Decarbonisation modelling in the electricity...
57
Decarbonisation modelling in the electricity sector Serbia Support for Low-Emission Development in South Eastern Europe (SLED)
Transcript of Decarbonisation modelling in the electricity...
SER
BIA
EN
G
Decarbonisation modelling in the electricity sector
Serbia
Support for Low-Emission Development in South Eastern Europe (SLED)
Decarbonisation modelling in the electricity sector
Serbia
AuthorS András MezősiLászló Szabó
Slobodan Markovic
Support for Low-Emission Development in South Eastern Europe (SLED)
Decembar 2015

AcknowLEDgEMEntSREC project management: József Feiler, Vaiva Indilaite, Ágnes kelemen, gordana kozhuharovaDesign and layout: tricia Barna, Juan tornerosCopyediting and proofreading: rachel hidegPublisher: the regional Environmental center for central and Eastern Europe (rEc)Photo credits: istockThe REC is implementing the project “Support for Low-Emission Development in South Eastern Europe”(SLED) to help policy makers in the project countries (Albania, the former Yugoslav Republic of Macedonia,Montenegro and Serbia) to establish realistic but ambitious decarbonisation pathways for their electricityand building sectors by 2030.The SLED project is funded by the Austrian Development Cooperation through the Austrian DevelopmentAgency (ADA). Special thanks are due to Hubert Neuwirth and Monika Tortschanoff of ADA.
Serbia DEcArBonISAtIon MoDELLIng In thE ELEctrIcIty SEctor 3
Table of contents
I. ExEcutIVE SuMMAry 6
II. IntroDuctIon 10
III. MEthoDoLogy 12
Scenario development framework 13
Models 13 The European Electricity Market Model 14
The EKC network model 15
Model assumptions 16 Cross-border network capacities 16
Current generation capacities 16
Fossil fuel prices 16
European Union Emissions Trading System price 16
European Union minimum tax levels for energy products 16
IV. ScEnArIo ASSuMPtIonS 19
Introduction of the European Union Emissions Trading System 21
Introduction of minimum excise duty on energy products 21
Environmental standards enforcement 21
Deployment of renewable energy sources for electricity 21
Conventional power plants 21
Electricity demand 23
V. MoDELLIng rESuLtS 24
Price development 25
Regional outlook 26
Generation mix 28
CO₂ impacts 28
Net import position 29
Investment costs 30
Support budget for renewable energy sources for electricity 30
VI. SEnSItIVIty ASSESSMEnt 36

DEcArBonISAtIon MoDELLIng In thE ELEctrIcIty SEctor Serbia4
VII. nEtwork IMPActS 40
Planned new network elements 42
Results of network modelling 43 Steady-state and contingency analyses 43
System balances 43
(N-1) Security criteria 43
Net transfer capacity 44
Transmission grid losses 45
VIII. AnnEx 49
The European Electricity Market Model 50
Geographical scope 51
Market participants 51
Equilibrium 52
Network representation 53
The EKC network model 53 Load-flow data collection 53
Demand 54
Network modelling methodology 54 Steady-state and contingency analyses 54
Evaluation of net transfer capacity 54
Transmission grid losses 55
References to Kosovo* in this publication should be understood according to the following definition: This designationis without prejudice to positions on status, and is in line with UNSCR 1244 and the ICJ Opinion on the Kosovodeclaration of independence.
Serbia DEcArBonISAtIon MoDELLIng In thE ELEctrIcIty SEctor 5
Tables and figuresTable 1 Present net transfer capacity values in the region (MW) 17
Table 2 Planned interconnectors and their investment status (MW) 17
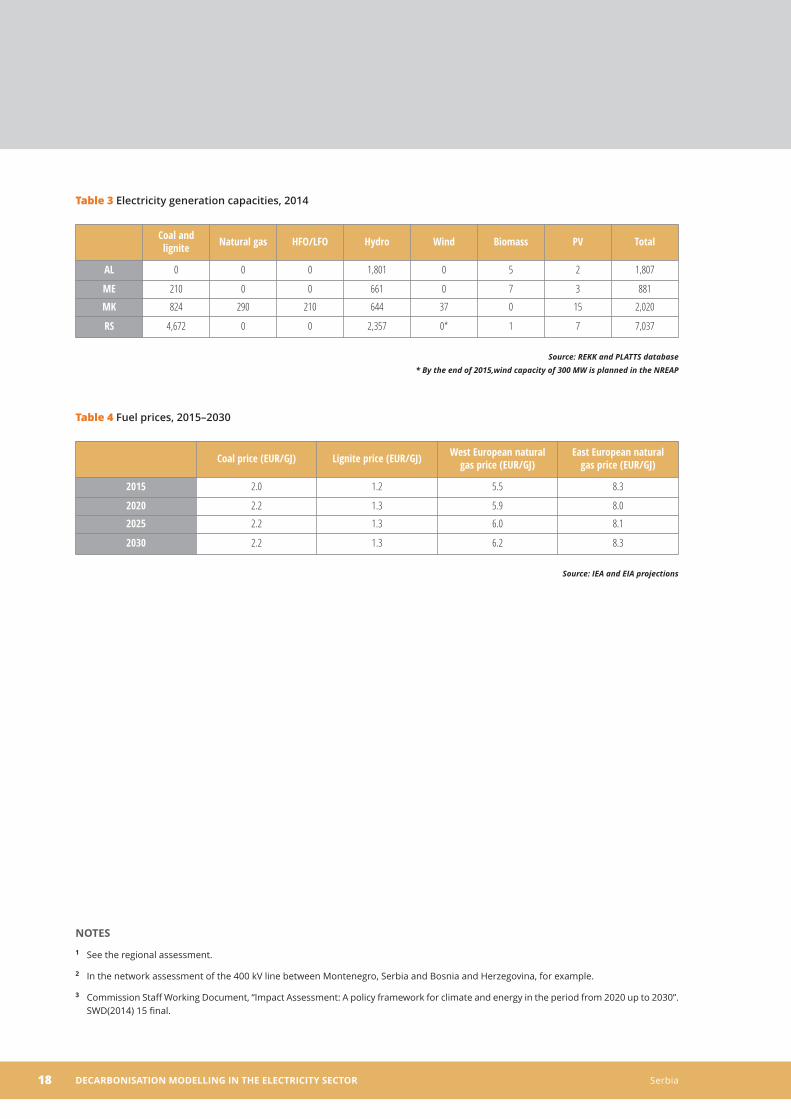
Table 3 Electricity generation capacities, 2014 18
Table 4 Fuel prices, 2015–2030 18
Table 5 Main scenario assumptions for Serbia 20
Table 6 Capacity deployment of renewable energy sources for electricity in the scenarios (MW) 22
Table 7 Gross electricity consumption in Serbia (GWh) 23
Table 8 Cumulated investment costs in 2015–2030 in the three scenarios 33
Table 9 Contingencies in 2020 44
Table 10 Contingencies in 2025 45
Table 11 Transmission losses in 2015, 2020 and 2025 in Serbia, for all scenarios and regimes 48
Figure 1 Modelled countries 15
Figure 2 Base-load price evolution in the various scenarios (EUR/MWh) 25
Figure 3 Peak-load price evolution in the various scenarios (EUR/MWh) 26
Figure 4 Planned new fossil fuel–based capacities in South Eastern Europe, 2015–2030 27
Figure 5 Planned new renewable-based capacities in the South Eastern Europe, 2015–2030 27
Figure 6 Generation mix, net imports and CO₂ emissions in the three scenarios 28
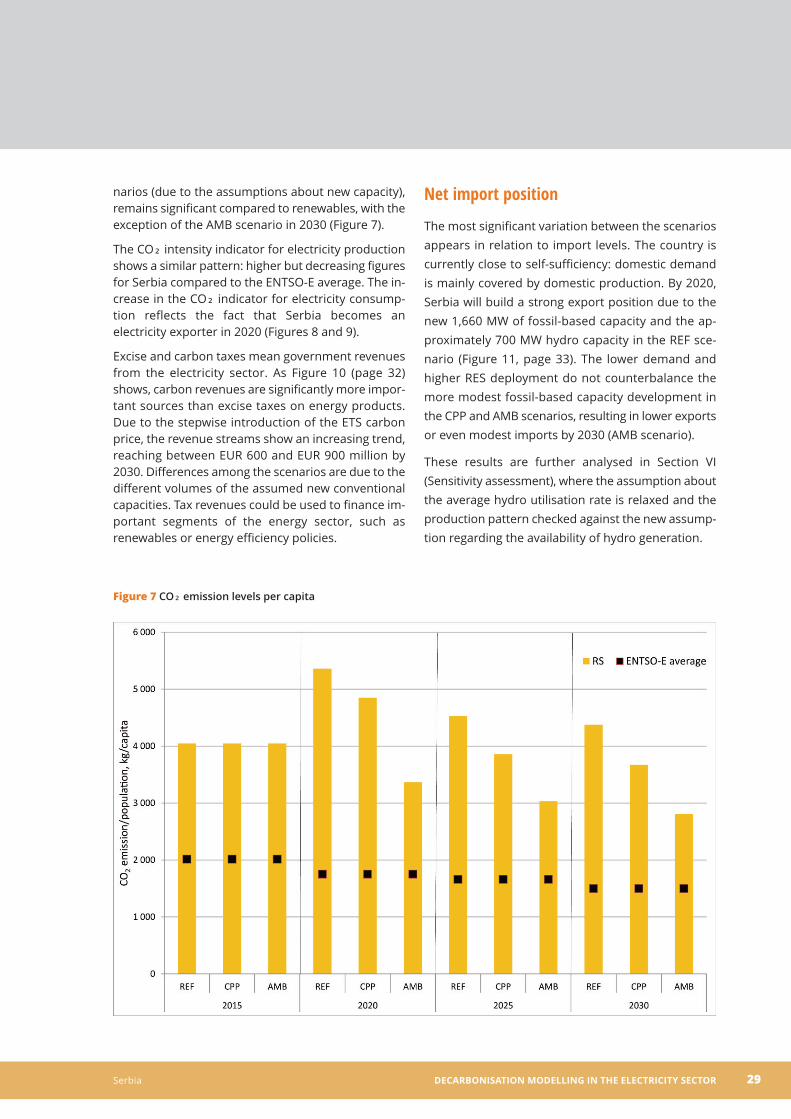
Figure 7 CO₂ emission levels per capita 29
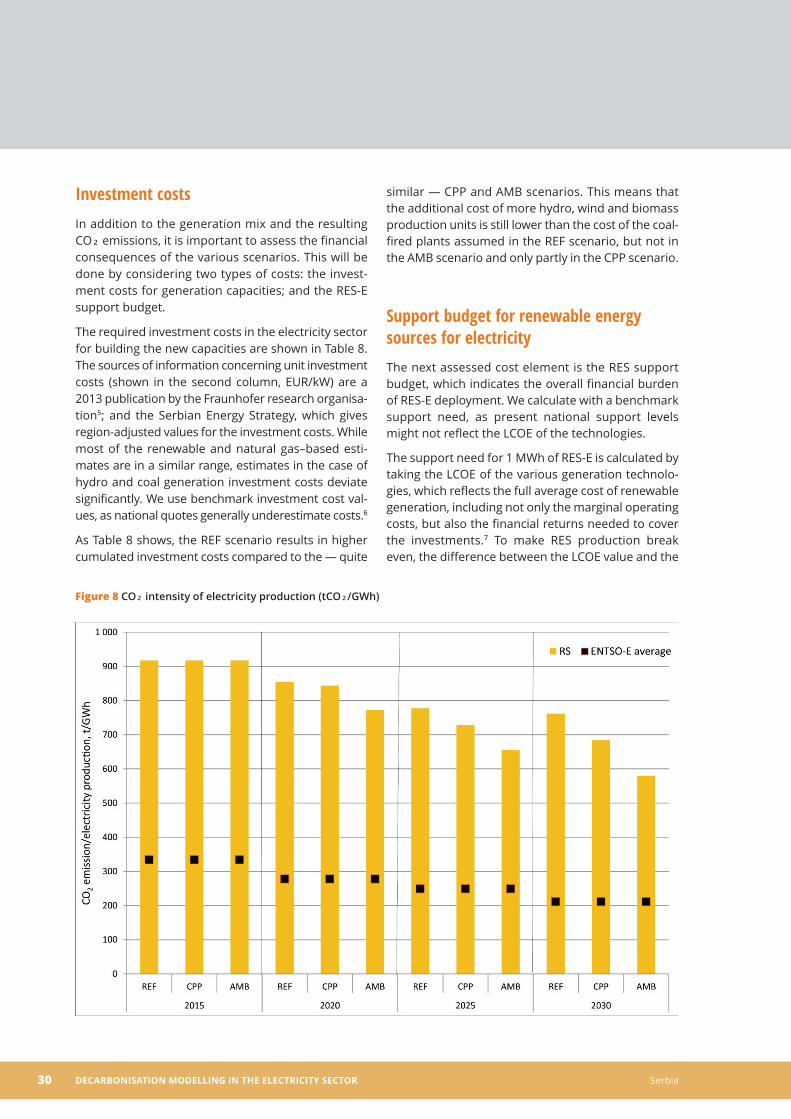
Figure 8 CO₂ intensity of electricity production (tCO₂/GWh) 30
Figure 9 CO₂ intensity of electricity consumption (tCO₂/GWh) 31
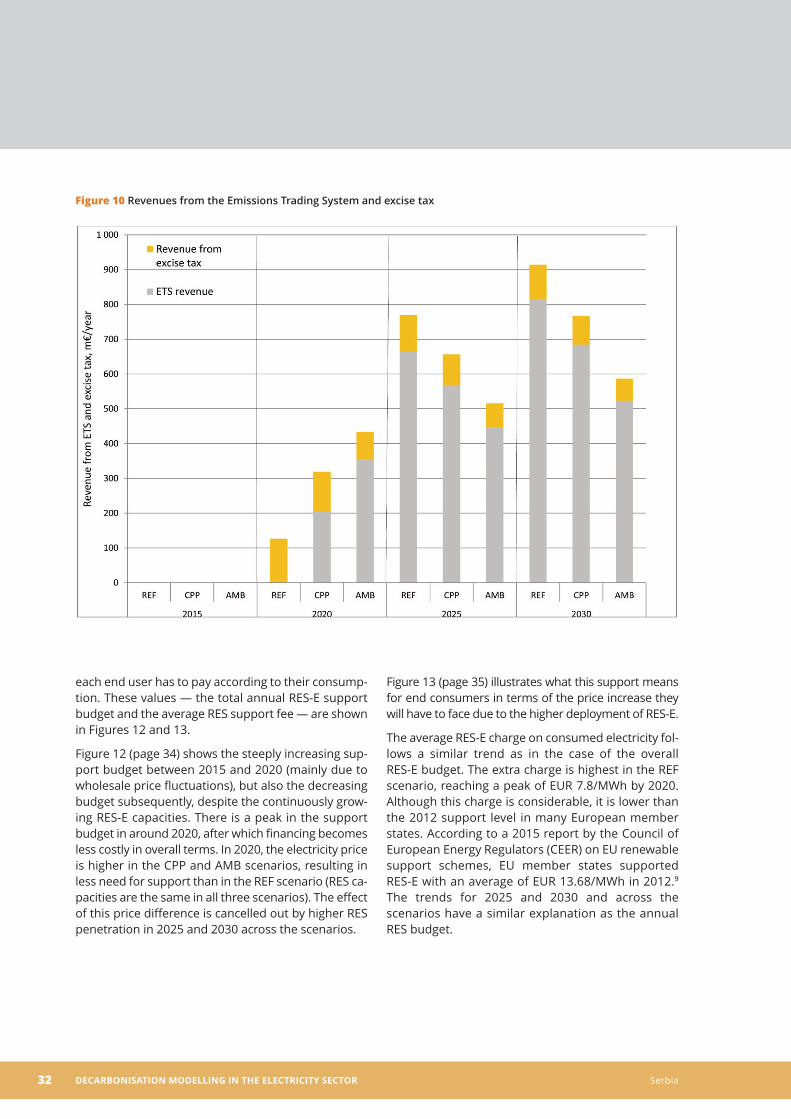
Figure 10 Revenues from the Emissions Trading System and excise tax 32
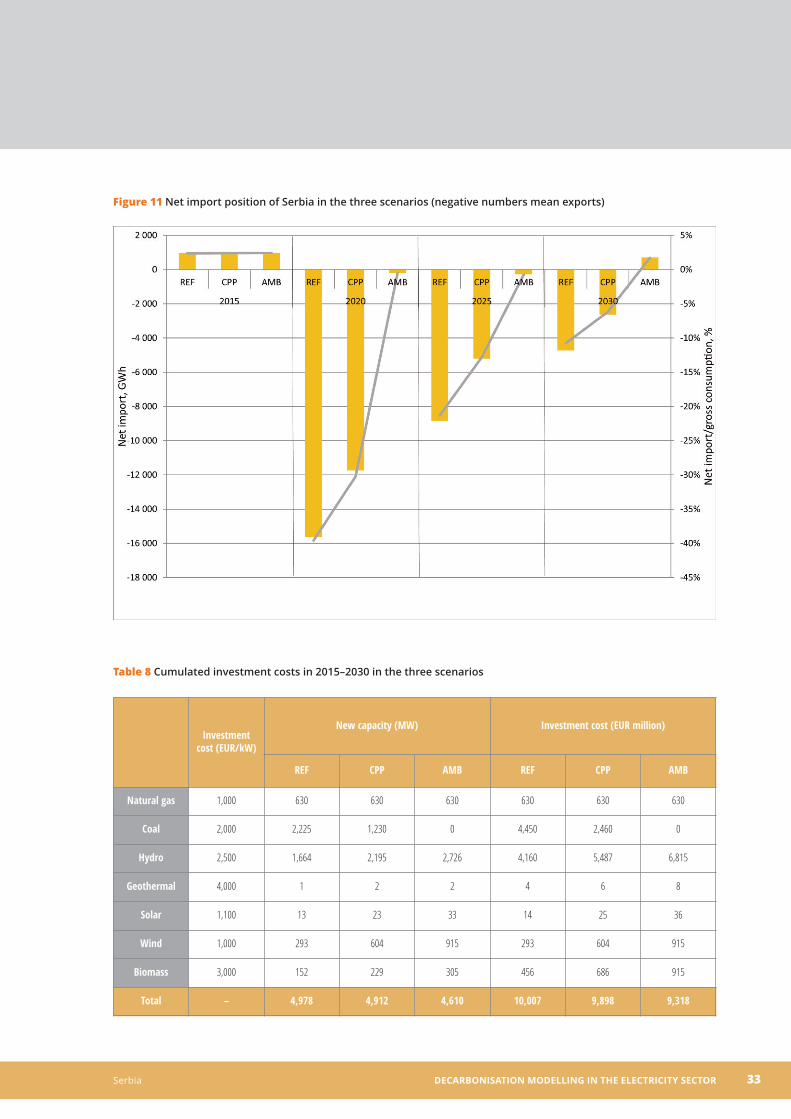
Figure 11 Net import position of Serbia in the three scenarios 33
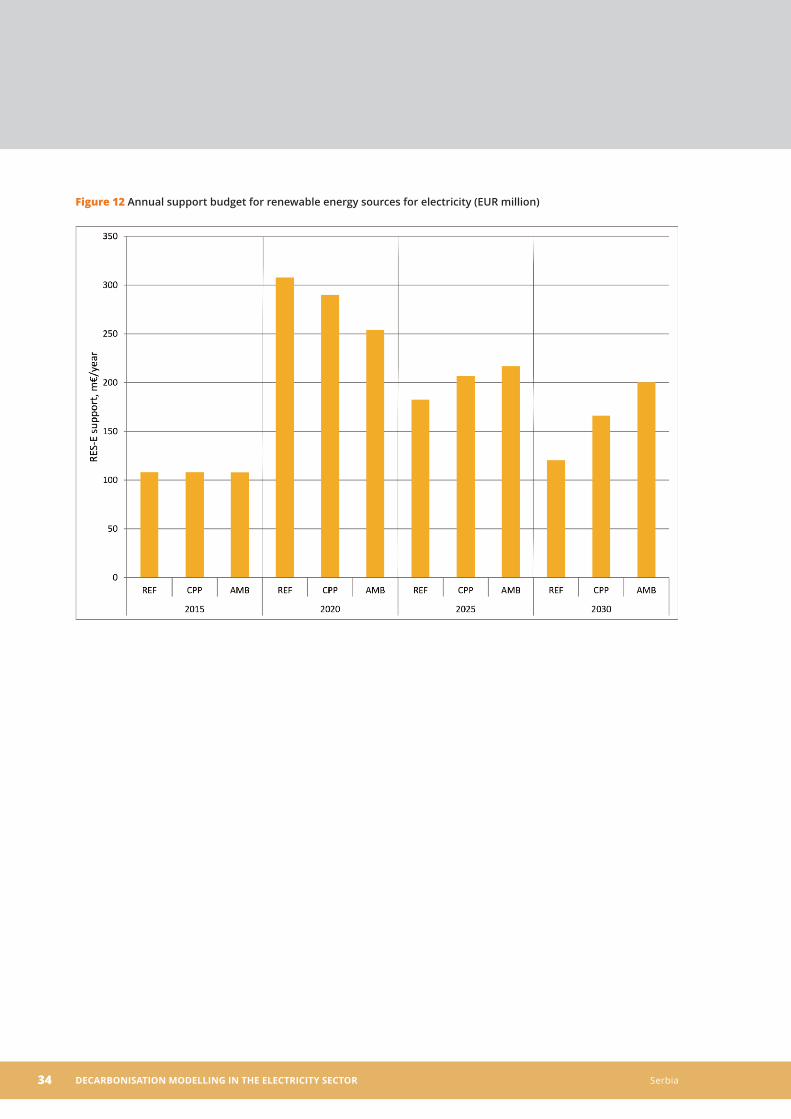
Figure 12 Annual support budget for renewable energy sources for electricity (EUR million) 34
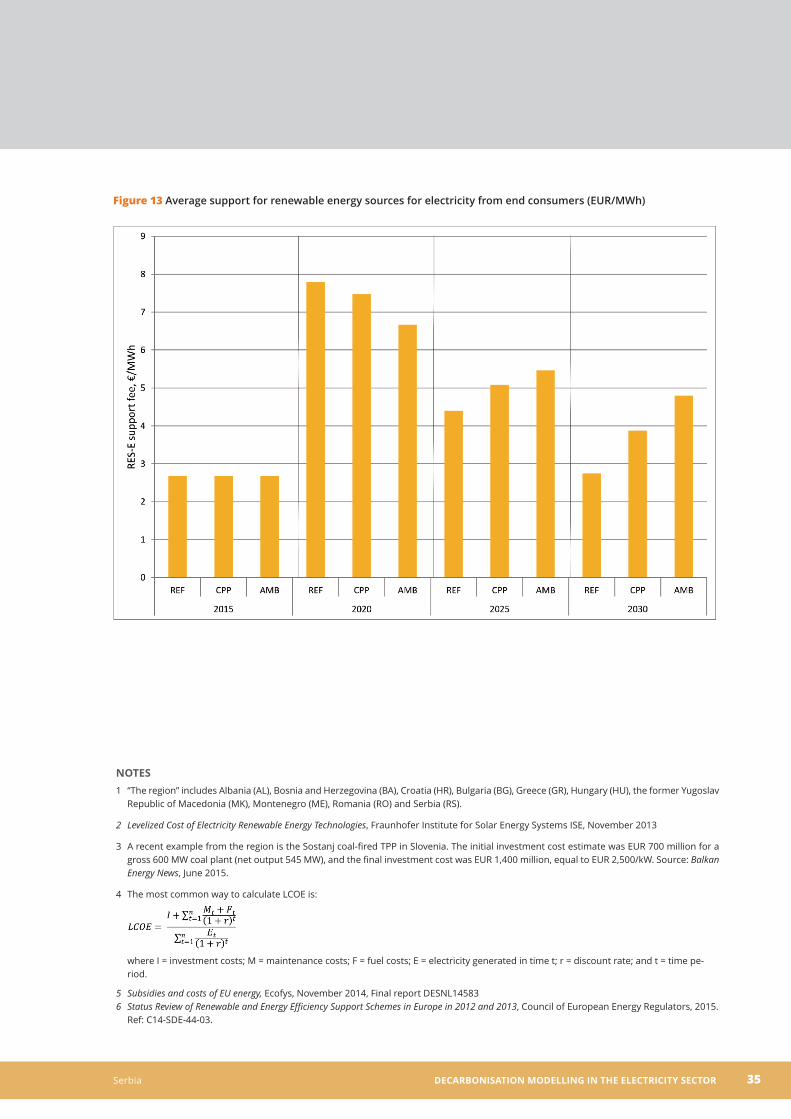
Figure 13 Average support for renewable energy sources for electricity from end consumers (EUR/MWh) 35
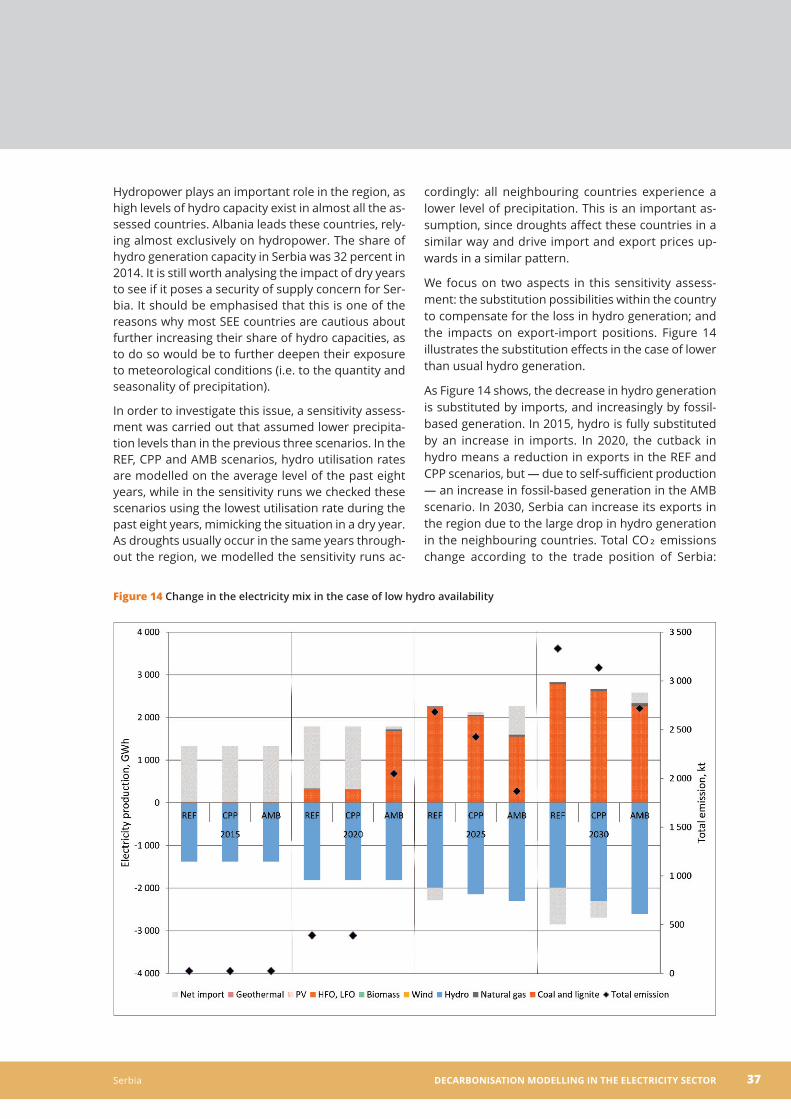
Figure 14 Change in the electricity mix in the case of low hydro availability 37
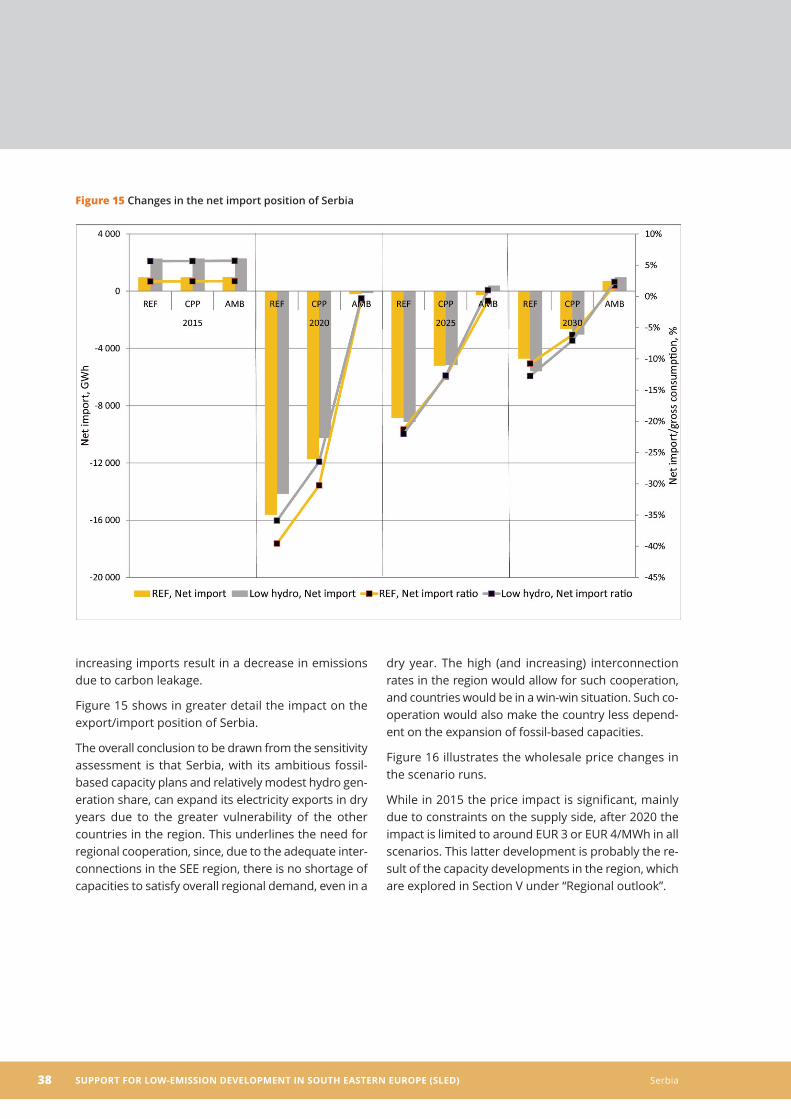
Figure 15 Changes in the net import position of Serbia 38
Figure 16 Base-load price changes in Serbia (EUR/MWh) 39
Figure 17 Geographical coverage of the network analysis 41
Figure 18 Planned interconnection lines in South Eastern Europe 42
Figure 19 Net transfer capacity values for 2020 (winter regime) 46
Figure 20 Net transfer capacity values for 2020 (summer regime) 46
Figure 21 Net transfer capacity values for 2025 (winter regime) 47
Figure 22 Net transfer capacity values for 2025 (summer regime) 47
Figure 23 Annual transmission losses in Serbia for all scenarios 49
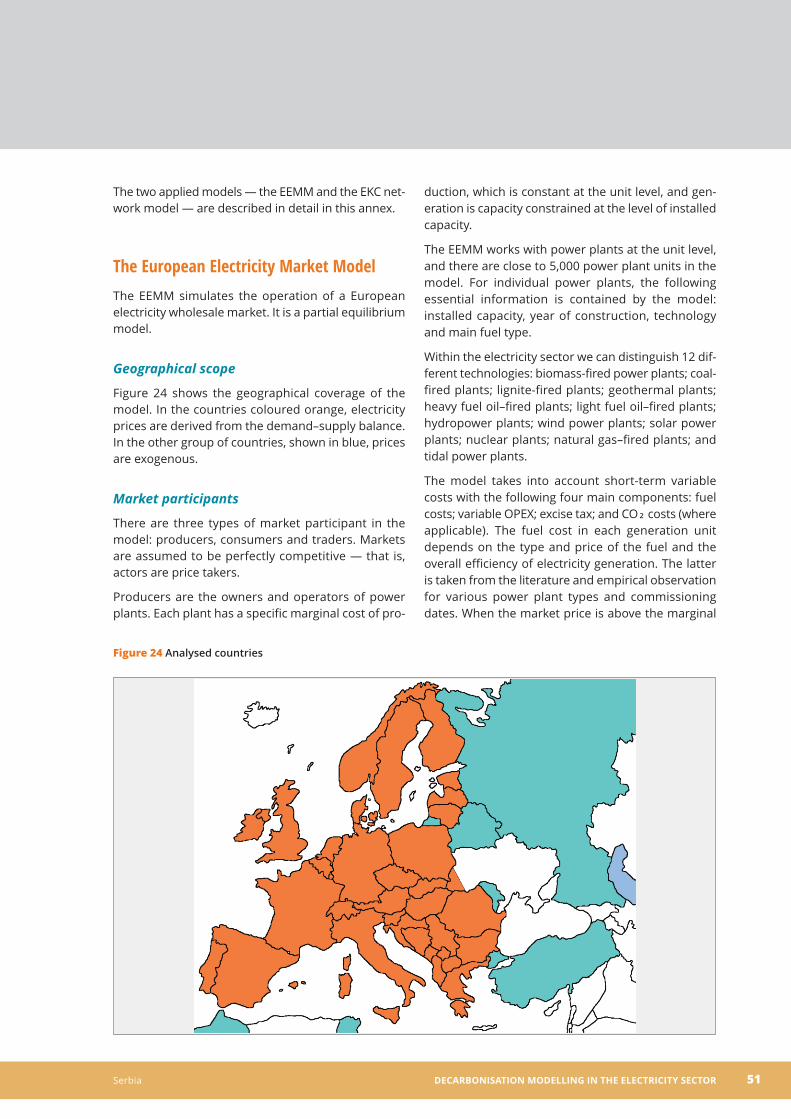
Figure 24 Analysed countries 51
Figure 25 Operation of the model 52

I. Executive summary
Serbia DEcArBonISAtIon MoDELLIng In thE ELEctrIcIty SEctor 7
The objective of the project “Support for Low-Emission Development in South Eastern Europe(SLED)” is to help policy makers in Albania, the formerYugoslav Republic of Macedonia, Montenegro andSerbia to set realistic but ambitious decarbonisationpathways for their electricity sectors up to 2030.
This study assesses the effect of decarbonisation sce-narios on the Serbian electricity system. In the currentassessment we also include Kosovo*, meaning thatdata referring to Serbia include Kosovo*, unless indi-cated otherwise.
The scenarios (Reference – REF; Currently PlannedPolicies – CPP; and Ambitious – AMB) use different assumptions related to electricity demand and sup-ply. Supply-side factors include the deployment levelsof renewable energy sources for electricity (RES-E),conventional capacity expansion levels and the ap-plied energy and carbon taxation rates. On the de-mand side, the various scenarios assume differentelectricity consumption based on the effectiveness ofenergy efficiency policies.
The scenarios and assumptions were agreed with themain stakeholders in Serbia (the Ministry of Miningand Energy, the Ministry for Agriculture and Environ-mental Protection, the Environmental ProtectionAgency, and electricity experts).
The assessment was carried out using the EuropeanElectricity Market Model (EEMM) developed by the Regional Centre for Energy Policy Research (REKK)and the network model of the Electricity CoordinatingCenter (EKC). The EEMM is a detailed, bottom-up economic simulation model covering the whole Euro-pean Network of Transmission System Operators forElectricity (ENTSO-E) region, while the EKC networkmodel covers the medium- and high-voltage networkof the South East European (SEE) region.
The following main conclusions could be drawn fromthe scenario modelling:
The stringency of climate policy commitments
has limited impact on wholesale price develop-ment. The wholesale price is dependent on regional generational capacity expansion ratherthan on the ambition level of climate policy. Since,at regional level, significant capacity expansion isforeseen in the coming five years in both fossil-and renewable-based generation, it will drivewholesale electricity prices down in the whole SEEregion until 2025.
The generation mix in the scenarios is shaped pri-
marily by the various planned new fossil capacitylevels. The REF scenario assumes six new powerplants with total additional capacities of 2,885 MW,while the CPP and AMB scenarios include a moremodest capacity increase in conventional genera-tion (1,860 MW and 630 MW respectively). The lowerfossil-based generation is substituted by hydro inthe AMB scenario in the longer term (by 2030).
Serbia is almost self-sufficient in 2015 in terms of
electricity consumption, although more new fossilcapacities will facilitate more export possibilities.Serbia remains a net exporter from 2020 onwards.Only the AMB scenario indicates a minor need forimports in 2030.
The stepwise reduction in new conventional capac-
ity between the scenarios is translated into a sim-ilar pattern in terms of CO₂ emissions, withsignificant differences between the scenarios. Percapita CO₂ emissions in Serbia are at least doublethe ENTSO-E average in all scenarios and referenceyears, due to the dominance of fossil-based gen-eration, which, although different in the three sce-narios (due to the new capacity assumptions),nevertheless remains significant compared to re-newables, with the exception of the AMB scenarioin 2030. The indicator for the CO₂ intensity of elec-tricity production shows a similar pattern: higherbut decreasing Serbian figures compared to theENTSO-E average. The increase in the CO₂ indica-tor for electricity consumption reflects the fact thatSerbia becomes an electricity exporter in 2020.
Due to the stepwise introduction of the Emissions
Trading System (ETS) carbon price, the revenuestream shows an increasing trend, reaching EUR 600 to EUR 900 million by 2030. The differ-ences between the scenarios are due to the dif-ferent volumes of the assumed new conventionalcapacities. The average RES-E charge on con-sumed electricity peaks in the REF scenario in2020 (EUR 7.8/MWh). Although considerable, thischarge is lower than the 2012 support level inmany European members states. According to a2015 report by the Council of European EnergyRegulators (CEER) on EU renewable supportschemes, EU member states supported RES-Ewith an average of EUR 13.68/MWh in 2012. Gov-ernment tax revenues collected on energy use(carbon and energy tax) can easily finance the required RES-E support budget after 2020.

DEcArBonISAtIon MoDELLIng In thE ELEctrIcIty SEctor Serbia8
The REF scenario results in higher cumulated
investment costs compared to the — quite simi-lar — CPP and AMB scenarios. This means thatthe additional cost of more hydro, wind and bio-mass production units is still lower than the costof the coal plants assumed in the REF scenario,but not in the AMB scenario and only partly inthe CPP scenario.
The security of supply concern is further analysed
in order to check the impact of a dry year on theSerbian electricity system. In the short term, severe droughts — modelled as the driest of thepast eight years in the region — could drive upprices by EUR 7.5/MWh, and in the long term byEUR 3 to EUR 4/MWh. In 2015, reduced hydro gen-eration is fully substituted by an increase in imports. In 2020, the cutback in hydro leads to areduction in exports in the REF and CPP scenarios.However, due to self-sufficient production, it leadsto an increase in fossil-based generation in theAMB scenario. In 2030, Serbia is able to increaseits exports in the region due to a large drop inhydro generation in neighbouring countries.
The overall conclusion of the sensitivity assess-
ment is that Serbia, with its ambitious fossil capac-ity plans and relatively modest hydro generationshare, will be able to expand its electricity exportsin dry years due to the greater vulnerability of theother countries in the region.
The assessment of network impacts shows that,
in general, the Serbian electricity system wouldrequire some reinforcements in its network inorder to cope with the planned RES capacity in-crease in the scenarios. If the planned networkadditions are built, no further contingencieswould appear in the system. The change in nettransfer capacities (NTC) does not show a distinctpattern across borders or in the various regimes(2020/2025 and winter/summer). The increase inRES-E in terms of overall installed capacities willproduce lower transmission losses in gross con-sumption in Serbia in both 2020 and 2025 com-pared to the REF scenario.
Executive summary Figure 1 Generation mix, net imports and CO₂ emissions in the three scenarios
Serbia DEcArBonISAtIon MoDELLIng In thE ELEctrIcIty SEctor 9
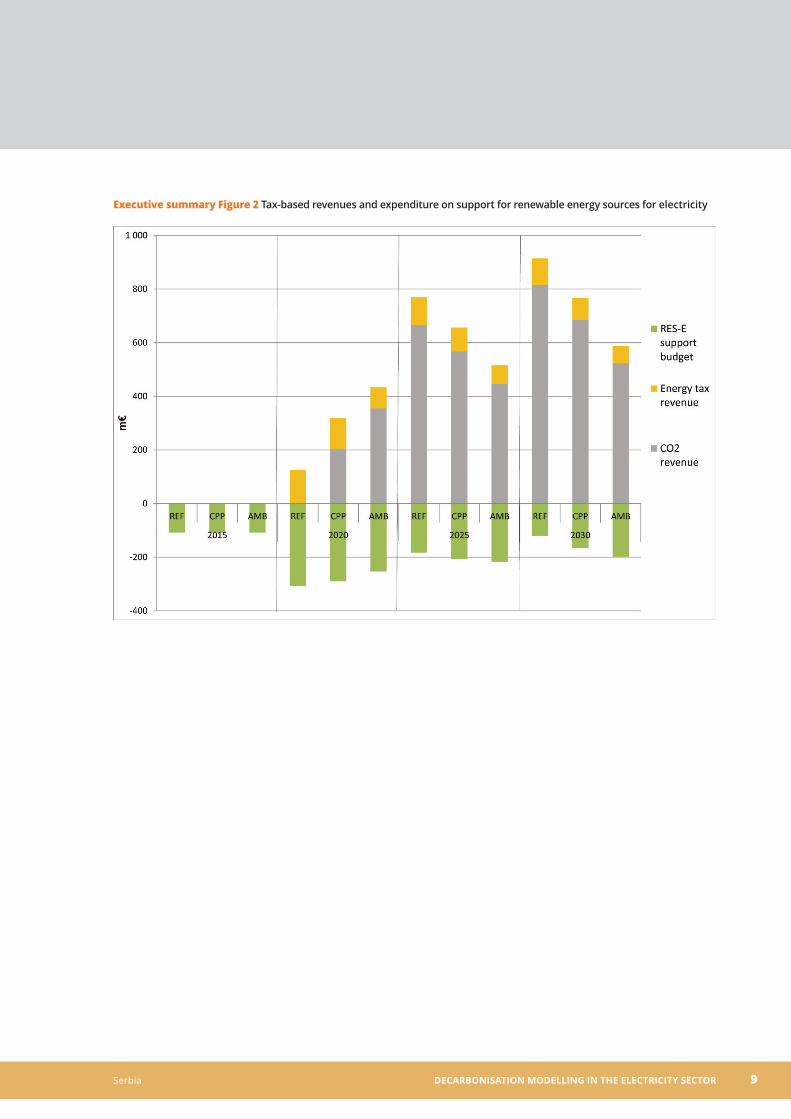
Executive summary Figure 2 Tax-based revenues and expenditure on support for renewable energy sources for electricity

II. Introduction
Serbia DEcArBonISAtIon MoDELLIng In thE ELEctrIcIty SEctor 11
The main objective of the SLED project is to help policy makers in Albania, the former Yugoslav Repub-lic of Macedonia, Montenegro and Serbia in settingup realistic but ambitious decarbonisation pathwaysfor their electricity sectors up to 2030. Policy develop-ments should be evidence based, as far as possiblebuilding on quantified modelling results obtainedfrom the possible set of future decarbonisation sce-narios. The SLED project assisted the countries withmodelling, accompanied by a continuous consulta-tion process to enable national policy makers to influ-
ence the scenario development process according totheir needs for their future energy sector and climatestrategy developments. During the modelling exer-cise, policy options related to production levelsand/or the fuel mix for electricity generation — suchas supply-side energy efficiency improvements, theaccelerated retirement of old power plants, increasingshares of renewable energy sources (RES), and elec-tricity demand — were assessed from the perspectiveof CO₂ emissions, generation capacity investmentcosts and renewable support needs.

III. Methodology
Serbia DEcArBonISAtIon MoDELLIng In thE ELEctrIcIty SEctor 13
In this section we introduce the framework for the sce-narios, including the differentiation dimension, and thetwo models used in the assessment of the scenarios.
Scenario development frameworkIn order to assess the full range of the decarbonisa-tion potential in the assessed countries, three scenar-ios were constructed for each country in the SLEDproject: Reference (REF); Currently Planned Policies(CPP); and Ambitious (AMB). Scenario assumptionswere related to six dimensions:
carbon value;
energy/excise tax;
environmental standards;
deployment of renewable energy technologies;
deployment of conventional generation tech-
nologies; andelectricity demand (integrating assumptions
on end-use energy efficiency improvement).
The above factors all affect national CO₂ emissions either via the level of electricity production or by theirimpact on the fuel mix for electricity generation. As faras taxation is concerned, two factors are identified.First, the introduction of the EU ETS either as a conse-quence of EU membership or the transposition of EUlaw required for members of the Energy Community;and second, simply the introduction of a national pol-icy instrument placing value on carbon emissions,which alters the cost of respective generation tech-nologies and hence the production possibilities. Thesame logic applies to the introduction of the minimumtax level on energy products required by EU legisla-tion. The electricity supply mix is affected by the intro-duction of European air pollution regulations: theLarge Combustion Plants (LCP) Directive, for example,may force the most polluting coal plants out of oper-ation, or limit their operating hours. The developmentof renewables and conventional (fossil) generation capacities is the outcome of national policy decisionsand — in the case of renewables — support levels.Electricity demand growth triggers higher productionfrom the available power plant portfolio or imports.
The REF scenario reflects the business-as-usual devel-opments in the country, meaning that the official en-ergy policy and legislative instruments that were inplace by the closing date of the scenario definition(July 2015) are included. The CPP scenario reflects
those policies that are under consideration and thatcould have an impact on GHG emissions. The thirdscenario, AMB, represents the most advanced climatepolicy stand.
The options included in the scenarios are assessednot only for the individual countries but also in termsof possible synergies from more collaborative actionsamong SEE countries.1 Modelling the various optionslisted above can help to identify the most effective options to reduce CO₂ emissions in the assessedcountries. Other impacts, such as those relating to security of supply and network reliability, are also included in the analysis.
conDItIonS SPEcIFIc to SErBIA
The main data and policy inputs for the scenarioswere agreed with relevant stakeholders (the Ministryof Energy and Mining, the Ministry of Agriculture andEnvironmental Protection, and the EnvironmentalProtection Agency) at a meeting held in Belgrade inNovember 2014. In the current assessment we in-clude Kosovo*, meaning that data referring to Serbiainclude Kosovo*, unless indicated otherwise.
ModelsDecarbonisation scenarios for the four assessedcountries and the region as a whole were developedusing the state-of-the-art European Electricity MarketModel (EEMM) in tandem with the detailed technicalnetwork model of the Electricity Coordinating Center(EKC). The EEMM has been frequently applied in theregion in the past in relation to Projects of EnergyCommunity Interest (PECI) assessment, while the net-work model has been used in many network expan-sion and upgrade projects in the region.2 The EEMMis a partial equilibrium model focused on generationcapacities, while the EKC network model focuses onthe transmission system, in particular on the devel-opment of cross-border capacities. The two modelsare introduced briefly in this section: more detailedmodel descriptions can be found in the Annex.
The reliability of model results was ensured by work-ing closely together with stakeholders in the region.The EKC network modelling team is from Serbia,which means that the modelling experts have in-depth regional knowledge. In addition to this insiderinvolvement, three project factors gave unique addedvalue to the assessment:
DEcArBonISAtIon MoDELLIng In thE ELEctrIcIty SEctor Serbia14
The models were updated with the most recent
data from the beneficiary countries, with the helpof local experts.
Throughout the project, the involvement of stake-
holders — including representatives of relevantministries dealing with climate- and energy-related issues and representatives of the trans-mission system operators (TSOs) — was ensuredby setting up a project “task force”. These expertsand policy makers were involved in defining policy-relevant scenarios and in the assessment ofmodel results already at an early stage of the project. They also provided up-to-date informa-tion on national energy policies and checked thevalidity of information and data at the stakeholdermeeting in November 2014.
The dissemination of project results is
ensured by means of workshops in all participat-ing countries.
The relevant experts and stakeholders in the projectcountries were reached with the help of a local expertconsultancy (EKC from Serbia), as well as the local offices of the Regional Environmental Center (REC),which has long-term expertise and a solid network inthe region.
The European Electricity Market Model
The EEMM is a simulation model of the Europeanelectricity wholesale market that works in a stylisedmanner with perfect competition assumptions.
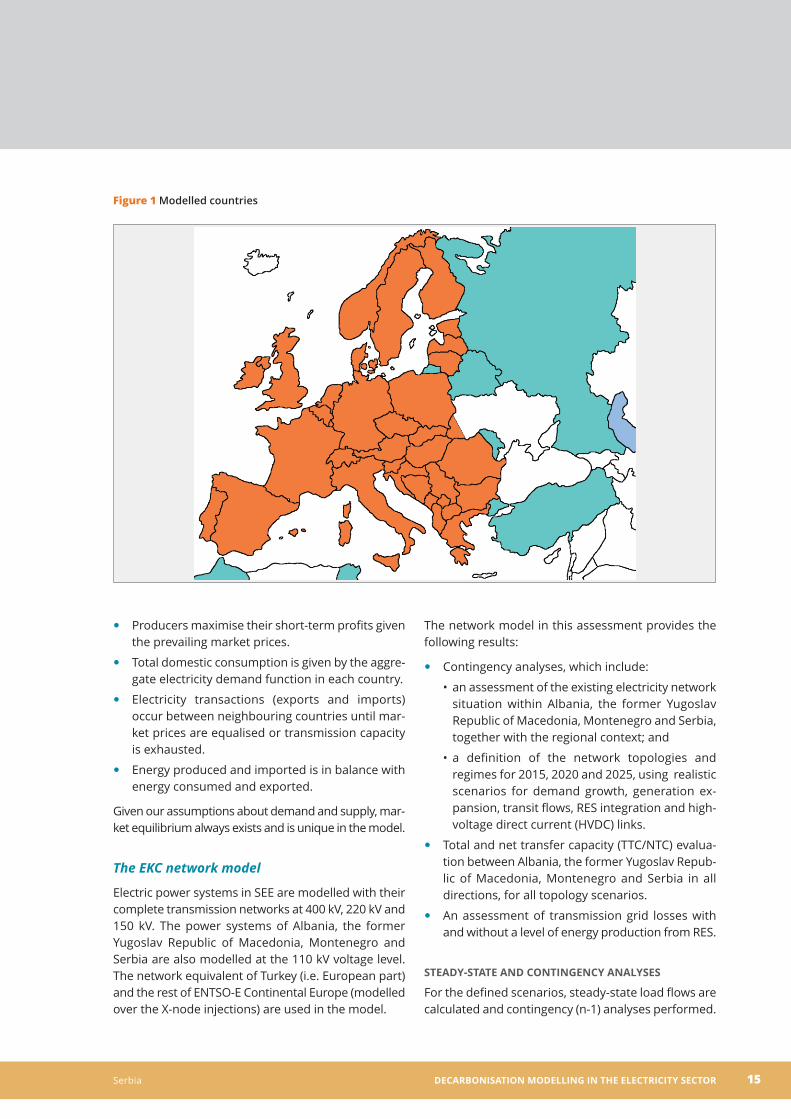
The EEMM covers 36 countries with rich bottom-uprepresentation. In Figure 1, in the countries colouredorange, electricity prices are derived from the demand-supply balance, and in the blue countriesprices are exogenous. The ENTSO-E countries of theEU (Malta and Cyprus are not included in the model)and Balkan countries are modelled in full detail.
In the electricity production sector we have differen-tiated 12 technologies. We assume one interconnec-tor per pair of countries, which means modelling 85transmission lines. The EEMM models the productionside at unit level, which means that at the greater Eu-ropean level almost 5,000 units are included in themodel runs. Equilibrium (in prices and quantities) isreached simultaneously in the producer and thetransmission segments. These units are characterisedby various technological factors, allowing the con-struction of the merit order for the particular time pe-riod. In each year we have 90 reference hours to
represent the load curve with sufficient detail for eachEuropean country.
There are three types of market participants in themodel: producers, consumers and traders. All ofthem behave in a price-taking manner: they take theprevailing market price as given, and assume thatwhatever action they decide upon has a negligible ef-fect on this price.
Producers are the owners and operators of powerplants. Each plant has a specific marginal cost of pro-duction, which is constant at the unit level. In addi-tion, generation is capacity constrained at the level ofavailable capacity.
The model only takes into account short-term vari-able costs with the following three main components:fuel costs, variable operational expenditure (OPEX),and CO₂ costs (where applicable). As a result, the ap-proach is best viewed as a simulation of short-term(e.g. day-ahead) market competition.
Price-taking producer behaviour implies that when-ever the market price is above the marginal genera-tion cost of a unit, the unit is operated at full availablecapacity. If the price is below the marginal cost, thereis no production at all; and if the marginal cost andthe market price coincide, then the level of productionis determined by the market clearing condition (sup-ply must equal demand).
Consumers are represented in the model in an aggre-gated way by price-sensitive demand curves. In eachdemand period there is an inverse relationship be-tween the market price and the quantity consumed:the higher the price, the lower the consumption. Thisrelationship is approximated by a downward slopinglinear function.
Finally, traders connect the production and consump-tion sides of a market, export electricity to more expen-sive countries and import it from cheaper ones.Cross-border trade takes place on capacity-constrainedinterconnectors between neighbouring countries. Elec-tricity exchanges always occur from a less expensivecountry to a more expensive one, until one of twothings happens: either prices, net of direct transmis-sion costs or export tariffs, equalise across the twomarkets; or the transmission capacity of the intercon-nector is reached. In the second case, a considerableprice difference may remain between the two markets.
The model calculates the simultaneous equilibriumallocation in all markets with the following properties:
Serbia DEcArBonISAtIon MoDELLIng In thE ELEctrIcIty SEctor 15
Producers maximise their short-term profits given
the prevailing market prices.
Total domestic consumption is given by the aggre-
gate electricity demand function in each country.
Electricity transactions (exports and imports)
occur between neighbouring countries until mar-ket prices are equalised or transmission capacityis exhausted.
Energy produced and imported is in balance with
energy consumed and exported.
Given our assumptions about demand and supply, mar-ket equilibrium always exists and is unique in the model.
The EKC network model
Electric power systems in SEE are modelled with theircomplete transmission networks at 400 kV, 220 kV and150 kV. The power systems of Albania, the former Yugoslav Republic of Macedonia, Montenegro andSerbia are also modelled at the 110 kV voltage level.The network equivalent of Turkey (i.e. European part)and the rest of ENTSO-E Continental Europe (modelledover the X-node injections) are used in the model.
The network model in this assessment provides thefollowing results:
Contingency analyses, which include:
an assessment of the existing electricity network•situation within Albania, the former Yugoslav Republic of Macedonia, Montenegro and Serbia,together with the regional context; and
a definition of the network topologies and•regimes for 2015, 2020 and 2025, using realisticscenarios for demand growth, generation ex-pansion, transit flows, RES integration and high-voltage direct current (HVDC) links.
Total and net transfer capacity (TTC/NTC) evalua-
tion between Albania, the former Yugoslav Repub-lic of Macedonia, Montenegro and Serbia in alldirections, for all topology scenarios.
An assessment of transmission grid losses with
and without a level of energy production from RES.
StEADy-StAtE AnD contIngEncy AnALySES
For the defined scenarios, steady-state load flows arecalculated and contingency (n-1) analyses performed.
Figure 1 Modelled countries

DEcArBonISAtIon MoDELLIng In thE ELEctrIcIty SEctor Serbia16
Security criteria are based on the loadings of lines andvoltage profile and are checked for each scenarioanalysed.
Load-flow assessment is a basic step for NTC evalua-tion, and it comprises the following analyses:
steady-state AC load-flow analysis;
a security (n-1) assessment where the tripping of
lines is simulated. This means that one line is con-sidered out of service while load flow is calculatedand the security of the system assessed (circuitoverloads and voltage violations); and
a voltage profile analysis.
In the analysis of voltage profiles, voltage limits areaccording to the respective national grid codes.
EVALuAtIon oF nEt trAnSFEr cAPAcIty
Total and net transfer capacity (TTC/NTC) were evalu-ated between Albania, the former Yugoslav Republicof Macedonia, Montenegro and Serbia, as well as be-tween these countries and their neighbours, in all di-rections and for all topology scenarios, with referenceto each target year and regime, and a final assess-ment was made of the TTC/NTC additional values asa result of the new interconnections and the strength-ening of the major internal energy transit routes.
General definitions of transfer capacities (TTC andNTC) and the procedures for their assessment weregiven by ENTSO-E, as well as by the practice and experience of regional SEE TSO working groups.
The methodology used in performing this study wasbased on the prerequisites outlined below.
The assessment of electricity losses is based on lossesover the equivalent time duration in the winter peakand summer peak periods. This approach takes intoaccount that the effect on losses may be different inthese two regimes, as a result of which losses on ayearly level can be determined more accurately.
Model assumptionsIn this section we introduce those assumptions thatremain constant across the various scenarios for allthe assessed countries and the regional assessmentas well.
Cross-border network capacities
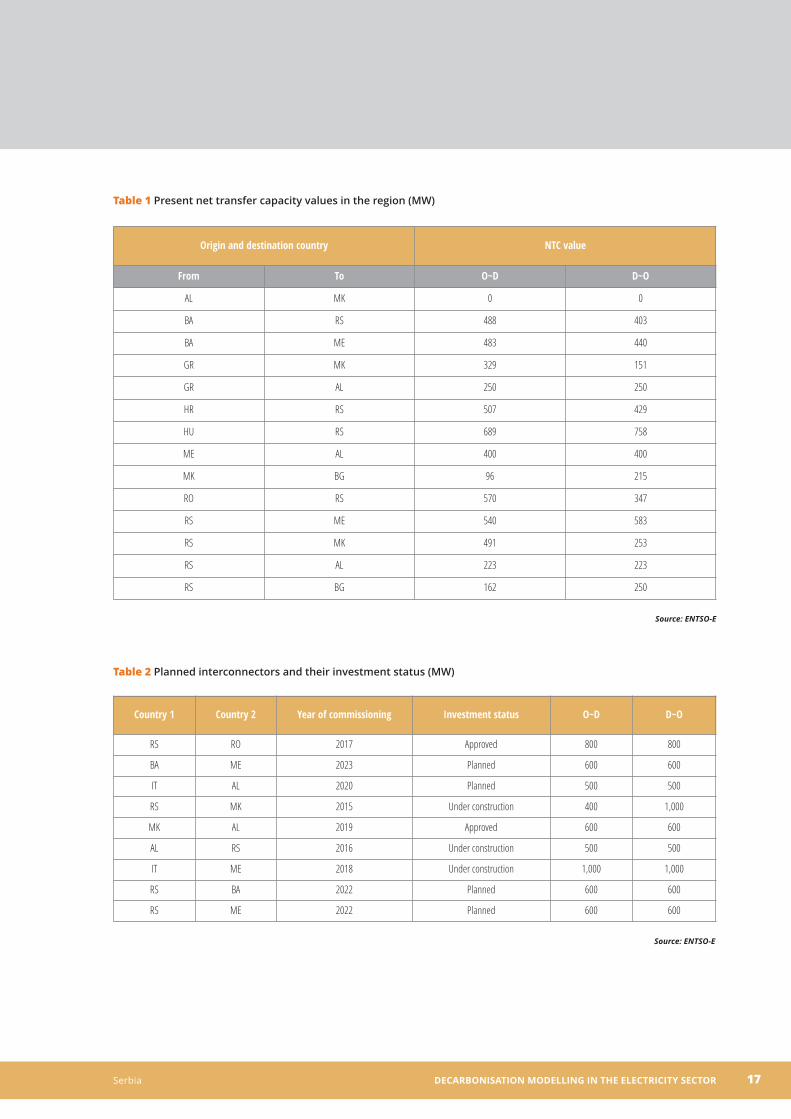
Even though countries in the SEE region are well con-nected with their neighbours, further capacity exten-sions are envisaged in the future. The model uses theNTC values of ENTSO-E to reflect the trading possibil-ities between countries. Tables 1 and 2 show the pres-ent NTC values in the region, including neighbouringcountries, and the planned new connections in themodelling timeframe.
The Montenegro–Italy 1,000 MW submarine cable isplanned to start operation in 2018. Construction hasalready started and is proceeding according to theinvestment plan. The other submarine cable con-necting Italy with Albania is very uncertain and mightnot be realised as planned, or might even be can-celled. The modelling considers the “approved” and“under construction” categories of ENTSO-E in allthree scenarios.
Current generation capacities
Table 3 provides information on electricity generationcapacities for the base year, 2014. There were nowind capacities installed in Serbia in 2014.
Fossil fuel prices
Table 4 shows the fossil fuel prices applied in themodelling for the period 2015–2030.
European Union Emissions Trading System price
Concerning the carbon price assumptions, we fol-lowed the carbon value path of the latest EU impactassessment (GHG40EE scenario3) and assumed anETS carbon price of EUR 22/tCO₂ for Europe by 2030.The ETS price goes linearly from its 2014 value of EUR 6/t to EUR 22/t by 2030 in all scenarios.
European Union minimum tax levels for energy products
Excise duty is differentiated according to the fuel used(coal, natural gas and heavy fuel oil [HFO]). The mini-mum excise duty level applied is equal to the 2014level applicable by EU law:
EUR 0.3/GJ for natural gas;
EUR 0.15/GJ for coal; and
EUR 0.38/GJ for HFO.
Serbia DEcArBonISAtIon MoDELLIng In thE ELEctrIcIty SEctor 17
Table 1 Present net transfer capacity values in the region (MW)
Origin and destination country NTC value
From To O~D D~O
AL MK 0 0
BA RS 488 403
BA ME 483 440
GR MK 329 151
GR AL 250 250
HR RS 507 429
HU RS 689 758
ME AL 400 400
MK BG 96 215
RO RS 570 347
RS ME 540 583
RS MK 491 253
RS AL 223 223
RS BG 162 250
Source: ENTSO-E
Table 2 Planned interconnectors and their investment status (MW)
Country 1 Country 2 Year of commissioning Investment status O~D D~O
RS RO 2017 Approved 800 800
BA ME 2023 Planned 600 600
IT AL 2020 Planned 500 500
RS MK 2015 Under construction 400 1,000
MK AL 2019 Approved 600 600
AL RS 2016 Under construction 500 500
IT ME 2018 Under construction 1,000 1,000
RS BA 2022 Planned 600 600
RS ME 2022 Planned 600 600
Source: ENTSO-E
DEcArBonISAtIon MoDELLIng In thE ELEctrIcIty SEctor Serbia18
notES
See the regional assessment.1
In the network assessment of the 400 kV line between Montenegro, Serbia and Bosnia and Herzegovina, for example.2
Commission Staff Working Document, “Impact Assessment: A policy framework for climate and energy in the period from 2020 up to 2030”.3
SWD(2014) 15 final.
Table 3 Electricity generation capacities, 2014
Coal andlignite Natural gas HFO/LFO Hydro Wind Biomass PV Total
AL 0 0 0 1,801 0 5 2 1,807
ME 210 0 0 661 0 7 3 881
MK 824 290 210 644 37 0 15 2,020
RS 4,672 0 0 2,357 0* 1 7 7,037
Source: REKK and PLATTS database* By the end of 2015,wind capacity of 300 MW is planned in the NREAP
Table 4 Fuel prices, 2015–2030
Coal price (EUR/GJ) Lignite price (EUR/GJ) West European naturalgas price (EUR/GJ)
East European natural gas price (EUR/GJ)
2015 2.0 1.2 5.5 8.3
2020 2.2 1.3 5.9 8.0
2025 2.2 1.3 6.0 8.1
2030 2.2 1.3 6.2 8.3
Source: IEA and EIA projections

IV. Scenario assumptions
DEcArBonISAtIon MoDELLIng In thE ELEctrIcIty SEctor Serbia20
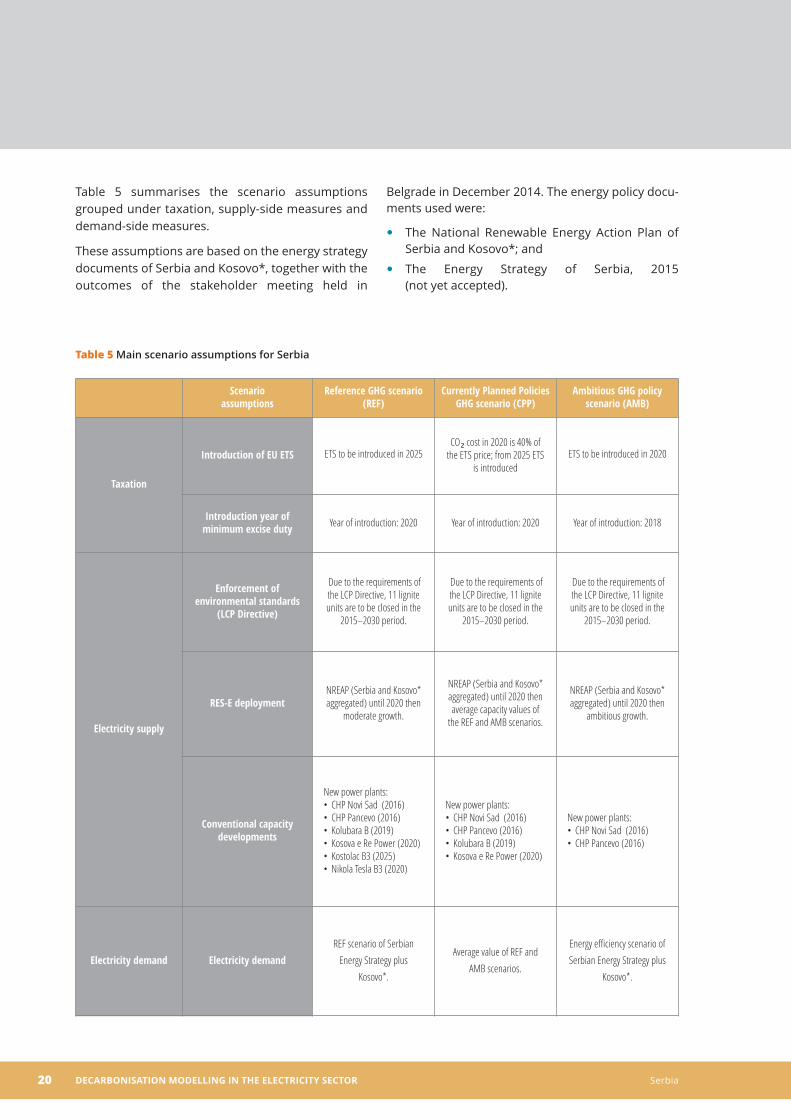
Table 5 summarises the scenario assumptionsgrouped under taxation, supply-side measures anddemand-side measures.
These assumptions are based on the energy strategydocuments of Serbia and Kosovo*, together with theoutcomes of the stakeholder meeting held in
Belgrade in December 2014. The energy policy docu-ments used were:
The National Renewable Energy Action Plan of
Serbia and Kosovo*; and
The Energy Strategy of Serbia, 2015
(not yet accepted).
Table 5 Main scenario assumptions for Serbia
Scenario assumptions
Reference GHG scenario(REF)
Currently Planned PoliciesGHG scenario (CPP)
Ambitious GHG policyscenario (AMB)
Taxation
Introduction of EU ETS ETS to be introduced in 2025 CO₂ cost in 2020 is 40% of
the ETS price; from 2025 ETSis introduced
ETS to be introduced in 2020
Introduction year ofminimum excise duty Year of introduction: 2020 Year of introduction: 2020 Year of introduction: 2018
Electricity supply
Enforcement ofenvironmental standards
(LCP Directive)
Due to the requirements ofthe LCP Directive, 11 ligniteunits are to be closed in the
2015–2030 period.
Due to the requirements ofthe LCP Directive, 11 ligniteunits are to be closed in the
2015–2030 period.
Due to the requirements ofthe LCP Directive, 11 ligniteunits are to be closed in the
2015–2030 period.
RES-E deploymentNREAP (Serbia and Kosovo*aggregated) until 2020 then
moderate growth.
NREAP (Serbia and Kosovo*aggregated) until 2020 thenaverage capacity values of
the REF and AMB scenarios.
NREAP (Serbia and Kosovo*aggregated) until 2020 then
ambitious growth.
Conventional capacitydevelopments
New power plants:CHP Novi Sad (2016) •CHP Pancevo (2016)•Kolubara B (2019)•Kosova e Re Power (2020)•Kostolac B3 (2025)•Nikola Tesla B3 (2020)•
New power plants:CHP Novi Sad (2016) •CHP Pancevo (2016)•Kolubara B (2019)•Kosova e Re Power (2020)•
New power plants:CHP Novi Sad (2016) •CHP Pancevo (2016)•
Electricity demand Electricity demandREF scenario of Serbian
Energy Strategy plusKosovo*.
Average value of REF andAMB scenarios.
Energy efficiency scenario ofSerbian Energy Strategy plus
Kosovo*.
Serbia DEcArBonISAtIon MoDELLIng In thE ELEctrIcIty SEctor 21
Introduction of the European UnionEmissions Trading SystemWe used different assumptions with respect to Serbiajoining the EU ETS. In the REF scenario, Serbia joinsthe ETS in 2025, while in the CPP scenario the powersector already faces a carbon value equal to 40 per-cent of the EU ETS price in 2020. In the AMB scenario,the Serbian power sector joins the ETS already in2020. “Joining the ETS” does not necessarily imply EUmembership: we only assume that national policymakers will apply some instruments with similar effects on the electricity sector as the EU ETS (e.g. bya voluntary or legal obligation, through a nationalcommitment or Energy Community commitments).
Introduction of minimum excise duty on energy productsConcerning other taxes in the energy sector, we usedthe assumption that the country introduces the min-imum level of excise duties in 2020 in the REF and CPPscenarios, while in the AMB scenario it is already in-troduced in 2018.
Environmental standards enforcementThermal power plants with a capacity below 300 MWare on average 45 years old and operate at 30 percentefficiency. The Energy Strategy envisages the gradualwithdrawal of these lignite units. The power plantsthat are assumed to be closed in the modelling in theperiod between 2016 and 2025 are as follows (withinstalled capacity and expected year of decommis-sioning in brackets):
Kolubara A1 (27 MW, 2024)
Kolubara A2 (27 MW, 2024)
Kolubara A3 (59 MW, 2016)
Kodovo A1 (65 MW, 2018)
Kosovo* A2 (125 MW, 2019)
Kostolac A1 (100 MW, 2024)
Morava (105 MW, 2024)
Nikola Tesla A1 (210 MW, 2024)
Nikola Tesla A2 (210 MW, 2025)
Kosovo* A3 (50 MW, 2020)
Kosovo* A4 (100 MW, 2021)
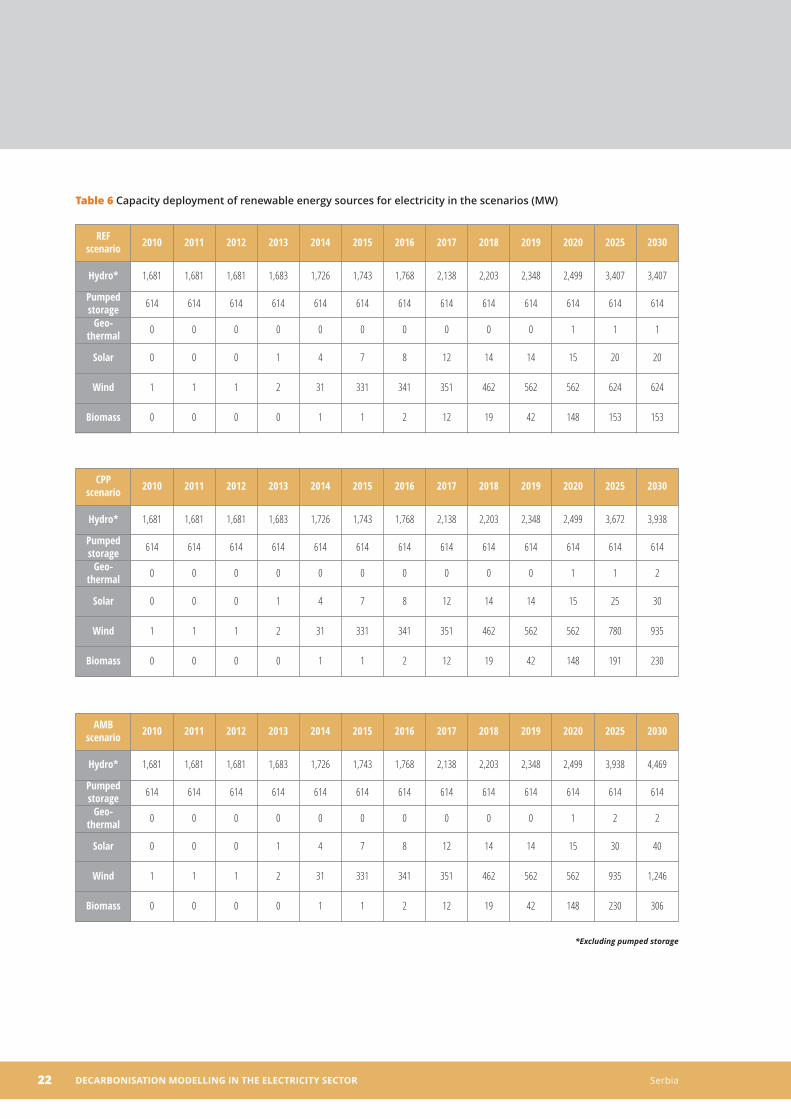
Deployment of renewable energy sourcesfor electricitySerbia (with Kosovo*) finalised its NREAP for the Energy Community Secretariat in 2013. The documentis the basis for our modelling, providing planned ca-pacity values up to 2020. Figures beyond 2020 arebased on expert assumptions up to 2030 (Table 6).
Up until 2020, all scenarios use the NREAP numbers.From 2020 onwards, the REF scenario assumes themoderate expansion of hydro and wind capacities.The AMB scenario allows for a strong growth of hydro(2,000 MW newly installed) and the doubling of windcapacities. The CPP scenario uses the average of theREF and AMB scenario values in the respective years(2025 and 2030). These scenarios assume normal util-isation conditions for weather-dependent technolo-gies (solar, wind), meaning average working hoursand efficiency. Concerning hydro generation in thesescenarios, average hydrological conditions are as-sumed. This assumption will be relaxed in the sensi-tivity assessment, where a low precipitation patternis also assessed. The EEMM treats RES-E capacities ina “must run” operation mode to reflect the prioritydispatch of renewable technologies.
Conventional power plantsSerbia plans to put into operation the following fossil-based power plants in the indicated year:
CHP Novi Sad (440 MW), 2016, natural gas
(biomass firing is also proposed)
CHP Pancevo (190 MW), 2016, natural gas
Kolubara B (630 MW), 2019, lignite
Kosova e Re Power (600 MW), 2020, lignite
Kostolac B3 (320 MW), 2025, lignite
Nikola Tesla B3 (675 MW), 2020, lignite
The construction of CHP Novi Sad (440 MW) and CHP Pancevo (190 MW) is foreseen in all scenarios.
DEcArBonISAtIon MoDELLIng In thE ELEctrIcIty SEctor Serbia22
Table 6 Capacity deployment of renewable energy sources for electricity in the scenarios (MW)
REF scenario 2010 2011 2012 2013 2014 2015 2016 2017 2018 2019 2020 2025 2030
Hydro* 1,681 1,681 1,681 1,683 1,726 1,743 1,768 2,138 2,203 2,348 2,499 3,407 3,407
Pumpedstorage 614 614 614 614 614 614 614 614 614 614 614 614 614
Geo-thermal 0 0 0 0 0 0 0 0 0 0 1 1 1
Solar 0 0 0 1 4 7 8 12 14 14 15 20 20
Wind 1 1 1 2 31 331 341 351 462 562 562 624 624
Biomass 0 0 0 0 1 1 2 12 19 42 148 153 153
CPP scenario 2010 2011 2012 2013 2014 2015 2016 2017 2018 2019 2020 2025 2030
Hydro* 1,681 1,681 1,681 1,683 1,726 1,743 1,768 2,138 2,203 2,348 2,499 3,672 3,938
Pumpedstorage 614 614 614 614 614 614 614 614 614 614 614 614 614
Geo-thermal 0 0 0 0 0 0 0 0 0 0 1 1 2
Solar 0 0 0 1 4 7 8 12 14 14 15 25 30
Wind 1 1 1 2 31 331 341 351 462 562 562 780 935
Biomass 0 0 0 0 1 1 2 12 19 42 148 191 230
AMB scenario 2010 2011 2012 2013 2014 2015 2016 2017 2018 2019 2020 2025 2030
Hydro* 1,681 1,681 1,681 1,683 1,726 1,743 1,768 2,138 2,203 2,348 2,499 3,938 4,469
Pumpedstorage 614 614 614 614 614 614 614 614 614 614 614 614 614
Geo-thermal 0 0 0 0 0 0 0 0 0 0 1 2 2
Solar 0 0 0 1 4 7 8 12 14 14 15 30 40
Wind 1 1 1 2 31 331 341 351 462 562 562 935 1,246
Biomass 0 0 0 0 1 1 2 12 19 42 148 230 306
*Excluding pumped storage

Serbia DEcArBonISAtIon MoDELLIng In thE ELEctrIcIty SEctor 23
The construction of the Kolubara B (630 MW) andKosova e Re Power (600 MW) lignite power plants isassumed only in the REF and CPP scenarios, while theconstruction of the Kostolac B3 (320 MW) and NikolaTesla B3 (675 MW) plants is assumed in the REF scenario exclusively.
Electricity demandElectricity consumption usually closely follows a coun-try’s GDP development. We did not prepare our ownforecast based on GDP assumptions, but used a mod-ification of the REF and energy efficiency scenarios ofthe Energy Strategy of Serbia (which excludesKosovo*) in order to include Kosovo* in the electricitydemand used in the modelling (Table 7).
Table 7 Gross electricity consumption in Serbia (GWh)
GWh 2015 2016 2017 2018 2019 2020 2025 2030
REF 40,230 40,050 39,871 39,691 39,511 39,332 41,416 43,824
CPP 38,895 38,567 38,258 37,940 37,622 37,303 39,182 41,410
AMB 37,559 37,103 36,646 36,189 35,732 35,275 36,948 38,995

V. Modelling results
Serbia DEcArBonISAtIon MoDELLIng In thE ELEctrIcIty SEctor 25
In this section we discuss the results of the modellingrelated to wholesale price development, the electric-ity generation mix, CO₂ emissions, renewable sup-port and investment needs for the generationcapacities included in the respective scenarios.
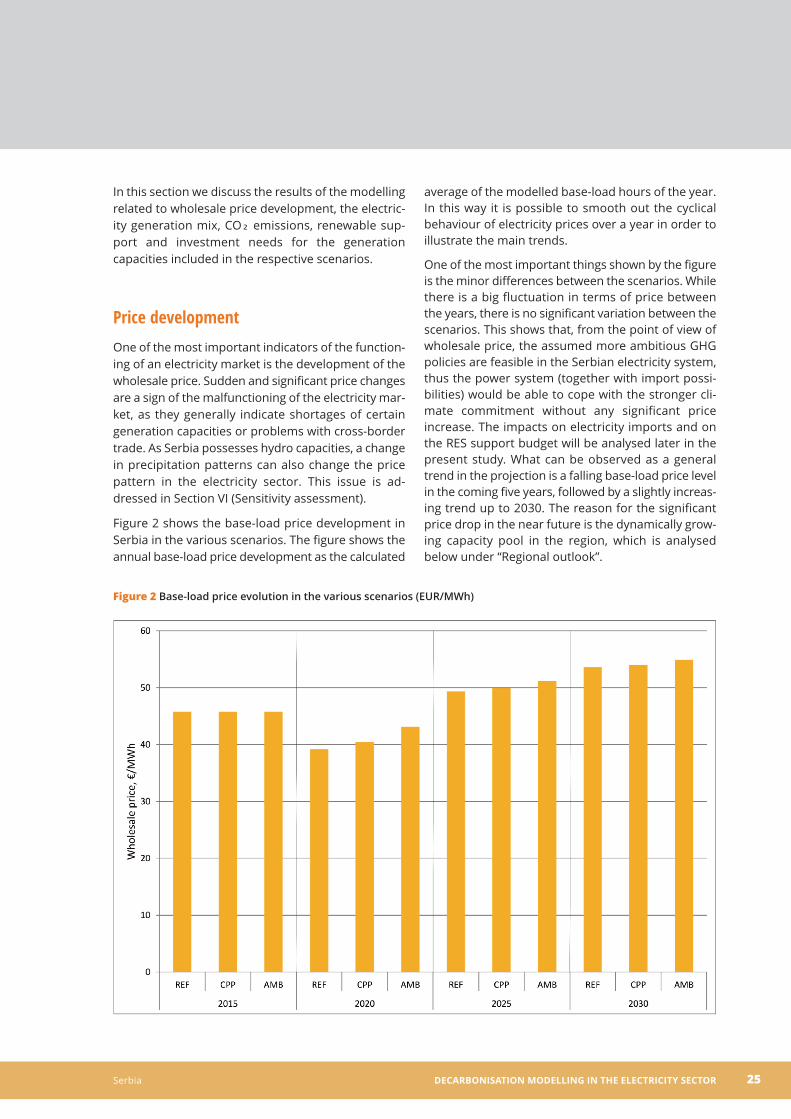
Price developmentOne of the most important indicators of the function-ing of an electricity market is the development of thewholesale price. Sudden and significant price changesare a sign of the malfunctioning of the electricity mar-ket, as they generally indicate shortages of certaingeneration capacities or problems with cross-bordertrade. As Serbia possesses hydro capacities, a changein precipitation patterns can also change the pricepattern in the electricity sector. This issue is ad-dressed in Section VI (Sensitivity assessment).
Figure 2 shows the base-load price development inSerbia in the various scenarios. The figure shows theannual base-load price development as the calculated
average of the modelled base-load hours of the year.In this way it is possible to smooth out the cyclical behaviour of electricity prices over a year in order toillustrate the main trends.
One of the most important things shown by the figureis the minor differences between the scenarios. Whilethere is a big fluctuation in terms of price betweenthe years, there is no significant variation between thescenarios. This shows that, from the point of view ofwholesale price, the assumed more ambitious GHGpolicies are feasible in the Serbian electricity system,thus the power system (together with import possi-bilities) would be able to cope with the stronger cli-mate commitment without any significant priceincrease. The impacts on electricity imports and onthe RES support budget will be analysed later in thepresent study. What can be observed as a generaltrend in the projection is a falling base-load price levelin the coming five years, followed by a slightly increas-ing trend up to 2030. The reason for the significantprice drop in the near future is the dynamically grow-ing capacity pool in the region, which is analysedbelow under “Regional outlook”.
Figure 2 Base-load price evolution in the various scenarios (EUR/MWh)
DEcArBonISAtIon MoDELLIng In thE ELEctrIcIty SEctor Serbia26
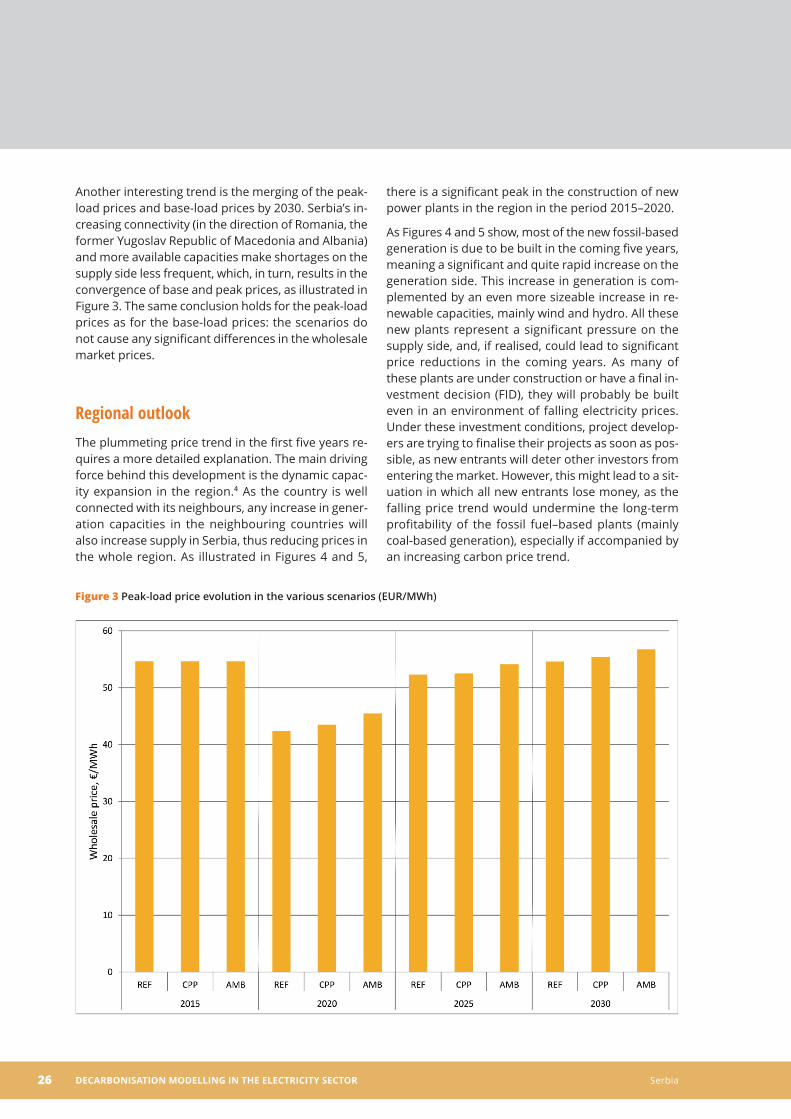
Another interesting trend is the merging of the peak-load prices and base-load prices by 2030. Serbia’s in-creasing connectivity (in the direction of Romania, theformer Yugoslav Republic of Macedonia and Albania)and more available capacities make shortages on thesupply side less frequent, which, in turn, results in theconvergence of base and peak prices, as illustrated inFigure 3. The same conclusion holds for the peak-loadprices as for the base-load prices: the scenarios donot cause any significant differences in the wholesalemarket prices.
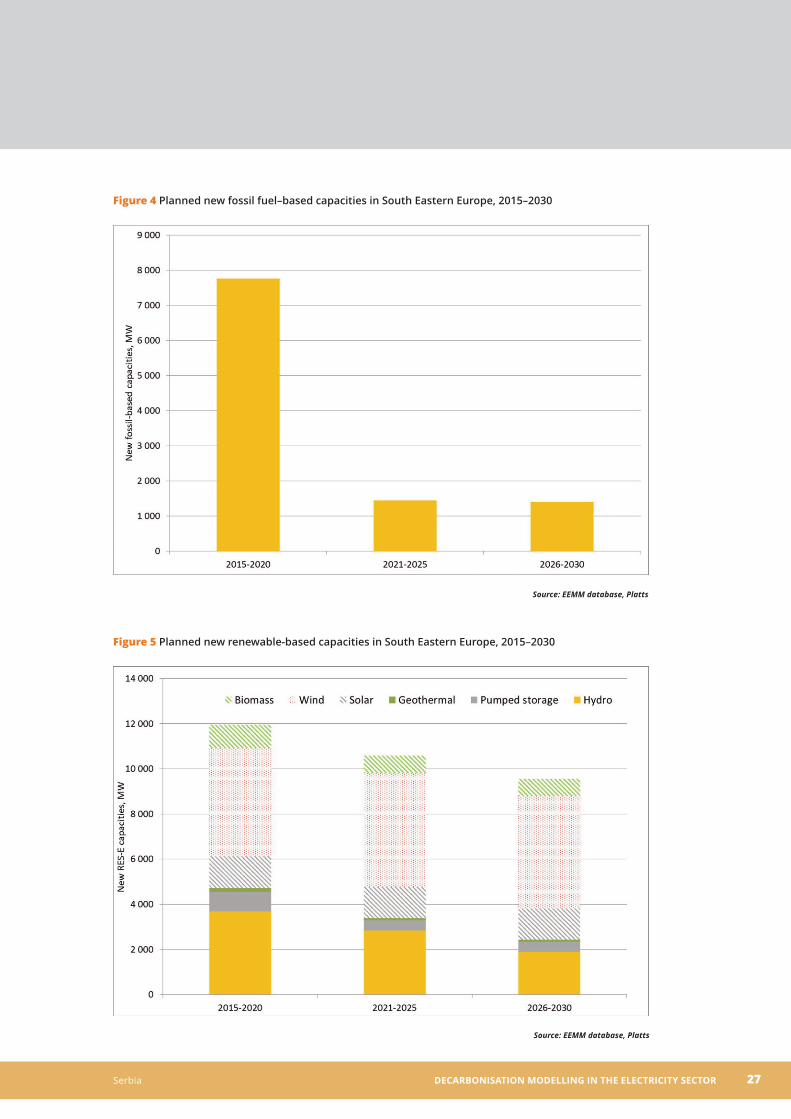
Regional outlookThe plummeting price trend in the first five years re-quires a more detailed explanation. The main drivingforce behind this development is the dynamic capac-ity expansion in the region.4 As the country is wellconnected with its neighbours, any increase in gener-ation capacities in the neighbouring countries willalso increase supply in Serbia, thus reducing prices inthe whole region. As illustrated in Figures 4 and 5,
there is a significant peak in the construction of newpower plants in the region in the period 2015–2020.
As Figures 4 and 5 show, most of the new fossil-basedgeneration is due to be built in the coming five years,meaning a significant and quite rapid increase on thegeneration side. This increase in generation is com-plemented by an even more sizeable increase in re-newable capacities, mainly wind and hydro. All thesenew plants represent a significant pressure on thesupply side, and, if realised, could lead to significantprice reductions in the coming years. As many ofthese plants are under construction or have a final in-vestment decision (FID), they will probably be builteven in an environment of falling electricity prices.Under these investment conditions, project develop-ers are trying to finalise their projects as soon as pos-sible, as new entrants will deter other investors fromentering the market. However, this might lead to a sit-uation in which all new entrants lose money, as thefalling price trend would undermine the long-termprofitability of the fossil fuel–based plants (mainlycoal-based generation), especially if accompanied byan increasing carbon price trend.
Figure 3 Peak-load price evolution in the various scenarios (EUR/MWh)
Serbia DEcArBonISAtIon MoDELLIng In thE ELEctrIcIty SEctor 27
Figure 4 Planned new fossil fuel–based capacities in South Eastern Europe, 2015–2030
Figure 5 Planned new renewable-based capacities in South Eastern Europe, 2015–2030
Source: EEMM database, Platts
Source: EEMM database, Platts
DEcArBonISAtIon MoDELLIng In thE ELEctrIcIty SEctor Serbia28
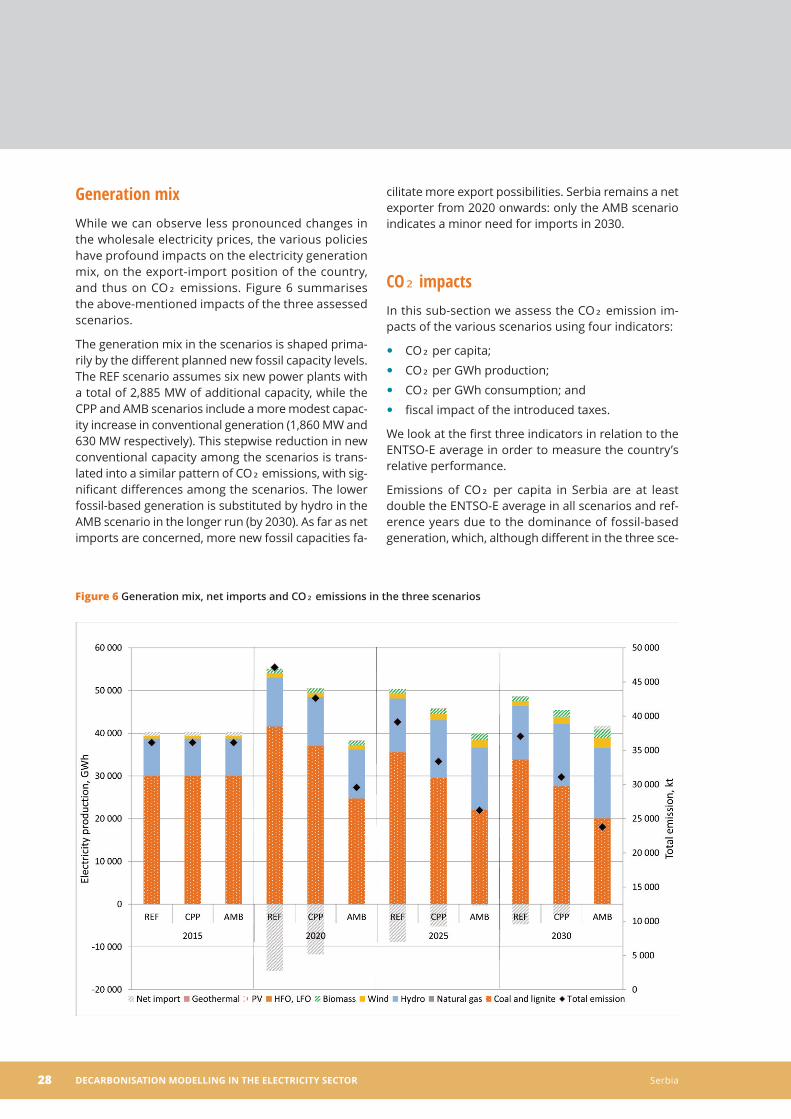
Generation mixWhile we can observe less pronounced changes inthe wholesale electricity prices, the various policieshave profound impacts on the electricity generationmix, on the export-import position of the country,and thus on CO₂ emissions. Figure 6 summarisesthe above-mentioned impacts of the three assessedscenarios.
The generation mix in the scenarios is shaped prima-rily by the different planned new fossil capacity levels.The REF scenario assumes six new power plants witha total of 2,885 MW of additional capacity, while theCPP and AMB scenarios include a more modest capac-ity increase in conventional generation (1,860 MW and630 MW respectively). This stepwise reduction in newconventional capacity among the scenarios is trans-lated into a similar pattern of CO₂ emissions, with sig-nificant differences among the scenarios. The lowerfossil-based generation is substituted by hydro in theAMB scenario in the longer run (by 2030). As far as netimports are concerned, more new fossil capacities fa-
cilitate more export possibilities. Serbia remains a netexporter from 2020 onwards: only the AMB scenarioindicates a minor need for imports in 2030.
CO₂ impactsIn this sub-section we assess the CO₂ emission im-pacts of the various scenarios using four indicators:
CO₂ per capita;
CO₂ per GWh production;
CO₂ per GWh consumption; and
fiscal impact of the introduced taxes.
We look at the first three indicators in relation to theENTSO-E average in order to measure the country’srelative performance.
Emissions of CO₂ per capita in Serbia are at least double the ENTSO-E average in all scenarios and ref-erence years due to the dominance of fossil-basedgeneration, which, although different in the three sce-
Figure 6 Generation mix, net imports and CO₂ emissions in the three scenarios
Serbia DEcArBonISAtIon MoDELLIng In thE ELEctrIcIty SEctor 29
narios (due to the assumptions about new capacity),remains significant compared to renewables, with theexception of the AMB scenario in 2030 (Figure 7).
The CO₂ intensity indicator for electricity productionshows a similar pattern: higher but decreasing figuresfor Serbia compared to the ENTSO-E average. The in-crease in the CO₂ indicator for electricity consump-tion reflects the fact that Serbia becomes anelectricity exporter in 2020 (Figures 8 and 9).
Excise and carbon taxes mean government revenuesfrom the electricity sector. As Figure 10 (page 32)shows, carbon revenues are significantly more impor-tant sources than excise taxes on energy products.Due to the stepwise introduction of the ETS carbonprice, the revenue streams show an increasing trend,reaching between EUR 600 and EUR 900 million by2030. Differences among the scenarios are due to thedifferent volumes of the assumed new conventionalcapacities. Tax revenues could be used to finance im-portant segments of the energy sector, such as renewables or energy efficiency policies.
Net import position
The most significant variation between the scenariosappears in relation to import levels. The country iscurrently close to self-sufficiency: domestic demandis mainly covered by domestic production. By 2020,Serbia will build a strong export position due to thenew 1,660 MW of fossil-based capacity and the ap-proximately 700 MW hydro capacity in the REF sce-nario (Figure 11, page 33). The lower demand andhigher RES deployment do not counterbalance themore modest fossil-based capacity development inthe CPP and AMB scenarios, resulting in lower exportsor even modest imports by 2030 (AMB scenario).
These results are further analysed in Section VI (Sensitivity assessment), where the assumption aboutthe average hydro utilisation rate is relaxed and theproduction pattern checked against the new assump-tion regarding the availability of hydro generation.
Figure 7 CO₂ emission levels per capita
DEcArBonISAtIon MoDELLIng In thE ELEctrIcIty SEctor Serbia30
Investment costsIn addition to the generation mix and the resultingCO₂ emissions, it is important to assess the financialconsequences of the various scenarios. This will bedone by considering two types of costs: the invest-ment costs for generation capacities; and the RES-Esupport budget.
The required investment costs in the electricity sectorfor building the new capacities are shown in Table 8.The sources of information concerning unit investmentcosts (shown in the second column, EUR/kW) are a2013 publication by the Fraunhofer research organisa-tion5; and the Serbian Energy Strategy, which gives region-adjusted values for the investment costs. Whilemost of the renewable and natural gas–based esti-mates are in a similar range, estimates in the case ofhydro and coal generation investment costs deviatesignificantly. We use benchmark investment cost val-ues, as national quotes generally underestimate costs.6
As Table 8 shows, the REF scenario results in highercumulated investment costs compared to the — quite
similar — CPP and AMB scenarios. This means thatthe additional cost of more hydro, wind and biomassproduction units is still lower than the cost of the coal-fired plants assumed in the REF scenario, but not inthe AMB scenario and only partly in the CPP scenario.
Support budget for renewable energysources for electricityThe next assessed cost element is the RES supportbudget, which indicates the overall financial burdenof RES-E deployment. We calculate with a benchmarksupport need, as present national support levelsmight not reflect the LCOE of the technologies.
The support need for 1 MWh of RES-E is calculated bytaking the LCOE of the various generation technolo-gies, which reflects the full average cost of renewablegeneration, including not only the marginal operatingcosts, but also the financial returns needed to coverthe investments.7 To make RES production breakeven, the difference between the LCOE value and the
Figure 8 CO₂ intensity of electricity production (tCO₂/GWh)

Serbia DEcArBonISAtIon MoDELLIng In thE ELEctrIcIty SEctor 31
market price (P) must be given to producers for everyproduced MWh of renewable electricity, which is thesupport need for RES-E production. Base-load andpeak-load prices are used from EEMM runs, makingit possible to calculate the support need for eachMWh of RES electricity produced. We assume that thissupport need is independent of the type of supportapplied (feed-in tariff [FIT] or feed-in premium). If thissupport need is multiplied by the projected quantityof generated RES-E, we arrive at the support budget.This calculation is shown in the following equation:
Support budget = (LCOEt-P)*generated electricity
LCOEt: levelised cost of electricity generation of•technology t ~ average cost of electricity produc-tion
P: modelled base-load electricity price (except•PV, where peak-load electricity prices are takeninto account)
We use a differentiated LCOE for all RES-E technolo-gies, based on data from the literature. One of themost recent reliable calculations (Ecofys, 20148) gives
the following benchmark LCOE data, which were usedin this study:
EUR 55/MWh for hydro;
EUR 90/MWh for wind;
EUR 110/MWh for biomass;
EUR 105/MWh for PV; and
EUR 80/MWh for geothermal.
Present FIT support in the country for new hydro capac-ities is set between EUR 74 and EUR 124/MWh for pro-duction capacities up to 30 GWh; for PV it is set at EUR132 to EUR 206/MWh; for wind at EUR 92/MWh; and forbiomass at EUR 82 to EUR 132/MWh, depending on thesize. The benchmark LCOE values show that the pres-ent level of support in Serbia will be sufficient to coverall types of RES in the future as well, so there is no pres-sure to further increase support for the technologies.
If the RES-E support budget is divided by the totalelectricity consumption — assuming that all electricityconsumers have to pay for the RES-E support — wecan also calculate the average RES support fee that
Figure 9 CO₂ intensity of electricity consumption (tCO₂/GWh)
DEcArBonISAtIon MoDELLIng In thE ELEctrIcIty SEctor Serbia32
each end user has to pay according to their consump-tion. These values — the total annual RES-E supportbudget and the average RES support fee — are shownin Figures 12 and 13.
Figure 12 (page 34) shows the steeply increasing sup-port budget between 2015 and 2020 (mainly due towholesale price fluctuations), but also the decreasingbudget subsequently, despite the continuously grow-ing RES-E capacities. There is a peak in the supportbudget in around 2020, after which financing becomesless costly in overall terms. In 2020, the electricity priceis higher in the CPP and AMB scenarios, resulting inless need for support than in the REF scenario (RES ca-pacities are the same in all three scenarios). The effectof this price difference is cancelled out by higher RESpenetration in 2025 and 2030 across the scenarios.
Figure 13 (page 35) illustrates what this support meansfor end consumers in terms of the price increase theywill have to face due to the higher deployment of RES-E.
The average RES-E charge on consumed electricity fol-lows a similar trend as in the case of the overall RES-E budget. The extra charge is highest in the REFscenario, reaching a peak of EUR 7.8/MWh by 2020.Although this charge is considerable, it is lower thanthe 2012 support level in many European memberstates. According to a 2015 report by the Council ofEuropean Energy Regulators (CEER) on EU renewablesupport schemes, EU member states supported RES-E with an average of EUR 13.68/MWh in 2012.9
The trends for 2025 and 2030 and across the scenarios have a similar explanation as the annualRES budget.
Figure 10 Revenues from the Emissions Trading System and excise tax
Serbia DEcArBonISAtIon MoDELLIng In thE ELEctrIcIty SEctor 33
Figure 11 Net import position of Serbia in the three scenarios (negative numbers mean exports)
Table 8 Cumulated investment costs in 2015–2030 in the three scenarios
Investmentcost (EUR/kW)
New capacity (MW) Investment cost (EUR million)
REF CPP AMB REF CPP AMB
Natural gas 1,000 630 630 630 630 630 630
Coal 2,000 2,225 1,230 0 4,450 2,460 0
Hydro 2,500 1,664 2,195 2,726 4,160 5,487 6,815
Geothermal 4,000 1 2 2 4 6 8
Solar 1,100 13 23 33 14 25 36
Wind 1,000 293 604 915 293 604 915
Biomass 3,000 152 229 305 456 686 915
Total – 4,978 4,912 4,610 10,007 9,898 9,318
DEcArBonISAtIon MoDELLIng In thE ELEctrIcIty SEctor Serbia34
Figure 12 Annual support budget for renewable energy sources for electricity (EUR million)
Serbia DEcArBonISAtIon MoDELLIng In thE ELEctrIcIty SEctor 35
Figure 13 Average support for renewable energy sources for electricity from end consumers (EUR/MWh)
notES1 “The region” includes Albania (AL), Bosnia and Herzegovina (BA), Croatia (HR), Bulgaria (BG), Greece (GR), Hungary (HU), the former Yugoslav
Republic of Macedonia (MK), Montenegro (ME), Romania (RO) and Serbia (RS).
2 Levelized Cost of Electricity Renewable Energy Technologies, Fraunhofer Institute for Solar Energy Systems ISE, November 2013
3 A recent example from the region is the Sostanj coal-fired TPP in Slovenia. The initial investment cost estimate was EUR 700 million for agross 600 MW coal plant (net output 545 MW), and the final investment cost was EUR 1,400 million, equal to EUR 2,500/kW. Source: BalkanEnergy News, June 2015.
4 The most common way to calculate LCOE is:
where I = investment costs; M = maintenance costs; F = fuel costs; E = electricity generated in time t; r = discount rate; and t = time pe-riod.
5 Subsidies and costs of EU energy, Ecofys, November 2014, Final report DESNL145836 Status Review of Renewable and Energy Efficiency Support Schemes in Europe in 2012 and 2013, Council of European Energy Regulators, 2015.
Ref: C14-SDE-44-03.

VI. Sensitivity assessment
Serbia DEcArBonISAtIon MoDELLIng In thE ELEctrIcIty SEctor 37
Hydropower plays an important role in the region, ashigh levels of hydro capacity exist in almost all the as-sessed countries. Albania leads these countries, rely-ing almost exclusively on hydropower. The share ofhydro generation capacity in Serbia was 32 percent in2014. It is still worth analysing the impact of dry yearsto see if it poses a security of supply concern for Ser-bia. It should be emphasised that this is one of thereasons why most SEE countries are cautious aboutfurther increasing their share of hydro capacities, asto do so would be to further deepen their exposureto meteorological conditions (i.e. to the quantity andseasonality of precipitation).
In order to investigate this issue, a sensitivity assess-ment was carried out that assumed lower precipita-tion levels than in the previous three scenarios. In theREF, CPP and AMB scenarios, hydro utilisation ratesare modelled on the average level of the past eightyears, while in the sensitivity runs we checked thesescenarios using the lowest utilisation rate during thepast eight years, mimicking the situation in a dry year.As droughts usually occur in the same years through-out the region, we modelled the sensitivity runs ac-
cordingly: all neighbouring countries experience alower level of precipitation. This is an important as-sumption, since droughts affect these countries in asimilar way and drive import and export prices up-wards in a similar pattern.
We focus on two aspects in this sensitivity assess-ment: the substitution possibilities within the countryto compensate for the loss in hydro generation; andthe impacts on export-import positions. Figure 14 illustrates the substitution effects in the case of lowerthan usual hydro generation.
As Figure 14 shows, the decrease in hydro generationis substituted by imports, and increasingly by fossil-based generation. In 2015, hydro is fully substitutedby an increase in imports. In 2020, the cutback inhydro means a reduction in exports in the REF andCPP scenarios, but — due to self-sufficient production— an increase in fossil-based generation in the AMBscenario. In 2030, Serbia can increase its exports inthe region due to the large drop in hydro generationin the neighbouring countries. Total CO₂ emissionschange according to the trade position of Serbia:
Figure 14 Change in the electricity mix in the case of low hydro availability
SuPPort For Low-EMISSIon DEVELoPMEnt In South EAStErn EuroPE (SLED) Serbia38
increasing imports result in a decrease in emissionsdue to carbon leakage.
Figure 15 shows in greater detail the impact on theexport/import position of Serbia.
The overall conclusion to be drawn from the sensitivityassessment is that Serbia, with its ambitious fossil-based capacity plans and relatively modest hydro gen-eration share, can expand its electricity exports in dryyears due to the greater vulnerability of the othercountries in the region. This underlines the need forregional cooperation, since, due to the adequate inter-connections in the SEE region, there is no shortage ofcapacities to satisfy overall regional demand, even in a
dry year. The high (and increasing) interconnectionrates in the region would allow for such cooperation,and countries would be in a win-win situation. Such co-operation would also make the country less depend-ent on the expansion of fossil-based capacities.
Figure 16 illustrates the wholesale price changes inthe scenario runs.
While in 2015 the price impact is significant, mainlydue to constraints on the supply side, after 2020 theimpact is limited to around EUR 3 or EUR 4/MWh in allscenarios. This latter development is probably the re-sult of the capacity developments in the region, whichare explored in Section V under “Regional outlook”.
Figure 15 Changes in the net import position of Serbia

Serbia DEcArBonISAtIon MoDELLIng In thE ELEctrIcIty SEctor 39
Figure 16 Base-load price changes in Serbia (EUR/MWh)

VII. Network impacts
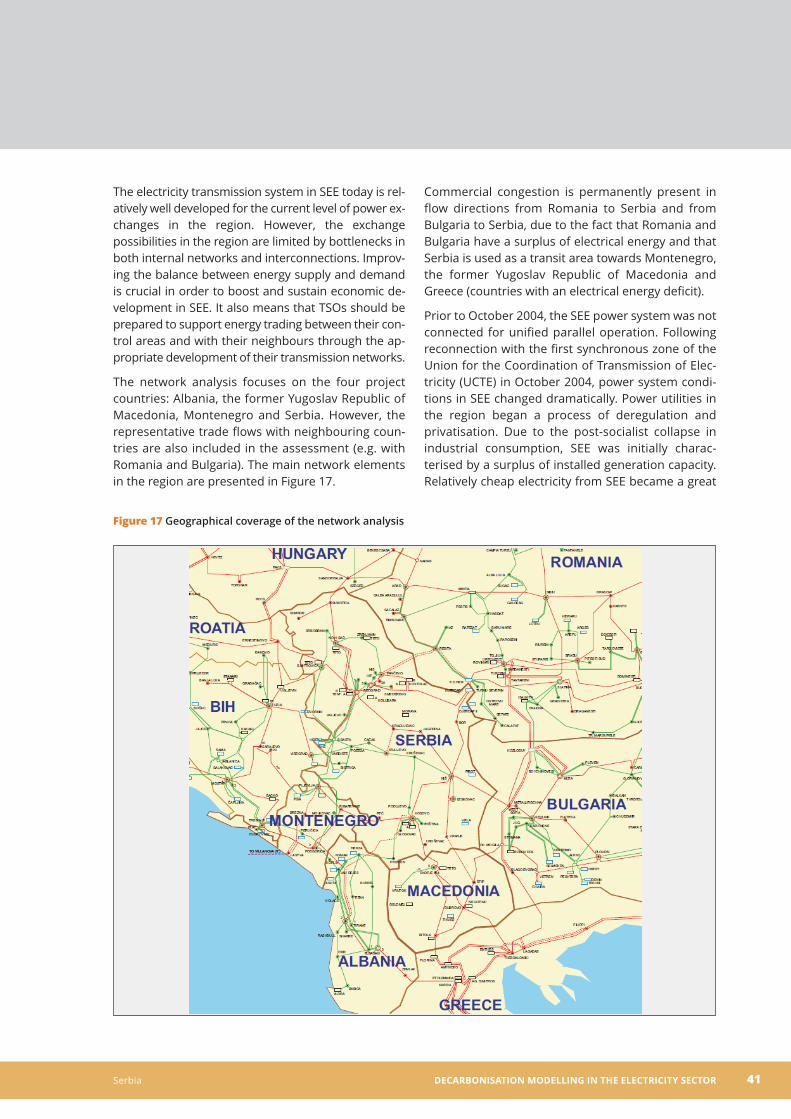
Serbia DEcArBonISAtIon MoDELLIng In thE ELEctrIcIty SEctor 41
The electricity transmission system in SEE today is rel-atively well developed for the current level of power ex-changes in the region. However, the exchangepossibilities in the region are limited by bottlenecks inboth internal networks and interconnections. Improv-ing the balance between energy supply and demandis crucial in order to boost and sustain economic de-velopment in SEE. It also means that TSOs should beprepared to support energy trading between their con-trol areas and with their neighbours through the ap-propriate development of their transmission networks.
The network analysis focuses on the four projectcountries: Albania, the former Yugoslav Republic ofMacedonia, Montenegro and Serbia. However, therepresentative trade flows with neighbouring coun-tries are also included in the assessment (e.g. with Romania and Bulgaria). The main network elementsin the region are presented in Figure 17.
Commercial congestion is permanently present inflow directions from Romania to Serbia and from Bulgaria to Serbia, due to the fact that Romania andBulgaria have a surplus of electrical energy and thatSerbia is used as a transit area towards Montenegro,the former Yugoslav Republic of Macedonia andGreece (countries with an electrical energy deficit).
Prior to October 2004, the SEE power system was notconnected for unified parallel operation. Following reconnection with the first synchronous zone of theUnion for the Coordination of Transmission of Elec-tricity (UCTE) in October 2004, power system condi-tions in SEE changed dramatically. Power utilities inthe region began a process of deregulation and privatisation. Due to the post-socialist collapse in industrial consumption, SEE was initially charac-terised by a surplus of installed generation capacity.Relatively cheap electricity from SEE became a great
Figure 17 Geographical coverage of the network analysis
DEcArBonISAtIon MoDELLIng In thE ELEctrIcIty SEctor Serbia42
market opportunity. Countries in the region agreed tocreate a stable common regulatory and marketframework capable of attracting investment in powergeneration and transmission networks.
All these factors have a substantial impact on the op-eration and development of the regional transmissionnetwork. Compared to other European regions, SEEis characterised by large interconnection capacities ata 220 kV voltage level and above.
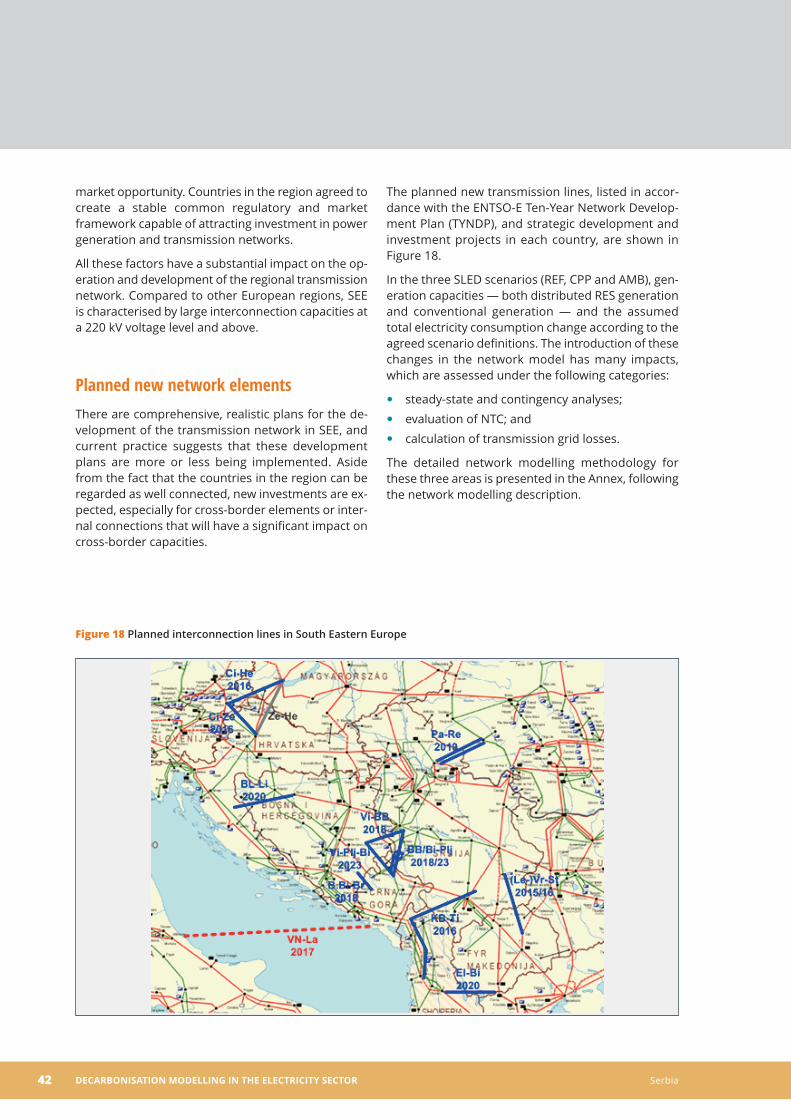
Planned new network elementsThere are comprehensive, realistic plans for the de-velopment of the transmission network in SEE, andcurrent practice suggests that these developmentplans are more or less being implemented. Asidefrom the fact that the countries in the region can beregarded as well connected, new investments are ex-pected, especially for cross-border elements or inter-nal connections that will have a significant impact oncross-border capacities.
The planned new transmission lines, listed in accor-dance with the ENTSO-E Ten-Year Network Develop-ment Plan (TYNDP), and strategic development andinvestment projects in each country, are shown inFigure 18.
In the three SLED scenarios (REF, CPP and AMB), gen-eration capacities — both distributed RES generationand conventional generation — and the assumedtotal electricity consumption change according to theagreed scenario definitions. The introduction of thesechanges in the network model has many impacts,which are assessed under the following categories:
steady-state and contingency analyses;
evaluation of NTC; and
calculation of transmission grid losses.
The detailed network modelling methodology forthese three areas is presented in the Annex, followingthe network modelling description.
Figure 18 Planned interconnection lines in South Eastern Europe
Serbia DEcArBonISAtIon MoDELLIng In thE ELEctrIcIty SEctor 43
Results of network modellingThe winter and summer operating regimes for the2015, 2020 and 2025 development stage in all scenar-ios were assessed in the network modelling stage. Theyear 2015 was considered as the reference year in theassessment, reflecting the present network topologyand the currently available generation capacities.
Steady-state and contingency analyses
Calculations within system studies were conductedon regional network models for SEE prepared for2020 and 2025. The power systems of the four as-sessed countries were modelled according to the datacollected and the Southeast Europe Cooperation Initiative (SECI) regional model for 2020/2025, theavailable respective national development plans, andthe transmission system development set out in theENTSO-E TYNDP 2012–2022.
System balances
Power system balances (in MW) in the assessed coun-tries, analysed for all regimes (winter and summer)and scenarios, are presented below.
In 2020:
Montenegro is an importing country in the sum-
mer regime, while in the winter regime it is an exporting country due to the significant numberof RES.
Serbia is an exporter of 1,000 MW in both regimes.
Albania is an exporting country.
Due to new capacities (conventional, especially TPPs),in 2025:
Serbia becomes a large exporter.
Montenegro is an exporter in the winter peak
regime (due to a certain number of RES), but in thesummer peak regime it still imports a smallamount of power.
Albania only exports in the winter peak regime
(AMB and REF) at 150 MW, and in other regimes itis balanced.
The former Yugoslav Republic of Macedonia is an importer in all regimes and scenarios.
(N-1) Security criteria10
In 2015, there are no high-loaded elements at 220 kVand 400 kV voltage levels in the assessed countries.
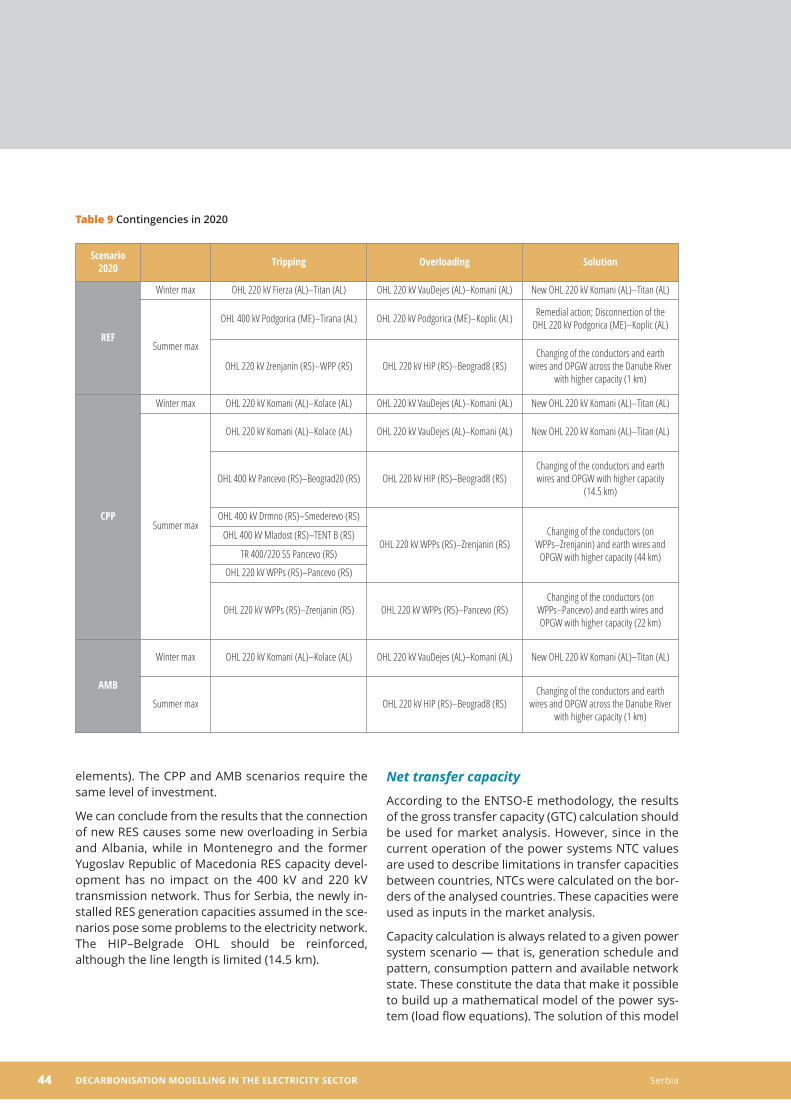
The results of the security assessments for 2020 and2025 are shown in Tables 9 and 10 for the whole ofthe assessed region, as contingencies appear at regional but not at country level.
In 2020, the following strengthening is necessary:
In all scenarios, the tripping of the OHL 220 kV
Fierza (AL)–Titan (AL) line leads to the overloadingof the OHL 220 kV VauDejes (AL)–Komani (AL) line.The new OHL 220 kV Komani (AL)–Titan (AL) linesolves the problem (70 km).
Some windfarms that are to be constructed within
the Serbian power utility EPS will be connected tothe OHL 220 kV Zrenjanin (RS)–Pancevo (RS) line.As a consequence of overloading in that area, inthe CPP scenario the conductor on the OHL 220 kV Pancevo (RS)–Zrenjanin (RS) line should bereplaced with a higher capacity one (length of approximately 22+44 km).
In the AMB scenario, only the replacement of a
1 km length of conductor on the OHL 220 kV HIP(RS)–Pancevo (RS) line is required (in addition tothe OHL 220 kV VauDejes [AL]–Komani [AL] line).
Generally speaking, the CPP scenario requires greateradditional investment than the other two (as a con-sequence of more new elements). The REF and AMBscenarios require the same level of investment, butless than the CPP scenario.
In 2025, the following strengthening is necessary:
In all scenarios, the tripping of the line OHL 220 kV
Fierza (AL)–Titan (AL) leads to the overloading ofthe OHL 220 kV VauDejes (AL)–Komani (AL) line.The new OHL 220 kV Komani (AL)–Titan (AL) linesolves that problem (70 km).
Some windfarms to be constructed within the
Serbian EPS will be connected to the OHL 220 kVZrenjanin (RS)–Pancevo (RS) line. As a conse-quence of overloading in that area, in the CPP andAMB scenarios the conductor on the OHL 220 HIP(RS)–Beograd 8 (RS) line should be replaced witha higher-capacity one (length of approximately14.5 km).
The REF scenario requires less additional investmentthan the other two (as a consequence of fewer new
DEcArBonISAtIon MoDELLIng In thE ELEctrIcIty SEctor Serbia44
elements). The CPP and AMB scenarios require thesame level of investment.
We can conclude from the results that the connectionof new RES causes some new overloading in Serbiaand Albania, while in Montenegro and the former Yugoslav Republic of Macedonia RES capacity devel-opment has no impact on the 400 kV and 220 kVtransmission network. Thus for Serbia, the newly in-stalled RES generation capacities assumed in the sce-narios pose some problems to the electricity network.The HIP–Belgrade OHL should be reinforced, although the line length is limited (14.5 km).
Net transfer capacity
According to the ENTSO-E methodology, the resultsof the gross transfer capacity (GTC) calculation shouldbe used for market analysis. However, since in thecurrent operation of the power systems NTC valuesare used to describe limitations in transfer capacitiesbetween countries, NTCs were calculated on the bor-ders of the analysed countries. These capacities wereused as inputs in the market analysis.
Capacity calculation is always related to a given powersystem scenario — that is, generation schedule andpattern, consumption pattern and available networkstate. These constitute the data that make it possibleto build up a mathematical model of the power sys-tem (load flow equations). The solution of this model
Table 9 Contingencies in 2020
Scenario2020 Tripping Overloading Solution
REF
Winter max OHL 220 kV Fierza (AL)–Titan (AL) OHL 220 kV VauDejes (AL)–Komani (AL) New OHL 220 kV Komani (AL)–Titan (AL)
Summer max
OHL 400 kV Podgorica (ME)–Tirana (AL) OHL 220 kV Podgorica (ME)–Koplic (AL) Remedial action; Disconnection of theOHL 220 kV Podgorica (ME)–Koplic (AL)
OHL 220 kV Zrenjanin (RS)–WPP (RS) OHL 220 kV HIP (RS)–Beograd8 (RS) Changing of the conductors and earth
wires and OPGW across the Danube Riverwith higher capacity (1 km)
CPP
Winter max OHL 220 kV Komani (AL)–Kolace (AL) OHL 220 kV VauDejes (AL)–Komani (AL) New OHL 220 kV Komani (AL)–Titan (AL)
Summer max
OHL 220 kV Komani (AL)–Kolace (AL) OHL 220 kV VauDejes (AL)–Komani (AL) New OHL 220 kV Komani (AL)–Titan (AL)
OHL 400 kV Pancevo (RS)–Beograd20 (RS) OHL 220 kV HIP (RS)–Beograd8 (RS)Changing of the conductors and earthwires and OPGW with higher capacity
(14.5 km)
OHL 400 kV Drmno (RS)–Smederevo (RS)
OHL 220 kV WPPs (RS)–Zrenjanin (RS)Changing of the conductors (on
WPPs–Zrenjanin) and earth wires andOPGW with higher capacity (44 km)
OHL 400 kV Mladost (RS)–TENT B (RS)
TR 400/220 SS Pancevo (RS)
OHL 220 kV WPPs (RS)–Pancevo (RS)
OHL 220 kV WPPs (RS)–Zrenjanin (RS) OHL 220 kV WPPs (RS)–Pancevo (RS)Changing of the conductors (on
WPPs–Pancevo) and earth wires andOPGW with higher capacity (22 km)
AMB
Winter max OHL 220 kV Komani (AL)–Kolace (AL) OHL 220 kV VauDejes (AL)–Komani (AL) New OHL 220 kV Komani (AL)–Titan (AL)
Summer max OHL 220 kV HIP (RS)–Beograd8 (RS)Changing of the conductors and earth
wires and OPGW across the Danube Riverwith higher capacity (1 km)
Serbia DEcArBonISAtIon MoDELLIng In thE ELEctrIcIty SEctor 45
provides knowledge of the voltages in the networknodes and the power flows in the network elements,which are the parameters monitored by a TSO inorder to assess system security.
Before the results are presented, it is important to un-derline that NTC values, beside network topologies,depend on the generation pattern of the region aswell as the engagement of the generation units in oneparticular system.
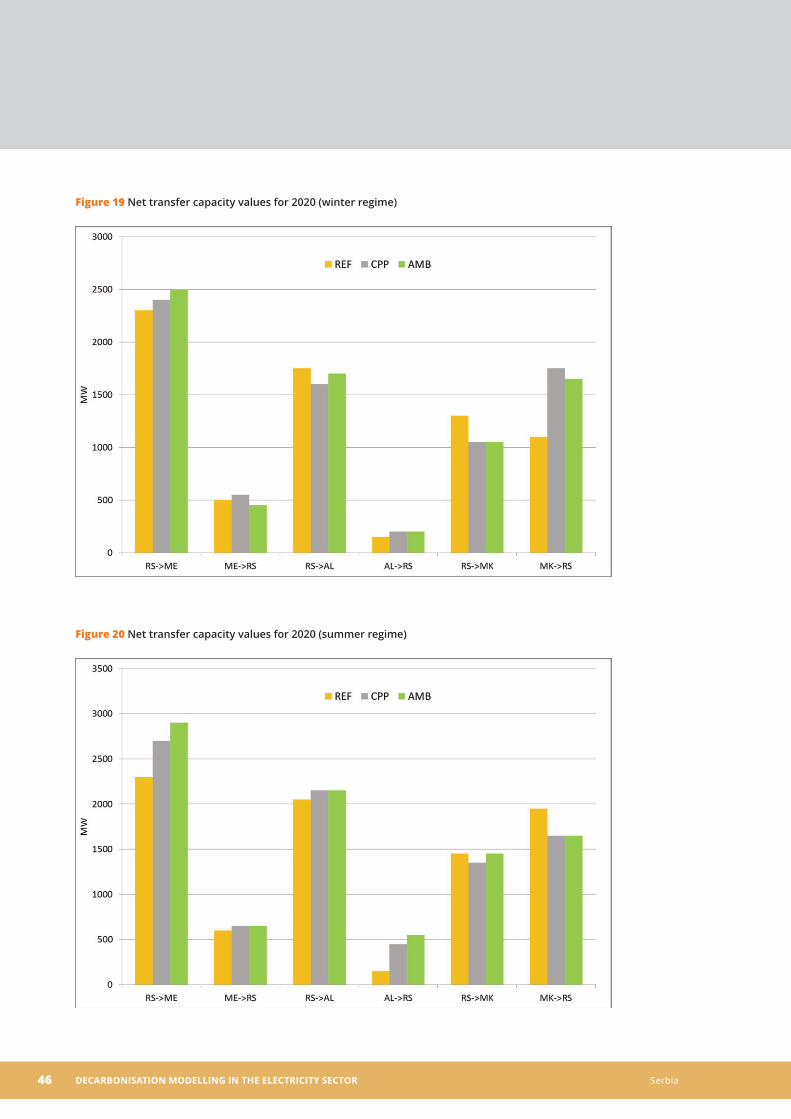
The NTC values for the three assessed scenarios for2020 and 2025 are presented in Figures 19 to 22.
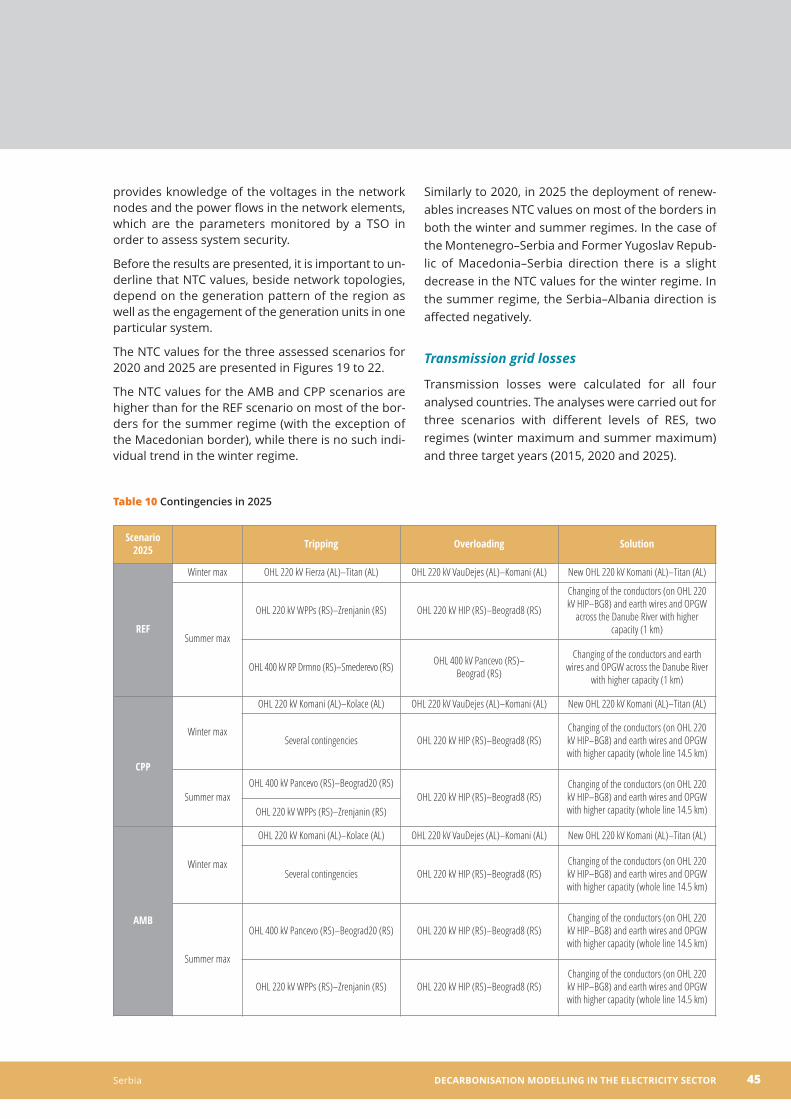
The NTC values for the AMB and CPP scenarios arehigher than for the REF scenario on most of the bor-ders for the summer regime (with the exception ofthe Macedonian border), while there is no such indi-vidual trend in the winter regime.
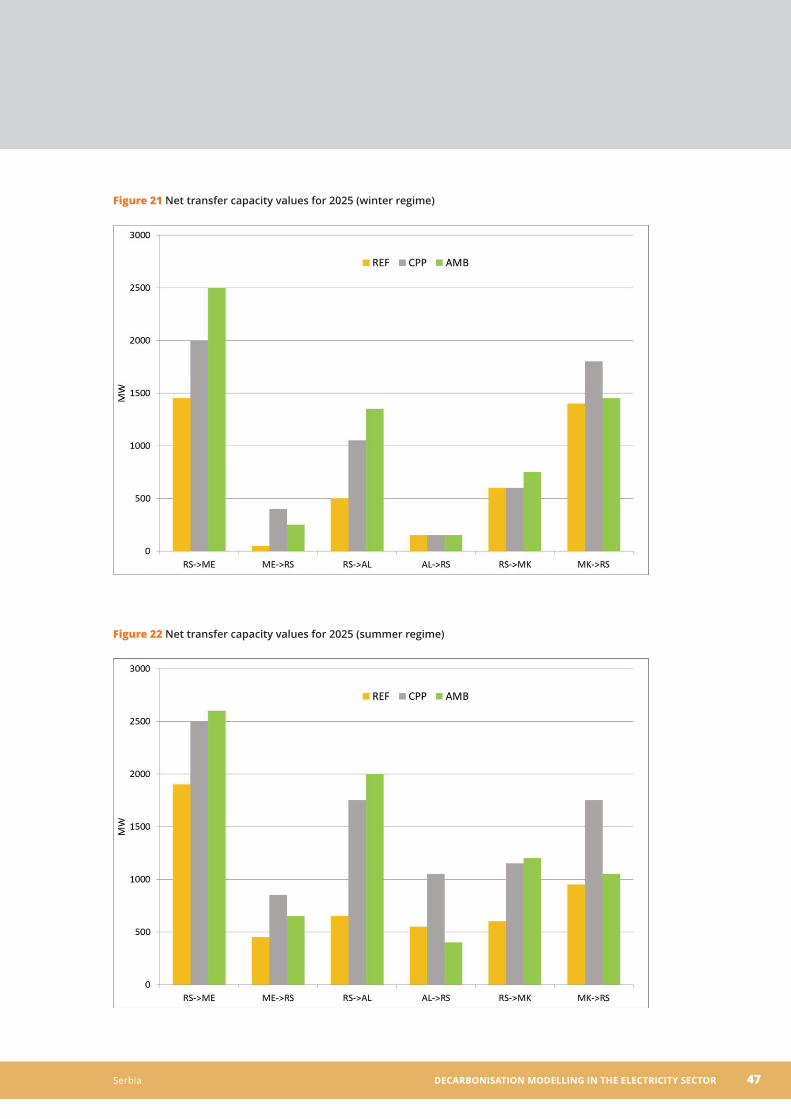
Similarly to 2020, in 2025 the deployment of renew-ables increases NTC values on most of the borders inboth the winter and summer regimes. In the case ofthe Montenegro–Serbia and Former Yugoslav Repub-lic of Macedonia–Serbia direction there is a slight decrease in the NTC values for the winter regime. Inthe summer regime, the Serbia–Albania direction is affected negatively.
Transmission grid losses
Transmission losses were calculated for all fouranalysed countries. The analyses were carried out forthree scenarios with different levels of RES, tworegimes (winter maximum and summer maximum)and three target years (2015, 2020 and 2025).
Table 10 Contingencies in 2025
Scenario2025 Tripping Overloading Solution
REF
Winter max OHL 220 kV Fierza (AL)–Titan (AL) OHL 220 kV VauDejes (AL)–Komani (AL) New OHL 220 kV Komani (AL)–Titan (AL)
Summer max
OHL 220 kV WPPs (RS)–Zrenjanin (RS) OHL 220 kV HIP (RS)–Beograd8 (RS)
Changing of the conductors (on OHL 220kV HIP–BG8) and earth wires and OPGW
across the Danube River with highercapacity (1 km)
OHL 400 kV RP Drmno (RS)–Smederevo (RS) OHL 400 kV Pancevo (RS)–Beograd (RS)
Changing of the conductors and earthwires and OPGW across the Danube River
with higher capacity (1 km)
CPP
Winter max
OHL 220 kV Komani (AL)–Kolace (AL) OHL 220 kV VauDejes (AL)–Komani (AL) New OHL 220 kV Komani (AL)–Titan (AL)
Several contingencies OHL 220 kV HIP (RS)–Beograd8 (RS)Changing of the conductors (on OHL 220kV HIP–BG8) and earth wires and OPGWwith higher capacity (whole line 14.5 km)
Summer maxOHL 400 kV Pancevo (RS)–Beograd20 (RS)
OHL 220 kV HIP (RS)–Beograd8 (RS)Changing of the conductors (on OHL 220kV HIP–BG8) and earth wires and OPGWwith higher capacity (whole line 14.5 km)OHL 220 kV WPPs (RS)–Zrenjanin (RS)
AMB
Winter max
OHL 220 kV Komani (AL)–Kolace (AL) OHL 220 kV VauDejes (AL)–Komani (AL) New OHL 220 kV Komani (AL)–Titan (AL)
Several contingencies OHL 220 kV HIP (RS)–Beograd8 (RS)Changing of the conductors (on OHL 220kV HIP–BG8) and earth wires and OPGWwith higher capacity (whole line 14.5 km)
Summer max
OHL 400 kV Pancevo (RS)–Beograd20 (RS) OHL 220 kV HIP (RS)–Beograd8 (RS)Changing of the conductors (on OHL 220kV HIP–BG8) and earth wires and OPGWwith higher capacity (whole line 14.5 km)
OHL 220 kV WPPs (RS)–Zrenjanin (RS) OHL 220 kV HIP (RS)–Beograd8 (RS)Changing of the conductors (on OHL 220kV HIP–BG8) and earth wires and OPGWwith higher capacity (whole line 14.5 km)
DEcArBonISAtIon MoDELLIng In thE ELEctrIcIty SEctor Serbia46
Figure 20 Net transfer capacity values for 2020 (summer regime)
Figure 19 Net transfer capacity values for 2020 (winter regime)
Serbia DEcArBonISAtIon MoDELLIng In thE ELEctrIcIty SEctor 47
Figure 21 Net transfer capacity values for 2025 (winter regime)
Figure 22 Net transfer capacity values for 2025 (summer regime)

DEcArBonISAtIon MoDELLIng In thE ELEctrIcIty SEctor Serbia48
The total losses in Serbia’s power systems are shownin Table 11.
The losses are highly dependent on electricity exchanges, transmission reinforcements, levels ofproduction and consumption, as well as the connec-tion points of power plants and consumers. Powerlosses are higher in the winter regime and lower inthe summer regime due to the large exchanges be-tween the countries during the winter regime in theperiod 2015–2030.
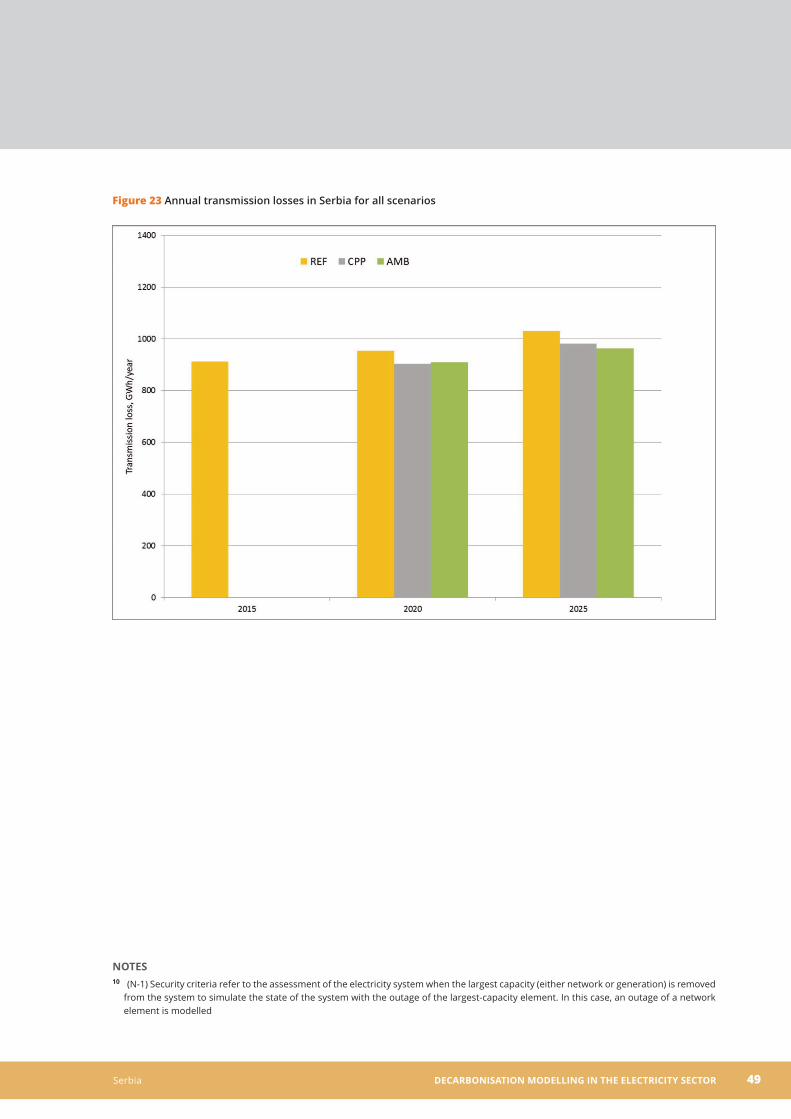
The increase in RES in overall installed capacities, pre-sented through the three scenarios, will producelower transmission losses in gross consumption inSerbia in 2025 and similar lower than REF losses inthe CPP and AMB scenarios in 2020. A regional com-parison of losses can be found in the regional study.
Total annual losses in Serbia’s power systems areshown in Figure 23.
Table 11 Transmission losses in 2015, 2020 and 2025 in Serbia, for all scenarios and regimes
2015 2020 2025
Winter Summer Winter Summer Winter Summer
Equivalent duration time of maximum losses (h) 2,841 2,964 2,841 2,964 2,841 2,964
Transmission losses
(MW)
REF 130.3 135.1 207.3 123.3 222.3 134.6
CPP - - 206.6 106.9 208 132
AMB - - 199 116.2 216 118
Yearly transmissionlosses (GWh)
REF 912.7 954.4 1,030.5
CPP - - 903.8 982.2
AMB - - 909.8 963.4
Serbia DEcArBonISAtIon MoDELLIng In thE ELEctrIcIty SEctor 49
notES(N-1) Security criteria refer to the assessment of the electricity system when the largest capacity (either network or generation) is removed10
from the system to simulate the state of the system with the outage of the largest-capacity element. In this case, an outage of a networkelement is modelled
Figure 23 Annual transmission losses in Serbia for all scenarios

VIII. Annex
Serbia DEcArBonISAtIon MoDELLIng In thE ELEctrIcIty SEctor 51
The two applied models — the EEMM and the EKC net-work model — are described in detail in this annex.
The European Electricity Market ModelThe EEMM simulates the operation of a Europeanelectricity wholesale market. It is a partial equilibriummodel.
Geographical scope
Figure 24 shows the geographical coverage of themodel. In the countries coloured orange, electricityprices are derived from the demand–supply balance.In the other group of countries, shown in blue, pricesare exogenous.
Market participants
There are three types of market participant in themodel: producers, consumers and traders. Marketsare assumed to be perfectly competitive — that is, actors are price takers.
Producers are the owners and operators of powerplants. Each plant has a specific marginal cost of pro-
duction, which is constant at the unit level, and gen-eration is capacity constrained at the level of installedcapacity.
The EEMM works with power plants at the unit level,and there are close to 5,000 power plant units in themodel. For individual power plants, the following essential information is contained by the model: installed capacity, year of construction, technologyand main fuel type.
Within the electricity sector we can distinguish 12 dif-ferent technologies: biomass-fired power plants; coal-fired plants; lignite-fired plants; geothermal plants;heavy fuel oil–fired plants; light fuel oil–fired plants;hydropower plants; wind power plants; solar powerplants; nuclear plants; natural gas–fired plants; andtidal power plants.
The model takes into account short-term variablecosts with the following four main components: fuelcosts; variable OPEX; excise tax; and CO₂ costs (whereapplicable). The fuel cost in each generation unit depends on the type and price of the fuel and theoverall efficiency of electricity generation. The latteris taken from the literature and empirical observationfor various power plant types and commissioningdates. When the market price is above the marginal
Figure 24 Analysed countries

DEcArBonISAtIon MoDELLIng In thE ELEctrIcIty SEctor Serbia52
generation cost of a unit, the unit is operated at fullavailable capacity, and if the price is below the mar-ginal cost there is no production.
Consumers are represented in the model in an aggre-gated way by price-sensitive demand curves. The slopeof the demand curve is the same for all countries.When determining future consumption we considerthe relationship between past GDP and electricity con-sumption figures separately for each country. Basedon this relation and the GDP forecast we establish theexpected annual electricity consumption.
Finally, traders connect the production and consump-tion sides of a market, export electricity to more expensive countries and import it from cheaper ones.Within the model, a country appears as a node — thatis, there are no network constraints within the country,only between countries. Cross-border trade takesplace on capacity-constrained interconnectors between neighbouring countries. Electricity exchangesoccur until either prices, net of direct transmissioncosts or export tariffs, equalise across the markets; or the transmission capacity of the interconnector is reached.
Equilibrium
The model is a partial equilibrium model and calcu-lates the equilibrium allocation in all domestic elec-tricity markets under the following constraints:
Producers maximise their short-term profits,
given market prices.
Total domestic consumption is given by the aggre-
gate electricity demand function in each country.
Electricity transactions (exports and imports) occur
between neighbouring countries until market pricesare equalised or transmission capacity is exhausted.
Energy produced and imported is in balance with
energy consumed and exported.
Market equilibrium always exists and is unique in themodel.
The calculated market equilibrium is static: it only describes situations with the same demand, supplyand transmission characteristics. To simulate theprice development of more complex electricity products, such as those for base-load or peak-loaddelivery, we perform several model runs with typicalmarket parameters and take the weighted average ofthe resulting prices.
When modelling, hourly markets are simulated, andthese simulations are independent from one another— that is, ramp-up costs are excluded. Within themodel, the equilibrium for a given hour (with respectto quantities and prices) is reached simultaneously bythe producer and transmission segments. Figure 25describes the operation of the model.
By determining the short-run marginal cost and avail-able capacity for each power plant we can construct
Figure 25 Operation of the model
Output
Input
Marginal generation cost Available generation capacity
Supply curves by countryDemand curves by countryCross border transmission capacity
Model
Equilibriun prices by country Electricity trade between countries Production by plant

Serbia DEcArBonISAtIon MoDELLIng In thE ELEctrIcIty SEctor 53
the supply curve for each country — in other words,the merit order curve. Taking into consideration theconstraints of cross-border capacities and the demand curves characterising each country, we arriveat the input parameters of the model. The model ap-plies these data to maximise European welfare, whichis the sum of producer and consumer surpluses. As aresult of model computations we get the hourly equi-librium price for each country, the hourly commercialtransfers between the countries, and the productionof each power plant unit.
We simulate the short-term market represented by aselected hour. We typically aim to model an annualperiod, rather than a single hour, therefore on the demand side it is necessary to settle on a given num-ber of reference hours through which annual averageprices are approximated. In the model, 90 referencehours are established.
Network representation
The EEMM assumes that each country is a node — inother words, network constraints do not exist withinany of the countries. Cross-border capacities, on theother hand, may impose a serious limitation on thetrading of electricity. Scarcity is expressed throughthe NTC.
The EKC model provided modelled NTC values for thefour target countries of the SLED project and theneighbouring regions (directly connected to the targetcountries), while for the rest of the countries mod-elled by the EEMM, data from ENTSO-E were used.
The EKC network model A regional load-flow model on which analyses are per-formed was developed based on SECI regional trans-mission models for 2015 (also used as the currentmodel), 2020 and 2025, updated according to the assumptions of the ToR.
All analyses were performed for the years 2015, 2020and 2025 with two typical regimes: winter peak (thirdWednesday in January at 19:30), and summer peak(third Wednesday in July at 10:30).
The topology of transmission networks in SEE coun-tries (Albania, Bosnia and Herzegovina, Bulgaria,Croatia, Greece, the former Yugoslav Republic ofMacedonia, Romania and Serbia) is taken according
to the SECI regional model, updated according to gen-eration surplus projections in SEE. Other neighbour-ing countries (France, Switzerland, Germany, Ukraineand Slovakia) are modelled as injections (over inter-connection lines); while Austria and Hungary are presented with the full model adopted according tothe UCTE system adequacy forecast 2014–2024.
The system study was performed on already existingstudies using the current regional system models de-veloped under SECI, checked and updated by theTSOs. System studies and planning were done on aregional basis, as was the definition of the bordercrossing points.
Electric power systems in SEE were modelled withtheir complete transmission networks (at 400 kV, 220 kV, 150 kV). The power systems in the four assessed countries were modelled in addition at the110 kV voltage level. The network equivalent of Turkey(i.e. European part) and the rest of ENTSO-E Continen-tal Europe (modelled over the X-node injections) werealso used in the model.
The following assessment was carried out in the net-work study:
Load-flow data collection, which includes:
an assessment of the existing electricity network•situation within Albania, the former Yugoslav Republic of Macedonia, Montenegro and Serbia,together with the regional context; and
a definition of the network topologies and•regimes for 2015, 2020 and 2025, using realisticscenarios for demand growth, generation expan-sion, transit flows, RES integration and HVDC links.
TTC/NTC evaluation among Albania, the former
Yugoslav Republic of Macedonia, Montenegro andSerbia in all directions, for all topology scenarios,with reference to each target year and regime.
Assessment of transmission grid losses with and
without a level of energy production from RES.
Load-flow data collection
In the process of collecting the data needed for load-flow studies, representatives of the four countries reviewed and updated the proposed datasets, whichinclude:
Demand level in the agreed regimes and power
exchanges in 2015, 2020 and 2025 for two charac-teristic regimes:

DEcArBonISAtIon MoDELLIng In thE ELEctrIcIty SEctor Serbia54
third Wednesday in January at 19:30 (winter•peak); andthird Wednesday in July at 10:30 (summer peak).•
A list of new generation facilities and generation
units to be decommissioned up to 2015, 2020 and 2025.A list of new elements in the transmission network.
The level of transmission reliability margin used in
the evaluation of the NTC.
These data were used for the preparation of the net-work models for 2015, 2025 and 2025, which wereused for the load-flow analyses.
Demand
The development of demand in two characteristicregimes (third Wednesday in January at 19:30 [winterpeak] and third Wednesday in July at 10:30 [summerpeak]) in 2015, 2020 and 2025 were analysed on thebasis of:
ENTSO-E online datasets;
ENTSO-E scenario outlook and adequacy forecasts;
national demand projections; and
consultants’ datasets from relevant projects
in the SEE region.
Since network forecast models are used in our analy-sis, demand excludes transmission and distributionlosses, as well as the power plants’ own consumptionand pumping.
Network modelling methodologyThe network modelling methodology comprises three parts:
steady-state and contingency analyses;
an evaluation of NTC; and
the calculation of transmission grid losses.
These parts are introduced in detail below.
Steady-state and contingency analyses
For the defined scenarios, steady-state load flows arecalculated and contingency (n-1) analyses performed.Security criteria are based on the loadings of lines andvoltage profile and checked for each scenarioanalysed.
Load-flow analyses provide an insight into transmis-sion network adequacy for the observed scenarios ofexchanges and a comparison of observed configura-tions, under steady-state and (n-1) operating condi-tions.
Load-flow assessment is a basic step in NTC evalua-tion and comprises the following analyses:
steady-state AC load flow;
security (n-1) assessment; and
voltage profile analysis.
In the analysis of voltage profiles, voltage limits aretaken according to the respective national grid codes.
It should be stressed that only the 400 kV and 220 kVnetworks were assessed from a security point of view.There are many new RES to be connected to lower-voltage networks, which might cause problems in net-works of 110 kV or lower, although this should besolved via the national transmission network plans.
Evaluation of net transfer capacity
The TTC and NTC were evaluated between Albania,the former Yugoslav Republic of Macedonia, Montenegro and Serbia, as well as between thesecountries and their neighbours, in all directions, forall topology scenarios, and with reference to each tar-get year and regime. A final assessment was alsomade of the TTC/NTC additional values as a result ofnew interconnections and the strengthening of themajor energy transit routes.
It is also important to note that TTC, NTC, base caseexchange (BCE), already allocated capacity (AAC) andavailable transfer capacity (ATC) are the exchangeprogramme values; these are not the physical flowsand generally differ from the physical flows at the interconnection lines (except in particular cases of radial operation).
The solution of this model is the so-called base caseand is the starting point for the computation. Thisbase case can already contain exchange pro-grammes between TSOs and control areas. Theseare the various transactions likely to exist in the fore-casted situation according to what has been observed in the past.
The TTC value may therefore vary (increase or decrease) when approaching the time of programme execution as a result of a more accurate knowledgeof generating unit schedules, load pattern, networktopology and tie line availability.
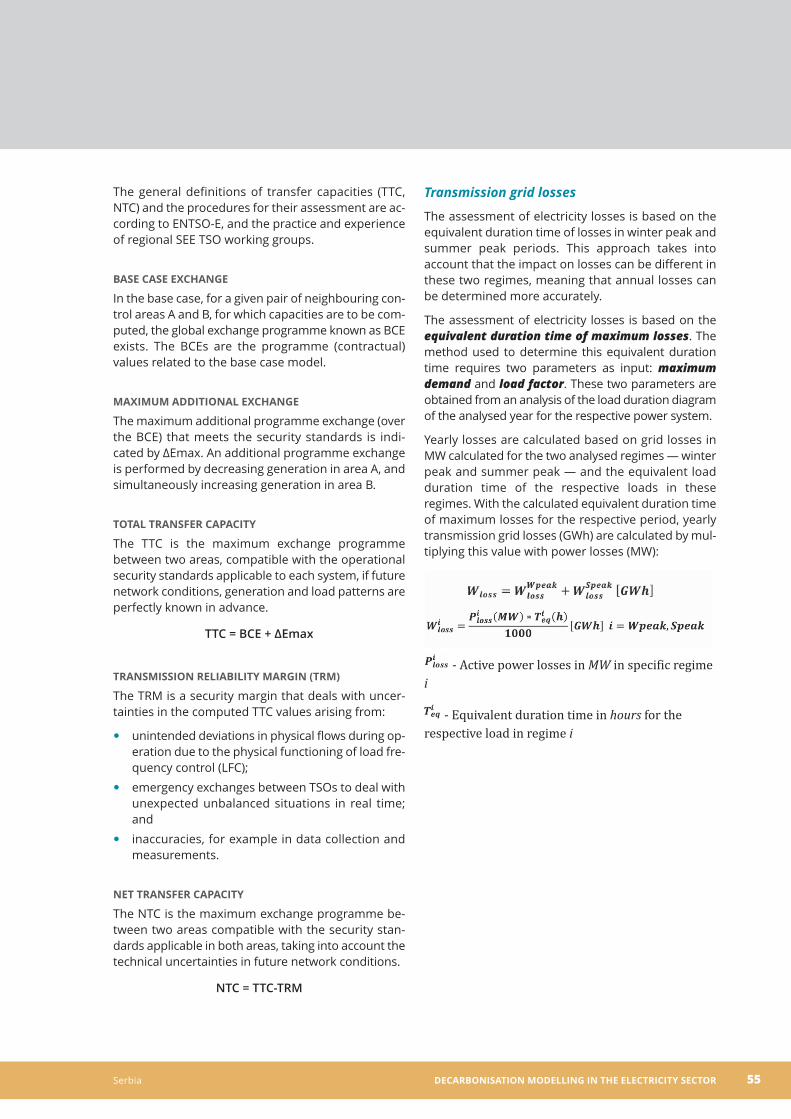
Serbia DEcArBonISAtIon MoDELLIng In thE ELEctrIcIty SEctor 55
The general definitions of transfer capacities (TTC,NTC) and the procedures for their assessment are ac-cording to ENTSO-E, and the practice and experienceof regional SEE TSO working groups.
BASE cASE ExchAngE
In the base case, for a given pair of neighbouring con-trol areas A and B, for which capacities are to be com-puted, the global exchange programme known as BCEexists. The BCEs are the programme (contractual) values related to the base case model.
MAxIMuM ADDItIonAL ExchAngE
The maximum additional programme exchange (overthe BCE) that meets the security standards is indi-cated by ΔEmax. An additional programme exchangeis performed by decreasing generation in area A, andsimultaneously increasing generation in area B.
totAL trAnSFEr cAPAcIty
The TTC is the maximum exchange programme between two areas, compatible with the operationalsecurity standards applicable to each system, if futurenetwork conditions, generation and load patterns areperfectly known in advance.
TTC = BCE + ΔEmax
trAnSMISSIon rELIABILIty MArgIn (trM)
The TRM is a security margin that deals with uncer-tainties in the computed TTC values arising from:
unintended deviations in physical flows during op-
eration due to the physical functioning of load fre-quency control (LFC);emergency exchanges between TSOs to deal with
unexpected unbalanced situations in real time;andinaccuracies, for example in data collection and
measurements.
nEt trAnSFEr cAPAcIty
The NTC is the maximum exchange programme be-tween two areas compatible with the security stan-dards applicable in both areas, taking into account thetechnical uncertainties in future network conditions.
NTC = TTC-TRM
Transmission grid losses
The assessment of electricity losses is based on theequivalent duration time of losses in winter peak andsummer peak periods. This approach takes into account that the impact on losses can be different inthese two regimes, meaning that annual losses canbe determined more accurately.
The assessment of electricity losses is based on theequivalent duration time of maximum losses. Themethod used to determine this equivalent durationtime requires two parameters as input: maximum demand and load factor. These two parameters areobtained from an analysis of the load duration diagramof the analysed year for the respective power system.
Yearly losses are calculated based on grid losses inMW calculated for the two analysed regimes — winterpeak and summer peak — and the equivalent loadduration time of the respective loads in theseregimes. With the calculated equivalent duration timeof maximum losses for the respective period, yearlytransmission grid losses (GWh) are calculated by mul-tiplying this value with power losses (MW):
- Active power losses in MW in specific regimei - Equivalent duration time in hours for the respective load in regime i
SER
BIA
EN
G
Decarbonisation modelling in the electricity sector
Serbia
Support for Low-Emission Development in South Eastern Europe (SLED)