Decadal variation of East Asian radiative forcing due to ...
5
The following supplement accompanies the article Decadal variation of East Asian radiative forcing due to anthropogenic aerosols during 1850–2100, and the role of atmospheric moisture Jiandong Li 1,2 , Wei-Chyung Wang 2, *, Zhian Sun 3 , Guoxiong Wu 1 , Hong Liao 4 , Yimin Liu 1 1 LASG, Institute of Atmospheric Physics, Chinese Academy of Sciences, Beijing 100029, PR China 2 Atmospheric Sciences Research Center, State University of New York, Albany, New York 12203, USA 3 Centre for Australian Weather and Climate Research, Australian Bureau of Meteorology, Melbourne, Victoria 3001, Australia 4 LAPC, Institute of Atmospheric Physics, Chinese Academy of Sciences, Beijing 100029, PR China *Corresponding author: [email protected] Climate Research: 61: 241–257 (2014) Supplement 1. 1. Model description for our atmospheric general circulation model (AGCM) The AGCM used in this study is the atmospheric component of Flexible Global Ocean–Atmosphere–Land System model Spectral Version 2 (FGOALS-s2), which is developed by the State Key Laboratory of Numerical Modeling for Atmospheric Sciences and Geophysical Fluid Dynamics at the Institute of Atmospheric Physics in Chinese Academy of Science (LASG/IAP/CAS). The full name of our AGCM is Spectral Atmospheric Model of IAP LASG (SAMIL) and is hereafter refered to as SAMIL. SAMIL is a spectral model with a horizontal resolution of R42, approximately 2.81° longitude × 1.67° latitude. The model uses 26 hybrid vertical layers that extend from the surface up to 2.19 hPa. The model dynamical framework employs a standard atmosphere subtraction scheme (Wu et al. 1996) to accurately calculate pressure gradient forces. The model dynamical time step is 10 min. Since the atmospheric radiative scheme has already been introduced in the manuscript, further descriptions are for other model parameterizations. The macro cloud fraction is derived from a diagnostic method (Slingo 1987, Kiehl et al. 1998) based on vertical motion, relative humidity, atmospheric stability, water vapor and convective mass fluxes. Additionally, the threshold for low cloud is modified by Bao et al. (2010) to take in account the differences among land, sea and regions of snow/ice cover. The cloud water content is diagnosed though the scheme (Xu & Randall 1996) with large scale meteorological fields. Meanwhile, the effective radius of clouds is parameterized for liquid clouds (Martin et al. 1994) and for ice clouds (Sun & Rikus 2004), respectively. The mass flux cumulus parameterization of Tiedtke (Tiedtke 1989) is utilized for deep, shallow and mid-level convection, with a modified closure assumption and the formation of organized entrainment and detrainment (Nordeng 1994, Song 2005). The boundary layer process is a higher-order closure scheme (Holtslag & Boville 1993) that computes the turbulent
Transcript of Decadal variation of East Asian radiative forcing due to ...
The following supplement accompanies the article
Decadal variation of East Asian radiative forcing due to anthropogenic aerosols during 1850–2100, and the role of atmospheric moisture
Jiandong Li1,2, Wei-Chyung Wang2,*, Zhian Sun3, Guoxiong Wu1, Hong Liao4, Yimin Liu1
1LASG, Institute of Atmospheric Physics, Chinese Academy of Sciences, Beijing 100029, PR China 2Atmospheric Sciences Research Center, State University of New York, Albany, New York 12203, USA
3Centre for Australian Weather and Climate Research, Australian Bureau of Meteorology, Melbourne, Victoria 3001, Australia 4LAPC, Institute of Atmospheric Physics, Chinese Academy of Sciences, Beijing 100029, PR China
*Corresponding author: [email protected]
Climate Research: 61: 241–257 (2014)
Supplement 1.
1. Model description for our atmospheric general circulation model (AGCM)
The AGCM used in this study is the atmospheric component of Flexible Global Ocean–Atmosphere–Land
System model Spectral Version 2 (FGOALS-s2), which is developed by the State Key Laboratory of Numerical
Modeling for Atmospheric Sciences and Geophysical Fluid Dynamics at the Institute of Atmospheric Physics in
Chinese Academy of Science (LASG/IAP/CAS). The full name of our AGCM is Spectral Atmospheric Model of IAP
LASG (SAMIL) and is hereafter refered to as SAMIL. SAMIL is a spectral model with a horizontal resolution of R42,
approximately 2.81° longitude × 1.67° latitude. The model uses 26 hybrid vertical layers that extend from the surface
up to 2.19 hPa. The model dynamical framework employs a standard atmosphere subtraction scheme (Wu et al. 1996)
to accurately calculate pressure gradient forces. The model dynamical time step is 10 min.
Since the atmospheric radiative scheme has already been introduced in the manuscript, further descriptions are for
other model parameterizations. The macro cloud fraction is derived from a diagnostic method (Slingo 1987, Kiehl et
al. 1998) based on vertical motion, relative humidity, atmospheric stability, water vapor and convective mass fluxes.
Additionally, the threshold for low cloud is modified by Bao et al. (2010) to take in account the differences among
land, sea and regions of snow/ice cover. The cloud water content is diagnosed though the scheme (Xu & Randall
1996) with large scale meteorological fields. Meanwhile, the effective radius of clouds is parameterized for liquid
clouds (Martin et al. 1994) and for ice clouds (Sun & Rikus 2004), respectively. The mass flux cumulus
parameterization of Tiedtke (Tiedtke 1989) is utilized for deep, shallow and mid-level convection, with a modified
closure assumption and the formation of organized entrainment and detrainment (Nordeng 1994, Song 2005). The
boundary layer process is a higher-order closure scheme (Holtslag & Boville 1993) that computes the turbulent

2
transfer of momentum, heat and moisture. The effects of gravity-wave drag are also applied, which depend on the
wind speed, density and static stability of the low-level flow (Palmer et al. 1986).
Previous results indicated that SAMIL can reproduce the mean large-scale climate patterns and the climate
variability in various timescale to a considerable degree (Zhou et al. 2005, Bao et al. 2010, 2013). Different versions of
SAMIL have been employed in various studies, such as simulating the effects of condensation heating on the
formation of the subtropical anticyclone in the Eastern Hemisphere (Liu et al. 2001), seasonal variation of the Asian
monsoon (Liu et al. 2004, Duan et al. 2008) and thermal forcing of the Tibetan Plateau on Asian climate patterns (Wu
et al. 2012, Duan et al. 2013). Recently, SAMIL was used to investigate the possible causes of temperature change in
East Asia (He et al. 2013).
2. Model performance on precipitation and cloud climatology
Here, we give some results simulated by SAMIL, with a focus on basic patterns of rainfall and cloud
climatology. As shown in Figs. S1, S3 & S4, the simulations from SAMIL are close to the observations, including the
global pattern and its zonal variation. In addition, SAMIL can reproduce well the summer Asian monsoon circulation
and precipitation (Fig. S2), although the precipitation centers are stronger than the observed. Of course, there are some
biases for SAMIL, such as the atmospheric moisture and some cloud properties. In the next steps, more efforts are
being made in LASG/IAP/CAS to improve some key climate processes in our climate model, such as physical-based
cloud microphysics, convection schemes and aerosol processes.
LITERATURE CITED
Bao Q, Wu GX, Liu YM, Yang J, Wang Z, Zhou T (2010) An introduction to the coupled model FGOALS1.1-s and its performance in East Asia. Adv Atmos Sci 27:1131–1142
Bao Q, Lin PF, Zhou TJ, Liu Y, and others (2013) The Flexible Global Ocean–Atmosphere–Land System model, Spectral Version 2: FGOALS-s2. Adv Atm Sci 30(3):561–576
Duan A, Sui C, Wu G (2008) Simulation of local air–sea interaction in the great warm pool and its influence on Asian monsoon. J Geophys Res 113, D22105, doi:10.1029/2008JD010520
Duan AM, Wang MR, Lei YH, Cui YF (2013) Trends in summer rainfall over China associated with the Tibetan Plateau sensible heat source during 1980–2008. J Climate 26:261–275
Holtslag AM, Boville BA (1993) Local versus nonlocal boundary-layer diffusion in a global climate model. J Climate 6:1825–1842
He B, Bao Q, Li J, Wu G, Liu Y, Wang X, Sun Z (2013) Influences of external forcing changes on the summer cooling trend over East Asia. Clim Change 117:829–841
Kiehl JT, Hack JJ, Bonan GB, Boville BA, Williamson DL, Rasch PJ (1998) The National Center for Atmospheric Research Community Climate Model: CCM3. J Climate 11:1131–1149
Liu YM, Wu GX, Liu P (2001) Condensation heating of the Asian summer monsoon and the subtropical anticyclone in the Eastern Hemisphere. Clim Dyn 17:327–338
Liu YM, Wu GX, Ren RC (2004) Relationship between the subtropical anticyclone and diabatic heating. J Climate 17:682– 698 Loeb NG, Kato S, Loukachine K, Manalo-Smith N (2005) Angular distribution models for top-of-atmosphere radiative flux
estimation from the clouds and the earth’s radiant energy system instrument on the Terra satellite. I. Methodology. J Atmos Oceanic Technol 22:338–351
Martin GM, Johnson DW, Spice A (1994) The measurement and parameterization of effective radius of droplets in warm stratocumulus clouds. J Atmos Sci 51:1823–1842

3
Nordeng TE (1994) Extended versions of the convective parameterization scheme at ECMWF and their impact on the mean and transient activity of the model in the tropics. Tech Memo 206, ECMWF, Reading
Palmer TN, Shutts GJ, Swinbank R (1986) Alleviation of a systematic westerly bias in general circulation and numerical weather prediction models through an orographic gravity wave drag parameterization. Q J Roy Meteor Soc 112, 1001–1039
Platnick S, King MD, Ackerman SA, and others (2003) The MODIS cloud products: algorithms and examples from Terra. IEEE Trans Geosci Remote Sens 41:459–473, doi:10.1109/TGRS.2002.808301
Rossow WB, Schiffer RA (1999) Advances in understanding clouds from ISCCP. Bull Amer Meteor Soc 80:2261–2287 Slingo JM (1987) The development and verification of a cloud prediction scheme for the ECMWF model. Q J Roy Meteor Soc
113:899–927 Song XL (2005) The evaluation analysis of two kinds of mass flux cumulus parameterizations in climate simulation. PhD thesis,
Institute of Atmospheric Physics, Chinese Academy of Sciences, Beijing, p 119–145 (in Chinese) Sun Z, Rikus L (2004) Validating model clouds and their optical properties using geostationary satellite imagery. Mon Weather
Rev 132:2006–2020 Tiedtke M (1989) A comprehensive mass flux scheme for cumulus parameterization in large-scale models. Mon Weather Rev
117:1779–1800 Wu G, Liu Y, He B, Bao Q, Duan A, Jin FF (2012) Thermal controls on the Asian summer monsoon. Sci Rep 2:404,
doi:10.1038/srep00404 Wu GX, Liu H, Zhao Y, Li W (1996) A nine-layer atmospheric general circulation model and its performance. Adv Atmos Sci
13:1–18 Xie PP, Arkin A (1996) Global precipitation: a 17-year monthly analysis based on gauge observations, satellite estimates, and
numerical model outputs. Bull Am Meteorol Soc 78:2539–2558 Xu KM, Randall DA (1996) A semiempirical cloudiness parameterization for use in climate models. J Atmos Sci 53(21):3084–
3102 Zhou TJ, Yu RC, Wang ZZ, Wu TW (2005) Atmospheric Circulation Global Model (SAMIL) and the Coupled Model
(FGOALS-s), Vol. 4, China Meteorological Press

4
(c) (d) (e)
(a) (b)
Fig. S1. Global distribution of annual mean (a) CMAP observed and (b) simulated precipitation (mm d–1); zonal mean precipitation (mm d–1) for (c) annual mean (ANN), (d) December–January–February (DJF) and (e) June–July–August (JJA). Here, the red lines are for SAMIL simulation and blues lines for the observations. CMAP observed precipitation (PR) denotes Xie–Arkin reanalysis dataset (Xie & Arkin 1996)
Fig. S2. Distribution of climatological summer (June–August, JJA) precipitation and wind fields at 850 hPa in Asian monsoon regions. Here, ERA40 denotes the ERA40 reanalysis dataset. The scale arrows (bottom right of panels) are in m s–1
5
(a) (b)
(c) (d) (e)
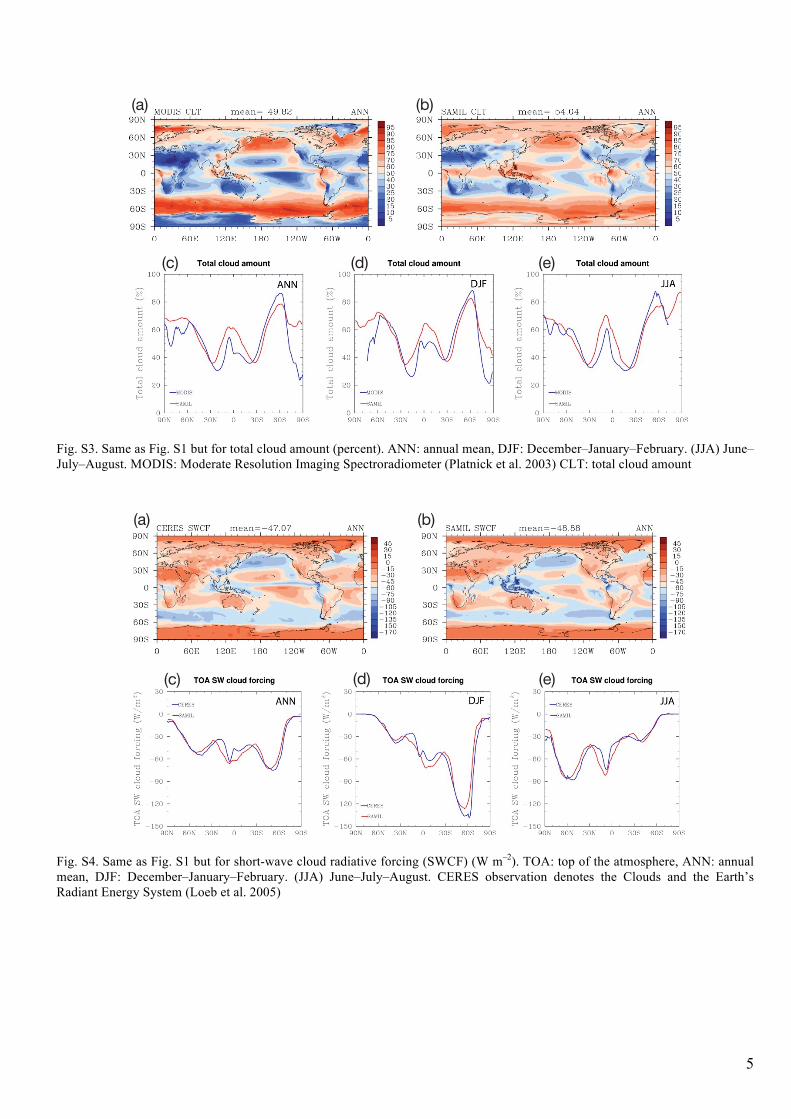
Fig. S3. Same as Fig. S1 but for total cloud amount (percent). ANN: annual mean, DJF: December–January–February. (JJA) June–July–August. MODIS: Moderate Resolution Imaging Spectroradiometer (Platnick et al. 2003) CLT: total cloud amount
(c) (d) (e)
(a) (b)
Fig. S4. Same as Fig. S1 but for short-wave cloud radiative forcing (SWCF) (W m–2). TOA: top of the atmosphere, ANN: annual mean, DJF: December–January–February. (JJA) June–July–August. CERES observation denotes the Clouds and the Earth’s Radiant Energy System (Loeb et al. 2005)