DEC 0 9 o , ,,- iX separate parts. By demonstrating ... (Stevens and Blumstein, 1978). ... 1971;...
43
ITTCT.q ~T FT FT SEC=.,JP CLSS§FCA' ON OF Ti-S 'AGE Form Approved REPORT DOCUMENTATION PAGE O No. 0704-0188 REPORT SECUjRITY CLASS1IPCATION l b RESTRICTIVE MARKINGS SECRITY CLASSiFICATION AUTHORITY 3. DISTRIBUTION/IAVAILABILTY OF REPORT b. DECLASSIFiCATiON/DOWNGRAiNG SCHEDULE :.-- D PERFORMING ORGANIZATiON REPORT NUMBER(S) S. MONITORING ORGANIZATION REPORT NUMBER(S) N AFObF 'KI6 ~ I2 5 a. NAME OF PERFORMING ORGANIZATION 6b OFFICE SYMBOL 7a. NAME OF MONITORING ORGANIZATION Univ of Wisconsin (if applicable) AFOSR/NL ic. ADDRESS (City, State, and ZIPCode) 1500 Highland Avenue Bldg 410 Madison, WI 53705-2280 Boiling AFB, DC 20332-6448 Ba. NAME OF FUNDING/SPONSORING 8b. OFFICE SYMBOL 9 PROCUREMENT INSTRUMENT iDENTIFICATION NUMBER ORGANIZATION (If applicable) AFOSR NL AFOSR-87-0240 8c. ADDRESS (City, State, and ZIP Code) 10 SOURCE OF FUNDING NUMBERS PROGRAM PROJECT TASK WORK UNIT Bldg. 410 ELEMENT NO. NO. NO ACCESSION NO. Boiling AFB, DC 20332-6448 61102F 2313 A6 11. TITLE (Include Security Classification) Additivity and Auditory Pattern Analysis 12. PERSONAL AUTHOR(S) Dr. Lutfi 13a. TYPE OF REPORT 13b. TIME COVERED 14. DATE OF REPORT (Year, Month, Day) IS. PAGE COUNT Annual FROM L~"TO -3Ar 18 May 88 42 16. SUPPLEMENTARY NOTATION 17. COSATI CODES 18. SUBJECT TERMS (Continue on reverse if necessary and identify by block number) FIELD GROUP SUB-GROUP 19. ABSTRACT (Continue on reverse if necnsary and identify by block number) ZIrhe project is designed to answer specific questions regarding listeners' ability to integrate information within and across stimulus dimensions, to extract information contained in the pattern of the acoustic signal, and to perform under conditions of stimulus uncertainty. The data are also used to determine how listeners weight the information provided by different components of the signal, and how best to package the acoustic information in frequency and/or time so that it is processed most effectively by the listener. Finally, work is undertaken to develop a computational model to summarize and predict the results of these and future experiments. DEC 0 9 8 0C ) -tcvc )* i% %\' r cA k'~ o , ,,- iX H 20. DISTRIBUTION / AVAILABILITY OF ABSTRACT 21. ABSTRACT SE'CURITY CLASSIFICATION 0 UNCLASSIFIED/UNLIMITED C SAME AS RPT. DTIC USERS 0 Q Q 22a NAME OF RESPONSIBLE INDIVIDUAL 22b. TELEPHONE (include Area Code) 22c. OFFICE SYMBOL D0 John F- Tnnev2 767-5021 NL DO Form 1473, JUN 86 Previous editions are obsolete. SECURITY CLASSIFICATION OF THIS PAGE 1r s 'r= 1 0 0 Tr 7 0 S T A T E M E N T U A Approo-id 1cr public rleme; UNCLASSIFIED D 'ih- f., Uunmte
Transcript of DEC 0 9 o , ,,- iX separate parts. By demonstrating ... (Stevens and Blumstein, 1978). ... 1971;...

ITTCT.q ~T FT FT
SEC=.,JP CLSS§FCA' ON OF Ti-S 'AGE
Form ApprovedREPORT DOCUMENTATION PAGE O No. 0704-0188
REPORT SECUjRITY CLASS1IPCATION l b RESTRICTIVE MARKINGS
SECRITY CLASSiFICATION AUTHORITY 3. DISTRIBUTION/IAVAILABILTY OF REPORT
b. DECLASSIFiCATiON/DOWNGRAiNG SCHEDULE :.--
D PERFORMING ORGANIZATiON REPORT NUMBER(S) S. MONITORING ORGANIZATION REPORT NUMBER(S)N AFObF 'KI6 ~ I2 5
a. NAME OF PERFORMING ORGANIZATION 6b OFFICE SYMBOL 7a. NAME OF MONITORING ORGANIZATION
Univ of Wisconsin (if applicable) AFOSR/NL
ic. ADDRESS (City, State, and ZIPCode)
1500 Highland Avenue Bldg 410
Madison, WI 53705-2280 Boiling AFB, DC 20332-6448
Ba. NAME OF FUNDING/SPONSORING 8b. OFFICE SYMBOL 9 PROCUREMENT INSTRUMENT iDENTIFICATION NUMBERORGANIZATION (If applicable)
AFOSR NL AFOSR-87-02408c. ADDRESS (City, State, and ZIP Code) 10 SOURCE OF FUNDING NUMBERS
PROGRAM PROJECT TASK WORK UNITBldg. 410 ELEMENT NO. NO. NO ACCESSION NO.Boiling AFB, DC 20332-6448 61102F 2313 A6
11. TITLE (Include Security Classification)
Additivity and Auditory Pattern Analysis
12. PERSONAL AUTHOR(S)Dr. Lutfi
13a. TYPE OF REPORT 13b. TIME COVERED 14. DATE OF REPORT (Year, Month, Day) IS. PAGE COUNT
Annual FROM L~"TO -3Ar 18 May 88 4216. SUPPLEMENTARY NOTATION
17. COSATI CODES 18. SUBJECT TERMS (Continue on reverse if necessary and identify by block number)
FIELD GROUP SUB-GROUP
19. ABSTRACT (Continue on reverse if necnsary and identify by block number)
ZIrhe project is designed to answer specific questions regarding listeners' ability
to integrate information within and across stimulus dimensions, to extract informationcontained in the pattern of the acoustic signal, and to perform under conditions ofstimulus uncertainty. The data are also used to determine how listeners weight theinformation provided by different components of the signal, and how best to package
the acoustic information in frequency and/or time so that it is processed most
effectively by the listener. Finally, work is undertaken to develop a computational
model to summarize and predict the results of these and future experiments.
DEC 0 9 8
0C ) -tcvc )* i% %\' r cA k'~o , ,,- iX H
20. DISTRIBUTION / AVAILABILITY OF ABSTRACT 21. ABSTRACT SE'CURITY CLASSIFICATION
0 UNCLASSIFIED/UNLIMITED C SAME AS RPT. DTIC USERS 0 Q Q
22a NAME OF RESPONSIBLE INDIVIDUAL 22b. TELEPHONE (include Area Code) 22c. OFFICE SYMBOL
D0 John F- Tnnev2 767-5021 NL
DO Form 1473, JUN 86 Previous editions are obsolete. SECURITY CLASSIFICATION OF THIS PAGE1r s 'r= 1 0 0 Tr 7 0 S T A T E M E N T U A
Approo-id 1cr public rleme; UNCLASSIFIEDD 'ih- f., Uunmte

*k ik TIO K -t 8 8 -1 2 5
Annual Technical Report, 5/1/87 - 4/30/88
Additivity and Auditory Pattern Analysis
Robert A. Lutfi, Principal Investigator
Project SummaryHuman discrimination of ccrmplex acoustic signals typically cannot be predicted
from the simple sum of the discriminabilities associated with individual componentsof the signal. Understanding such failures of additivity is central to ourunderstanding of complex sound perception. The goal of this project is toelucidate the rules and mechanisms whereby individual stimulus componentscombine to influence the detection and discrimination of complex sounds. Theproject is designed to answer specific questions regarding listeners' ability tointegrate information within and across stimulus dimensions, to extract informationcontained in the pattern of the acoustic signal, and to perform under conditions ofstimulus uncertainty. The data are also used to determine how listeners weight theinformation provided by different components of the signal, and how best topackage the acoustic information in frequency and/or time so that it is processedmost effectively by the listener. Finally, work is undertaken to develop acomputational model to summarize and predict the results of these and futureexperiments.
Statement of Work/Research ObjectivesCan the perception of a complex event be reduced to the sum of its
analyzable elements? This was one of the fundamental questions that occupied theminds of the earliest thinkers interested in understanding human perception.Today, of course, we are familiar with the Gestaltist's favorite illusionsdemonstrating that the perception of the whole is often greater than the sum of itsseparate parts. By demonstrating the importance of the relations among parts,the Gestalt psychologist redefined the study of perception as the study of patterns.
In contemporary psychoacoustics, the Gestaltist's influence has been madeevident in pattern perception models of pitch (Goldstein, 1973; Terhardt, 1974;Wightman, 1973), localization (Searle, 1982; Perkins, Kistler and Wightman, 1986),and speech (Stevens and Blumstein, 1978). Now there is evidence that simpleauditory detection, as well, frequently involves an analysis of the overall pattern ofexcitation produced by the signal and masker (Ahumada and Lovell, 1971;Ahumada, Marken, and Sandusky,1975; Green, 1983; Green, and Kidd, 1983; Green,and Mason, 1985; Hall, Haggard, and Fernandes, 1984; Hanna, 1984; Leek, andWatson, 1984; Lutfi, 1985, 1986; Spiegel, Picardi, and Green, 1981). The basicresult of the detection studies is a failure of additivity; components of the acousticcomplex affect threshold in ways that are not predicted by summing their separateeffects. Failures of additivity imrose severe constraints on our ability to predict theauditory system's response to complex stimuli, like speech, from the response tomuch simpler inputs. Thus, one of the greatest challenges confrontingpsychoacoustics in the years ahead is to understand the mechanisms andinvariances that determine how stimulus components combine to influence auditoryperception.
1 8S 12 OT2

The present project adopts an approach to this problem which is both simpleand direct. In all experiments, the unit of analysis is the discriminability, asmeasured by d', of single tone bursts that differ (on average) in level. Thecomplex signals of these experiments are comprised of various combinations of 2 to13 of these tone bursts distributed in frequency and/or time. On the basis ofsimple additivity, the discriminability of the complex is given by the vectorsummation rule, d' coglex = (Ed'.2 ) 2 , where d'. is the discriminability of the ithtone component of t e complex. The vector summation rule thus provides thereferent for evaluating the discriminability actually obtained. This simple approachis used to address the following specific questions regarding the processing ofcomplex sounds:
(1) How efficiently can human observers integrate information within and acrossdifferent stimulus dimensions?
(2) What effects do varying degrees of stimulus uncertainty along relevant andirrelevant dimensions have on th ability to integrate this information?
(3) How efficiently can observers extract information contained in the pattern oflevel variation across the individual components of the complex?
(4) Which components of the complex are weighted most heavily in the decisionprocess?
(5) What is the best way to package the acoustic information in frequency and/ortime so that it will be processed most effectively by the observer?
(6) What are the mechanisms underlying the discrimination of these complexsounds? Can a computational model be developed to account for the results?
Research ProgressStudy 1: Magnitude Analysis
This early experiment was lesigned to address two questions: How efficientlyis information combined across frequency channels, and what effect does spectraluncertainty have on the ability -o combine this information? The stimuli were n-tone complexes, where n ranged from 1 to 13. The frequencies of the tones werespaced at equilog intervals from 250 to 4000 Hz. Fig. 1A shows an example ofone of these complexes where n is 10. In this experiment, the tones were addedfrom low frequencies to high as n was increased (lo-pass condition). All tonecomplexes were played over 16-,it, audio-quality, D-to-A converters at a 20-kHzrate. The complexes were gated on and off with 5-ms, cosine-squared ramps for a cototal duration (from 0 voltage points) of 100 ms. On each interval of a two-interval, forced-choice trial, the individual intensities of the tones in the complex
comprised a random sample of size n from one of two log-normal distributions:LOW (MI = 65 dB, al = 5 dB) and HIGH (M h = 70 dB, a = 5 dB). The rvalue of n was fixed for each block of trials. The listener's task was to identifywhich interval contained the complex drawn from the HIGH distribution. ClFeedback was given after each trial. The recording of trial by trial data, tle Lgeneration of stimuli, and all other experimental events were controlled by an IBM...AT computer.
According to the Theory cf Signal Detection, optimal performance for thistask as measured by d' grows as the square root of n. Specifically, d' =,i l lo p tn A/G, where A N h-M,, and a h = . Optimal performance is the
2-"N

J
- Q
a
Ac
0.5 1.0 2.0 4.0
Frequency in kHz
J
= k 1.'l/|e''(x) }
,
= ( uJ!1"
n
(A) , Mgiueaayiseprmn,()Ptenaayiexrmn,(C
t I i4 I I
- I
0 5 1 .0 2 04.
-JJa..
c
- I'
= / u
C
*1'
0.5 . 0
. 0
FIG 1. Examples of idealized stimulus spectra used in three different experiments,
(A) Magnitude analysis experiment, (B) Pattern analysis experiment, (C)
Information reliability experiment.
See text for further details.

I I I I
FIG 2. Integration functionsfrom pilot experiment. Symbolsrepresent the averages of three
subjects, over '1000 trials per
subject; a=5 dB (circles), a=10dB (triangles). Solid line isperformance of an ideal detector.Dashed line is prediction of amodel. See text for furtherdetails.
II I I I I
4 6 8 18 12
n
jel 0. ysq mos 000
Ux ^+ x** +4 A+ a~
CD A
X xC +x x
[sq/0
0x e +
1,0
' - 5 19 - 0 5 18 i~ 0 5 16
Dia.erence Overall Level. dB
FIG 3. Psychometric functions from pilot experiment. Each panel gives data froma different subject. Plotted along the abscissa is the difference between the overalllevel of the two stimuli in each trial. Different symbols represent different n.
S++ I1|
SLo-poss-- - - - - --- - - - FIG 4. W eighting functions from
Fipilot experiment. Horizontal
.a ddashed line is percent agreement
<= , ,/ . / -:,for n=1. Other curves arel of -h-to,-i'--i-e - percent agreement for n> .
u Average of three subjects. SeeL text for further details.
I I I I I I2 4 6; 6 IS 12
Compoonen t Number
I J

referent whereby we can determine how efficiently our listeners are able to makeuse of the information provided by the different tones of the complex. Also, thevalue of a provides an index of the degree of spectral uncertainty associated withthe task - the greater the value of a, the greater the amount of uncertainty. Tomeasure the effects of uncertainty on listeners' ability to combine information, wesimply vary a while being sure at the same time to adjust n or A so as tomaintain the same level of performance from an ideal detector.
Fig. 2 shows the results of this experiment. The solid curve representsoptimal performance for the task as predicted by TSD. The circles represent theaverage performance of three listeners, over 1000 trials per listener. The trianglesrepresent the average performance of these same 3 listeners when both a and Awere changed from 5 to 10 dB 'constant d' ). The dashed line is the predictionof a model which will be descr.bed later. OPpor future reference, we will refer tocurves drawn in these coordinates as integration functions. First, note that thelisteners' ability to integrate information across frequencies is less than optimal.Whereas optimal performance grows at the square root of n, obtained performancegrows more nearly as the cube root of n (cube root of n growth is the dashedline).' What is intriguing about this result is that even for small n listeners makeso little use of the information available in the stimulus. Based on numerousstudies of the information processing capacity of humans, we had expected that atleast 7 give or take 2 componeats would have been processed optimally (Miller,1963). The suboptimal performance cannot be attributed to a ceiling effect - wehave since replicated the cube root of n growth in performance at a lower level ofd'opt. It is also unlikely that the tones were masking one another - even with ahalf-octave separation between the tones performance is unchanged. Finally, theresults cannot be attributed to a simple lack of training. Most of subjects arepracticed musicians, some have been participating in these experiments for over ayear now with little or no observable improvement in performance.
Another intriguing result is that increasing the level of stimulus uncertainty (aof 5 versus 10 dB) has no effect. We had expected that, in general, higher levelsof uncertainty would produce poorer performance as Watson and many others havefound. In fact, a a of 5 and !0 dB represents a fairly wide range of stimulusvariability. The apparent discrepancy appears to be related to the fact that inWatson's experiments, unlike ours, there is no variation in the difference (level,frequency, or duration) to be discriminated; put simply, optimal performance forWatson's task is unbounded. This may be important. Most naturally occuringsignals vary, thus, even an ideal detector would make errors on occasion. But thisis precisely the type of stimulus variability which in our experiment has no effect.Could it be that the effects of stimulus uncertainty are largely limited to thoselaboratory conditions in which the difference to be discriminated is fixed, that is,in which an ideal detector makes no errors?
In this regard at least, our task appears more analogus to a traditional noiseintensity discrimination task (e.g. Green, 1965) than to Watson uncertaintyexperiment. Our a could be likened to the a of the sampling distribution of noiseenergies; our A would be analogus to the mean difference between noise energies tobe discriminated. Of course, in our experiment, a is generally much larger than inthe noise discrimination experiment, and the form of the distributions are differentas well. The important point to note however is that performance in bothexperiments is found to be constant for a constant A/a ratio, reflecting a type of1At first, this may seem inconsistent with the results of earlier studies (e.g. Green, 1960) showingsquare root of n growth for intensity discrimination of noise signals (where n refers to signalbandwidth). One must remember, however, that in our experiment the distributions of individualtone intensities are log-normal, thus overall intensity discrimination is a suboptimal strategy.
3

Weber fraction in both cases. Lxperiments are currently underway to partial outthe relative influence of peripheral and central factors on these results.
Preliminary modelling effortsWe have now pursued several computational models to account for the results
of this pilot experiment. Althot-gh these models have so far only been applied tothe data of this experiment, they could in principle be applied to future resultsobtained in any of the experiments of this proposal. Each of these modelsattributes suboptimal performance to a different stage of auditory processing. Theoutstanding feature of these models is that, despite their differences, they allprovide an equally excellent summary of the preliminary data, in each caseaccounting for 92% or more of the total variance. We believe that future researchshould be largely guided by attempts to empirically test these models. Indeed,such tests should eventually conerge on a subset of stimulus conditions for whichoptimal performance is both p:edicted and obtained -- this would provide thelitmus test of any model.
Table I. Models of Information Integration
Model General Form Specific Form Growth Factor
Interchannel d' = A/(o2/n+R)1/ 2 R a a 2 [n/(1+nR/, 2)]"/ 2
Correlation
Compressive F(d'i) = EF(d') F(z) = zp ni/p
Nonlinearity
Limited Memory d'~ [d 2+E wd)2I1/2 ~ a constant [,±W2 (n-1)] 1/2
Capacity "j
Nonoptimal Difference approx n1/3
Decision Overall LevelStrategy
Model 1: Correlated Observations. In our pilot experiment, the n elementscomprising the stimulus sample are independent. The basic assumption of thecorrelated observations model is that the n observationa corresponding to theseelements are not independent. In effect, the model assumes that there is a sourceof internal (central) noise which is common to all observations. The generalformulation of this model is given in Table I. Note that the general form isidentical to the predictions for an ideal detector with the exception of the varianceterm R in the denominator. The variance term R represents the influence of thecentral noise in this model. In the specific form of the model, R is assumed togrow with the external variance a (i.e. the internal noise ip multiplicative). Thevalue of R providing the best fit to the data is 3.4 dB (R/ 2 _1.8 dB) which is inreasonably good agreement with internal noise estimates from other types ofintensity discrimination experimeats (e.g. Bos and DeBoer, 1966; Durlach, 1963).
Model 2: Information Compression. This model allows that all observationsare independent. However, if. assumes all observations are subject to somenonlinear transformation both before and after they are combined. In Table I, the
4

nonlinear transformation is given by F which is assumed in this case to be apower-law. When the exponent p of the power-law is 2 there is no informationloss with n and the model predicts optimal performance. For p > 2, there is aprogressive loss of information provided by each additional observation. The resultis a common form of information compression (Hafter and Dye, 1983; Lutfi, 1983;Penner, 1978, 1980; Stevens, 1936). The value of p providing the best fit to thedata is 3.4. This yields a compressive exponent on n of 0.3, which again is ingood agreement with values obtained in the other types of studies cited above.
Model 3: Limited Memory Capacity. This model emphasizes the fact that oneach trial of the two-interval, forced-choice task, the observer must compare theobservation made on the secon6e interval with a memory trace of the observationmade on the first interval. TIe trace is volatile and is assumed to deteriorateover time. In our formulation of the model (Table I), performance is optimalwhen the memory load is only one element (this assumes that the time betweenobservations is small, say less than a half second). For each additional element,only a fraction wi of the information is preserved by the time the secondobservation interval comes along for comparison. We find excellent fits to the datawhen all w.s are assumed equal to 0.5.
Mode? 4: Nonoptimal Decision Strategy. This model assumes no specialdegradation or compression of information before the decision stage. Rather, themodel assumes that performance is limited by the listener's choice of a nonoptimalrule for arriving at a decision. The optimal decision strategy in our pilotexperiment begins by computing a level difference between the first and secondobservation interval for each element of the stimulus sample. The optimal strategyis then to choose interval 1 if the sum of these differences is positive, otherwisechoose interval 2. We have explored a number of alternative nonoptimal decisionrules and have found one in particular that provides a very good account of thedata. In this nonoptimal strategy, decisions are based simply on the overall leveldifference between the first and second observation interval (see footnote 1). Thisdecision rule approximately yields a cube root on n growth rate as shown by thedashed line in Fig. 2.
There are several approaches that will be taken to test among these models.Many tests will simply involve the manipulation of variables explicitly or implicitlydefined in the mathematical formulations of the models. These variables includethe variance of the distribution of members within each stimulus category (holdingd't constant), the number of members, the number of categories, the mathematicalform of the distributions, and the size of the sample randomly drawn on eachtrial. Other tests will involve various manipulations in stimulus parameters andvarious ways of "packaging" the information presented to observers. For instance,the tones from signal and nonsignal distributions will be intermingled in frequencyand time in various ways to form different classes of spectral-temporal patterns(Study 2). The final approach will be to evaluate the models based on trial-by-trial analyses of the listeners' responses. This latter approach is discussed ingreater detail below.
Trial-by-trial analysesEach of the models we ha-e described makes a specific prediction regarding
the mathematical form of the integration function. Unfortunately, the differencesamong these functions are so small that they cannot be resolved within themeasurement error of our experiment. In this situation, we resort to analyzing themodels' predictions for the trial-by-trial data.
Consider for example the predictions of Model 4. According to this model,the listener responds to the interval perceived to have the higher overall level.
5

Thus, on trials in which the HIGH sample has the higher overall level the listenerwill usually respond correctly, ozi trials in which the LOW sample has the higheroverall level, the listener should more often respond incorrectly. Indeed, if overalllevel is the cue used by listeners, then the trial-by-trial data across all conditionsof the experiment should converge on a single psychometric function; the abscissafor this function would be the difference between the overall level of HiGH andLOW samples on each trial. Fig 3. shows the results this analysis. To obtain apercent correct value at each level difference, the trial-by-trial data wereaccumulated into 1 dB bins; thx s the percent correct at say 5 dB is actually thepercent correct for all trials in which the level difference between the HIGH andLOW samples was between 4.5 and 5.5 dB. Each panel represents the data froma different subject; the different symbols correspond to the different sample sizes(n). The solid curve in each panel is the best fitting logistic (see Bush, 1963).The data do indeed tend to converge on a single psychometric function. Note alsothat for a performance level of' 75% correct, the overall level difference for allsubjects is near 1 dB - a normal difference limen for intensity in the 21FCprocedure. This analysis provides a necessary, not a sufficient, test of model 4. Itdemonstrates nonetheless how the trial-by-trial data may be used to gain additionalinsights into the processes underlying discrimination performance.
Another use of the trial-by-trial data is to provide stimulus weightingfunctions. These functions are intended to specify the relative contribution ofdifferent stimulus elements to the decision process (see question 3). The methodwe have chosen is simply to count the agreements between the response on eachtrial and the level difference of -he ith element on each trial. For example, if ona given trial the level of the iti, element is higher on the second interval, and ifthe response is to the second interval, then the response is scored as an agreement.Fig. 4 shows the percent agreements for each of the elements as derived from thetrial-by-trial data of the pilot experiment. Only those trials in which the ith leveldifference exceeded 5 dB were included in this analysis. This restriction wasimplemented to eliminate possible disagreements resulting from the listeners inabilityto discriminate the level differenze. Now suppose that when all thirteen elementsare played (n=13), the listener attends exclusively to the thirteenth element. Thepercent agreements in this case should equal the percent agreements when only oneelement was played (n=). The percent agreements will be less than this to theextent that the listener attends to the other n-1 components. The horizontaldashed line gives the percent agreements for n=1. The results give little evidencethat listeners differentialiy weight the various frequencies that comprise thesesignals. This is not too surprising since all elements constitute equally reliablesources of information. We would not expect this to be true when differentreliabilites are associated with each element (study 5).
Study 2. Pattern analysisThe relevant information d-istinguishing many naturally occuring signals is
contained not only in overall intensity differences across signals, but also in thepattern of intensity variations across frequency within each signal. The next studyfocused on listeners' ability to perform spectral pattern analysis. All conditionswere identical to the pilot expeziment described earlier except on each interval ofthe 21FC trial, half the tones were drawn from the HIGH distribution and theother half were drawn from the LOW distribution. On one interval, the oddnumbered tones were drawn from the HIGH distribution, the even numbered tonesfrom the LOW (See Fig. IB). On the other interval, the reverse was true. Thelistener's task was to identify the interval in which the odd numbered tones weredrawn from the HIGH distribution. To insure that the subject's response were
6

0
0
0E3k
Co
19r 434 M 0
44a
0 0
U -
o - u
Cu
S- - A U
00
9*0 c Lo *0
14-
o
bO

based on spectral pattern analysis, we also roved the overall level of the stimuluson each presentation (see Green, 1988).
According to the Theory of Signal Detection, optimal performance for thistask is identical to that for tae earlier magnitude discrimination task. -- Theperformance ,j the ideal detector is unaffected by how the information is packagedin frequen:, and/or time. It is of interest, therefore, to compare the performanceof our -ubjects in this task to their performance in the earlier magnitudediscrimination task. Both the trace memory model and the correlated observationsmodel predict that human performance in the pattern analysis task will be nearoptimal. There is no decay cf memory because the relevent comparisons arebetween the intensities of components that occur simultaneously with one another.There is no effect of common internal noise because the common noise issubtracted out in the differencing of components. In contrast, the nonoptimaldecision model predicts that human pattern analysis will be worse than magnitudeanalysis.
The results of this experiment (squares) are compared with the results of themagnitude analysis experiment (circles) in Fig. 5. The data are plotted asmeasures of discrimination efficiency, eta = (d obt/d opt) 2 . It is clear that spectralpattern analysis is significantly poorer for our subjects than simple intensitydiscrimination. The difference increases with the number of components in thestimulus. Though the results support the nonoptimal decision model, we can notrule out the possibility that roving overall stimulus level may have had adetrimental effect on performance. Experiments are underway to test thishypothesis. Additional tests of these models will involve discrimination of patternsacross both frequency and time.
Study 3. Differential Weighting of Frequency ComponentsNot all frequencies comprising naturally occuring sounds be expected to carry
the same amount of information for discrimination. Obviously, those frequencycomponents conveying the greatest amount of information should be given greatestweight in the decision process. Study 3 investigated listeners' ability to selectweights appropriate to the information content of the individual frequencycomponents of the complex. The first experiment represented an extreme case inwhich all information relevant to classification was contained in a single component,the one at 1 kHz. On one interval of the 21FC trial, the level of the 1-kHzcomponent was drawn from the HIGH distribution. On the other interval, thelevel of this component was drawn from the LOW distribution. The levels of allother tones on both intervals was drawn from the LOW distribution (See Fig. IC).The listener's task was to select the interval in which the 1-kHz component wasselected from the HIGH distribu,-ion. We were quite surprised to find that severalof our best subjects could not perform above chance on this task (triangles of Fig.5), even after considerable practice. We had expected that subjects' performancewould be near optimal. They would only need to focus their attention on thecritical band containing the single 1-kHz component and ignore all othercomponents. Apparently they were unable to do this. This represents a rathersevere departure from the critical band principle, one that may be related to recentresults obtained by Neff and Green (1987). We intend to pursue this resultfurther by increasing the information (the d'opt) provided by the 1-kHz component,and by slowly increasing the information conveyed by the other components.Weighting functions derived from the trial-by-trial data should indicate whether ornot listeners selectively weight the individual frequency components according totheir information content.
7

Publications, Abstracts and Talks supported by AFOSR
Scientific Journal ArticlesLutfi, R.A. (1988a). "Interpreting measures of frequency selectivity: Is forward
masking special?," J. Acoust. Soc. Am. 83, 163-177.
Lutfi, R.A. (1988b). "Complex interactions between pairs of forward maskers,"Hearing Research, in press.
Abstracts and TalksLutfi, R.A. (1987). "Additivity and auditory pattern analysis," Presentation given at
the AFOSR Program in Auditory Pattern Recognition. December meeting.
Lutfi, R.A. (1988c). "Discrimination of random spectra by normal-hearing listeners,"in Abstracts of the l1th Midwinter Research Meeting, ARO. Editedby D.J. Lim, p. 209.
Lutfi, R.A. (1988d). "A detection- heoretic approach to complex sound perception,"Presentation given at the Psychophysics Laboratory at the University ofFlorida, Gainesville.
Papers in PreparationLutfi, R.A. (1988e). "Informational processing of complex sound: I. Magnitude
analysis," J. Acoust. Soc. Am. or J. Exp. Psychol., Human Percept & Perf.
8

Bibliography
Ahumada, A. Jr., and Lovell, J. (1971). "Stimulus features in signal detection,"J. Acoust. Soc. Am. 4), 1751-1756.
Ahumada, A., Jr., Marken, R., and Sandusky, A. (1975). "Time and frequencyanalysis of auditory signal detection," J. Acoust. Soc. Am. 57, 385-390.
Berg, B.G. (1987). "Internal noise in auditory decision tasks," Doctoral Dissertation,Indiana University.
Bos, C.E., and de Boer, E. (1966). "Masking and discrimination," J. Acoust. Soc.Am. 39, 708-715.
Bush, R.R. (1963). "Estimation and evaluation," in Handbook of MathematicalPsychology, edited by R.D. Luce, R.R. Bush, and E. Galanter, (John Wileyand Sons, New York), pp. 429-469.
Durlach, N.I. (1963). "Equalization and cancellation theory of binaural masking-leveldifferences," J. Acoust. Scc. Am. 35,1206-1218.
Durlach, N.I., Braida, L.D., and Ito, Y. (1986). "Towards a model fordiscrimination of broadband signals," J. Acoust. Soc. Am. 80, 63-72.
Goldstein, J.L. (1973). "An optimum processor theory for the central formationof pitch of complex tones," J. Acoust. Soc. Am. 54, 1496-1516.
Green, D.M. (1958). "Detection of multiple component signals in noise," J. Acoust.Soc. Am. 30, 904-911.
Green, D.M. (1960). "Auditory cetection of a noise signal," J. Acoust. Soc. Am.32, 121-131.
Green, D.M. (1964). "Consistency of auditory judgments," Psych. Rev. 71, 392-407.Green, D.M. (1983). "Profile analysis: A different view of auditory
intensity discrimination," Amer. Psychol. 38, 133-142.Green, D.M. (1988). Profile Analysis: Auditory Intensity Discrimination, (Oxford
University Press, New York).Green, D.M. and Kidd, G. Jr. (1983). "Further studies of auditory profile
analysis," J. Acoust. Soc. Am. 73, 1260-1265.Green, D.M. and Mason, C.R. (1985). "Auditory profile analysis: Frequency,
phase, and Weber's Law," J. Acoust. Soc. Am. 77, 1155-1161.Green, D.M., and Swets, J.A. (1966). Signal Detection Theory and Psychophysics
(Krieger: Huntington, New York).Hall, J.W., Haggard, M.P. and Fernandes, M.A. (1984). "Detection in
noise by spectro-temporal analysis," J. Acoust. Soc. Am. 76, 50-56.Hanna, T.E. (1984). "Discrimination of reproducible noise as a function of
bandwidth and duration," Percept. Psychophys. 36, 409-416.Leek, M.R. and Watson, C.S. (1984). "Learning to detect auditory pattern
components," J. Acoust. Soc. Am. 76, 1037-1044.Lutfi, R.A. (1983). "Additivity of simultaneous masking," J. Acoust. Soc. Am. 73,
262-267.Lutfi, R.A. (1985). "A power-law transformation predicting masking by sounds with
complex spectra," J. Acoust. Soc. Am. 77, 2128-2135.Lutfi, R.A. (1985). "A power-law transformation predicting masking by sounds
with complex spectra," J. Acoust. Soc. Am. 77, 2128-2135.Lutfi, R.A. (1986). "Two- versus four-tone masking, revisited," J. Acoust. Soc.
Am., 80 422-428.Lutfi, R.A. (1988). "Discrimination of random spectra by normal-hearing listeners,"
in Abstracts of the 11th Midwinter Research Meeting, ARO, Edited by D.J.Lim, p. 209.
9

Miller, G.A. (1963). "The magical number seven, plus or minus two: Some limitson our capacity for processing information," in Readings in MathematicalPsychology, edited by R.D. Luce, R.R. Bush, and E. Galanter, (John Wileyand Sons, New York), pp 135-151.
Neff, D.L. and Green, D.M. (197). "Masking produced by spectral uncertaintywith multicomponent maskers," Perception & Psychophysics 41, 409-415.
Penner, M.J. (1978). "A power-lawr transformation resulting in a class of short-termintegrators that produce time-intensity trades for noise bursts," J. Acoust.Soc. Am. 63, 195-201.
Penner, M.J. (1980). "The coding of intensity and the interaction of forward andbackward masking," J. Acoust. Soc. Am. 67, 608-616.
Penner, M.J. and Shiffrin, R.M. (1980). "Nonlinearities in the coding of intensitywithin the context of a temporal summation model," J. Acoust. Soc. Am.67, 617-627.
Perkins, M.E., Kistler, D.J. and Wightman, F.L. (1986). "Spectralpattern recognition and sound localization," J. Acoust. Soc. Am.submitted.
Robinson, D.E., and Berg, B.G. (1986). "A partitioned variance model for multipleobservations," Paper presented at the 19th Annual Meeting of the Societyfor Mathematical Psychology, Cambridge, MA.
Searle, C.L. (1982). "A model of auditory localization: Peripheral constraints,"In Localization of Sounc.: Theory and Applications, Edited by R.W.Gatehouse (Amphora Press: Groton, CT).
Spiegel, M.F., Picardi, M.C. a-ad Green, D.M. (1981). "Signal and maskeruncertainty in intensity discrimination," J. Acoust. Soc. Am. 70,1015-1019.
Stevens, K.N. and Blumstein, S.E. (1978). "Invariant cues for place ofarticulation in stop consonants," J. Acoust. Soc. Am. 64, 1358-1368.
Stevens, S.S. (1936). "A scale fcr the measurement of psychological magnitude:loudness," Psychol. Rev. 43, 405-416.
Terhardt, E. (1974). "Pitch, consonance and harmony," J. Acoust. Soc. Am. 55,1061-1069.
Watson, C.S. and Kelly, W.J. (1981). "The role of stimulus uncertainty in thediscrimination of auditory patterns," in Auditory and Visual PatternRecognition, edited by D.J. Getty and J.H. Howard, Jr., (LawrenceErlbaum and Associates, Hillsdale).
Watson, C.S., Kelly, W.J. and Wroton, H.W. (1976). "Factors in the discriminationof tonal patterns II: Selective attention and learning under various levels ofstimulus uncertainty," J. Acoust. Soc Am. 60, 1176-1186.
Wightman, F.L. (1973). "The pattern-transformation model of pitch," J. Acoust.Soc. Am. 54, 407-416.
10

Interpreting measures of frequency selectivity: Is forward maskingspecial?a)
Robert A. LutfiWaisman Center, University of Wisconsin. Madison. Wisconsin 53 705
(Received 29 August 1986; accepted for publication 26 September 1987)
In a previous article [Lutfi, J. Acoust. Soc. Am. 76, 1045-1050 (1984) ], the following relationwas used to predict measures of frequency selectivity obtained in forward masking frommeasures obtained in simultaneous masking: F(g) = G + H(g) - H(O), where, for a givenmasker level, F is the amount of forward masking (in dB) as a function of signal-maskerfrequency separation (g), H is the amount of simultaneous masking, and G is the amount offorward masking forg = 0. In the present study, the relation was tested for a wider range ofsignal and masker frequencies, masker levels, and signal delays. The relation describedthresholds from all conditions well with the inclusion of one free parameter A corresponding toa constant frequency increment, F(g) = G + H(g + A) - H(A). The parameter) wasrequired to account for observed shifts in the frequency of maximum forward masking. It isargued that a single tuning mechanism can account for commonly observed differencesbetween simultaneous- and forward-masked measures of frequency selectivity.
PACS numbers: 43.66.Ba, 43.66.Dc, 43.66.Fe [WAY]
INTRODUCTION tory nerve (Kiang et al., 1965), and evidence for a physio-logically vulnerable "second filter" (Evans, 1975). Appar-
Forward masking refers to the elevation in the threshold ent similarities suggested possible connections between theseof a signal presented shortly after the masker has terminated, physiological observations and the differences observedThe residual effect of the masker offers a means of measuring among psychophysical tuning curves. Weber ( 1983) has re-auditory frequency selectivity free from intrusive interac- viewed three such theories in detail and has rejected one oftions that may occur when the signal and the masker are them. Later interpretations were to implicate "off-frequencyplayed simultaneously (e.g., Egan and Hake, 1950; Green- listening" (O'Loughlin and Moore, 1981) and "cuing" ef-wood, 1971 ). Unfortunately, differences exist among simul- fects (Terry and Moore, 1977; Moore, 1978). However, thetaneous- and forward-masked measures that, after many frequency-dependent nature of these effects preserved thestudies, are still not well understood. By far, the largest dif- general assumption that differences among tuning curvesferences, and those that have received the most attention, are somehow reflect additional frequency-selective processesobserved among psychophysical tuning curves. This esti- operating in forward masking.mate of frequency selectivity gives the level of the masker at More recently, articles have begun to question the ex-each frequency necessary to mask a fixed-level, fixed-fre- tent to which additional tuning mechanisms are involved. Inquency signal. Typically, tuning curves are observed to be a contemporary review of the literature of frequency selec-narrower when measured in forward masking than when tivity, Jesteadt and Norton (1985) note that forward-mask-measured in simultaneous masking (Duifhuis, 1976; Hout- ing tuning curves may broaden markedly at high signal lev-gast, 1972, 1974; Lutfi, 1984; Moore et al., 1984; Moore, els, while simultaneous-masking tuning curves appear to1978; Weber, 1983; Wightman et al., 1977). There is little change little (Stelmachowicz and Jesteadt, 1984). They sug-agreement regarding the mechanisms underlying this result, gest that forward-masking tuning curves may be narroweralthough it has commonly been assumed that at least two than simultaneous-masking tuning curves only for moder-separate, frequency-selective processes are involved (Duif- ate- and low-level signals; for high-level signals, forward-huis, 1976; Houtgast, 1972, 1974; Moore, 1978; O'Loughlin masking tuning curves might actually be broader. Subse-and Moore, 1981; Terry and Moore, 1977; Weber, 1983; quent data of Moore and Glasberg (1986) indicate that theWightman et al., 1977). Forward masking is believed to be difference between simultaneous- and forward-masking tun-fundamentally different from simultaneous masking in that ing curves is reduced slightly at high signal levels. Nelsonit reflects the operation of these additional frequency selec- and Freyman (1984) report a similar, perhaps related,tive processes. broadening of tuning curves with increasing signal delay
The decision to invoke additional tuning mechanisms (also see Kidd and Feth, 1981; Small and Busse, 1980).came after physiological studies had accumulated evidence They show that, if signal level is selected to equate the tips ofof suppression from single-unit recordings in the cat's audi- the tuning curves, the tuning curves do not change signifi-
Some of the data of this article were reported earlier in a NATO Ad- cantly with signal delay. Bacon and Moore (1986) found
vanced Research Workshop I Weber and Lutfi, in Auditory Frequency r that the difference between simultaneous- and forward-
lectivity, edited by B. C. J. Moore and R. D. Patterson (Plenum, New masking tuning curves also depends on the temporal place-
York. 1996)1. ment of the signal within the simultaneous masker. When
163 J. Acoust. Soc. Am. 83 (1), January 1988 0001-4966/88/010163-15S00.80 De 1986 Acoustoca Socety of America 163

the signal occurs at either end of the simultaneous masker In simultaneous masking, for relative masker frequen-(the trailing end being the typical placement in tuning curve cies (f-f, )/f, = - 0.3 and - 0.2, a control measure wasexperiments), forward-masking tuning curves do appear taken to prevent the detection of aural combination bandssignificantly narrower. However, when the signal occurs in generated by signal-masker interaction (see Greenwood,the temporal center of the simultaneous masker, this differ- 1971). A low-level band of noise (50 Hz wide and 30 dBence is much reduced. Even when tuning curves have shown below the level of the primary masker) was gated on and offlarge differences in simultaneous and forward masking, the in the same manneras the signal. The center frequency of therole of additional tuning mechanisms has been questioned additional noise band was set equal to the center frequencysince other measures of frequency selectivity fail to show of the most audible aural combination band at 2f -f,such large differences (Lutfi, 1984; Weber and Lutfi, 1986). (Greenwood, 1971). The amount of masking produced byOne such measure, the filter function, gives signal threshold this additional noise band alone was always 25 dB or moreas a function of masker frequency for a fixed-level masker. below that produced by the primary masker, and so it wasLutfi (1984) reports filter functions that are essentially par- not expected to produce any additional masking of the sig-allel in simultaneous and forward masking over a wide range nal.of masker levels.
The recent studies complicate the interpretation of for- A. Stimuliward-masking tuning curves. They suggest that differencesin measures, once thought to reflect the operation of addi- The signal was a 10-ms sinusoid, shaped with 5-ms, Kai-
tional tuning mechanisms, may, in large part, be attributed ser ( W = 0.2) onset and offset ramps (Childers and DurI-
to interactions among the effects of masker frequency, mask- ing, 1975). This ramp has the desirable property that the
er level, and signal delay that are peculiar to the tuning curve spectral sidelobes are more than 70 dB down from the pri-
experiment. Presently, it is difficult to determine the influ- mary lobe within 20% of the primary lobe center frequency.
ence of such interactions. The previous studies have general- The narrow-band noise maskers had 3-dB bandwidths of 50
ly focused on the effects of one or two of these factors while Hz. They were gated on and off with 5-ms Kaiser ramps for a
holding the remaining factor(s) constant. Specific values total duration (between the 0 voltage points) of 200 ms. All
chosen for the remaining factors may, therefore, have played stimuli were digitally (PDP- 11/40) synthesized and output
a role in producing the observed differences among tuning through 14-bit DACs, low-pass filtered at the 4.-kHz cutoff
curves. The purpose of the present study is to investigate the frequency of Unigon (model LP-120, 120 dB/oct) and
interaction among all three factors rather than to provide a Khron-hite (model 3343, 96 dB/oct) filters. The narrow-
fine-grain analysis of any one. Comparatively few masker band noise maskers were randomly sampled from a 3-s noise
frequencies were used so that tuning curves and filter func- file. The levels of all stimuli were controlled by programma-
* tions could be obtained for a wider range of signal frequen- ble attenuators, and all stimuli were presented over TDH-49
* cies, masker levels, and signal delays than has been typical of headphones (with 65001 cushions) to the right ear of sub-
any one study. Based on the results, it is argued that differ- jects seated in a IAC, double-wall, sound-attenuated
ences commonly observed between simultaneous- and for- chamber.
ward-masking tuning curves are largely epiphenomena ofthe tuning curve procedure. B. Procedure
I. METHOD In all conditions, signal threshold was the dependentFilter functions and tuning curves were obtained in si- variable. Signal thresholds were obtained in daily 2-h ses-
multaneous and forward masking by measuring threshold sions using a two-interval, forced-choice, adaptive proce-for a brief sinusoidal signal in the presence of a variable- dure (see Levitt, 1971 ). Threshold estimates were based onfrequency, narrow-band noise masker. Filter functions were the average of the last eight reversals in each adaptive runobtained for three signal frequencies (f, = 0.5, 1.0, and 2.0 after the first two reversals had been rejected. Five such esti-kHz); tuning curves were obtained for two signal frequen- mates were obtained on different days for each condition of
cies (f, = 0.5 and 2.0 kHz). The masker frequencies (f) the experiment. The lowest and highest of the five estimatesvaried in proportion to the signal frequency were rejected and the remaining three were averaged to ar-
(f-f, )/f, - 0.3, -0.2, - 0.05,0.0, 0.05,0.1, and 0.2. rive at the final threshold estimate. The standard error of theIn simultaneous masking, the offset of the signal (0 voltage trimmed mean exceeded 3 dB for 5% of the cases (see Bar-point) coincided with the offset of the masker. In forward nett and Lewis, 1978 for information regarding the use ofmasking, the onset of the signal followed the offset of the trimmed means). For all subjects, the pattern of results wasmasker by 5, 10, 20, or 40 ms. Masker level varied from 30- quite similar. Therefore, the data were further averaged90 dB SPL depending on the particular combination of across subjects.masker frequency and signal delay. Complete filter func- Four normal-hearing individuals were paid observers intions were obtained for masker levels of 50-80 dB SPL. each phase of the study, although the same four observersThese data were then used to derive tuning curves at signal did not participate in each phase. One subject was unable tolevels of 30-60 dB SPL. The details of this derivation are continue after data had been collected for the 2.0-kHz signal.described in Sec. II. Not all filter shapes and tuning curves Data for the 0.5-kHz signal were, therefore, collected with awere obtained for all possible combinations of level and sig- replacement subject. A second replacement was required be-
nal delay, fore collecting data for the 1.0-kHz signal. The ages of the
164 J. Acoust. Soc. Am.. Vol. 83, No. I. January 1988 Robert A. Lulfi: Interpreting forward masking 164

.subjets ranged from 21-30 years. Each subject was tested quately, on the selected coordinates, oy titer functions with;ndividutl. two linear segments. Expressing relative masker frequency
as g = (f-f, )/f,, the filter functions are of the formII. RESULTS
A. Filter functions in simultaneous and forward masking H(g) = -#ig-a, g<a, (1)
as a function of signal frequency .Tma - I g - al, g>a,
Figure 1 shows simultaneous- and forward-masked wherefl, and/3, are, respectively, the unsigned slopes of thethresholds as a function of the relative masker frequency for upper and lower branches of the function, a corresponds toeach of the three signal frequencies. Masker level is 80 dB the frequency at the break point, and T.aA is signal thresholdSPL and signal delay in forward masking is 5 ms. Delaying (in dB) at the breakpoint. The parameter a allows the MMFthe signal results in an overall reduction in masked thresh- to be estimated slightly above or below the signal frequency.old, but the reduction in threshold does not always appear to The curves drawn through the simultaneous-masked thresh-be the same at each masker frequency. For instance, thresh- olds were obtained by selecting values of #,,, /6, a, andold for the 2.0-kHz signal is greatist in simultaneous mask- T.. satisfying the least-squares criterion. The results of theing when the masker frequency is 2.0 kHz. In forward mask- regression for the individual and mean data are shown ining, however, the 1.9-kHz masker produces the highest Table I (80-dB masker level). Each curve represents thethreshold. The effect is also evident for the 0.5- and 1.0-kHz regression of four parameters on only seven points, so thesignals. In each case, the maximum masking frequency proportion of variance accounted for (r2) is predictably(MMF) in forward masking occurs at a frequency just be- high. In subsequent analysis, these simultaneous-maskinglow that obtained in simultaneous masking. Similar shifts in filter functions will be used to predict the forward-maskedthe MMF in forward masking have been reported previously thresholds.by a number of investigators (Ehmer and Ehmer, 1969; The degree of frequency selectivity exhibited by simul-Kidd and Feth, 1981; Munson and Gardner, 1950; Nelson taneous-masking filter functions is estimated by the steep-and Freyman, 1984; Vogten, 1978a,b; Widin and Viemeis- ness of the unsigned slopes, ,O. and fl. For the 1.0- and 2.0-ter, 1979a,b; Zwicker and Jaroszewski, 1982). These shifts kHz signals, the low-frequency slope is small relative to thehave been examined most extensively in the context of psy- high-frequency slope reflecting the familiar upward spreadchophysical tuning curve experiments. Therefore, discus- of masking. The average 3-dB bandwidths derived from thesion of them is reserved for the section on tuning curves. slopes are 83, 83, and 252 Hz, respectively, for the 0.5, 1.0-,
The simultaneous-masked thresholds are described ade- and 2.0-kHz signals. These values are in reasonable agree-
g 500 HZ 1009 Hz 2098 Hz
I
0J
"00
ino A#AA
• S
•-6. 3 -0.2 -6.1 0.0 0.1 9l.2 -9.3 -9.2 -4.1 0.0 9.1 01.2 -19.3 -9.2 -0.1 0.01 0.1 0l.2
, Relative MasKer Frequencyj (fm-fs)/fS
I! FIG. 1. Simultaneous- and forward-masked thresholds (circles and triangles, respectively) as a function of relative masker frequency g for three signal
frequenciesfs -- 500, 1000, and 2000 Hz. Signal delay is 5 ms. The data are the averaged threshold of four subjects. The filter functions drawn through thes imultaneous-masked thresholds were obtained by leant-squares regression according to Eq. ( I1). The forward-masking filter functions were derived from
the simultaneous-masking filter functions according to Eq. (2).
I. 165 J. Acoust. Soc. Am., Vol. 83. No. I, January 1988 Robert A. Luffh: Interpreting forward masking 165
I Aa
- I I I II I III

TABLE 1. Parameters for simultaneous-masking filter functions. The rms error refers to the root-mean-square deviations of the data from the fitted curve.
Parameters
Masker level A1 0 T,_, rms error
Subject Hz dB SPL a dB dB dB SPL r: dB
IL 500 80 0.025 68.8 25.3 76.1 0.892 1 270 0.050 55.3 27.0 66.9 0.920 1.160 0.067 56.7 56.1 60.3 0.934 1.950 0.021 26.2 37.1 49.2 0.825 1.2
1000 80 - 0.033 72.9 64.2 74.5 0.732 3.72000 80 0.021 131.0 29.4 73.6 0.995 0.5
70 0.037 101.0 44.8 622 0.914 1 760 0.074 146.0 59.3 563 0.979 1.450 0.050 73.8 42.3 461 0.946 0.9
DO 500 80 0.000 30.7 29,9 70,5 0.881 1.170 0.056 65.8 35.3 62.6 0.842 1.860 0.062 35.0 34.7 53.2 0.736 2.550 0.049 2.7 35.1 42.7 0.891 0.9
1000 80 0.002 94.8 55.8 81.3 0.892 2.12000 80 0.091 273.0 51.5 76.8 0.927 2.6
70 0.042 197.0 94.5 70.0 0.978 2.060 0.046 143.0 105.0 56.1 0.902 3.550 0.049 137.0 109.0 50.4 0.972 1.2
BL 500 80 - 0.034 31.7 62.3 73.8 0.962 1.070 0.050 47.2 38.0 62.9 0.977 0.760 0.029 9.3 51.7 53.0 0.982 0.750 0.082 50.0 53.9 47.6 0.988 0.9
1000 80 - 0.013 133.5 50.8 77.0 0.873 2.8FB 2000 80 0.000 126.0 27.6 73.7 0.975 1.3
70 0.000 115.0 47.5 63.1 0.967 1.160 0.000 80.0 67.2 54.4 0.874 2.550 0,017 87.1 66.2 47.2 0.944 1.3
DD 500 80 0.000 22.8 46.3 69.7 0.829 2.270 0.000 534 50.8 60.8 0.951 0.960 0.030 4.4 27.4 49.0 0.922 1.150 0.000 11.4 164.0 42.5 0.997 0.7
3Z 1000 80 -0.013 142.9 39.2 76.6 0.979 1.4DD 2000 80 0.049 145.0 15.4 71.2 0.958 1.5
70 0.034 144.0 46.4 66.1 0.959 1.560 0.021 105.0 69.0 54.2 0.988 0.950 - 0.005 54.7 71.6 43.5 0.851 2.1
Mean 500 80 0.000 35.7 36.9 72.3 0.993 0.570 0.040 57.1 37.6 63.4 0.963 1.060 0.050 26.9 41.5 53.9 0.982 0.750 0.042 14.1 43.0 45.0 0.951 0.9
1000 80 -0.012 107.0 54.5 76.4 0.921 2.12000 80 0.030 143.0 28.5 73.7 0.990 1.0
70 0.030 138.0 58.4 65.3 0.991 1.160 0.035 111.0 72.0 55.0 0.961 1 550 0.032 83.1 74.8 46.9 0.954 1.4
ment with bandwidth estimates of the auditory filter ob- F(g) = H(g + A) + €, (2)tained in simultaneous masking with less intense maskers'Weber (1977), for instance, reports 3-dB bandwidths of 97 where A and " are constants. The parameter A merely repre-and 217 Hz, respectively, for a 1.0- and 2.0-kHz signal. Pat- sents a shift in the breakpoint frequency; it provides an esti-terson (1976) obtained a 3-dB bandwidth of 69 Hz for a 0.5- mate of the shift in the MMF in forward masking. The pa-kHz signal. rameter " gives the corresponding change in Tmj. The
We wish to determine whether or not the degree of fre- simultaneous-masking filter functions were used to predictquency selectivity, as indicated by the slopes of the filter the forward-masked thresholds by estimating the constantsfunctions, differs significantly in forward masking. If the fil- A and in Eq. (2). The results are the curves drawn throughter function in simultaneous masking is designated H(g), the forward-masked thresholds in Fig. 1. Table II (M = 80then all filter functions having identical slopes are of the dB, t = 5 ms) gives, for the individual and mean data, theform values of A and " satisfying the least-squares criterion. For
166 J. AcouSt. Soc. Am., Vol. 83, No. 1, January 1988 Robert A. Lutfi: Interpreting forward masking 166

.TABLE I1. Parameters,. and , (entries) for forward-masking filter functions. Note that the r value in the nght-hand column reiers to the proponion o tocalvanability.accunted for in all conditions of the corresponding row,.
Masker level
50 60 70 80 dB SPL rms errorSubject Hz 1 , , Z A " rz dB
JL 500 0.021 -4.22 0.051 - 6.54 - 0.025 - 8.70 - 0.032 - 11.2 0.959 1.5100 ... 0.020 - 14.2 0.885 2.42000 0.050 - 5 97 0.098 3.14 0.051 - 11.8 0.020 - 18.1 0.951 1.8
DO 500 0.000 - 1.25 0.019 -4.49 -0,009 -6.11 -0,070 -9.32 0.912 2.41000 ....... -0.081 -9.96 0.657 4.12000 0.035 - 4.71 0.066 - 12.0 0.057 - 16.7 0.065 - 20.4 0.895 2.8
BL 500 0.012 - 2.15 0.052 3.35 0.013 - 7.66 0.055 - 9.53 0.952 1.81000 ... ...... 0.046 - 14.3 0.915 2.4
FB 2000 0.054 - 7.61 0.054 - 11.7 0.056 - 14.4 0.045 - 18.4 0.934 1.9
DD 50 0.024 -0.904 0.055 -2.61 -0.012 -3.08 0.126 -6.61 0.955 1.4BZ 10o ......... -0.0005 - 15.1 0.888 2.4DD 2000 0.050 - 3.07 0.041 -6.18 0.045 - 12.3 0.037 - 11.3 0.943 2.1
Mean 500 0.031 - 2.06 0.044 -4.22 0.004 - 6.08 0.034 -9.76 0.978 1.31000 .... ... 0.026 - 14.7 0.972 1.22000 0.055 - 6.59 0.065 - 8.58 0.055 - 13.6 0.045 - 17.2 0.966 1.6
the mean data, the proportion of variance accounted for by B. Filter functions in simultaneous and forward maskingthe two-parameter fit is 0.959,0.972, and 0.897, respectively, as a function of masker levelfor the 0.5-, 1.0-, and 2.0-kHz signals. Most of the residualvariance can be attributed to measurement error. A second Each of the panels of Fig. 2 gives simultaneous- andregression, in which all four parameters (f,, i1, a, and forward-masked thresholds for the 2.0-kHz signal obtainedTm, ) were allowed to vary, indicated no significant or sys- at a different masker level. The signal delay in forward mask-tematic departure from the values of the two-parameter fit. ing was 5 ms. As before, the filter functions in simultaneousIn particular, the slope values were equally often greater masking were estimated by selecting values ofrb,/f,?, a, andthan and less than those of the two-parameter fit. The largest T,, in Eq. (1) satisfying the least-squares criterion. As Ta-departures in mean slope values occurred for the 2.0-kHz ble I shows, the four-parameter regression continues to ac-signal: a Pi, of 47.9 (four-parameter fit) compared to 28.5 count for a high proportion of the variance in the simulta-
(two-parameter fit), and a ., of 155 compared to 143. In neous-masked thresholds at the lower masker levels. Thethis worst case, the four-parameter fit accounted for an addi- upward spread of masking with masker level is evident in thetional 4% of the total variance, changing slopes of the filter functions. At the lowest masker
I I I I [ | I I I
-Se DS SPL -60 Be SPL -7 B SPL BSPI
0C
-
'Ci
-0.2 9.9 9.2 -9.2 9.9 i9.2 -0.2 6.9 0.2 -9.2 0.0 0.2
Relati ve Masker Frequencyj ( Im-Fs)/f
FIG. 2. Same a3 Fig. I except the simultaneous- and forward-masking filter functions are plotted for the 2000-Hz signal, at four masker levels, 50-80 dBSPL. Quiet threshold is 28 dB SPL and is designated by the knee in the filter functions at this level.
187 J. Acoust. SoC. Am.. Vol. 83, No. i. January 1988 Robert A. Luffi: Interpreting forward masking 167
0

level,,, and, are nearly equal; the filter function is roughly quent!y, the 0.5-kHz filter function becomes nearly symmet-symmetric. As masker level grows, ,., increases while f, nc at the highest masker level.decreases so that the filter function becomes highly asymme- An important feature of both the 0.5- and 2.0-kHz datatric. Such changes in masking asymmetry are evident for all is the interaction that is observed between the effects offour subjects and replicate those commonly observed in si- masker level and signal delay. At any given masker frequen.multaneous masking (e.g., Egan and Hake, 1950; Lutfi and cy, the threshold reduction that results from delaying thePatterson, 1984; Patterson and Nimmo-Smith, 1980; Vog- signal is greater at high masker levels than at low ones. Forten, 1978a). instance, when masker level is 50 dB, the difference between
The forward-masking filter functions were derived as simultaneous- and forward-masked thresholds for on-fre-before from the simultaneous-masking filter functions using quency maskers (masker frequency equal to the signal fre-Eq. (2). The estimates of A and " for the individual and mean quency) is about 5 dB. When masker level is 80 dB, however,data are given in Table II. The two-parameter fits to the the dB difference is nearly quadrupled. The interactionforward-masked thresholds are quite good. Excluding the between masker level and signal delay for on-frequency80-dB masker condition, which was described earlier, the maskers has been described in detail by Jesteadt et al.forward-masking filter functions account for 97% or more (1982). The data of Figs. 2 and 3 indicate that the level-of the total variability in the forward-masked thresholds at delay interaction behaves similarly for off-frequencyeach level. This means that the level-dependent changes in maskers.masking asymmetry observed in simultaneous masking aremaintained in forward masking. Note again that the esti-mates of A consistently place the MMF in forward maskingslightly below that in simultaneous masking, and slightly C. Tuning curves In simultaneous and forward masking
below the frequency of the signal. as a function of signal level
A similar pattern of results was obtained for the 0. 5-kHz Figures 4 and 5 give tuning curves derived from the datasignal with the 5-ms signal delay. Figure 3 shows the data of Figs. 2 and 3, respectively. The method for deriving thesewhile Tables I and II give the parametem-of the best-fitting tuning curves follows that of Lutfi (1984) and Bacon andfilter functions. The forward-masking filter functions for the Viemeister (1985). Simultaneous- and forward-masking0.5-kHz signal account for a comparably high proportion of functions were estimated for each masker frequency by lin-the variability in both the individual and the mean forward- ear, least-squares regression of the mean thresholds onmasked thresholds. For the mean data, the proportion of masker level. The masking functions were then used to corn-variance accounted for is 0.978. Changes in masking asym- pute the masker level at each frequency corresponding to ametry with level are less pronounced for the 0.5-kHz signal fixed threshold of 30, 40, 50, or 60 dB. Such point estimatesthan for the 2.0-kHz signal. At the lowest masker level, the based on the regression provide greater reliability than thosefilter function is asymmetric with,8. less thanfl,. This asym- based on a single mean provided that the relation betweenmetry is also opposite to that of the 2.0-kHz filter functions. the variables is truly linear (Cohen and Cohen, 1975). TableSuch reversals in masking asymmetry are not uncommon, III gives the obtained slope and intercept values. The esti-particularly at low masker levels (e.g., Lutfi and Patterson, mated masking functions describe the data quite well. The1984; Zwicker and Jaroszewski, 1982). As before,#., in- worst case is represented by the function with the smallestcreases with masker level whilef(, tends to decrease. Conse- slope (0.16), here the proportion of variance accounted for
I I I F r II I I I I II I I I I III I I I I
C 50 0B DS SPL 70 DB SPL - D8 SPL
-J
-0.2 0.0 0.2 -9.2 0.0 e9.2 -0.2 e.9 0.2 -0.2 6.6 9.2
Relative Masker Frequen~cy (fem-fs)/fs
FIG. 3. Same as Fig . 2 except simultaneous- and forward-masking filter functions are shown for the 500-Hz signal.
168 J. Acoust. Soc. Am., Vol. 83. No. 1, January 1988 Robert A. Lutfi: interpreting forward maskig 168
• A I dI I I

I I I I I I I I
-30 DB SPL -40 DB SPL -50 DB SPL
,/
/FIG. 4. Simultaneous. (circles) and for.*war d (triangles) masking tuning curves
at signal levels of 30-50 dB SPL. Signal> frequency is 2000 Hz and signal delay is
_j 5 ms. The obtained tuning curves (con-
L tinuous lines) were derived from theX masked thresholds of Fig. 2. The dashed
lines are predictions derived from Eq.(2). See text for details.
-6.2 0.0 0.Z -6.2 6.6 8.2 -8.2 8.8 0.2
Relative Masker Frequency (Imn-f)/fs
was 91%. Also shown in Figs. 4 and 5 are predicted tuning the MMF noted earlier in the filter furctions. Disparitiescurves (dotted lines). These curves were obtained by taking between the tips of simultaneous- and forward-masking tun-horizontal cuts through the predicted filter functions of ing curves have been reported previously by VogtenFigs. 2 and 3. In some cases, it was also necessary to interpo- (1978a,b), Kidd and Feth (1981), Nelson and Freymanlate between points on the filter functions in order to deter- (1984), and Widin and Viemeister (1979a,b). In the studymine the tip of the tuning curve. by Vogten, the MMF occurs at the signal frequency in for-
The tunin, curves obtained for the 2.0-kHz signal (Fig. ward masking, but slightly above the signal frequency in4) are representative of those reported in previous studies simultaneous masking. Vogten's tuning curves were ob-(e.g., Moore, 1978; Small, 1959; Vogten, 1978b; Weber, tained at low stimulus levels. The MMF shifts observed in1983). They have the familiar V shape in which the right the first and second panels of Fig. 4 replicate those reportedbranch of the V is quite steep and the left branch is slightly at low levels. All of the remaining authors show that, asbowed. Note also that the tips of the tuning curves in for- stimulus intensity is increased, the MMF in forward mask-ward masking are displaced slightly to the left of those is ing shifts to a frequency below that of the signal. This patternsimultaneous masking. This disparity reflects the shifts in of results is evident in the third panel of Fig. 4.
I I I I I
-40 D8 SPL -50 DB SPL DS SPL
a,J
C.
>,~ FIG. 5. Same as Fig. 4 except signal frequen-a cy is 500 Hz; the tuning curves were derived
' " -from the masked thresholds of Fig. 3.
J
-9.2 s.9 1 .2 -i.2 9.0 I.2 -0.2 9 8.2
RSltie Mko er oeqA iIuencye (tm-ia)mk
169 J. Acoust. Soc. Am., Vol. 83, No. 1, January 1988 Robert A. Luffi: Interpreting forward masking 169

TABLE Ill. Siope and intercept ,aiuc, of the mdlskir tun.iiion, tailnCd from Jminr lea.stI-,qvjre, repression %i:h tic thremnoij, 4~t'rJ.'ci .cro,, usjecs
- 'lnterCeptHii m "-fIs Slope dlB SI'L
simultan.ous - 0.30 .07 - 24 t 3 I ( X'-020 1 04 17 5 () , ,a
0.05 1 03 12.6 5 0 t)9,,0.00 0.85 3.2 t) 0 q940.05 0.84 4.0 5 0 Qo'0 10 0,3 1 7 5 09),0.20 0,74 5.4 4 0)o7
5 - 030 0.73 -t.7 3 0.9so-020 0.78 4 5 4 0995-0.05 0.77 0.6 4 0.994
000 060 13.I 6 0.9940.05 0.62 11. ) 4 0.9950 t0 054 15.7 4 0.920.20 0.59 9.5 4 0.Q97
iX) smultaneou% -- 0.30 1,63 - 6.7 3 0992-0.20 1.28 - 37.2 5 0.989-0.05 1.05 - 13.5 5 0990
000 089 1.5 6 0.0Q60.05 0.85 4.1 5 0.9920.10 0.92 - 8.6 5 0.9940.20 0.51 7.7 4 0.976
5 - 0.30 0.88 - 24.3 3 0.975-0.20 0.69 -6.7 4 0.989-0.05 0.67 4.9 4 0.988
0.00 0.49 13.9 6 09930.05 0.46 9.6 4 0.9750.10 0.28 16.3 4 0.9620.20 0.16 20.3 4 0.914
10 -0.20 0.80 - 14.3 4 0.998-0.05 0.47 10.2 4 1.000
0.00 042 17.0 6 0.9960.05 0.36 11.7 4 0.9990.10 0.40 7.9 4 0.953
20 -0.20 0.71 - 12.0 4 090-0.05 0.46 12.1 4 0989
0.00 0.37 16.2 6 0,9930.05 0.44 6.5 4 0.9790.10 0.35 7.8 4 0960
40 -0.05 0.43 8.6 4 0.9860.00 0.19 22.8 6 0.9270.05 0.31 11.5 4 0.980
The tuning curves of Fig. 4 are further typical in that from delaying the signal is greater at high masker levels thanoverall they appear narrower in forward masking. For in- at low. This interaction affects the tuning curve because, forstance, for the 40-dB signal, the slope of the high-frequency the tuning curve, masker level covaries with masker frequen-branch of the tuning curve is roughly 190 dB/oct in simulta- cy. For the low-level, on-frequency maskers, the thresholdneous masking, while in forward masking it is near 320 dB/ reduction produced by delaying the signal is small. Thus theoct. The respective slopes for the low-frequency branch of increment in masker level necessary to compensate for thethe tuning curve in simultaneous and forward masking are threshold reduction is small. For the high-level, off-frequen-40 and 45 dB/oct. These values are within the range of val- cy maskers, the threshold reduction produced by delayingues that have been obtained in previous studies. The dispar- the signal is large; thus the corresponding increment inity of tuning in simultaneous and forward masking also ap- masker level is large. The fact that the tuning curves at 2.0-pears to persist at high signal levels, consistent with the data kHz are narrower in forward masking may, therefore, beof Moore and Glasberg (1986). Only the slope of the low- understood in terms of a three-way interaction among thefrequency tail of the forward-masking tuning curve (from effects of masker frequency, masker level, and signal delay.g = - 0.3 to - 0.2) appears to become shallower at these The tuning curves obtained for the 0.5-kHz signal arehigh signal levels. shown in Fig. 5. Unlike the tuning curves for the 2.0-kHz
The disparity between the tuning curves in simulta- signal, these curves fail to evidence any significant differenceneous and forward masking is related to the masker level- in terms of the degree of apparent tuning in simultaneoussigna! delay interaction described earlier. Recall that, at any and forward masking. Unfortunately, there are few compar-given masker frequency, the threshold reduction that results able data in the literature at this low signal frequency. Vog-
170 J. Acoust. Soc. Am., Vol. 83. No. i, January 1988 Robert A. Lutfi: Interpreting forward masking 170

60ol SP'. odB SPL 80 UB SP"
}Do I5cy
A :10 ffi -
a 20 ms
+ 0 ms fi
C0.
in 4emVAA
LA A4.
4.10 ~0 0
-9.3 -8.2, -9.1 0l.0 9.1 0.2 -11.3 -t6.2 -l.1 t9.9l 9.1 9.2 -i9.3 -0.2 -0l.t 0.0 0.1 8I.2
Relative Mosser Frequency, (fm-fs)/fs
FIG. 6. Forward-masked thresholds for signal delays of 5 (circles), 10 (triangles), 20 (squares), and 40 (crosses) ms. Signal frequency is 2000 HZ. The
forward-masking filter functions were derived from the simultaneous-masking filter functions according to Eq. (2). Note that the filter functions and
corresponding thresholds for the 10-, 20-, and 40-ms delays have been shifted downward ( number ofdB indicated to the right of each function ) to improve
visible separation.
ten ( 1978b ) reports tuning curves at 0.5 and 2.0 kHz for one D. Filter functions and tuning curves as a function ofsubject. This subject's data agree with the present data inas- signal delay
much as the difference in tuning between simultaneous andforward masking was much less apparent for the 0.5-kHz To further test the generality of Eq. (2), we have ob-signal. Moore e al. ( 1986) report comparable data from two tained forward-masked thresholds for the 2.0-kHz signal assubjects. One of these subjects showed narrower tuning a function of signal delay. These forward-masked thresholdscures in forward masking at 0.5 kHz, while the other failed are given in Fig. 6. The filter functions drawn through theseto show any difference in tuning, at least within the range of data were derived from the simultaneous-masking filterfrequencies used in the present study. functions and Eq. (2) as before. Table IV gives the corre-
S TABLE IV. Parameters A and (entres) for forward-masking filter functions. Note that the r: value in the right-hand column refers to the proportion of
total anabilhty accounted for in all conditions of the corresponding row.
a
! Signal delay
r
iMasker level t --5 10 20 40 ms rms error
S Subect dB SPL A A 2 "r dB
i JL 80 0.020 - 18.1 0.037 - 19.3 0.075 - 26.7 0.040 - 292 0.931 1.9
S70 0.051 - 11.8 0.077 - 11.8 0.067 - 17.1 0.059 - 224 0,915 2.160 0.09 3.1 0.082 -9.1 0.060 - 12.6 0.060 - 20.2 0.927 1.520.4 0.065 25.5 0.045 - 28.3 0.074 - 35.2 0.671 3.8
DO 10 0.00
70 0-087 - 167 0062 - 21.8 0.021 - -4. 0.2 -1 0.608.1 8.
60 0.066 - 12.0 0.077 - 16.2 0.086 - 16.4 0.106 -20.2 0.840 210
FO 80 0.045 - 18.4 0.032 - 24.7 0.039 - 23.4 0.050 - 29.5 0.805 3.270 0.056 - 14.4 0.025 - 17.0 0.044 - 20.4 0.090 - 19.7 0.914 1.7
60 0.054 - 11.7 0,022 - 16.6 0.027 - 16.0 0.072 - 20.0 0.823 2.1
DD 80 0037 - 11.3 0.045 - 15.8 0.037 - 21.1 0.006 - 28.2 0.864 2.4
70 0.045 - 12.3 0.037 - 16.4 0.652 - 16.3 0.2 39 081 1.8
630 0.041 -6.2 0.035 - &0 0.036 - I0,0 0.040 - 14.7 0,8641 1.6
%lean 80 0.045 -17.2 0.040 - 22.1 0.035 - 24.7 0.050 - 29.8 0.871 2.2
70 0.055 -13.6 0 41 - 16.4 0.057 - 18.1 0.040 - 25.1 0.879 1.7
60 0.065 - 8.6 0.055 - 11.4 0.057 - 12.5 0.067 - 18.8 0.901 1.6
17c d. Acoust. Soc. Am. Volf 10-. 20. N 1 January 1988 Robert A. Lutfi: Interpretng forward maskino 17

sponding values of A and :, and the proportion of variance in one case, these slopes did consistently and signiticantiyaccounted for. Note that the threshold and filter functions deviate from those predicted by the two-parameter fit. Forare shifted downward with each delay to improve visible the 10-ms signal delay, the slopes of the four-parameter fitsseparation. The data described previously for the 5-ms delay on the low-frequency side were generally smaller, rangingare also included for comparison. Individually, the propor- from 36.0 dB for the 60-dB level masker to 0.2 dB for the 80-tion of variance accounted for by the two-parameter fits dB level masker. The corresponding slopes for the two-pa-tends to be lower at longer signal delays. For subject DO, in rameter fits (see Table I) range from 72.0-28.5 dB.particular, the predicted functions account for less than The first panel of Fig. 7 gives examples of tuning curves70% of the total variability in some cases. There were two corresponding to these data. Predictions are shown as dottedfactors that contributed to the lower proportion of variance lines as before. The 35-dB signal in this case was selected toaccounted for individually. First, the range over which be representative of the low-level signals for which tuningmasking could be measured at the long delays was restricted. curves are most frequently reported in the literature. TheConsequently, there were fewer thresholds and the total major effect of increasing signal delay is an overall elevationvariability among thresholds was smaller. Second, at the of the tuning curve accompanied by a shift in the the tip oflong signal delays, the individual off-frequency thresholds the curve (the point at the MMF) to a frequency below thattended to be more variable so that there was greater mea- of the signal. Kidd and Feth ( 1981 ) and Nelson and Frey-surement error. This was most true of subject DO. man (1984) report identical shifts in the tips of tuning
Turning to the mean data, the two-parameter fits ac- curves with increasing delay. In their data, the shift in tips iscount, respectively, for 90%, 88%. and 87% of the variabil- often accompanied by a decrease in the slope of the low-ity in the mean forward-masked ,hresholds at masker levels frequency branch of the tuning curve, as is evident in theof 60-80 dB. In each case, the rms error between the predict- predicted curves of Fig. 7. Nelson and Freyman (1984) re-ed and obtained thresholds is close to 2 dB. The correspond- port that the differences among their tuning curves are large-ing four-parameter fits accounted, respectively, for 96%, ly eliminated if signal level-signal delay combinations are95%, and 94% of the variability. The slopes of the filter selected such that the level of maskers near the tips of thefunctions resulting from the four-parameter fits at the longer curves are equated. When this is done, their tuning curvessignal delays cannot be considered very' reliable given the nearly superimpose. The second panel of Fig. 7 shows tuninglimited number of data points defining each curve. However, curves in which the level of maskers near the tips of the
I I I I 1 I I 1
35 dB SPL Equated Tips
Delaya 5 ms
Cobl 40 mS
-Ja.
•FIG. 7. Left panel: forward-masking" , * ,tuning curves for a 35-dB SPL signal at
o , -" , 'signal delaysof5 (circles) and 40 (tan-
,,gles) ins. The tuning curves were de-, rived from the data of Fig. 6 (see text for
In- ' a details). Dashed lines represent predic-' • tions based on Eq. (2). Right panel: Sig-
G nal level is selected for each signal delay
,"so as to equate masker level near the tisof the tuning curves. The lower of the
) in ,two dashed curves gives the predictiosfor the 5-ms delay; the solid curve isomitted for clarity of presentton.
rin
t . I I I1 I I-9.3 -9.2 -9.1 9.9 0.1 0.2 -0.3 -8.2 -9.1 9.0 9. 97.2
Relative Masker Frequency (fm-fs)/fs
172 J. Acoust. Soc Am . Vol. 83. No. 1. January 1988 Robert A. Lull,: Interpreting forward masking 17g

cur'es has been equaled. For the signal delays of 5 and 40 amount of deca. Ths model'\ predictions ar- zi'eyj .
,ms. the corresponding signal le'els are 40 8 and 32.3 d[" H.C -
SPL. In keeping with the data of Nelson and Freyman(I q84). the differences among these curves are largely re- where .Z is allowed to vary as a free parameter. In the second
duced version, the time decay of maskine is assumed to be constantwith a shift in frequency equal to the shift in the MMF. I nismodel is similar to the two parameter model with the excep-tion that the shift in the MMF was estimated by allowing .
E. Analyses with fewer parameters to vary with the constraint = G - H(2). The variable-A.Earlier data of Luthi ( 1984) were described well by as- model's predictions are given by the relation
suming a A of 0. The value of C was then given as the dB F(g) =H(g+A) + IG-H(A) (5)difference between thresholds in on-frequency (g = 0) for-ward and on-frequency simultaneous masking. Specifically, The results of the regressions for all three models are
S= G - H(0), where, G is the on-frequency, forward- shown in Table V. The proportion of variance accounted for
masked threshold. Substituting into Eq. (2), the earlier by four-parameter fits to the data is included for compari-
model's predictions were given by the relation son. The fixed-parameter model clearly does a poor job ofsummarizing the data. On average, the proportion of vari-ance accounted for is over 18% less than when all four pa-
Note that this model contains no free parameters. In terms of rameters are allowed to vary. The variable-' model does onlyEq. (2), A is a predetermined constant and " is extracted slightly better. On average, the proportion of variance it ac-directly from the data. The fixed-parameter model predicts counts for is 14% less than when all four parameters arethat for a fixed-level masker, the time decay of masking in dB allowed to vary. Only the variable-; model provides a com-is the same for all masker frequencies and is given by the paratively good fit to the data. It misses on average less thandifference G - H(O). 3% of the total variability accounted for by the four-param-
In this section, the earlier model and two modifications eter model. Figure 8 summarizes, for all conditions of thisare applied to the present data. In the first version, the time study, the forward-masked thresholds and the correspond-decay of masking is assumed to be constant as before, but no ing predictions of the variable-) model. The dashed linesspecific relation is assumed between masker level and the correspond to points of equality between the obtained and
TABLE V Parameters for forward masking filter functions resulting from three assumed models (see text for a full explanation) -The regression in each caseS %as performed on the mean data. Bottom rows give the proportion vanance accounted for by each model and the corresponding rms error at each signal
frequency. The regression results for the four-parameter fits are included for comparison. The difference between the a values obtained in simultaneous andforward masking for the four-parameter fit provides an independent estimate of the frequency shift ;.
Model
t Masker level Fixed-parameter Vanable.- Vanable-,. Four-parameterHz ms dB SPL A A = a, - a,
500 5 80 0.000 - 101 0.000 - 8.3 0.045 - 10.1 004570 0.000 - 7.60 0.000 -6 10 -0.005 - 760 004060 0.000 - 510 0.000 - 368 0037 - 5.10 0.05Q50 0.000 - 260 0.000 - 161 0042 - 2.60 -0004W(XY) 5 50 0.000 - 174 0.000 - 157 0.022 - 17.4 0.019
2000 5 80 0.000 - 19g6 0.000 - 18.6 0.052 - 19.6 0.05670 0.000 - 15.6 0.000 - 14.8 0.055 - 15.6 0.06260 0.000 - 11.6 0.000 - 9.75 0.065 - 11.6 006950 0.000 - 760 0.000 - 7.73 0.055 -7.60 0062
10 s0 0000 -22. 0000 -24.0 0.037 - 2.1 0.03070 0.000 - 174 0.000 - 176 0,045 - 1..4 003060 0.000 - 12,7 0000 - 14 1 0.050 - 12 7 0035
20 so 0.000 - 26.9 0000 - 26.3 0.007 - :6.9 005770 0.000 - 21.7 0.000 - 20.3 0.065 - 21.7 0.06660 0.000 - 16.5 0000 - 15.0 0.067 - 16.5 0049
40 80 0.000 - 34 7 0.000 - 324 -0.007 - 34.70 0.000 - 27,7 0000 - 26.4 0.025 - 27.7
60 0.000 -20.7 0000 - 19.1 0.060 - 20.7
500 Proportion of 0.924 0.962 0.960 Q ()2
10(' vanance 0861 0.888 0.968 0 Q17
2000 accounted for 0.616 0.661 0 9 0 Q71
500 rms 2.1 1.5 13 07
1000 error 1.0 09 04 042000 in dB 4,2 3.9 2.0 1 1
173 J Acoust. Soc. Am., Vol 83. No. I. January 1988 Robert A Lutft Interoreting forward masking 173

I I I good. Overall the one-parameter, \anable-.,. model ac-
counts, respectively, for 97%. 97%. and 91 c of the variancedin the forward-masked thresholds for the 0.5-. 10-. ,nd 2.0-r 80 dB
kHz signals. The corresponding rms error is 1.3. 0.4, and 2.0.J+% dB
U- ,70
-n , III. DISCUSSION
,6+ A. The interaction between masker level and signalA 4 delay
. ,, , 50 It has long been known that the time decay of masking isa) 3,- related to the overall level of the masker (Gardner, 1947;L 0 ~ 1 -
. , ^ ,- * ,, Harris et al.. 1951; Plomp, 1964; Zwislocki et al., 1959).,0 o3 " Perhaps, the most comprehensive data on this relation are0 ..-rt a+
_ , ,' ,'" _those of Jesteadt et al. ( 1982). These authors have shownc N , ,t9 , that the family of functions relating signal threshold to sig-
," Delay nal delay at each masker level converge at a common delay.o0 r v+o 5 ms The rate of masking decay is greater at high masker levels0 ,,0 10 ms than at low. Widin and Viemeister (1979.") interpret the
" A 20 ms level-delay interaction to reflect the dependence of masking* 40 ms decay on the overall level of the masker. However, an alter-
,I native interpretation is that the interaction reflects the de-30 40 5 6 70 pendence ofmasking decay on the initial amount of masking
(Moore and Glasberg, 1981 ). In the earlier studies, as wellPredicted Threshold, dB SPL as the study by Jesteadt et al., the overall level of the masker
FIG. 8. Predictions of the variable-A model. Forward-masked thresholds is correlated with the initial amount of masking at someare shown for all conditions of this study. The dashed lines correspond to short delay.points of equality between the obtained and the predicted thresholds. They The data of the present study bear on this issue. For thehave been displaced from one another by 10 dB to allow comparisons at filter function, the initial amount of masking (simultaneouseach masker level (parameter). The different symbols denote the differentsignal delay masker frequencies appear as repeated symbols for each masker masking) decreases with increasing frequency separationlevel and signal delays; combination. For the 5-ms delay. the signal frequen- between signal and masker, but the overall level of the mask-cies were 500 (crosses), 1000 (inverted triangles), and 2000 (squares) Hz. er remains constant. Thus, if masking decay depends on theIn all other cases, the signal frequency is 2000 Hz. initial amount of masking, simultaneous- and forward-
masking filter functions should be nonparallel they shouldthe predicted thresholds. They have been displaced from one be parallel if masking decay depends on the overall level ofanother by 10 dB to allow comparisons at each masker level, the masker. The present data tend to support the conclusionThe different symbols denote signal delay; masker frequen- of Widin and Viemeister that masking decay depends on thecies and signal frequencies appear as repeated symbols for overall level of the masker. Based on their own data, how-each masker level-signal delay combination. The correspon- ever, Moore and Glasberg ( 1981 ) came to the opposite con-dence between the obtained and predicted thresholds is clusion. They show filter functions (their Fig. 8), obtained
Moore and Clasberq (1981) Moore et al. (1987)
S--0 simultA-6 forward
o "'Ie 't FIG. 9. Left panel: simultaneous- (circles)and forward- (tnangles) masked thresholds
0~ from the study of Moore and Glasberg(1981), subject lB. Signal duration is 5 ms.Right panel: simultaneous- and fosward-
amasked thresholds from the study of Moore% A et al. (1987). In each panel, the dashed tine
gives the prediction of the vanabe-A model- --- forA equal to O.
0.8 8.1 0.2 0.3 0.4 0.0 8.2 0.2 0.3 0.4
Notch Width, Af/f
174 J. Acoust. Soc. Am. Vol 83, No. 1. January 1988 Robert A. Lutfi Interpreting forward mask,, '74
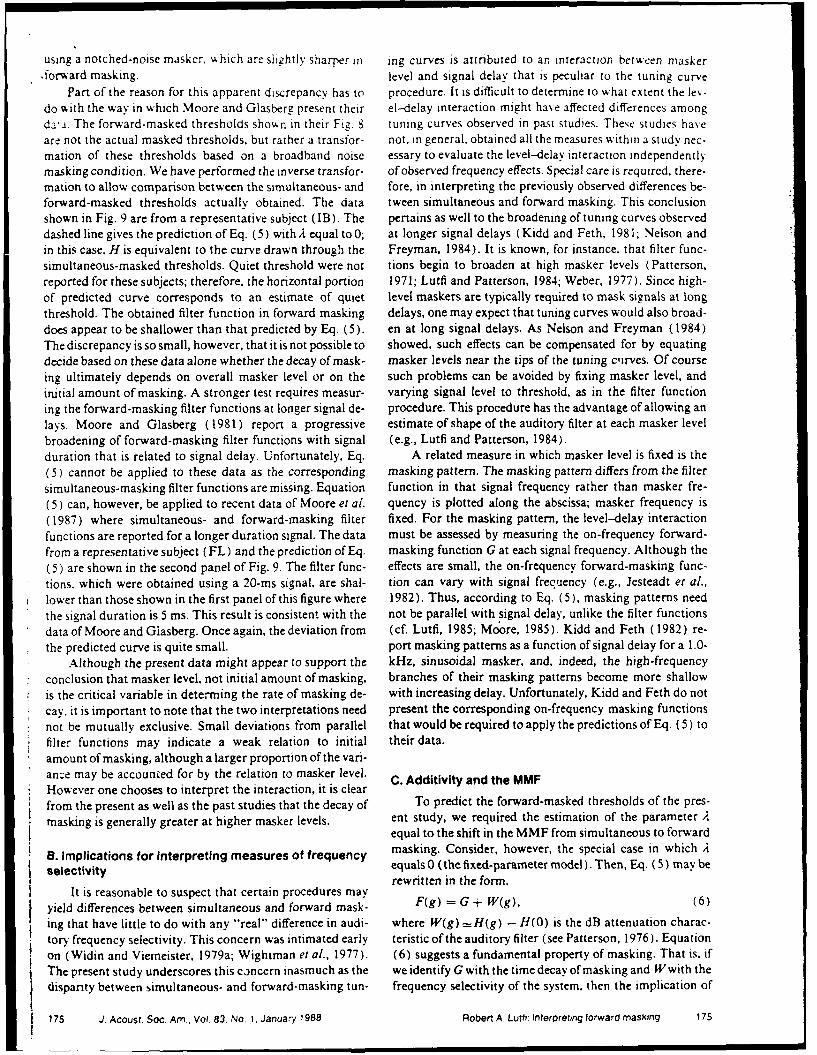
using a notched-noise masker, which are slichtly sharper in ing curves is attributed to an interaction between masker
.forward masking. level and signal delay that is peculiar to the tuning curvePart of the reason for this apparent discrepancy has to procedure. It is difficult to determine to what extent the ev-
do with the way in which Moore and Glasberg present their el-delay interaction might have affected differences amongdy-i. The forward-masked thresholds shown in their Fig. 8 tuning curves observed in past studies. These studies haveare not the actual masked thresholds, but rather a transfor- not, in general, obtained all the measures within a study nec-mation of these thresholds based on a broadband noise essary to evaluate the level-delay interaction independentlymasking condition. We have performed the inverse transfor- of observed frequency effects. Special care is required, there-mation to allow comparison between the simultaneous- and fore, in interpreting the previously observed differences be-forward-masked thresholds actually obtained. The data tween simultaneous and forward masking. This conclusionshown in Fig. 9 are from a representative subject (IB). The pertains as well to the broadening of tuning curves observeddashed line gives the prediction of Eq. (5) with 2 equal to0; at longer signal delays (Kidd and Feth, 1981; Nelson andin this case. H is equivalent to the curve drawn through the Freyman, 1984). It is known, for instance, that filter func-simultaneous-masked thresholds. Quiet threshold were not tions begin to broaden at high masker levels (Patterson,reported for these subjects; therefore, the horizontal portion 1971; Lutfi and Patterson, 1984; Weber, 1977). Since high-of predicted curve corresponds to an estimate of quiet level maskers are typically required to mask signals at longthreshold. The obtained filter function in forward masking delays, one may expect that tuning curves would also broad-does appear to be shallower than that predicted by Eq. (5). en at long signal delays. As Nelson and Freyman (1984)The discrepancy is so small, however, that it is not possible to showed, such effects can be compensated for by equatingdecide based on these data alone whether the decay of mask- masker levels near the tips of the tuning curves. Of courseing ultimately depends on overall masker level or on the such problems can be avoided by fixing masker level, andinitial amount of masking. A stronger test requires measur- varying signal level to threshold, as in the filter functioning the forward-masking filter functions at longer signal de- procedure. This procedure has the advantage of allowing anlays. Moore and Glasberg ( 1981 ) report a progressive estimate of shape of the auditory filter at each masker levelbroadening of forward-masking filter functions with signal (e.g., Lutfi and Patterson, 1984).duration that is related to signal delay. Unfortunately, Eq. A related measure in which masker level is fixed is the(5) cannot be applied to these data as the corresponding masking pattern. The masking pattern differs from the filtersimultaneous-masking filter functions are missing. Equation function in that signal frequency rather than masker fre-(5) can, however, be applied to recent data of Moore er al. quency is plotted along the abscissa; masker frequency is(1987) where simultaneous- and forward-masking filter fixed. For the masking pattern, the level-delay interactionfunctions are reported for a longer duration signal. The data must be assessed by measuring the on-frequency forward-from a representative subject (FL) and the prediction of Eq. masking function G at each signal frequency. Although the(5) are shown in the second panel of Fig. 9. The filter func- effects are small, the on-frequency forward-masking func-tions. which were obtained using a 20-ms signal, are shal- tion can vary with signal frequency (e.g., Jesteadt et al.,lower than those shown in the first panel of this figure where 1982). Thus, according to Eq. (5), masking patterns needthe signal duration is 5 ms. This result is consistent with the not be parallel with signal delay, unlike the filter functionsdata of Moore and Giasberg. Once again, the deviation from (cf. Lutfi, 1985; Moore, 1985). Kidd and Feth (1982) re-the predicted curve is quite small- port masking patterns as a function of signal delay for a 1.0-
Although the present data might appear to support the kHz, sinusoidal masker, and, indeed, the high-frequencyconclusion that masker level, not initial amount of masking, branches of their masking patterns become more shallowis the critical variable in determing the rate of masking de- with increasing delay. Unfortunately, Kidd and Feth do notcay. it is important to note that the two interpretations need present the corresponding on-frequency masking functionsnot be mutually exclusive. Small deviations from parallel that would be required to apply the predictions of Eq. (5) tofilter functions may indicate a weak relation to initial their data.amount of masking, although a larger proportion of the vari-ance may be accounted for by the relation to masker level. C. Additivity and the MMFHowever one chooses to interpret the interaction, it is clearfrom the present as well as the past studies that the decay of To predict the forward-masked thresholds of the pres-
masking is generally greater at higher masker levels. ent study, we required the estimation of the parameter Aequal to the shift in the MMF from simultaneous to forward
8. Implications for interpreting measures of frequency masking. Consider, however, the special case in which Ae t equals 0 (the fixed-parameter model). Then, Eq. (5) may bei seectiityrewritten in the form.
It is reasonable to suspect that certain procedures mayyield differences between simultaneous and forward mask- F(g) = G - W(g), (6)ing that have little to do with any "real" difference in audi- where W(g) =H(g) - H(O) is the dB attenuation charac-tory frequency selectivity. This concern was intimated early teristic of the auditory filter (see Patterson, 1976). Equationon (Widin and Viemeister, 1979a; Wightman et al., 1977). (6) suggests a fundamental property of masking. That is, ifThe present study underscores this concern inasmuch as the we identify G with the time decay of masking and Wwith thedisparity between simultaneous- and forward-masking tun- frequency selectivity of the system, then the implication of
175 J. Acoust Soc. Am., Vol. 83. No. i. januay 1988 Robert A. Lutfi: Interpreting forward masking 175

Eq. (6) is that these two processes are independent and addi- IV. SUMMARYt%,- tadditive, that is. in dB). Of course. as previously The major results of this study can be summarized asshown, the present data are poorly summarized when A is follows: ( 1 ) Simultaneous- and forward-masked thresholdsassumed to be 0. Therefore, the relation implied by Eq. (6) is are described well by parallel filter functions; (2) maximumeither false or some third unrelated factor is responsible for forward masking typically occurs a, a frequency below thatthe shift in the MMF in forward masking, of maximum simultaneous masking: (3) except, perhaps, at
McFadden (1986) has recently reviewed arguments fa- low signal frequencies, forward-masking tuning curves arevoring the latter possibility. The most compelling interpreta- narrower than simultaneous-masking tuning LL'rves, even attion attributes the shift in the MMF to a basalward displace- high signal levels; (4) differences among forward-maskingment of the traveling-wave envelope with increasing tuning curves are largely eliminated when signal-level, sig-stimulus intensity. According to McFadden, when stimulus nal-delay combinations are chosen to equate masker levelsintensity is high, the region maximally "fatigued" along the near the tips of the tuning curves; (5) a single frequency-cochlear partition occurs basal to the region maximally fa- selective function estimated exclusively from the simulta-tigued when stimulus intensity is low. Thus, at high intensi- neous-masked thresholds can be used to predict results ( I )-ties, signals at frequencies above the masker would be ex- (4). The results imply that a single frequency-selective pro-pected to undergo the greatest amount of masking. cess can account for commonly observed differences be-McFadden cites physiological evidence for a basalward dis- tween simultaneous- and forward-masked measures of fre-placement with intensity which lends credence to this inter- quency selectivity.pretation (e.g., Evans, 1977; Rhode, 1978: Russell and Sel-lick, 1978; Sachs and Abbas, 1974). He further argues that ACKNOWLEDGMENTSthe greatest effects should be observed in forward masking, I would like to thank Dr. Frederic L. Wightman, Dr.as in the present study, where certain confounding interac- William A. Yost, Dr. Walt Jesteadt and especially, Dr. Bri-tions between signal and masker are eliminated. Other inter- an C. J. Moore for providing helpful comments on an earlierpretations have been proposed by Vogten (1978b) and Wi- version of the manuscript. Eleni Nicholas assisted in prepar-din and Viemeister (1979b). Vogten describes the shift inthe MMF observed at low stimulus intensities in terms of ing the figures. 1 would also like to thank Dr David M.
tem- Green for bringing the McFadden (1986) article to my at-suppression, while Widin and Viemeister emphasize the im- tention. Some of the data of this article were reported in aportance in forward masking of the short-term spectrum at timely fashion through a collaborative effort with Dr. Danielthe offset of the masker. Of all of these interpretations, only L. Weber. This research was supported by NSF Grant No.Vogten's is clearly inconsistent with the additive relation BNS 83-08498, and, in part, by a grant from the AFOSR.implied by Eq. (6).
'The function H is actually proportional to the integral of the auditory filterD. Individual differences in tuning curves characteristic evaluated over the frequency band of the masker. However,
The decision to average the data of the four subjects in because the frequency band of the masker is relatively small, direct com-parisons between the bandwidths of H and the filter characteristic are per-
each condition of this study was based on the similarity missible.
among the individual filter functions in each condition. Inother words, the thresholds overall did not differ significant- Bacon, S. P., and Moore, B. C. J. (1986). "Temporal effects in masking and
ly across subjects. When the data were replotted as tuning their influence on psychophysical tuning curves," J. Acoust. Soc. Am. 80,curves (constant threshold), however, differences among 1638-1645.subjects were greatly exaggerated, particularly on the high- Bacon, S. P., and Viemeister, N. F. (1985). "Simultaneous masking by gat-
ed and continuous sinusoidal maskers," 1. Acoust. Soc. Am. 78, 1220-frequency side of the tuning curve, and particularly in for- 1230.ward masking. The reason for this is clear. Consider the Barnet, V., and Lewis, T. (1978). Outliers in Statistical Data (Wiley, New
slope values of the masking functions in Table III. The slope York).values are generally quite small for forward maskers with Childers, D., and Durling, A. (1975). Digital Filtering and Signal Process-
ing (West, St. Paul, MN), pp. 437-439.frequencies above that of the signal (g>0). For instance, Cohen, J., and Cohen, P. (1975).Applied Muliple Regression/Correlation
when g = 0.2, the slope of the masking function for the 2.0- Analysis for the Behavioral Sciences (Erlbaum. Hillsdale, NJ).kHz signal presented at the 5-ms delay is only 0.16. This Duifhuis, H. (1976). "Cochlear nonlinearity and second filter: Possiblemeans that a 1.6-dB difference in threshold in this condition mechanism and implications," J. Acoust. Soc. Am. 59, 408-423.
Egan, J. P., and Hake, H. W. (1950). "On the masking pattern of a simplecorresponds to a 10-dB difference in masker level for the auditory stimulus," J. Acoust. Soc. Am. 22, 622-630.
tuning curve. Quite frequently, such small differences in Ehmer, R. H., and Ehmer, B. J. (1969). "Frequency pattern of residualthreshold can be expected to produce rather large differ- masking by pure tones measured on the Bikisy audiometer." 1. Acoust.ences in psychophysical tuning curves. Consequently, spe- Soc. Am. 46, 1445-1448.
Evans, E. F. (1975). "Auditory frequency selectivity and the cochlearcial care may be required in interpreting individual differ- nerve" in Facts and Models in Hearing, edited by E. Zwicker and E. Ter-ences among tuning curves. This is particularly true in hardt (Springer. New York), pp. 118-129.studies where tuning curves are reported for only one or two Evans, E. F. (1977). "Frequency Selectivity at high signal levels of singlesubjects, or where comparisons are made betweenthe tuning units in cochlear nerve and nucleus." in Psychophysics and Physiology of
saearing, edited by E. F. Evans and J. P. Wilson (Academic, Ne, York I,curves of individual normal-hearing and hearing-impaired pp. 185-192.subj..cts. Gardner, M. B. (1947). "Short duration auditory fatigue as a method of
176 J. Acoust. Soc Am .Vol 83. No 1, January 1988 Robert A. Lutfi: Interpreting forward masking 176

classifying heanng impairment." 1. Acoust. So Am. 19. 17S-l90 tuning cur es from intense masking tones Dela'-t:me and probe e %'.
Greenwvood. D. D. (1971). "Aural combination tones and auditory mask- manipulations." J. Acoust. So, Am 75. 1570-15'"
ing." J. Acoust. Soc Am. 50. 502-543. O*Loughlin, B J., and Moore. B C. J. (1981). "Off-frequency li..tening
Hams, J. D., Rawnsley. A. I.. and Kelsey. P (1951). "Studies in short- Effects on psychophysical tuning curves obtained in simultaneous and
duraion auditory fatigue: 1. Frequency differences as a function of iten- forward masking." J Acoust. Sox. Am 69. 1119-I 125
si:-,.' J Exp Psychol 42, 430-436. Patterson. R D. ( 1971 . "'Effect ofamplitude on the auditory fiter shape."
Houtgast. T (1972) "Psychophysical evidence for lateral inhibition in I Acoust Soc. Am. 49, 81.
hearing." I Acoust Soc. Am. 51. 1885-1894. Patterson. R. D (1976). "Auditors filter shapes derived with noise sttmu-
Houtgast. T. (1974) "Lateral suppression in heanng: A psychophysical li."). Acoust. Soc. Am. 59. 64.0-654.
study of the ear's capability to preserve and enhance spectral contrasts." Patterson, R. D.. and Nimmo-Smith. . (1980). "Off-frequency listening
Doctoral dissertation, Academishe Pers. B. V.. Amsterdam. and auditory-filter asymmetry," J. Acoust. Sc. Am. 67. 229-245.
Jesteadt. W. Bacon, S. P.. and Lehman. J. R. (1982). "Forward masking as Plomp, R. (1964). "Rate of decay of auditory sensation," J. Acoust. Soc,
a function of frequency, masker level, and signal delay." 1. Acoust. Soc. Am. 36. 277-282.
Am 71.1)50-962. Rhode, W. S. (1978). "Some observations on cochlear mechanics," J
Jesteadt, W, and Norton. S. J. (1985). "The role ofsuppression in psycho- Acoust. So. Am. 64. 158-176.
physical measures of frequency selectivity." I. Acoust. Soc. Am. 78, 365- Russell, I. J.. and Sellick, P. M. ( 1978). "intracellular studies of hair cells in3".4 the mammalian cochlea." J. Physio!. 284, 261-27 1.
Kiang. N. Y.-S., Watanabe. T., Thomas, E. C., and Clark. L. F. (1965). Sachs, M. B..andAbbas, P.J. (1974)."Rateversus level functions foraudi.
"Discharge patterns of single fibers in the cat's auditory nerve," Res. tory-nerve fibers in cats: Tone-burst stimuli," J. Acoust. Soc. Am. 56.
Monogr. 35 MIT, Cambridge, MA). 1835-1847.
Kidd. G..Jr., andFeth, L. L. (1981). "Patterns ofresidual masking." Hear. Small. A. M. (1959). "Pure tone masking,"J. Acoust. Soc. Am. 31, 1619-
Res. 5, 4Q-67. 1625.
Levitt, H. (1971). "Transformed up-down methods in psychoacoustics," Small, A. M., and Busse. C. (1980). "Psychophysical tuning curves in for-
). Acoust. Soc. Am. 49. 467-477. ward masking," J. Acoust. Soc. Am. Suppl. 1 67, S9.
Lutfi. R. A. (1984). "Predicting frequency selectivity in forward masking Stelmachowtcz. P. G.. and Jesteadt, W. (1984). "Psychophysical tuning
from simultaneous masking." J. Acoust. Soc. Am. 76, 1045-1050. curves in normal-hearing listeners: Test reliablity and probe level ef-
Lutfi. R. A. (1985). "A reply to comments by Moore [J. Acoust. Soc. Am. fects," 1. Speech Hear. Res. 27. 396-402.
78, 253-255 ( 1985) 1." . Acoust. Soc. Am. 78, 255-257. Terry, M.. and Moore, B. C. J. (1977). "Suppression effects in forward
Lutfi, R. A.. and Patterson, R. D. (1984). "On the growth of masking masking," ;. Acoust. Soc. Am. 62. 781-784.
asymmetry with stimulus intensity," . Acoust. Soc. Am. 76, 739-745. Vogten. L. L. M. (1978s). "Simultaneous pure-tone masking. The depend-
McFadden. D. (1986) " The curious half-octave shift: Evidence for a ba- ence of masking asymmetries on intensity," J. Acoust. Soc. Am. 63,
salward migration of the traveling-wave envelope with increasing intensi- 1509-1527.
ty," in Basic and Applied Aspects of.Voise-Jnduced Hearing Loss, edited Vogten, L. L. M. (1978b). "Low-level pure-tone masking: A comparison of
by R. J. Salvi, D. Henderson. R. P. Hamerick, and V. Colletti (Plenum, 'tuning curves' obtained with simultaneous and forward masking," J.
New York). Acoust. Soc. Am. 63, 1520-1529.
Moore, B. C. 1. (1978). "Psychophysical tuning curves measured in simul- Weber, D. L. (1977). "Growth of masking and the auditory filter," 3.
taneous and forward masking." J. Acoust. Soc. Am. 63, 524-532. Acoust. Soc. Am. 62, 424-429.
Moore, B. C. 1. ( 1985). "Comments on 'Predicting frequency selectivity in Weber, D. L. (1983). "Do off-frequency maskers suppress the signal?," J.
forward masking from simultaneous masking' [J. Acoust. Soc. Am. 76, Acoust. Soc. Am. 73, 887-893.
1045-1050 (1984) 1," J. Acoust. Soc. Am. 78, 253-255. Weber. D. L., and Lutfi, R. A. (1986). "The unimportance ofsuppression,"
Moore. B. C. J.. and Glasberg, B. R (1981). "Auditory filter shapes de- in Auditory Frequency Selectivity, edited by B. C. J. Moore and R. D.
ned in simultaneous and forward masking," J. Acoust. Soc. Am. 70, Patterson (Plenum, New York).
1003-1014. Widin, G. P., and Viemeister, N. F. (1979a). "Intensive and temporal ef-
Moore, B. C. J., and Glasberg, B. R. (1986). "Comparisons of frequency fects in pure.tone forward masking," J. Acoust. Soc. Am. 66, 388-395.
selectivitv in simultaneous and forward masking for subjects with unila- Widin, G. P., and Viemeister, N. F. (1979b). "Short-term spectral effects in
teral cochlear impairments," J. Acoust. Soc. Am. 80, 93-107. pure-tone forward masking," J. Acoust. Soc. Am. 66, 396-399.
Moore, B. C. J., Glasberg, B. R., and Roberts, B. (1984). "Refining the Wightman, F. L.,'McGee, T., and Kramer, M. (1977). "Factors influenc-
measurement of psychophysical tuning curves," J. Acoust. Soc. Am. 76, ing frequency selectivity in normal and hearing-impaired listeners," in
1057-1066. Psychophysics and Physiology of Hearing, edited by E. F. Evans and J. P.
Moore. B. C. J.. Poon. W. F., Bacon. S. P., and Glasberg. B. R. (1987). Wilson (Academic, London).
"The temporal course of masking and the auditory filter shape," 3. Zwicker, E., and Jaroszewski, A. (1982). "Inverse frequency dependence
Acoust. Soc. Am. 81, 1873-1880. of simultaneous tone-on-tone masking patterns at low levels," J. Acoust.
Munson. W. A., and Gardner. M. B. (1950). "Loudness patterns: A new Soc. Am. 71, 1508-1512.
approach," J. Acoust. Soc. Am. 22, 177-190. Zwislocki, I., Pirodda, E., and Rubin, H. (1959). "On some post-stimula-
Nelson. D. A., and Freyman. R. L. (1984). "Broadened forward-masked tor'. effects at the threshold of audibility," J. Acoust. Soc. Am. 31, 9-14.
177 J Acoust Soc. Am Vol. 83. No 1. January 1988 Robert A. Lutti lnternretng forward masking 177

Submitted to Hearing Research, April, 1988.
Complex interactions between pairs of forward maskers
Robert A. LutfiWaisman CenterUniversity of WisconsinMadison, Wisconsin 53705
ABSTRACTThe present study was conducted to determine to what extent the combined
effect of two forward maskers can be predicted from addition of their individualeffects. The maskers were 50-Hz wide noise bands with center frequencies rangingfrom 1.8 to 2.2 kHz. The sigr-al was a brief, 2.0-kHz tone burst. When themaskers were gated on and off tzgether, the combination produced sometimes moreand sometimes less masking than predicted depending on the particular pair and therelative amounts of masking procauced by the individual members of the pair. Thegreatest discrepancy occured, however, when the masker pair was presentedsimultaneously with the signal or when the forward maskers were presented insequence. In the latter case, the obtained threshold exceeded the predicted thresholdby as much as 34 dB.
Keywords: Forward masking, additivity
INTRODUCTIONOver the last several years, there has been renewed interest in masking by
pairs of 'equated' maskers; maskers which when presented separately produceequal amounts of masking of a common signal. Early studies revealed that themasking produced by such pairs often exceeds the simple sum of themasking produced by the individual members of the pair (Bilger, 1959; Green,1967; Pollack, 1964). In the sttdy, by Pollack, this excess masking (beyond thatpredicted by simple summation) amounted to as much as 19 dB. The more recentstudies reveal the excess masking effect to be wide spread. Large amounts ofexcess masking have now been obtained for various pairs of sequentialforward maskers (Hanna et al., 1982; Penner, 1980; Penner and Shiffrin, 1980;Widin and Viemeister, 1980), forward and simultaneous maskers (Jesteadt et al.,1982; Jesteadt and Wilke, 1982), forward and backward maskers (Patterson,1971; Penner, 1980; Robinson and Pollack, 1973; Wilson and Carhart, 1971),and pairs of simultaneous maskers (Canahl, 1971; Lutfi, 1983; Moore, 1985;Nelson, 1979; Patterson and Nimmo-Smith, 1980, Zwicker, 1954). Indeed, only pairsof concurrent, forwards maskers have so far been found not to produce any excessmasking (Jesteadt and Wilke, 1982; Neff and Jesteadt, 1983). Such resultschallenge the traditional view of masking which assumes that the effects ofmaskers are additive (Fletcher, 1940; Patterson and Green, 1978). They have leadto a different class of models in which the effects of maskers undergo a

2
compressive nonlinear transformation prior to summation (Penner, 1980; Pennerand Shiffrin, 1980; Lutfi, 1983, 1935).
A strong assumption of these nonlinear models is that the amount of excessmasking depends only on the reiative effects of maskers in the pair, not ontheir particular temporal or spectral configuration (1). The assumption reflectsthe early stage of development cf these models. For instance, a basic differencein excess masking does appear to exist for simultaneous versus nonsimultaneousmasker pairs (cf, Penner, 1980; Lutfi, 1983). There is also the issue as towhy all combinations of equated maskers appear to produce excess masking exceptconcurrent forward maskers. This latter issue seems the more critical since it wouldbe unparsimonious to assert that auditory transduction is nonlinear except in thisone case.
In light of the results for concurrent forward maskers, it seemed appropriateto explore further the effects of these maskers. We began by focusing oncombinations of maskers with frequencies disparate from the signal frequency. Inthe studies by Jesteadt, Neff and Wilke, the effective masker components werealways at or very nearly equal to the signal frequency. We also examined theeffects of varying the relative amounts of masking produced by the individualmaskers in the pair. The pattern of results to emerge from these experimentswas complex. Various maskers combined to produce significant amounts ofexcess masking, no excess masking, or even a release from masking. We nextexamined the masking produced by a pair of simultaneous maskers, a pair ofsequential forward maskers, and a simultaneous-plus-forward masker. The first twopairs produced the largest amounts of excess masking observed in this study, as muchas 34 dB for the pair of sequential forward maskers. In contrast, the effects of thesimultaneous and forward masker when paired were additive. The data are enoughto dishearten those who would propose such elegant models as offered byPenner (1980), Penner and Shiffria (1980), and Lutfi (1983).
I. METHODA. Stimuli
The signal in all conditiors was a 10-ms, 2.0-kHz sinusoid, gated on andoff with 5-ms Kaiser ramps. This ramp produces spectral sidelobes that are morethan 70 dB down from the primary lobe within 20% of the primary lobe centerfrequency (see Childers and Duriing, 1975). The maskers were 200-ms, 50-Hz widenoise bands with variable center frequencies, they were also gated on and offwith 5-ms Kaiser ramps. The long-term, power-spectra of the noise bands hadskirts that fell over 1000 dB/octave near the passband. Three pairs of maskerswere used. The center frequencies of the maskers in each pair were 1.8 and 1.9kHz, 1.9 and 2.1 kHz, and 2.1 and 2.2 kHz. The maskers were gated on and offtogether with the onset of the signal following after a 5-ms silent interval.All stimuli were generated digitally and output through 14-bit DACs. Each maskerwas randomly sampled from a 3-s file on each presentation. The signal andeach masker in the pair were played over separate DACs (10-kHz rate for eachDAC). When only one masker was presented, Os (corresponding to 0 voltage)were output through the DAC otherwise occupied by the second masker. Theoutput of each DAC was low-pass filtered at 4.0 kHz, 120 dB/octave for eachmasker and 96 dB/octave for the signal. After mixing, the stimuli wereamplified and were presented o-er TDH-49 headphones to the right ear ofsubjects seated in a double-wal', IAC sound-attenuated chamber.

3
B. ProcedureSignal thresholds were obtained using a standard, two- interval, forced-
choice adaptive procedure (Levitt, 1971). Each trial block began with the signalabout 15 dB above masked threshold. Signal level decreased after two consecutivecorrect responses, and it increasedi for each incorrect response. The initial valueof the step size was 6 dB; after two reversals in the direction of attenuation, thestep size was changed to 2 dE. The trial sequence ended for each subjectindividually after a total of 18 raversals in signal attenuation had been recorded.The first two reversals were ignored and the levels of the remainingreversals were averaged to obtain a threshold estimate.
The relative amount of masking produced by the individual maskers in eachpair was varied by varying the relative levels of the maskers in the pair. Onemasker was always fixed at 65 dB SPL, while the other varied from 30 to 80 dBSPL in 10 dB steps. An entire masking function (signal threshold versusmasker level) was obtained for a single masker configuration before proceedingto the next. Typically, three masking functions were obtained within each daily2-h session. After a single threshold estimate had been obtained for allconditions of the experiment a replication was performed.
C. SubjectsFour university students were paid at an hourly rate to participate as
listeners in the study. The ages of the subjects ranged between 18 and 23 years.All reported normal hearing and all had at least 10-h previous experience withthe adaptive, two-interval, forced-choice task.
II. RESULTSThe pattern of results was the same for all subjects, therefore the
threshold estimates for each, condition were averaged across subjects andreplication. Fig. 1 gives the masking functions for all three masker pairs. Ineach panel, unfilled circles represent the masking function for the variable-levelmasker presented alone and filled triangles represent the masking function forthe variable-level masker in the presence of the fixed-level masker (vertical barsrepresent one standard error on either side of the mean). The masking producedby the fixed-level masker alone is designated by the dashed line in each panel. Themasking functions for the single variable-level maskers are quite typical of thoseobtained in the past (Egan and Hake, 1950; Vogten, 1978). They have a slope of 1or slightly greater for maskers below the signal frequency, and a slope slightly lessthan one for maskers above the signal frequency.
Assuming simple summation of masking, the amount of masking produced bythe masker pairs should never exceed by more than 3 dB the amount of maskingproduced by the more effective member of the pair. Also, masking by the pairshould never fall below that of the more effective member. Exceptions to bothof these predictions are evident in Fig. 1. For example, when the 1.9 and 2.1-kHzmaskers separately produce equivalent amounts of masking (where the circlesand dashed lines intersect), the amount of masking produced by the pair isabout 10 dB greater than either masker alone. This is equivalent to 7 dB of excessmasking. Excess masking is ev'dent for the other masker pairs as well, althoughthe amount of excess masking is never as large. For all masker pairs, therealso appears to be a release from masking; the pair actually produces less maskingthan the more effective member of the pair. The release from masking is evident inthe left-hand portion of each panel where the masking function for the pair dips

4
below that produced by the fixed-level masker (dashed line). In most cases, therelease from masking amounts to only a few dB, however, at least in one case(fixed 2.2-, variable 2.1-kHz masker) it amounts to over 10 dB.
The overall pattern of results is made more clear in Fig. 2. The dependentvariable in Fig. 2 is the difference between the amount of masking produced bythe pair and the amount of masking produced by the more effective member ofthe pair. This relative amount f masking is plotted as a function of thedifference in the amount of nasking produced by each masker individually.The unfilled circles are from the condition wherein the lower frequency masker wasfixed in level. The filled squares are from the condition wherein the higher frequencymasker was fixed in level. The solid line in the middle of each panel gives theprediction based on simple additi'ity of masking. From Fig. 2 it is possible to seethat excess masking results whenever the individual maskers in the pair produceroughly equivalent amounts of masking. The effect is largest for the 1.9+2.1-kHzpair and is small or nonexistent for the 1.8+1.9-kHz pair. In contrast to the excessmasking, a release from masking results whenever the individual maskers in the pairproduce largely discrepant amounts of masking; again, the largest release frommasking being obtained with the 1.2+2.2-kHz pair.
Fig. 3 shows a similar set of data from a control condition in simultaneousmasking. In this condition, the maskers were identical to the 1.8 and 1.9-kHzmaskers used before, however, the signal was a 2.0-kHz sinusoid which was gatedon and off with the maskers using 5-ms Kaiser ramps as before. These data areconsistent with the data from numerous other studies which have obtained 10 dB ormore excess masking for the combination of two simultaneous maskers (Canahl, 1971;Green, 1967; Lutfi, 1983; Nelaon, 1979; Patterson and Nimmo-Smith, 1980).
III. DISCUSSIONA. Is forward masking additive?
The studies of Jesteadt and Wilke (1982) and Neff and Jesteadt (1983) havesuggested that the effects of concurrent forward maskers are additive. This is animportant result because many other combinations of maskers have so far been shownto produce large nonadditive effects in the form of excess masking. The present datashow that some combinations of concurrent forward maskers can produce nonadditiveeffects, both in the form of excess masking and as a release from masking. In thissection, we consider possible explanations for the apparent discrepancy between thepresent and past results.
Consider first the excess masking. In the present study, significant amounts ofexcess forward masking were obtained only for the 1.9+2.1 and 2.1+2.2-kHz maskerpairs, and then only when the individual maskers in the pair produced nearlyequivalent amounts of masking. We believe that a different factor is responsible forthe excess masking in each case. For the 1.9+2.1-kHz pair, a likely cause is 'off-frequency listening' (Patterson anc Nimmo-Smith, 1980). Because the ear's frequencyresolving power is finite, there is some spread of excitation across auditory frequencychannels. Consequently, the channels providing the best signal-to-noise ratio maysometimes be located off the frequency of the signal, away from that of the masker.This form of off-frequency listenaing is restricted whenever the frequencies of themaskers bracket the signal, as is true for the 1.9+2.1-kHz pair. The result is thatthe effect of such maskers in combination may exceed the simple sum of their effectsin isolation. A different interpretation is required for the 2.1+2.2-kHz pair sincethese maskers do not bracket the signal. In this case, the excess masking could have

resulted from masking by an aural combination band generated at the signalfrequency. This combination band would have been expected to produce significantamounts of masking only when the level of the 2.2-kHz masker was equal to orslightly below the level of the 2.1.kHz masker (Goldstein, 1967; Greenwood, 1971). Asit happens, these are exactly the circumstances under which the excess masking forthis pair is observed.
Consider next the release from masking. At first, one might be inclined toattribute this effect to suppression of the less intense masker by the more intensemasker (Houtgast, 1974). However, there are two reasons why this interpretation isinadequate. First, for at least two of the masker pairs, the masker frequencies seemtoo close to yield measureable suppression effects (see Shannon, 1976.). Second, evenif the less intense masker were completely suppressed, we should not expect theamount of masking to be any less than that of the more intense masker. In otherwords, there should be no release from masking except perhaps in the very rareinstance when the less intense masker produced the greater amount of masking. Amore likely interpretation is that the release from masking reflects the use of a'quality difference cue' between the signal and the masker pair (Moore, 1980; Fastland Bechly, 1981). Moore and others have presented evidence that a brief signalmay be confused as part of the forward masker when, as in the present experiment,the signal and masker share a similar 'pitch-like' quality. Adding a second masker,which itself produces relatively lit.le masking, gives the overall masker a more 'noise-like' quality, thereby lessening the chance of such confusions.
If one accepts the possibility of such confounding influences, then for only onecondition of the present study can the results be safely compared to those of Jesteadtand Wilke (1982), and Neff and Jesteadt (1983). This would be the 1.8+1.9-kHzcondition in which the individual maskers produce nearly equivalent amounts ofmasking. For this condition, the effects of the maskers do appear to be additive; ifnot, the discrepancy is very small. Thus, the data for this condition, at least,appear to be consistent with the previous data using concurrent forward maskers.
B. Excess masking as a failure of waveshape analysis.Barring any confounding interactions between maskers, why is it that only the
effects of concurrent forward maskers appear to be additive? One explanation maybe made in terms of waveshape analysis. First, consider what happens when twononconcurrent forward maskers are combined. When either masker is presented alone,the signal will be detected as a brief pertubation in waveshape at the end of themasker. Adding a second masker, which is separated from the first in time, willproduce a second perturbation ir close temporal proximity to that produced by thesignal. This second perturbation may 'mask', be confused with, or otherwise interferewith that produced by the signal which in turn may result in excess masking. Thesituation is different for concurren. forward maskers. Gating the forward maskers onand off together simply eliminates this second perturbation, and thus, the proposedcause of the excess masking. It is of interest to note that a similar type ofwaveshape analysis has been suggested as the cause of excess simultaneous masking(Lutfi, 1986).
The foregoing analysis is easily tested. If waveshape analysis is responsible forthe excess masking obtained with nonconcurrent maskers, then it should be possibleto both minimize and maximize the excess masking by selecting masker combinationswhich respectively minimize and maximize the difficulty of waveshape analysis. Anadditional experiment was conducted. The signal was a 20-ms, 2.0-kHz sinusoidal

6
burst. The nonconcurrent masker pair was a 200-ms noise band immediately followedby a 20-ms noise band (i.e. the offset of the first noise band corresponded to theonset of the second noise band at the zero voltage points). Both noise bands were50 Hz wide and both were cente-ed at 2.0-kHz. All stimuli were gated on and offas before with 5-ms Kaiser rampc. The levels of the maskers were also selected sothat each individually produced .he same amount of masking. The first panel ofFig. 4 shows the thresholds fcr two subjects when the signal was presentedimmediately following the 20-ms masker. The dashed line gives the predictionassuming additivity of masking. Note from the insert that the masker andsignal+masker waveshapes are clearly discriminable when either masker is presentedalone. When the two maskers are combined, however, the difference in waveshapes ismuch less clear and the signal may be perceived as a continuation of the masker.As much as 34 dB of excess masking is obtained in this condition, a record amountfor the combination of these types of maskers. Perhaps, more interesting is thatwhen the signal is presented simultaneously with the 20-ms masker (second panel),the excess masking is essentially eliminated. In this case, whether the maskers arepresented individually or together, the masker and signal+masker waveshapes arenever particularly easy to discriminate.
C. SummaryRecent models have been successful in describing the masking produced by
various masker pairs based only cn the relative amount of masking produced by eachmember of the pair (Jesteadt, 1D83; Lutfi, 1983, 1985; Penner, 1980; Penner andShiffrin, 1980). The present stuly reveals several exceptions to the predictions ofthese models. The masking produced by pairs of concurrent forward maskers is foundto depend not only on the relative amounts of masking, but, also on the particularcombination of masker frequencies chosen. The pattern of results is complexsuggesting that several different processes may have been involved. Among these areoff-frequency listening, cueing effects, and masking by aural distortion products. Evenwhen such factors can be ruled out, there is still found to be a large discrepancy inthe amount of combined masking produced by equated pairs of concurrent versussequential forward maskers. It may be that many of the results obtained usingcombinations of forward maskers can be accounted for in terms of differences amongstimulus waveshapes.
ACKNOWLEDGEMENTSI would like to thank two anonymous reviewers for comments on an earlier
version of this manuscript. This research was supported by grants from theNational Science Foundation and the Air Force Office of Scientific Research.Some of the data were collected while the author was a postdoctoral student inthe Communicative Disorders Department of Northwestern University.
FOOTNOTE(1) This assumption is contigent upon the condition that the effective components ofthe maskers are separated either in frequency or in time.

7
REFERENCES
Bilger, R.C. (1959). "Additivity of different types of masking," J. Acoust. Soc. Am.31, 1107-1109.
Canahl, J.A. (1971). "Two- versus four-tone masking at 1000 Hz," J. Acoust. Soc.Am. 50, 471-474.
Childers, D. and Durling, A. (1975). Digital Filtering and Signal Processing (West, St.Paul) pp. 437-439.
Egan, J.P. and Hake, H.W. (1950). "On the masking pattern of a simple auditorystimulus," J. Acoust. Soc. A:n. 22, 622-630.
Fastl, H. and Bechly, M. (1981). "Post masking with two maskers: Effects of
bandwidth," J. Acoust. Soc. Am. 69, 1753-1757.
Fletcher, H. (1940). "Auditory patterns," Review of Modern Physics 12, 47-65.
Goldstein, J.L. (1967). "Audtitory nonlinearity," J. Acoust. Soc. Am. 41, 676-689.
Green, D.M. (1967). "Additivity of masking," J. Acoust. Soc. Am. 41, 1517-1525.
Greenwood, D.D. (1971). "Aural combination tones and auditory masking," J. Acoust.Soc. Am. 50, 502-543.
Hanna, T.E., Robinson, D.E., Shiffrin, R.M., and Gilkey, R.H. (1982). "Forwardmasking of diotic and dichotic clicks by noise," J. Acoust. Soc. Am. 72,1171-1177.
Houtgast (1974). "Lateral suppression in hearing: A psychophysical study of the ear'scapability to preserve and enhance spectral contrasts," Doctoral dissertation,Academishe Pers. B.V., Amsterdam.
Jesteadt, W. (1983). "A model of the combined effects of forward and simultaneousmasking," J. Acoust. Soc. Am. 73, S91.
Jesteadt, W., Weber, D.L. and Wilke, S. (1982). "Interaction of simultaneous andforward masking for maskers and signals differing in frequency," J. Acoust. Soc.Am. Suppl. 71, S72.
Jesteadt, W., Wilke, S. (1982). "L-iteraction of simultaneous and forward masking," J.Acoust. Soc. Am. 71, S72 (A).
Levitt, H. (1971). "Transformed up-down methods in psychoacoustics," J. Acoust. Soc.Am. 49, 467-477.
Lutfi, R.A. (1983). "Additivity of simultaneous masking," J. Acoust.Soc. Am. 73,262-267.
Lutfi, R.A. (1985). "A power-law transformation predicting masking by sounds withcomplex spectra," J. Acoust. Soc. Am. 77, 2128-2135.

8
Lutfi, R.A. (1986). "Two- versus four-tone masking, revisited," J. Acoust. Soc. Am.,80 422-428.
Moore, B.C.J. (1980). "Detection cues in forward masking," in Psychophysical,Physiological and Behaviora Studies in Hearing, edited by G. van den Brinkand F.A. Bilsen (Delft U.P., Delft).
Moore, B.C.J. (1985). "Additivity of simultaneous masking, revisited," J. Acoust. Soc.Am. 78, 488-494.
Neff, D.L. and Jesteadt, W. (1982). "Additivity of forward masking," J. Acoust. Soc.Am. 74, 1695-1701.
Nelson, D.A. (1979). "Two-tone masking and auditory critical bandwidths," Audiology18, 279-306.
Patterson, J.H. (1971). "Additivity of forward and backward masking as a function ofsignal frequency," J. Acoust. Soc. Am. 50, 1123-1125.
Patterson, R.D. and Green, D.M. (1978). "Auditory masking," in Handbook ofPerception, Vol. VI, edited by E.C. Carterette and M.P. Friedman (AcademicPress, New York).
Patterson, R.D. and Nimmo-Smith, I. (1980). "Off-frequency listening and auditory-filter asymmetry," J. Acoust. Soc. Am. 67, 229-245.
Penner, M.J. (1980). "The coding of intensity and the interaction of forward andbackward masking," J. Acoust. Soc. Am. 67, 608-616.
Penner, M.J. and Shiffrin, R.M. (1980). "Nonlinearities in the coding of intensitywithin the context of a temporal summation model," J. Acoust. Soc. Am. 67,617-627.
Pollack, I. (1964). "Interaction of forward and backward masking," J. Aud. Res. 4,63-67.
Robinson, C.E. and Pollack, I. (1973). "Interaction between forward and backwardmasking: A measure of the integration period of the auditory system," J. Acoust.Soc. Am. 53, 1313-1316.
Shannon, R.V. (1976). "Two-tone unmasking and suppression in a forward-maskingsituation," J. Acoust. Soc. Am. 59, 1460-1470.
Vogten, L.L.M. (1978). "Simultaneous pure-tone masking: The dependence of maskingasymmetries on intensity," J. Acoust. Soc. Am. 63, 1509-1527.
Widin, G.P. and Viemeister, N.F. (1980). "Masker interaction in pure-tone forwardmasking," J. Acoust. Soc. Am. 68, 475-479. -4
Wilson, R.H. and Carhart, R. (1971). "Forward and backward masking: Interactionsand additivity," J. Acoust. Soc. Am. 49, 1254-1263.

Zwicker, E. (1954). "Die Verdeckung von Schmallbandgerauschen durch Sinustone,"Acustica 4, 415-420.

10
FIGURE CAPTIONS
Fig. 1 Masking functions for the three pairs of concurrent forward maskers. Unfilledcircles give mean threshalds (4 subjects) in the presence of the variable-levelmasker alone. Vertical bars represent one standard error on either side ofthe mean. The dashed line denotes the threshold in the presence of thefixed-level (65 dB SPL) masker alone. Filled triangles give thresholds whenthe variable- and fixed-!evel maskers are combined.
Fig. 2 The ordinate gives, for each masker pair, the amount of masking above orbelow that produced by the most effective n'ember in the pair. Theabscissa gives the difference in the amount of masking produced by theindividual members of the pair. Unfilled circles denote that the fixed-levelmasker was the lower frequency masker. Filled squares denote that thefixed-level masker was the higher-frequency masker. The solid line in thecenter of each panel gives the prediction based on simple additivity ofmasking.
Fig. 3 Same as Fig. 2, except tie two maskers were presented simultaneously withthe signal.
Fig. 4 Panel A: Signal threshold in the presence of a pair of sequential forwardmaskers is plotted as a function of the threshold in the presence of eithermasker alone (different symbols represent data from two subjects). Thedashed line gives the prediction based on additivity of masking. Panel B:Same as panel A, except the signal was presented simultaneously with thetrialing masker. The insert in each panel shows the waveshapes of thesignal and both maskers combined. The cross-hatched region denotes thesignal.

I I I I 0
IC )
>~U-)
CD 0
CL
CDm
0 10>
L L)
-J
it-
L -
> >
a>
coo
- LA-
0L 09 09 ot 02 oz oz 09 09 ot 02 oz
ildS 8P " -I oL4 5 8 1 d4I 1KUFTS

(N
if M
CD G
CD 0
CD
mZ
E) a
UU
C 0mS
II
CC
aNU
OD*(n0 1
6P xKVE) U>S~ Ul

N L
<EONU
-U4
CDC'-5
0 U 0
<E
9101 90 S
SP 'xioW :a-4 ej rout>1sioWI .unowid

SQ
I I I I
N0
N-N IN l
NL
NC
NXNU
tC1NW
NM
044
N1E
0/- ~ 09 0 00 OIdS~~~ ~ ~~~ 8P'1 (I)a-Li P)SO