Debugging and Profiling - Cornell University Center for ...Debugging: symbolic debugging • Inspect...
45
Debugging and Profiling Aaron Birkland Cornell Center for Advanced Computing Special thanks to the Texas Advanced Computing Center for some slide content.
Transcript of Debugging and Profiling - Cornell University Center for ...Debugging: symbolic debugging • Inspect...

Debugging and Profiling
Aaron Birkland
Cornell Center for Advanced Computing
Special thanks to the Texas Advanced Computing Center for some slide content.

Introduction
Debugging
• Find defects, analyze failures, verify expected program flow.
• Debugger tools: Inspect or modify state of running program, port-mortem analysis of memory dumps.
• Harder in parallel!
Profiling
• Measure performance characteristics, Identify areas for improvement.
• Profiler tools: collect performance measurements of a running program, analyze afterward.
• Harder in parallel!
May 16-17, 2012 www.cac.cornell.edu 2

Background: Compiling/Linking
May 16-17, 2012 www.cac.cornell.edu
.c
compile
.o
exe
link
.so
Create machine instructions, static data, symbols (function/variable names)
Resolve symbols from external libs.
.a
static dynamic
3
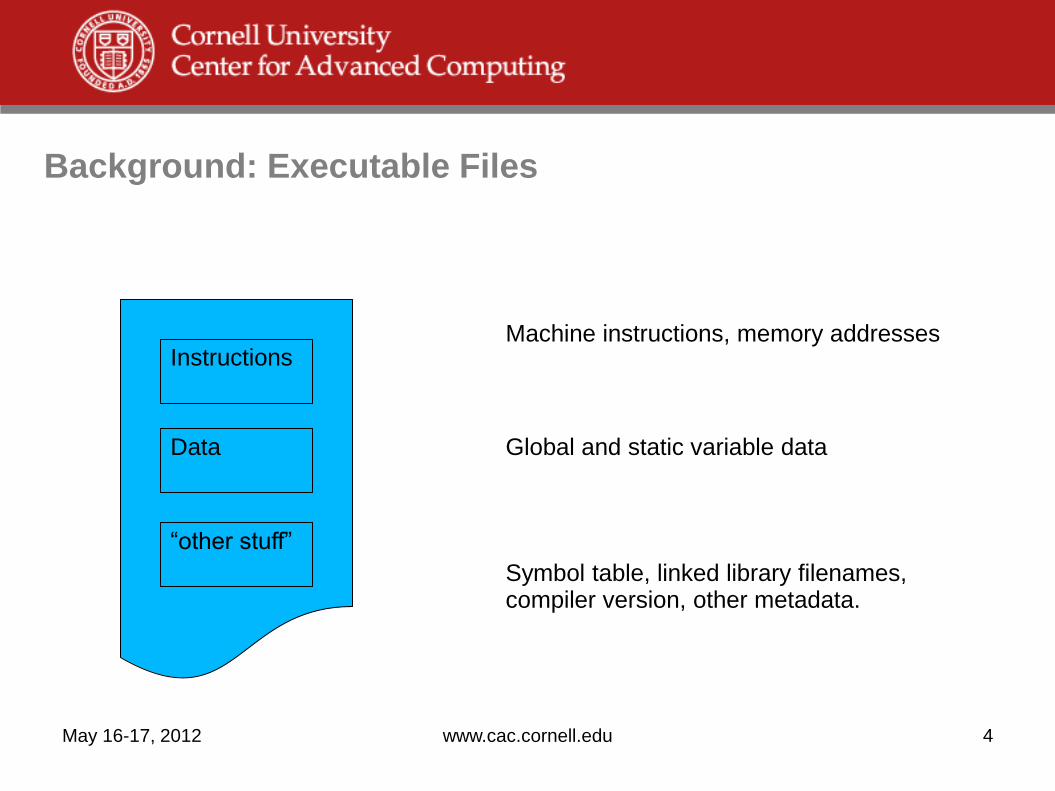
Background: Executable Files
May 16-17, 2012 www.cac.cornell.edu
Instructions
Data
“other stuff”
Machine instructions, memory addresses
Global and static variable data
Symbol table, linked library filenames, compiler version, other metadata.
4
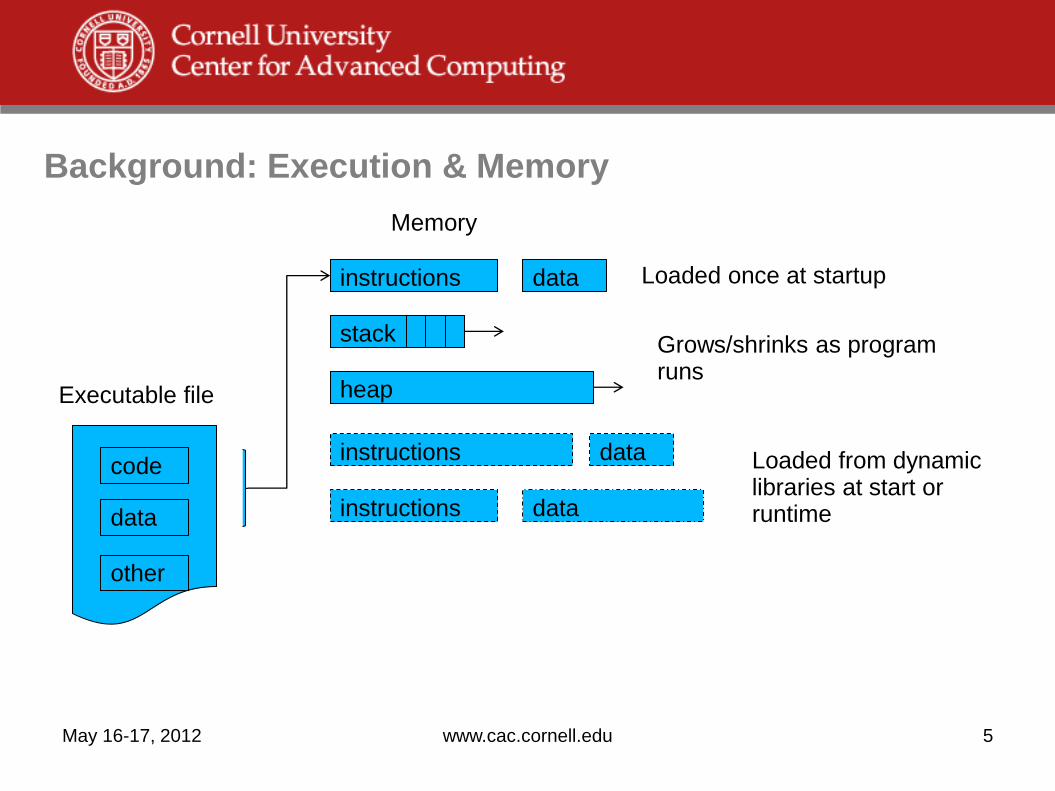
Background: Execution & Memory
May 16-17, 2012 www.cac.cornell.edu
code
data
other
instructions data
stack
heap
instructions data
data instructions
Executable file
Memory
Grows/shrinks as program runs
Loaded from dynamic libraries at start or runtime
Loaded once at startup
5

Background: Execution & Memory
May 16-17, 2012 www.cac.cornell.edu
code
data
other
instructions data
stack
heap
instructions data
data instructions
Executable file
Memory
Instruction and static data allocated at load time Static data initialized to a certain value in the code copied from data segment Uninitialized static data allocated and initialized to Zero Includes instructions and data from statically-linked libraries
6

Background: Execution & Memory
May 16-17, 2012 www.cac.cornell.edu
code
data
other
instructions data
stack
heap
instructions data
data instructions
Executable file
Memory
Stack composed of frames created/destroyed each time a function is called/exited Each frame contains: • All automatic local variables • All arguments passed in • Address of caller’s frame
Frames are added/removed from end of stack only
7
Background: Execution & Memory
May 16-17, 2012 www.cac.cornell.edu
code
data
other
instructions data
stack
heap
instructions data
data instructions
Executable file
Memory
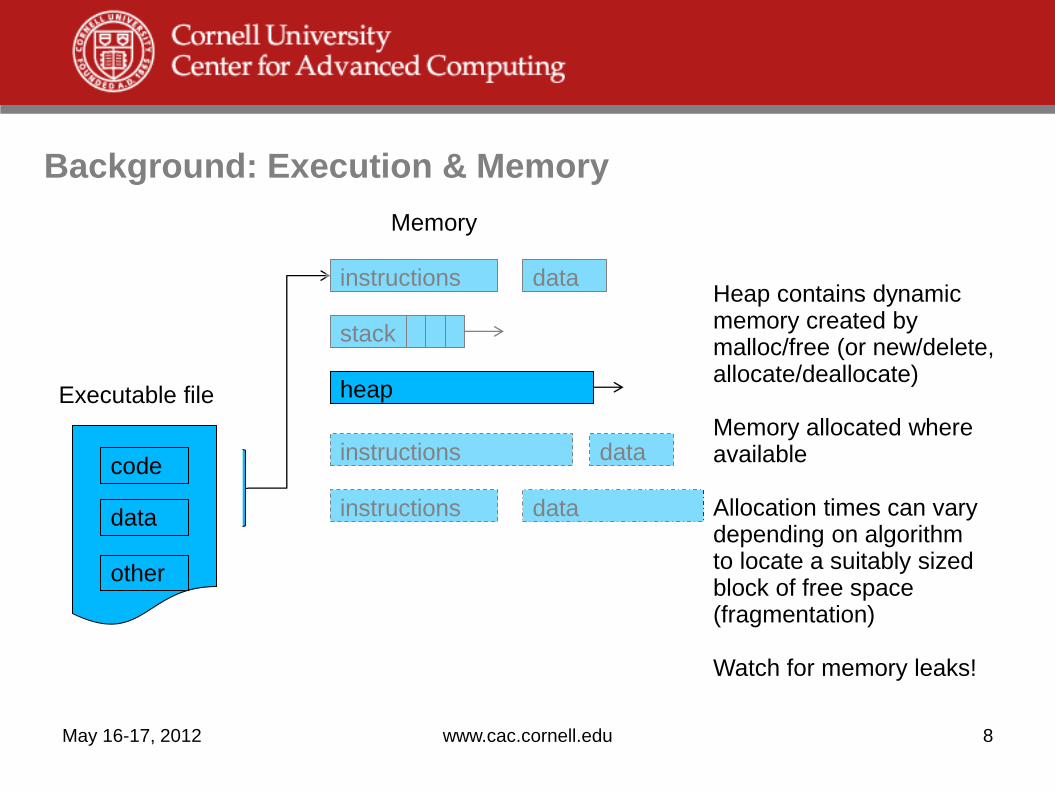
Heap contains dynamic memory created by malloc/free (or new/delete, allocate/deallocate) Memory allocated where available Allocation times can vary depending on algorithm to locate a suitably sized block of free space (fragmentation) Watch for memory leaks!
8

Background: Execution & Memory
May 16-17, 2012 www.cac.cornell.edu
code
data
other
instructions data
stack
heap
instructions data
data instructions
Executable file
Memory
“Other” segments in executable file contain names of dynamic libraries. OS loads these libraries into Memory upon startup Possible to load on demand (e.g. via dlopen/dlsym) Won’t run unless all referenced libraries are present! (undefined symbol)
9
Background: OS and Hardware
• OS can provide API for inspecting and controlling process execution
• Wrap a program at startup or attach to running process
• Example: Linux ptrace()
– Pause execution
– Modify in-memory instructions
– Inspect or modify data memory or registers
– Catch signals and traps
• CPU can provide hardware counters
– Cache hits/misses, TLB hits/misses, FLOPs, etc
May 16-17, 2012 www.cac.cornell.edu 10

Background: Profilers and Debuggers in control
May 16-17, 2012 www.cac.cornell.edu
code
data
other
instructions data
stack
heap
instructions data
data instructions
Executable file
Memory
Profiler or Debugger
Read symbols, metadata
Load alternate libraries
Read or write data, instructions
11

Debugging
• Inspect program state, compare to one’s own assumptions and expectations
– Step through code line by line
– Inspect variables/memory at specific points
– Inspect memory and call stack after a crash
• For MPI, OpenMP ‘state’ gets more complex
– Many remote processes with own memory
– Message status and timing
– Step through individual processes or thread independent of rest (while others may still be running!)
May 16-17, 2012 www.cac.cornell.edu 12
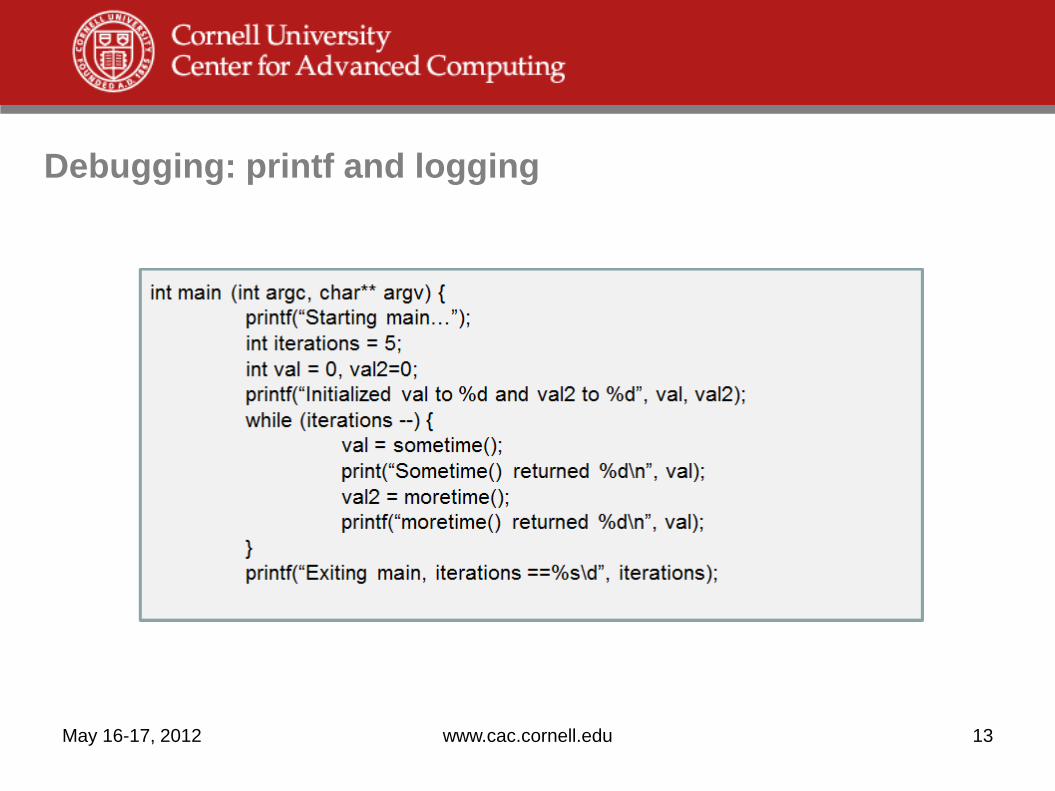
Debugging: printf and logging
May 16-17, 2012 www.cac.cornell.edu 13

Debugging: printf and logging
• Easy and intuitive
– Target specific sections of code, under specific conditions
– Simply analyze log(s) after execution, even for parallel or multithreaded jobs
– Great for rare/transient or timing related bugs
• Invasive and messy
– Need to re-compile when logging statement added/removed
– Can slow down execution
– Easy to forget statements are there
– Can be hard to correlate output with statements.
– Jumbled output with threads printing simultaneously
May 16-17, 2012 www.cac.cornell.edu 14
Debugging: printf and logging
• Logging frameworks an improvement over printf (e.g. Log4c)
– Filter by log levels (WARN, INFO, DEBUG)
– Timestamps, formatting, runtime configuration changes
– Control over where/how log is written (console, large file, rolling file, remote server, database, etc)
May 16-17, 2012 www.cac.cornell.edu 15
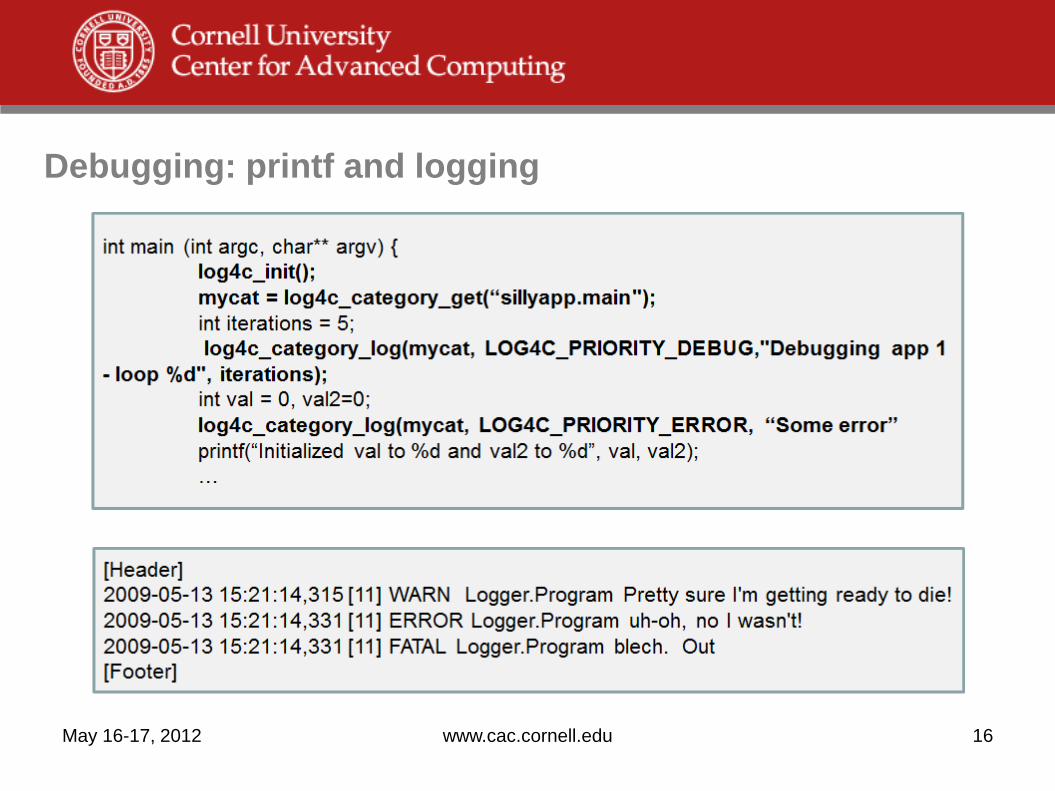
Debugging: printf and logging
May 16-17, 2012 www.cac.cornell.edu 16

Debugging: symbolic debugging
• Inspect process memory, correlate instructions & memory addresses with symbols from source code.
• Compiler option (-g for gcc, intel) tells compiler to store debugging symbols in the executable file
May 16-17, 2012 www.cac.cornell.edu
code
data
other
Human-readable symbols and correlation data stored in one of the “other” segments in an executable file. • Not loaded into memory (no runtime overhead)
• Some compilers MAY disable some optimizations • Available for inspection by debugging tool • Provides a very useful “map” for inspecting core dumps
17

Debugging: symbolic debugging: serial, threaded
May 16-17, 2012 www.cac.cornell.edu
code
data
other
instructions data
stack
heap Executable file
Memory
Read symbols, metadata
Read function call sequence and local variables from stack
Determine location, step through lines of code by manipulating instructions
Read program data from heap
Debugger (e.g. GDB)
18

Debugging: symbolic debugging: serial, threaded
• GDB (Gnu, almost ubiquitous), IDB (Intel)
– Launch a program, analyze a dump, or attach to running process
– Set conditional breakpoints, start/stop execution at will
– Inspect and modify variables
May 16-17, 2012 www.cac.cornell.edu
Analyze a dump: gdb <executable> core.1234 (check ulimit setting for max core file size!)
Attach to process: gdb <executable> 1234
Launch a process: gdb <executable>
19

Debugging: symbolic debugging: GDB
• run – execute the program from beginning.
• backtrace – produce the backtrace from the last fault
• break <line number> or break <function-name> - break at the line number or at the use of the function
• step – step to next line of code (step into function if possible)
• next – step to next line of code (do not step into function)
• print <variable name> - print the value stored by the variable
• continue – run until next break point
May 16-17, 2012 www.cac.cornell.edu 20

Debugging: symbolic debugging
May 16-17, 2012 www.cac.cornell.edu
Source code and execution
Variables
Stack view
Evaluation, expressions
21

Debugging: symbolic debugging: Optimized code
• Aggressive optimizations (e.g. –O3) cause machine instructions to diverge from machine code!
– Loop unrolling, function inlining, instruction re-ordering, optimizing out variables, etc
• Effects: debugger much less predictable
– Setting some breakpoints are impossible (instructions optimized out or moved)
– Variables are optimized out, or appear to change unexpectedly
– Stepping through code follows arbitrary execution order
• Easiest to debug with NO optimizations (-O0)
May 16-17, 2012 www.cac.cornell.edu 22
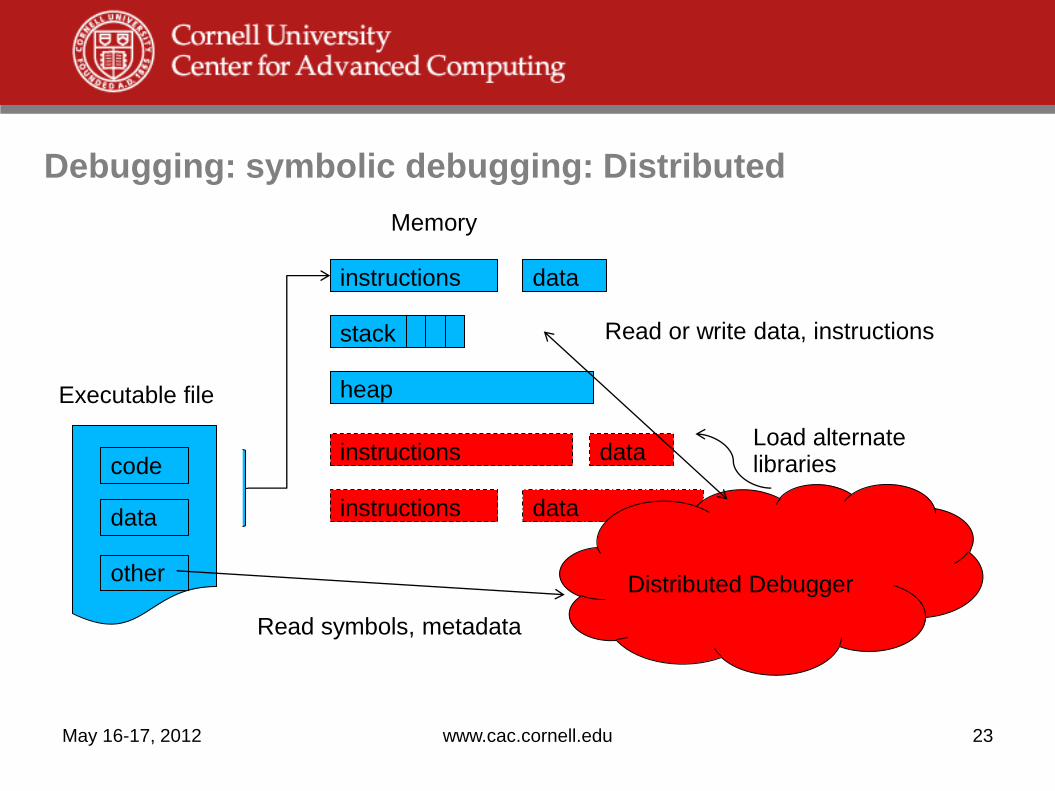
Debugging: symbolic debugging: Distributed
May 16-17, 2012 www.cac.cornell.edu
code
data
other
instructions data
stack
heap
instructions data
data instructions
Executable file
Memory
Distributed Debugger
Read symbols, metadata
Load alternate libraries
Read or write data, instructions
23
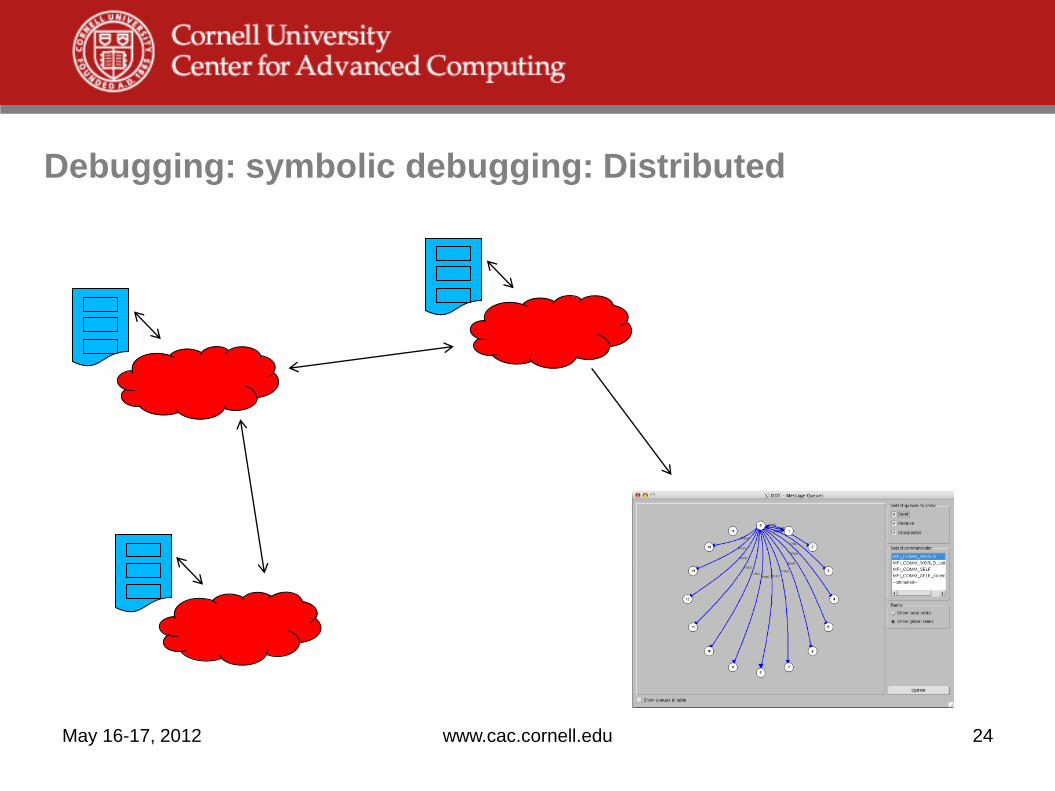
Debugging: symbolic debugging: Distributed
May 16-17, 2012 www.cac.cornell.edu
24

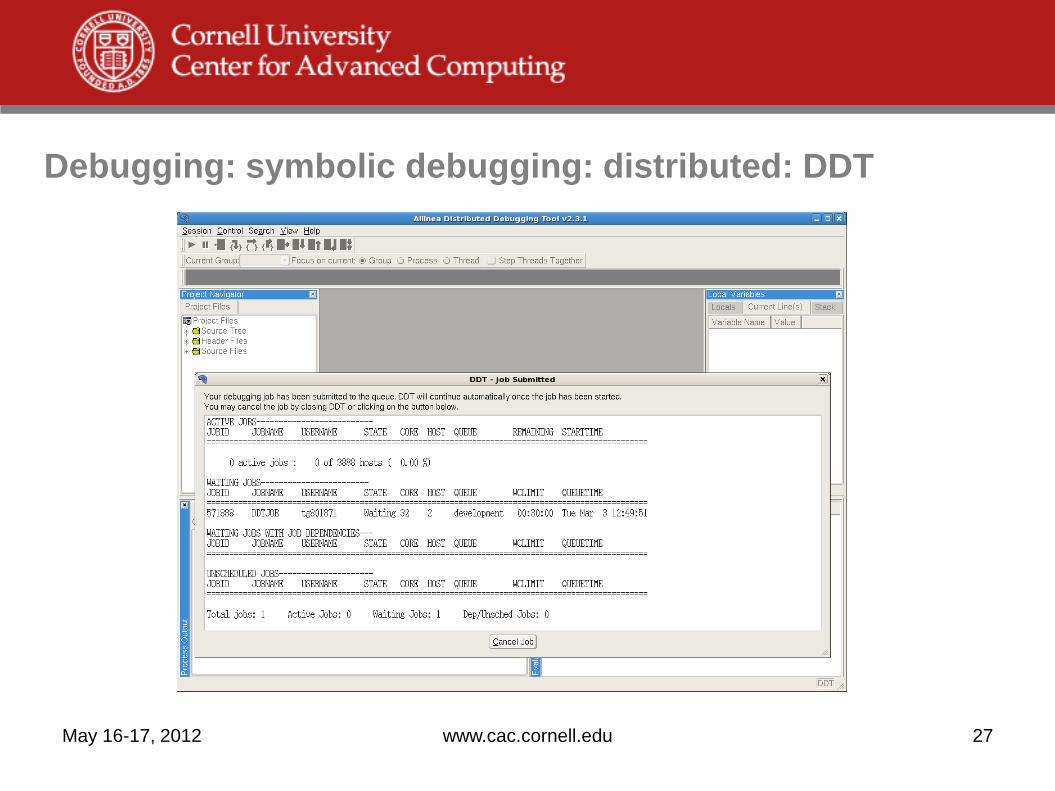
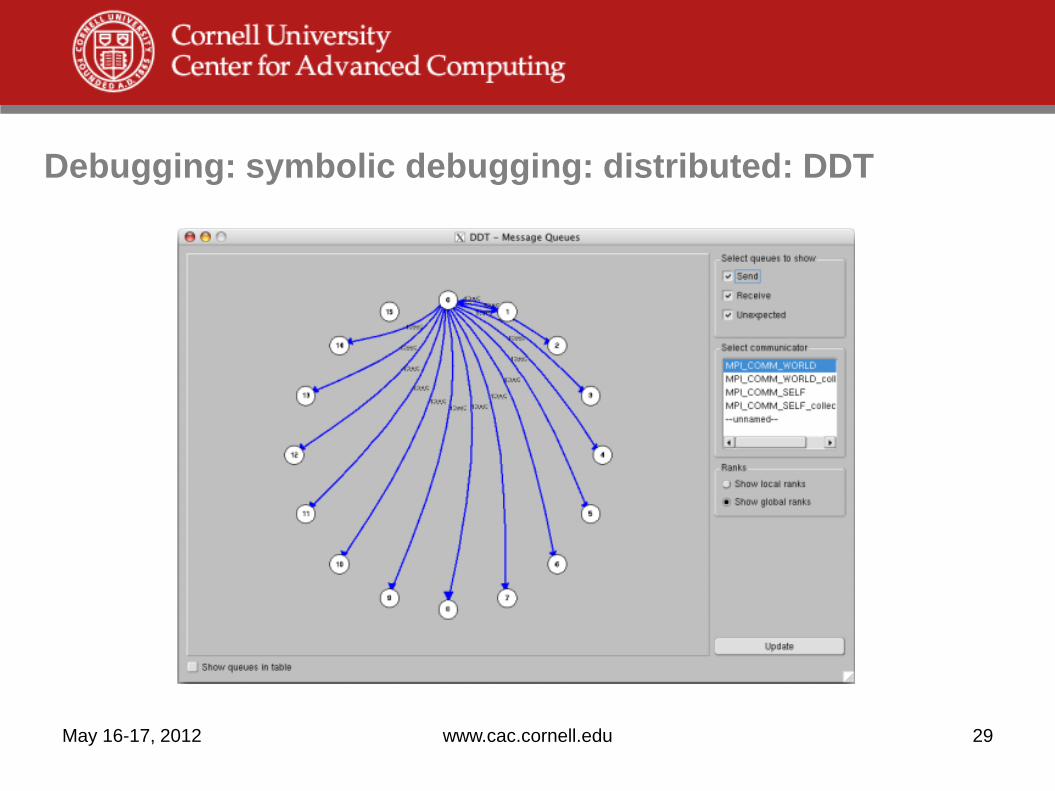
Debugging: symbolic debugging: distributed: DDT
• DDT (Allinea Distributed Debugger Tool)
• Proprietary, GUI-oriented
• Large-scale OpenMP, MPI debugging
– MPI message tracking
– View queues and communication patterns for running procs
– Supports all MPI distributions on Ranger
• Jobs submitted through DDT
– Remember, it needs to “wrap” and control each task
• Usage: Compile with –g, then module load ddt, then ddt <executable> and go from there.
May 16-17, 2012 www.cac.cornell.edu 25

Debugging: symbolic debugging: distributed: DDT
May 16-17, 2012 www.cac.cornell.edu
Add any arguments
Ranger default
Sets number of nodes
Click when ready to submit job
26
Debugging: symbolic debugging: distributed: DDT
May 16-17, 2012 www.cac.cornell.edu 27
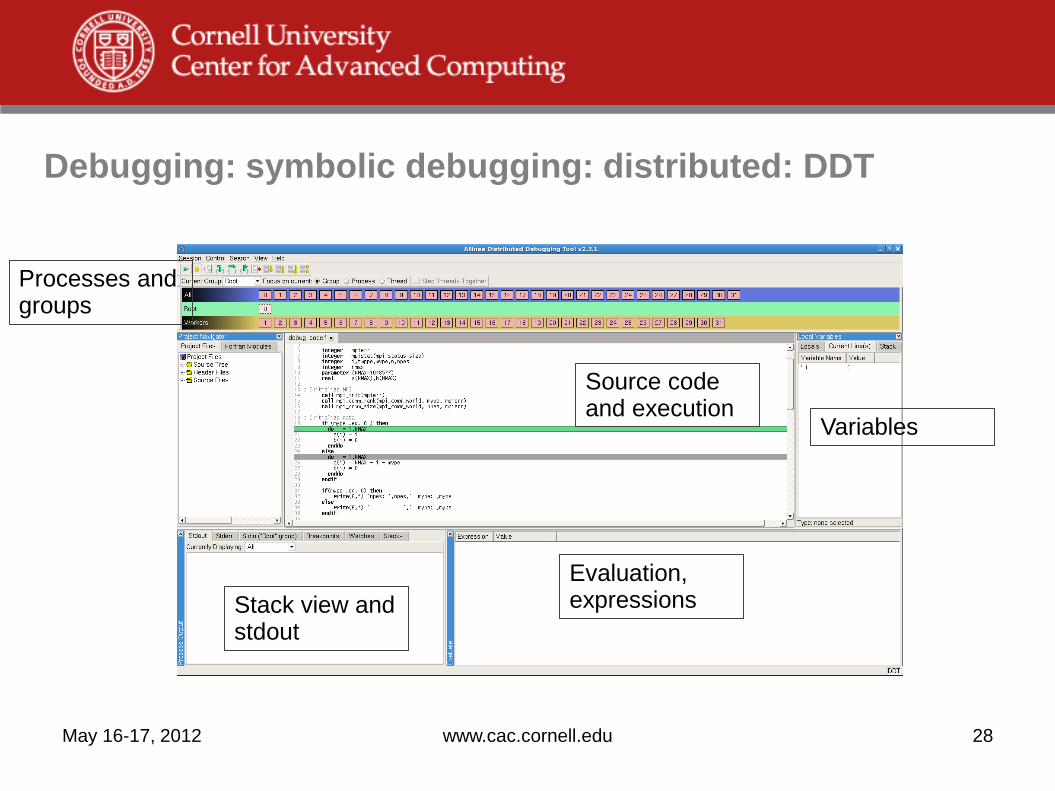
Debugging: symbolic debugging: distributed: DDT
May 16-17, 2012 www.cac.cornell.edu
Source code and execution
Variables
Evaluation, expressions Stack view and
stdout
Processes and groups
28
Debugging: symbolic debugging: distributed: DDT
May 16-17, 2012 www.cac.cornell.edu 29
Profiling
• Measure performance characteristics, identify compute-intensive areas (e.g. “hot spots”) that may be worth improving
• Can suffer from “observer effect” – collecting performance data significantly degrades performance
• Two main approaches: instrumentation and statistical sampling
– Instrumentation: add instructions to collect information (function call duration, number of invocations, etc)
– Sampling: Query state of unmodified executable at regular intervals
May 16-17, 2012 www.cac.cornell.edu 30
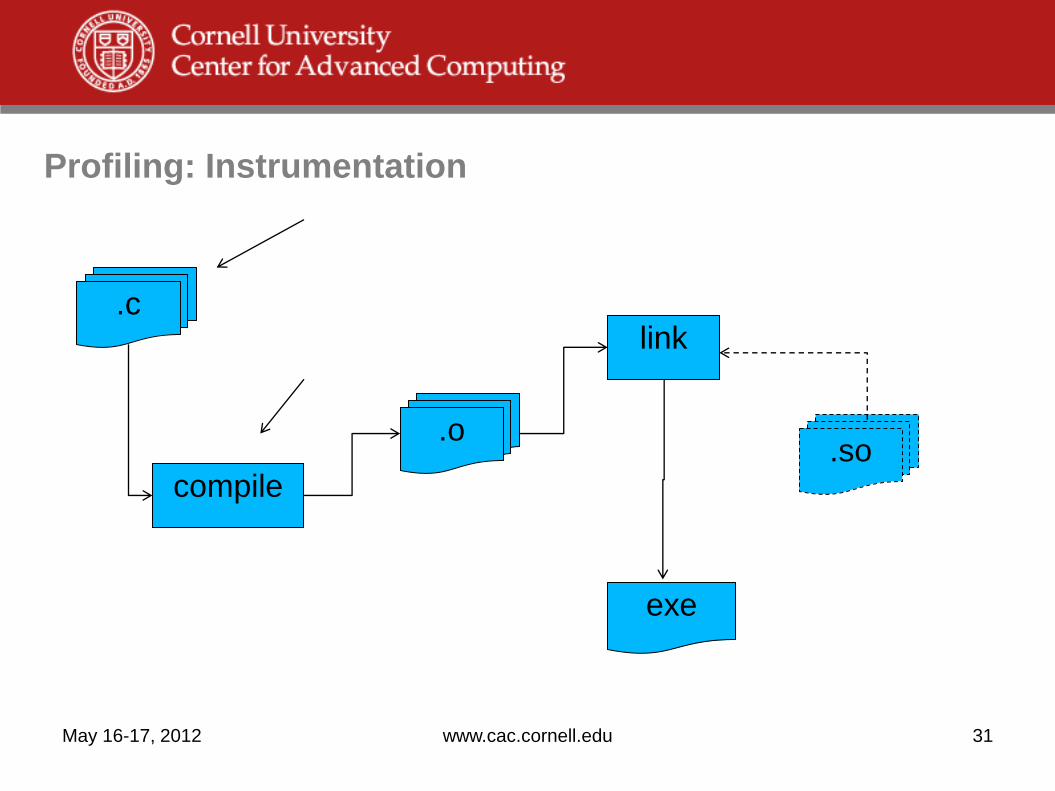
Profiling: Instrumentation
May 16-17, 2012 www.cac.cornell.edu
.c
compile
.o
exe
link
.so
31
Profiling: Instrumentation: printf and timers
• Check system time and printf at appropriate points
– SYSTEM_CLOCK or clock() for fortran, C
• Very simple, great for targeting a specific area.
• Problem: printf statements are expensive, especially if there are many
• Problem: Timer precision and accuracy is system/implementation dependent.
May 16-17, 2012 www.cac.cornell.edu 32

Profiling: Instrumentation: GPROF
• GPROF (GNU profiler)
• Compile option –pg adds debugging symbols and additional data collection symbols
– Slows program down, sometimes significantly
• Each time program is run, output file gmon.out is created containing profiling data
– This data is then analyzed by gprof in a separate step, e.g. gprof <executable> gmon.out > profile.txt
May 16-17, 2012 www.cac.cornell.edu 33
Profiling: Instrumentation: GPROF
• Flat profile
– Lists each function with associated statistics
– CPU time spend, number of times called, etc
– Useful to identify expensive routines
• Call Graph
– Number of times function was called by another, called others
– Gives a sense of relationship between functions
• Annotated Source
– Number of times a line was executed
May 16-17, 2012 www.cac.cornell.edu 34

Profiling: sampling
May 16-17, 2012 www.cac.cornell.edu
code
data
other
instructions data
stack
heap Executable file
Memory
Sampling profiler
Read symbols, metadata
Read execution state from memory
Read hardware counters
35
Profiling: sampling: HPCToolkit, PAPI
• PAPI: Provides access to hardware counters
– API hides gory details of hardware/OS platform
– Cache accesses, hits, misses
– FLOPS
– The kinds of data available depend very much on hardware
• HPCToolkit
– Asynchronous sampling of running processes
– Supports OpenMP, MPI, and hybrid
– Supports running against optimized code
– http://hpctoolkit.org
May 16-17, 2012 www.cac.cornell.edu 36

Profiling: sampling: HPCToolkit
May 16-17, 2012 www.cac.cornell.edu 37
From Xu Liu, John Mellor-Crummey, and Nathan R. Tallen (2012), Analyzing Application Performance Bottlenecks on Intel’s SCC. Presented at TACC-Intel Highly Parallel Computing Symposium, Austin, TX
Profiling: sampling: PerfExpert
• Developed at TACC
• Easy to use interface over data collected via HPCToolkit and PAPI
• Provides suggestions and “what to fix”
• Runs against fully optimized code with debugging symbols
• http://www.tacc.utexas.edu/perfexpert
May 16-17, 2012 www.cac.cornell.edu 38

Profiling: sampling: PerfExpert
May 16-17, 2012 www.cac.cornell.edu 39

Profiling: sampling: PerfExpert
May 16-17, 2012 www.cac.cornell.edu 40
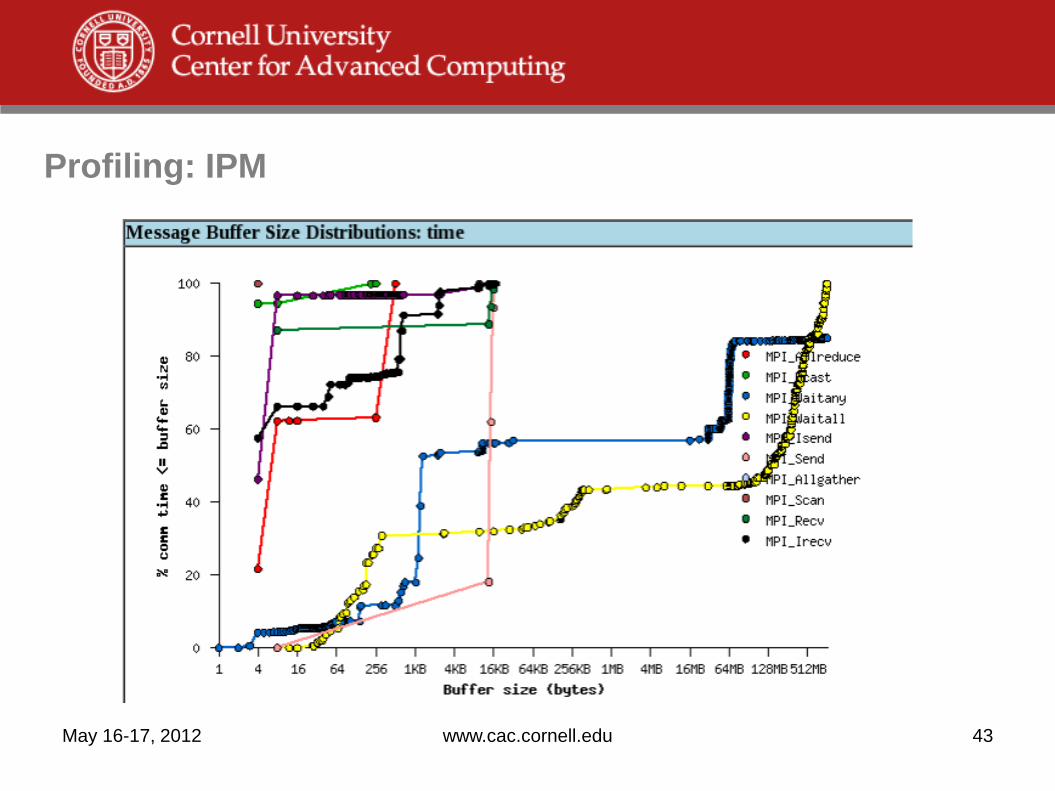
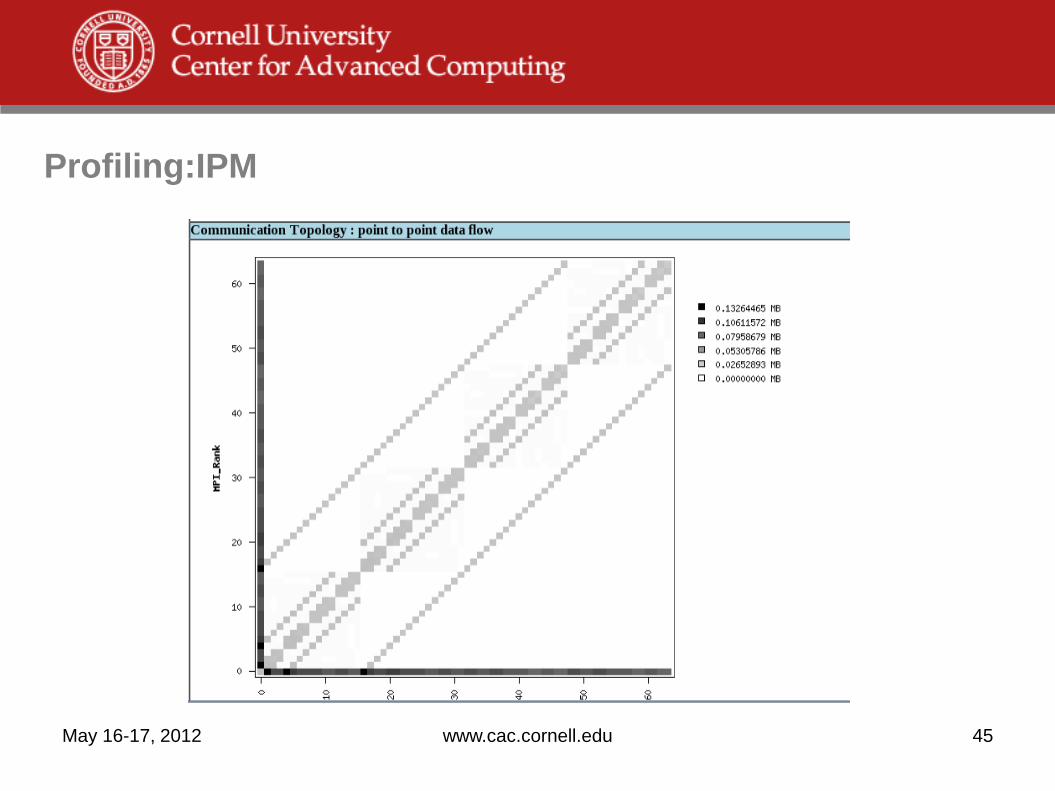
Profiling: IPM
• Integrated Performance Monitoring
• Run against fully optimized code with debugging symbols (-g)
• You need to explicitly pre-load ipm library:
– module load ipm
– export LD_PRELOAD=$TACC_IPM_LIB/libipm.so
– export IPM_REPORT=full
– ibrun <my executable> <my arguments>
• Produces text, html, xml reports of processing and communication statistics
• Very good for quick snapshot of MPI behaviour
• http:/ipm-hpc.sourceforge.net/
May 16-17, 2012 www.cac.cornell.edu 41
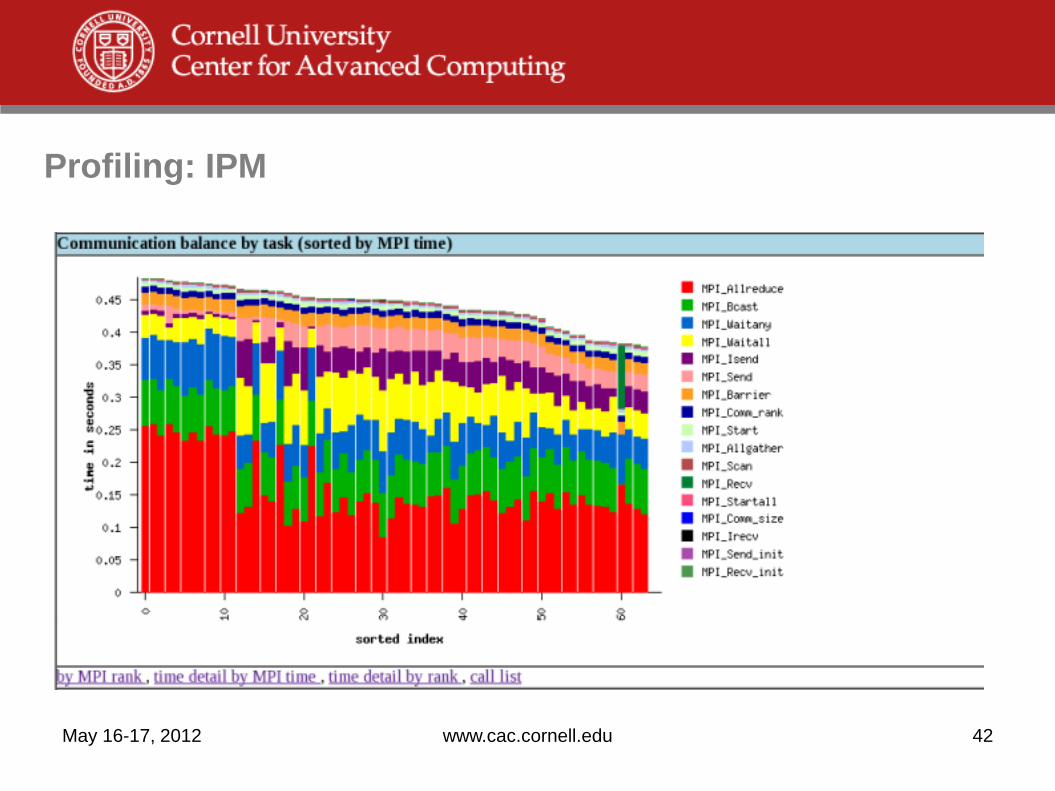
Profiling: IPM
May 16-17, 2012 www.cac.cornell.edu 42
Profiling: IPM
May 16-17, 2012 www.cac.cornell.edu 43

Profiling:IPM
May 16-17, 2012 www.cac.cornell.edu 44
Profiling:IPM
May 16-17, 2012 www.cac.cornell.edu 45