Debt signaling and outside investors in early stage firms
53
Economic Working Paper Series Working Paper No. 1546 Debt signaling and outside investors in early stage firms Mircea Epure and Martí Guasch Updated version: February 2019 (November 2015)
Transcript of Debt signaling and outside investors in early stage firms

Economic Working Paper Series Working Paper No. 1546
Debt signaling and outside investors in early stage firms
Mircea Epure and Martí Guasch
Updated version: February 2019
(November 2015)
Debt Signaling and Outside Investors in Early Stage Firms
Mircea Epure Martí Guasch
Universitat Pompeu Fabra and BGSE Tilburg University
[email protected] [email protected]
February 6, 2019*
Journal of Business Venturing, forthcoming
Abstract
By imposing a market like governance and directing entrepreneurs towards professional
management, debt, and especially business debt, can serve as a reliable signal for outside
equity investors. Such signals of firm accountability can alleviate the stringent information
asymmetry at the early stages of the firm, and become stronger for bank business debt, in the
presence of personal debt, and in high capital industries. Using the Kauffman Firm Survey,
we find evidence consistent with our hypotheses. Outside investors can rely on the
governance role of debt and its underpinnings such as the bank-firm relationship. We also
corroborate that young firms tend to focus on growth rather than profitability.
Keywords: governance; entrepreneurship; financing; information asymmetry; debt; equity
JEL codes: G32, M13, M40
* We thank the Editor, Jonathan Arthurs, three anonymous referees, Mario Daniele Amore, Gavin Cassar, Antonio Dávila, Hans Degryse, Javier Gómez Biscarri, Gaizka Ormazabal, Petya Platikanova, Carlos Serrano, as well as seminar and conference participants at ESADE, Universitat Pompeu Fabra, IE Business School, UB, the Society for Institutional and Organizational Economics, the European Accounting Association, INFORMS International, ERMAS, and the Academy of Management Annual Meeting for useful comments. We thank the Kauffman Foundation for providing access to its Firm Survey and continuous support. This work received support from the Spanish Government through the grants ECO2014-57131-R, ECO2017-85763-R and SEV-2015-0563, and from ACCID. This paper previously circulated with the title “Information Asymmetry Reduction in Opaque Contexts: Evidence from Debt and Outside Equity Financing in Early Stage Firms.” Usual disclaimers apply.

1
1. Introduction
The increasing supply of private equity investments positively affects firm creation,
employment, and aggregate income (Samila and Sorenson, 2011). Attracting external
financing is especially critical for early stage firms, which face different constraints as
compared to incumbent firms (e.g. recurrent cash flows and retained earnings are usually not
available). While debt is the prevalent financing source at the early stages of the firm (Robb
and Robinson, 2014), outside equity injections can be attractive to entrepreneurs due to their
positive impact on firm growth (Croce et al., 2013; Puri and Zarutskie, 2012) and
management practices (Davila and Foster, 2007).
The uniqueness of start-up characteristics and the stringent informational asymmetry in
their context (Arthurs et al., 2009; Cassar, 2004; Cassar et al., 2015) require taking a step
beyond the usual approaches to firm capital structure. In the case of incumbent firms, the
accounting literature indicates that investors may prefer firms with lower debt levels (Caskey
et al., 2012; Jones and Hensher, 2004), while finance studies point to a pre-established order
of financing sources (Myers, 1984). However, in an entrepreneurial context investors face a
higher informational risk, which may magnify the role of early stage financing.
We posit that debt can be a reliable signal for outside equity investors, by alleviating the
information asymmetries that are tightly woven into the expected governance tensions in
entrepreneurial firms. One key tension is that, subsequent to receiving an outside investment,
firms can engage in moral hazard behavior by pursuing private benefits. This largely explains
why equity investors in entrepreneurial firms institute stricter management control systems
(Davila and Foster, 2007). Contrasting with an ex post behavior focus, we propose that
outside investors can attempt to identify early stage firms which already feature governance
mechanisms that help to mitigate potential agency conflicts. Debt, which is usually present at
early stages (Robb and Robinson, 2014), can reduce misaligned incentives by imposing a

2
disciplining governance mechanism (Jensen, 1986). To be effective, such governance should
also direct entrepreneurs towards a more professional market oriented management, rather
than the commonly observed personal management (Bloom et al., 2012).
We thus conjecture that outside investors can rely on the signaling value of debt that is
given by its effective governance role. Foremost, debt enacts a market like governance (David
et al., 2008; Williamson, 1988), with strong implications on firm control (Kochhar, 1996).
The governance of the control rights behind debt can be tied to the monitoring of cash flows
(Jensen, 1986), but can go as far as fully shifting the control of firm management (Grossman
and Hart, 1982), which entails a magnified impact in the case of entrepreneurs. Given the dire
consequences of not repaying debt, this financing source becomes more than a simple
alternative for lifting roadblocks towards firm growth, and acts as a governance mechanism
that raises accountability and can transmit valuable information to outsiders.
Moving beyond the main relationship between debt and outside equity, we uncover
various layers of heterogeneity at firm and industry levels. First, we hypothesize that the
signaling value of the firm’s business debt is higher relative to that of personal debt, which is
granted to the entrepreneur instead of the firm. Business debt is observable in financial
statements and has costlier underpinnings: it entails higher screening and monitoring costs,
and lenders institute an ongoing governance and control mechanism even in times of good
economic prospects (see, e.g., Dey et al., 2016; Triantis and Daniels, 1995). Such arguments
become stronger for bank business debt, as specialized lenders can have additional advantages
based on soft information from an early bank-firm relationship and the active monitoring of
funding sources such as credit lines (Berger et al., 2017; Degryse and Ongena, 2005). Second,
we link the intensity of the debt signal to the interaction between the governance mechanism
instituted through business debt and the unlimited liability of the entrepreneur’s personal debt
with the firm. With high levels of business debt and in the presence of personal debt, the

3
entrepreneur is not only accountable to external constituents who actively monitor firm
activity, but also signals commitment with the firm and thus enhances the reliability of the
signal to outside investors. Third, we hypothesize that the governance role of debt can send a
stronger signal to outside investors in capital intensive industries. Accordingly, lenders can
institute a more effective governance mechanism in capital intensive industries that feature
more reliance on financing needed to scale up their business models (Gompers and Lerner,
2002; Rajan and Zingales, 1995).
We test our theoretical predictions using the Kauffman Firm Survey (KFS), which
provides a panel of US firms that were founded in 2004 as new independent businesses and
tracks them during seven follow-up years. Our empirical strategies account for selection into
outside equity financing, compare similar firms that only differ in debt levels at inception, and
mitigate endogeneity concerns related to confounding factors that could drive debt and equity.
We consistently find a positive relationship between debt and outside equity injections. This
positive association is stronger for business debt and bank business debt. It is also more
pronounced when business and bank business debt are accompanied by personal debt, when
the firm has a bank credit line, and in high capital intensive industries. In granular results, we
show that debt effects are stronger in times of economic distress, when capital providers may
rely more on available signaling. Finally, we uncover real effects by showing that high debt
firms achieve higher growth (but not higher profitability), which is stronger in the case of
business debt and in capital intensive industries.
Our contributions are multifold. We fill a gap in the literature by probing into the
relationship between debt and outside equity at the early stages of the firm. Existing studies
on capital structure largely refer to incumbent firms, perhaps due to their market shares or the
scarcely available data on start-ups (especially from the US). We start from the pervasive
opaqueness of both the entrepreneurial firms and the financing process, and propose a
4
theoretical framework of the governance role of debt which can produce an observable and
costly to reproduce signal on which outside equity investors can rely. The basic premise is
that the presence of lenders can provide informational benefits due to their early stage
screening and especially due to the governance mechanisms they impose. Such market like
governance directs entrepreneurs towards more rigorous management practices, and can help
investors to assess arm’s length equity transactions.
Our framework and empirical results contribute to a vibrant stream of literature that
employs signaling rationales to understand the entrepreneur-investor relationship (e.g. Ahlers
et al., 2015; Arthurs et al., 2009; Baldenius and Meng, 2010; Conti et al., 2013; Davila et al.,
2003; Downes and Heinkel, 1982; Pollock and Gulati, 2007; Islam et al., 2018). We push a
step further the literature on the importance of the early stage capital structure for the
investors’ selection process, in which financial information (e.g. Armstrong et al., 2006;
Hand, 2005) and non-financial information such as owner characteristics (e.g. Baum and
Silverman, 2004; Bernstein et al., 2017; Dimov and Shepherd, 2005; Maxwell et al., 2011)
have been shown to matter. By focusing on the governance mechanisms that debt imposes, we
help to reduce attribution errors that investors can make (Baum and Silverman, 2004). Finally,
we contribute at the intersection of theory and empirics by juxtaposing the roles of the
financing structure and owner characteristics.
Our work also paves the way to implications for entrepreneurs and policy makers. In
managerial implications, we show that entrepreneurs could rely on the governance role of
debt to signal accountability to external constituents through the early stage bank firm
relationship. In policy implications, we discuss that early stage debt can hold a higher
signaling value in more capital intensive industries. In these contexts, there should be fewer
regulatory interventions, as investors can rely more on firm and entrepreneur-level signals. In
contrast, the signal holds a lower value in less capital intensive industries, especially if these
5
are emerging industries, and regulators could strategically consider to intervene, e.g., via
competitive financing programs.
2. Theoretical framework and hypotheses
2.1. Outside equity in early stage firms
Outside investors range from individuals, the so-called business angels (BA), to companies,
government agencies, and institutionalized venture capital (VC) firms. Market based equity
financing, present in fewer firms as compared to debt, is most common in the venture cycle of
US entrepreneurial firms (Gompers and Lerner, 2002) than in other contexts which feature
more bank-dependent financing of entrepreneurship (Colombo and Grilli, 2007; Felix et al.,
2012; Jeng and Wells, 2000). Illustratively, in 1980, the US VC industry invested $610
million in business projects (Puri and Zarutskie 2012), while in 2016, investments amounted
to $61 billion, with a peak of $105 billion in the 2000 dotcom bubble.1 Given the US context
of our study, we examine outside equity investments that are related to the start-up year and
subsequent growth and expansion stages (see, cf., Gompers and Lerner, 2002; Jeng and Wells,
2000). This is consistent with the Kauffman Firm Survey design and Robb and Robinson
(2014), in which the capital structure decisions of new firms are tracked starting with the
founding year for a period that allows for observing investment and growth outcomes from
initial decisions.
Outside equity can be a key financing source, with important implications for the
financing (Chemmanur and Fulghieri, 2013), management practices (Davila and Foster,
2007), and survival and growth (Davila et al., 2003; Puri and Zarutskie, 2012; Croce et al.,
2013) of early stage firms. The debate on the relationship between early stage debt and equity
remains open, mostly due to the opaqueness of both the entrepreneurial firms and the
1 See the 2017 PwC MoneyTree Report on the historical trends in private equity.

6
investors involved in the financing processes. Previous studies find that both non-financial
and financial information can be relevant attributes for investor decisions. First, there is a
general consensus on the importance of intangible attributes such as owner characteristics or
industry expectations in earlier (MacMillan et al., 1987; Fried and Hisrich, 1994; Tyebjee and
Bruno, 1984) or more recent work (Bernstein et al., 2017; Sorensen, 2007; Baum and
Silverman, 2004; Dimov and Shepherd, 2005; Maxwell et al., 2011). Second, financial
information can play a role in outside equity injections. For instance, Armstrong et al. (2006)
study how financial information can explain pre-IPO differences in equity valuations, while
Hand (2005) shows that cash holdings are positively related to equity valuations. Overall,
there appears to be a complementarity between the two types of information, and using the
relevant variables can help to overcome attribution errors that investors have been shown to
make (Baum and Silverman, 2004).
Whereas we analyze the factors influencing investors’ decisions, we will carefully
consider the implications of outside investor presence. In start-up firms there is no clear
separation between ownership, management and control, as many times entrepreneurs engage
in all tasks. Incoming outsiders who hold significant equity may reshape the power
distribution, decision-making and control. For instance, they tend to institute formal
organizational practices related to human resource policies, the adoption of stock option plans
(Hellmann and Puri, 2000) or management control systems (Davila and Foster, 2007). This
could clash with the entrepreneurs’ personal style of managing the business, while a more
market oriented management practice may serve to attract outside investors. We address
related issues in the next section and in setting-up the analysis.

7
2.2. Information asymmetry and the relationship between debt and outside equity
Early stage outside investors face particularly opaque ventures and consequently a high
information risk. Given that they cannot rely on past information or market valuations,
investors must identify reliable information signals of firm characteristics.
If new ventures were to behave similarly to incumbents, the relationship between debt
and outside equity would follow established accounting or finance insights. First, the
accounting literature indicates that high debt could be informative of financial distress
(Caskey et al., 2012; Jones and Hensher, 2004), and thus one would expect early stage debt to
send a negative signal to investors. Second, in corporate finance, the pecking order theory
posits that an incumbent firm may choose to finance operations first through internal
financing and, only after, through debt financing and ultimately, through equity markets
(Myers, 1984). This would imply that firms have unequal willingness and possibilities to
access debt depending on their existing debt levels, and that the preference for a certain
financing source supersedes the potential usefulness of that source to mitigate information
asymmetry problems. Robb and Robinson (2014) document that the pecking order theory may
not apply to start-ups. As we will argue, this can be due to a signaling value in the governance
role of debt that can supersede a pecking order logic.
Signaling theory has been widely used to study the opaque entrepreneur-investor
relationship (Arthurs et al., 2009; Cassar et al., 2015). In an early study, Downes and Heinkel
(1982) show that entrepreneur ownership can positively link to firm value. More recently,
Baldenius and Meng (2010) and Conti et al. (2013) theorize on how signals may lead to
different investor efforts depending on contract and firm characteristics. Their results are in
line with Elitzur and Gavious (2003) who show that the negotiation between entrepreneurs
and investors is a reliable signal of fewer potential moral hazard problems. Arthurs et al.
(2009) argue that the length of pre-IPO lockup periods can be a signal of firm quality, and

8
Pollock and Gulati (2007) link IPO signals to alliance formation. Sanders and Boivie (2004)
highlight governance characteristics as useful signals; Ahlers et al. (2015) point to human and
intellectual capital as uncertainty reduction factors; Davila et al. (2003) state that VC funding
events help to signal the quality of the firm in the labor market; and Islam et al. (2018) show
that research grants are a useful signal for attracting VC funding.
We argue that debt can serve as a signal of an effective governance mechanism to
mitigate information asymmetry between entrepreneurs and investors. Entrepreneurial firms
can generate the debt signal through the joint process of applying for debt and having the
application approved by the lender. Once produced, this signal is credible since it fulfills the
observability and costliness conditions (Connelly et al., 2011; Spence, 2002). First, debt is
observable in the financial statements of the firm. Second, it is costly to produce since its
contracting has to adhere to various conditions, including screening processes and subsequent
monitoring. This enacts the lender as a gatekeeper and ex post monitor, and thus should
ensure that entrepreneurial firms unable to obtain debt—either due to the application process
or failure of committing to contractual conditions—cannot falsely introduce noisy signaling in
the environment. Such characteristics are more common to a separating equilibrium, in which
only willing and able firms can signal through debt, rather than a pooling equilibrium in
which outside investors would not be able to distinguish between entrepreneurial firm types.
The role of debt as an effective governance signal is supported by both agency theory
and transaction cost economics. Jensen (1986) uses agency rationales to argue that debt
disciplines managers’ use of cash flows and generally limits discretion over payout policies.
Williamson (1988) explains through a transaction cost economics perspective that debt
governance is important when assets are redeployable, such as the case of cash, which is key
in entrepreneurial firms that feature less professional management and the pursuit of private
benefits. Examining the two theories together, Kochhar (1996) describes the tensions related

9
to the capital structure of the firm and how debt can ease potential conflicts by imposing an
effective governance with implications on the control rights of the firm. This type of
governance is similar to the management control systems that outside investors tend to impose
after entering entrepreneurial firms (see, e.g., Davila and Foster, 2007). Rather than taking an
ex post view of control instituted by outside investors, we argue that debt can send a valuable
signal to prospective investors that such governance is already in place. In this sense, lender
presence can help investors to assess arm’s length equity transactions due to their early
screening and the effective governance that they institute.
[[Insert Figure 1 about here]]
Figure 1 illustrates the main characteristics of our framework. Once an entrepreneurial
project is transformed into an early stage firm, in the absence of external financing and
control, the potentially conflicting logics between entrepreneurs and investors arise from the
discretionary use of cash flows in the pursuit of private benefits (Kochhar, 1996), and an
overall less professional management (Bloom et al., 2012). By imposing a market type
governance (David et al., 2008; Williamson, 1988), debt raises accountability to external
constituents and enacts a mechanism of monitoring and control of firm cash flows and more
generally firm operations (Jensen, 1986; Kochhar, 1996). Failure to adhere to debt related
obligations can lead to outcomes as dire as losing the control of the firm (Grossman and Hart,
1982); from an entrepreneur perspective, the risk of this extreme outcome can serve as a
powerful disciplining mechanism. Taking all arguments together, we conjecture that given the
governance it imposes, debt can serve to mitigate the severe information asymmetry at the
early stages of the firm by sending valuable signals to prospective investors.
Hypothesis 1: At the early stages of the firm, debt is positively related to outside equity
injections.
10
2.3. The signaling value of debt types
Our baseline hypothesis can be more pronounced depending on the type of debt. The
heterogeneity in debt types and their relationship to firm outcomes has received some
attention in the case of incumbent firms, but this has been less so for the more opaque start-
ups. Even for incumbent firms, the evidence is rather new; for instance, Rauh and Sufi (2010)
and Colla et al. (2013) show that debt heterogeneity matters for capital structure, and more
generally for firm outcomes. For small firms, but not necessarily start-ups, Hall et al. (2004)
and Watson and Wilson (2002) emphasize the importance of screening processes and
monitoring costs that may differ between debt types. Robb and Robinson (2014) are likely the
first to extensively describe the different typologies of debt for start-ups in the US. They show
that bank debt is by and large the most important financing source for start-ups, while Cole
and Sokolyk (2018) indicate that 76% of firms use some type of credit instrument at inception
and argue that business and personal debt are fundamentally different.
The personal versus business debt distinction is relevant to our study in more than one
way. On the one hand, lenders assess personal debt by analyzing the creditworthiness of an
individual and not necessarily the viability of the firm’s prospects. In many cases, lenders
may not know that the loan will be transferred to the funding of a start-up. On the other hand,
business debt is subject to greater scrutiny at contracting stages and more intensive
monitoring and control ex post (Cole and Sokolyk, 2018). Since outside investors are less
interested in the owner’s creditworthiness, but more so in the screening of firm prospects and
the governance that a successful loan granting imposes, business debt encompasses more
valuable informational attributes. In essence, the arguments for our baseline hypothesis,
become stronger in the case of business debt. By imposing a stronger monitoring of firm
activity, business debt can act as a fundamental governance mechanism to deter discretionary
behaviors (Park, 2000). Conversely, the willingness of the entrepreneur to take risk and use

11
personal debt in the early stage firm does not signal the existence of governance or higher
accountability—high personal debt can provide discretion in management and be detrimental
to an effective governance role of debt—but instead can signal commitment to the firm. While
early signaling studies have looked at entrepreneur ownership (Downes and Heinkel, 1982),
the unlimited liability of personal debt brings about a commitment component that can
enhance the signaling mechanism in the governance role of debt.
Within the types of business debt, bank business debt can further strengthen the signal
to outside investors. In a context where hard, quantitative information is scarce, stronger ties
to banks can make debt signals more credible as banks usually access soft information on the
firm (Agarwal and Hauswald, 2010; Degryse and Ongena, 2005), which may well serve not
only for screening but also for instituting effective control mechanisms (Berger et al., 2017).
In this line, David et al. (2008) argue that relational lenders—most common in the case of
early stage firms—can help to resolve liquidity concerns and more closely monitor borrowers
to obtain soft information that can be used for a more active control of the firm. Overall,
banks specialize in monitoring ex post firm behavior not only by imposing tough initial
conditions, but also through a strict governance of debt such as a continuous control and
potential revocation of credit lines (Acharya et al., 2014). Thus, the bank-firm relationship can
serve for mitigating early stage liquidity concerns, and importantly can be a reliable signal to
outside investors of an effective governance that guides firm management.
Taking all arguments together, we believe that business debt, and especially bank
business debt, sends a stronger signal to outside investors. This is so given that its contracting
process is costlier, requires more firm-specific information, and the ex post governance is
supervised by specialized lenders. Moreover, the entrepreneur’s commitment to the firm can
be increased by the presence of personal debt, which although not related to governance
mechanisms, can add an additional layer of reliability towards external constituents.

12
Hypothesis 2a: At the early stages of the firm, business debt, and especially bank
business debt, is positively related to outside equity injections.
Hypothesis 2b: At the early stages of the firm, business debt, and especially bank
business debt, is more positively related to outside equity injections in the presence of
personal debt.
2.4. Capital needs and the signaling value of debt
Connelly et al. (2011) explain that the value of a signal can be stronger or weaker depending
on firm specific factors, but also on factors related to the signaling environment. Given that
information asymmetries and the potentially related problems can vary with the environment,
institutions or industry are potential factors that can influence the usefulness and reliability of
a signal. We focus on the role of the industry in strengthening the value of the debt signal, as
firm capital structure can be related to industry characteristics (MacKay and Phillips, 2005;
Myers, 1984; Scherr et al., 1993). To the extent that debt financing is more relevant in certain
industries, we would expect an industry heterogeneity in the signaling value of debt for
outside investors.
The contracting and use of debt has been shown to have more importance in capital
intensive industries (Jordan et al., 1998), which poses a natural industry classification for the
heterogeneity in the signaling value of debt. Indeed, Titman and Wessels (1988) and Rajan
and Zingales (1995) argue that the reliance on debt financing is key for firms that feature high
levels of tangible assets, a common aspect in high capital intensive industries. Drawing on
these arguments, there are some connected features that affect early stage firms within our
theoretical framework. On the one hand, the governance role of debt described in hypothesis 1
and Figure 1 can be more straightforwardly implemented in capital intensive industries with
easier to evaluate tangible assets. In this line, the presence of tangible assets can facilitate the
13
disciplining of discretionary unaligned behavior (Gompers and Lerner, 2002), which can be
sanctioned more readily through changes in control (Grossman and Hart, 1982). On the other
hand, in high as compared to low capital intensive industries, having contracted debt is key
for achieving growth, one of the main objectives of early stage firms (Carpenter and Petersen,
2002). Specifically, to achieve growth, early stage firms in high capital intensive industries
need to expand their operations by increasing their tangible asset base. This presupposes a
more difficult to scale up business model in the absence of available and well governed
financing, which debt can ensure (Gompers and Lerner, 2002).
Thus, although the governance role of debt can be facilitated by the attributes of firms in
capital intensive industries, its existence is important for potential investors as it more
effectively safeguards the adherence to contractual obligations and a less discretionary
management of the entrepreneurial firm. We believe that, although the environment represents
a relatively underresearched topic within signaling theory (Connelly et al., 2011), industry
heterogeneity in capital requirements adds an important layer to the relationship between
early stage debt and outside equity.
Hypothesis 3: At the early stages of the firm, debt is more positively related to higher
outside equity injections in high (relative to low) capital intensive industries.
3. Data and sample
We conduct our study using the Kauffman Firm Survey (KFS), which provides information
on start-ups founded in 2004 as new independent businesses and are representative of the US
population. The survey tracks 4,928 start-ups from their inception and through seven follow-
up years, and provides information on industry, location, employment, credit scores,

14
financials, as well as detailed demographics of the entrepreneurs. All firms were sampled in
their founding year, thus avoiding left-censoring problems.2
The firm’s legal form is a key feature for potential outside equity injections. The KFS
includes sole proprietorships, limited liability companies (LLC), corporations and
partnerships.3 We discard sole proprietorships and partnerships. First, sole proprietorships are
unincorporated businesses owned by an individual and do not distinguish between the
business and the owner personal income or wealth filings. By definition, there are no outside
investors in sole proprietorships. Second, we also exclude partnerships, a specific type of
business in which an agreement establishes key corporate decisions (e.g. on profits or
ownership). Especially at early stages, these particular conditions can distort arm’s length
private equity transactions that are within the focus of our study (also, only 42 firm-year
observations are partnerships that receive outside investment).
[[Insert Table 1 about here]]
Our final sample consists of 5,619 firm-year observations corresponding to 833 start-
ups in year 2004. Table 1 summarizes the variables, while Appendix Table A1 provides their
detailed definitions; correlations are presented in Table A2.4 For instance, the average levels
of debt and outside equity are $302,364 and $98,222, respectively. In line with previous
literature (e.g. Puri and Zarutskie, 2012), outside equity is concentrated in a small proportion
of start-ups (at the 90th percentile, the value for this variable is 0).5
2 The sampling process started from a Dun & Bradstreet database containing 250,000 businesses that had started operations in 2004 from which a random sample of 32,469 was drawn, and 4,928 responses were recorded in the baseline survey. Dun & Bradstreet provides information on more than 225 million businesses worldwide. For the final sample, businesses were excluded if they had an EIN, had scheduled C income, or had paid taxes prior to 2004 (Robb and Robinson, 2014). 3 Corporations in the KFS include two subcategories: C-corporations (the traditional business that is held legally liable for the actions and debt of the business) and the subchapter S-Corporation (a special type of corporation that, for instance, allows for profits and losses to be passed through shareholders’ personal tax filing). 4 We do not use ratio measures to avoid that accounting rules mechanically and jointly drive debt and outside equity. 5 One related concern could be the presence of convertible debt, which is not given any treatment or importance by Robb and Robinson (2014) and KFS reports. First, if convertible debt were to drive our results, we should find a negative and significant relationship between debt and equity. This would make it more difficult for our estimates to report a positive association between debt and outside equity, and makes our results conservative. Second, we proxy for the existence of convertible debt at the firm-year level by combining KFS questions “F2a. How much of Owner X

15
Several control variables are related to financial and owner characteristics, and the
business form (LLC or corporation type). The median start-up has revenues of $140,000, two
employees, profits of $3,500, and a ROA (profit divided by total assets) of 3.5%. Main owner
characteristics indicate that the median entrepreneur is 47 years old, has been working in the
industry for about 12 years and, whereas the median entrepreneur did not set up a business,
many did. Most entrepreneurs are males (78%) and 88% are born in the US.
4. Empirical strategy
4.1. Heckman two-stage model
Most start-ups do not raise outside equity either because they are not able to attract investors
or because they are not interested in the funds and presence of external investors. These are
two different mechanisms that generate zeros in the outside equity variable.6 Selection models
are especially useful in this context. Outside equity investments are a two-stage process in
which first the start-up either receives or not outside equity, and second, conditional upon
receiving outside equity, the amount is set. In our case, the second “amount equation” is not
strictly random or independent of the first “participation equation” (e.g. firms with certain
levels of revenues and traction may be more prone to raise private funds). Therefore, we use
the Heckman selection model, which allows for dependence between the two equations and
corrects for it when computing the standard errors. The selection (1) and outcome (2)
equations are:
Out_E_Dumi,t = α + β1Ln(Debt)i,t + β2Out_E_Dumi,t-1 + β3Xi,t + β4Zi,t + dt + gi + εi,t (1)
own money did he/she put into the business during the current calendar year?” and “F2b. What percentage of the business did Owner X own on December 31 of the current calendar year?”. The logic is that, if Owner X does not put any money in the business in the current calendar year, but his/her percentage of ownership increases, there is a strong indication of a convertible debt instrument. We identify 50 firm-year observations that take the value of one according to the criteria above. When removing these observations from our analyses, or when controlling for this variable, we obtain similar results. 6 We do not use Tobit regressions, since these assume that the same probability mechanism generates both the zeros and the positive values (Cameron and Trivedi, 2009), which is not true in our context.

16
Ln(Out_E)i,t = α + β1Ln(Debt)i,t + β2Xi,t + β3Zi,t + dt + gi + lit + εi,t (2)
where Out_E_Dumi,t is a binary variable that takes the value of one if firm i receives outside
equity financing at time t, and Ln(Debt)i,t and Ln(Out_E)i,t are the natural logarithms of one
plus the amount of debt and outside equity, respectively, that firm i acquires at time t. Xi,t and
Zi,t include firm and owner characteristics, respectively (see Table 1). We also control for year
(dt), industry (gi) and location (lit) fixed effects. Finally, Out_E_Dumi,t-1 is a binary variable
that takes the value of one if firm i received outside financing in t-1, and zero otherwise. This
variable fulfills the exclusion restriction; thus, it is included only in the selection equation. We
assume that the lagged value of Out_E_Dumi,t is significant in the selection equation
(probability of being invested) but not in the amount equation (having received outside equity
does not drive the amount to invest, which will most probably differ across firms).
We use the Heckman model to determine the main relationships between the variables
of interest, and include a comprehensive set of control variables to address potential omitted
variable problems. However, debt and outside equity could still be subject to simultaneous
causality. In Section 2, we have theoretically analyzed this aspect, and argued for the direction
of the signal from debt to equity. To empirically address this concern, we design a propensity
score matching and further tackle endogeneity through an instrumental variable approach.
4.2. Propensity Score Matching
We use propensity score matching (PSM) to match two groups of start-ups with similar
characteristics at inception (year 2004), but which differ in the level of debt. Matching at
inception is useful to explore both the existence and the use of debt. We obtain two groups:
the treated (high debt) and the control (low debt) groups. The PSM uses the predicted values
from a logit regression to estimate a propensity score:
P(Debt_Dumi | Xi) = F(a + b1Ln(Out_E)i + b2Controlsi) (3)

17
where Debt_Dumi takes the value of one if the start-up has high debt in 2004 (i.e. top quartile
of the debt variable distribution) and zero if the firm has low debt in 2004 (i.e. lower two
quartiles). F(.) is the logistic function that includes predictor variables: Ln(Out_E)i, the natural
logarithm of outside equity plus one, and a series of firm and owner characteristics.
We match each high debt start-up with one control firm using closest neighbor matching
without replacement and requiring exact matching by industry (NAICS 2-digit).7 This process
successfully matches 368 firms (184 in each group), statistically similar on the selected
characteristics. The matching variables are selected using the following criteria. First, we
match by size, since high debt firms may be larger than low debt firms and investors would
not be attracted by the debt signal itself but by size. To avoid this confounding argument, we
include ln(Revenues), ln(Total assets) and number of employees in our matching procedure.
Second, we use ROA as a profitability variable as it could be that financial institutions grant
more loans to more profitable firms, which also attract more outside equity. Third, risk is a
crucial factor for both debt and equity; we mitigate this confounding effect by including credit
risk as a matching variable. Fourth, we match by the initial level of outside equity, as our
PSM strategy is designed to observe differences in outside equity injections over time. Fifth,
since we also analyze the role of debt usage (i.e. asset structure), we match by those variables
that show significant explanatory power in our regressions analyzing outside equity injections
(i.e. Heckman model in Table 2): ln(Cash) and ln(Inventory).
Finally, we include owner characteristics. To choose among the different variables, we
regress the outside equity dummy (having received outside equity) on each of the owner
characteristics variables and four additional models including all owner characteristics
variables and, sequentially and jointly, industry, year and state fixed effects (see Appendix
7 As suggested in Guo and Fraser (2014), we use a caliper width of 0.25*standard deviation of the propensity score variable (i.e. 37,900). Observing that this width does not successfully match all variables (e.g. t-tests between groups for some of the matched variables remain significant at 10%), we progressively reduce the caliper until all matching variables are not significantly different between the two groups (i.e. we finally use a caliper width of 15,000).

18
Table A3). The only variables that consistently show explanatory power for receiving outside
equity across all models are week hours dedicated to the business, previous start-up
experience and education. This evidence goes beyond the PSM matching, and will be
discussed further in the results section.
4.3. Exploring industry heterogeneity and real effects
To study industry heterogeneity in the relationship between debt and outside equity
(hypothesis 3), and explore firm real effects related to the use of debt, we create two splines
for our coefficients of interest for high and low capital intensive industries. We follow the
definition of Acemoglu and Guerrieri (2007), which is based on the same NAICS industry
classification used in the KFS, to classify firms into high and low capital intensive industries.
We run binary and OLS models on the following general specification:
Outcome=α+β1Ln(Debt_HighCap)i,t+β2Ln(Debt_LowCap)i,t+β3Xi,t+β4Zi,t+dt+lit+εi,t (4)
where Outcome is sequentially the outside equity dummy (Out_E_Dum), the outside equity
positive amount (Ln(Out_E>0)), ln(Revenues), market share (the percentage of the firm’s
revenues in the industry-year) and ROA. The coefficients of interest are β1 and β2 which split
the overall coefficient of debt between high and low capital intensive industries. The term
Ln(Debt_HighCap)i,t captures the value of debt when the firm is in a high capital intensive
industry and zero otherwise; while Ln(Debt_LowCap)i,t takes the debt value in low capital
industries and zero otherwise. These two terms cover the complete spectrum of industries. We
are interested in the statistical and economic comparison of these two coefficients, which
reflect whether trends (i.e. positive or negative) and slopes (i.e. magnitudes) are different
depending on industry type. We also treat the debt decompositions (i.e. personal, business,
bank and non-bank) in a similar fashion by creating industry-type splines for each coefficient

19
of interest. Similar to equations (1) and (2), Xi,t includes firm-level characteristics while Zi,t
captures owner characteristics. Year and location fixed effects are also included.
4.4. Robustness checks: reduced sample and instrumental variable approach
For the period 2009-2011, the KFS survey includes a specific question that distinguishes
between start-ups that actively seek outside equity financing and those which do not. This
offers a clear rule for excluding the firms that report zero values in the outside equity variable
due to not seeking outside equity. The survey only contains this question between 2009 and
2011, and thus we use this analysis as a robustness test. For this sample we can assume that
the same probability mechanism generates both zeros (firms which fail to raise outside equity)
and positive values (firms which succeed to raise outside equity), and use a Tobit model.
Next, there could still exist factors that confound the ability to raise both debt and
outside equity. To reduce such endogeneity concerns, we re-estimate our baseline result using
an instrumental variable approach. We use the number of small bank branches per county at
the start of our sample (year 2004) as an instrument for debt and the governance signal within.
First, in line with Degryse and Ongena (2005), we expect bank proximity to have a negative
effect on information asymmetry and facilitate loan granting. Second, lending to start-ups
tends to be higher in regions with more small banks (Berger et al., 2015). Third, as
relationship lenders, small banks are better suited to ensure a governance role of debt, as they
have been shown to have a comparative advantage in using soft information to alleviate the
financial constraints of small businesses (Agarwal and Hauswald, 2010; Berger et al., 2017).
Finally, for the instrument to be valid it should satisfy the exclusion restriction. One
concern could be that if local economic conditions are related to banking competitiveness, the
instrument might also influence the ability of firms to raise outside equity. In this case, the
instrument would be invalid and the coefficients biased. We address this concern by

20
controlling for time-varying state level macroeconomic conditions obtained from the Bureau
of Economic Analysis (GDP per capita and personal income growth) and from the Bureau of
Labor Statistics (unemployment growth).
5. Results
5.1. Heckman two-stage model
Panel A of Table 2 presents the results from incremental specifications for the probability of
receiving outside equity (first-stage selection equation of the Heckman model). We
consistently find that debt and its decomposition into personal and business debt are positively
related to the likelihood of receiving outside equity. The coefficients are largely stable across
specifications, even to the inclusion of owner characteristics. As for the latter, untabulated
coefficients indicate that week hours dedicated to the business, start-up experience and the
level of education are the only owner characteristics that are significant and positively
correlated to the likelihood of attracting outside equity. This is in line with Appendix Table
A3 that explores the relationship between owner characteristics and receiving outside equity.
The identifying variable (the lagged outside equity dummy) is positive and significant,
revealing that having been invested in the previous year has a positive effect on receiving
funds in the current period. Results are consistent across specifications. One salient finding is
that cash is positively related to the likelihood of receiving funds. This can be one of the
information channels for the governance role of debt in early stage firms.
[[Insert Table 2 about here]]
Panel B of Table 2 reports the results of the relationship between debt and the
magnitude of outside equity injections (second-stage outcome equation). The number of
observations is reduced to include start-ups that received outside equity. Results indicate a
positive relationship between debt and outside equity (columns 1, 3 and 5), supporting our

21
hypothesis 1. Next, we show that this main effect is mostly driven by business debt, while
personal debt has an insignificant link to outside equity (columns 2, 4 and 6). To explore
hypothesis 2a in detail, we decompose business debt into bank and non-bank business debt
(the latter includes family, employee or government credit). The results in columns (7) and (8)
show that, among the two types of business debt, bank business debt is significantly and
positively associated to outside equity injections, further supporting our hypothesis 2a. In
addition, the unreported owner characteristics do not show any significant association with the
amount of equity raised. This indicates that owner characteristics may be important
determinants for the decision to invest, but not for the amount invested.
[[Insert Table 3 about here]]
To test hypothesis 2b, we replicate the Heckman model by decomposing the business
debt and bank business debt coefficients between firms that feature personal debt and those
that do not. The results in columns (1-2) and (3-4) of Table 3 largely uphold our hypothesis:
the positive relationship between business, and especially bank business debt and outside
equity injections is stronger in the presence of personal debt. We take a step further and add a
governance intensity layer by identifying firms with active bank credit lines, which occurs for
22% of the observations in our sample. As we have argued, banks are able to better ensure an
effective governance and control, and one channel that allows them to do so is the active
monitoring of credit lines. In columns (5-6) and (7-8) we reveal that having an active credit
line significantly enhances the positive link between bank business debt and outside equity,
and even more so in the presence of personal debt. For all comparisons in Table 3,
untabulated t-tests show that the coefficients of interest are significantly larger than their
counterparts.

22
5.2. Propensity Score Matching
We start by corroborating the effectiveness of the matching procedure. Appendix Table A4
summarizes the 184 matched-paired observations in 2004 resulting from the PSM, as well as
the overall sample in the same period. T-tests confirm that the matching process is successful
as there are no significant differences in any variable across groups, meaning that each paired
observation is equal in all matched dimensions. Table A4 also reports descriptive statistics for
the 2004 sample. The matching goes beyond the selected variables. For instance, other owner
characteristics are also similar between the matched samples even if not included in the
matching (e.g. owner age or industry experience).
Panels A of Figure 2 and Table 4 illustrate debt levels over time for the two matched
groups. After matching in 2004, start-ups first show a certain path dependency, followed by a
converging trend until the financial crisis, when firms seem to stabilize their level of debt. We
are mainly interested in the amount of outside equity that the two types of firms are able to
attract. Panels B of Figure 2 and Table 4 reveal that outside equity injections are significantly
different between high and low debt firms in financial distress times (years 2007 and 2008).
This result upholds hypothesis 1 especially for periods in which capital providers are
constrained, and the debt signal could hold higher value.
[[Insert Figure 2 and Table 4 about here]]
Two factors can drive our PSM results. First, acquiring debt at inception signals
stronger governance mechanisms right from the beginning of firm operations (e.g. lower
discretionary management) and also a lender-firm relationship that could favor future credit
availability. These aspects can be especially valuable for outside investors in crisis periods.
Second, the use of debt through investments that start-ups make in 2005 and 2006, the years
prior to the observed significant difference in outside equity, can serve as information
channels. Table 5 reveals that high debt start-ups show higher values for balance sheet asset

23
items, with more significant differences two years after debt contracting. Accordingly, firms
that acquire more debt at inception have higher levels of cash, inventory and fixed assets,
suggesting that debt is not only contracted but also used. These findings provide support to
the Heckman analysis, especially to the role of cash as an information channel. For
robustness, we redo our PSM analysis by debt category. Matching by business debt, we find
that high business debt start-ups attract more outside equity, especially close to crisis years. In
contrast, matching by personal debt does not reveal any significant results.
[[Insert Table 5 about here]]
Next, we use our matched groups to explore the real effects of debt usage. We track
firm growth (revenues) and profitability (ROA). Panel C of Table 4 shows that high debt
start-ups achieve greater growth relative to low debt ones in 2009-2010, after the documented
outside equity injections. However, growth does not seem to come along with profitability, as
ROA is not statistically different across groups (Panel D of Table 4). It may be that during the
early stages of the firm, profitability is postponed in favor of growth. One important result is
that the credit risk of our matched groups does not differ during the whole analyzed period
(Panel E of Table 4). This measure, that can also be a proxy of firm quality, is less
endogenous as it employs ratings from an exogenous source, Dun & Bradstreet. Over the
entire period, firms in the high and low debt groups appear to be equally able to contract
additional financing; this strengthens our signaling interpretation.
5.3. Industry heterogeneity and real effects
Table 6 reports the results for hypothesis 3 by splitting the coefficients of total debt and its
decompositions into the trends corresponding to high versus low capital intensive industries.
Columns (1) to (3) show that the probabilities of attracting outside equity are positive for all

24
debt types across industries. However, t-tests show that the coefficients for total, business and
bank business debt are larger in high as compared to low capital intensive industries.
[[Insert Table 6 about here]]
The results on the trends between debt and the magnitude of outside equity injections
reveal a clear cut heterogeneity in the differential effects by industry, supporting our
hypothesis 3. We systematically find that the magnitude of the association between debt and
outside equity injections is about two times larger in high with respect to low capital intensive
industries (column 4 in Table 6). This differentially larger effect is also found for business
debt (column 5) and bank business debt (column 6). Indicatively, in high capital intensive
industries, a one standard deviation increase in debt is associated to a 4.3% increase in outside
equity with respect to the average level. For reference, across industries, a one standard
deviation increase in debt is associated to a 2.4% increase in outside equity with respect to the
average level (column 5, Panel B of Table 2). Throughout, t-tests confirm that debt
coefficients are significantly larger in high as compared to low capital intensive industries.
Next, we analyze the link between debt types and firm economic outcomes. First, in line
with the PSM results, we find an overall positive relationship between debt and revenues
(column 1 in Table 7). Exploring the heterogeneity in this result, we find that this positive
effect is mainly driven by business debt (column 3 in Table 7) and is significantly and
economically larger for firms operating in high capital intensive industries (column 4 in Table
7). Second, we analyze the real effects of debt types on market share (the percentage of firm’s
revenues in industry-year, with a mean value of 0.89 and a standard deviation of 4.33). While
there is no overall effect of debt (column 5), there is a strong positive association between
debt and market share in high capital intensive industries (column 6). Decomposing, there is a
positive association between business debt and market share (column 7), which becomes
statistically and economically stronger in high capital intensive industries (column 8). Third,

25
we show that at early stages, these effects of debt related to firm growth, do not materialize in
higher profitability: ROA results (columns 9 to 12) show no significant relationship between
debt and profitability for any debt decomposition across industry types. These results
corroborate our PSM analysis and reveal important heterogeneous real effects by industry
type.
[[Insert Table 7 about here]]
5.4. Robustness: results from reduced sample and instrumental variable approach
First, for 106 observations during 2009-2011, the KFS allows us to identify precisely the
firms that actively seek outside equity investments and were successful or failed in the
process. For this subsample we run Tobit regressions. In untabulated regressions, we find
strong results for the positive relationship between business debt and outside equity injections.
Second, we further tackle endogeneity concerns by replicating our baseline results for
the relationship between debt and outside equity using an instrumental variable approach. In
Table 8, we use the number of small bank branches in each county at the start of our sample
(year 2004) as an instrument for debt and its governance role. Similar to Berger et al. (2017),
we define small banks as those with total assets below $1 billion.8 The complete
specifications include the full set of firm and owner characteristics, as well as time-varying
macroeconomic conditions, and year and industry effects.
[[Insert Table 8 about here]]
The first stage results (columns 1 and 3 in Table 8) confirm the positive and significant
relationship between the instrument and debt. This is in line with the idea that bank proximity
can help to decrease information asymmetry (Degryse and Ongena 2005), and that small
banks are especially suited to use soft information to screen and control early stage firms
8 For robustness, we define small banks as those with total assets below the median, and obtain similar results.
26
(Berger et al., 2017). The second stage results (columns 2 and 4 in Table 8) reveal that the
instrumented level of debt is positively and significantly related to outside equity financing.
Overall, the hypothesized relationship between debt and outside equity is corroborated by
further addressing potential endogeneity concerns.
5.5. Ruling out alternative explanations based on the pecking order theory
One concern is whether our results follow a pecking order, in which firms with high debt turn
to the last available financing source, outside equity. In our theoretical framework, and in line
with Robb and Robinson (2014), we have argued that such theories may apply better to
incumbents than to start-ups. Here we address this issue empirically. We first analyze the rate
of approval or denial of debt applications, which KFS reports for the 2007-2011 period, for
high relative to low debt firms. We categorize firms into high and low debt groups in year
2004 using the same procedure defined in the PSM analysis. High (low) debt firms made 367
(346) debt applications, being approved in 77% (66%) of the occasions. Thus, high debt firms
do not seem to shift towards outside equity due to their impossibility to raise debt financing.
One may however argue that the high debt firms that apply for debt financing may be a
selected sample of firms that anticipate success in the application process. To address this
concern, we use the KFS question (available for years 2007-2011): “F14g. During this year,
was there any time when the business needed credit but did not apply because you thought the
application would be denied?”. We create a dummy variable that takes the value of one for
firms that did not apply due to anticipating rejection, and zero otherwise. In the high debt
group, 18% of firm-year responses indicate not applying for debt financing because they
expected a denial. In the low debt group, 16% answered in the same manner. This difference
is not statistically significant in any period, suggesting that there is no systematic difference in
the anticipation of debt application denials between the high and low debt groups.

27
Finally, another concern would be that high debt firms might have worse credit scores
and therefore the only financing option they are left with is outside equity. Our PSM results
show that both the high and low debt groups have similar credit risk (Panel E of Table 4); that
is, even with similar levels of credit risk over the entire panel, high debt firms are more likely
to attract outside equity investors. In addition, we include credit risk as control variable in all
regressions. Overall, while the pecking order theory may be more useful for incumbent firms,
we believe that our signaling framework is more suitable to the start-up context.
6. Discussion and contributions
6.1. Contributions to theory
We push a step further the literature on the relevance of start-ups’ characteristics for financing
options. The baseline premise in our theoretical framework is that early stage firms are
opaque and signals based on their key attributes can help investors in their decisions. Our
theoretical arguments develop a governance understanding of debt that can serve to mitigate
information asymmetries related to the management and control of the young firm. Building
on seminal governance studies in economics (Jensen, 1986) and management (Kochhar,
1996), we posit that the problem of discretionary control of the firm is exacerbated in the
entrepreneurial firm. We propose that by commanding greater accountability to external
constituents, outside investors can interpret the presence of early stage debt as a valuable
signal of a market like governance (David et al., 2008; Williamson, 1988).
Our work serves to reconcile some of the perspectives on the lender versus investor
information interpretation processes. Lenders tend to focus their governance mechanisms on
the downside risk, linked to which investors could evaluate their position as residual
claimants (Grossman and Hart, 1982; Jensen 1986); however, investors have been shown to
select firms mostly based on their upside growth potential (Gompers and Lerner, 2002). As

28
we have argued, the lender perspective can bring value to the information interpretation
process of investors. While Ueda (2004) proposed that investors can have informational
advantages, in recent evidence Berger et al. (2017) have shown that specialized lenders are
most suited to alleviate the financing constraints of entrepreneurial firms by relying on
relationship lending and soft information. We highlight that in the case of young firms, a
lender focus could provide informational benefits to investors. As such, business debt requires
competitive screening and adhering to tight monitoring standards which taken together
presuppose a costly and difficult to imitate process. Foremost, by using early stage soft
information, lenders are able to guide the prevalent discretionary, less professional
management of young firms (Bloom et al., 2012) towards a more market oriented one (David
et al., 2008; Williamson, 1988), which investors can evaluate as a positive mechanism for
future growth prospects.
By theoretically analyzing the intensity of the debt governance signals at firm and
industry levels, our framework contributes to expanding the knowledge on signaling
rationales in entrepreneur-investor relationship, which have ranged from signaling in IPOs
(Arthurs et al., 2009; Pollock and Gulati, 2007) to the importance of human capital (Ahlers et
al., 2015; Davila et al., 2003) and competitive financing (Islam et al., 2018). Our work also
helps to integrate existing knowledge on the joint usefulness of firm financial information
(Armstrong et al., 2006; Hand, 2005) and non-financial attributes such as ownership
characteristics (Baum and Silverman, 2004; Bernstein et al., 2017; Dimov and Shepherd,
2005; Maxwell et al., 2011) to analyze the unique phenomena of entrepreneur-investor
relationship (e.g. Arthurs et al., 2009; Cassar, 2004; Cassar et al., 2015). Throughout, our
framework shows that some of the mainstream insights for incumbent firms may not prevail
for early stage firms, thus revealing important boundaries of existing theories. For instance,
29
the use of early stage signals of firm governance may supersede the assumptions on the
ordering of financing sources in incumbent firms.
6.2. Contributions to empirics and practice
Our theoretical and empirical analyses together support that, given debt’s ubiquitous presence
at the early stages of the firm, investors can mitigate the high informational risk in the start-
ups’ context by relying on lenders’ incentives and ability to monitor firm activity. The various
layers of heterogeneity in our results lead to implications for both firms and investors.
The governance signal is enhanced in the case of business debt, which entails costlier
screening process and imposes a tougher monitoring that restricts discretionary firm
management under the dire penalty of losing control rights. The effective governance of
business debt engenders a greater external accountability of entrepreneurs, which is
intensified in the presence of personal debt. Although personal debt is less related to such
governance mechanisms, its presence can signal the entrepreneur’s commitment with the firm.
There are thus two-sided advantages from contracting business debt: the firm benefits not
only from lifting roadblocks to growth, but also from a solid anchoring point for prospective
investors. These advantages are stronger in capital intensive industries, which feature higher
reliance on financing and more difficult to scale up business models.
The signaling effect is more salient in crisis times, when constrained capital providers
may value more an effective governance of debt. This finding extends the existing evidence
on crisis effects in the development stages of the firm (Block and Sandner, 2009), by
suggesting that the liquidity provided by debt jointly with an increased accountability of the
firm towards external constituents can link to attracting outside equity in crisis times. Such
accountability effects can be enhanced by early stage bank-firm relationships, particularly in
capital intensive industries, in which bank business debt has a significantly larger effect on

30
outside equity injections. Transmitting information through the bank-firm relationship can be
based on the advantages of specialized lenders in using soft information and their greater
ability to actively monitor credit lines (Berger et al., 2017; Degryse and Ongena, 2005).
It is not only the mere existence of debt that strengthens the signal, but also the use of
debt. Our analysis reveals that for the first years of activity, high debt firms can transmit
information to investors through balance sheet items such as fixed assets or cash holdings that
can lead to sustained firm activity and valuation (Hand, 2005). These findings contribute to
the complementarity of different types of information that can help to explain investor
decision-making. Whereas owner characteristics such as previous start-up experience, time
dedicated to the business and education can be related to attracting outside equity, ceteris
paribus, there is an important relevance of debt types for attracting outside equity as well as
for the magnitude of injections.
Next, we go beyond the signaling role of debt to reveal firm real effects. Overall, we do
not find effects on profitability, but reveal important differential growth effects: debt, and
especially business debt is positively associated with revenues and market share, and even
more so in capital intensive industries. This is in line with the idea that start-ups mainly focus
on growth as value enhancing (Carpenter and Petersen, 2002) or as a strategy towards going
public (Puri and Zarutskie, 2012). For instance, Choi et al. (2016) show that the governance
role of debt fosters innovation, a potential channel for growth. An underlying mechanism is
that the governance role of debt directs entrepreneurs to more market oriented management
practices (Bloom et al., 2012), which are congruent with the preferences of outside investors
and the more formal control systems that investors tend to impose (Davila and Foster, 2007).
Our findings contribute to core policy debates on economic growth.9 Understanding the
underpinnings of the governance role of debt for outside equity investments and firm real
9 See for example the European Angels Fund initiative (http://www.eif.org/what_we_do/equity/eaf/index.htm) where European institutions co-invest with business angels or the Kauffman Foundation letter to the US Senate expressing
31
effects paves the way for policy-making that can range from relaxing the regulation of
platforms of venture lending and investment, to reforming economic programs for credit
promotion to young firms. For the latter, regulators could consider the extent to which credit
programs are suitable. Our results show that in capital intensive industries, there is a higher
signaling value of debt. In these cases, the capital market may function better with fewer
interventions, as equity providers can more readily use firm and entrepreneur level signals.
Conversely, in emerging industry contexts, financing grants can hold a stronger signaling
value for attracting outside equity (Islam et al., 2018). If the emerging industries are also less
capital intensive, regulators could strategically consider interventions, for instance by
designing financing programs.
6.3. Limitations and extensions
To conclude, we point to some limitations of our study. While our work explores various
layers of heterogeneity, it has some limitations that can serve as a stepping stone. Future
research could attempt to employ quasi-natural experiments to more narrowly identify the
underpinnings of the causal mechanisms between debt and outside equity. These, however,
are not always available. A long-standing unresolved issue relates to the extent to which new
firms can be leveraged, or how more sophisticated hybrid financial instruments such as
convertible or preferred stock should be employed. In this study we do not indicate an
optimum amount of debt that a start-up should contract; this issue could be tackled through
formal models from the more traditional capital structure literature, such as the static trade-off
theory. In informationally opaque contexts, these models may benefit from integrating the
role of incentives on performance at the time of changes in capital structure (Kaplan, 1989).
Finally, there is an increasing trend to study debt concentration (Colla et al., 2013; Rauh and the need to promote equity investments at early stages of the firm (http://www.kauffman.org/~/media/kauffman_org/resources/2016/kauffman_foundation_senate_finance_tax_reform_working_group_letter_4_15_15.pdf).

32
Sufi, 2010). Whereas debt concentration is a characteristic usually found in established firms,
the potential implications for young firms remain underexplored. All in all, future research
could use our study as a step toward bridging the gap between the research on start-ups and
incumbent firms.

33
References
Acemoglu, D., Guerrieri, V. (2007). Capital deepening and nonbalanced economic growth. Journal of Political Economy, 116(3), 467-498.
Acharya, V., Almeida, H., Ippolito, F., Perez, A. (2014). Credit lines as monitored liquidity insurance: Theory and evidence. Journal of Financial Economics, 112(3), 287-319.
Agarwal, S., Hauswald, R. (2010). Distance and private information in lending. Review of Financial Studies, 23(7), 2757-2788.
Ahlers, G.K., Cumming, D., Günther, C., Schweizer, D. (2015). Signaling in equity crowdfunding. Entrepreneurship Theory and Practice, 39(4), 955-980.
Armstrong, C., Davila, A., Foster, G. (2006). Venture-backed private equity valuation and financial statement information. Review of Accounting Studies, 11(1), 119-154.
Arthurs, J.D., Busenitz, L.W., Hoskisson, R.E., Johnson, R.A. (2009). Signaling and initial public offerings: The use and impact of the lockup period. Journal of Business Venturing, 24(4), 360-372.
Baldenius, T., Meng, X. (2010). Signaling firm value to active investors. Review of Accounting Studies, 15(3), 584-619.
Baum, J.A.C., Silverman, B.S. (2004). Picking winners or building them? Alliance, intellectual, and human capital as selection criteria in venture financing and performance of biotechnology startups. Journal of Business Venturing, 19(3), 411-436.
Berger, A.N., Cerqueiro, G., Penas, M. (2015). Market size structure and small business lending: Are crisis times different from normal times? Review of Finance 19, 1965-1995.
Berger, A.N., Bouwman, C.H., Kim, D. (2017). Small bank comparative advantages in alleviating financial constraints and providing liquidity insurance over time. Review of Financial Studies, 30(10), 3416-3454.
Bernstein, S., Korteweg, A.G., Laws, K. (2017). Attracting early stage investors: Evidence from a randomized field experiment. Journal of Finance, 72(2), 509-538.
Block, J., Sandner, P. (2009) What is the effect of the financial crisis on venture capital financing? Empirical evidence from US Internet start-ups. Venture Capital, 11(4), 295-309.
Bloom, N., Genakos, C., Sadun, R., Van Reenen, J. (2012). Management practices across firms and countries. Academy of Management Perspectives, 26(1), 12-33.
Cameron, A.C., Trivedi, P.K. (2009). Microeconometrics Using Stata. Stata Press. Carpenter, R.E., Petersen, B.C. (2002). Is the growth of small firms constrained by internal
finance? Review of Economics and Statistics, 84(2), 298-309. Caskey, J., Hughes, J.S., Liu, J. (2012). Leverage, excess leverage and future returns. Review
of Accounting Studies, 17(2), 443-471. Cassar, G. (2004). The financing of business start-ups. Journal of Business Venturing, 19(2),
261-283. Cassar, G., Ittner, C.D., Cavalluzzo, K.S. (2015). Alternative information sources of
information asymmetry reduction: Evidence from small business debt. Journal of Accounting and Economics, 59(2-3), 242-263.
Chemmanur, T.J., Fulghieri, P. (2013). Entrepreneurial finance and innovation: An introduction and agenda for future research. Review of Financial Studies, 27(1), 1-19.

34
Choi, B., Kumar, M.S., Zambuto, F. (2016). Capital structure and innovation trajectory: The role of debt in balancing exploration and exploitation. Organization Science, 27(5), 1183-1201.
Cole, R.A., Sokolyk, T. (2018). Debt financing, survival, and growth of start-up firms. Journal of Corporate Finance, 50, 609-625.
Colla, P., Ippolito, F., Li, K. (2013). Debt specialization. Journal of Finance, 68(5), 2117-2141.
Colombo, M.G., Grilli, L. (2007). Funding gaps? Access to bank loans by high-tech start-ups. Small Business Economics, 29(1-2), 25-46.
Connelly, B.L., Certo, S.T., Ireland, R. D., Reutzel, C. R. (2011). Signaling theory: A review and assessment. Journal of Management, 37(1), 39-67.
Conti, A., Thursby, M., Rothaermel, F.T. (2013). Show me the right stuff: Signals for high-tech startups. Journal of Economics & Management Strategy, 22(2), 341-364.
Croce, A., Martí, J., Murtinu, S. (2013). The impact of venture capital on the productivity growth of European entrepreneurial firms: “Screening” or “value added” effect? Journal of Business Venturing, 28(4), 489-510.
David, P., O’Brien, J.P., Yoshikawa, T. (2008). The implications of debt heterogeneity for R&D investment and firm performance. Academy of Management Journal, 51(1), 165-181.
Davila, A., Foster, G., Gupta, M. (2003). Venture capital financing and the growth of startup firms. Journal of Business Venturing, 18(6), 689-708.
Davila, A., Foster, G. (2007). Management control systems in early-stage startup companies. The Accounting Review, 82(4), 907-937.
Degryse, H., Ongena, S. (2005). Distance, lending relationships, and competition. Journal of Finance, 60(1), 231-266.
Dey, A., Nikolaev, V., Wang, X. (2015). Disproportional control rights and the governance role of debt. Management Science, 62(9), 2581-2614.
Dimov, D.P., Shepherd, D.A. (2005). Human capital theory and venture capital firms: Exploring “home runs” and “strike outs”. Journal of Business Venturing, 20(1), 1-21.
Downes, D.H., Heinkel, R. (1982). Signaling and the valuation of unseasoned new issues. Journal of Finance, 37(1), 1-10.
Elitzur, R., Gavious, A. (2003). Contracting, signaling, and moral hazard: a model of entrepreneurs, “angels,” and venture capitalists. Journal of Business Venturing, 18(6), 709-725.
Fried, V.H., Hisrich, R.D. (1994). Toward a model of venture capital investment decision making. Financial Management, 23(3), 28-37.
Gompers, P., Lerner, J. (2002). The Venture Capital Cycle. MIT Press. Grossman, S.J., Hart, O.D. (1982). Corporate financial structure and managerial incentives.
In The Economics of Information and Uncertainty (pp. 107-140). University of Chicago Press.
Guo, S., Fraser, M.W. (2014). Propensity Score Analysis: Statistical Methods and Applications. SAGE Publications.
Hall, G.C., Hutchinson, P. J., Michaelas, N. (2004). Determinants of the capital structures of European SMEs. Journal of Business Finance & Accounting, 31(5-6), 711-728.

35
Hand, J. (2005). The value relevance of financial statements in the venture capital market. The Accounting Review, 80(2), 613–648.
Hellmann, T., Puri, M. (2000). The interaction between product market and financing strategy: The role of venture capital. Review of Financial Studies, 13(4), 959-984.
Islam, M., Fremeth, A., Marcus, A. (2018). Signaling by early stage startups: US government research grants and venture capital funding. Journal of Business Venturing, 33(1), 35-51.
Jeng, L.A., Wells, P.C. (2000). The determinants of venture capital funding: evidence across countries. Journal of Corporate Finance, 6(3), 241-289.
Jensen, M.C. (1986). Agency costs of free cash flow, corporate finance, and takeovers. American Economic Review, 76(2), 323-329.
Jones, S., Hensher, D.A. (2004). Predicting firm financial distress: A mixed logit model. The Accounting Review, 79(4), 1011-1038.
Jordan J., Lowe, J., Taylor, P. (1998). Strategy and financial policy in UK small firms. Journal of Business Finance & Accounting, 25(1-2), 1-27.
Kaplan, S. (1989). The effects of management buyouts on operating performance and value. Journal of Financial Economics, 24(2), 217-254.
Kochhar, R. (1996). Explaining firm capital structure: The role of agency theory vs. transaction cost economics. Strategic Management Journal, 17(9), 713-728.
MacKay, P., Phillips, G.M. (2005). How does industry affect firm financial structure?. Review of Financial Studies, 18(4), 1433-1466.
MacMillan, I.C., Zemann, L., Subbanarasimha, P.N. (1987). Criteria distinguishing successful from unsuccessful ventures in the venture screening process. Journal of Business Venturing, 2(2), 123-137.
Maxwell, A.L., Jeffrey, S.A., Lévesque, M. (2011). Business angel early stage decision making. Journal of Business Venturing, 26(2), 212-225.
Myers, S.C. (1984). The capital structure puzzle. Journal of Finance, 39(3), 574-592. Park, C. (2000). Monitoring and structure of debt contracts. Journal of Finance, 55(5), 2157-
2195. Pollock, T.G., Gulati, R. (2007). Standing out from the crowd: The visibility-enhancing
effects of IPO-related signals on alliance formation by entrepreneurial firms. Strategic Organization, 5(4), 339-372.
Puri, M., Zarutskie, R. (2012). On the life cycle dynamics of venture-capital- and non-venture-capital-financed firms. Journal of Finance, 67(6), 2247-2293.
Rajan, R.G., Zingales, L. (1995). What do we know about capital structure? Some evidence from international data. Journal of Finance, 50(5), 1421-1460.
Rauh, J., Sufi, A. (2010). Capital structure and debt structure. Review of Financial Studies, 23(12), 4242- 4280.�
Robb, A.M., Robinson, D.T. (2014). The capital structure decisions of new firms. Review of Financial Studies, 27(1), 153-179.
Samila, S., Sorenson, O. (2011). Venture capital, entrepreneurship, and economic growth. The Review of Economics and Statistics, 93(1), 338-349.
Sanders, W.M.G., Boivie, S. (2004). Sorting things out: Valuation of new firms in uncertain markets. Strategic Management Journal, 25(2), 167-186.
Scherr, F.C., Sugrue, T.F., Ward, J.B. (1993). Financing the small firm start-up: Determinants

36
of debt use. Journal of Small Business Finance, 3(1), 17-36. Sorensen, M. (2007). How smart is smart money? A two-sided matching model of venture
capital. Journal of Finance, 62(6), 2725-2762. Spence, M. (2002). Signaling in retrospect and the informational structure of markets.
American Economic Review, 92(3), 434-459. Titman, S., Wessels, R. (1988). The determinants of capital structure choice. Journal of
Finance, 43(1), 1-19. Triantis, G.G., Daniels, R.J. (1995). The role of debt in interactive corporate
governance. California Law Review, 83, 1073-1113. Tyebjee, T.T., Bruno, A.V. (1984). A model of venture capitalist investment activity.
Management Science, 30(9), 1051-1066. Ueda, M. (2004). Bank versus venture capital: Project evaluation, screening, and
expropriation. Journal of Finance, 59(2), 601-621. Watson, R., Wilson, N. (2002). Small and medium size enterprise financing: A note on some
of the empirical implications of a pecking order. Journal of Business Finance & Accounting, 29(3&4), 557-578.
Williamson, O. (1988). Corporate finance and corporate governance. Journal of Finance, 43(3), 567-591.

37
Table 1. Descriptive statistics of main variables Obs. Mean Std. dev. p50 p90
Main variables Ln(Debt) 5,619 8.598 4.656 10.309 12.612
Ln(Personal debt) 5,619 4.333 5.000 0 11.082 Ln(Business debt) 5,619 3.614 5.090 0 11.482 Ln(Bank business debt) 5,619 2.974 4.686 0 10.820 Ln(Non-bank business debt) 5,619 0.640 2.458 0 0 Ln(Out_E) 5,619 0.710 2.861 0 0 Out_E_Dum 5,619 0.060 0.238 0 0 Control variables Crisis 5,619 0.243 0.429 0 1 Firm characteristics Ln(Revenues) 5,619 10.314 4.757 11.849 14.403 Profits (K$) 5,619 -61.104 4,808.841 3.500 150.000 Credrisk 5,619 2.931 0.980 3 4 Employees 5,619 5.940 17.373 2 13 Hightech 5,619 0.168 0.374 0 1 Ln(Cash) 5,619 8.183 3.670 9.210 11.562 Ln(Accounts receivable) 5,619 6.473 5.171 8.517 12.128 Ln(Inventory) 5,619 4.254 5.094 0 11.488 Ln(Fixed assets) 5,619 8.618 4.484 9.913 12.910 ROA 5,619 -9.777 1,153.882 0.035 1.109 Owner characteristics Owner age 5,619 47.127 10.647 47 61 Years of industry experience 5,619 13.319 10.539 12 30 Week hours 5,619 44.509 21.229 50 70 Start-up experience 5,619 0.968 1.347 0 3 Education 5,619 6.687 2.026 7 9 Male 5,619 0.783 0.412 1 1 US born 5,619 0.881 0.324 1 1
This table presents the descriptive statistics for the analyzed sample spanning 2004-2011. Out of the total 5,619 observations 2,619 are LLC, 2,234 are S-Corporations, and 766 are C-Corporations. Complete definitions for all variables are provided in Table A1. The high ROA mean and a standard deviation are driven by the presence of five observations. Removing these observations from the sample yields a mean ROA of 0.035 with a standard deviation of 6.107, and a median of 0.035. Running the analysis with this reduced sample does not statistically or economically change our results.

38
Table 2. Panel A. Heckman selection model: First-stage Probit regressions Dep. var.: Out_E_Dum (1) (2) (3) (4) (5) (6) (7) (8) Ln(Debt) 0.034*** 0.033*** 0.032***
(0.010) (0.011) (0.010)
Ln(Personal debt) 0.029*** 0.036*** 0.035*** 0.036*** 0.035***
(0.007) (0.008) (0.008) (0.008) (0.008)
Ln(Business debt) 0.025*** 0.025*** 0.024***
(0.007) (0.007) (0.007)
Ln(Bank Business debt) 0.017** 0.018**
(0.008) (0.008)
Ln(Non-bank Business debt) 0.046*** 0.041***
(0.011) (0.011)
Out_E_Dum (t-1) 1.435*** 1.410*** 1.135*** 1.101*** 1.064*** 1.027*** 1.090*** 1.021***
(0.116) (0.117) (0.119) (0.120) (0.116) (0.117) (0.121) (0.117)
Crisis -0.132* -0.146* -0.321*** -0.338*** -0.290** -0.312** -0.331*** -0.307**
(0.074) (0.075) (0.124) (0.126) (0.125) (0.126) (0.126) (0.127)
Credrisk 0.027 0.008 0.028 0.011 0.022 0.006 0.012 0.006
(0.038) (0.037) (0.041) (0.040) (0.041) (0.041) (0.040) (0.041)
Ln(Revenues) -0.031*** -0.032*** -0.025*** -0.025*** -0.029*** -0.029*** -0.025*** -0.029***
(0.008) (0.008) (0.008) (0.009) (0.008) (0.008) (0.009) (0.008)
Employees 0.003* 0.003* 0.002 0.002 0.001 0.001 0.002 0.001
(0.002) (0.002) (0.002) (0.002) (0.002) (0.002) (0.002) (0.002)
Hightech 0.210** 0.234** 0.200* 0.195* 0.182* 0.171 0.192* 0.168
(0.090) (0.091) (0.106) (0.108) (0.109) (0.110) (0.107) (0.109)
Financial information Ln(Cash) 0.040*** 0.050*** 0.032** 0.041*** 0.049*** 0.041***
(0.014) (0.015) (0.013) (0.014) (0.015) (0.014)
Ln(Accounts receivable) -0.008 -0.013 -0.013 -0.017* -0.012 -0.017*
(0.009) (0.009) (0.009) (0.009) (0.009) (0.009)
Ln(Inventory) 0.011 0.009 0.004 0.003 0.009 0.003
(0.010) (0.010) (0.010) (0.010) (0.010) (0.010)
Ln(Fixed assets) -0.004 -0.006 -0.004 -0.005 -0.005 -0.005
(0.009) (0.009) (0.009) (0.009) (0.009) (0.009)
ROA -0.004** -0.004** -0.004* -0.004* -0.004** -0.004*
(0.002) (0.002) (0.002) (0.002) (0.002) (0.002)
Profits -0.000 -0.000 -0.000 -0.000 -0.000 -0.000
(0.000) (0.000) (0.000) (0.000) (0.000) (0.000)
Owner characteristics No No No No Yes Yes No Yes Legal status fixed effects Yes Yes Yes Yes Yes Yes Yes Yes Year fixed effects No No Yes Yes Yes Yes Yes Yes Industry fixed effects No No Yes Yes Yes Yes Yes Yes Observations 4,230 4,230 4,230 4,230 4,230 4,230 4,230 4,230
Panel A of Table 2 presents the Heckman selection equation in which the dependent variable is an outside equity indicator that takes the value of 1 if the start-up receives outside equity and 0 otherwise (equation 1). Owner characteristics are those summarized in Table 1. Table A1 defines all variables. Robust standard errors are presented in parenthesis. * p<0.10, ** p<0.05, *** p<0.01.

39
Table 2. Panel B. Heckman selection model cont.: Second-stage OLS regressions Dep. var.: Ln(Out_E) (1) (2) (3) (4) (5) (6) (7) (8) Ln(Debt) 0.041 0.052** 0.062**
(0.036) (0.024) (0.024)
Ln(Personal debt) -0.098*** -0.008 -0.002 -0.008 -0.002
(0.026) (0.019) (0.019) (0.019) (0.019)
Ln(Business debt) 0.059** 0.045** 0.052**
(0.028) (0.022) (0.021)
Ln(Bank business debt) 0.052** 0.061**
(0.026) (0.027)
Ln(Non-bank business debt) 0.031 0.039
(0.029) (0.028)
Crisis -0.125 -0.059 0.301 0.150 0.197 0.038 0.146 0.031
(0.307) (0.323) (0.404) (0.402) (0.399) (0.400) (0.402) (0.400)
Credrisk -0.556*** -0.539*** -0.108 -0.139 -0.104 -0.135 -0.140 -0.137
(0.150) (0.143) (0.123) (0.124) (0.123) (0.124) (0.124) (0.124)
Ln(Revenues) 0.030 0.031 -0.016 -0.014 -0.022 -0.017 -0.013 -0.015
(0.028) (0.027) (0.027) (0.026) (0.029) (0.028) (0.026) (0.028)
Employees 0.040** 0.035** 0.013 0.013 0.014 0.013 0.012 0.012
(0.017) (0.018) (0.011) (0.011) (0.011) (0.011) (0.011) (0.011)
Hightech 1.096*** 1.085*** 0.680** 0.706** 0.878*** 0.920*** 0.711** 0.935***
(0.353) (0.354) (0.332) (0.331) (0.333) (0.347) (0.334) (0.357)
Financial information Ln(Cash) 0.236*** 0.233*** 0.235*** 0.231*** 0.233*** 0.231***
(0.038) (0.040) (0.041) (0.044) (0.040) (0.044)
Ln(Accounts receivable) -0.028 -0.032 -0.033 -0.035 -0.033 -0.036
(0.025) (0.025) (0.025) (0.025) (0.026) (0.025)
Ln(Inventory) 0.047* 0.055* 0.043 0.053* 0.054* 0.053*
(0.028) (0.028) (0.028) (0.028) (0.028) (0.028)
Ln(Fixed assets) 0.019 0.021 0.025 0.026 0.021 0.026
(0.027) (0.027) (0.028) (0.028) (0.028) (0.028)
ROA -0.012 -0.007 -0.004 0.001 -0.007 0.001
(0.020) (0.019) (0.020) (0.018) (0.019) (0.018)
Profits -0.000 -0.000 -0.000 -0.000 -0.000 -0.000
(0.000) (0.000) (0.000) (0.000) (0.000) (0.000)
Owner characteristics No No No No Yes Yes No Yes Legal status fixed effects Yes Yes Yes Yes Yes Yes Yes Yes Year fixed effects No No Yes Yes Yes Yes Yes Yes Industry fixed effects No No Yes Yes Yes Yes Yes Yes State fixed effects No No Yes Yes Yes Yes Yes Yes Observations 214 214 214 214 214 214 214 214
Panel B of Table 2 reports the measurement (outcome) equation in which the dependent variable is the logarithm of outside equity (equation 2). Owner characteristics are those summarized in Table 1. Table A1 defines all variables. Robust standard errors are presented in parenthesis. * p<0.10, ** p<0.05, *** p<0.01.

40
Table 3. Personal debt and credit lines
Dep. Var.: Out_E_Dum Ln(Out_E) Out_E_Dum Ln(Out_E) Out_E_Dum Ln(Out_E) Out_E_Dum Ln(Out_E) Model: 1st stage 2nd stage 1st stage 2nd stage 1st stage 2nd stage 1st stage 2nd stage (1) (2) (3) (4) (5) (6) (7) (8) Ln(Personal debt) 0.043*** -0.043 0.034*** -0.024 0.035*** -0.003 0.030*** -0.010
(0.010) (0.028) (0.010) (0.025) (0.008) (0.019) (0.009) (0.022)
Ln(Bus debt_Pers) 0.017* 0.093***
(0.010) (0.029)
Ln(Bus debt_NoPers) 0.034*** 0.011
(0.010) (0.027)
Ln(Bank bus debt_Pers) 0.019* 0.091***
(0.011) (0.034)
Ln(Bank bus debt_NoPers) 0.016 0.020
(0.012) (0.034)
Ln(Bank bus debt_CredLine) 0.027*** 0.067**
(0.009) (0.032)
Ln(Bank bus debt_NoCredLine) -0.002 0.043 -0.001 0.043 (0.013) (0.031) (0.013) (0.030) Ln(Bank bus debt_CredLine_Pers) 0.035*** 0.082** (0.012) (0.037) Ln(Bank bus debt_CredLine_NoPers) 0.011 0.044 (0.014) (0.048) Ln(Non-bank business debt) 0.041*** 0.039 0.041*** 0.037 0.042*** 0.039 (0.011) (0.029) (0.011) (0.028) (0.011) (0.029) Controls Yes Yes Yes Yes Yes Yes Yes Yes Owner characteristics Yes Yes Yes Yes Yes Yes Yes Yes Legal status fixed effects Yes Yes Yes Yes Yes Yes Yes Yes Year fixed effects Yes Yes Yes Yes Yes Yes Yes Yes Industry fixed effects Yes Yes Yes Yes Yes Yes Yes Yes State fixed effects No Yes No Yes No Yes Yes Yes Observations 4,230 214 4,230 214 4,230 214 4,230 214
This table reports coefficients of a Heckman two stage model with the first stage indicating whether the firm raises equity financing or not (Out_E_Dum) and the second stage showing the amount raised, Ln(Out_E). We decompose the effects of business debt (columns 1-2) and bank business debt (columns 3-4) into firms that feature personal debt and firms that do not. In columns 5-6, we decompose bank business debt between firms with active credit and those without. Columns 7-8 decompose the coefficient of bank business debt with credit lines between firms with and without personal debt. The included controls and owner characteristics are those summarized in Table 1. Table A1 defines all variables. Robust standard errors are presented in parenthesis. * p<0.10, ** p<0.05, *** p<0.01.

41
Table 4. Propensity score matching: Differences in means between groups 2004 2005 2006 2007 2008 2009 2010 2011 Panel A: Debt mean values (see Figure 2) Low debt group 4.854 7.059 6.871 7.315 7.149 6.987 6.093 6.595 High debt group 12.042 10.037 9.049 9.846 8.378 9.223 8.564 8.013 t-test p-value 0.000*** 0.000*** 0.002*** 0.001*** 0.147 0.013** 0.020** 0.161
Panel B: Outside equity mean values (see Figure 2) Low debt group 1.410 1.455 0.666 0.318 0.157 0.311 0.164 0.331 High debt group 1.656 1.213 0.843 1.224 0.880 0.433 0.177 0.187 t-test p-value 0.559 0.599 0.630 0.026** 0.041** 0.716 0.958 0.627 Panel C: Ln(Revenues) mean values Low debt group 7.931 9.496 9.495 10.483 9.894 10.706 10.510 11.396 High debt group 8.175 9.243 9.621 10.331 10.425 11.839 11.639 11.780 t-test p-value 0.652 0.688 0.852 0.821 0.490 0.059* 0.087* 0.521 Panel D: ROA mean values Low debt group -0.341 -0.323 0.002 -1.043 -0.942 0.322 1.382 -2.390 High debt group -0.658 -0.359 -0.303 0.538 -0.368 -0.467 0.197 0.395 t-test p-value 0.350 0.932 0.597 0.149 0.599 0.351 0.441 0.133 Panel E: Credit risk mean values Low debt group 3.245 3.098 2.762 2.674 2.663 2.714 2.632 2.845 High debt group 3.277 3.095 2.842 2.634 2.600 2.704 2.875 2.986 t-test p-value 0.664 0.980 0.522 0.782 0.675 0.953 0.176 0.520
This table reports mean differences between the 184 treatment firms (high debt in 2004) and the matched 184 control firms (low debt in 2004). The first two panels report mean differences for debt (Panel A, see also Figure 2) and outside equity (Panel B, see also Figure 2). We also report the evolution of different economic outcomes for the high and low debt groups: Ln(Revenues) as a measure of firm growth (Panel C), ROA as a measure of profitability (Panel D) and firm credit risk (Panel E). Table A1 defines all variables. * p<0.10, ** p<0.05, *** p<0.01.

42
Table 5. Asset decomposition (years 2005 and 2006)
Mean values in 2005 t-test p-value
Low debt Std. dev. High debt Std. dev.
Ln(Cash) 8.084 0.340 8.296 0.271 0.624 Ln(Accounts receivable) 5.210 0.454 5.906 0.412 0.256 Ln(Inventory) 3.767 0.433 4.236 0.408 0.431 Ln(Fixed assets) 8.298 0.392 9.223 0.370 0.087*
Mean values in 2006 t-test p-value
Low debt Std. dev. High debt Std. dev.
Ln(Cash) 7.503 0.392 8.441 0.307 0.058* Ln(Accounts receivable) 6.284 0.494 6.116 0.430 0.797 Ln(Inventory) 3.550 0.450 4.773 0.451 0.057* Ln(Fixed assets) 7.890 0.448 9.466 0.371 0.007***
This table reports differences in the asset structure for the two matched groups of start-ups (i.e. high and low debt) for the two years prior to the significant difference in the attraction of outside equity between high and low debt groups. Table A1 defines all variables. * p<0.10, ** p<0.05, *** p<0.01.

43
Table 6. Heterogeneous effects: High versus low capital intensive industries Dep. var.: Out_E_Dum Out_E_Dum Out_E_Dum Ln(Out_E>0) Ln(Out_E>0) Ln(Out_E>0) Model: Probit Probit Probit OLS OLS OLS (1) (2) (3) (4) (5) (6) Ln(Debt_HighCap) 0.041*** 0.106***
(0.012) (0.029)
Ln(Debt_LowCap) 0.029*** 0.057**
(0.011) (0.026)
Ln(Bus debt_HighCap) 0.041*** 0.092***
(0.012) (0.026)
Ln(Bus debt_LowCap) 0.018* 0.044*
(0.010) (0.023)
Ln(Pers debt_HighCap) 0.029** -0.006 (0.011) (0.027) Ln(Pers debt_LowCap) 0.038*** -0.003 (0.010) (0.028) Ln(Bank bus debt_HighCap) 0.035*** 0.109*** (0.012) (0.031) Ln(Bank bus debt_LowCap) 0.011 0.050* (0.010) (0.025) Ln(Non-bank bus debt_HighCap) 0.043** 0.056 (0.019) (0.038) Ln(Non-bank bus debt_LowCap) 0.041** 0.040 (0.016) (0.031) Ln(Personal debt) 0.034*** -0.006 (0.008) (0.022) Controls Yes Yes Yes Yes Yes Yes Owner characteristics Yes Yes Yes Yes Yes Yes Legal status fixed effects Yes Yes Yes Yes Yes Yes Year fixed effects Yes Yes Yes Yes Yes Yes State fixed effects Yes Yes Yes Yes Yes Yes b debt HighCap>b debt LowCap 0.077 0.013 b bus HighCap>b bus LowCap 0.052 0.067 b bank bus HighCap>b bank bus LowCap 0.038 0.037 Observations 4,008 4,008 4,008 339 339 339
This table presents the heterogeneous effects in the relationship between debt and outside equity (equation 4). We split firms into high and low capital intensive industries and model different debt measures accordingly. Columns 1 to 3 report results of Probit regressions with Out_E_Dum as dependent variable. Columns 4 to 6 report results of OLS regressions with Ln(Out_E>0) as dependent variable. The included controls and owner characteristics are those summarized in Table 1. Table A1 defines all variables. Robust standard errors are presented in parenthesis. * p<0.10, ** p<0.05, *** p<0.01.
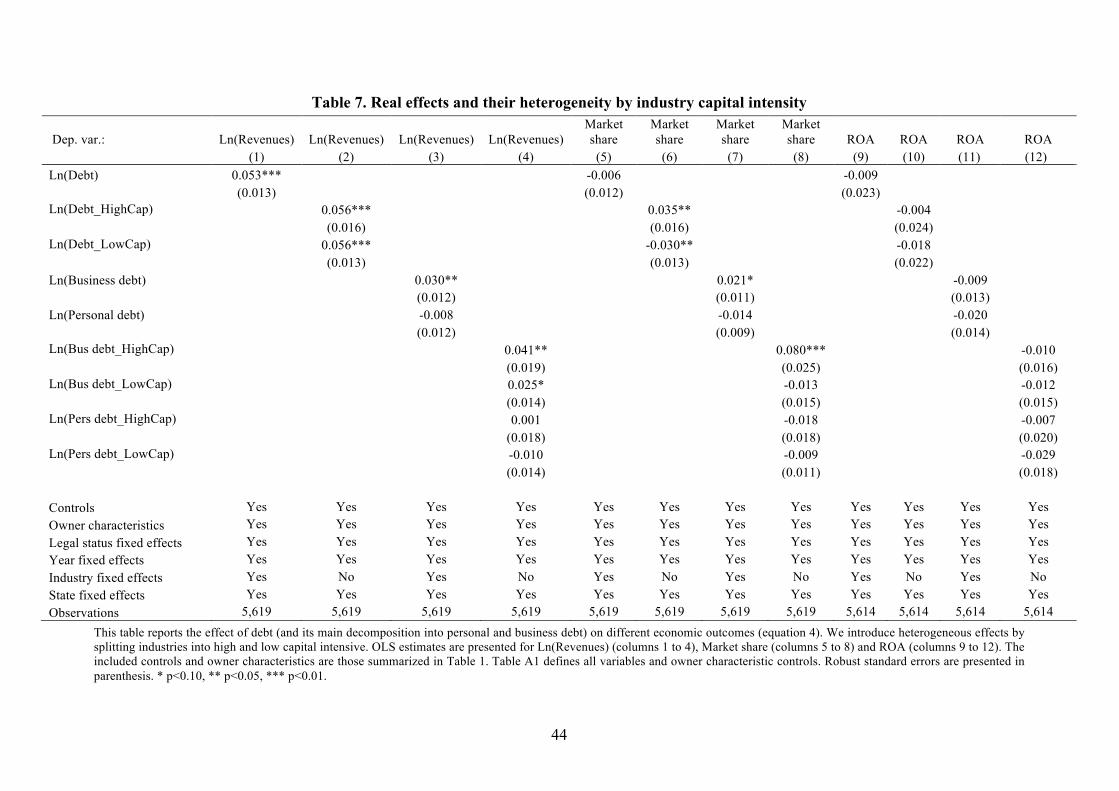
44
Table 7. Real effects and their heterogeneity by industry capital intensity
Dep. var.: Ln(Revenues) Ln(Revenues) Ln(Revenues) Ln(Revenues) Market share
Market share
Market share
Market share ROA ROA ROA ROA
(1) (2) (3) (4) (5) (6) (7) (8) (9) (10) (11) (12) Ln(Debt) 0.053***
-0.006
-0.009
(0.013)
(0.012)
(0.023) Ln(Debt_HighCap)
0.056***
0.035**
-0.004
(0.016)
(0.016)
(0.024) Ln(Debt_LowCap)
0.056***
-0.030**
-0.018
(0.013)
(0.013)
(0.022) Ln(Business debt)
0.030**
0.021*
-0.009
(0.012)
(0.011)
(0.013) Ln(Personal debt)
-0.008
-0.014
-0.020
(0.012)
(0.009)
(0.014) Ln(Bus debt_HighCap)
0.041** 0.080***
-0.010
(0.019) (0.025)
(0.016)
Ln(Bus debt_LowCap)
0.025* -0.013
-0.012
(0.014) (0.015)
(0.015)
Ln(Pers debt_HighCap) 0.001 -0.018 -0.007 (0.018) (0.018) (0.020) Ln(Pers debt_LowCap) -0.010 -0.009 -0.029 (0.014) (0.011) (0.018) Controls Yes Yes Yes Yes Yes Yes Yes Yes Yes Yes Yes Yes Owner characteristics Yes Yes Yes Yes Yes Yes Yes Yes Yes Yes Yes Yes Legal status fixed effects Yes Yes Yes Yes Yes Yes Yes Yes Yes Yes Yes Yes Year fixed effects Yes Yes Yes Yes Yes Yes Yes Yes Yes Yes Yes Yes Industry fixed effects Yes No Yes No Yes No Yes No Yes No Yes No State fixed effects Yes Yes Yes Yes Yes Yes Yes Yes Yes Yes Yes Yes Observations 5,619 5,619 5,619 5,619 5,619 5,619 5,619 5,619 5,614 5,614 5,614 5,614
This table reports the effect of debt (and its main decomposition into personal and business debt) on different economic outcomes (equation 4). We introduce heterogeneous effects by splitting industries into high and low capital intensive. OLS estimates are presented for Ln(Revenues) (columns 1 to 4), Market share (columns 5 to 8) and ROA (columns 9 to 12). The included controls and owner characteristics are those summarized in Table 1. Table A1 defines all variables and owner characteristic controls. Robust standard errors are presented in parenthesis. * p<0.10, ** p<0.05, *** p<0.01.
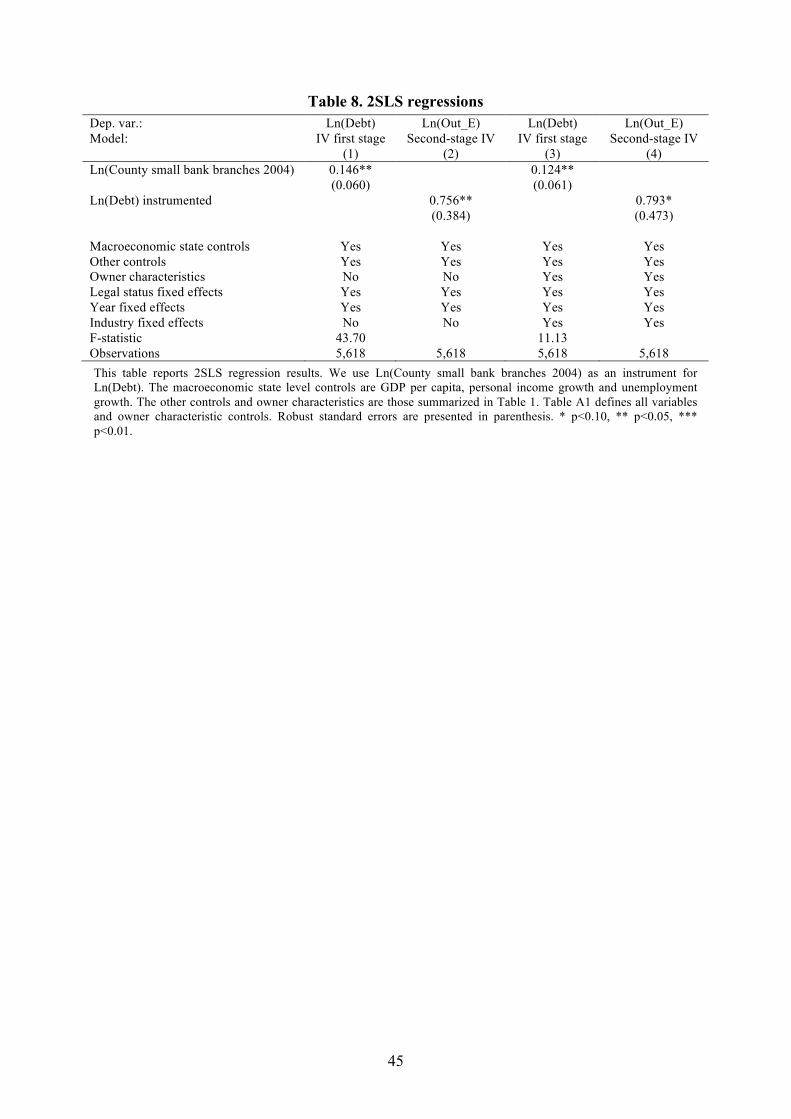
45
Table 8. 2SLS regressions Dep. var.: Ln(Debt) Ln(Out_E) Ln(Debt) Ln(Out_E) Model: IV first stage Second-stage IV IV first stage Second-stage IV (1) (2) (3) (4) Ln(County small bank branches 2004) 0.146** 0.124** (0.060) (0.061) Ln(Debt) instrumented 0.756** 0.793* (0.384) (0.473)
Macroeconomic state controls Yes Yes Yes Yes Other controls Yes Yes Yes Yes Owner characteristics No No Yes Yes Legal status fixed effects Yes Yes Yes Yes Year fixed effects Yes Yes Yes Yes Industry fixed effects No No Yes Yes F-statistic 43.70 11.13 Observations 5,618 5,618 5,618 5,618 This table reports 2SLS regression results. We use Ln(County small bank branches 2004) as an instrument for Ln(Debt). The macroeconomic state level controls are GDP per capita, personal income growth and unemployment growth. The other controls and owner characteristics are those summarized in Table 1. Table A1 defines all variables and owner characteristic controls. Robust standard errors are presented in parenthesis. * p<0.10, ** p<0.05, *** p<0.01.

46
Figure 1. The governance role of debt in early stage firms
Entrepreneurial project
Early stage potential governance tensions with outside investors: - discretionary use of cash flows - pursuit of private benefits - personal (rather than professional) management
The governance role of debt: - market like governance of management, accountability - reduce discretion on cash flows and operations - implications on control rights
Outside equity investment

47
Figure 2. Evolution of debt (Panel A) and equity (Panel B)
This panel (A) presents the mean values of Ln(Debt) for high (dashed line) and low (solid line) debt groups using the matched samples. In 2004, we force this variable to differ across the two groups.
This panel (B) presents the mean values of Ln(Out_E) for high (dashed line) and low (solid line) debt groups using the matched samples. In 2004, we force this variable to be equal across the two groups.

48
Supplementary appendix
Table A1. Definitions of variables Main variables
Ln(Debt) Ln(Total debt in $ + 1) Ln(Personal debt) Ln(Personal debt in $ + 1) Ln(Business debt) Ln(Business debt in $ + 1) Ln(Bank business debt) Bank Business debt: Ln (bank business debt in $ + 1) Ln(Non-bank business debt) Non-bank Business debt: Ln (non-bank business debt in $ + 1) Ln(Out_E>0) Ln(Outside equity in $). It excludes firms with $0 in Outside equity Ln(Out_E) Ln(Outside equity in $ + 1) Out_E_Dum Dummy variable: 1 for positive $ amounts of outside equity, and 0 otherwise Debt_Dum Dummy variable: 1 for high debt, the highest quartile of Ln(Debt), and 0 for low debt, the
lowest two quartiles Other variables Crisis Dummy variable: 1 for years 2007 – 2009, and 0 otherwise Firm characteristics Ln(Revenues) Ln(Revenues in $ + 1) Profits Profits amount in dollars Credrisk Dun & Bradstreet credit risk score: 1 (lowest) to 5 (highest probability of delinquency) Employees Number of employees
Hightech Industries (NAICS) defined as technology employers and generators by the NSF’s Survey of Industrial Research and Development
Ln(Cash) Ln(Cash in $ + 1) Ln(Accounts receivable) Ln(Accounts receivable in $ + 1) Ln(Inventory) Ln(Inventory in $ + 1) Ln(Fixed assets) Ln(Fixed assets in $ + 1). Fixed assets is the sum of land, buildings, equipment and vehicles Ln(Total assets) Ln(Total assets in $ + 1) ROA Profits divided by total assets Legal form 1: Limited Liability Company, 2: S-Corporation, 3: C-Corporation Credit line Dummy variable: 1 if the firm has an active bank credit line, and 0 otherwise Market share (Revenues / Industry-year revenues at 2-digit NAICS) x 100 Owner characteristics Owner age Age of the primary owner Years of industry experience Primary owner’s years of experience in industry Week hours Weekly hours dedicated to the venture by the primary owner Start-up experience Number of businesses previously created by the primary owner
Education Educational level of the primary owner. 1: Less than 9th grade, 2: High school not finished, 3: High school, 4: Technical degree, 5: College not finished, 6: Associate degree, 7: Bachelor, 8: Graduate studies not finished, 9: Master, 10: Profess. schools/Doctorate.
Male 1: Male (primary owner), 0 otherwise US born 1: US born (primary owner), 0 otherwise Macroeconomic conditions GDP per capita Yearly GDP per capita at state level collected from Bureau of Economic Analysis Personal income growth Yearly personal income growth at state level collected from Bureau of Economic Analysis Unemployment growth Yearly unemployment growth at state level collected from Bureau of Labor Statistics High/low capital intensive industry
High and low capital intensive industries as defined in Appendix B of Acemoglu and Guerrieri (2007). Based on NAICS industry classification
Instrumental variable Ln(County small bank branches 2004)
Small bank branches per county in 2004. Similar to Berger et al. (2017), we define small banks as those with total assets below $1 billion. Source: Federal Deposit Insurance Corp. (FDIC).

49
Table A2. Correlations Variable 1 2 3 4 5 6 7 8 9 10 11 12 13 14 15
1 Ln(Debt) 1.00 2 Ln(Personal debt) 0.49 1.00 3 Ln(Business debt) 0.50 0.22 1.00 4 Ln(Bank business debt) 0.44 0.20 0.88 1.00 5 Ln(Non-bank business debt) 0.20 0.08 0.40 -0.09 1.00 6 Ln(Out_E) 0.06 0.07 0.10 0.04 0.13 1.00 7 Out_E_Dum 0.06 0.08 0.10 0.04 0.13 0.98 1.00 8 Crisis 0.06 0.01 0.04 0.05 -0.02 -0.03 -0.04 1.00 9 Ln(Revenues) 0.18 0.01 0.16 0.15 0.04 -0.05 -0.05 0.06 1.00
10 Profits -0.03 -0.04 0.00 0.01 -0.01 -0.05 -0.04 0.01 -0.01 1.00 11 Credrisk -0.09 0.04 -0.05 -0.05 -0.01 0.01 0.02 -0.13 -0.10 0.01 1.00 12 Employees 0.14 -0.02 0.17 0.16 0.06 0.08 0.06 0.02 0.20 -0.05 0.00 1.00 13 Hightech -0.01 -0.07 0.00 -0.02 0.03 0.06 0.05 0.01 0.03 -0.01 -0.09 0.02 1.00 14 Ln(Cash) 0.14 -0.07 0.08 0.06 0.05 0.11 0.08 0.04 0.29 -0.01 -0.15 0.19 0.09 1.00 15 Ln(Accounts receivable) 0.23 0.04 0.24 0.22 0.07 0.03 0.02 0.06 0.40 -0.01 -0.09 0.23 0.12 0.31 1.00 16 Ln(Inventory) 0.18 0.13 0.18 0.16 0.07 0.06 0.05 0.02 0.20 -0.02 0.03 0.13 -0.06 0.09 0.17 17 Ln(Fixed assets) 0.18 0.10 0.19 0.18 0.06 0.01 0.00 0.05 0.16 -0.02 -0.06 0.19 -0.07 0.12 0.19 18 ROA 0.02 0.01 0.01 0.01 0.00 0.00 0.00 0.01 0.03 0.00 0.00 0.00 -0.03 0.02 0.01 19 Owner age 0.01 -0.02 -0.01 -0.02 0.00 0.05 0.04 0.10 0.01 0.01 -0.09 0.01 0.03 0.05 -0.01 20 Years of industry exp. -0.01 -0.09 0.00 0.00 0.00 0.05 0.04 0.01 0.05 -0.01 -0.06 0.06 0.14 0.08 0.13 21 Week hours 0.18 0.14 0.16 0.13 0.10 0.10 0.09 0.02 0.22 0.01 0.01 0.12 0.04 0.16 0.29 22 Start-up experience -0.01 0.01 0.03 0.01 0.05 0.12 0.11 0.00 0.04 -0.02 0.01 0.05 0.02 0.05 0.02 23 Education 0.02 -0.04 -0.01 -0.03 0.05 0.10 0.09 -0.01 0.04 -0.01 -0.06 0.05 0.18 0.12 0.03 24 Male 0.06 -0.03 0.06 0.05 0.04 0.05 0.04 0.02 0.07 0.00 -0.02 0.06 0.07 0.12 0.10 25 US born 0.02 -0.01 0.01 0.02 0.00 -0.01 -0.01 -0.01 0.02 0.00 0.02 0.00 -0.06 0.00 0.01
Variable 15 16 17 18 19 20 21 22 23 24
15 Ln(Accounts receivable) 1.00 16 Ln(Inventory) 0.17 1.00 17 Ln(Fixed assets) 0.19 0.20 1.00 18 ROA 0.01 0.01 0.02 1.00 19 Owner age -0.01 0.04 0.04 0.00 1.00 20 Years of industry exp. 0.13 -0.05 0.00 -0.02 0.40 1.00 21 Week hours 0.29 0.17 0.14 0.00 -0.08 0.09 1.00 22 Start-up experience 0.02 0.08 0.05 -0.03 0.18 0.04 -0.02 1.00 23 Education 0.03 -0.07 -0.11 -0.01 0.11 0.01 -0.03 0.05 1.00 24 Male 0.10 0.03 0.03 0.00 0.04 0.20 0.13 0.10 0.04 1.00 25 US born 0.01 -0.01 0.04 0.00 0.02 0.07 -0.03 0.03 -0.15 -0.04
This table reports correlations among the main variables (observations: 5,619). Table A1 defines all variables.
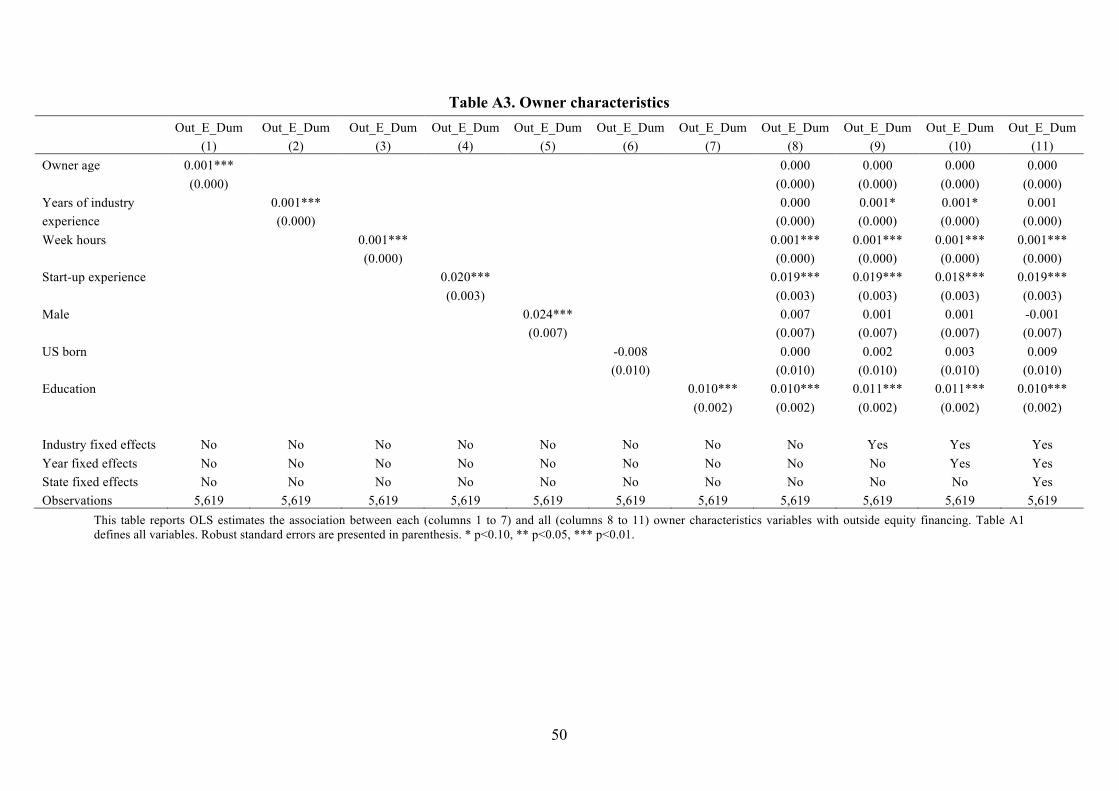
50
Table A3. Owner characteristics Out_E_Dum Out_E_Dum Out_E_Dum Out_E_Dum Out_E_Dum Out_E_Dum Out_E_Dum Out_E_Dum Out_E_Dum Out_E_Dum Out_E_Dum (1) (2) (3) (4) (5) (6) (7) (8) (9) (10) (11) Owner age 0.001***
0.000 0.000 0.000 0.000
(0.000)
(0.000) (0.000) (0.000) (0.000) Years of industry
0.001***
0.000 0.001* 0.001* 0.001
experience
(0.000)
(0.000) (0.000) (0.000) (0.000) Week hours
0.001***
0.001*** 0.001*** 0.001*** 0.001***
(0.000)
(0.000) (0.000) (0.000) (0.000) Start-up experience
0.020***
0.019*** 0.019*** 0.018*** 0.019***
(0.003)
(0.003) (0.003) (0.003) (0.003) Male
0.024***
0.007 0.001 0.001 -0.001
(0.007)
(0.007) (0.007) (0.007) (0.007) US born
-0.008
0.000 0.002 0.003 0.009
(0.010)
(0.010) (0.010) (0.010) (0.010) Education
0.010*** 0.010*** 0.011*** 0.011*** 0.010***
(0.002) (0.002) (0.002) (0.002) (0.002) Industry fixed effects No No No No No No No No Yes Yes Yes Year fixed effects No No No No No No No No No Yes Yes State fixed effects No No No No No No No No No No Yes Observations 5,619 5,619 5,619 5,619 5,619 5,619 5,619 5,619 5,619 5,619 5,619
This table reports OLS estimates the association between each (columns 1 to 7) and all (columns 8 to 11) owner characteristics variables with outside equity financing. Table A1 defines all variables. Robust standard errors are presented in parenthesis. * p<0.10, ** p<0.05, *** p<0.01.

51
Table A4. Propensity score matched groups Propensity Score Sample Full 2004 sample
Low debt group mean Std. dev. High debt
group mean Std. dev. t-test p-value
Mean Std.dev
Ln(Out_E) 1.410 (3.999) 1.656 (4.073) 0.559 1.199 (3.573)
Ln(Revenues) 7.931 (5.177) 8.175 (5.159) 0.652 7.719 (5.290)
Credrisk 3.245 (0.732) 3.277 (0.705) 0.664 3.279 (0.732)
Ln(Cash) 7.571 (4.156) 7.571 (3.711) 1.000 7.090 (4.003)
Ln(Inventory) 3.958 (4.929) 3.837 (4.658) 0.810 3.800 (4.783)
Ln(Total assets) 11.008 (2.221) 11.285 (1.292) 0.144 10.652 (2.115)
Employees 2.897 (8.558) 2.516 (3.63) 0.579 3.212 (9.862)
ROA -0.341 (3.843) -0.658 (2.538) 0.350 -0.355 (1.917)
Week hours 45.446 (24.858) 45.223 (23.443) 0.930 44.813 (23.390)
Start-up experience 1.049 (1.404) 0.967 (1.355) 0.571 0.993 (1.396)
Education 6.592 (2.130) 6.625 (2.063) 0.882 6.665 (1.988)
This table reports the means and standard deviations for the 184 treatment firms (high debt in 2004) and the matched 184 control firms (low debt in 2004) (equation 3). T-test p-values confirm that the matching process has been successful on the specified covariates since no significant differences across groups are observed. The sample is also matched by industry according to NAICS 2-digit codes. The two right columns include descriptive statistics of the full sample in year 2004 when the matching process is performed. Complete definitions for all variables are provided in Table A1.