DEBT POLICY COORDINATION OFFICE | MINISTRY OF FINANCE
47
Transcript of DEBT POLICY COORDINATION OFFICE | MINISTRY OF FINANCE

DEBT POLICY COORDINATION OFFICE | MINISTRY OF FINANCE
PAKISTAN DEBT POLICY STATEMENT 2010‐11

This page is left intentionally blank.

DEBT POLICY STATEMENT 2010‐11
i
Table of Contents Table of Contents ........................................................................................................................................... i
Acknowledgements ....................................................................................................................................... ii
List of Acronyms ........................................................................................................................................... iii
I. Introduction ...................................................................................................................................... 1
II. Debt Policy Statement ...................................................................................................................... 2
III. Principles of Sound Debt Management ............................................................................................ 3
IV. Review of Public Debt ....................................................................................................................... 5
IV.i. Dynamics of Public Debt Burden ............................................................................................... 9
IV.ii. Servicing of Public Debt .......................................................................................................... 12
V. Domestic Debt ................................................................................................................................ 13
V.i. Permanent Debt ...................................................................................................................... 14
V.ii. Floating Debt ........................................................................................................................... 17
V.iii. Unfunded Debt ....................................................................................................................... 19
V.iv. Domestic Debt during Jul‐Sep 2010 ........................................................................................ 21
VI. External Debt & Liabilities ............................................................................................................... 21
Vi.i. Public and Publically Guaranteed Debt ................................................................................... 22
VI.ii. Private Non‐Guaranteed Debt ................................................................................................ 23
VI.iii. IMF Debt ................................................................................................................................. 23
VI.iv. Foreign Exchange Liabilities .................................................................................................... 24
VI.v. External Debt & Liabilities during Jul‐Sep 2010 ...................................................................... 24
VI.vi. Currency Movements and Translational Impact ..................................................................... 24
VI.vii. External Debt Servicing ........................................................................................................... 26
VII. External Sector Assessment ............................................................................................................ 27
VIII. External Debt Sustainability ............................................................................................................ 29
IX. Guarantees ...................................................................................................................................... 31
X. Report on Compliance with FRDL Act 2005 .................................................................................... 33
XI. Debt Strategy .................................................................................................................................. 36
XI.i. Institutional Reforms .............................................................................................................. 38
XII. Concluding Remarks ........................................................................................................................ 38
DEBT POLICY STATEMENT 2010‐11
ii
Acknowledgements
This Policy Statement has been prepared to fulfill the requirement laid out under Section 7 of the Fiscal
Responsibility and Debt Limitation Act 2005. I would like to acknowledge the input of various Ministries,
Departments, Divisions and Agencies, particularly, timely data provision by Budget Wing (MoF),
Economic Affairs Division, and the State Bank of Pakistan. I would like to recognize the effort put in by
Mehwish Ashraf, Financial Analyst (DPCO) in the realization of this comprehensive document.
Masroor Ahmed Qureshi Director General Debt Policy Coordination Office Ministry of Finance

DEBT POLICY STATEMENT 2010‐11
iii
List of Acronyms
BoP Balance of Payments CDNS Central Directorate of National Savings CDR Currency‐to‐Deposit Ratio DSC Defence Savings Certificates DPCO Debt Policy Coordination Office EAD Economic Affairs Division EDL External Debt and Liabilities ENDA Emergency Natural Disaster Assistance FDI Foreign Direct Investment FEE Foreign Exchange Earnings FELs Foreign Exchange Liabilities FER Foreign Exchange Reserves FRDL Act Fiscal Responsibility and Debt Limitation Act GDP Gross Domestic Product IDB Islamic Development Bank IMF International Monetary Fund KESC Karachi Electric Supply Company LTD Long‐term Debt MRTB Market Related Treasury Bills MTB Market Treasury Bill NBP National Bank of Pakistan NHA National Highway Authority NSS National Saving Schemes OTC Over The Counter PAF Pakistan Air Force PASSCO Pakistan Agricultural Storage and Services Corporation Ltd. PEPCO Pakistan Electric Power Company PIA Pakistan International Airline PIB Pakistan Investment Bonds PKR Pakistani Rupee PPA Power Purchase Agreement PPG Public and Publically Guaranteed PSEs Public Sector Enterprises PSM Pakistan Steel Mills SBA Stand by Agreement SBP State Bank of Pakistan SDR Special Drawing Rights SFD Saudi Fund for Development STD Short‐term Debt TCP Trading Corporation of Pakistan TIP Telephone Industries of Pakistan TPD Total Public Debt USD United States Dollar WAPDA Water and Power Development Authority
DEBT POLICY STATEMENT 2010‐11
1
I. Introduction
Sovereign debt has traditionally received much attention as a crucial component of a country’s
macroeconomic and financial policy framework. The conventional view is that debt can stimulate
aggregate demand and output in the short run, but crowds out capital and reduces output in the long
run. High public debt can adversely affect capital accumulation and growth via higher long‐term interest
rates, higher future distortionary taxation, inflation, and greater uncertainty about prospects and
policies. In more extreme cases of a debt crisis, by triggering a banking or currency crisis, these effects
can be magnified. High debt is also likely to constrain the scope for countercyclical fiscal policies, which
may result in higher volatility and further lower growth. Intuitively, high debt may not only increase
uncertainty about economic perspectives and policies but also raise vulnerability to crises, which may be
accompanied by higher macroeconomic volatility.
In many advanced economies, public debt has reached in 2010 levels that had never been reached
before in the absence of a major war. Public debt is projected to rise from an average of about 73
percent of GDP at end‐2007 to about 108 percent of GDP at end‐2015. While this is a direct fall‐out from
the global crisis, debt levels had ratcheted up over many decades before. In most of the G‐7 countries,
they had been used as the ultimate shock absorber—rising in bad times but not declining significantly in
good times. In other words, periods of fiscal tightening typically succeeded in reducing deficits but fell
short of what was needed to reduce the accumulated debt stock. The outlook for public debt ratios in
advanced countries is much more worrisome and concerns of sustainability have come to the fore.
Public debt has also increased in some emerging economies (e.g., in Central and Eastern Europe) during
the recession, although the bulk of these economies have not been hit as hard as advanced economies,
reflecting their relatively healthier fiscal positions before the crisis. Nonetheless, emerging economies
tend to have a lower debt tolerance, owing to narrower and more volatile revenue bases, and are
exposed to spillover from solvency risks in advanced sovereigns. Resultantly, the public debt ratio of
emerging economies, which has increased much less as a result of the crisis, is expected to stabilize
already this year and resume a downward trend in 2011.
Pakistan’s debt dynamics have been witnessing gradual erosion since FY2007‐08. The improving debt
dynamics has been reversed and the total public debt‐to‐GDP ratio is hovering above 60 percent. A
myriad of domestic issues and the international credit crisis impacted the country’s debt position. High

DEBT POLICY STATEMENT 2010‐11
2
interest payments, large subsidies, growing security spending needs as well as inability to aggressively
tap the already narrow tax base besides not stretching the tax regime to un‐taxed sectors of the
economy led to a wide fiscal gap with a direct bearing on debt sustainability.
The domestic financial sector remained largely insulated from the direct consequences of the global
financial crisis. However, the sharp rise in international oil and food prices rapidly expanded
macroeconomic imbalances in Pakistan. In the absence of adequate measures to address the
imbalances, the economy slid into a balance of payments crisis. By mid‐October 2008, the foreign
exchange reserves had plummeted and the nominal exchange rate had depreciated significantly.
In response, Pakistan developed a macro‐economic stabilization program supported by the IMF. In
November 2008, Pakistan signed a 23‐month SBA program with the IMF amounting to US$ 7.61 billion,
which was later augmented to US$ 11.33 billion in August 2009 and subsequently extended to
September 2011. Favourable developments in the external sector were a value addition to this program
while fiscal problems have continued. Consequently, large amount of debt has been accumulated to
finance the large budget deficit.
II. Debt Policy Statement
The Debt Policy Statement is presented to fulfill the requirement in Section 7 of the Fiscal Responsibility
and Debt Limitation (FRDL) Act 2005. The statement provides an overview of the public debt as well as
external debt and liabilities and explains the changes to debt over the 2008‐09.
Section 7 of FRDL Act 2005 requires that:
(1) The Federal Government shall cause to be laid before the National Assembly, the debt policy
statement by the end of January of each year.
(2) The purpose of the debt policy statement is to allow the assessment of the Federal Government’s
debt policies against the principles of sound fiscal and debt management and debt reduction path.
(3) In particular and without prejudice to the provisions of sub‐section (2) the debt policy statement
shall, inter alia, contain –

DEBT POLICY STATEMENT 2010‐11
3
(a) Assessment of the Federal Government's success or failure in meeting the targets of total public
debt to estimated gross domestic product for any given year as specified in the debt reduction
path;
(b) Evaluations of external and domestic borrowing strategies and provide advice on these
strategies;
(c) Evaluations of the nominal and real costs of external and domestic borrowing and suggest ways
to contain these costs;
(d) Analysis of the foreign currency exposure of Pakistan's external debt;
(e) Consistent and authenticated information on public and external debt and guarantees issued by
the Government with ex post facto budgetary out‐turns of all guarantees and those of other
such claims and commitments;
(f) Information of all loan agreements contracted, disbursements made thereof and repayments
made thereon, if any, by the Government during the fiscal year; and
(g) Analysis of trends in public debt and external debt and steps taken to conform to the debt
reduction path as well as suggestions for adjustments, if any, in the Federal Government's
overall debt strategy.
III. Principles of Sound Debt Management
Debt management strategy is an essential complement to sound macroeconomic policies and the
judicious choice of policy regime in achieving financial stability. Debt management is also perceived as
an important factor that underpins the credibility and reputation of a sovereign, and conditions the
stability of debt capital markets and the financial institutions that hold public debt. The sharp increase in
debt levels in developed countries and the recent contagion fears in Euro Area countries through the
banking systems have reinforced this perception.
Public debt management represents optimization in the cost‐risk space within the constraints set by
macroeconomic policy; in the long run, even the best public debt managers cannot substitute for
unsound policy making. At a strategic level, debt management plays a vital role in securing the economic
benefits of a sound policy framework in several ways. First, improvements in the debt structure can be
an essential complement to fiscal consolidation in ensuring a robust recovery. Second, such
improvements, when implemented opportunistically, can strengthen the effectiveness of managing
public debt going forward, at a relatively low cost.

DEBT POLICY STATEMENT 2010‐11
4
Domestic and external debt should be treated separately. Domestic debt is a charge on budget and must
be serviced through government revenues and/or additional borrowings whereas external debt (both
public and private), in addition to government revenues, is also a charge on balance of payments and
must be serviced from foreign exchange earnings, reserve drawdown, and additional borrowings.
Therefore, the two should be managed separately to ensure fiscal and external account solvency. Each
of these types of debt has its own benefits and drawbacks, with a trade‐off between costs of borrowing
and exposure to various types of risks that needs to be balanced in order to ensure ample and timely
access to cost efficient funding. A comprehensive approach to managing domestic debt must place a
high priority on the development of domestic capital markets, and avoid the crowding‐out of the private
sector.
The level of debt depends on the debt servicing capacity of the economy i.e. export earnings and
revenue generation. The debt burden can be expressed in terms of stock ratio i.e. Debt to GDP, External
Debt (EDL) to GDP or flow ratios i.e. Debt to Revenue, External Debt to Foreign Exchange Earnings (FEE).
It is common practice to measure public debt burden as a percentage of GDP; however, it makes more
sense to measure debt burden in terms of flow ratios because earning potential reflects more accurately
on repayment capacity as GDP changes do not fully translate in to revenues particularly in case of
Pakistan where taxation systems are inelastic and taxation machinery is weak.
As a rule of thumb, as long as the real growth of revenue is higher than the real growth of debt, the Debt
to Revenue ratio will not increase. Crucially, future levels of debt hinge around the primary balance of
the government. Mathematically, if the primary balance (fiscal deficit before interest payments) is zero
and the growth in revenue is higher than the cost of invested funds, the debt burden will ease. Bridging
the gap between revenues and non‐interest expenditure, and ensuring a reduction (generation) in
primary deficit (surplus) is an essential pre‐requisite that facilitates debt management efforts.
Managing the levels of external debt, and the risks associated with them pose policy makers with a
different set of challenges. In this case, if the growth in FEE exceeds the growth in External Debt, the
ratio of EDL‐to‐FEE will continue to decline. Although external debt expressed as a percentage of GDP
and export earnings depicts the levels and burden of external debt, a clear insight in to the future path
of debt is gained by analyzing the non‐interest current account deficit. A nil current account deficit
before interest payment and higher growth in FEE compared to the interest rate paid on EDL will ensure
a decline in EDL‐to‐FEE over time. Focusing on limiting the non‐interest current account deficit, while
DEBT POLICY STATEMENT 2010‐11
5
ensuring that the cost of borrowing is kept at a minimum restricts the increases in debt levels in the
medium to long‐term; while partially mitigates the inherent risks of external borrowing.
IV. Review of Public Debt
Public debt has important influence over the economy both in the short and the long run. Higher public
debt raises solvency risks, constrains the capacity to use fiscal policy as a countercyclical tool, and can
increase borrowing costs for sovereigns. Ultimately, increase in public debt may reduce output growth
and productivity. Pakistan managed to temporarily reverse the upward debt trend during FY2006 and
FY2007, but this reduction has been dwarfed by the surge in the debt ratio by nearly 5.3 percentage
points since. Out of this increase of 5.3 percent, borrowing for balance of payments (BoP) support
including IMF contributed 3.0 percent of GDP since FY2007.
The total public debt stood at Rs. 8,894 billion as of June 30, 2010, an increase of Rs. 1,265 billion or 16.6
percent higher than the debt stock at the end of last fiscal year (See Table 1). Government borrowed Rs.
798 billion from domestic sources and Rs. 189 billion from external sources to finance the fiscal
operations. Additionally, government borrowed SDR 2,145 million or Rs. 271 billion from IMF for balance
of payment support (that included budget support under the bridge financing facility) and incurred an
exchange loss of Rs. 200 billion on the external debt portfolio owing to rupee depreciation against US
dollar. The Pak Rupee depreciated by 5 percent during FY2010 compared to 19.2 percent in FY2009.
Fiscal consolidation witnessed during FY2009 was reversed in FY2010 due to lower growth of revenue
compared to budgeted growth, higher subsidies and security related expenditures; the fiscal deficit
increased from 5.3 percent of GDP in FY2009 to 6.3 percent in FY2010. The current account deficit was
2.3 percent of GDP compared to 5.7 percent of last fiscal year. Fall in international commodity prices
coupled with import compression measures resulted in restrained growth of imports, whereas exports
grew by 2.9 percent that resulted in significantly reduced current account deficit. However faster global
economic recovery and increase in international commodity prices will limit or reverse the gains
achieved this year, going forward.

DEBT POLICY STATEMENT 2010‐11
6
Non‐materialization of Tokyo pledges forced the government to request IMF for bridge finance to cover
the financing shortfall. This facility was made available in FY2010 on the pre‐text that the budget will
draw on this account to finance its priority needs until Tokyo‐related pledges are disbursed and that the
budget will replenish the dedicated account to the amount borrowed from the Fund as Tokyo‐related
pledges are disbursed.
The primary source of increase in public debt during 2009‐10 has been a rapid increase in local currency
component that accounted for 63.1 percent of the total increase in TPD. The main reasons for this shift
in borrowing were the non‐materialization of Tokyo pledges, slow disbursement from multilateral and
bilateral donors and higher than budgeted fiscal deficit.
The external debt component grew by Rs. 467 billion or 12.4 percent due to increased foreign public
debt inflows on the one hand, and depreciation of the Rupee on the other hand. Rupee lost
approximately 5 percent of its value against the US dollar during 2009‐10. An increase of around Rs. 200
billion, approximately 16 percent of the total increase in TPD, was due to the exchange rate movement.
Appreciation of the US Dollar against other major currencies caused the foreign currency component of
public debt to decrease by US $440 million. However, capital gain on foreign currency debt was
mitigated by 5 percent depreciation of Pak Rupee against US Dollar. This capital loss on foreign currency
FY06 FY07 FY08 FY09 FY10 FY11*
Domestic Currency Debt 2,320 2,600 3,266 3,853 4,651 4,956Foreign Currency Debt 2,038 2,201 2,778 3,776 4,243 4,517Total Public Debt 4,357 4,802 6,044 7,629 8,894 9,473
Domestic Currency Debt 30.4 30.0 31.9 30.2 31.7 28.8Foreign Currency Debt 26.7 25.4 27.1 29.6 28.9 26.3Total Public Debt 57.2 55.4 59.0 59.9 60.6 55.1
Domestic Currency Debt 215 200 218 208 224 199Foreign Currency Debt 189 170 185 204 204 182Total Public Debt 405 370 403 412 428 381
Domestic Currency Debt 53.2 54.2 54.0 50.5 52.3 52.3Foreign Currency Debt 46.8 45.8 46.0 49.5 47.7 47.7Memo:Foreign Currency Debt (in US$ Bill ion) 33.8 36.4 40.7 46.4 49.6 52.4Exchange Rate (Rs./US$, E.O.P) 60.2 60.4 68.3 81.4 85.5 86.3GDP (in Rs. Bill ion) 7,623 8,673 10,243 12,739 14,668 17,182Total Revenue (in Rs. Bill ion) 1,077 1,298 1,499 1,851 2,078 2,485
*end‐September 2010Source: EAD, SBP, Budget Wing, MoF and DPCO staff calculations
Table 1. Public Debt, FY06‐FY11*
(In billions of Rs.)
(In percent of GDP)
(In percent of Revenue)
(In percent of Total Debt)
DEBT POLICY STATEMENT 2010‐11
7
debt, however, is mitigated by the strong concessionality element associated with Pakistan’s external
loans. The impact of any currency shock should not be looked at in isolation, but rather be analyzed in
the context of interest rate differential. The increase in the foreign currency component of TPD also
includes IMF BoP support that is not used to fund budgetary operations, but to strengthen Pakistan’s
foreign exchange reserves.
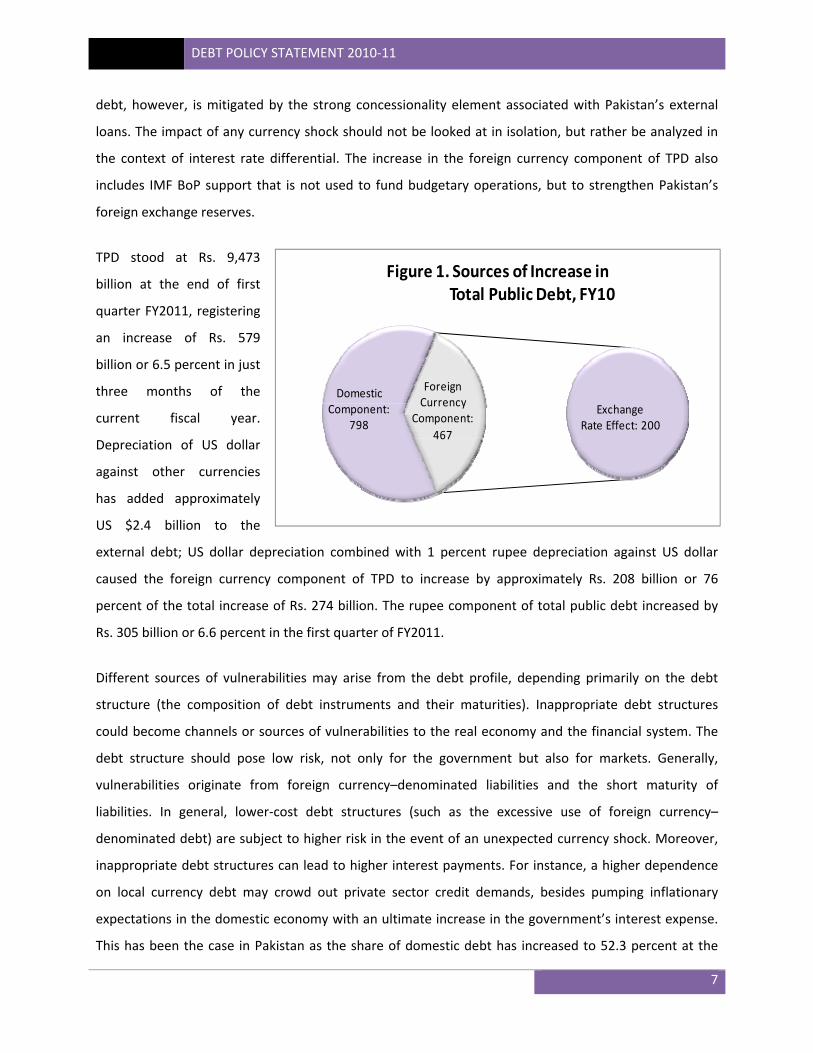
TPD stood at Rs. 9,473
billion at the end of first
quarter FY2011, registering
an increase of Rs. 579
billion or 6.5 percent in just
three months of the
current fiscal year.
Depreciation of US dollar
against other currencies
has added approximately
US $2.4 billion to the
external debt; US dollar depreciation combined with 1 percent rupee depreciation against US dollar
caused the foreign currency component of TPD to increase by approximately Rs. 208 billion or 76
percent of the total increase of Rs. 274 billion. The rupee component of total public debt increased by
Rs. 305 billion or 6.6 percent in the first quarter of FY2011.
Different sources of vulnerabilities may arise from the debt profile, depending primarily on the debt
structure (the composition of debt instruments and their maturities). Inappropriate debt structures
could become channels or sources of vulnerabilities to the real economy and the financial system. The
debt structure should pose low risk, not only for the government but also for markets. Generally,
vulnerabilities originate from foreign currency–denominated liabilities and the short maturity of
liabilities. In general, lower‐cost debt structures (such as the excessive use of foreign currency–
denominated debt) are subject to higher risk in the event of an unexpected currency shock. Moreover,
inappropriate debt structures can lead to higher interest payments. For instance, a higher dependence
on local currency debt may crowd out private sector credit demands, besides pumping inflationary
expectations in the domestic economy with an ultimate increase in the government’s interest expense.
This has been the case in Pakistan as the share of domestic debt has increased to 52.3 percent at the
Domestic Component:
798Exchange
Rate Effect: 200
Foreign Currency
Component: 467
Figure 1. Sources of Increase inTotal Public Debt, FY10

DEBT POLICY STATEMENT 2010‐11
8
end of June 2010 from 50.5 percent in 2008‐09. And the foreign currency component declined to 47.7
percent from 49.5 percent respectively.
There has been a major shift in fiscal deficit financing patterns. Since FY2008, almost 80 percent of the
fiscal deficit has been financed from the domestic sources whereas during FY2002‐07 only 47 percent of
fiscal deficits were financed through local currency borrowing. This huge borrowing need of the
government in absence of liquid debt capital markets and policy of net zero quarterly borrowing from
SBP has increased the domestic interest rates. This has also strengthened the already strong inflationary
expectations in the economy; FY2011 would be the fourth consecutive year of double digit inflation,
unprecedented in the history of the country. There is a need to reduce fiscal deficit to avoid imbalance
in the external account as excess demand created by large fiscal deficits will put the current account
under pressure and will trigger further monetary tightening and currency depreciation to secure the
external account.
53.2 54.2 54.050.5 52.3
46.8 45.8 46.049.5 47.7
FY06 FY07 FY08 FY09 FY10
Figure 2. Composition of Total Public Debt,FY06‐FY10
Domestic Currency Debt Foreign Currency Debt
DEBT POLICY STATEMENT 2010‐11
9
IV.i. Dynamics of Public Debt Burden
Being a measure of total government indebtedness, public debt is a reflection of developments in fiscal
operations on one hand, and changes in the external sector on the other hand. Furthermore, the
performance of the real sector of the economy has a bearing on debt levels. With regards to fiscal
operations, expenditure in excess of revenue means additional emphasis on debt creation. However, if
growth in revenues exceeds growth in expenditure, debt burden will be lowered. Similarly with regards
to external account, the interaction of imports (expense) and exports (revenues) and the resulting
current account balance is a key in determining the borrowing requirements of the economy.
Macroeconomic performance of the economy as measured by GDP growth and changes in price level
also impact the burden placed by a country’s debt obligations.
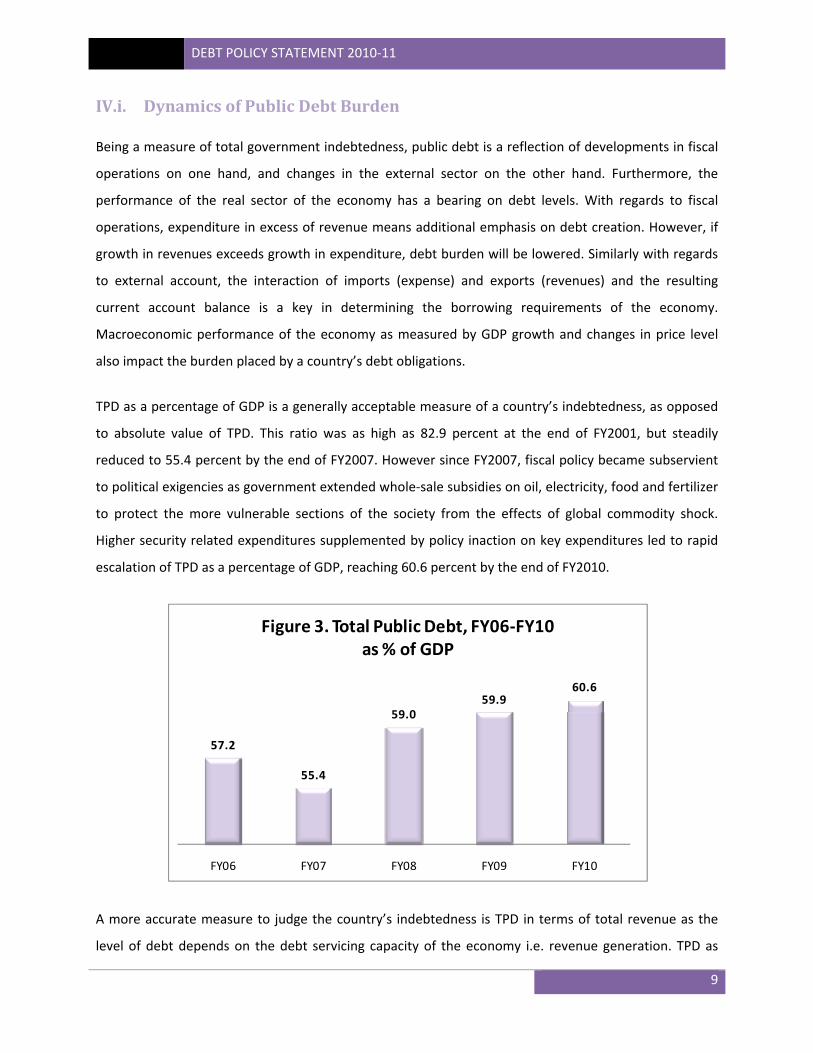
TPD as a percentage of GDP is a generally acceptable measure of a country’s indebtedness, as opposed
to absolute value of TPD. This ratio was as high as 82.9 percent at the end of FY2001, but steadily
reduced to 55.4 percent by the end of FY2007. However since FY2007, fiscal policy became subservient
to political exigencies as government extended whole‐sale subsidies on oil, electricity, food and fertilizer
to protect the more vulnerable sections of the society from the effects of global commodity shock.
Higher security related expenditures supplemented by policy inaction on key expenditures led to rapid
escalation of TPD as a percentage of GDP, reaching 60.6 percent by the end of FY2010.
A more accurate measure to judge the country’s indebtedness is TPD in terms of total revenue as the
level of debt depends on the debt servicing capacity of the economy i.e. revenue generation. TPD as
57.2
55.4
59.059.9
60.6
FY06 FY07 FY08 FY09 FY10
Figure 3. Total Public Debt, FY06‐FY10as % of GDP

DEBT POLICY STATEMENT 2010‐11
10
times of Government Revenues fell from as high as 6.3 times in 2000‐01 to 3.7 times by 2006‐07.
However due to the prevalent conditions in the economy, both domestic and international, TPD
increased to 4.0 times of Government Revenues by the end of 2007‐08. Since FY2008, the growth in
revenue is not keeping pace with the growth in debt thus resulting in deterioration of this critical
indicator to 4.3 times by 2009‐10, i.e. TPD is now more than four times of government total revenues. It
is important to note that TPD also includes IMF SBA facility for BoP support which is reflected in the
foreign exchange reserves of the SBP. Government should aim to bring TPD below 3.5 times of its
revenues.
Obligations in respect of debt servicing have increased over the recent past as the debt service‐to‐
revenue ratio increased from 29.6 percent in FY2005‐06 to 46.6 percent in 2008‐09. However, debt
service as a percentage of total revenue witnessed a drop in FY2010 to 40.4 percent. This indicator has
improved largely on account of a phasing out of lumpy payments for high cost zero‐coupon Defence
Savings Certificates (DSCs) sold in the late 1990s. These instruments started maturing in FY2008,
undermining the servicing of domestic debt in the initial years of their issue but inflated the service
payments on domestic front in FY2008 and FY2009 as the interest is paid at maturity. Ideally, this ratio
should be below 30 percent to allow government to allocate more resources towards social and poverty
related expenditure.
Table 2 depicts trends in various indicators in real terms (after adjusting for changes in price level).
Double‐digit inflation has been a persistent macro‐economic phenomenon since 2007‐08. Against a real
405
370
403412
428
FY06 FY07 FY08 FY09 FY10
Figure 4. Total Public Debt, FY06‐FY10as % of Govt.Rev

DEBT POLICY STATEMENT 2010‐11
11
GDP growth of 3.7 percent in FY2007‐08, revenues exhibited a negative real growth of 0.6 percent while
the non‐interest expenditure recorded a 7.7 percent expansion in real terms. To close this mismatch,
heavy reliance on debt creating flows in the absence of any capital flows meant a 8.3 percent growth in
the stock of total public debt after adjusting for inflation (12 percent for FY2007‐08).
A lower GDP growth and rising inflation in the succeeding year led to a revenue growth of 2.6 percent in
real terms, whereas the growth in primary spending was encouragingly negative. As a result, real growth
in TPD moderated to 4.9 percent in 2008‐09. Nonetheless, it was higher in FY2009‐10. Given the
alarming expansion in non‐interest expenditure (a growth of 13.5 percent was witnessed in 2009‐10 in
real terms even though inflationary pressures receded), and a 2.0 percent real growth in revenues, the
public debt levels were contained to 5.9 percent. The revenue to GDP ratio is steadily declining since
early nineties. Even during 1999‐2004, that witnessed the lowest average fiscal deficit in the last twenty
years, the reduction in deficit came about on account of lower fiscal expenditure and not higher
revenues.
FY06 FY07 FY08 FY09 FY10Real Growth of Public Debt ‐3.0 2.3 8.3 4.9 5.9
Real Growth of Revenues 8.3 11.9 ‐0.6 2.6 2.0
Real Growth in Non Interest Expenditure 14.9 6.2 7.7 ‐12.1 13.5
Real Growth of GDP 5.8 6.8 3.7 1.2 4.1
Public Debt/GDP 57.2 55.4 59.0 59.9 60.6
Public Debt/Revenue 405 370 403 412 428
Debt Service/Revenue 29.6 33.8 37.2 46.6 40.4
Table 2. Selected Debt Indicators
Source: Budget Wing, SBP and DPCO staff calculations
Real Growth ofRevenues
Real Growth ofPublic Debt
Public Debt Burden
FY06 8.3 ‐3.0 ‐11.3
FY07 11.9 2.3 ‐9.6
FY08 ‐0.6 8.3 8.9
FY09 2.6 4.9 2.3
FY10 2.0 5.9 3.9
Table 3. Real Growth of Public Debt Burden
Source: DPCO staff calculations
DEBT POLICY STATEMENT 2010‐11
12
Although total public debt has been constantly increasing in nominal terms, the trend of negative
growth of the debt burden has only been reversed in the previous three years. A closer look at the
dynamics of the debt burden points towards lower growth in real revenues as the main cause of the
deterioration of this indicator. As shown in Table 3, real growth in revenues was encouraging during
2005‐06 and 2006‐07, however, revenue collection suffered a reduction in real terms since then.
Coinciding with the drop in real revenue growth, total public debt in real terms which shrunk by 3.0
percent in 2005‐06, began to increase in the following years. The unprecedented events of 2007‐08, and
the heavy and sustained borrowing to cover widening fiscal deficits led the TPD to grow in real terms,
whereas real revenue growth was lower than the growth of TPD. The combination of an increasing level
of debt and lower growth of revenues in real terms has meant that the debt burden of the economy has
increased in the previous three years. The growing debt burden of the government highlights the
importance of increased revenue generation going forward. As witnessed during 2009‐10, even
relatively weak real growth of the level of debt can severely increase the debt burden of the economy if
revenue collection in real terms is not up to par. Government needs to take immediate revenue
generation measures as future payments on account of IMF SBA will increase the quantum of debt
servicing, ultimately increasing pressure on government resources.
IV.ii. Servicing of Public Debt
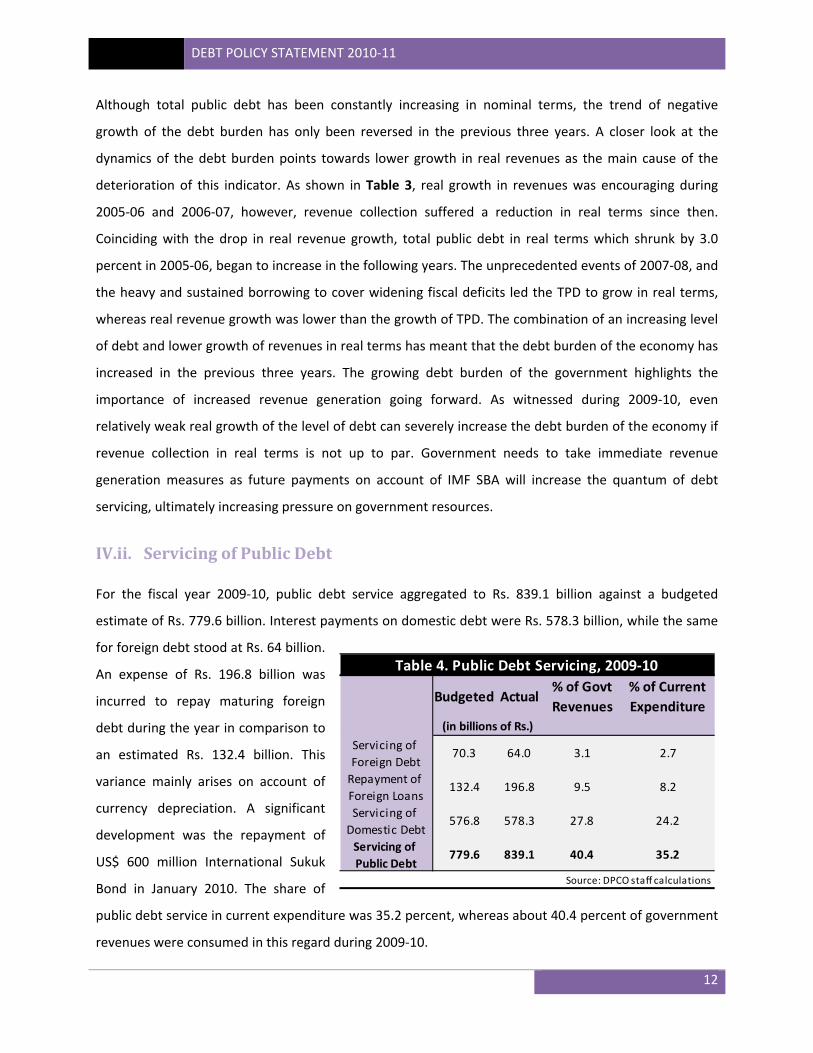
For the fiscal year 2009‐10, public debt service aggregated to Rs. 839.1 billion against a budgeted
estimate of Rs. 779.6 billion. Interest payments on domestic debt were Rs. 578.3 billion, while the same
for foreign debt stood at Rs. 64 billion.
An expense of Rs. 196.8 billion was
incurred to repay maturing foreign
debt during the year in comparison to
an estimated Rs. 132.4 billion. This
variance mainly arises on account of
currency depreciation. A significant
development was the repayment of
US$ 600 million International Sukuk
Bond in January 2010. The share of
public debt service in current expenditure was 35.2 percent, whereas about 40.4 percent of government
revenues were consumed in this regard during 2009‐10.
Budgeted Actual % of Govt Revenues
% of Current Expenditure
Servicing of Foreign Debt
70.3 64.0 3.1 2.7
Repayment of Foreign Loans
132.4 196.8 9.5 8.2
Servicing of Domestic Debt
576.8 578.3 27.8 24.2
Servicing of Public Debt
779.6 839.1 40.4 35.2
Table 4. Public Debt Servicing, 2009‐10
Source: DPCO staff calculations
(in billions of Rs.)

DEBT POLICY STATEMENT 2010‐11
13
Even though these indicators have improved in comparison to previous years, an increasing
concentration of financing mix towards internal sources and higher domestic interest rates on account
of tight monetary policy indicate a persistent burden of servicing expense on the government’s
budgetary position.
V. Domestic Debt
Domestic debt markets and particularly, bond markets are a complementary source of finance. Notably,
the government has a ‘market‐completion’ role in the development of the debt market. The presence of
a well‐functioning government debt market helps build and develop efficient financial markets. Financial
market development is essential for ensuring stable economic growth. A sound financial market allows a
country’s savings to be channeled into investments in a more effective way. More efficient financial
markets also allow for longer‐term loans for individuals and companies. Such loans help boost
investment in a more stable way, allowing the financial system to promote an efficient allocation of
capital and transformation of maturities. Given their size and lower risk relative to other domestic
issuers, public debt issues are the appropriate instrument with which to facilitate this process. In doing
so, the government effectively establishes the benchmark for the pricing of private sector debt
instruments.
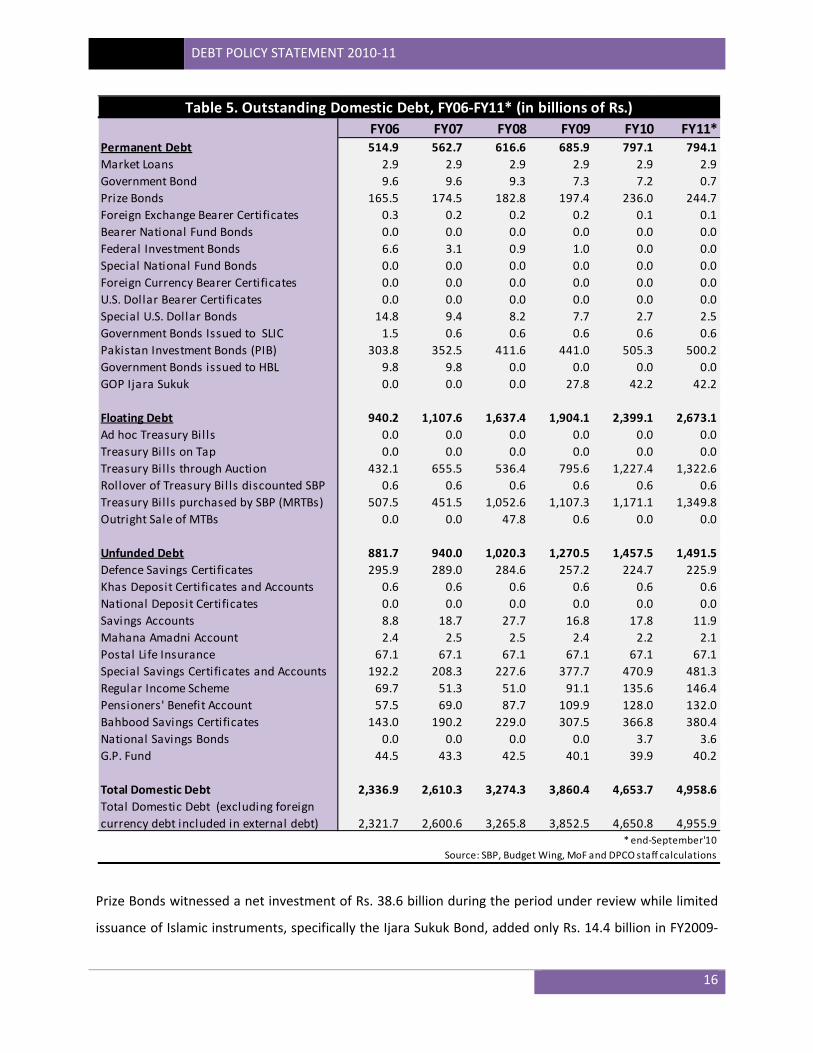
Domestic debt stood at Rs. 4,653.7 billion as of end‐June 2010, adding Rs. 793.3 billion in one year. The
growth of 20.5 percent in FY2009‐10 is 2.6 percentage points higher than FY2008‐09. In percent of GDP,
30.7 30.1
32.030.3
31.7
FY06 FY07 FY08 FY09 FY10
Figure 5. Domestic Debt, FY06‐FY10as % of GDP

DEBT POLICY STATEMENT 2010‐11
14
domestic debt increased to 31.7 percent during 2009‐10 from 30.3 percent over 2008‐09. An emphasis
on deficit financing through internal sources owing to non‐availability of external receipts has been the
prime cause.
The composition of domestic debt has undergone some radical changes in recent years. No doubt,
floating debt (short term domestic debt) has always been dominated in comparison to permanent and
unfunded debt, but a growing share of short term debt is worrisome. At the end of FY2009‐10, floating
debt accounted for 51.6 percent of the total domestic debt, 2.3 percentage points higher than that of
end‐FY2009. On the contrary, unfunded debt (NSS instruments) contributed 31.3 percent to the total
stock at June 30, 2010 against a share of 32.9 percent in the preceding year. In the same spell, 17.1
percent of the outstanding FY2010 domestic debt was concentrated in permanent debt (long term
domestic debt) when compared to a contribution of 17.8 percent in the stock of end‐June 2009.
Nonetheless, an increasingly short‐tenured internal debt is undesirable and poses risk in form of
refinancing/roll‐over, liquidity and interest rate risks. This tendency in local currency government debt
needs to be replaced by an increased focus on medium and long‐term market issuances.
Below is a detailed analysis of domestic debt categories:
V.i. Permanent Debt
The stock of medium to long term domestic debt, also known as permanent debt, posted a growth of
16.2 percent to end the year at Rs. 797.1 billion. An increase of Rs. 111.3 billion during FY2009‐10 in
16
21
26
31
36
41
46
51
FY06 FY07 FY08 FY09 FY10
In percent
Figure 6. Structure of Domestic Debt,FY06‐FY10
Floating Debt
Permanent Debt
Unfunded Debt
DEBT POLICY STATEMENT 2010‐11
15
comparison to an addition of Rs. 69.3 billion in the preceding year has mainly come at the back of heavy
receipts in Pakistan Investment Bonds (PIBs). Owing to dull economic activity in the country and
anticipation of a decline in inflationary trends, the market offered healthy bids. On the supply‐side, the
government exhibited greater appetite for borrowing through PIBs. In the absence of any large PIB
maturity during the year, Rs. 64.3 billion was fetched from the market as the SBP conducted five
successful auctions during 2009‐10. During the fiscal year, the SBP increased the share of non‐
competitive bids from 10 to 15 percent in the respective auctions. This was aimed at encouraging non‐
financial institutions and individuals to invest in government securities; thereby broadening the
distribution base.
The government’s credibility and commitment to market‐based funding costs in the primary market has
improved. One factor is the publication of, and adherence to, an auction calendar, which enables the
market to plan for issuance and better absorb the government’s funding needs. Another important
development has been the discontinuation of applying low or arbitrary cut‐off yields in auctions.
Instead, the volumes announced in the calendars are mostly complied with. This has been another
factor that has enhanced the credibility of the government as a price‐taker, instead of being a price‐
maker, in the primary market.
To increase the efficiency and depth of both the primary and secondary markets of government
securities, SBP has taken a number of measures in the recent past. An important measure in this regard
is the introduction of an electronic platform for the trading of government securities, which was
launched in January FY2010 (See Box 1). Prior to the launch of this system, government securities were
traded in the OTC (Over The Counter) market. This system of trading was not only cumbersome and
required considerable time and effort to settle a deal, but also limited scheduled banks’ ability to gauge
the real‐time demand and supply of securities in the market. This rendered the pricing mechanism of
securities in the secondary market sub‐optimal; risking a dead‐weight loss. Moreover, in the absence of
a centralized system, participants in the money market spent considerable time in finding a profitable
deal. Available data shows that the cumulative trading of government securities through this platform
reached 66 percent of the total trading volume by end‐FY2010, compared to a level of 58.0 percent in
January FY2010.
DEBT POLICY STATEMENT 2010‐11
16
Prize Bonds witnessed a net investment of Rs. 38.6 billion during the period under review while limited
issuance of Islamic instruments, specifically the Ijara Sukuk Bond, added only Rs. 14.4 billion in FY2009‐
FY06 FY07 FY08 FY09 FY10 FY11*Permanent Debt 514.9 562.7 616.6 685.9 797.1 794.1Market Loans 2.9 2.9 2.9 2.9 2.9 2.9Government Bond 9.6 9.6 9.3 7.3 7.2 0.7Prize Bonds 165.5 174.5 182.8 197.4 236.0 244.7Foreign Exchange Bearer Certificates 0.3 0.2 0.2 0.2 0.1 0.1Bearer National Fund Bonds 0.0 0.0 0.0 0.0 0.0 0.0Federal Investment Bonds 6.6 3.1 0.9 1.0 0.0 0.0Special National Fund Bonds 0.0 0.0 0.0 0.0 0.0 0.0Foreign Currency Bearer Certificates 0.0 0.0 0.0 0.0 0.0 0.0U.S. Dollar Bearer Certificates 0.0 0.0 0.0 0.0 0.0 0.0Special U.S. Dollar Bonds 14.8 9.4 8.2 7.7 2.7 2.5Government Bonds Issued to SLIC 1.5 0.6 0.6 0.6 0.6 0.6Pakistan Investment Bonds (PIB) 303.8 352.5 411.6 441.0 505.3 500.2Government Bonds issued to HBL 9.8 9.8 0.0 0.0 0.0 0.0GOP Ijara Sukuk 0.0 0.0 0.0 27.8 42.2 42.2
Floating Debt 940.2 1,107.6 1,637.4 1,904.1 2,399.1 2,673.1Ad hoc Treasury Bills 0.0 0.0 0.0 0.0 0.0 0.0Treasury Bills on Tap 0.0 0.0 0.0 0.0 0.0 0.0Treasury Bills through Auction 432.1 655.5 536.4 795.6 1,227.4 1,322.6Rollover of Treasury Bills discounted SBP 0.6 0.6 0.6 0.6 0.6 0.6Treasury Bills purchased by SBP (MRTBs) 507.5 451.5 1,052.6 1,107.3 1,171.1 1,349.8Outright Sale of MTBs 0.0 0.0 47.8 0.6 0.0 0.0
Unfunded Debt 881.7 940.0 1,020.3 1,270.5 1,457.5 1,491.5Defence Savings Certificates 295.9 289.0 284.6 257.2 224.7 225.9Khas Deposit Certificates and Accounts 0.6 0.6 0.6 0.6 0.6 0.6National Deposit Certificates 0.0 0.0 0.0 0.0 0.0 0.0Savings Accounts 8.8 18.7 27.7 16.8 17.8 11.9Mahana Amadni Account 2.4 2.5 2.5 2.4 2.2 2.1Postal Life Insurance 67.1 67.1 67.1 67.1 67.1 67.1Special Savings Certificates and Accounts 192.2 208.3 227.6 377.7 470.9 481.3Regular Income Scheme 69.7 51.3 51.0 91.1 135.6 146.4Pensioners' Benefit Account 57.5 69.0 87.7 109.9 128.0 132.0Bahbood Savings Certificates 143.0 190.2 229.0 307.5 366.8 380.4National Savings Bonds 0.0 0.0 0.0 0.0 3.7 3.6G.P. Fund 44.5 43.3 42.5 40.1 39.9 40.2
Total Domestic Debt 2,336.9 2,610.3 3,274.3 3,860.4 4,653.7 4,958.6Total Domestic Debt (excluding foreigncurrency debt included in external debt) 2,321.7 2,600.6 3,265.8 3,852.5 4,650.8 4,955.9
* end‐September'10Source: SBP, Budget Wing, MoF and DPCO staff calculations
Table 5. Outstanding Domestic Debt, FY06‐FY11* (in billions of Rs.)

DEBT POLICY STATEMENT 2010‐11
17
10. A growth of 52 percent is lower against a healthy inflow of Rs. 27.8 billion in the fiscal year 2008‐09.
The supply‐side issues gain prominence when reason for this reduction is analyzed as the Islamic
banking industry is in need to invest in SLR eligible instruments. As Islamic financial instruments require
a tangible underlying asset, operational difficulties in arranging the infrastructure delayed the re‐
issuance of these bonds. The Ijara Sukuk bonds were recently re‐issued in November 2010.
Box 1: Electronic Bond Trading Platform
SBP launched the electronic bond trading platform for fixed‐income securities on January 11, 2010. Previously, all
securities were traded in the inter‐bank market either through individual dealing terminals or through telephones,
with no real‐time source of information. This used to result in delayed deal execution, inefficient pricing
mechanism, enhanced credit/liquidity risk, and unproductive utilization of liquidity available in the market.
The availability of real‐time information about yields and turnover will help the issuer in determining demand for its
paper and make better funding decisions. It will also attract more investors to the market as the price discovery
process becomes much easier resulting in liquidity enhancement and reduced liquidity premium. This will also
result in the development of liquid yield curves for various market segments. Since Bloomberg subscribers pay no
additional cost for this platform, they will save on broker commissions by using it more frequently which should
result in narrower spreads, ceteris paribus.
With a widened investor base, banks will be able to shift government debt from their books freeing up funds for
private sector credit. Overtime, it will also facilitate the development of ABS market in Pakistan as investors
become more comfortable with fixed income instruments resulting in increased lending capacity for banks.
The fact that Bloomberg is offering its services in all the major financial markets in the world is another advantage
of the system as it will provide international investors with an additional window on Pakistan’s economy.
Source: State Bank of Pakistan
V.ii. Floating Debt
During FY2009‐10, floating debt grew by 26 percent as opposed to an augmentation of 16.3 percent in
the fiscal year 2008‐09, given the renewed interest of banks in extending budgetary financing to the
government. Much of the proceeds accrued through Market Treasury Bills (MTBs) as Rs. 431.8 billion
was added to the stock of June 30, 2010. Subdued private sector credit demand and risk aversion on
part of financial institutions provided ample space to the banking sector for investing heavily in risk‐free

DEBT POLICY STATEMENT 2010‐11
18
government securities. Moreover, declining discount rate throughout the year restricted banks to limit
their interest to 12‐month government paper.
With a view to providing investment opportunities to small investors and institutions who wish to risk
non‐acceptance of bids to invest directly in MTBs, SBP introduced the non‐competitive bid option with a
cap of 15 percent of the pre‐announced auction targets w.e.f. 1st July, 2010. These bids are accepted at
weighted average yield in each tenor as decided in the primary auction.
On the other hand, Government borrowed Rs. 63.8 billion by issuing Market Related Treasury Bills
(MRTBs) to SBP. The growth of 5.8 percent, even though slightly higher than 5.2 percent of previous
year, highlights the government policy of complying with the “net zero quarterly borrowing limits”
strategy. However, the same was not adhered to in the last two quarters of 2009‐10.
The growing share of floating debt in total domestic debt in recent years has meant an inordinate
reliance on the shorter end of the sovereign yield curve. Debt structures that rely heavily on short‐term
instruments are sources of vulnerability, because short average maturities entail high rollover and
refinancing risk. In such cases, an increase in interest rates can have an adverse fiscal impact. Debt
structures that are too short or allow for bumps in the maturity profile can potentially generate
confidence crises, fueled by investors’ concerns that the government will not have sufficient funds to
redeem maturing bonds when they fall due.
432
656536
796
1,227
508 452
1,053 1,1071,171
FY06 FY07 FY08 FY09 FY10
Figure 7. MTBs vs. MRTBs, FY06‐FY10in billions of Rs.
Market Treasury Bills
Market Related Treasury Bills

DEBT POLICY STATEMENT 2010‐11
19
V.iii. Unfunded Debt
The category of unfunded debt underwent a modest growth of 14.7 percent to end the fiscal year 2009‐
10 at Rs. 1,457.5 billion in comparison to a healthy expansion of 24.5 percent in FY2008‐09. Net receipts
in Regular Income Scheme were up by 49 percent in 2009‐10 as the stock increased from Rs. 91.1 billion
as of end FY2009 to Rs. 135.6 billion as of end June 2010. Special Saving Certificates and Accounts
fetched a relatively weak investment of Rs. 93.2 billion when analyzed against the net receipts of Rs.
150.1 billion in 2008‐09.
Special NSS instruments (Bahbood Savings Certificates and Pensioner’s Benefit Accounts) exhibited a
dull performance as Rs. 77.4 billion were mobilized in 2009‐10 as compared to Rs. 100.7 billion in the
fiscal year 2008‐09. Defence Savings Certificates, in line with the previous year’s trend, observed
attrition to the tune of Rs. 32.5 billion or 12.6 percent in FY2010.
Central Directorate of National Savings (CDNS) launched a new initiative in January 2010 in the form of a
listed, scripless and tradable National Savings Bond. Rs. 3.65 billion were generated through this avenue
having three maturity points (3, 5 and 10 years) offering rates of 12.5 percent, 12.55 percent and 12.6
percent respectively.
Profit rates on National Saving Schemes were not revised during the fiscal year 2009‐10. However, the
onset of the fiscal year saw updated returns to reflect the lower yields on market debt instrument (PIBs).
This has been a prime reason behind below the target net inflows of Rs. 187 billion during FY2010
against a budgeted influx of Rs. 231 billion. In the earlier year, the rates on different NSS instruments
were increased twice in line with the elevated yields on PIBs and then reduced in tandem with declining
returns on long‐term government instruments.

DEBT POLICY STATEMENT 2010‐11
20
Stock Stock Receipts RepaymentsNet
Investment(End FY09) (End FY10)
Permanent Debt 685.9 797.1 227.1 115.3 111.8Market Loans 2.9 2.9 0.0 0.0 0.0Government Bond 7.3 7.2 0.0 0.1 ‐0.1Prize Bonds 197.4 236.0 129.5 90.9 38.6Foreign Exchange Bearer Certificates 0.2 0.1 0.0 0.0 0.0Bearer National Fund Bonds 0.0 0.0 0.0 0.0 0.0Federal Investment Bonds 1.0 0.0 0.0 0.9 ‐0.9Special National Fund Bonds 0.0 0.0 0.0 0.0 0.0Foreign Currency Bearer Certificates 0.1 0.0 0.0 0.0 0.0U.S. Dollar Bearer Certificates 0.0 0.0 0.0 0.0 0.0Special U.S. Dollar Bonds 7.7 2.7 0.3 5.3 ‐5.0Government Bonds Issued to SLIC 0.6 0.6 0.0 0.0 0.0Pakistan Investment Bonds (PIB) 441.0 505.3 83.0 18.0 64.9Government Bonds issued to HBL 0.0 0.0 0.0 0.0 0.0GOP Ijara Sukuk 27.8 42.2 14.4 0.0 14.4
Floating Debt 1,904.1 2,399.1 3,824.1 3,329.1 495.0Ad hoc Treasury Bills 0.0 0.0 0.0 0.0 0.0Treasury Bills on Tap 0.0 0.0 0.0 0.0 0.0Treasury Bills through Auction 795.6 1,227.4 1,434.2 1,002.4 431.8Rollover of Treasury Bills discounted SBP 0.6 0.6 0.0 0.0 0.0Treasury Bills purchased by SBP (MRTBs) 1,107.3 1,171.1 2,389.9 2,326.1 63.8Outright Sale of MTBs 0.6 0.0 0.0 0.6 ‐0.6
Unfunded Debt 1,270.5 1,457.5 577.3 391.2 186.1Defence Savings Certificates 257.2 224.7 49.8 82.2 ‐32.4Khas Deposit Certificates and Accounts 0.6 0.6 0.0 0.0 0.0National Deposit Certificates 0.0 0.0 0.0 0.0 0.0Savings Accounts 16.8 17.8 155.5 155.3 0.3Mahana Amadni Account 2.4 2.2 0.1 0.4 ‐0.3Postal Life Insurance 67.1 67.1 0.0 0.0 0.0Special Savings Certificates and Accounts 377.7 470.9 172.7 79.8 93.0Regular Income Scheme 91.1 135.6 64.0 19.4 44.5Pensioners' Benefit Account 109.9 128.0 31.6 13.4 18.2Bahbood Savings Certificates 307.5 366.8 97.3 38.0 59.3National Savings Bonds 0.0 3.7 3.7 0.0 3.7G.P. Fund 40.1 39.9 2.6 2.8 ‐0.1
Total Domestic Debt 3,860.4 4,653.7 4,628.5 3,835.6 792.9
Table 6. Causative Factors in Change in Stock of Domestic Debt, FY10 (in billions of Rs.)
(in FY10)
Source: Budget Wing, MoF and DPCO staff calculations
DEBT POLICY STATEMENT 2010‐11
21
V.iv. Domestic Debt during JulSep 2010
At the end of 1st quarter of the current fiscal year, the domestic debt rested at Rs. 4,958.6 billion. This
growth of 6.6 percent came primarily from the floating debt, while the unfunded category added a
minuscule portion. On the other hand, permanent debt witnessed a net retirement as government
bonds (PIBs and others) matured. A growing spending need on account of current expenses was largely
met by resorting to SBP window. Consequently, the net zero quarterly borrowing limits was not
observed for Q1FY2011 and the government piled up Rs. 178.1 billion under MRTBs in the first three
months of FY2010‐11. This incremental borrowing translated into a pronounced growth of 15.3 percent
in three months, surpassing an annual average of 5.5 percent over the last two years.
With regards to MTBs, market participants submitted to a short view in auctions following the
announcement of a hike in discount rate in August 2010, concentrating their offers in the 3‐month
tenor. As a result, Rs. 95.2 billion (or 7.8 percent) was added to the stock of MTBs till September 30,
2010. Inflows in Bahbood Savings Certificates, Regular Income Scheme and Special Savings Certificates
contributed to a modest growth of 2.3 percent under the NSS head, whereas Savings Accounts were
down by Rs. 5.9 billion in the first three months of FY2010‐11.
VI. External Debt & Liabilities
The country’s External Debt and Liabilities (EDL) stock was recorded at US$ 55.6 billion as of June 30,
2010. During 2009‐10, US$ 3.3 billion was added to the stock resulting in a growth of 6.3 percent. This
increase in EDL is the lowest since FY2007‐08 as the EDL experienced an expansion of 14.5 percent and
13.4 percent in FY2008 and FY2009 respectively. A falling current account deficit, low foreign currency
debt creating flows and appreciation of USD against other foreign currencies were the main factors
associated with a muted growth witnessed in EDL for 2009‐10. As most of the external loans are project
based, limited capacity to deliver on these projects has resulted in unutilized lending pipelines of
existing commitments. Hence, disbursements under the IMF‐SBA dominated the external debt creating
inflows throughout the year whereas other heads underwent minor additions/subtractions. As a
percentage of GDP in dollar terms, the EDL was down by 50 bps in 2009‐10 compared to 2008‐09 and
approximated to 31.8 percent.
Below is a detailed analysis of each category within EDL.

DEBT POLICY STATEMENT 2010‐11
22
Vi.i. Public and Publically Guaranteed Debt
Public and Publically Guaranteed (PPG) debt was US$ 43.1 billion at end‐June 2010, up by only US$ 502
million against FY2008‐09. This low growth of 1.2 percent has restrained the overall increase in the stock
FY06 FY07 FY08 FY09 FY10 FY11*
33.3 35.8 40.6 42.6 43.1 44.933.0 35.6 40.4 42.4 42.9 44.832.8 35.6 39.7 41.8 42.1 43.9
Paris Club 12.8 12.7 13.9 14.0 14.0 14.8Multilateral 16.6 18.5 21.5 23.0 23.7 24.7Other Bilateral 0.8 0.9 1.1 1.4 1.8 1.8Euro Bonds/Saindak Bonds 1.9 2.7 2.7 2.2 1.6 1.6Military Debt 0.1 0.1 0.0 0.2 0.2 0.2Commercial Loans/Credits 0.2 0.1 0.1 0.2Local Currency Bonds 0.1 0.0 0.1 0.1Saudi Fund for Development (SFD) 0.2 0.2SAFE China Deposits 0.5 0.5 0.5NBP/BOC Deposits 0.5 0.5 0.4 0.3 0.2 0.1
0.2 0.0 0.7 0.7 0.8 0.9IDB 0.2 0.0 0.7 0.7 0.8 0.9
i i) Publicly guaranteed debt 0.3 0.2 0.2 0.2 0.2 0.2Paris ClubMultilateral 0.2 0.2 0.1 0.1 0.1 0.0Other Bilateral 0.1 0.1 0.1 0.1 0.0 0.0Commercial Loans/Credits 0.0 0.0 0.0 0.1 0.1Saindak Bonds 0.0 0.0
1.6 2.3 2.9 3.3 3.2 3.21.5 1.4 1.3 5.1 8.1 8.9
of which Central Govt. 1.1 1.6Monetary Authorities 1.5 1.4 1.3 5.1 7.0 7.3
0.2 0.236.4 39.5 44.9 51.1 54.5 57.30.8 0.8 1.3 1.3 1.1 1.1
37.2 40.3 46.2 52.3 55.6 58.433.8 36.4 40.7 46.4 49.6 52.410.8 14.3 8.7 9.5 13.1 13.4
28.6 27.6 27.3 31.5 31.1 30.126.2 25.1 24.7 26.2 24.6 23.625.8 24.9 24.2 25.7 24.1 23.10.1 0.0 0.4 0.4 0.5 0.51.2 1.0 0.8 3.2 4.6 4.70.7 0.6 0.8 0.8 0.6 0.6
29.2 28.2 28.1 32.2 31.8 30.78.5 10.0 5.3 5.9 7.5 7.0
7,623 8,673 10,243 12,739 14,668 17,18259.9 60.6 62.5 78.5 83.8 90.360.2 60.4 68.3 81.4 85.5 86.3
GDP (in bill ions of US dollars) 127.4 143.0 164.5 162.3 175.0 190.2
Table 7: Pakistan: External Debt and Liabilities
(in billions of USD)1. Public and Publical ly Guaranteed Debti) Public debt
A. Medium and Long Term(>1 year)
B. Short Term (<1 year)
2. Private Non‐Guaranteed Debt (>1 year)3. IMF
4. Scheduled Banks' BorrowingTotal External Debt (1 through 4)5. Foreign Exchange LiabilitiesTotal External Debt & Liabilities (1 through 5)
(of which) Public DebtOfficial Liquid Reserves
(in percent of GDP)Total External Debt (1 through 4)1. Public and Publical ly Guaranteed Debt
A. Medium and Long Term(>1 year)B. Short Term (<1 year)
3. IMF4. Foreign Exchange Liabilities
* end‐September 2010Source: SBP, EAD and DPCO staff calculations
Total External Debt & Liabilities (1 through 5)Official Liquid Reserves Memo:GDP (in bill ions of Rs.)Exchange Rate (Rs./US$, Period Avg.)Exchange Rate (Rs./US$, EOP)
DEBT POLICY STATEMENT 2010‐11
23
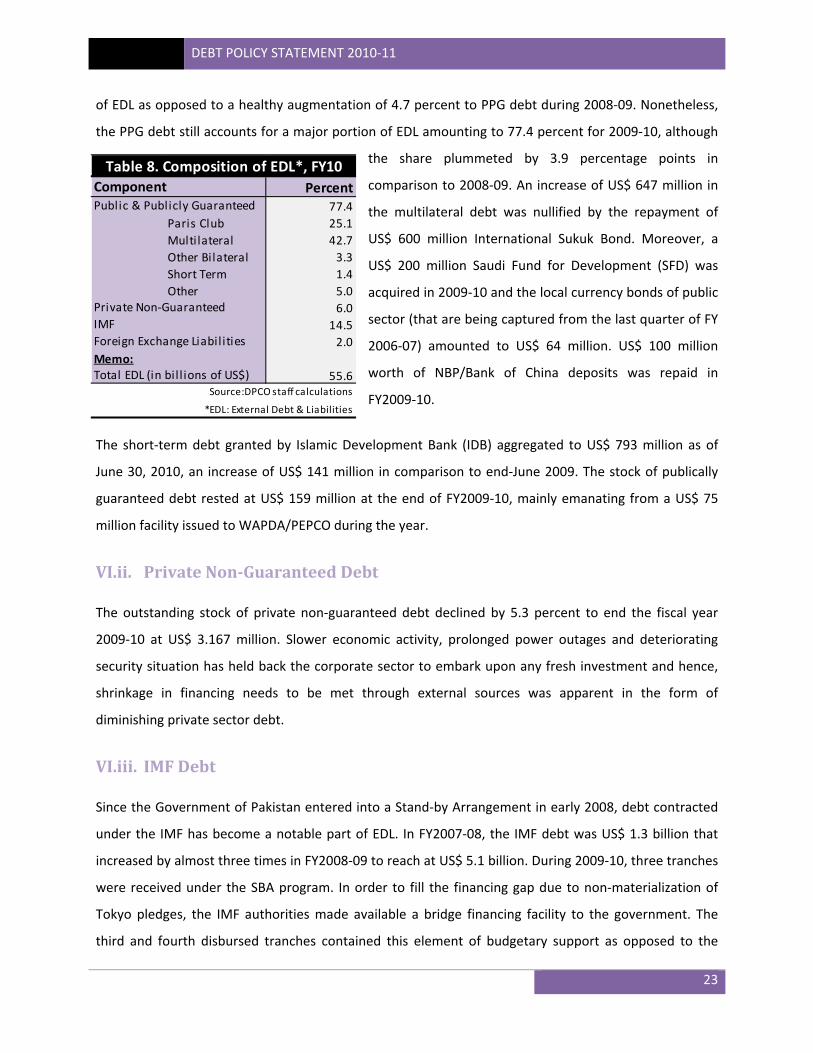
of EDL as opposed to a healthy augmentation of 4.7 percent to PPG debt during 2008‐09. Nonetheless,
the PPG debt still accounts for a major portion of EDL amounting to 77.4 percent for 2009‐10, although
the share plummeted by 3.9 percentage points in
comparison to 2008‐09. An increase of US$ 647 million in
the multilateral debt was nullified by the repayment of
US$ 600 million International Sukuk Bond. Moreover, a
US$ 200 million Saudi Fund for Development (SFD) was
acquired in 2009‐10 and the local currency bonds of public
sector (that are being captured from the last quarter of FY
2006‐07) amounted to US$ 64 million. US$ 100 million
worth of NBP/Bank of China deposits was repaid in
FY2009‐10.
The short‐term debt granted by Islamic Development Bank (IDB) aggregated to US$ 793 million as of
June 30, 2010, an increase of US$ 141 million in comparison to end‐June 2009. The stock of publically
guaranteed debt rested at US$ 159 million at the end of FY2009‐10, mainly emanating from a US$ 75
million facility issued to WAPDA/PEPCO during the year.
VI.ii. Private NonGuaranteed Debt
The outstanding stock of private non‐guaranteed debt declined by 5.3 percent to end the fiscal year
2009‐10 at US$ 3.167 million. Slower economic activity, prolonged power outages and deteriorating
security situation has held back the corporate sector to embark upon any fresh investment and hence,
shrinkage in financing needs to be met through external sources was apparent in the form of
diminishing private sector debt.
VI.iii. IMF Debt
Since the Government of Pakistan entered into a Stand‐by Arrangement in early 2008, debt contracted
under the IMF has become a notable part of EDL. In FY2007‐08, the IMF debt was US$ 1.3 billion that
increased by almost three times in FY2008‐09 to reach at US$ 5.1 billion. During 2009‐10, three tranches
were received under the SBA program. In order to fill the financing gap due to non‐materialization of
Tokyo pledges, the IMF authorities made available a bridge financing facility to the government. The
third and fourth disbursed tranches contained this element of budgetary support as opposed to the
Percent77.4
Paris Club 25.1Multilateral 42.7Other Bilateral 3.3Short Term 1.4Other 5.0
6.014.52.0
Memo:55.6Total EDL (in bill ions of US$)
Source:DPCO staff calculations
*EDL: External Debt & Liabilities
Table 8. Composition of EDL*, FY10ComponentPublic & Publicly Guaranteed
Private Non‐GuaranteedIMFForeign Exchange Liabil ities

DEBT POLICY STATEMENT 2010‐11
24
strictly BoP support nature of previous tranches. At the end of the fiscal year 2009‐10, IMF debt
aggregated to US$ 8.1 billion (and a growth of 57 percent) out of which SDR 713.35 million or US$ 1,055
million accrued to the federal government. The remaining IMF funds were recorded on SBP books to
strengthen the foreign exchange reserves of the country.
VI.iv. Foreign Exchange Liabilities
Foreign Exchange Liabilities (FEL) mainly comprise of central bank deposits and foreign currency bonds.
FEL decreased by 11.9 percent in FY2009‐10 and summed to US$ 1.1 at end‐June 2010. The NHA bonds
and other liabilities (SWAP) were repaid during the year while central bank deposits were reduced by
US$ 100 million.
VI.v. External Debt & Liabilities during JulSep 2010
EDL during the first three months of the current fiscal year 2010‐11 increased to US$ 58.4 billion. A raise
of US$ 2.8 billion in the first quarter of the fiscal year at a time when IMF inflows have dried up has been
at the back of translational loss (USD vs. Other foreign currencies), meaning thereby that slow moving
flows govern the outstanding EDL stock. PPG debt stood at US$ 44.9 billion as of end‐September 2010
consequent to an addition of US$ 1 billion and US$ 884 million in respect of multilateral and Paris Club
debt. The Bank of China deposits witnessed another US$ 100 million repayment in the first quarter of
2010‐11.
The IMF authorities, in support of the government’s effort to deal with the natural calamity of floods
early in the fiscal year, provided the Emergency Natural Disaster Assistance (ENDA) facility and
immediately disbursed the approved amount of SDR 296.98 million (US$ 451 million). The fifth review
could not be completed as Pakistan was not able to deliver on certain pre‐requisites and therefore, no
tranche of the remaining two under the IMF‐SBA was released. As a result, the stock of IMF debt was
elevated by 10.3 percent to end the first quarter at US$ 8.9 billion. This BoP support programme has
recently been extended to end September 2011 so that the government gets time to implement certain
crucial fiscal reforms as mutually agreed.
VI.vi. Currency Movements and Translational Impact
In Pakistan, external loans are contracted in various currencies but disbursements are effectively
converted into Pak Rupee. As Pak Rupee is not an internationally traded currency, the other currencies

DEBT POLICY STATEMENT 2010‐11
25
are bought and sold via selling and buying of USD. Hence, the currency exposure of foreign debt
originates from two sources: USD/other foreign currencies and PKR/USD. This two‐pronged exchange
rate risk has been a major source of increase in the stock of EDL over a period of time in contrast to
actual inflows.
For instance, translational loss amounted to US$ 3.1 billion in FY2007‐08. Since then, a fairly
strengthening USD has largely stemmed the increase in EDL on this account and the loss was limited to
US$ 53 million during FY2008‐09. For 2009‐10, encouragingly a translational gain of US$ 440 million was
attained at the back of an appreciating USD against other major international currencies. The exchange
loss should be viewed in the context of interest rate differential of the currencies involved.
Managing foreign exchange risk is a fundamental component of a prudent debt management strategy.
Careful management of currency risk has been increasingly mandated by sovereigns, especially after the
currency‐crisis episodes of the last decade and the consequent heightened international attention on
accounting and balance sheet risks. A comprehensive foreign exchange risk management programme
requires establishing and implementing sound and prudent foreign exchange risk management policies
and control procedures. The external debt portfolio of Pakistan is contracted in 20 different currencies
and the historical losses borne by Pakistan in this respect call for a sophisticated currency hedging
framework to be installed within the government. If we analyze the currency movements over a longer
period of last 20 years, the cost of foreign currency borrowing adjusted for exchange rates movement
has been 1.5 percent lower than the average domestic interest rates.
Unlike FY2009‐10, the first three months of the current fiscal year 2010‐11 underwent a huge
translational loss aggregating to US$ 2.4 billion. Successful efforts in handling the Euro‐zone debt
episode have averted the currency crisis and resultantly, Euro is regaining its lost value against USD. This
appreciation of Euro/USD coupled with quantitative easing in the US to stimulate economy resulted in
US dollar losing its value against other currencies, thus increased the Pakistan’s EDL in the first quarter
of 2010‐11. This highlights the need of a proactive currency hedging framework to capitalize upon
favourable developments and most importantly, to mitigate unfavourable currency movements. The
Government is in the process of developing an institutional and legal framework for currency risk
management.

DEBT POLICY STATEMENT 2010‐11
26
VI.vii. External Debt Servicing
During FY2009‐10, external debt servicing summed to US$ 7.364 billion that is 16.4 percent higher than
the previous year. A segregation of this aggregate number shows a payment of US$ 4.632 billion in
respect of maturing EDL stock while interest payments were US$ 1.009 billion. US$ 1.732 billion was
rolled‐over.
Among the principal repayments, US$ 897 of multilateral debt and US$ 600 million of International
Sukuk Bond accounted for most of the share whilst, short‐term scheduled banks’ borrowing observed
heavy repayments approximating to US$ 1.181 billion. Similarly, hefty interest payments worth of US$
877 million on foreign currency public debt contributed to the bottom line. In FY2010‐11, the central
bank deposits were mostly rolled‐over.
During July‐September 2010, the servicing on external debt was recorded at US$ 2.169 billion. Out of
the grand total, principal repayments were US$ 1.436 billion and interest payments were 233 million.
The roll‐overs amounted to US$ 500 million in the first quarter of 2010‐11.
Over the last two years, the debt servicing levels have notably increased. Notwithstanding, with the IMF‐
SBA repayments set to initiate in the second half of FY 2011‐12, the servicing will increase to much
higher levels.
2005‐06 2,894 1,300 4,194
2006‐07 2,869 1,300 4,169
2007‐08 3,134 1,200 4,334
2008‐09 4,728 1,600 6,328
2009‐10 5,641 1,723 7,364
2010‐11* 1,669 500 2,169
Table 9. Pakistan's External Debt Servicing
YearsActual
Amount PaidAmount Rolled
*July‐September 2010Source: State Bank of Pakistan
Total
(in millions of USD)

DEBT POLICY STATEMENT 2010‐11
27
VII. External Sector Assessment
During 2009‐10, a narrowing current account deficit has been the main driver behind an ease in the
external account of the country. The BoP position greatly benefitted from declining international
commodity and oil prices coupled with a slump in domestic demand. Imports decelerated sharply and
exports posted a positive growth. Additionally, sustained robust workers’ remittances were a positive
input to current account balance, notwithstanding a recessionary trend in countries that contribute a
major portion to this head. As a result, the current account deficit reduced from 5.7 percent of GDP in
FY2009 to 2.3 percent of GDP in FY2010, the lowest in the last five years. Pakistan’s exports regained its
lost momentum to some extent by posting a growth of 2.9 percent during FY2010 in contrast to a
contraction of 6.4 percent in 2008‐09. Similarly, import growth was slightly down by 1.7 percent in
FY2009‐10 against a large reduction of 10.3 percent the previous year.
On the other hand, financial account weakened marginally but a significant decline in current account
deficit led the overall external position to register a surplus in 2009‐10, after a gap of two years. Funds
from the IMF plus disbursements from other donor agencies were the underlying factors. On top of it,
shifting of liquidity management in respect of oil purchases from SBP to the interbank market increased
the demand for US Dollars and resultantly the domestic currency was depreciated by 5 percent during
FY2009‐10.
FY06 FY07 FY08 FY09 FY10Foreign Exchange Earnings 31.8 33.0 37.3 35.4 38.1
Goods: Exports f.o.b 16.6 17.3 20.4 19.1 19.7 Services: Credit 3.8 4.1 3.6 4.1 5.2 Income: Credit 0.8 0.9 1.6 0.9 0.6 Current Transfers 10.7 10.7 11.7 11.3 12.7 Of which Workers Remittances 4.6 5.5 6.5 7.8 8.9
Foreign Exchange Payments 36.8 39.9 51.1 44.6 42.1 Goods: Imports f.o.b 25.0 27.0 35.4 31.7 31.2 Services: Debit 8.2 8.3 10.0 7.5 6.9 Income: Debit 3.5 4.5 5.5 5.3 3.8 Of which Interest Payments 1.2 1.4 2.2 1.9 1.5 Current Transfers: Debit 0.1 0.1 0.1 0.1 0.1
Table 10. Components of Foreign Exchange Earnings & Payments(in billions of US$)
Source: SBP and DPCO staff calculations

DEBT POLICY STATEMENT 2010‐11
28
Pakistan’s foreign exchange reserves increased by US$ 4.0 billion in FY2010 to end the fiscal year at US$
16.9 billion. Favorable external account developments (discussed above) contributed to the increase in
the reserves. It is worth noting here that foreign exchange reserves have rebounded principally at the
back of IMF BoP support. Net of IMF inflows, the reserves appear fairly stagnant (see Figure 5). With the
SBA programme coming to an end in September 2011 and the government set to repay the installments
from FY2012 onwards, the external sector will be under stress.
Building upon the improvements achieved in the overall external account over the last two years require
a vigilant short and medium term strategy going forward. A much anticipated reversal in the decreasing
global commodity prices including oil prices and the post‐flood scenario would likely put pressure on the
BoP position through a widening current account deficit. Supplementing this would be a general drying
up of foreign debt creating flows that may in turn aggravate problems in securing external funding to
shore up the diminishing foreign exchange reserves post IMF‐SBA. The government is, hence, advised to
take proactive efforts to mitigate the same.
This means that the improvement in the external account is mostly contributed by factors exogenous in
nature and the structural weaknesses remain unaddressed. Such an assessment calls for a higher fiscal
and monetary policy coordination along with solid efforts to augment exports and other non‐debt
creating foreign currency flows to reduce reliance on external financing.
0
2000
4000
6000
8000
10000
12000
14000
16000
Dec‐07
Jan‐08
Jan‐08
Feb‐08
Mar‐08
May‐08
Jun‐08
Jul‐08
Aug
‐08
Sep‐08
Oct‐08
Nov‐08
Dec‐08
Dec‐08
Jan‐09
Feb‐09
Mar‐09
Apr‐09
May‐09
Jun‐09
Jun‐09
Jul‐09
Aug
‐09
Sep‐09
Oct‐09
Nov‐09
Jan‐10
Feb‐10
Mar‐10
Mar‐10
Apr‐10
May‐10
Jun‐10
Jul‐10
Aug
‐10
Sep‐10
Sep‐10
Sep‐10
Oct‐10
Nov‐10
Dec‐10
Forex Reserves with SBP
Forex Reserves with SBP ‐ excluding IMF
Figure 8. Foreign Exchange Reserves, Dec'07‐Dec'10in millions of USD

DEBT POLICY STATEMENT 2010‐11
29
VIII. External Debt Sustainability
During 2009‐10, non interest current account deficit was 1.4 percent of nominal GDP, much less than
the 4.5 percent recorded in FY2009. Similarly, the foreign exchange earnings of the country were up by
7.9 percent whereas the non‐interest foreign currency payments decreased by a slower pace than that
of 2008‐09. These positive developments on the balance of payments front, besides other factors,
culminated into a restrained growth of 6.3 percent in the country’s external debt and liabilities stock as
opposed to a high average growth of 13.9 percent over the last two years (FY2008 and FY2009).
The fiscal year 2009‐10 saw an improvement in the external debt sustainability indicators in comparison
to the preceding year. A major respite has been witnessed in the EDL‐to‐GDP ratio as it improves from
32.6 percent in FY2008‐09 to 31.8 percent in FY2009‐10. Lower external receipts, exchange gain and
modest economic growth were the factors contributing to this reduction. Improvements have also been
observed in the EDL‐to‐FEE and EDL‐to‐FER ratios. For 2009‐10, the former stood at 1.46 times as
compared to 1.48 times in FY2008‐09 at the back of strong workers’ remittances and a positive turn‐
around in export earnings. A generally acceptable threshold requires a country’s EDL to remain below 2
times of FEE. Following Pakistan’s entry into the IMF programme, the foreign exchange reserves of the
country were bolstered. This combined with a low EDL growth decreased the latter indicator to 3.3
times in FY2009‐10 from 4.2 times in FY2008‐09.
External Debt Indicators FY 06 FY 07 FY 08 FY 09 FY 10Non Interest Current Account Balance/GDP ‐2.9 ‐3.8 ‐7.1 ‐4.5 ‐1.4Growth in Exports 14.3 4.4 18.2 ‐6.4 2.9Growth in Imports 31.6 8.0 31.2 ‐10.3 ‐1.7Growth in EDL 5.1 8.3 14.5 13.4 6.3Growth in FEE 17.6 4.0 13.0 ‐5.2 7.9Growth in Non Interest Foreign Currency Payments 29.1 8.4 27.2 ‐12.8 ‐4.9Int. Pmt./FEE 2.9 3.3 3.3 3.3 2.6EDL Servicing/FEE 13.2 12.6 11.6 17.9 19.3STD/FEE 0.5 0.1 1.9 1.9 2.1STD/LTD 0.5 0.1 1.7 1.4 1.6EDL/FEE (times) 1.17 1.22 1.24 1.48 1.46EDL/Exports (times) 2.25 2.33 2.26 2.74 2.83EDL/FER (times) 2.84 2.66 4.06 4.22 3.33EDL/GDP 29.2 28.2 28.2 32.2 31.8Rol lover Ratio (Principa l Repayments/Disbursements ) 62.7 53.9 52.8 44.6 70.9
Table 11. External Debt Sustainability: FY06 ‐ FY10 (in percent)
FEE: Foreign Exchange Earnings; STD: Short‐term Debt; EDL: External Debt and Liabilities; LTD: Long‐term Debt;
TPD: Total Public Debt; FER: Foreign Exchange Reserves
Source: EAD, SBP & DPCO staff calculations

DEBT POLICY STATEMENT 2010‐11
30
Healthy foreign exchange earnings have led to a reduction in the Interest payments‐to‐FEE ratio. This
ratio in percentage terms declined to 2.6 percent in 2009‐10 as opposed to a static 3.3 percent in the
previous three years. As the external debt servicing increases, so does the ratio of EDL servicing‐to‐FEE.
In FY2009 and FY2010,
concomitant to higher servicing
cost in the wake of increased
principal repayments, this ratio
remained elevated at 17.9 percent
and 19.3 percent respectively as
opposed to an average 12.5
percent over FY2006‐08. However,
Pakistan is gradually approaching
the internationally acceptable
percentage (20 percent) in terms
of this indicator. The current levels of servicing are bound to increase as IMF‐SBA repayments initiate in
FY2012, that require serious efforts to enhance the export earnings if Pakistan is to remain under the
accepted threshold.
Short‐term debt (mostly granted by IDB) has historically been a small part of the country’s EDL. As such,
the ratio of STD‐to‐LTD has only increased in recent years, approximating to 1.6 percent at the end of
2.52.72.93.13.33.53.73.94.14.34.5
11.051.11.151.21.251.31.351.41.451.5
FY 06 FY 07 FY 08 FY 09 FY 10
Figure 9(a). External Debt Sustainability Indicators
EDL/FEE (LHS) EDL/FER
2468101214161820
2.02.22.42.62.83.03.23.43.6
FY 06 FY 07 FY 08 FY 09 FY 10
Figure 9(b). External Debt Sustainability Indicators
IP/FEE (LHS) EDL Servicing/FEE

DEBT POLICY STATEMENT 2010‐11
31
FY2009‐10. This increase has translated into a rise in the STD‐to‐FEE ratio registered at 2.1 percent for
the fiscal year 2009‐10.
The roll‐over ratio has deteriorated in FY2010 as opposed to the previous fiscal year. The Principal
repayments‐to‐Disbursements ratio was 44.6 percent in 2008‐09 that increased to 70.9 percent in
FY2010. This means that most of the disbursed amounts were used up in paying off the maturing
external debt. It is also worth‐noting that relatively lower IMF disbursements throughout the year were
absorbed for repayments in absence of other expected foreign currency flows.
IX. Guarantees
Guarantees are contingent liabilities that come into play on the occurrence of an event covered by the
guarantee. Since guarantees result in increase in contingent liability, they should be examined in the
same manner as a proposal for a loan, taking into account, inter alia, the credit‐worthiness of the
borrower, the amount and risks sought to be covered by a sovereign guarantee, the terms of the
borrowing, the justification and public purpose to be served, probabilities that various commitments will
become due and possible costs of such liabilities, etc.
The sovereign guarantee is normally extended for the purpose of achieving the following objectives:‐
0.00.20.40.60.81.01.21.41.61.82.02.2
FY 06 FY 07 FY 08 FY 09 FY 10
Figure 9(c). External Debt Sustainability Indicators
STD/FEE STD/LTD
DEBT POLICY STATEMENT 2010‐11
32
(i) To improve financial viability of projects or activities undertaken by government entities with
significant social and economic benefits;
(ii) To enable public sector companies to raise resources at lower interest charges or on more favorable
terms;
(iii) To fulfill the requirement in cases where sovereign guarantee is a precondition for concessional
loans from bilateral/multilateral agencies to sub‐sovereign borrowers.
However, there are also costs associated with the provision of government guarantees. Hence, such
off‐balance sheet transactions can not be overlooked in order to gain a holistic view of a country’s fiscal
position and unveil the hidden risks associated with the obligations made by the government outside
the budget. Similarly, reported debt levels of a sovereign may be understated owing to the non‐inclusion
of guarantees, explicit or implicit, which may materialize in future. In the case of Pakistan, these include,
for instance, explicit and implicit guarantees issued to Public Sector Enterprises (PSEs) and unfunded
losses of state owned entities such as Pakistan Steel Mill, PIA, WAPDA, PEPCO, Railways, etc.
During the fiscal year 2009‐10, the Government of Pakistan issued guarantees aggregating to Rs. 224
billion (See Table 12). This issuance amounted to 1.5 percent of GDP. This year, much of the issuance
Name of Organization Amount(in billions of Rs.)
WAPDA/PEPCO 169.8Railways Division 17.1PSM 10.0TCP 8.4PIA 7.7P.A.F Shahbaz Air H.Q 6.0KESC 3.0Pak Textile City Limited 1.0TIP 1.1Grand Total 224.0
(In percent of GDP)
Grand Total 1.53%Memo:GDP (in billions of Rs.) 14,668
Table 12. Guarantees Issued, FY10
Source: DPCO staff calculations

DEBT POLICY STATEMENT 2010‐11
33
was concentrated in the power sector. About Rs. 169.8 billion (or 75.8 percent of the total issuance)
worth of new guarantees were granted to WAPDA/PEPCO during FY2009‐10. Moreover, the transfers of
power sector entities’ loan portfolio to Power Holding Pvt. Ltd. was achieved by rolling‐over existing
guarantees valued at 0.7 percent of GDP.
Public disclosure of information about guarantees is an essential component of fiscal transparency, but
it is more important to reflect the impact of financial risk associated with guarantees in the fiscal
account. The outstanding contingent liabilities as of June 30, 2010 stood at Rs. 602.6 billion. This
includes the stock of explicit debt guarantees in both domestic and foreign currencies that appear in the
accounting books of PSEs. The Rupee guarantees accounted for 54.6 percent of the total stock.
Other than the publically guaranteed debt of PSEs, Government Issue continuing guarantees against the
commodity financing operations undertaken by TCP, PASSCO, and provincial governments. Commodity
financing is secured against hypothecation of commodities and letter of comfort from the Finance
Division. For 2009‐10, Rs. 76.6 billion worth of new guarantees were issued on behalf of commodity
financing operations, translating into 0.5 percent of the nominal output.
In addition to these explicit guarantees, there is a need to quantify implicit guarantees embedded in
many government contracts, i.e., PPAs and other such agreements in which turnover guarantees are
defined, that represent a potentially significant charge on future budgets. Finance Division is
contemplating to install a mechanism to capture such implied guarantees.
X. Report on Compliance with FRDL Act 2005
The Fiscal Responsibility and Debt Limitation (FRDL) Act, 2005 was approved on 13 June 2005. The FRDL
Act, 2005 requires that the federal government take measures to reduce total public debt and maintain
Outstanding Guarantees extended to PSEs 602.6
‐Domestic Currency 328.8
‐Foreign Currency 273.8
Memo:Foreign Currency (US$ Million) 3,246.4
Source: DPCO
Table 13. Guarantees Outstanding as of June 30, 2010(Rs. Billion)

DEBT POLICY STATEMENT 2010‐11
34
it within prudent limits thereof. The following sections identifies the various limits prescribed by the
FRDL Act 2005 and reports on progress thereof.
The FRDL Act 2005 requires the following:
(1) Reducing the revenue deficit to nil not later than the thirtieth June, 2008 and thereafter
maintaining a revenue surplus
As of June 30, 2010, the revenue deficit approximated to Rs. 308 billion or 2.1 percent of GDP.
(2) Ensure “that within a period of ten financial year, beginning from the first July, 2003 and
ending on thirtieth June, 2013, the total public debt at the end of the tenth financial year does
not exceed sixty percent of the estimated gross domestic product for that year and thereafter
maintaining the total public debt below sixty percent of gross domestic product for any given
year.”
As of 30th June 2010, the total public debt stood at 60.6 percent of GDP. It must be noted here that the
limit of 60 percent of total public debt‐to‐GDP is applicable from the fiscal year 2012‐13 onwards.
(3) Ensure “that in every financial year, beginning from the first July, 2003, and ending on the
thirtieth June 2013, the total public debt is reduced by no less than two and a half percent of
the estimated gross domestic product for any given year, provided that social and poverty
alleviation related expenditures are not reduced below 4.5 percent of the estimated gross
domestic product for any given year and budgetary allocation to education and health, will be
doubled from the existing level in terms of percentage of gross domestic product during the
next ten years.”
FY03 FY04 FY05 FY06 FY07 FY08 FY09 FY10Revenue Balance ‐1.5% 0.3% ‐0.7% ‐0.6% ‐0.9% ‐3.5% ‐1.5% ‐2.1%
FY03 FY04 FY05 FY06 FY07 FY08 FY09 FY10
Domestic Currency Debt 1,852 1,995 2,152 2,320 2,600 3,266 3,853 4,651
Foreign Currency Debt 1,771 1,816 1,913 2,038 2,201 2,778 3,776 4,243
Total Public Debt 3,623 3,810 4,065 4,357 4,802 6,044 7,629 8,894
GDP 4,876 5,641 6,500 7,623 8,673 10,243 12,739 14,668
Total Public Debt (as % of GDP) 74.3 67.6 62.5 57.2 55.4 59.0 59.9 60.6
(in billions of Rs)

DEBT POLICY STATEMENT 2010‐11
35
During the fiscal year 2009‐10, 0.7 percentage point of GDP was added to the stock of total public debt.
Social and poverty alleviation related expenditure (as given by pro‐poor budgetary expenditure
excluding non‐development outlays on law and order) remained at 6.72 percent of GDP in 2009‐10.
Additionally, expenditure on health and education in 2009‐10 amounted to 0.76 percent and 1.77
percent of GDP respectively.
(4) Not issue “new guarantees, including those for rupee lending, bonds, rates of return, output
purchase agreements and all other claims and commitments that may be prescribed, from
time to time, for any amount exceeding two percent of the estimated gross domestic product
in any financial year: Provided that the renewal of existing guarantees shall be considered as
issuing a new guarantee.”
New guarantees issued by the government in 2009‐10 amounted to Rs. 224 billion or 1.5 percent of
GDP. Moreover, the government rolled over existing guarantees equal to 0.7 percent of GDP issued
against borrowing of different power sector entities to facilitate transfer of their loans into Power
Holding Pvt. Ltd, this only involved the change of name of the borrower on the existing guarantees. The
government also issued letter of comfort equivalent to 0.5 percent of GDP against commodity finance.
Since last few years, Pakistan is faced with serious challenges both at the domestic and international
fronts. Serious internal security situation, energy shortages, rehabilitation of IDPs, severe floods and
rising inflation combined with global economic & credit crises and higher commodity prices have all put
enormous pressure on government’s limited fiscal resources. Given the severity of these constraints, the
government has been able to manage the fiscal deficits at reasonable levels though was unable to
totally comply with some provisions of FRDL Act 2005. However, the government remains fully
committed to adhere to all the provisions of FRDL Act 2005 in future.
FY03 FY04 FY05 FY06 FY07 FY08 FY09 FY10
Social sector and poverty related expenditure(as % of GDP)
3.6 3.9 4.2 4.9 4.9 9.3 6.9 6.7
Expenditure on education (as % of GDP) 1.6 1.7 1.8 1.9 1.9 1.8 1.9 1.8
Expenditure on health (as % of GDP) 0.5 0.5 0.5 0.5 0.6 0.6 0.7 0.8

DEBT POLICY STATEMENT 2010‐11
36
XI. Debt Strategy
Till recently, debt strategy exercised by the government was restricted to specific nominal levels of debt,
and the break‐up of financing between external, domestic bank and non‐bank sources that is laid out in
the federal budget annually. The domestic debt is further divided into market debt (namely Market
Treasury Bills and Pakistan Investment Bonds) and national savings without any consideration to the
tenor, timing and cost of funds. There exists no clear and formal debt strategy and the entire process
lacks cohesive vision. Rudimentary debt operations are carried out by different agencies with little or no
coordination. Similarly, the government debt instruments offered to the market are fragmented and
provide different returns for the same credit quality and maturity. Furthermore, guidelines for the
regulation of significant contingent liabilities, in the shape of provision of government guarantees, are
not defined. Under these circumstances, it is difficult to set and more importantly, achieve debt
management objectives/benchmarks. It is important to note that while the federal budget identifies the
levels of various sources of debt, no guidelines are provided with regards to optimal currency mix,
distribution of tenor, and the exact timing of issuance. The only benchmarks against which debt
operations in the country can be measured are the level of total public debt‐to‐GDP and issuance of
guarantees as defined under FRDLA 2005.
With a view to improve the quality of debt management operations, government adopted a
comprehensive debt management strategy for fiscal year 2010‐11. The key focus of the strategy is to;
Explore foreign currency borrowing avenues, and
Augment the domestic liquidity
Deficit financing as envisaged in the Federal Budget 2010‐11 focuses primarily on domestic sources. Rs
499 billion worth of financing is to be obtained from domestic bank and non‐bank sources, while Rs. 86
billion is budgeted from external sources. The remaining Rs. 100 billion is expected through
disbursement of grants from external sources. The higher reliance on domestic sources in the medium‐
term framework will continue to put upward pressure on domestic interest rates and crowd out the
private sector credit.
It is therefore imperative to explore a) foreign funding avenues and b) ways to augment the domestic
liquidity of the banking sector that will allow relieving some pressure from domestic interest rates and
possibility of crowding out of private sector credit.

DEBT POLICY STATEMENT 2010‐11
37
A shift in financing mix towards foreign currency flows will also reduce the pressure on domestic
sources, providing room for credit provision to the private sector, and creating space for easing of policy
rates if required. Keeping in mind the persistence of a current account deficit, the proposed mix will
provide some balance of payment support, while ensuring against the consequences of a rebound in
international commodity prices or weaker than expected export performance. Additionally, access to
such financing will be crucial in case of non‐materialization of budgeted foreign currency loans and
grants.
Under the strategy government will mobilize US$ 500‐1,000 million from international debt capital
markets in addition to the budgeted Rs. 43 billion (US$ 500 million). While this may seem like an
expensive and difficult option in the context of recent sovereign debt crises, it will aid in relieving some
pressure from domestic interest rates. The savings on domestic borrowing will outweigh this additional
cost.
Furthermore, steps may be taken to augment the domestic resource envelop. One way could be to
reduce currency‐to‐deposit ratio that currently hovers around 33.2 percent (as of January 08, 2011),
highest in the region. With money multiplier of 3.2 times (as of January 08, 2011), a small reduction in
CDR can significantly add to resource envelope. Ministry of Finance in consultation with SBP will work
out a plan to address this issue.
A major second source of supplementing domestic liquidity could be to unlock personal equity. Banking
penetration is comparatively lower in the rural economy owing to non‐documentation/non‐valuation of
real estate in rural areas. Measures will be taken to incentivize the rural public to borrow against their
assets. This will not only help in supplementing liquidity but would also provide needed stimulus to
domestic demand of goods and services.
To increase the duration of domestic debt,
Government intends to borrow more in longer
tenor maturities. This will allow deepening of
the domestic interest rate yield curve and help
develop the domestic debt capital markets. The
proposed funding plan will reduce reliance on
treasury bills from 53 percent of the domestic debt portfolio to 47 percent by FY2013.
FY10 FY11 FY12 FY13T‐Bil ls 53% 49% 48% 47%PIBs 11% 12% 13% 15%Sukuk 1% 2% 3% 4%CDNS 35% 37% 35% 34%
Table 14. Proposed Funding Mix

DEBT POLICY STATEMENT 2010‐11
38
XI.i. Institutional Reforms
XI.i.a. Reorientation of CDNS
Needed support and resources will be provided to CDNS to restructure and convert it into a vibrant
customer centric distribution channel for government debt instruments for retail investors.
XI.i.b. Development of Domestic Debt Capital Markets
The objectives of debt management cannot be achieved in absence of vibrant and liquid secondary debt
capital markets. Efforts will be made to address the following key areas:
• Consistent and Transparent Debt Management Strategy
• Level Playing Field for All Investor Groups
• Comprehensive Disclosure of Government Fiscal Position
• Liquidity in Government Benchmark Securities
XI.i.c. Centralization of Debt Management Operations
A critical prerequisite of successful implementation of debt strategy is the centralization of debt
management operations, i.e., decision making and implementation.
XI.i.d. Market Risk Management
The government intends to put in place a legal and institutional framework to undertake operations to
manage market risks imbedded in the external debt portfolio within the strategic parameters.
XII. Concluding Remarks
Pakistan’s debt dynamics have witnessed a gradual deterioration since FY2007‐08. Increased pressure
on government’s limited fiscal resources from internal security situation, rehabilitation of IDPs, power
and food subsidies to insulate the general masses from rise in international commodities have resulted
in increased debt burden. The total public debt stood at Rs. 8,894 billion as of end June 2010 or 60.6
percent of GDP, an increase of 16.6 percent over the last fiscal year.
Soundness of Pakistan’s debt position, measured by various sustainability ratios, while deteriorating
slightly from the previous fiscal year, remains higher than the internationally accepted thresholds. Total
DEBT POLICY STATEMENT 2010‐11
39
public debt levels around 3.5 times and debt servicing below 30 percent of government revenue are
generally believed to be within the bounds of sustainability. Total public debt in terms of revenues has
increased to 4.3 times during 2009‐10, as opposed to 4.1 times in the previous fiscal year whereas the
debt serving to revenue has declined to 40.4 percent in 2009‐10 from 46.6 percent in 2008‐09.
Regardless, the widening gap between the real growth of revenues and real growth of total public debt
needs to be aggressively addressed to reduce the debt burden and improve the debt carrying capacity of
the country to finance the future growth and development needs.
It is important to mention here that the debt level is still sustainable, though a bit higher than
acceptable threshold, however the real concern is the widening fiscal account deficits. In this context, it
is imperative for the government to enhance the low tax to GDP ratio by bringing all sectors of the
economy into tax net and withdrawing tax exemptions extended to various sectors. Implementation of
RGST is the right step in this direction. Equally important is the rationalization of current expenditure
and curtailment of non‐productive outlays that will bring improvement in the national investment
climate, saving incentives and opportunities, and competitiveness of the real economy. Government’s
initiatives of restructuring Public Sector Enterprises, implementing National Governance Plan and
Austerity measures would assist in achieving this objective.
Pakistan’s external debt and debt servicing in terms of foreign exchange earnings stood at 1.46 times
and 14.8 percent during 2009‐10 compared to 1.48 times and 13.4 percent respectively in 2008‐09.
These indicators are still within the acceptable threshold of 2 times and 20 percent of foreign exchange
earnings correspondingly. Encouragingly, the growth in non‐interest foreign exchange payment was
negative 4.9 percent whereas foreign exchange earnings recorded a healthy growth of 7.9 percent that
helped reduce the current account deficit. Notwithstanding, the rising global commodity prices including
oil prices, post flood scenario and expected repayment of IMF SBA facility starting FY2012 may exert
pressure on current account in future. Government should take measures to augment the foreign
currency flows to mitigate the effects of higher international commodity prices, i.e., tap international
debt capital markets as envisaged in the debt strategy, take measures to fast track projects to release
sanctioned project loans of bilateral/multilateral agencies, further strengthen remittances initiative and
boost exports.
Debt reduction to sustainable levels cannot be achieved without persistent economic growth. The
slowdown in growth is a major consequence of rising debt burden and simultaneously adversely impacts

DEBT POLICY STATEMENT 2010‐11
40
the debt servicing capacity of the economy. Therefore it is important for the government to adopt an
integrated approach for economic revival and debt reduction strategy, which will require some difficult
trade‐offs in the short‐term. Unless corrective measures on the fiscal and external fronts are adopted
and properly implemented, the debt situation of Pakistan may remain vulnerable in the near‐term. Thus,
implementing structural reforms that boost potential growth is a key to ensure debt sustainability.