DEBT CAPITAL MARKETS REVIEW - Reutersshare.thomsonreuters.com/general/PR/DCM-4Q15-(E).pdfDebt...
22
DEBT CAPITAL MARKETS REVIEW MANAGING UNDERWRITERS Full Year 2015 REUTERS/ Kevin Lamarque
Transcript of DEBT CAPITAL MARKETS REVIEW - Reutersshare.thomsonreuters.com/general/PR/DCM-4Q15-(E).pdfDebt...

DEBT CAPITAL MARKETS REVIEW MANAGING UNDERWRITERS Full Year 2015
REUTERS/ Kevin Lamarque

Banking Composite of Top US Debt Bookrunners 8
IFR Markets Supplement 9
US Securitizations ex.CMBS, Agency CMO, CDO & Self-Funded(F20a) Thomson Reuters Solutions for the Deal Making
Community
14
Brazilian Domestic Debt (BR2)
Global Debt by Mexican Issuers (MX1)
2
Australia Deals Intelligence
All Australian International Bonds (AJ7)
All Australian Debt (ex self-funded) (AJ3a)
Japan Debt
7
3
7
7
4
All Bonds in Euros (N1)
Global High Yield Debt - Non-US Dollar Denominated (B6)
10
14
11All Global Green Bonds (GR01)
All International Green Bonds (JG1) 11
1
1
1
2
6
Asia Debt
Asia Deals Intelligence
International Debt
All International Bonds (J1)
All International Securitizations (J10c)
EMEA Deals Intelligence 10
10
10
3
https://www.thomsonone.com
Bonds Targeted in Japan (AP4)
Debt Capital Markets Criteria Summary
3
17
Global Debt
Global Deals Intelligence
Global Debt, Equity & Equity Related (A1)
Global Debt and Syndicated Loans (DL1)
Global Scorecard
18
US High Yield Corporate Debt (F8)
Japanese Corporate Debt (AP3)
Global Investment Grade Corporate Debt (B7)
All Bonds in Yen (AP5)
Global Asset-Backed Securities (B11) & (B13) 3
Japan Deals Intelligence
Banking Composite of Top Global Debt Bookrunners
6
13
13
US Debt
Global Debt Rankings - Last Ten Years
20
19
All Federal Credit Agency Debt (H1)
US Debt (F1) 6
US Mortgage-Backed Securities (F11)
US Asset-Backed Securities (F14) Criteria Summary
14
14
5
18
17
US Investment Grade Corporate Debt (F9)
6
Middle East Emerging Market Bonds (L5)
2
Full Year 2015 | Debt Capital Markets | Managing Underwriters
Debt Capital Markets ReviewTable of Contents
Global Mortgage-Backed Securities (B10)
16
Leading Underwriters for Fourth Quarter 2015
Global Debt (B1) Australian Debt
Global Debt and Syndicated Loans Islamic Finance (DL2)
17
Japanese Securitizations (AP2)
17
All Asian Currencies (ex-Japan, ex-Australia, ex-China) (AS1a)
All Asian Currencies (ex-Japan, ex-Australia) (AS1)
Samurai Bonds (AP1)
16
16
15
15Dim Sum Bonds (AS24a)
15Asian G3 Currency Bonds (ex-Japan, ex-Australia) (AR2)
Australian Dollar Non-Securitized Bonds (ex self-funded)(AJ6)
15
15
16
12
12
12
12
EMEA Emerging Market Bonds (L2)
Global High Yield Deals Intelligence
Global High Yield Debt (B4)
Global High Yield Debt - US Dollar Denominated (B5)
All International Emerging Market Bonds (L1) 13
13
13
14
Latin America Emerging Market Bonds (L3)
Asia-Pacific Emerging Market Bonds (L4)
Global Debt in Mexican Pesos (MX2)
Domestic Mexican Debt (MX3)
High Yield
Emerging Market Debt
Emerging Market Debt - Latin America
All Brazilian Debt (BR1)

AVERAGE HEALTHCARE AND TECH OFFERINGS TOP $1 BILLION – Debt capital markets activity in the Technologysector totaled US$153.0 billion during full year 2015, an increase of 42% compared to year-ago levels. ConsumerStaples and Healthcare activity saw strong year-over-year growth, registering increases of 31% and 30%, respectively.Average deal size in the Healthcare sector led all industries this year with the average deal totaling nearly US$1 3 billion
US INVESTMENT GRADE CORPORATE DEBT BREAKS ALL-TIME ANNUAL RECORD - High Grade corporate debtofferings targeted to the US marketplace totaled US$1.2 trillion during full year 2015, an increase of 8% compared to ayear ago and the strongest annual period for the asset class since records began in 1980. Fourth quarter activity totaled$254.1 billion, a decline of 6% compared to the third quarter of this year.
GLOBAL HIGH YIELD VOLUME DOWN 22% AS SECOND HALF ACTIVITY FALLS 58% - The volume of global highyield corporate debt reached US$347.2 billion during full year 2015, a 22% decrease compared to full year 2014 and theslowest annual period for global high yield issuance since 2011. Fourth quarter 2015 high yield issuance totaled US$48.8billion, bringing overall second half volume to US$103.1 billion, a 58% decline compared to the first half of 2015 and theslowest six month period for high yield offerings since the second half of 2011.
Global Debt Activity Down 13% l US Investment Grade Debt Breaks All-Time Record l High Yield Offerings Fall 22% l JP Morgan Tops Underwriting Rankings
Full Year 2015 | Debt Capital Markets | Managing Underwriters
DEBT CAPITAL MARKETS REVIEW
Global High Yield Corporate Debt- Quarterly
Global Debt Capital Markets by Asset Class
GLOBAL DEBT CAPITAL MARKETS ACTIVITY FALLS 13% - Overall global debt capital markets activity totaled US$5.3trillion during full year 2015, a 13% downtick compared to full year 2014 and the slowest annual period for global debtcapital markets activity since 2011. Fourth quarter global debt activity decreased 13% compared to the third quarter of2015, marking the slowest three-month period for global debt offerings since the third quarter of 2011 and the thirdconsecutive quarterly percentage decline.
Global Deals Intelligence
$2 2$2.4
50
100
150
200
250
300
$0
$20
$40
$60
$80
$100
$120
$140
$160
$180
1Q 2Q 3Q 4Q 1Q 2Q 3Q 4Q 1Q 2Q 3Q 4Q 1Q 2Q 3Q 4Q 1Q 2Q 3Q 4Q 1Q 2Q 3Q 4Q 1Q 2Q 3Q 4Q 1Q 2Q 3Q 4Q 1Q 2Q 3Q 4Q
2007 2008 2009 2010 2011 2012 2013 2014 2015
Pro
ceed
s ($
bil)
Global High Yield Debt ($bil)
Number of Offerings
Average deal size in the Healthcare sector led all industries this year, with the average deal totaling nearly US$1.3 billion.Materials offerings registered the steepest declines so far this year, down nearly 40% compared to a year ago.
‐12.1% -11.7%
204,825.6
▼
53.86,169,998.9Industry Total 100.0
▲▼-12.3% 10.1%Industry % Change from Same Period Last Year
19,382
Industry % Change from Same Period Last Year
36,589.3
▼▼
‐6.5%
Top Ten Total
-13.9%
9,352,567.7
-14.3% ▼
▲+162
▼▼
-133
▼▼
Industry % Change from Last QuarterIndustry % Change from Last Quarter
▲1151.4
100.0
▼
48.5Industry Total
-8.7%
38,399.9 100.0
Credit Suisse 9 ▼ 1,072Wells Fargo & Co 1,12410 3.3
9▲
246,767.3 -0.14.2HSBC Holdings PLC 88
3,313,585.8 +2.4 ▲
4.0261,311.2 333,686.2
-▼
9+0.9
5.5
+0.5
-2.9%
324,449.9105.8
-218 ▼
Top Ten Total
6.3-0.23.8
283,611.18
7 359,042.53.6
19,716.5
1,651.6-0.1
▲-247
Deutsche Bank7 325,574.9
6 37
1,157.3
▼
3.0
▼5.3+0.3
1,436
▼
-406
-0.44.3Credit Suisse
4.5 ▼
Goldman Sachs & Co
-0.1 Deutsche Bank
+0.4
▲+0.2
+0.2 -146 6.6
8Morgan Stanley
▼
2.3
1,719.8
-0.1
▲
6.01,230
8.1
6.3
▼
2,405.4884.8
1,576
▼
5 380,798.6
Goldman Sachs & Co
2,530.9-0.8 ▼ 7.4
5.3 1,155325,618.3
▲ 1,424 7.3Morgan Stanley 5 6 326,217.7 5.3Barclays ▼4 4.3 +0.2
HSBC Holdings PLC-0.6
1,658.8-
+0.45.72,205.16.6
0-135
Citi 3 2 388,192.1 8.26.2 +0.7
JP Morgan 1 1 461,854.6▼▼
7.5
2015 Rank
2014 Rank
6.4
Bookrunner
Bank of America Merrill Lynch 2 4 392,425.5
Share Ch.
▲
Deals# of
1,808
1,587
ProceedsMarketSh (%)
Global Debt and Syndicated Loans (DL1)
Imputed Fees (US$m)
+0.3 ▲ 2,985.99.3 -303 +0.5 ▲# of Deals
6.3▲ 8.1+0.8 ▲
-1882,516.9-104
+0.21,574
10
2Citi
5
Fees
4
6
JP Morgan
7
▲
Proceeds per Bookrunner (US$m)Market Market
▼Bookrunner
2015 Rank
7.8
Global Debt, Equity & Equity-related (A1) Jan 1 - Dec 31
Proceeds per Bookrunner (US$m) # of Deals per BookrunnerManagerChange in Market Market
Sh (%)
Wells Fargo & Co
Barclays
Bank of America Merrill Lynch
387,128.6
704,148.62
3
4
1 1
3.5
6405,317.5
1,046
▲1,638
+5.835
91,642.3▼
▼
4,554,620.21,510.9
▼
2014 RankShare Ch.
MarketSh (%)
23,534
-21.7%-10.7%
+4,152▲
-15.3%▼
▲-92 +4.7
▲
▲▲
4.7▼▼
-418
▼ 2,134.5 5.87.0
1,814.3 +5.0
-2,816
4.43.0-0.3
1,5811,392
0 1,070
8.1 +4.1
+0.3
▼+4.3
2.94.3
+2.9
Share Ch.Sh (%)Manager Market
▲
2,673.3-503
# of Deals per Bookrunner
Jan 1 - Dec 31
Change in Proceeds
Imputed Fees (US$m)
# of Deals Fees# of Market
Sh (%) Deals▲
Sh (%)Market
Share Ch.+0.6 2,430
Market
▲7.610.6▲7.3 +7.3
2,763.0 +7.610.3 ▼
591,726.5 ▼6.3 -0.37.2 -0.4 ▼7.5
▲5.05.2
▼ +95
▼6.8▲
-0.4
489,504.8
▼-176-175
1,701.0-0.5
2,493676,004.58.11,907
-143 ▼6.7
1,587.6-264
4.3 1,6124.1 ▲ 1,501.11,914
+0.84.1
-0.2
-269
1,041.3▼
4.55.9
▼-112 ▲
▲50.3 +50.318,369.3
+4.14.1+4.54.5
▼
100.0▲
EMERGING MARKETS CORPORATE DEBT DOWN 40% - Corporate debt from emerging markets issuers totaledUS$192.6 billion during full year 2015, a 40% decrease from a year ago. Nearly 56% of all emerging markets corporatedebt during the year was raised by issuers in India, Mexico and Malaysia and Russia. Issuance from corporations inBrazil totaled US$10.7 billion, a decline of 82% compared to a year ago.
JP MORGAN TOPS GLOBAL DEBT LEAGUE TABLE - JP Morgan held the top spot for global debt underwriting duringfull year 2015, with proceeds of US$395.0 billion and an increase of 0.4 market share points. Barclays moved to secondplace from fourth with a market share gain of 0.8 points, while Citi maintained third place.
OVERALL DEBT UNDERWRITING FEES DECLINE 17% - According to Thomson Reuters/Freeman Consulting,estimated fees from DCM activity totaled US$19.9 billion during full year 2015, a decrease of 17% year-on-year. Feesfrom high grade debt totaled US$10.4 billion (a 52% share), while fees from high yield debt totaled $4.3 billion. High yieldfees decreased 24% compared to a year ago, while investment grade fees decreased 12%.
$0.0$0.2$0.4$0.6$0.8$1.0$1.2$1.4$1.6$1.8$2.0$2.2
1Q 2Q 3Q 4Q 1Q 2Q 3Q 4Q 1Q 2Q 3Q 4Q 1Q 2Q 3Q 4Q 1Q 2Q 3Q 4Q 1Q 2Q 3Q 4Q 1Q 2Q 3Q 4Q 1Q 2Q 3Q 4Q 1Q 2Q 3Q 4Q 1Q 2Q 3Q 4Q 1Q 2Q 3Q 4Q
2005 2006 2007 2008 2009 2010 2011 2012 2013 2014 2015P
roce
eds
(US
$t)
Investment Grade Corporate MBS Federal Credit AgencyAgency, Supranational, Sovereign ABS High Yield CorporateEmerging Market Corporate
Visit http://dmi.thomsonreuters.com to view archives and order custom League Tables https://www.thomsonone.com
1

190,634.6
435,065.6166.7
US Federal Credit Agency Debt (B8)
-21 1%
983,783.0154,416.11,212 +23.5%
US High Yield Corporate Debt (F8)
Global High Yield Corporate Debt (B4)
All Global Debt (B1)
Agency, Sovereign & Supranational Debt (F10)US Investment Grade (F9)
US Short-term Debt - including MBS, ABS (F16)
+0.1Global Long-term Debt (B2)
Global Mortgage-backed Securities (B10)
+0.1
Global Investment Grade Corporate Debt (B7)
Global Agency, Sovereign & Supranational Debt (B9) -
US Taxable Municipal Debt (F15)US Asset-backed Securities (F14)
▲
Global Long-term Debt ex MBS, ABS & Munis (B3)
▼
0
+0.1
▲+0.5
1,046
-0 1
-0.2
1.4
0.8
245.72.1
▼
-
+21251.7
1.1
▼
-0.1 ▼
▲▲
-116
216.2371.6
-1.1
1.9
1.1
0
158 6▼ 0 8
-26219.4
274.0
▼-5
-317
+58
2.6
▼▲
▼
523.9▼▲▼
1.2
1,218,252.9825876
848
2,917
413.0
3.24,927,030.7
2.2▼
1.3
+2.9%435 931 1
-19.2%2,357
997Global Asset-backed Securities (B11)
-14.1%
-12.3%915
75512,633
2,641,376.1
5,024,553.4
444,214.8347,204.84,232,666.9
149,236.5
323,395.6247
6,344552
10,55312,277 5,798,027.4
3,011,035.2
272,151.5358,886.5
+30.2%
1,104 +8.0%-1.9%
447,805.4344 081 2
321
2.8296
673415
1 9
▲
▼
4.6
-1.1-0.2
+0.4
62,974.1+0.3
83,465.678,194.7 ▲
1.61.5
+0.31714 2.2
1.9
1.8+0.11.8
▼
▲-110+31
4.6▼
4.4449
▲+1.0▲ 872.6 4.42.5 0 -5.0
7.9
641
407
6.9
2.83.1
7341,009
666
5.5
▼
+216502.2
2.0
460
-112
-19
-115▲▼
0-143 ▼ 888.3-241 ▼ 673.8-66
▲5.4
3.4
▼-0.4+1.07.6
+0.55.6
▼4.5 -0.3
▲6.18.2▲
+0.4
-
-97-3031,213 8.3
1,108.88241,197
5.7
▼▼ 1,206.5
+0.8+0.87.0▼
▼3
5.31,057.5-1068.9
1,506.5-62
▲ 8.71,2665 6.4 ▼1,077.3
JP Morgan 1,430▲ +0.8
▲395,022.0 ▲1 1-5142
4 339,420.9
115,294.6
94,233.3
5
10
120,690.4
11
2014 RankDeals
Jan 1 2014 - Dec 31 2014 Proceeds per Bookrunner (US$m)
in ProceedsMarket
Share Ch.$USm
348,380.7
ProceedsDealsDeals
2015 Rank Sh (%)
Proceeds No.Proceeds
6.5343,213.7Barclays
7.56.6
3
Natixis
RBC Capital Markets▲
-21.8%
▼
▲
14,455
▼
-13.3%Nomura
HSBC Holdings PLCCredit Suisse610
RBS
6
93,755.4
99,139.1
21
8
15
20
61,835.850 843 121
1719
Mizuho Financial GroupCredit Agricole CIB
18UniCredit
201819
▼
15
12
1616
1.2TD Securities Inc
1,186
2,600,240.1
UBS
▼
14
+3.1%+0.4%
Societe Generale▼
▲
13
11
▲
▼+4.8%
▲▼
-17.8%
▼Wells Fargo & Co
+2.9%
858307,776.8143,406.2
266,891.9932
8
Deutsche Bank▼
-46.3%
517
6341,138,271.2
510700
-18.6%
448
439
7,906 ▼
13,582.1
▲
156,355.1 1,464
1,977,315.6
Jan 1 2015 - Dec 31 2015
US Mortgage-backed Securities (F11)
US Long-term Debt (F2)▲
Bank of America Merrill Lynch
Morgan StanleyGoldman Sachs & Co
7,295.2263,143.2
369,300.6
1,228,942.2
2,970
759
186,709.0US Long-term Straight ex MBS, ABS & Munis (F3)US Federal Credit Agency Debt (F7)
362
Jan 1 - Dec 31Global Scorecard
252,983.1
4,239
No.
2,609,759.43,2041,917,957.94,514
$USm
131210
MarketManager
+0.91,723.0
▲▲
9
Citi
Bookrunner
67
Global Debt
Global Debt (B1)
BNP Paribas SA
% Change
▲
+0.48.3▲ 1,216
1,299
Imputed Fees (US$m)
-202Fees
Change in
Full Year 2015 | Debt Capital Markets | Managing Underwriters
▲
5.4
-0.1+0.1
3.02.3
-0.1
+0.4
9
▲▲
257,313.1-0.7
3.94.7
1,399.4
▼
8.69.8
▲
1 0 -0 1▼
+0.2
3.6
1,157
283
# of Deals per BookrunnerMarket# of
+1.0287,927.2
7
159,933.3
▲
799
Market
4.8249,154.9
1.2
+0.1
▲
Sh (%) Share Ch.Market
+0.5
193,158.1
▼4.9
203,919.1+1.1
▲▲
+0.1
▼Sh (%) # of Deals
253,738.8 +0.3
All US Debt (F1)
Global Emerging Markets Corporate Debt (B15)
-21.1%-18.4%301,267.8
▼-
▼ ▼
▼▲+0.2
-0.1
-0.10.5
257.5-0.1
1.00.5104.9
194.3▲
158.6▼▼ 1.3
0.8
1.5
-51.7
848
192,619.2 1,241 323,229.6 1,464
Global Disclosed Fees (A2)
435,931.1
JP Morgan
Bank of America Merrill LynchCitiCiti
9972,665
-0.1
Global Short-term Debt (B14)Global Asset-backed Securities (B11)
Bank of America Merrill Lynch7.8JP Morgan
Citi
14.5
9.1
Credit Suisse
JP Morgan
Global Bonds
11.2
+1.8-4.6
+12.2
+1.3
+0.2
+2.7
U.S. High Yield Corporate Debt (F8)
Global Debt inc MBS, ABS & US Tax Munis (B1)
U.S. Federal Credit Agency (H1)
Global High Yield Corporate Debt (B4)
Citi
10.98.3
Global ABS (B11)Global Investment Grade (B7)
Citi
10.6
All International Securitizations (J10c) Bank of America Merrill Lynch 12.2BNP Paribas SA
US Bonds
U.S. LT Debt inc MBS,ABS &Tax Munis(F2)
All Asian Currencies ex CDs (AS1)Asian G3 Currency Bonds ex JP & Aus (AR2)Asia-Pacific Bonds
U.S. Debt, Equity & Equity-related (E1)
All International Bonds (J1)
U.S. Mortgage-backed Securities (F11)U.S. Asset-backed Securities (F14)
BarclaysU.S. LT Federal Credit Agency Debt (H3)
U.S. Investment Grade Corporate Debt (F9)
U.S. Disclosed Fees (E2)
-1.2+2.6
International Bonds
Barclays
12.1
▼17.1 ▲33.7
1
Current Qtr Market Share
(%)
▼
369,080.6
Leading Underwriters for Fourth Quarter 2015
8.2
13.3
U.S. Debt inc MBS, ABS, & Tax Munis (F1)
4
Citi
+0.9 2
4+2.711.1
1
31
11.7
+2.7
+0.8
▲
7.79.4
▲
▲
▲
4
1
Australian Dollar Bonds (AJ3)
All Bonds in Euro (N1)
+0.8+0.5
JP Morgan
Citi
11.613.7
1+1.2
+4.9
▲▲
No. 1 Manager
+2.9
344,081.22,400
Citi
-40.4%
JP Morgan
Market SectorStocks and BondsGlobal Debt, Equity & Equity-related (A1)
2015 vs. 2014
-13.8%▼-22.8%-14.4% ▼
78.0 +4.014,566 -2,449
▲15,510.7▲
▼
19,942.8 100.0
-16.9% ▼
▼-32399
+6▼
-6
-31
5,299,940.5
215
76.82.7+0.11.3▲
▲1.9▼
2470 -
-13.1% ▼
Global Debt Capital Markets % Change by Asset Class
+5.69.5 +4.311.7
HSBC Holdings PLC
1-0.4
▲▲
Commerzbank AG
NatixisMitsubishi UFJ Financial Group
2
13
1
▲
Mkt. Share Chg. from Last Qtr (%)
8
Industry % Change from Last Quarter
34,944.4
2824
2122 27
50,843.121
▲
▲
▲▲
11
1
+1.1
1
▲
▲
▲1
▲
Industry % Change from Same Period Last Year
Daiwa Securities Group Inc
▼-13.4%
+4.2Industry Total
30Scotiabank
23
▼
100.04,048,810.6
49,527.1
Top Twenty Five Total
0.9
35,297.5 0+0.1 1930.70.729
97.325
Westpac Banking+4.9
117.927.6
▼
Consecutive Quarters No. 1
▲
▼
1
▼
▲Australian Domestic Securitization (AJ5) National Australia Bank
Australia Bonds
1.0 -0.1 283+0.2
0.737,433.7
-12.3%
-19.2%-21.8% -21.1%
2.9%
-40.4%
23.5%
-50%
-40%
-30%
-20%
-10%
0%
10%
20%
30%
40%
50%
Investment Grade Corporate
Agency, Supranational,
Sovereign
High Yield Corporate
ABS MBS Emerging Market Corporate
Federal Credit Agency
https://www.thomsonone.comVisit http://dmi.thomsonreuters.com to view archives and order custom League Tables
2

Proceeds per Bookrunner (US$m)
▲+1.2
+9.1
▲
Imputed Fees (US$m)
▼
3.8
# of Deals per Bookrunner Imputed Fees (US$m)
912.3
Global Debt
2.7
Share Ch.
▼
▲
▲549
▲
+0.8
▲
▲Wells Fargo & Co 9
+5.39
52.8BNP Paribas SA
-11.7%-8.6%
6,344
HSBC Holdings PLC+3
5.15.0
128,660.44.3-90
▼▼-74
6▲
4.9 -128,551.0+1.212
-1410 594
▲-43-81
599▼
5.6 -43
+16▲
▲
Proceeds per Bookrunner (US$m)2014 Rank Share Ch.
Global Investment Grade Corporate Debt (B7)
# of Deals
Imputed Fees (US$m)Market
Full Year 2015 | Debt Capital Markets | Managing Underwriters
Market
▲
MarketMarketChange in Market# of Deals per Bookrunner
Sh (%)Deals657
543.6
473.0
JP Morgan 1
▼
▼Sh (%)
10.4
5.2
-37▲
9.4
-1,562
4.0
5.9658.6
8.8
53.5
+0.7
780.3▼ 6.3
7.5
617.7+1.5
Global Mortgage-Backed Securities (B10)Jan 1 - Dec 31
+0.2
▼
▼-95
▼ 451.0
396.8
# of Deals per Bookrunner
▼
8.4
Sh (%)
+1.0
Proceeds
▼
# of2015 RankBookrunner
Manager
Bank of America Merrill Lynch 2 8.7▲+1.8
Jan 1 - Dec 31
6.63 +1.7
Fees1 208,012.4 +1.1
Citi 34
175,310.77.9
+1.36.4
136,355.6169,079.9
5.22
Deutsche Bank 6 47
Morgan Stanley 5Goldman Sachs & Co 5 8
7.9
▲ 555
Barclays 7
+0.3 8.7354135,849.7 +0.8
8
132,992.3 -0.2501
86,531.5 ▼91,743.9
▲4.9 +0.1
4183.3Top Ten Total
▼
1,393,087.4
▼▲
10
Industry % Change from Last Quarter
3.5
100.0
Proceeds per Bookrunner (US$m)
Industry % Change from Same Period Last Year▼
9.4
Global Debt and Syndicated Loans Islamic Finance (DL2)
-8.1%
Industry Total
-12.3%
2,641,376.1
464.1-0.4
-281.15,578.5
6.6
10,418.9 100.0
0-0.3
-19.8%
▲253
-31.4%
534
4.5
4.5
+1.6
Imputed Fees: Global Investment Grade Corporate Debt
▲
Full Year
Jan 1 - Dec 31
9.2 10.0 8.3 9.4 8.5 8.4 11.0 10.6 11.8 10.4
6,9146,491
4,8835,411 6,254
5,817
6,382 6,336
7,9076,345
0
1,000
2,000
3,000
4,000
5,000
6,000
7,000
8,000
9,000
$0
$2
$4
$6
$8
$10
$12
$14
2006 2007 2008 2009 2010 2011 2012 2013 2014 2015
Num
ber o
f Offe
rings
Fees
(US
$bil)
Global Investment Grade Fees (US$b) Number of Offerings
* tie
Wells Fargo & Co
-1.57.55.5
6.7 -3.2110.5124.9
+2.7
90.9
10
Sh (%)
100.0
3.7
100.0
▼
6 8 18,885.1
17,661.5
7
10,820.7
-20.8%
169,253.7641.1259,468.3
▲
-9.8%
655
▼
▲▼▲▲
▼
51▲
60+0.8
▼
7.8
63▲
58.2372.1100.0-71
+5 18.829.24.2
+4
▼
86
4.6▼▲
▲65.4 -2.8 ▼ -0.7
+1.2 +1.6
27.5
2.9▼
▲+1.635.7 5.6 +1.9 ▲
▲9.6 -20 ▼ 22.9 ▼9.2
3.6 -1.7+1.0
-34.5 +1.5
+0.8
7.1
▲ 24
180
-2.4+0.1
▲
▼
21,036.4
Deutsche Bank
Credit Suisse5▼
▼
7▲
-12.1%
4.7
7.018,068.8
12,100.3
3.0
▼
+1.6
1,124.316
11,724.69▲
▲RBC Capital Markets
6
97,823.5
16,742.7
-26.8%
Jan 1 - Dec 31
▼
Share Ch.
Proceeds per Bookrunner (US$m)2015 Rank
9.4
FeesMarket
▲
-9.5%
Manager
▼
▼
88# of DealsSh (%)
▼
▼
-1.4
-14.9%
Market
-2.3-14
91-1.3 ▼
Proceeds
▲
Imputed Fees (US$m)MarketChange in
6.89.2
Sh (%)
▼-0.7
# of Deals per Bookrunner
100.0
-0.3 ▼
▼
58.7-5
-5
▼
6.5
10
▼-149
66.7 -1.5848 1,657.6
▲ 41.1▲149.8
+41813.5▲ 6.6 -1 ▼
+1.1+3.2
2.567.8
9.0
+1.4
5.1 -1.3+0.8
21.3
5.25.1 -1.2
-9
4.9 +0.1 56+1.4
53.463 7.46.8
77
8.0 ▼ 112.8
9.1 -26
3 6 24,706.6
-
14.8% ▲
2▲ 11.1
Share Ch.▼-0.6
98 11.6 ▼-16-5
-1.0
14.6
1,111.6
-0.6+1.4
101 11.9 ▲+0.3
Market
+1.0▼
▼▼▼
▼
0.8%
447,805.4
# of Deals per Bookrunner
▲
Sh (%)
8 59 17,755.7
68
▲14.1124
▲
▼▼
Wells Fargo & Co
100.0856.3
077.1 +5.5
0.8
+51876
8.6-368 7.8+1.6
100.0
▼-0.2 ▼▲
10337,341.6 75.5
-2.6 ▼ 72Mischler Financial Group Inc 10 3.6Deutsche Bank 9 24,425.5
16,064.0-3.067.4-0.960.2 5.4▼
▼Goldman Sachs & Co 8 7 25,157.3 5.6
6.18.2 -32-4
5.5▼ 61▼ 87 9.9
▲+1.9+1.7
8.110.6
29,796.2 6.575.9
▲ 72.7▲29,341.2
6.7 +14 -▲
06.8 ▲
4
+1.3
+46.6 +0.1
90.1▲7.9-1.4 10.0
118.012.3 +14
▼+24
6 36,527.0 108
889
-0.9+3.1
▼100.9 9.1▲
▲12.3 ▲3
116.21 ▼9.5 -1.0
▲42,699.8 +1108
Market
Wells Fargo & Co 4
+35131
Proceeds per Bookrunner (US$m)2014 Rank Proceeds
8.2
Bank of America Merrill LynchJP Morgan
2 8 43,095.1
Industry Total
Industry % Change from Last QuarterIndustry % Change from Same Period Last Year
3
# of DealsShare Ch.2015 Rank
Market # of
HSBC Holdings PLC
94
▲
4 543
2
5
84.4
2.7
24,290.9
3
8
Top Ten Total
-5.7%-21.1%
344,081.2
▼▼
229,708.9Industry Total
Industry % Change from Same Period Last YearIndustry % Change from Last Quarter
▲
Bookrunner
▲
JP Morgan
▲▲
Mizuho Financial Group
6
146.3
Top Ten Total
150 17.1▲
+1.5Morgan Stanley
▲
5
▲13.212.3 ▲+4415.0
+2.3▲10.5
4
▲
100.0
# of
Industry % Change from Same Period Last Year
Manager
-7.6%
Market
Citi 1JP Morgan
19.8
Bookrunner39,562.8
9.97.0
▼7.0
Proceeds11.5
7.224,150.9
610.0
-0.9 7.0Citi 7Barclays
88
-0.6
35,345.0▲
Imputed Fees (US$m)
Global Asset-Backed Securities ex-CDOs (B13)
▲
Share Ch.
▲
+3.2
Sh (%)
# of Deals per Bookrunner
+3.5▲
Deals
84 12.8Citi
2014 Rank
Market
+0.2
Market
28,342.6
# of
MarketFees
▼
+4.3
+10.2
6.2%-4.7% ▼
+2.7
▲
6.1
Imputed Fees (US$m)Change in ManagerMarket
Deals Sh (%) Sh (%)Market
9.6
2
▼
233.5
-2.439.0
▼
12,023.1
123.0▼
▼
-15
+63.5
Industry % Change from Last Quarter 28.6%
▲
+5.2
9.310.2
5.4
Fees
4.3
Jan 1 - Dec 31
Market
-2▲
63.5
▲
Market Change in
7.1
2.1
+9.39.8
4.2
+2.15.2
+4.24.4+7.1
▲1 2 54,890.5Credit Suisse▲
Market
+15.0
Market Change in # of DealsSh (%)
MarketMarketSh (%) Share Ch.
7.410.7
15.8
▼▼
Manager
-10
Share Ch.
16.5
-76.5
7
2,286.2
Deals # of Deals
121
23,418.2
Fees
# of Deals per Bookrunner
1▼
Share Ch.
3.42.8
+3.4
2014 Rank
7.4
+2.25.5
Proceeds per Bookrunner (US$m)2015 Rank
Market
Deutsche BankMorgan Stanley
54
9
19.8-2.6
Sh (%)
84
▲
41.4▼
10
71
7
3
17,003.7
3.2
▼ 36.3
Top Ten Total127
Bank of America Merrill Lynch
+0.7-5▲
10.8
▲
▼
46.20
-4.2Bank of America Merrill Lynch13.118,303.2
8.1 +0.313.913.4
-9Barclays▼ 43.9
10.912
7.2- -0.2
▼ 15.0Bookrunner
-226.55.7
▲
2015 Rank
2014 RankBookrunner
Market
5,421.4 13.1Sh (%)
Proceeds per Bookrunner (US$m)
CIMB Group Sdn Bhd 1 +1.4
# of
HSBC Holdings PLC-1030
Proceeds37 30.6
24.820 -14
Deals
Malayan Banking Bhd 3 32
+0.48.28.6 +2.43,580.5
▼-5RHB 4 7 2,689.8 24Standard Chartered PLC 5 4Dubai Islamic Bank PJSC 6
▲
▲5.8
▲▼▲ 23 19.0
13 2,114.2 -2.4 18 +10 ▲14.95.1
+1.04.0 -0.9 +1 2.2
-5 4.63.57▼
AMMB Holdings Bhd 8 1,464.1
10
51,669.4MashreqBank PSC
9
105.4+3.2
6
11
10.71513
66.78.3
12.43.11,301.4 ▲
61.1%
41,500.2 100.0Industry Total
▼▲
-16.4%
Sh (%)
-4.9%
-15.3%
2.9%
Mizuho Financial Group
RBC Capital Markets
-18
24,111.75.5 +1.0
33,847.8
-36Credit SuisseBarclays
▼
▲▼
▲
Industry % Change from Last Quarter
155.3%
-2.4%
Industry Total
Global Asset-Backed Securities (B11)
-10
Industry % Change from Same Period Last Year
▼
-9.3%
Imputed Fees (US$m)
Share Ch.
-2.6%
▼
9.8%
25,221.1 60.71,275.9
▲
1▼
Top Ten Total
9
▲▼10▲
National Bank of Abu DhabiCiti 3.1
+0.3+1.4
+13.6
https://www.thomsonone.comVisit http://dmi.thomsonreuters.com to view archives and order custom League Tables
3

Full Year 2015 | Debt Capital Markets | Managing Underwriters
Issue Type Composition for the Top Global Debt Bookrunners Jan 1 - Dec 31 2015
Banking Composite: Global Debt
59.7%
49.9%
56.1%
60.3%
56.5%
59.6%61.3%
52.3%
51.6%
5.1% 4.7% 4.4%6.3%
4.0%6.8%
4.0%0.5%
12.3%
9.3%
60%
70%
80%
90%
100%
4.8% 4.9% 5.8% 4.3% 3.4% 2.7% 2.3% 2.1%
6.8% 6.5%
13.6%
19.4% 16.4%
12.9% 14.5%12.4%
15.2%
28.9%
9.5%
0.2%
2.0%
1.9%3.2%
2.3% 2.5%2.6% 0.5%
5.3%
1.1%
0.3%
1.6%
6.2%
1.1%
0.3%
2.7%
1.1% 0.5%
2.2%
0.0%
0.0%
13.2%
13.0%
13.0%
13.7%
16.5%
14.8% 16.2%
8.9%
18.6%
14.3%
69.4%
0%
10%
20%
30%
40%
50%
%
JP Morgan Barclays Citi Bank of America Merrill Lynch
Deutsche Bank Morgan Stanley Goldman Sachs & Co HSBC Holdings PLC Credit Suisse Wells Fargo & Co
% T
otal
Pro
ceed
s
ABS Agency, Supranational, Sovereign Emerging Market Corporate Federal Credit Agency High Yield Corporate Investment Grade Corporate MBS
https://www.thomsonone.comVisit http://dmi.thomsonreuters.com to view archives and order custom League Tables
4

Full Year 2015 | Debt Capital Markets | Managing Underwriters
Global Debt Rankings* - Last Ten Years
1
2
3
4
JP Morgan
Barclays
Citi
Bank of America Merrill Lynch
*Global Debt League Table (B1) positions reflect consolidation within the banking sector. Rankings shown are as of the current quarter end in each calendar year.
5
6
7
8
9
10
2006 2007 2008 2009 2010 2011 2012 2013 2014 2015
Ran
k
Deutsche Bank
Morgan Stanley
Goldman Sachs & Co
HSBC Holdings PLC
Credit Suisse
Wells Fargo & Co
https://www.thomsonone.comVisit http://dmi.thomsonreuters.com to view archives and order custom League Tablesg ( ) p g g q y
5

+0.1
▼
▲▲▼
▼▲
+0.2
0-2.0
+0.5+0.1+0.7-0.1-0.2+0.1
1.71.8
2.52.42.62.2
0.9
1 0
0.70.9
41.555.262 3▼
▲▲▼
0+4+35+8-22+9+4+11-107
33.64 9
9.711.610.913.18.99.44.83.533
3446
838845
▲ 90108102122
▲
▼
▲▲▲▼
▲▲
+0 1
+0.7+0.3+0.9+0.1-0.3+0.2
2.42.32.32.21.81.31.0
RBS
131718
15,323.5
8,163.0
16
180.7
Scotiabank
Mizuho Financial GroupRBC Capital MarketsBNP Paribas SAUS Bancorp
Societe GeneraleCredit Agricole CIB 12,358.4
241119
141612
131415
2019
17
8 139 6
Manager
42.1 +23 ▲ 670.2
Fees# of DealsChange in
▲
+0.3+0.5-2.2
Share Ch.-42 ▼ 749.4 12.4 +0.1 ▲
Sh (%)409 43.913.2 -0.3 ▼1 161,983.6
7
11.6 +0.6 ▲
▼
30,034.128,292.428,227.027,093.6
JP Morgan 1
9 9
12
51,133.1
11 15
7
0.911,507.2
21,472.5
0 7
Share Ch. Deals Sh (%)Market MarketMarket # of Market
Imputed Fees (US$m)
▲
11.1 +0.7
Full Year 2015 | Debt Capital Markets | Managing Underwriters
US DebtHighest Volume on Record for US Investment Grade l Underwriting Fees up 14%
US Investment Grade Corporate Debt (F9) Jan 1 - Dec 31
▲
Proceeds
Proceeds per Bookrunner (US$m) # of Deals per Bookrunner2015 Rank
2014 RankBookrunner
MarketSh (%)
8
142,659.6
5 4 93,593.9
72,490.2
2 2
6Barclays
US Deals Intelligence
US Debt (F1) Jan 1 - Dec 31
Bank of America Merrill Lynch
Morgan Stanley
HSBC Holdings PLCDeutsche Bank
UBSMitsubishi UFJ Financial Group
▲Citi 3 3 129,151.9 10.5
392▼ 531.4+1.1 ▲ 36.3 -16338 8.8 ▲
Goldman Sachs & Co 4 5 99,619.7 8.1+1.1
+0.5 ▲
Wells Fargo & Co 6 8 89,586.27.6 -0.17.3
▲7.6 -0.1 ▼274 29.4 -19
-24 ▼ 7.3 +0.7459.2▼
+1.2
223 23.9 442.1
25.8 ▲5.9 -1.3 ▼ -70
+1.6 ▲ +3201 21.6240 ▲
5.3 0 -7.5
▼454.5320.9
-0.8 ▼253.2 4.265,314.6 5.3 -37 ▼-1.1 ▼ 182 19.54.2 -0.5 ▼ 190.1105 ▼ -0.8
122 13.111.3 -35
-11 -0.3197.9 3.3▼
Credit Suisse 10 10 45,146.1 3.7 -0.3 ▼ ▼3.1
▼▲
▼
▲
-▲▲▲
101.8108.153.1
149.5145.1158.6135.6
Annual volume for U.S. Investment Grade corporate debt in 2015 reached US$1.2 trillion, an all-time high. Thenumber of deals decreased 16% to 932 issues. Despite the decline, average deal size increased from US$1 billion toUS$1.3 billion. US Investment Grade volume was bolstered by several jumbo transactions, as 13 deals with aprincipal amount over US$10 billion raised a total of US$180.5 billion in 2015. In comparison, just eight offeringsgreater than US$10 billion came to market between 2005 and 2014. The largest transaction of 2015 was March'sActavis Funding issue, which ranked as the second largest bond issue on record.
The Financials, Energy and Power, Healthcare and Technology sectors accounted for 74.2% of U.S. InvestmentGrade corporate volume, in aggregate with US$912.3 billion in proceeds. Technology sector volume was the higheston record, with US$104.3 billion, up 66% from a year ago. The US$14.6 billion Hewlett-Packard issue in Septemberwas the second largest Technology sector financing on record.
According to data from Thomson Reuters/Freeman Consulting, 2015 fees totaling US$6 billion were the highest onrecord and were up 13.8% from fees paid in 2014. JP Morgan was the top fee earner with US$749.4 million. WellsFargo saw the largest increase in fee share, up 1.2 percentage points.
24.0
▲▲
0.4Standard Chartered PLC ▼1.6
▲
-16
▲▲▼
39.7%
+0.2+0.1-0.10.4
46.6
+1.96,061.3
‐12.6%
-▲▲+0.1
13.8%
0+0.2
0.8
0.80.8
1.00.7
62.340.350.047.5
▼▼▲
+1
-3-1
+2+6
4.9
2.72.4
1.94.6
2215
46184325
+0.1+0.2
+0.1
▲
0-0.2
▲-▼
0.50.50.4
+0.4Scotiabank
22
193123SunTrust Banks
20 8,139.6
Top Thirty Total
2122
2423TD Securities Inc
Sumitomo Mitsui Finl Grp Inc
Bank of New York Mellon Corp
‐5.1%
6,021.0
25
5,964.65,287.04,492.620
28
‐5.4%
72.9 -0.5
‐5.2%
▼
▲▲
‐22.1% ▼‐26.7% ▼
▼
▼Industry % Change from Last Quarter
▲
0.66,813.70.7
‐15.6%
Proceeds per Bookrunner (US$m) # of Deals per Bookrunner Imputed Fees (US$m)
1,186,573.6 96.9
0.4
93.2100.0
+1.2 ▲ 5,629.9
Industry % Change from Same Period Last Year 8.0% ▲
-172Industry Total
▼
Industry % Change from Last Quarter ‐3.9% ▼Industry % Change from Same Period Last Year ‐17.8% ▼
932
Top Ten Total 190,632.8
1,228,942.2 100.0
Industry % Change from Last Quarter ‐5.7% ▼ ▼
362 -155
▼
Industry Total 252,983.1
4.7▲ 151.42,360.075.5 -1.1 ▼
96RBC Capital Markets 10 10 12,093.8 4.8 +0.5 +0.8 ▲31.5 -35 5.0 -0.6
-12 ▼▼
26.55.2 -0.5 ▼ 114Wells Fargo & Co 9 9 13,116.7
207.2 6.4▼ 162.2
107 29.6 -49 ▼▼
Credit Suisse 8 7 14,846.2 5.9 -1.8 ▼ -0.9 ▼29.8 -35 5.7 -2.46.5 -1.7 ▼ 108
▲Morgan Stanley 7 4 16,331.6
223.8▼ 185.5
126 34.8Barclays 6 8 18,301.0 7.2 +0.7 +0.4 ▲37.0 -25 7.8 +0.3
-15 ▼▲
6.98.3 0 - 134Deutsche Bank 5 3 20,940.7
236.7 7.3▼ 252.5
136 37.6 -24 ▼▼
Citi 4 5 21,056.5 8.3 +0.2 ▲ +0.6 ▲39.2 +1 7.7 -0.18.6 +0.7 ▲ 142Goldman Sachs & Co 3 6 21,697.8
320.7 9.9▲ 248.9
183 50.6▲
Bank of America Merrill Lynch 2 2 24,777.4 9.8 +0.9 ▲ +0.7 ▲47.0 -56 11.5 +0.7▼ 371.1
-22 ▼JP Morgan 1 1 27,471.1 10.9 -0.1 ▼ 170
Sh (%) Share Ch.Sh (%) Share Ch. Deals Sh (%) # of Deals Fees2015 Rank
2014 RankBookrunner Proceeds
Market Market
Market MarketMarket Market # of Market Change in Manager
2015 Rank
2014 RankBookrunner Proceeds
# of Market Market MarketChange in ManagerSh (%) Share Ch. Deals Sh (%) # of Deals Fees Sh (%) Share Ch.
1 296,264.8 20.5 -148▼ 86811.4 -0.4 ▲Bank of America Merrill Lynch 2 3 264,988.2 10.2 +0.6 ▲JP Morgan 1 11.2 +0.4
899 21.2 -34 ▼▼ 1,396.0
+0.31,273.3 10.3Citi 3 2 254,735.2
5.9-75 ▼ 1,160.7
643 +0.4
▲▲9.3 +0.89.8 +0.1 ▲ 776 18.3
728.5Barclays 4 4 221,385.1 8.5 +0.1 ▲
6 6 180,317.6
▲7.0 +1.5
-62 ▼20.1 +153
521 12.3 -44 ▼ +0.2▲ 870.2
▲▲+0.9
Morgan Stanley 7 7 177,777.6 6.86.9 -0.1 ▼Goldman Sachs & Co
7.4 -0.5
851884.5 7.1
7.0
-0.1 ▼ 620 ▼522 12.3
14.6 -37 ▼Deutsche Bank 8 5 155,680.0 6.0 -1.2 ▼ -132
915.9▼
11.8 -43 5.65.5
▼ 690.8-1.0▼ 679.6
▼5.7 -0.5 ▼3.4 -0.1 ▼
500-0.2 ▼
Credit Suisse 9 8 147,665.5HSBC Holdings PLC 10 10 88,595.9 247 5.8 -42 ▼ 273.1
-0.6
Industry Total▼
2.2Top Ten Total 1,969,187.7
2,609,759.4 100.075.7 -0.1 8,872.6
-275 12,427.74,23971.5 +0.7 ▲
100.0
▼▼ ▼
▼‐14.1%
Jan 1 - Dec 31
Proceeds per Bookrunner (US$m) # of Deals per Bookrunner Imputed Fees (US$m)
US High Yield Corporate Debt (F8) Jan 1 - Dec 31
Proceeds per Bookrunner (US$m) # of Deals per Bookrunner Imputed Fees (US$m)
All Federal Credit Agency Debt (H1)
2015 Rank
2014 RankBookrunner Proceeds
Market Market # of Market Change in Manager Market MarketSh (%) Share Ch. Deals Sh (%) # of Deals Fees Sh (%) Share Ch.
3.8 +30▲ 238Barclays 1 1 72,571.8 14.1 +1.16.8
▲ 23.1 ▲Wells Fargo & Co 2 8 44,569.0 8.6 +3.4
8.1 -0.8 ▼ 221813 13.1▲
+36 ▲ 18.0 6.4 -0.9
8.2 +1.2+382 ▲ 19.1
Nomura 4 5 30,929.5 6.03.6Deutsche Bank 3 2 41,530.8
▲ 175 2.8 13.9 ▼
+1.8 ▲▼
5.0 -0.45.6 -0.3
+63 ▲3.4 +9 ▲212▼
+0.3▼
JP Morgan 6 3 28,150.0TD Securities Inc 5 4 28,672.0 -0.45.2
-3.014.7
201 3.2 +10 ▲4.5 -0.9 ▼ 5445.5 -0.9 ▼
Morgan Stanley 7 7 23,113.6702
▼▲8.8 +228 ▲
▲20,215.1
15.1 5.4 +1.113.0
▼5.7 +1.0
4.6
First Horizon National Corp 8 12 20,384.8 4.0 +1.0 11.3 16.1 ▲3.9 -1.7
+239 ▲2.4 -1.16.7 ▼
Citi 10 10 17,391.9112HSBC Holdings PLC 1.89 6
Top Ten Total 327,528.5▲3.4 -0.4 ▼ 185 3.0
63.7 +0.8 ▲-0.8
-55▼+54 ▼
▼150.5 -1.510.8 3.8
53.5515,575.8
6.0% ▲
100.0
‐30.0%
3,237.6 100.0
▼‐4.2%
100.0
51.4%
Industry Total 6,201 281.2
▲ 48.2% ▲
100.0+2,104
▲Industry % Change from Same Period Last Year 30.8% ▲
Industry % Change from Same Period Last Year 0.4% ▲‐6.4%Industry % Change from Last Quarter ‐8.9% ▼‐6.1%
38
21
2930
SantanderBBVALloyds BankANZ Banking GroupPNC Financial Services Group
262728Wells Fargo & Co 5 9 181,777.8 ▲
15.24,470.94,271.23,071.32,535.0
264029
-0.10
+0.10.40.30.2
211711
2,356.1 12
▼-▲▼
0.2
▲▼
1.3
-9-5
+3
+1
2.31.81.2
0.50.40.3
▲
34.730.122.5
38.4
▼▼
▼▼▲-
0.6
-0.1-0.1+0.2
+0.2
0.6
016.1▲
-113-0.1 1.4-0
Visit http://dmi.thomsonreuters.com to view archives and order custom League Tables https://www.thomsonone.com6

9
4
Wells Fargo & Co 6 7RBC Capital Markets 7 9
Industry % Change from Same Period Last Year
Bank of America Merrill Lynch
Credit Suisse 3
3 20,718.6
▼▼
71.4 5.2 +2.1 ▲84
+1.0
+1.47.9 -3.2 ▼
Full Year 2015 | Debt Capital Markets | Managing Underwriters
US Securitizations
+469 13.5 -34
‐16.4% ▼
16.5▼91 17.8 -18 ▼ -2.1114.6 8.4
18.8 ▼
6 21,949.6 8.3
12.52 32,998.8
▲ ▲
Sh (%)Deals Sh (%) Share Ch.▼ 15.5-13
▲+2.1 ▲212.6+0.9
# of Deals
-6 121.2 8.8
Fees
Imputed Fees (US$m)
▼6.6 -4.1112.7 8.2
Share Ch.13.8 -1.4
▲
Barclays8.6 -1.5 ▼
JP Morgan▼
4 22,709.0
Citi 1 1 36,417.82
Bookrunner Proceeds
Proceeds per Bookrunner (US$m)Market Market2015
Rank2014 Rank
Jan 1 - Dec 31
# of Deals per Bookrunner Imputed Fees (US$m)Manager
Proceeds per Bookrunner (US$m) # of Deals per Bookrunner
US Mortgage-Backed Securities (F11)†
96111 21.8
# of Market Change in MarketSh (%)
Market
US Asset-Backed Securities (F14)† Jan 1 - Dec 31
18,798.2 7.15 ▼ 91.2
+1.0 ▲ 67 13.1 -10 ▼ +1.1 ▲10.6 -4 ▼ 49.5 ▲+0.516,376.5
Deutsche Bank 8 5 15,686.5 6.0 -1.1 ▼▲6.2 +0.9 54
74.2 5.43.6
64 12.5 -24 ▼ -2.1 ▼8 15,476.6 5.9 +0.3 ▲ 51 10.0 +2 ▲
Goldman Sachs & Co 10 10 9,491.8 3.6Morgan Stanley ▲ 134.0 9.8 +0.9
38 7.5 -6 ▼ +0.6 ▲Top Ten Total 210,623.4 79.9 -2.8
-0.2 ▼1,061.0
79.6 5.8▼ 77.3 -0.1 ▼
Industry Total 263,143.2 100.0 100.0510 -100
▼
1,372.2
‐19.9%Industry % Change from Last Quarter ‐13.9% ▼
‐18.6%▼ ‐12.0%‐9.5%
US ABS Collateral Volume Breakout (US$b) Jan 1 - Dec 31
US Asset-Backed Securities excluding Self-Funded (F14a)† Jan 1 - Dec 31
Proceeds per Bookrunner (US$m) # of Deals per Bookrunner Imputed Fees (US$m)
$74.5 27%
$27.0 10%
$13.3 5%
$99.8 37%
$55.6 21%
CDO Credit Card Student Loan Auto Other
†
3.0% ▲‐11.1% ▼ ‐1.6% ▼‐3.7%
-0.4 ▼▼
1 28,747.2 14.2
369,300.6 100.0
Sh (%)
▲
ProceedsCredit Suisse 1
8
128 30.7 -0.2 ▼JP Morgan 2 2 22,853.5
Wells Fargo & Co24
308,009.1
Industry % Change from Same Period Last YearIndustry % Change from Last Quarter
7
2.9% ▲
20,957.1
7
Share Ch. Deals# of
4.45.7
▼▼
0.2%
MarketSh (%)
+6Fees
▲ 101.7
ManagerChange in
16.7Sh (%)# of Deals Share Ch.
Market
▲+59
Market
▲3.7% ▲16.5%
100.0889.8
1.085.7
58.7
Imputed Fees (US$m)2015 Rank
2014 RankBookrunner
624,895.3
+1.5
-0.6
36,527.0 9.9
▼
6.5 -1.3
7.6 -1.56.7
+1.5 ▲
1.7% ▲▲8.4%
759
0 -+5.1
8.6▼762.2
▼-3-0.2 ▼
▼-2.6 7.8 -23
▼7.2
-2.3 ▼▼
-0.2 ▼5.9 -1.66.6
▲ -0.6
▼
6.860.80 - 64.1
52.6-5
11.1 +15
68 9.0
9.77.8
7459
84
59
Market
6 6
3
Proceeds per Bookrunner (US$m) # of Deals per BookrunnerMarket
3 27,870.5
16,064.010
+3-3-0.2 ▼
7818.5
Goldman Sachs & Co
10Mischler Financial Group Inc
6 24,045.6Deutsche Bank 9 5
7718.7
-8
Top Ten TotalIndustry Total
83.6 +2.2 ▲
+2.3 ▲72 9.5 +19 ▲ 72.6 8.2 +1.7 ▲
+25
12.6
Deals
▲+15 ▲-0.4 ▼93.8+2.0
10.5+5 ▲118.0 13.3
Imputed Fees (US$m)
Share Ch.Market
▲ 90.8 10.2
2014 Rank
53,512.6
110 14.5108 14.2
10.7 96-0.2 ▼14.5 +2.7 ▲
9.6▲
+2.9 ▲8.0
Market
▲Sh (%)
19.0 +4.2+44 ▲ 142.2# of Deals
16.0FeesSh (%)
Market # of Market Change in Manager Market
Citi
JP Morgan 2
Morgan Stanley
3
5Barclays
Bank of America Merrill Lynch 4
Sh (%)Credit Suisse 1 1
Share Ch.144
29,405.6
Bookrunner Proceeds2015 Rank
98 35,252.5
39,478.9
Proceeds per Bookrunner (US$m) # of Deals per Bookrunner
▼-1.2 ▼ 85 20.4 -12 ▼ 52.2
57.283 9.4 -1.83 19,980.2
11.3 +0.1 ▲8.5 -2.0
19.9▼
Citi 4 5 19,944.4 9.9 +0.5 ▲Bank of America Merrill Lynch 9.9
Barclays 5 4 18,848.9-1.2
+1.576
6.540.09.3
▼▼▲
▼ 42.0 6.9 -1.0▲
8.249.9▼▼ 27.7 4.5RBC Capital Markets 7 8 12,638.5
Wells Fargo & Co 16,175.8
▼
+0.3 ▲6.2 -0.3 ▼ -68.0 18.2 -4
▼Deutsche Bank 8 7 11,560.5 5.7 -0.8 ▼ 55
-0.5▼-0.9
9 2.2 ▲-14
+7.3+126.7 4.4
▲ ▲ 60.9 10.0+1.2▲ 32.5 5.3+1
490.8 80.4 +2.4 ▲417
▲
Industry % Change from Last Quarter
611.1 100.0
▼
-16
‐12.0% ▼Industry % Change from Same Period Last Year ‐8.6%
202,535.1Industry TotalTop Ten Total 163,843.4
11.34713.2
7.7Guggenheim Securities LLC
Quarterly Residential ABS, MBS & CDO Volume
▲
▼
100.081.0 +0.4
3.33.2
6,707.1 +2.29Goldman Sachs & Co 32▲10 11
166,387.3 +0.2
Proceeds per Bookrunner (US$m) # of Deals per Bookrunner Imputed Fees (US$m)2015 Rank
2014 Rank
Market MarketBookrunner Proceeds Sh (%) Share Ch.
# of Market Change in Manager Market MarketDeals Sh (%) # of Deals Fees Sh (%) Share Ch.
Citi 1 1 32,789.1 13.5 +1.3 ▲ 104 21.7 -2 ▼ 207.0 15.6 +2.6 ▲JP Morgan 2 4 26,087.1 10.8 +1.0 ▲ 87 18.1 -7 ▼ 111.9 8.4 +1.0 ▲Credit Suisse 3 2 21,709.0 8.9 -2.2 ▼ 89 18.5 -20 ▼ 113.5 8.5 -2.3 ▼Barclays 4 7 20,449.9 8.4 +1.7 ▲ 80 16.7 +5 ▲ 68.0 5.1 +2.2 ▲Wells Fargo & Co 5 6 18,798.2 7.7 +0.9 ▲ 67 14.0 -10 ▼ 110.4 8.3 +1.0 ▲Bank of America Merrill Lynch 6 3 18,293.7 7.5 -3.4 ▼ 66 13.8 -34 ▼ 87.9 6.6 -4.1 ▼Deutsche Bank 7 5 15,686.5 6.5 -1.2 ▼ 64 13.3 -23 ▼ 73.5 5.5 -2.1 ▼Morgan Stanley 8 8 15,476.6 6.4 +0.2 ▲ 51 10.6 +2 ▲ 133.8 10.1 +0.9 ▲RBC Capital Markets 9 9 13,651.5 5.6 +0.1 ▲ 50 10.4 -6 ▼ 42.1 3.2 +0.4 ▲Goldman Sachs & Co 10 10 9,222.5 3.8 -0.4 ▼ 37 7.7 -7 ▼ 78.8 5.9 +0.5 ▲Top Ten Total 192,164.1 79.1 -2.0 ▼ 1,026.9 77.2 +0.1
100.0▲
Industry Total 242,759.6 100.0 -94 1,330.1480
‐11.5% ▼Industry % Change from Same Period Last Year ‐17.3% ▼ ‐16.4% ▼ ‐19.1%
Jan 1 - Dec 31US Securitizations ex CMBS, Agency CMO, CDO & Self Funded (F20a)†
Rankings reflect new securitizations criteria implemented September 2014 (See back page)
▼Industry % Change from Last Quarter ‐13.8% ▼ ‐9.9% ▼
0
100
200
300
400
500
600
700
800
900
$0
$100
$200
$300
$400
$500
$600
1 2 3 4 1 2 3 4 1 2 3 4 1 2 3 4 1 2 3 4 1 2 3 4 1 2 3 4 1 2 3 4 1 2 3 4 1 2 3 4
2006 2007 2008 2009 2010 2011 2012 2013 2014 2015
# of
Issu
es
Pro
ceed
s (U
S$b
)
Proceeds (US$b)# of Issues
†
Visit http://dmi.thomsonreuters.com to view archives and order custom League Tables https://www.thomsonone.com
Rankings reflect new securitizations criteria implemented September 2014 (See back page)2006 2007 2008 2009 2010 2011 2012 2013 2014 2015
7

Full Year 2015 | Debt Capital Markets | Managing Underwriters
Banking Composite: US DCM
Jan 1 - Dec 31DCM Bookrunner Industry Composition (F1) Jan 1 - Dec 31 DCM Bookrunner Industry Composition (Ex Financials) (F1)
15.9%
15.1%
15.2%
11.9%17 4%
10.2%
5.9%
11.1%
10.5%
5.5%
9.4%
8.8%
12.2% 8.6%
8.6%
6.7%
11.3%8.3%
8.5%
6.6%
2.8%
4.5%
3.1%3.1%
2.5%
3.1%
2.0%
3.2%
4.6%
4.5%
4.4%
5.7%
4.4% 9.0%
3.9%
2.6%6.0% 11.4%
2.4%
13.0%
2.6%
2.7%
2.9%
1.0%
3.9%
1.3% 2.4%
1.5%
0.8%
2.0%6.4%
4.0%2.2%
3.6%
9.7%
4.4%3.7%
1.7%
0.4%
2.5%
7.0%
2.7%
7.2% 5.8% 6.2%3.9%
4.3% 3.0%
5.1%
5.2%
7.1% 6.4% 8.1% 8.0% 7.7%9.8% 8.8% 8.8%
1.0%
8.6%
60%
70%
80%
90%
100%
Pro
ceed
s
5.7%
3.1%
3.8%
6 0% 6 9%
1.6%
0.9%
0.5%
2.7%
1 3%
2.4%
2 4%
1.0%
0.3%
4.4%
1.8%
4 3%
3.9%
3.7% 2.8%
1.8%
3.4%
4.4%
4.3%
4.8%
5.3%
4.6%
5.5%
5.8%
5.3%
0.7%
5.0%
38.0%33.1%
41.1%
33.3%
39.7%44.0%
43.0%31.7% 33.2%
42.4%
60%
70%
80%
90%
100%
Pro
ceed
s
3.5%3.7%3.1%2.4%
5.1%
3.2%
3.8%
1.8%
2.1%1.4%
15.5% 15.3% 15.5%12.2%
19.3%18.1%
20.8%
14.1%18.7%
17.5%
10.8%15.3% 17.4%
14.0%
0.1%
16.3% 12.6%
14.2%
30.0%
11.6%
15.2%
15.7% 12.0%
14.8%
15.1%
20.3%20.2%
19.2% 21.5%
17.4%
17.8%
0%
10%
20%
30%
40%
50%
JPM BoA Citi GS WF Barc DB MS HSBC CS
% o
f Ind
ustry
Consumer Products and Services Energy and Power Government and Agencies
Healthcare High Technology Industrials
Materials Media and Entertainment Real Estate
Retail Consumer Staples Telecommunications
2.2%
2.5%
1.8%
1.6%
3.1%
1.8%
2.5%
1.1%
1.4%
0.8%
9.6% 10.2%9.1% 8.2%
11.7%10.1%
13.6%
8.6%12.5%
10.1%
6.7%
10.2%10.3%
9.3%
0.1%
9.1%8.2%
8.6%
20.0%
6.7%
9.4%
10.5%
7.1% 9.9%
9.1%
11.4%13.2%
11.6%
10.6%
12.4%
9.4%
10.2%
7.0%
11.6%
10.7%
5.7% 3.9% 6.7%
7.0%
3.2%
5.8%
5.9%
7.2%
5.8%
5.2%
3.8%7.4%
5.0%
3.8%
1.8%
3.0%
1.8%
2.1%
1.5%
1.7%1.3%
2.0%
2.6%
2.7% 2.6%
6.0%
2.4%1.4%
3.9%
6.9%
7.5%
1.6%
1.8%
1.7%
0.7%
2.4%
0.7%
1.5%
1.2%
4.0% 1.3%
5.9%2.5%
2.4%
1.4%
4.3%
2.2%3.0%
0%
10%
20%
30%
40%
50%
JPM BoA Citi GS WF Barc DB MS HSBC CS
% o
f Ind
ustry
P
Consumer Products and Services Energy and Power Government and Agencies
Healthcare High Technology Industrials
Materials Media and Entertainment Real Estate
Retail Consumer Staples Telecommunications
Financials
Visit http://dmi.thomsonreuters.com to view archives and order custom League Tables https://www.thomsonone.com8
4.23.9x68,00017,500
33,000
13.52.7x
10,500 41,400
3.6x
10,750
30,000
32,300
4.12.9x46,50016,000Visa
3.9x 11.7
Microsoft Corp
United Health Group
4/23/2015
16,700Abbvie
14,600
3/3/2015
AT&T
12/9/2015
7/9/2015
5/5/2015
Actavis Funding
www ifrmarkets com
13,000
9/30/2015
19.53.1x48,50015,500
7/13/2015
Charter Communications
30.82.1x
10/29/2015
2/9/2015
7/20/2015
Microsoft Corp
41,00015,000CVS Health Corp
IFR MarketsUS Debt Issuance Surges l New Record for High-Grade Debt
Top Deals US Investment Grade Debt Transactions Jan 1 - Dec 31IFR Markets Intelligence
Total Book Size (US$m)
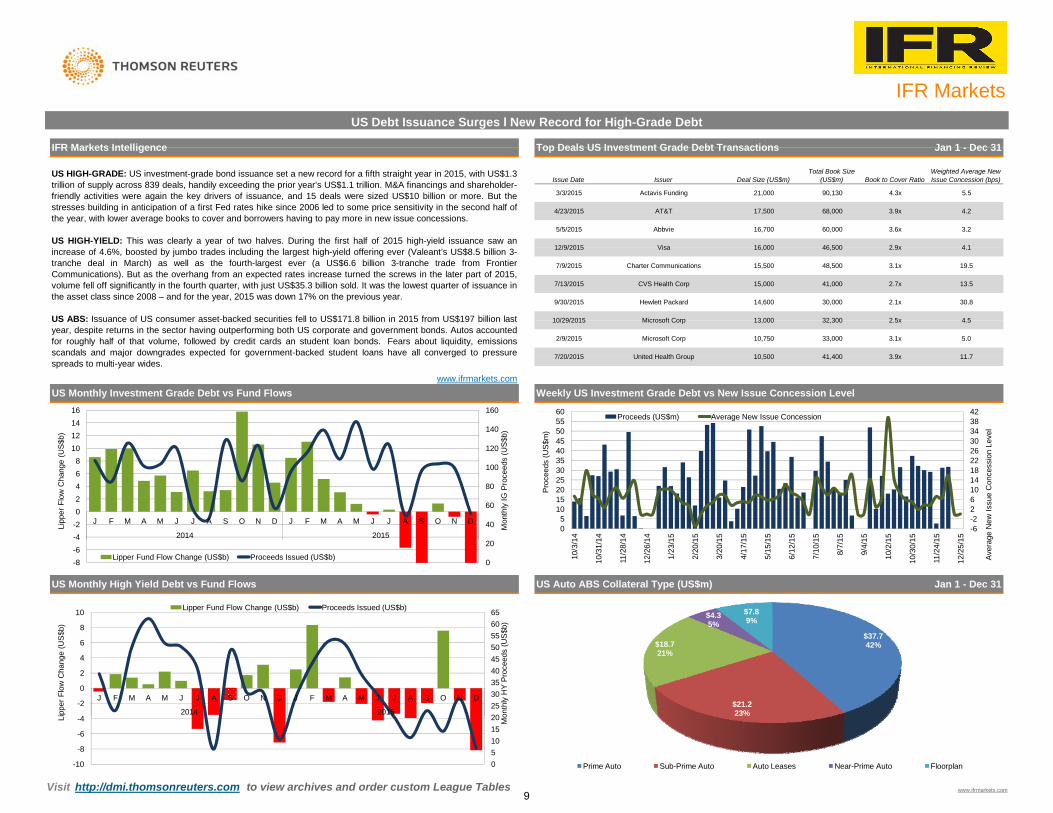
US HIGH-GRADE: US investment-grade bond issuance set a new record for a fifth straight year in 2015, with US$1.3trillion of supply across 839 deals, handily exceeding the prior year's US$1.1 trillion. M&A financings and shareholder-friendly activities were again the key drivers of issuance, and 15 deals were sized US$10 billion or more. But thestresses building in anticipation of a first Fed rates hike since 2006 led to some price sensitivity in the second half ofthe year, with lower average books to cover and borrowers having to pay more in new issue concessions.
US HIGH-YIELD: This was clearly a year of two halves. During the first half of 2015 high-yield issuance saw anincrease of 4.6%, boosted by jumbo trades including the largest high-yield offering ever (Valeant’s US$8.5 billion 3-tranche deal in March) as well as the fourth-largest ever (a US$6.6 billion 3-tranche trade from FrontierCommunications). But as the overhang from an expected rates increase turned the screws in the later part of 2015,volume fell off significantly in the fourth quarter, with just US$35.3 billion sold. It was the lowest quarter of issuance inthe asset class since 2008 – and for the year, 2015 was down 17% on the previous year.
US ABS: Issuance of US consumer asset-backed securities fell to US$171.8 billion in 2015 from US$197 billion lastyear, despite returns in the sector having outperforming both US corporate and government bonds. Autos accountedfor roughly half of that volume, followed by credit cards an student loan bonds. Fears about liquidity, emissionsscandals and major downgrades expected for government-backed student loans have all converged to pressurespreads to multi-year wides.
5.03.1x
4.5
Issuer
Hewlett Packard
Issue Date Deal Size (US$m)Weighted Average New Issue Concession (bps)Book to Cover Ratio
2.5x
3.260,000
21,000 90,130 4.3x 5.5
US Monthly High Yield Debt vs Fund Flows
www.ifrmarkets.comWeekly US Investment Grade Debt vs New Issue Concession Level
US Auto ABS Collateral Type (US$m) Jan 1 - Dec 31
US Monthly Investment Grade Debt vs Fund Flows
$37.742%
$21.223%
$18.721%
$4.35%
$7.89%
5101520253035404550556065
-8
-6
-4
-2
0
2
4
6
8
10
J F M A M J J A S O N D J F M A M J J A S O N D
2014 2015
Lipp
er F
low
Cha
nge
(US
$b)
Mon
thly
HY
Pro
ceed
s (U
S$b
)
Lipper Fund Flow Change (US$b) Proceeds Issued (US$b)
0
20
40
60
80
100
120
140
160
-8-6-4-202468
10121416
J F M A M J J A S O N D J F M A M J J A S O N D
2014 2015
Lipp
er F
low
Cha
nge
(US
$b)
Mon
thly
IG P
roce
eds
(US
$b)
Lipper Fund Flow Change (US$b) Proceeds Issued (US$b)
-6-226101418222630343842
05
1015202530354045505560
10/3
/14
10/3
1/14
11/2
8/14
12/2
6/14
1/23
/15
2/20
/15
3/20
/15
4/17
/15
5/15
/15
6/12
/15
7/10
/15
8/7/
15
9/4/
15
10/2
/15
10/3
0/15
11/2
4/15
12/2
5/15
Pro
ceed
s (U
S$m
)
Aver
age
New
Issu
e C
once
ssio
n Le
vel
Proceeds (US$m) Average New Issue Concession
www.ifrmarkets.comVisit http://dmi.thomsonreuters.com to view archives and order custom League Tables
Prime Auto Sub-Prime Auto Auto Leases Near-Prime Auto Floorplan0-10
9

International bond volumes were down 10% from the previous year’s total. Barclays had the biggest increase in year-on-year market share in 2015 (up 0.8 points), anchored primarily by investment grade corporate and SSAunderwriting activity. Credit Suisse recorded the largest decrease (down 0.5 points), having worked on 116 fewertransactions than the previous year. Only BAML from the top ten banks worked on more deals in 2015 than theprevious year.
M&A financing was a major catalyst for the bond markets in 2015. This included Actavis Funding’s raising of US$20.9billion towards its acquisition of Allergan, AT&T’S US$17.5 billion deal for its purchase of DirecTV and Merck’sUS$7.9 billion six tranche offering towards its purchase of Cubist. The Actavis and AT&T deals were the second andthird largest corporate bond deals of all time.
US Dollar denominated corporate issuance remained robust throughout 2015 on the back of strong investor appetite,with volumes up 10.6%. Euro Corporate issuance was less active by comparison, with a 1.1% rise on 2014 volumes.International SSA issuance was notably down year on year, by 19.1%, with particular weakness in the Sovereign andSupranational sectors, which fell by 27.7% and 24.2%, respectively.
All International Bonds by Issue Type
Goldman Sachs & Co 7 7
All International Securitizations (J10c)
53
Barclays 2 4
Deutsche Bank 5
Morgan Stanley
Industry % Change from Same Period Last Year
JP Morgan 1 1
Citi 3Bank of America Merrill Lynch
2
279,319.5264,494.1
Top Ten Total
311,602.5
4
284,138.97.5
Market Market
+0.47.78.4
+0.8
Sh (%) Share Ch.
▲
6.4 -1.1
3.7 ▼
100.0
-0.4137,949.3Credit Suisse
Proceeds per Bookrunner (US$m)2015 Rank
2014 RankBookrunner Proceeds
Change in ManagerImputed Fees (US$m)# of Deals per Bookrunner
Sh (%) # of DealsDeals
Full Year 2015 | Debt Capital Markets | Managing Underwriters
International DebtInternational Bond Volumes Down 10% l M&A Finance Key Market Driver l SSA Sector In Decline
All International Bonds (J1) Jan 1 - Dec 31EMEA Deals Intelligence
# of MarketFees
890▲ 1074 19.9
16.5 936.6-57 ▼▼
6.0 +0.79.5-144 1,495.7
Market MarketSh (%) Share Ch.
▲▲
+1.4
+34 ▲1,218.6
+0.8 ▲-98 ▼
1,257.5+0.7 ▲
▼16.5
7.7+0.6 ▲ 943 17.5+1.0 ▲ 892
0
7.1 8.0
HSBC Holdings PLC 6 6 214,724.4238,915.6
16.35.6 +0.2 ▲ 653
880-5.8 613.2
6.1
▼▼
+0.3▲+0.3
6.2
9513.9
▲-2312.1 971.8-156
17.6 -216 6.4▼▼
-0.2-0.5
▼
1,005.1
4.9
-0.6-0.2
▼
5.1 955.2677 12.5 -53+0.1 ▲-10311.8
▼ 764.1▼▼ 467.5
9,685.3
3.0-0.5
3.9
▲
▼ 638553
+2.7▼10.3 -116▲61.7
190,118.8144,090.2
88208,785.4
BNP Paribas SA 9
‐10.0%
9
3,715,813.92,274,138.7
Industry Total
10 10
▼
+1.161.2
▼ -11.6%
5,395 -1,165
▼
Jan 1 - Dec 31
▼
15,741.9 100.0
‐9.7%Industry % Change from Last Quarter -12.2% ▼-17.8%
▼ -12.7%
Top Ten Total
▲Industry % Change from Last Quarter -8.2% ▼ -4.3%
1,817
▼ 1.2%
Industry Total 1,073,648.2 100.0
Industry % Change from Same Period Last Year -5.6% ▼ -11.1% ▼ -5.5% ▼
-0.654.1 -0.31,724.9
100.03,182.6-227▼▼-43 ▼ -0.4
599,246.011.1
▼▼ 201
55.9 -0.8
10.2 -74.6146.7
▼Citi 10 9 42,938.0 4.0
4.1 -0.1-
▼ 154.1 4.8 -0.2▼ 1865.7
Goldman Sachs & Co 9 10 43,641.4
UniCredit 7JP Morgan 8 7 52,069.7 14.8 +8 ▲ 0
▼15.5 -24180.2
▼ 281-
57,844.16 54,644.6
4.9 05.1 -0.2
Industry Total
Industry % Change from Same Period Last Year -0.1% ▼
258,893.9
2015 Rank
0.0%
▲5.4 +0.6 ▲ 290
456
▼Industry % Change from Last Quarter -2.0% ▼ -20.2%
▲4.2% ▲-0.8%
▼
▲+5.90 100.0
625.5869.7
71.869.43.2
+0.8 ▲1.6 ▲
▼26 5.7 +6 ▲
33.315
5.9 -4
Top Ten Total 179,278.28,211.3 +1.5 ▲
-0.5+0.8
Goldman Sachs & Co 9 10 8,483.3RBC Capital Markets 10 14.2
▼9 13,374.5 ▲+15 ▲ 51.6+0.3 10.548▲
▲-5.9 0
5.9
+3.4▲ 63 13.8 +7
-1.23.8▼27
6 16,515.6 6.4 0 63-
20,757.688.8 10.2
-1.6 15.4 -15 ▼▼7.7 ▲
5
▼Wells Fargo & Co 6 7 19,903.9
70Deutsche Bank 5 2
8.7▼ 70.8▼
101.9
JP Morgan 4 1 20,904.0
▲▲
+3.67.5
22,488.0 +1.1 ▲ 81.5 9.4
▲
78
Imputed Fees (€m)
687.7
14.9
▲▲17.1 +15
11.7
-1.4-28
+0.6-1.8
51.5+0.1
13.8 +6 ▲
MarketManager Market
65.3
Jan 1 - Dec 31
18.0
▼
▲
Market
8.1-4.38.0
FeesShare Ch.9.4 +1.4
Sh (%)
66.6
▲100
MarketShare Ch.
# of Deals per Bookrunner
+1.8Deals
21.9 +23 ▲+20
Market# of Market Change in ManagerImputed Fees (US$m)
2014 RankBookrunner
3
3Credit Suisse
24,322.3
Morgan Stanley 87
5.2
8.1
24,317.72 4
Proceeds
BNP Paribas SABookrunner
MarketProceeds per Bookrunner (€m)
+1.4Barclays
Market
100.0
3.3
2014 Rank
1Sh (%)
1
# of
7.1 387▼Deals
▼
Change in
6.576,201.5Share Ch.Proceeds # of Deals
-32Sh (%)
21.3Share Ch.
-0.67.1 +0.8 19.2▲
▼Fees Sh (%)207.9
Barclays 3 4 72,417.4HSBC Holdings PLC 2 3 75,930.4
-1.36.7 +0.6 ▲ ▲+116.6
6.0192.1 ▲+0.6▲+1.0
349 +13
-38311 17.1 -48302
Credit Agricole CIB 6 8
4 2Societe Generale 5 5 ▼ 281 15.5Deutsche Bank
5.4▼
-0.358,117.065,441.9 6.1
All Bonds in Euros (N1)
-0.3
16.0 135.8 4.3 ▲+0.24.0127.8 +0.2
269▲
+20
▲ 207.8 6.5
-0.7 ▼7.5▼ 238.6 -0.4
▼ 133.9▼
4.2
Sh (%)
# of Deals per Bookrunner
Sh (%)# of Deals2015 Rank
9.4 +1.582
Full YearEuropean Financial and Corporate Inv Grade By Domicile Nation
Proceeds per Bookrunner (US$m)
Citi 1
Market Market
Bank of America Merrill Lynch
€ -
€ 200
€ 400
€ 600
€ 800
€ 1,000
€ 1,200
Q1 Q2 Q3 Q4 Q1 Q2 Q3 Q4 Q1 Q2 Q3 Q4 Q1 Q2 Q3 Q4 Q1 Q2 Q3 Q4 Q1 Q2 Q3 Q4 Q1 Q2 Q3 Q4 Q1 Q2 Q3 Q4
2008 2009 2010 2011 2012 2013 2014 2015
Pro
ceed
s (€
b)
Investment Grade Corporate Agency, Supranational, Sovereign High Yield CorporateFederal Credit Agency Emerging Market Corporate ABS & MBS
€0
€20
€40
€60
€80
€100
€120
€140
€160
Pro
ceed
s (€
b)
2014 2015
https://www.thomsonone.comVisit http://dmi.thomsonreuters.com to view archives and order custom League Tables10

▲
Top Green Bond Issuance by Nation Full Year All International Green Bonds (JG1) Jan 1 - Dec 31
Industry % Change from Last Quarter 102.9% ▲ 36.4% ▲ 113.2%▲
+22
Industry % Change from Same Period Last Year 33.1% ▲ 43.1% ▲ 67.8%
86.1 100.0+5.9 ▲
Industry Total 27,034.2 100.0 73▲ 51.8 60.1
6.9 +4.9 ▲Top Ten Total 18,969.2 70.2 +0.5
▲ 11 15.1 +6 ▲ 5.9Citi 10 8 1,144.3 4.2 +0.7+4 ▲ 4.6 5.3 -0.2 ▼
▼Deutsche Bank 9 5 1,198.8 4.4 -2.3 ▼ 11 15.1
17.8 +6 ▲ 3.1 3.6 -3.1+2.3 ▲
JP Morgan 8 6 1,239.4 4.6 -1.7 ▼ 139 12.3 +5 ▲ 4.1 4.7
5.3 +3.1 ▲BNP Paribas SA 7 10 1,266.1 4.7 +1.9 ▲
▲ 9 12.3 +4 ▲ 4.6Barclays 6 9 1,346.8 5.0 +2.1-2 ▼ 3.7 4.3 -4.3 ▼
▲SEB 5 1 1,669.7 6.2 -8.1 ▼ 12 16.4
17.8 +7 ▲ 6.6 7.7 +4.6-2.3 ▼
Morgan Stanley 4 7 2,120.7 7.8 +2.7 ▲ 1316 21.9 +7 ▲ 3.6 4.2
7.4 -1.0 ▼HSBC Holdings PLC 3 4 2,619.4 9.7 +1.4 ▲
▲ 21 28.8 +13 ▲ 6.4Credit Agricole CIB 2 3 2,691.0 10.0 +0.3+4 ▲ 9.2 10.7 +1.9 ▲
Share Ch.Bank of America Merrill Lynch 1 2 3,673.0 13.6 +3.5 ▲ 18 24.7
MarketBookrunner Proceeds Sh (%) Share Ch. Deals Sh (%) # of Deals Fees Sh (%)
Market # of Market Change in Manager MarketAccording to figures compiled by Thomson Reuters and The Climate Bonds Initiative, Bank of America Merrill Lynchled the 2015 Global Green Bonds rankings, with a market share of 13.6% from 18 transactions. The Green Bondsmarket continued to expand throughout the year – by geography, issuer type (corporate and bank issuers), andproject/asset category (low carbon transport and water) – bolstered by increasing credit enhancements bydevelopment banks and strong political commitment in local markets worldwide. For example, China and India bothdeveloped Green Bond regulation and considered policy support initiatives in 2015, each with Green Bond totalsexceeding US$1 billion during the year.
Investor demand for Green Bonds continued to grow in 2015, particularly by institutional investors and corporatetreasuries. The year also saw increased disclosure of green project selection, proceeds management andenvironmental impact.
Notably, the U.S. market has been slow to adopt the independent review model already prevalent in other markets.However, 2015 saw an incremental shift toward a European-style review model, with Morgan Stanley providing areview for its own inaugural green bond (US$500 million), followed by Renovate America (US$201.5 million).
Proceeds per Bookrunner (US$m) # of Deals per Bookrunner Imputed Fees (US$m)2015 Rank
2014 Rank
Market
Full Year 2015 | Debt Capital Markets | Managing Underwriters
Green BondsBAML Lead Global Green Bonds Underwriting l Green Bonds Market Diversifying l Increasing Green EM Activity
Green Bonds Deals Intelligence All Global Green Bonds (GR01) Jan 1 - Dec 31
Global Green Bond Industry Composition Full Year Global Green Bonds Volume Jan 1 - Dec 31
▲Industry % Change from Last Quarter 95.9% ▲ 133.3% ▲ 109.5% ▲Industry % Change from Same Period Last Year 28.1% ▲ 37.2% ▲ 61.6%
+30 79.059 100.0▲
Industry Total 24,306.5 100.051.8 60.1 +5.9
+4.3 ▲Top Ten Total 18,969.2 70.2 +0.5 ▲
10 16.9 +5 ▲ 5.1 6.45.8 0 -
Citi 10 8 885.2 3.6 -0.1 ▲▲ 8 13.6 +3 ▲ 4.6Barclays 9 9 1,147.1 4.7 +1.6
+4 ▲ 3.1 3.9 -3.1 ▼▲
Deutsche Bank 8 5 1,198.8 4.9 -2.2 ▼ 11 18.622.0 +6 ▲ 4.0 5.1 +2.6
+3.0 ▲JP Morgan 7 6 1,239.4 5.1 -1.6 ▼ 13
9 15.3 +5 ▲ 4.2 5.33.1 -2.6 ▼
BNP Paribas SA 6 10 1,266.1 5.2 +2.2 ▲▼ 9 15.3 +1 ▲ 2.5SEB 5 1 1,268.8 5.2 -6.2
+6 ▲ 6.2 7.9 +4.6 ▲▼
Morgan Stanley 4 7 1,921.0 7.9 +2.4 ▲ 12 20.333.9 +12 ▲ 3.6 4.5 -2.2
-1.3 ▼Credit Agricole CIB 3 2 2,431.9 10.0 -0.4 ▼ 20
15 25.4 +7 ▲ 5.9 7.510.6 +1.5 ▲
HSBC Holdings PLC 2 4 2,589.3 10.7 +2.4 ▲▲ 16 27.1 +3 ▲ 8.4Bank of America Merrill Lynch 1 3 3,214.2 13.2 +2.9
Deals Sh (%) # of Deals Fees Sh (%) Share Ch.# of Market Change in Manager Market Market2015
Rank2014 Rank
Market MarketBookrunner Proceeds Sh (%) Share Ch.
Proceeds per Bookrunner (US$m) # of Deals per Bookrunner Imputed Fees (US$m)
-2
0
2
4
6
8
10
12
$0
$1,000
$2,000
$3,000
$4,000
$5,000
$6,000
2014 2015
US$m
$12.245%
$7.528%
$4.717%
$1.14%
$0.94%
US$bln
Government and AgenciesFinancialsEnergy and PowerIndustrialsReal EstateConsumer Staples
5,184
4,624
4,274
2,419
1,910
1,412
1,393
1,018
976
777
$0 $1,000 $2,000 $3,000 $4,000 $5,000 $6,000
United States of America
Netherlands
Germany
Luxembourg
France
India
China
Sweden
Finland
Japan
US$m
Visit https://www.climatebonds.net/for further detail https://www.thomsonone.com11

▼▼ -25.4% ▼
Industry % Change from Same Period Last Year -21.8%Industry % Change from Last Quarter -10.2% ▼ -2.4%
-203
▼ -26.9% ▼ -24.3%
100.0▲
Industry Total 347,204.8 100.067.73.7
+0.2552 4,347.0
▲Top Ten Total 235,682.5 68.1 +0.8 ▲ 2,939.4
118159.53.7
3.9-35 ▼ 167.39 13,517.8RBC Capital Markets 10 10 12,870.1
9Wells Fargo & Co ▼+0.5 ▲
▼ -0.2101 18.3 -12 ▼ +0.7
27.4 289.8 6.7 -0.6 ▼3.9 -0.1
-59 ▼21.4
5.9 -1.2 ▼ 151Credit Suisse 8 5 20,336.024.3 -42 ▼ 233.3 5.4 -1.3
+0.5 ▲▼Morgan Stanley 7 7 20,679.9 6.0 -0.8 ▼ 134
-0.1166 30.1 -12 ▼159
288.3 6.66.3
6.8 +0.7 ▲▼
Barclays 6 8 23,731.2Citi 5 4 24,509.0
▲7.1 -0.1
-21 ▼28.8 -45 ▼ 273.0 ▼38.0 359.4 8.3 +1.18.2 +1.2 ▲ 210
192Bank of America Merrill Lynch 4 6 28,320.6
▼Goldman Sachs & Co 3 3 28,490.6 8.2 +0.6 ▲ ▼ 336.7-48
34.8 -233.9 +0.28.5
7.7 -0.3
+0.2 ▲▲Deutsche Bank 2 2 28,696.8 8.3 -0.1 ▼
JP Morgan 1 1 34,530.5 10.0 +0.1 ▼▲ 227 41.1 10.6370.6461.5-68
187▼
Market MarketSh (%) Share Ch. Deals Sh (%) # of Deals Fees Sh (%) Share Ch.Market Market # of Market Change in Manager
Proceeds per Bookrunner (US$m) # of Deals per Bookrunner Imputed Fees (US$m)2015 Rank
2014 RankBookrunner Proceeds
Full Year 2015 | Debt Capital Markets | Managing Underwriters
High Yield DebtGlobal High Yield Volumes Down 22% l Key Deals M&A Driven l JP Morgan Leads Global Fee Pool
Global High Yield Debt (B4) Jan 1 - Dec 31Global High Yield Deals Intelligence
Global High Yield Debt - US Dollar Denominated (B5) Jan 1 - Dec 31
Global High Yield issuance cooled in 2015 and was the lowest yearly volume recorded since 2011, down by 21.8%from 2014 figures. The final quarter was the lowest quarterly total since the fourth quarter of 2011. None of the topten banks priced more deals in 2015 than in 2014.
Some of the key 2015 deals were driven by M&A market activity. United States pharmaceutical company Valeant’sUS$10.1 billion equivalent four-tranche deal for its acquisition of Salix was the second largest High Yield deal onrecord. Altice priced a US$5.3 billion equivalent transaction for its planned purchase of Portugal Telecom. Italiancommercial lottery operator and gaming company GTECH priced a five tranche US$4.9 billion transaction backing itsacquisition of US gaming firm IGT.
According to data from Thomson Reuters and Freeman Consulting, JP Morgan led global fee market share, withUS$461.5 million accrued from 227 deals. JP Morgan was also the top US dollar fee earner with US$379.7 millionfrom 177 deals. In the non dollar space, Deutsche Bank led the fee pool, with €97 million from 60 transactions.
Average Quarterly Spread to Benchmark*
▼ -10.2% ▼Industry % Change from Last Quarter -12.5% ▼ -13.3%Industry % Change from Same Period Last Year -16.4% ▼ -17.9% ▼ -13.9% ▼
-38+2.9 ▲
Industry Total 73,832.8 100.0 865.7174 100.064.1▲ 554.3Top Ten Total 43,703.5 59.3 +3.5
MarketSh (%)
▲
Fees Sh (%) Share Ch.Market Manager# of Market Change in
▲Industry % Change from Last Quarter -9.2% ▼
Sh (%) # of DealsDeutsche Bank
Industry % Change from Same Period Last Year -18.1%
Top Ten Total 195,856.2
▼ -29.6% ▼ -22.5% ▼-29.5% ▼3.6%
395 -166 3,391.6 100.0-0.5 ▼
Industry Total 265,742.3 100.0
▲73.9 -1.4 ▼ 2,426.3 71.7
-13 ▼ +0.7115
151.4 4.54.8163.6
96 24.34.6 +0.4 ▲▼
RBC Capital Markets 10 10 12,093.8Wells Fargo & Co 9 9 13,216.7
▼5.0 -0.4
-52 ▼29.1 -34 ▼ ▼29.4 218.7 6.5 -0.8
-0.56.0 -1.7 ▼ 116Credit Suisse 8 7 15,890.8
28.6 -41 ▼ 194.3 5.7 -2.1+0.5 ▲
▼Morgan Stanley 7 5 17,006.3 6.4 -1.6 ▼ 113
+0.1130 32.9 -13 ▼138
227.9 6.77.1
7.0 +0.7 ▲▼
Barclays 6 8 18,598.6Citi 5 4 21,260.5
▲8.0 -0.2
-35 ▼34.9 -39 ▼
21,721.1239.2 ▲
35.2 263.5 7.8 +0.1+0.2
8.2 -0.1 ▼ 139-1 ▼ 259.6 7.7147
+0.8 ▲▲Goldman Sachs & Co 3 6 22,454.1 8.5 +0.8 ▲
328.4 9.7190 48.1 -21 ▼▼10.6 -0.3 44.8177
37.29.6 +1.0 ▲
+0.5# of Deals Fees Sh (%) Share Ch.
379.7 11.2-63 ▼ ▲
Change in ManagerMarket Market # of Market
Global High Yield Debt - Non-US Dollar Denominated (B6) Jan 1 - Dec 31
Proceeds per Bookrunner (US$m)
Bookrunner Proceeds Sh (%) Share Ch.
Bookrunner Proceeds
28,199.2Bank of America Merrill Lynch 2 2 25,415.1
Deutsche Bank 4 3
2015 Rank
2015 Rank
Proceeds per Bookrunner (€m)
2014 Rank
JP Morgan 1 1
MarketMarket
# of Deals per Bookrunner Imputed Fees (US$m)
# of Deals per Bookrunner Imputed Fees (€m)
Deals Sh (%)Market Market
1 1 6,321.4Share Ch. Deals
8.6
2014 Rank
56-12-6
-0.3 ▼ 60 34.5JP Morgan 2 3 5,741.0 ▼ 74.27.8 +0.5 32.2▲
+1.0 ▲8.6 -0.7 ▼
▼ 97.0 11.2
Goldman Sachs & Co 3 2 5,481.9 7.4 0 ▼53 30.5 -2 ▼ 69.9 8.1- -1.36.4 +2.329.9 +6 ▲ 55.7
+0.7 ▲ +0.7 ▲HSBC Holdings PLC 4 7 4,709.1 ▲ 52
Credit Suisse 6 6 3,983.2
▲Barclays 5 5 4,646.9 6.3 6.3
-24.1 -14 ▼ 45.3 5.2 -0.7
45 54.725.9 +2 ▲25.3 -4
BNP Paribas SA7.4 0▼ 63.6
7 4 3,907.7- 44
Morgan Stanley 8 12 3,319.2 4.5 35.1▼
+1.1 ▲ 29 16.7▼
4.1 +1.2▼ 42
-1.3▲+2 ▲
Citi 9 9 2,942.5 4.0 -0.33.3
▼Bank of America Merrill Lynch 10 16 2,650.6 16.1 +5 ▲
17.2
+1.6
+1.7-5
▲ 283.530 ▼ 30.6
28.2
Monthly High Yield Volume
3.6 +1.1
5.3 -0.95.4 0
6.4
0
100
200
300
400
500
600
700
800
900
Q1 Q2 Q3 Q4 Q1 Q2 Q3 Q4 Q1 Q2 Q3 Q4 Q1 Q2 Q3 Q4 Q1 Q2 Q3 Q4 Q1 Q2 Q3 Q4 Q1 Q2 Q3 Q4
2009 2010 2011 2012 2013 2014 2015
Bas
is P
oint
s
Spread to Benchmark 2-Quarter Moving Average (Spread to Benchmark)
*Spreads based on fixed rate issues where spread information is available
0
20
40
60
80
100
120
$0
$10
$20
$30
$40
$50
$60
$70
JFMAMJJASONDJFMAMJJASONDJFMAMJJASONDJFMAMJJASONDJFMAMJJASONDJFMAMJJASONDJFMAMJJASOND
2009 2010 2011 2012 2013 2014 2015
# of
Issu
es
Pro
ceed
s (U
S$b
)
Proceeds (US$)# of Issues
Visit http://dmi.thomsonreuters.com to view archives and order custom League Tables https://www.thomsonone.com12

8561.5106.0Top Ten Total
100.059,816.0 172.9
% Change from Same Period Last Year
‐96
▼
Industry Total43,284.0
2.5+0.3
100.0▲
+0.1 ▲ +0.9+1.0
▲▲▲
+1.9
▼ 8.5
4.3▼
8.2 0 -
16.5▼ 14▲
4.37.4
12.3 7.1
4.9▲
+3.7 ▲3.1 -0.8 ▼
▼▼ 5.3
▲9.1
13.7+1.1 ▲
8.015.7
+1.8
-0.8 ▼20
-20 14.6
-12-12
17.3-16 ▼▼6,580.1 11.0▲9.4 +0.6
# of
11.8JP Morgan 2 1Barclays 3 3 5,616.4
-1.7
Sh (%)Fees Share Ch.Manager
Citi 1 2 7,026.3 29.4
MarketBookrunner Proceeds Sh (%) Share Ch. Deals Sh (%)
▼▲
# of Deals per Bookrunner
34.1%
710
+56.9
Imputed Fees (US$m)2015 Rank
2014 Rank
Market MarketChange in Market Market
-40.1%
Jan 1 - Dec 31
▼
339,084.5 100.0
10.9%-41.0%
11
▼
-0.9 ▲+2.472.3
▲4.0 ▼
+1.6-0.9
3.65.96.1
+0.9 136.9
15.3 -4Goldman Sachs & Co
6
2.89
1,690.3
143,543.6
24.7
▲
2,169.49 11.8 -2
-1156.5
3,652.4
8.5
Societe Generale 8 7
# of Deals25
22.423.5
▼▼
+0.6
19▲ 21
▼▼10.0 -1.8
-4.7▼
▲12 14.1 -6
% Change from Same Period Last Year -36.3% ▼
16.5 -5
-0.2+0.2
Morgan Stanley 10
1,221.2
40.6 ▼33.7
▼
UniCredit▼
Deutsche Bank
BNP Paribas SA
HSBC Holdings PLC
0▲▲
▼
+0.5-
-0.2
▼
4.7
2.8
‐923
Sh (%)
-298.9▼
4.656.9
▼3.3
45.7
100.0694.3 56.9
3.7
▼
Top Ten Total 210,903.0Industry Total
-1.2604
▼-423.0 -1.3
4.1 +0.2
54
Imputed Fees (US$m)Change in
DealsMarketMarketManager
Fees# of Deals
# of Deals per Bookrunner
Share Ch.
Goldman Sachs & Co 1010.9Barclays 9 7 12,797.3
10,140.3
BNP Paribas SA 8 9 14,034.4
62.3
663.8 -0.3 ▼6
▲4.6 +0.6
89
4.9 +1.3-56▲
▼114 18.9 ▼
14.7 -43▲Standard Chartered PLC 7 8 15,604.6Morgan Stanley 6 10 16,712.7 55.7
▼ 71.4Bank of America Merrill Lynch 5 5 21,923.8-4274 12.3
78.7 6.46.5 +0.7 ▲ 93 15.4 -55
1245.8
▼▼
20.5 -78 ▼8.0 -0.2
-1.5-77 97.6
-0.8JP Morgan 3 3 27,022.6Deutsche Bank 4 4 23,031.4
2 1 33,173.8121▼8.0 -0.6
9.8 ▼33.1 -13025.5
▼ 109.5 9.0 +0.2 ▲8.6
Full Year 2015 | Debt Capital Markets | Managing Underwriters
Emerging MarketsAll International Emerging Market Debt Down 36% l EMEA Emerging Market Debt Down 40% l Latin America Emerging Market Debt Down 51%
Jan 1 - Dec 31EMEA Emerging Market Bonds (L2)All International Emerging Market Bonds (L1) Jan 1 - Dec 31
Proceeds per Bookrunner (US$m)
▲-7.6% ▼
+0.3
76
% Change from Last Quarter
▼▼20.0
Asia-Pacific Emerging Market Bonds (L4)
▲ 200
Market
104.5
4 4 5,227.9
154 -102
Proceeds per Bookrunner (US$m)2015 Rank
2014 Rank
MarketShare Ch.Bookrunner Proceeds Sh (%)
Market
8.75 3,914.7
+2.4-0.4
8 3,862.96.5
+0.4
-2.2
# of
HSBC Holdings PLC 1 2 36,462.1 10.8Sh (%)
▲
-1.3
Latin America Emerging Market Bonds (L3)
▼
% Change from Last Quarter
Citi
6.8
Jan 1 - Dec 31
-53.0% ▼ -34.4% ▼53.3% ▲ 117.2% ▲
-39.9%33.4%
*ti
16 22.9 -16 +2.5▲1.6
12,055.70
-0.2-37-49
-
29.5▼
Sh (%)
▲ -1219 8.2
MarketMarketShare Ch.
Morgan Stanley 6,541.3 ▼27.1 -31 ▼
14 20.010.69.55 10
7,272.0
11.5
Sh (%)
8.3 +0.9▲
6.211,843.74 5 +0.1 ▲6.3
18.9 -25 ▼ 46.5 6.1 ▼76 -0.5▼
7.5
+5.8 +0.216.0-0.2 ▼ -0.8
12.3
8.0
▼
▼-42 ▼ 9.528.8 45.786Standard Chartered PLC 3 4
▼6.0▼
JP Morgan-1.0 ▼-0.757.22
21.4+2.1 ▲ 18 25.7
27 38.6-4.0 ▼-26
▼-0.5
37.6+2.88.716,577.0 22.691
HSBC Holdings PLC
Citi 3 1 7,672.9 11.1HSBC Holdings PLC 2 3 7,922.6 -1.5 ▼ Citi 2
▼-17 28.6 8.017.5▼
Share Ch.14.7 38.6
Deals Sh (%)+6.0 ▲ 27 -84 ▲
Fees Sh (%) Share Ch.+0.4▼
# of Deals10.580.9▲ 22,061.8 11.6 -0.3
DealsSh (%) Share Ch.▼ 151
MarketMarketChange in ManagerBookrunner Sh (%)
Change in Proceeds per Bookrunner (US$m) # of Deals per Bookrunner
ProceedsBookrunner # of Deals FeesMarket Market # of Market
Bank of America Merrill Lynch 1 4 10,117.2
ManagerImputed Fees (US$m)
2015 Rank
2014 Rank
2JP Morgan 4
▲17.5 4.7Deutsche Bank 6 5 5,692.9
9.4+0.9 ▲
0.9 -1.3 ▼20.4-15 ▼
▼15.718.6 -19 ▼138 9 3,436.9 5.0
117 6 4,496.5 ▲
+2.1 ▲BBVA 9 14 3,346.5 4.9+1.0
6.5 +1.3▲Santander
Credit Suisse
9 12.9 -7 ▼ 7.4 3.1
72.3BNP Paribas SA 10 11 2,119.3Top Ten Total 58,618.1
12.9 -43.1 -0.6 ▼ 9
-63.1%
184.2+2.4 ▲Industry Total 68,889.4
▼% Change from Same Period Last Year -50.5%
100.0 70 ‐9158.32.0 -3.0
7 10Bank of America Merrill Lynch 6Bank of China Ltd
6
▲▼ 9.1 ▼
+0.4
▼100.0
-0.3232.1
Imputed Fees (US$m)
-1.3 ▼
2015 Rank
2014 Rank
1 1Proceeds
MarketProceeds per Bookrunner (US$m) # of Deals per Bookrunner
Deutsche Bank 5 3
Market # of Market
11,727.0 6.1-0.110,449.1
20.9 -33▼ 555.5
-2.3 ▼4.9 -0.1 ▼
84-23
48.3 6.313.7
▼73 18.2 -11 ▼ 27.1 -0.7Morgan Stanley 8 9 7,145.1
3.57,496.5 ▼3.9 -0.24.3
37.5▼
▼ 32.63.7 -0.5 ▼ -32 0 -3.7 +0.1
46 11.4▲ -0.2 ▼59 -32 ▼BNP Paribas SA 9 11 7,021.3 27.6 3.6
3.3 -1.0 ▼ 38 9.5 -11 2.614.7
▼Top Ten Total 112,622.6 59.0Goldman Sachs & Co 10 8 6,245.4 -1.3▼ 19.8
190,921.9-3.4 ▼ -6.4 ▼
402 100.055.3423.2
% Change from Same Period Last Year -24.3% ▼
‐183
-31.3%
Industry Total
▼ -21.3% ▼ 34.8% ▲▼ -26.9% ▼
767.7
Middle East Emerging Market Bonds (L5) Jan 1 - Dec 31
% Change from Last Quarter -23.6% ▼ % Change from Last Quarter
Market
100.0
Imputed Fees (US$m)2015 Rank
2014 RankBookrunner Proceeds
Proceeds per Bookrunner (US$m)Market Market # of Market
# of Deals per Bookrunner
1 2,635.1
MarketSh (%) Share Ch.# of Deals Fees
Change in ManagerShare Ch. Deals Sh (%)
13.8 -0.6 ▼ 17Sh (%)
▼Citi 2 2 1,720.8 9.0 7.0
11.5 -0.6▼ 5.1-0.3 ▼
36.2 -11
Standard Chartered PLC 3 6 1,645.0
1HSBC Holdings PLC
15▼10 21.3 -6 ▼ 3.1 -1.3▲8.9 +5.3▼
+5.5National Bank of Abu Dhabi 4 9 1,543.64.0
+4.910.6 -4
▲31.9 -38.6 +2.3 ▲
8.1 ▲12 25.5 +2 ▲ 4.0 8.9▲3.9 8.9 +3.4▼
+1.14.111 1,170.6Morgan Stanley 7 15 1,136.0
1,212.7+3.4-0.6
6▲+4.2 ▲
▼ 512.8 -1 ▼
JP Morgan 5 46.166.3
BNP Paribas SA
▼ -3.912.8 +2
Barclays 8 5 812.465.94 8.5 -6 ▼4.2
3.6▲ 1.62.4-2.1
9 3.8▼ 1.7-0.2
19.1 -8 -0.93 ▲
Emirates NBD PJSC 9 7 700.2 -1.5 ▼3.7
19,138.6
3.3 +2.323
100.0▲69.0
+16.4Top Ten Total 13,197.7Societe Generale 10 621.3 ▲
+12.0
% Change from Last Quarter 811.7% ▲% Change from Same Period Last Year -52.6% ▼
Industry Total
1.1▼
1.8▲
2.1
▼+1.8
.9
▲
125.0% ▲ 556.3% ▲▼
44.5
▼
100.047
-63.4%
‐13
-21.7%
61.2▼▲+10.227.2
▼-18.2% ▼ -47.8% ▼ -0.7%-60.2% ▼
Jan 1 - Dec 31All International Emerging Market Bond Volume by Industry (US$b)
$154.646% $99.8
30%
$30.59%
$14.84%
$10.23%
$9.23%
$5.82%
$4.71%
$2.51%$2.2
1%$1.80%
$1.60%
Financials Government and Agencies Energy and PowerIndustrials Real Estate MaterialsHigh Technology Telecommunications Consumer Staples
*tie
https://www.thomsonone.comVisit http://dmi.thomsonreuters.com to view archives and order custom League Tables
0%Healthcare Consumer Products and Services Retail
13

Global Brazilian Debt Volume by Sector Full Year
% Change from Last Quarter
Jan 1 - Dec 31
10,939.8 100.0
▲
56
Global Debt by Mexican Issuers (MX1)
-3.3% ▼ 0.0%-85.0% ▼
0.0% ▲% Change from Same Period Last Year -83.7% ▼ -74.2% ▼
Industry Total28.8 85.3
‐161 33.8 100.0Top Ten Total 9,716.5
▼100.0 +21.6 ▲ +22.7 ▲
269.21.8 -32.2 ▲ 1
-12.9▼ 1.0 -7.3Credit Suisse 10 23 240.5 +1.8 2.9
▼2 3.6 -39 ▼ .3 0.9▼ -0.8▲7.1 -5 ▼ 1.84 5.4 +2.5+0.6 ▲
5.4
2.5Bank of America Merrill Lynch 8 11 434.9 4.0Banco do Brasil SA 9 1
▲Morgan Stanley 7 14 589.6 5.4 +3.7 ▲ +0.7 ▲2 3.6
8.9 -11 ▼ 2.85-6 ▼ 1.8
Citi 6 7 933.3 8.2 +1.28.5 +2.6 ▲
4 16.5 +1.3+3.0 ▲ ▲2 3.6 -12 ▼ 4.1 12.1 +3.9
▲7.1 -3 ▼ 5.6+8.5 ▲10.4
Deutsche Bank 4 12 1,248.4 11.4JP Morgan 5 6 1,138.0
+1.9 ▲ +5.9 ▲-21 ▼ 3.2 9.615.3 +6.2 ▲ 23 ▲
Santander 3 3 1,329.7 12.2▼ 3.8 11.2 +0.8
9 16.1
+6.2 ▲ +14.5Itau Unibanco 2 4 1,678.4
13.141.1 -37
Fees▲13 23.2 -33 ▼ 4.4
Sh (%)Manager Market
Share Ch.Banco Bradesco SA 1 2 1,854.5 17.0
Sh (%) # of DealsBookrunner Proceeds Sh (%) Share Ch. DealsMarket Market # of Market
Full Year 2015 | Debt Capital Markets | Managing Underwriters
Emerging Markets - Latin AmericaGlobal Brazilian Debt Volume Down 84% l Fees for Global Brazilian Debt Down 85% | Domestic Brazilian Issuance Down 43%
Change in 2015 Rank
2014 Rank
Market
All Global Debt by Brazilian Issuers (BR1) Jan 1 - Dec 31
Proceeds per Bookrunner (US$m) # of Deals per Bookrunner Imputed Fees (US$m)
Domestic Brazilian Debt in Reals (BR2) Jan 1 - Dec 31
9077
60
91
140
78
107
108
217
56
0
30
60
90
120
150
180
210
240
$0
$10
$20
$30
$40
$50
$60
2006 2007 2008 2009 2010 2011 2012 2013 2014 2015
# of
Issu
es
Pro
ceed
s (U
S$b
)
Securitized DebtJunk Rated DebtInvestment Grade CorporateAgency, Supranational, Sovereign# of Issues
▼▼ -14.9% ▼ -5.0% ▼ ▼
▲ 38.7%-12.7%
100.0
-16.0% % Change from Same Period Last Year 4.5%-26.0% ▲ 7.5%
+5 100.0
▲% Change from Last Quarter
‐1528.3▲28.3
-12.7%
10,489.7
▼▼% Change from Same Period Last Year -28.6%▼ -9.5% ▼
72
% Change from Last Quarter
Industry Total+27.495.4
100.0 79
+11.3
10,090.4100.030.1 Industry Total
1 +3.4 ▲+1330.5+21.0 ▲9,623.7
▲100.0+35.330.192.6 +34.8
Imputed Fees (US$m)
▲1.0 3.4
87.6
1.6
Market Market
+3.2▲ 1.0
-49.2%
+1.3 ▲
# of Deals per Bookrunner
▲ Top Ten Total-
+1▲ SD Indeval SA de CV 10▼
▲3.3 +3.35.6
3.2- 1 1.43.2 +3.2
100.0
482.85 6.9
-2.9
+2.86.0 +0.6
Change in
SD Indeval SA de CV 109,700.1Top Ten Total
330.5
-16.6%
▲Bank of America Merrill Lynch 9 478.4 4.7 +1.4 ▲4.6 -0.7 6.3 -2
▼▲▲4.8 -2.0
▼
▲+0.8 ▲+2
Bank of America Merrill Lynch 9 135.3 -1.5▼4.6 ▼
8 478.4
▲
▼ 5 1.69 482.8
92.7
+30▲ 1.1-0.3 -3.6 13 18.1 1.16▼ 13 8+216.51.5 5.4508.7 5.0 +1.4
3.815 508.7 ▲+2.8▲ 1.5
▲-1+2 ▲5.1 8 11.1
1.7 5.9602.0Casa de Bolsa Inverlat 7 12▲ 84.9 10.1
Manager
▼+3.9▼ 1.7 8▲-8
-1 ▲15.36.2 ▼ 2.4
5.7 8 11.1
23.6
12 602.0 +2.1▼ 11 ▲
Santander13.9 -9
+4.7 ▲
10.16
+12 ▲
Inversora Bursatil SA de CV
Corporacion Actinver Sab de CV
11Inversora Bursatil SA de CV 6 95.5
+2.6
+3.04 653.2 2.4 8.4
7
Grupo Financiero Banorte-Ixe 5 653.2 6.5 -4.32 ▼+4.6 ▲
▼ -0.9 ▼53.31,089.8 10.8 11.7▲
-1.3 7.983.3
Grupo Financiero Banorte-Ixe▲ 174
3 3.1 10.810.4 +6.3 11.0 +7.1 +5.2Santander 4 11 ▲ 17 +111,089.8 21.5 ▲
Citi ▲ 33 45.815.2 +6.9 ▲ 34 15.4 +10.1+6.7
+1.6▲ 3.2+8.6 ▲+26 ▲
3 105.5 19.4
10.5▲ 36 50.0
+22 ▲1,553.5
+23 ▲+3.1 ▲ 43 59.745.6 +26
3 1,591.71,891.0 18.7
43.0 +18 ▲ Citi
-1.9 ▼
▲ Casas de Bolsa Bital, S.A. 2 45.1 18.1 +0.5 ▲
Casa de Bolsa InverlatCorporacion Actinver Sab de CV 8
▼
3.3 -4.0
▲ 3618.0 +11.3
Sh (%) Share Ch.
7 1,891.0Casas de Bolsa Bital, S.A. 2 18.2 +11.9▲ 5.5
# of Deals Fees1 1▲ 44 2,033.8 20.2
Sh (%)▲ BBVA1 2,072.0BBVA 1 ▲ 5.2 17.3 +3.355.7 +20
% Change from Last Quarter% Change from Same Period Last Year
Market2015 Rank
-32.8% ▼72.5% ▲
Domestic Mexican Debt (MX3)
-21.1%
2015 Rank
2014 Rank Bookrunner Proceeds Sh (%) Share Ch.
2014 Rank
90
Deals Sh (%)
14.3%
Market# of Deals Fees
19.8 +4.7
# ofSh (%) Share Ch.
Jan 1 - Dec 31
Proceeds per Bookrunner (US$m)
Share Ch.Market
▲
BookrunnerMarket
▲
MarketDealsProceeds
Market MarketSh (%)
# of Market
Global Debt in Mexican Pesos (MX2) Jan 1 - Dec 31
Proceeds per Bookrunner (US$m) # of Deals per Bookrunner Imputed Fees (US$m)Change in Manager
78.4%
▲ 67.6Industry TotalTop Ten Total 26,479.9 79.7 +16.8
▼ 3
33,242.3 ‐24
4.7 -2.6
100.0
-7 ▼72.8 +5.2 ▲
▼ 3.1Credit Suisse 9 5 1,576.5 ▼
3.3Deutsche Bank 10 7 1,559.9
▼ 4.03.3 -44.7 -3.6 4 4.4
▲ 33.9 -5.9 ▼-9 ▼ 3.64.3
▲ 36Barclays 8 10
+261,733.1
40.05.2 +1.8
Casas de Bolsa Bital, S.A. 7 17 1,891.0 5.7 +3.7▲
5.9 +4.5 ▲▼ 7.8 8.4 +0.7▲ 5.5
-5Bank of America Merrill Lynch 6 4 2,747.8 8.3 -0.1 ▼ 13Santander 5 11 2,949.1 ▲
14.48.9 +5.6
7.97.8 -11+9 ▲ 8.1 8.7 +4.3 ▲21 23.3
7 8.6 +0.5 ▲▼5
HSBC Holdings PLC 4 1Morgan Stanley 3 9
▼6.8-5
2,994.95.6
9.0 -0.93,113.3 9.4 +5.7 ▲
+3.4 ▲7.3 +2.1 ▲
▲ 9.3 10.0 +3.9▼
▲▲ 11.5
+1812.4 +1.0 ▲
52.2BBVA 2 23,980.8 12.0 +3.8
473,933.5 11.8▲ 40 44.4 +7Citi 1 6
Sh (%) Share Ch.Bookrunner Proceeds Sh (%) Share Ch. Deals Sh (%) # of Deals Fees2014 Rank
Market Market # of Market2015 Rank
# of Deals per Bookrunner Imputed Fees (US$m)Change in Manager Market Market
Proceeds per Bookrunner (US$m)Proceeds per Bookrunner (R$m) # of Deals per Bookrunner Imputed Fees (US$m)2015 Rank
2014 Rank
Market MarketBookrunner Proceeds Sh (%) Share Ch.
# of Market Change in Manager Market MarketDeals Sh (%) # of Deals Fees Sh (%) Share Ch.
Banco Bradesco SA 1 3 15,825.5 38.3 +21.8 ▲ 37 29.8 -8 ▼ 8.4 35.6 +18.0 ▲Itau Unibanco 2 4 12,321.1 29.8 +15.7 ▲ 49 39.5 -16 ▼ 7.8 34.5 +17.7 ▲Santander 3 2 4,551.0 11.0 -5.6 ▼ 14 11.3 -7 ▼ 2.5 10.5 +7.6 ▲Banco do Brasil SA 4 1 2,450.0 5.9 -13.1 ▼ 6 4.8 -37 ▼ 1.7 5.5 -19.1 ▼HSBC Holdings PLC 5 8 1,682.2 4.1 +1.1 ▲ 7 5.6 -3 ▼ .8 3.4 0 -Credit Suisse 6 11 900.0 2.2 +0.9 ▲ 1 0.8 -1 ▼ 1.0 - - -JP Morgan 7 14 712.5 1.7 +1.1 ▲ 2 1.6 +1 ▲ .6 2.8 +2.2 ▲Banco BTG Pactual SA 8 6 682.0 1.7 -4.8 ▼ 14 11.3 -18 ▼ .2 0.9 -7.2 ▼Banco BBM Investimentos SA 9 - 450.0 1.1 +1.1 ▲ 1 0.8 +1 ▲ .4 1.8 +1.8 ▲Citi 10 20 397.5 1.0 +0.7 ▲ 1 0.8 -18 ▼ .4 1.9 +1.5 ▲Top Ten Total 39,971.8 96.8 +18.9 ▲ 23.8 100.0 +22.5
100.0▲
Industry Total 41,342.1 100.0 ‐129 24.6124
15.4% ▲% Change from Same Period Last Year -43.4% ▼ -51.0% ▼ -58.3% ▼% Change from Last Quarter 21.1% ▲ -33.3% ▼
https://www.thomsonone.comVisit http://dmi.thomsonreuters.com to view archives and order custom League Tables14

Asian Corporate Bonds Imputed Fees (US$m) Full Year 2015
-1.3Goldman Sachs & Co 7 7 7,962.4
t Includes Asian Development Bank issuance
All Asian Currencies (ex-Japan ex-Australia) (AS1**)
6
Deutsche Bank
55.810.1
▼-0.3
4.3
100.0
▼‐9.0%
3JP Morgan
Deals
-0.5
5
Sh (%)Bookrunner11.41
Proceeds
3
Bank of America Merrill Lynch 45 11,238.7
5.7
6.3
‐12.9%
42
11,453.112,557.9
2
6
Citi
Industry % Change from Same Period Last YearIndustry % Change from Last Quarter
Standard Chartered PLC 6.110,386.9
HSBC Holdings PLC
Proceeds per Bookrunner (US$m)
-0.3 ▼20,805.2
2014 Rank
▼9.6
# of Deals per Bookrunner# of
▼-0.157
Share Ch. Sh (%)
Change in
▼
# of Deals Fees Sh (%)
Market
▼
Imputed Fees (US$m)
17,602.4 -1.872.4 ▼
7.8
Full Year 2015 | Debt Capital Markets | Managing Underwriters
Asia DebtAsian G3 Down 13% l Asian Local Currency Falls 46% l Investment Grade Issuance at 83%
Asian G3 Currency Bonds (ex-Japan ex-Australia) (AR2†)Asia Deals Intelligence Jan 1 - Dec 31
Asian G3 (US$, Euro, Yen) bond offerings in 2015 totaled US$182.5 billion from 292 deals, down 12.9% from 2014.US Dollar issuance amounted to US$167.7 billion, accounting for 91.7% of total Asian G3 activity. China-domiciledissuers posted US$77.1 billion of bond offerings and remained the most active in the Asian G3 market, capturing41.8% of volume. Despite a 9.5% decline from 2014, Financials sector borrowings reached US$110.4 billion,representing 59.9% of total Asian G3 volume.
Asian currency bond offerings in 2015 amounted to US$407 billion from 3,604 deals, a 46.3% decline from the totalraised last year. Chinese Yuan issuances accounted for 58.1%, dominating Asian currency volumes with US$236.5billion from 1,051 deals, despite falling 56.6% from year ago figures. Investment Grade issues captured 82.7% ofAsian currency transactions, posting total issuance of US$336.7 billion.
According to estimates from Thomson Reuters/Freeman Consulting, investment banking fees in the Asian G3currency bond market totaled US$714.1 million in 2015, a 17.1% decrease from total fees paid in 2014. Estimatedunderwriting fees on Asian currency bonds (ex. Japan, Australia) declined 58.5% of 2014's volume, to total US$878.4million from US$2.1 billion a year ago.
MarketManager
1 123-32-41
Market
86
Market2015 Rank
Market
▼24.3 -20 ▼ 44.8 6.3
Share Ch.
6.9
42.129.5
-0.2
23.3 -37+0.25.3
71-0.2
43.7
▲-13-0.8 ▼ 68 -0.7
▼ ▼ 38.1
4.471-1.8 ▼ 24.3 ▼-18 ▼ -2.96.1
▼-1.2▼ 38 2.9
19.5▼▼ 49.9 7.0
4.6▲ 24.1+1158
▼13.0 -13 ▼ 20.632.8
Bank of China Ltd 9 11 6,692.7 +0.2Morgan Stanley 8 8 7,783.0
3.7 -0.7-0.9 ▼ -0.1-20 ▼
3.447 16.1
BNP Paribas SA 10 10 6,163.5 ▼ 25.03.4 -0.1 ▼47 16.1 -17 ▼▼
-8.1292
19.93.5
▲
Top Ten Total 112,645.8-0.4
▼
Industry Total 182,893.4 -80▼▼
▼‐24.2% ▲▼ ‐21.5%
61.8 -5.8
39.7%▼
714.1 100.057.0407.2
‐17.1%
Jan 1 - Dec 31
**Includes CDs and CPs
▲
103
Jan 1 - Dec 31Offshore Chinese Yuan Issued & Settled Bonds (ex self-funded) (AS24a)
100.0%
122,403.6
+0.5
51.2 100.0
▼▼
‐62.4%
Industry Total
133.9% ▲▲▼
▼
9
‐34.9%
▲
‐42.5%
▲
▼▲
Industry Total 163,119.2
-1.2
4.0% ▲
▲
‐51.7%
392
Industry % Change from Same Period Last Year
100.0
2.0-18
1.0▼
2.2
65.01.8
4.6▼ +3.1-3
45
3.4+7.1 ▲
▼Industry % Change from Same Period Last Year ‐32.8% ▼ ‐30.8% ▼ ‐41.4%
100.0121.8+6.5194.8-20
+5.9
-04.220.04.07.7
▼▲ 2 1.5▲ 62.5
3.0+14.4 ▲
▲7.5
8.2
▲▲-0
+0.9
▲+1.73.3 -1.43.95.7 -0.4
22.2
▼ 97 15.6
+0.3949.4 ▼▲
10-4
▼
14.6▼ 129 1,034.5 6.2 +1.7 9 20.0
▼
-3
-8▲
-15
26.7▼
8.9
▲7.0▼-6.610.6▼
5.5+2.313.7
+8.3▲ 8-8
24.4
▼
▼ 11
14▲
▼ 14.5 7.4 -1.7-8+6 17.3▲
MarketSh (%) Share Ch.MarketManager
Fees
▲▼8.3
16.0-0.8
8.2 +1.516.2
7.0
-1.9
Change in # of DealsShare Ch. Deals
16 35.6 -15 ▼Sh (%)
HSBC Holdings PLC
Standard Chartered PLC
Market # of MarketSh (%)
17.8▲ 31.1
Bookrunner
5JP Morgan
4DBS Group Holdings 3 25
1
4
Top Ten Total▼
10.1
▼2.875.1
+0.4
8.11,590.6
33.22.0 -1.8 11
+6.7
▲ 3.12.2 12
▼
-210
‐47.5%▼
China Construction Bank 13 3,552.29Industrial & Comm Bank China 10 6 3,323.6
Agricultural Bank of China 8 16 3,779.8 +0.8177
2.3
+1.03.2▲ .8
-0.71.6
▼ 6.2
1.1▼
-21Credit Agricole CIB 6 22 4,571.4
4,294.3Barclays+8-52.6
2.3▲ 7
14 -2+1.2
3.6▲
2.81.8
+2.0 ▲ 16 4.1Bank of China Ltd 5 5 6,605.2 19 4.84.1 -1.7 ▼
▲+2.8-16-2.29.4 ▼DBS Group Holdings 4 3 8,634.1 37 4.6-2.2 ▼
▲ 625.3
▼ 8.82.4-344.5
▼15.8BNP Paribas SA 12.3 +5.63 4 20,010.2
Standard Chartered PLC 2 2 27,512.9 ▼ 6.8
Share Ch. Sh (%)Deals
+2.1+0.5
16.9 +2.3 13.4759.337.5 ▼
▲
Share Ch.# of Deals Sh (%)Fees
100.0
# of Deals per Bookrunner
10,555.5
Imputed Fees (US$m)Market
19.1 -89147 18.2
Industry % Change from Last Quarter
+0.1
Change in
63.4
651.09
3.2544.5
Market
▲
ProceedsManager
Top Ten Total
Sh (%)
UBSCITIC
Market
-104▲
10
615
Proceeds per Bookrunner (US$m)2015 Rank
-1.6
+2.3
BookrunnerHSBC Holdings PLC 19,355.1
Industry Total
+1.7Bank of America Merrill LynchCIMB Group Sdn Bhd
6
2015 Rank
16,672.4
Asian G3 Currency High Yield Bonds (ex-Japan ex-Australia)(AR10)
8526.9
Credit Suisse
Proceeds
2
Deutsche Bank 3
Industrial & Comm Bank China
2014 Rank
3 4
14.5
Market
1,164.2
+1.1 ▲2.7
Proceeds
1
5Sh (%)
91.3% ▲
Jan 1 - Dec 31
Proceeds per Bookrunner (US$m) # of Deals per Bookrunner Imputed Fees (US$m)
1,343.69.5
1,684.6
1,066.2
Industry % Change from Same Period Last Year
KB Financial Group Inc 9 20
-4.2 ▼▼-0.9
▼
6.1-0.6-77
7.4 -68
9,845.0 2.4-0.69,140.6
6.4
2014 Rank
17*
-3.0
134,289.7 33.2
+1.2
▼-1.01.6
+1.9
+7.2
▼
5
78
# of Deals per Bookrunner Imputed Fees (US$m)Market Change in
17.3+54
2.6 ▼2.7 ▼-2.4▼
20.5
2.2
100.029.7
-1,608
-0.3262.0 -6.9878.4
2.0
3,604
4.7
▼ 14.22.3
▼
Share Ch.
▼▲+1.1
▼
24.02.9
4.1-156
3.3▼ 29.4
25.7
-12641.6
Market MarketMarket Manager
4.8
Market # of# of DealsShare Ch.
395Deals
34.1105
Sh (%)
▼+1.0
-1.3 ▼
▲ 11.0
120 3.3-112
+1.3 ▲-1.0
36.13.9▼
3.5-0.9 ▼ 2.9
FeesSh (%)
3.2
2
13,727.5 3.4-130▼
18,104.214,367.8
-2.6 2.9
6113
1 14,098.3
12,836.0
▼▲
Bank of China Ltd3.0
3.5CITICStandard Chartered PLC 5 14
-133+0.9
-90
▼
+0.3 95
▼
▼
-1.9
-0.5+1.0
98
219
-4.6
▼ 85 2.4
24.6
▲8 7
-1172.5
406,978.6▼
▼▼‐30.9% ‐58.5%
‐39.7%
100.0
‐64.7%
▼
China Construction Bank
Bank of Communications Co Ltd
▼
2
19.1▼
265
10,557.7
Industrial Bank Co Ltd ▼
# of Market
▲
▲4
2.6
Industry % Change from Last Quarter ‐39.6% ▼
Top Ten Total10
7Shanghai Pudong Development Bk 12,257.5
89
‐46.3%
2.3
MarketProceeds per Bookrunner (CNYm)
▲HSBC Holdings PLCBookrunner
2015 Rank
1 40,119.9
2014 Rank
Industry % Change from Last Quarter
1
$0
$500
$1,000
$1,500
$2,000
$2,500
$3,000
2006 2007 2008 2009 2010 2011 2012 2013 2014 2015
Chinese Yuan U.S. Dollar All Other Currencies
* tie **Includes CDs and CPs
Visit http://dmi.thomsonreuters.com to view archives and order custom League Tables https://www.thomsonone.com15

MarketMarket2015 Rank
-1.7
21.5
Market2014 Rank
-8 44.6▼+1.1
Australian international debt offerings in 2015 totaled US$77.9 billion from 120 deals, down 13% from last year. TheUS Dollar accounted for 55% of total market activity, with proceeds of US$42.9 from 48 transactions. Financialssector issuances amount to US$55.5 billion from 99 deals, down 25.5% from 2014.
Australian Dollar bond (excluding self-funded) proceeds in 2015 reached AU$117.9 billion from 306 deals, a drop of7.9% from total proceeds raised last year. Australian-domiciled issuers captured 55.9% of the AU$ bond market,reaching AU$66.2 billion. US-domiciled issues followed with AU$11.8 billion and German-domiciled borrowings withAU$8.7 billion, both with 33 transactions.
According to Thomson Reuters/Freeman Consulting, estimated investment banking fees earned from AustralianDollar (excluding self-funded) bonds to date reached AU$350 million, a 21.7% decline from total fees earned in 2014.Estimated fees from Australian international bond offerings this year registered a slight dip of 0.1% from last year, tototal US$259.2 million.
# of Deals per Bookrunner
12.7 ▼▲Deals Sh (%) Share Ch.Share Ch. # of Deals
ManagerFees
Change in Sh (%)
Market# ofBookrunner
Proceeds per Bookrunner (AU$m) Imputed Fees (AU$m)
14.817,414.2Sh (%)Proceeds
Australian International Bonds Down 13% | Australian Dollar Debt at AU$118 billion
13.917,244.8 14.6
+3.3▼-2.813,766.5
+4.0▲
11.7Deutsche Bank 5
8
3 16,360.7National Australia Bank 34
7UBS10,178.2
7
67.78.6
6 9,055.04.0
▲▲46.1
15.8+0.7
▲
+1.413.2
+0.4 ▲
27.8▼74
22.2
85
▲
▼
▼
6.1
-0.7
+1.1 ▼
▼▲ 12.4
55.4-3
+1.429.8 8.5
+0.82.9▲ 10.3▲80.6▲
+5.1
-0.2+2
‐7.9%
17.0▼86.9 +1.9
+4282.5
‐31.1% ▼▼▼ ‐12.1%
306100.0117,873.5
‐29.0% ▼
RBC Capital Markets 109
Top Ten Total
Nomura
Industry Total
Industry % Change from Last QuarterIndustry % Change from Same Period Last Year
Australian Dollar Non-Securitized Bonds (ex-self-funded) (AJ6)
11
Westpac Banking
ANZ Banking Group
1
TD Securities IncCiti 8
9
350.0102,362.1 ▲
52
-42
5
4,418.4 3.8
4,686.14,721.3
+0.4-4.5
-0.33.84.0
11.9
Market
‐21.7%‐35.5%
▼▼
100.0
Jan 1 - Dec 31
▼
Jan 1 - Dec 31
Full Year 2015 | Debt Capital Markets | Managing Underwriters
Australia Debt
▼29.1
-973▲89
-6
4.0 +2.0+4
14.4
-17
-0.341.7
11.144
50+9+0.3-2
24.2
▲2.3 +0.6▲
▲▼3.2
▲ 13.8
8.2
Commonwealth Bank of Australia
Australia Deals Intelligence
1 24
4,516.9
All Australian Debt (ex self-funded) (AJ3a)
▲34
38▲
2
11.1
23.9
16.3
▼
All Australian Debt (ex self-funded) Proceeds by Issue Type (AU$b) Full Year 2015
68
$140
46.2 99.4▼
8.04.6
168.4
+1.45.8
10.4+0.9
▲▲
▼
▼▲
▼
▲
142.3%
+3.051,455.0
Industry % Change from Last Quarter 91.9%
▲66.2
3,680.7 +0.413
National Australia Bank
10 4,320.6 5.6
BNP Paribas SA 9
259.277,916.8 100.0
4.4+0.7
9▲2.3 -0.110 12
+6.2 ▲Top Ten Total
Industry % Change from Same Period Last Year
▲ANZ Banking Group 3,310.4
-34
‐13.0%
120
17
‐8.3%
Industry Total
▲
14.2▲4.3
‐22.1%
3,420.9▼
-6 ▼▲
+0.8 7.511.714
+265.2 +14.6
-0.63.1-611.8
Deutsche Bank 611 5.213.49.2 -9Barclays 7 ▼4,007.5 ▼3 -1.2
+1.4
8 9
▲
4.75.1
▼4.0 -0.1-1 ▼15.016.3 6.3 +0.613.9▼
184,430.6 5.7 -0.6 -6
+0.15.410.820.0 -5
▼
Goldman Sachs & Co+0.7
3 8
▼ 13Bank of America Merrill Lynch 5 42416 13.3 5.7
▼14.8 -0.9
HSBC Holdings PLC 4 5 5,114.6 6.65,571.5 +2
Proceeds per Bookrunner (US$m) # of Deals per Bookrunner
7.2 +2.3
Bookrunner
▲▲ ▲
Market
21.7
Market Market
8.0 -0.8▼
DealsChange in # of
Proceeds Share Ch.Sh (%)2014 Rank
All Australian International Bonds (AJ7) Jan 1 - Dec 31
Bookrunner2National Australia Bank
Manager Market Market
1Sh (%)Fees
+14.11 2 10,458.1 13.4 +3.5Sh (%) Share Ch.
2015 Rank
2014 Rank
9.2 -1.8 ▼ 25▲
20.753.326
# of Deals
20.8 -9
Commonwealth Bank of Australia
Citi 2 1 7,140.120.6
ANZ Banking Group
Westpac BankingNational Australia Bank
-4 ▲
Imputed Fees (US$m)
# of Market
MarketMarket Change in
All Australian Securitization (ex-CDOs) (AJ4)
Proceeds per Bookrunner (AU$m) # of Deals per Bookrunner2015 Rank
Imputed Fees (AU$m)
Share Ch. Deals Sh (%)Manager
Sh (%)Market Market
- 11.3 24.4# of Deals Fees
# ofProceeds
Market
6,651.6 +6.9Sh (%)
+9.1 ▲ 25 65.825.3Share Ch.
▲0+9.4 ▲ 34.22 4 5,531.8 21.0 13
15 39.5Commonwealth Bank of AustraliaWestpac Banking 3 1 3,884.3 14.7 -3.1 ▼
+9.1 ▲+3 ▲ 7.9 17.1-5.1 ▼+1 ▲ 7.1 15.3
+0.9 ▲ 42.14 3 3,791.1 14.4 1610 26.3
ANZ Banking GroupMacquarie Group 5 6 2,298.3 8.7 -1.4 ▼
-0.6 ▼0 - 6.6 14.1-2.9 ▼-1 ▼ 4.9 10.6
-0.5 ▼ 15.86 8 1,527.2 5.8 66 15.8
Deutsche BankJP Morgan 7 5 1,278.0 4.9 -6.3 ▼
-3.5 ▼-3 ▼ 1.6 3.3-4.0 ▼-4 ▼ 2.6 5.6
+1.1-5.9 ▼ 13.28 7 862.4 3.3 5Citi
Sumitomo Mitsui Finl Grp Inc 9 - 276.0 1.1+1.8 ▲+2 ▲ 3.3 7.1+1.3▲ ▲+1 ▲ .6 1.31 2.6
-0.3 ▼ 2.610 11 138.0 0.5 1 .3 0.6+2.6 ▲Top Ten Total 26,238.7 99.7
26,346.7 100.0 38 -4 46.3
Market
-50.0%Industry % Change from Last Quarter‐10.6% ▼ -9.5%-58.6% ▼
+1.5
MarketProceeds per Bookrunner (AU$m)
ManagerBookrunner Proceeds Sh (%)
2015 Rank
2014 Rank
MarketSh (%) # of Deals FeesShare Ch. Deals
# of Deals per BookrunnerChange in
Imputed Fees (AU$m)
Sh (%)27.072 12.6 ▼-1.738.3▼-9▲
▲ 591 12 3 12.9
13,728.9 15.111.2
▲12.9▼ 39.1▼▼ -1.433.9
+1.510.9 58 -5+2.8
▼ 21.7-1322.1
-2.4▲-8 ▼ 44.4 14.6
14.222.5
9.8+9 29.85 4 9,055.0 9.9 38+1.5 ▲5
▲8,651.1 9.5
10.8 60
+1.750-0.862 23.2
UBS +0.5 ▲Deutsche Bank 6 7
8 1018.77 8TD Securities Inc ▼
444,721.3 5.2 +0.8
4.4
5.0 +0.7 ▲52
+23.4
13.8 4.6▼▼
▲9 9 4,418.4 4.910
4,516.9-0.3
88.64,010.6
+1.4 ▲80,654.9-3.8
‐34.4% ▼ ‐28.6%‐24.1%
0.0% ▲▼
0
100.0
‐13.6% ▼
Jan 1 - Dec 31
100.0
▲-0.4 ▼-
‐9.2% ▼
Industry Total
▼
91,123.1
Industry % Change from Last Quarter ▼‐9.4%
Market
267
28
+225
+4
▲
19.5 ▲10.5
-1716.5
+18.2
▲ 19.9
10.3
▼
▼
▼
2.76.6
▼
302.9 100.0
2.7
+0.4
Share Ch.
▲
▲
+1.1 ▲▼-0.5
+1.1+1.8
▲▲▲
+5.581.1
+2.4
+1 ▲
Industry Total
ING
Industry % Change from Same Period Last Year
6
Nomura
‐0.1%▲
▼ ▼▼
4
Industry % Change from Same Period Last Year
100.0
9,947.611,778.3
245.98.2
Top Ten Total
RBC Capital MarketsCiti
‐8.9%
JP Morgan ▼
3 29,826.8
$0$10$20$30$40$50$60$70$80$90
$100$110$120$130$140
2006 2007 2008 2009 2010 2011 2012 2013 2014 2015
Agency, Supranational, Sovereign Investment Grade Corporate MBS Federal Credit Agency ABS
Visit http://dmi.thomsonreuters.com to view archives and order custom League Tables https://www.thomsonone.com16

Overall Japanese Yen denominated bond activity posted the lowest full year volume since 2004, with JPY17.7 trillionin proceeds (down 4.0% from 2014). Deal count in the year, at 959 issues, trailed 2014 by 13.4%. According toThomson Reuters/Freeman Consulting, estimated fees for Yen denominated bond activity totaled JPY67.4 billionduring 2015, a 6.4% decrease from last year.
Japanese Corporate Bond activity registered JPY6.8 trillion in proceeds from 346 deals, the lowest annual volumesince 2006’s JPY6.6 trillion. Transactions in the Financials sector showed a remarkable decline, registering a nearly40% decrease, followed by the Industrials sector, which posted the second largest year-on-year decline of about 20%.
Samurai Bond volume in 2015 declined 22.5% from last year, with JPY2 trillion in proceeds from 79 deals. Americanissuers recorded a total of JPY107.6 billion in proceeds and registered a 5.3% market share, the lowest proceedsfrom American issuers since 1998’s JPY13 billion. European issuers continued to dominate the Samurai market (witha 75.5% market share) but also registered a 15.6% year-on-year decline in proceeds.
2.0%
6.4 +1162,505.3
790.8▲92.3 -1.6
-6.4%
67,436.6
-13.4%
959
▼▼
2015 Rank
2014 Rank
16,279,621.3Top Ten Total
Proceeds¥mil
Mitsubishi UFJ Morgan Stanley2,730,586.0
▲16.7%Industry % Change from Same Period Last YearIndustry % Change from Last Quarter
100.0
▼▲
-4.0%40.8%
Samurai Bonds (AP1)
+0.1
Industry Total -149
Tokai Tokyo Financial Holdings 10▼
61
100.0-1.6
Bank of America Merrill LynchMitsubishi UFJ Financial Group 8
8 226,638.9
17,653,901.8
9 ▲37 3.9 0 - 967.5▲
+0.1 ▲6 325,447.6▲+0.1
1.81.3
352.29 365,142.3 2.1
▲388,559.3 +0.67+1.0
10,734.9▼
901.5
143.6 -72.625
1,150.1▼
-20
Share Ch.538▼
11,599.4▼-33
41.9402▲ ▲+1.917.2▼ 14,604.7
Share Ch.Sh (%)3,615,387.1
Imputed Fees (¥m)Market Market
# of Deals Fees ¥milDeals Sh (%)Manager
# of Deals per Bookrunner# of
Mizuho Financial Group 1 1
Change in Market Market
56.1Sh (%)Market
Goldman Sachs & Co
Daiwa Securities Group Inc 5
7Sumitomo Mitsui Trust Holdings
Sumitomo Mitsui Finl Grp Inc
6
4-0.9
2 3,129,797.3Nomura 3
2 +0.517.73 15.5
Full Year 2015 | Debt Capital Markets | Managing Underwriters
Japan DebtYen Bond Activity Lowest Since 2004 l Corporate Bond Financial Sector Down 20% l Samurai Issuance Down 23%
All Bonds in Yen (AP5) Jan 1 - Dec 31Japan Deals Intelligence
493,395.7 2.8
-0.32,640,688.6 15.0-1.12,363,978.55
10
▼ -45▼▼
13.437.3
▼+1.8
368 38.4
▲355358
13.71.5 +5
9,227.4
▼ 15.9 -0.7
2.8 ▲
-3.4
▲37.0 -23
-20
-1.8
20.5
10,627.0
1,902.0
21.7
▲
+1.1
▼-4.8
▼
+0.4
15.8 ▲
+1.9
1.4-0▼
▼
▲
▲
1.3
1.292.7
1.7+0.3
Jan 1 - Dec 31
-2 ▼
4
Proceeds per Bookrunner (¥m)
Lead Manager
Jan 1 - Dec 31
*tie
Japanese Corporate Debt Volume by Industry (¥ Billion) Full Year 2015
▼
-12
28.8%
88.3100.0
-2 ▼
13,497.311,913.3
267.2 2.0
5.5739.9
▼
▼
1.6
Japanese Securitizations (AP2)
2.1
▲▼
84.3
▼
Market
4,401.3
-3
Imputed Fees (¥mil)Manager
# of Deals per BookrunnerChange in
▲
2.12.1
+0.3
24.6%▼
79 5,416.5
2.5 ▼
5,162.1▲ 95.4
+0.6
Sh (%)Fees ¥mil
-6.0 14.1
3.0
# of Deals
5.05
Market
▼33.3% ▲
-20.2%
-21 ▼
122.5
60.60
+7
0141.6
+5Sh (%)
70.9
▲+7
Fees ¥milChange in
▲63.3
Market
50
45,000.0 --▲
2
242,500.0
+3.7▲
▲
2.5
4910.1862.0
Deals
Manager Market
# of
18.9
63.3
# of Market
Sh (%)
65.8 ▲+2
100.0
2.3
Jan 1 - Dec 31
+5
2015 Rank
2014 Rank
Proceeds MarketProceeds per Bookrunner (¥mil)
MarketBookrunner
# of Deals per Bookrunner Imputed Fees (¥mil)
Market
▼
+2.4
▲
-0.2
+1.4
▲-0.6
+1.2
+0.4-0.1
▲+8.1-7.8
Share Ch.
▼
▲
▼
▼▲
2.6
73.7 -6 ▼ 32.6▲ 1,902.0+5
1.1
-3.28.0-1 ▼3.00
▼
-2.2+0.4
▼1,278.2 9.5 -0.6
▲5.9
1,077.1
+0.3
-1
1.7 ▲▲2.2
-4 ▼
+3
673.0
▼
801.2
+1.8▼
3.12.6
▼
▲-0.5
▲▲33.5%
-5.4
▼-1.7▲
352.0421.4+1
1.74Goldman Sachs & Co 10 -0.4▲
232
4▼
-3.8
-1.5
15
3.4▼
-27
23 9.9▼ 7
18.916.2
1,024.6
2.7
15.4877.4831.4
15.7148.1847.8
¥mil
6.5
171
-1.6
1,272,627.21
2014 Rank
▼▲ 14▼9.9
58
7Bank of America Merrill Lynch
6
Top Ten Total
12
Mitsubishi UFJ Financial Group
Industry % Change from Same Period Last Year
-16.8%
32.612.6
13.9
3
Industry % Change from Last Quarter 16.1%
2Sumitomo Mitsui Trust Holdings
▲
▲
▲
▲17.925
0
▲55,485.0
+0.8
4+0.83
1 -5.23
Sh (%)+0.5
330,785.016.216.3
Share Ch.▲
364,941.7374,883.3
¥mil
+2.4
▲
Sh (%)
100.0
3.84.8
Market
-6.2
8.0+1.1
Sumitomo Mitsui Finl Grp Inc
▲
Market
18.4Deals # of Deals
Proceeds per Bookrunner (¥mil)
9+3.8
▼
Sh (%)
5250
274,700.0
312,700.0
+7.1386,750.0
Share Ch.
▼
56
11
1
+1.4
8
324,841.7
2.2 -+0.4
-2.8
16.0
-2.5
364
42,033.3
43,260.0+1.1
Proceeds
11
-22.5%
1
8
9
▲277,750.0
493,395.7
678
Mizuho Financial Group2.7
10
7
14
Deutsche Bank
91.5 ▼
-4.9% ▼
1,023.8Mitsubishi UFJ Morgan StanleyNomura 2
100.0
-5.4%
7.1
93.2
5
Industry % Change from Last Quarter
3,574,872.02.5
187,201.17.0
47.5% ▲▲
Industry Total
22.9%
3,907,851.5
Citi
Top Ten Total
Nomura
Mitsubishi UFJ Morgan Stanley
Daiwa Securities Group Inc
8
2,033,800.01,952,416.7 96.0
Industry % Change from Same Period Last Year
Natixis
Mizuho Financial Group
Industry Total
Lead Manager
Barclays
Share Ch.+0.5 ▲
-4.6
▲+1.3
▼▲
+3.1
Daiwa Securities Group Inc 328,686.7
-16
7.6 -26
7
2015 Rank
95,548.0
Sumitomo Mitsui Finl Grp Inc 4
148,700.09
2
125,500.0Barclays
5 4Bank of America Merrill Lynch
21
5865
39
63
80
6675
95
79
0
10
20
30
40
50
60
70
80
90
100
0200400600800
1,0001,2001,4001,6001,8002,0002,2002,4002,600
2006 2007 2008 2009 2010 2011 2012 2013 2014 2015
# of
Issu
es
¥ B
illion
Europe Asia-Pacific (ex Central Asia) Americas # of Issues
¥1,733.326%
¥1,285.019% ¥940.0
14%
¥533.08%
¥475.07%¥461.0
7%¥435.0
6%¥297.0
4%
¥287.24%
¥266.04% ¥50.0
1%¥20.00%
Industrials
Financials
Telecommunications
High Technology
Retail
Energy and Power
Consumer Products and Services
Materials
Real Estate
Consumer Staples
Media and Entertainment
Visit http://dmi.thomsonreuters.com to view archives and order custom League Tables https://www.thomsonone.com
1%0%Healthcare
17

Industry % Change from Same Period Last YearIndustry % Change from Last Quarter
2.5
Full Year 2015 | Debt Capital Markets | Managing Underwriters
Japan Debt
1.63.83.7
-2493,395.710 +2.0
▼
▲▼
3.0
7+0.1 35
-0.4
44.2%1.3% ▲
94.7
-13.3% ▼ -7.9%
▼ ▼-0.6
0611.0
928
▼
94.2-142
61,422.6100.065,215.5
901.9
673.0
841.3790.8
▼
▲34
23
-1.3
-1.2
0
▼▼ -
0-8300,251.56
-1.4 ▲
Bank of America Merrill Lynch
+0.10263,559.3
1.88 ▼
-46.6 +11
0 -
114.4 8Tokai Tokyo Financial Holdings
-7
4.03.5
-8+1
2.3▼0.6 -0.4▲
Mitsubishi UFJ Financial Group
-0.2
▼164.171.7
0.5
96.133,649.035,073.2
-1.4100.0Industry Total
▲-17.1%-25.6% ▼
346 -119
58.1%▼
16,631,301.8
0.5-0.3
▲
187,201.1
19.5%
Top Ten Total
-28.1%Industry % Change from Same Period Last Year -20.3% ▼
▲
6,736,369.119,900.08
99.30.3 -0.3 ▼
▼
10
6,782,500.0
Industry % Change from Last Quarter 6.8%
-0.3100.0
▼
-2 255.8 ▲+0.3+0.3
4.62.9
▼▲
Tokai Tokyo Financial Holdings 914Shinkin Central Bank 0.2
10 34,369.9 +0.1 12 ▲
-8.0% ▼
8
15,731,504.6
226,638.91.1
100.0
▲
Industry Total
6
-0.1▼▼
193.30.3
+0.10.60.7
▲
+0.3
Daiwa Securities Group Inc15.2
9Goldman Sachs & Co
910
7
Top Ten Total
180Deals
+2.7 ▼Mitsubishi UFJ Morgan Stanley
Sumitomo Mitsui Trust Holdings
Nomura6,789.6 19.4▲6,631.1
▼▼
▼ 518.9 4
-2.1Sumitomo Mitsui Finl Grp Inc
51.2
5,324.1▲▼ 43.1
-55-33
-48▲
177
10 +3
51.4
16149
▲
178▲
# of ManagerShare Ch. Fees ¥mil# of Deals
Market Market
▲▼
16.2
Imputed Fees (¥mil)
▼▲
# of Deals per Bookrunner
▼
Market
-4.7Share Ch.Sh (%)
-32 14,500.4
Jan 1 - Dec 31
+2.0
+2.210,599.0
+2.0
2.9-1.6
17.6
14.110,553.09,163.5
▲▲+0.1
42.9
Change in
22.2▼
1.4
▼-22
3-5.91
2 1,370,382.6 20.2
21.7
4▲+0.8
1,468,795.8
Japanese Corporate Debt (AP3)
20.2
9
Sumitomo Mitsui Finl Grp Inc 4
0.81.3
Daiwa Securities Group Inc 14.25 5Goldman Sachs & Co
Bank of America Merrill Lynch 8 7 40,508.2
655,500.088,484.96
Citi 7 +0.2
1-7.7
6,721.521.1 ▼
+3.6 ▲7,383.4
-0.6
Deals
Bonds Targeted in Japan (AP4)
39821.5
Market
▲535
▼11,497.7
-0.6-23
39.2 16.3
Sh (%)57.7
2014 Rank
+0.316.1
3,064,467.9-0.5
Proceeds per Bookrunner (¥mil)Market
Sh (%)Proceeds2015
RankShare Ch.19.2 ▼3,572,737.1
18.4-2.7Mizuho Financial Group+0.9
¥milSh (%)2015 Rank
2014 Rank
Proceeds
▼
Lead Manager ¥mil1
1,372,538.4
Market
52.0Share Ch.
Change in
▼
# of Deals per Bookrunner
Sh (%) Lead ManagerMarket
200
# of Deals Fees ¥milMarket
+5-26
▲ 1,902.0▲
▼
515.72,608,638.6
2,677,936.0▼4
1414.12,336,678.5 ▼-0.6
1.5▼352964,732.3
38.437.9
57.8-60
356 -39+2.81,321,157.03
19.5 +4.73 ▼ 364
▲
# of
Jan 1 - Dec 31
Proceeds per Bookrunner (¥mil)
Sh (%)MarketMarket Manager
Imputed Fees (¥mil)
▲2Mitsubishi UFJ Morgan Stanley
Nomura 3Mizuho Financial Group -52 22
1
https://www.thomsonone.comVisit http://dmi.thomsonreuters.com to view archives and order custom League Tables18

-
-
-
-
-
-
-
-
-
-
Europe
Asia-Pacific
JapanAki SatoTel: +813 6441 1120E-mail: [email protected]
Carina Causon-Israel
E-mail: [email protected]
Tel: +1 646 223 4892
Full Year 2015 | Debt Capital Markets | Managing Underwriters
Ranking Criteria Summary
Database coverage includes all US public, Euro public and Rule 144a fee-eligible global debt transactions (including Global bonds, Euro/144a transactions, Yankee Bonds, Eurobonds, Foreign Bondsand preferred stock) as well as MBS, ABS & Taxable Munis.
Evgeniya KolesovaUnited States
If you would like to participate in the submission process, receive quarterly press releases, or have questions about our full league table criteria please contact:
Tel: +1 646 223 8457
https://www.thomsonone.com
League table volumes for Mitsubishi UFJ Financial Group and Morgan Stanley, included herein, reflect changes after the commencement of their jointly established securities firms in Japan: (1)Mitsubishi UFJ Morgan Stanley Securities and (2) Morgan Stanley MUFG Securities. Credit for the newly established joint ventures rolls up to Morgan Stanley. For Japanese involvement league tablesMorgan Stanley will be represented as "Mitsubishi UFJ Morgan Stanley."
Transactions must be received within 5 business days of pricing for league table accreditation. (Rule 144a transactions sold exclusively in the US market, MBS, ABS transactions in all markets and allFederal Credit Agency transactions must be received within 5 business days of settlement.) Transactions not received by the applicable deadline are entered into the database but classified as rankineligible and are not included in league tables for the current calendar year.
All league tables are based on deal proceeds (total issue amount multiplied by the issue price) unless otherwise stated; and current data and previous year's data is as of 9:00am EST on December 31,2015.
Full credit is given to the bookrunner, equal if joint books. In cases of underwriter consolidation, credit is given to the surviving/parent firm. Non-US dollar denominated transactions are converted to theUS dollar equivalent at the time of announcement.
Long-term league tables exclude deals with a minimum life of less than 1.5 years (or 18 months), except for Asian local currency denominated bonds and all securitized tranches, which require aminimum life of more than 360 days. Minimum life is defined as the difference between the settlement date and the earliest maturity date or first call/put option.
As concluded following our 2014 DCM Roundtable in Tokyo, Thomson Reuters will begin publishing domestic Japanese rankings on an "Anbun Hoshiki" (Proportional) basis beginning with JapaneseFiscal Year 2014 - 2015 after April 1st, 2014. Please note that the Samurai Bonds ranking (AP1) will be consistent with all other international bonds rankings and will remain on the "Equal-to-Each"allocation basis.
Imputed fees are calculated using Freeman Consulting. proprietary algorithm for transactions for which spreads or fees are not disclosed. Deal fees are on a gross basis before all expenses. Eachunderwriter or advisor is allocated its share of deal fees using Freeman Consulting. allocation methodology, based on the number of underwriters or advisors on the deal and their role. No fees areallocated to syndicate members.
While Thomson Reuters has used reasonable endeavors to ensure that the information provided in this document is accurate and up to date as at the time of issue, neither Thomson Reuters nor its third party content providers shall be liable for any errors, inaccuracies or delays in the information, nor for any actions taken in reliance thereon, nor does it endorse any views or opinions of any third party content provider. Thomson Reuters disclaims all warranties, express or implied, as to the accuracy or completeness of any of the content provided, or as to the fitness of the content for any purpose to the extent permitted by law. The content herein is not appropriate for the purposes of making a decision to carry out a transaction or trade and does not provide any form of advice (investment, tax, legal) amounting to investment advice, nor make any recommendations or solicitations regarding particular financial instruments, investments or products, including the buying or selling of securities. Thomson Reuters has not undertaken any liability or obligation relating to the purchase or sale of securities for or by any person in connection with this document.
© 2015 Thomson Reuters. All rights reserved.
Thomson Reuters and the Thomson Reuters logo are registered trademarks and trademarks of Thomson Reuters and its affiliated companies. Any third party name or mark herein belongs to the relevant third party.
Visit http://dmi.thomsonreuters.com to view archives and order custom League Tables
E-mail: [email protected]
E-mail: [email protected]
E-mail: [email protected]
Following our mid-year League Table Inquiry, all 2014 US mortgage-related securitizations have been classified as mortgage backed regardless of risk category or deal structure.
Joyce Lu
Ian Willmott
Tel: +632 459 1566
US marketplace league tables include US dollar denominated domestic, Yankee, Global and Euro/144a bond and preferred stock transactions. Global bond league tables include domestic, foreign,Global, Euromarket and Euro/144a bond and preferred stock transactions issued in any currency.
Tel: +44 207 542 4376
19
© 2015 Thomson Reuters..Thomson Reuters and the Kinesis logo are trademarks of Thomson Reuters.
FOR INFORMATION PROFESSIONALSSDC Platinum is the world’s foremost financial transactions database, covering new issues, M&A, syndicated loans, private equity, project finance, poison pills, and more.
Solution for:• Market Analysis & Trends (Geography, Sector,
Asset Class, Deal Type, Deal Size, etc.)• Deal Origination (Debt Maturity Analysis,
Company Lifecycle including Private Equity)• Pitch Creation (Firm Credentials,
Representative Acquirors)• M&A Targeting (Active Strategic/Sponsor
Acquirors, Target Company Screener)• Negotiation (T&C Benchmarking)
FOR INVESTMENT BANKERSThomson Reuters Eikon is the most intuitive and comprehensive way of staying informed. With natural-language search, you can quickly find global information, news, charts and analytics. Company and industry views provide top-level summaries, and then detailed information is just a click away. Identify new opportunities and gain deep understanding of markets, industries, companies and events.
Thomson Reuters Eikon also includes an Add-In for Microsoft® Office to help you increase your efficiency. From screening and targeting to comparables analysis, building league tables, valuing a company and
developing a client pitch book, you can do all this without leaving Microsoft Office. Search and autosuggest features in Excel make model-building easier.
Solution for:• Managing Client Relationships• Deal Origination• New Issues Pre-Marketing/Roadshows• Financial Modeling• Customized League Tables• Simple Deals screening• Valuation analysis and comparable
deal screening• On-brand pitch book creation
FOR STRATEGY AND PLANNING TEAMSThomson Reuters Deals Business Intelligence enables you to slice and dice our renowned Deals and Fees data to create ad hoc reports, analyze market trends, benchmark your performance and identify opportunities – all within a tool built into your workflow in Excel®, saving you valuable time and giving you a competitive edge.
Solution for:• Conducting market analysis and
identifying trends• Benchmarking your performance and
monitoring competitors• Targeting clients by wallet size and
banking relationship• Allocating resources more effectively by
evaluating and analyzing lost deals
Send us a sales enquiry at: financial.thomsonreuters.com/salesRead more about our products at: financial.thomsonreuters.com/products
To purchase individual Thomson Reuters Deals or League Table reports, please contact our Thomson Reuters On Demand group:
Web: http://financial.thomsonreuters.com/ondemandEmail: [email protected]
Access unique analysis for free anytime using Thomson Reuters Deals Intelligence website and receive regular updates, delivered direct to your inbox.
Go to: dmi.thomsonreuters.com/dealsintelligence
Thomson Reuters Solutions for the Deal Making Community
20