Debt and deleveraging: Uneven progress on the path to growth
64
Updated research McKinsey Global Institute Debt and deleveraging: Uneven progress on the path to growth January 2012
Transcript of Debt and deleveraging: Uneven progress on the path to growth

Updated research
McKinsey Global Institute
Upd
ated Research
McK
insey Global Institute
Debt and d
eleveraging: Uneven progress on the path to grow
th
Debt and deleveraging: Uneven progress on the path to growth
January 2012

Copyright © McKinsey & Company 2012
The McKinsey Global Institute
The McKinsey Global Institute (MGI), the business and economics research arm of McKinsey & Company, was established in 1990 to develop a deeper understanding of the evolving global economy. Our goal is to provide leaders in the commercial, public, and social sectors with facts and insights on which to base management and policy decisions.
MGI research combines the disciplines of economics and management, employing the analytical tools of economics with the insights of business leaders. Our “micro-to-macro” methodology examines microeconomic industry trends to better understand the broad macroeconomic forces affecting business strategy and public policy. MGI’s in-depth reports have covered more than 20 countries and 30 industries. Current research focuses on six themes: productivity and growth; global financial markets; technology and innovation; urbanization; the future of work; and natural resources. Recent reports have assessed job creation, resource productivity, cities of the future, and the impact of the Internet.
MGI is led by three McKinsey & Company directors: Richard Dobbs, James Manyika, and Charles Roxburgh. Susan Lund serves as director of research. Project teams are led by a group of senior fellows and include consultants from McKinsey’s offices around the world. These teams draw on McKinsey’s global network of partners and industry and management experts. In addition, leading economists, including Nobel laureates, act as research advisers.
The partners of McKinsey & Company fund MGI’s research; it is not commissioned by any business, government, or other institution. For further information about MGI and to download reports, please visit www.mckinsey.com/mgi.

McKinsey Global Institute
Updated research
Charles RoxburghSusan LundToos DaruvalaJames Manyika Richard DobbsRamon FornKaren Croxson
January 2012
Debt and deleveraging: Uneven progress on the path to growth

In 2011, the global economy continued to feel the lingering effects of the 2008 financial crisis. For those hoping to see progress on reducing the debt overhang from the credit bubble and a stronger economic recovery, it was a year of disappointment and fresh dangers.
Two years ago, the McKinsey Global Institute (MGI) published a report that examined the global credit bubble and looked at 32 episodes in which countries had significantly reduced their debt—or deleveraged—after a financial crisis. In that research, Debt and deleveraging: The global credit bubble and its economic consequences, we warned how long and painful the process of reducing debt would be.
In this report, we update that research and assess the progress in deleveraging by the major mature economies today. We focus particularly on the United States, the United Kingdom, and Spain, three large economies in which the credit bubble was pronounced. These nations are facing a range of challenges that illustrate the difficult trade-offs involved in stabilizing financial systems, reducing debt, and restarting growth.
We also examine more closely the banking crises and deleveraging episodes of Sweden and Finland in the 1990s, which offer relevant lessons for debt reduction today. We see that these Nordic deleveraging episodes proceeded in two phases—several years of private-sector debt reduction and recession, followed by a longer period of economic expansion and public-sector deleveraging. It is our hope that by looking deeply into how today’s economies are progressing through these phases, business leaders and policy makers can gain a better perspective on what to expect and how to craft policies and strategies for a deleveraging environment.
McKinsey Global Institute leaders Charles Roxburgh and Susan Lund directed this research. McKinsey directors James Manyika, Richard Dobbs, Toos Daruvala, and Ramon Forn provided support and insight. The project team was headed by Karen Croxson and included Albert Bollard, Dennis Bron, and John Piotrowski. We thank Geoffrey Lewis for editorial support, and other members of the MGI communications and operations organization for their many contributions: Julie Philpot, Deadra Henderson, Tim Beacom, and Rebeca Robboy.
The analysis and insights in this report also reflect the generous contributions of McKinsey colleagues from around the world: Per-Anders Enkvist, Enrique Garcia Lopez, Sara Jonsson, Carmen Martin Ruiz-Jarabo, Jaana Remes, Olli Salo, and Annaliina Soikkanen. We are also grateful to David Hunt, a former McKinsey colleague and now CEO of Prudential Investment Management.
Preface

Debt and deleveraging: Uneven progress on the path to growthMcKinsey Global Institute
We wish to thank several academic experts whose knowledge and guidance helped shape this report: Martin N. Baily, Bernard L. Schwartz Chair in Economic Policy Development at the Brookings Institution; Klas Eklund, senior economist at SEB and adjunct professor of economics, University of Lund; and Matti Pohjola, professor of economics, Aalto University School of Economics and former deputy director of the United Nations University—World Institute for Development Economics Research (UNU-WIDER).
Our goal is to develop a clearer understanding of how economies can reduce debt and resume economic growth in an orderly way and provide some useful markers of progress for policy makers and business leaders. As with all MGI projects, this research is independent and has not been commissioned or sponsored in any way by any business, government, or other institution.
Richard Dobbs Director, McKinsey Global Institute Seoul
James Manyika Director, McKinsey Global Institute San Francisco
Charles Roxburgh Director, McKinsey Global Institute London
Susan Lund Director of Research, McKinsey Global Institute Washington, DC
January 2012


Debt and deleveraging: Uneven progress on the path to growthMcKinsey Global Institute
Executive summary 1
Debt and deleveraging: Uneven progress on the path to growth 11
Appendix: Technical notes 43
Bibliography 51
Contents


Debt and deleveraging: Uneven progress on the path to growthMcKinsey Global Institute
1
The deleveraging process that began in 2008 is proving to be long and painful, just as historical experience suggested it would be. Two years ago, the McKinsey Global Institute published a report that examined the global credit bubble and provided in-depth analysis of the 32 episodes of debt reduction following financial crises since the 1930s.1 The eurozone’s debt crisis is just the latest reminder of how damaging the consequences are when countries have too much debt and too little growth.
In this report, we revisit the world’s ten largest mature economies2 to see where they stand in the process of deleveraging. We pay particular attention to the experience and outlook for the United States, the United Kingdom, and Spain, a set of countries that covers a broad range of deleveraging and growth challenges. We also look at the relevant lessons from history about how governments can support economic recovery amid deleveraging. We discuss six markers that business and government leaders can look for when monitoring progress, and we assess how close to these milestones the United States, the United Kingdom, and Spain are today. Among our key findings:
� The deleveraging process is in its early stages in most countries. Total debt has actually grown across the world’s ten largest mature economies since the 2008–09 financial crisis, due mainly to rising government debt. Moreover, the ratio of total debt to GDP has declined in only three countries in our sample: the United States, South Korea, and Australia (Exhibit E1).
� The deleveraging episodes of Sweden and Finland in the 1990s are particularly relevant today. They show two distinct phases of deleveraging. In the first, households, corporations, and financial institutions reduce debt significantly over several years, while economic growth is negative or minimal and government debt rises. In the second phase, growth rebounds and government debt is reduced gradually over many years.
� Today, the United States most closely follows this debt-reduction path. Debt in the financial sector relative to GDP has fallen back to levels last seen in 2000, before the credit bubble. US households have reduced their debt relative to disposable income by 15 percentage points, more than in any other country; at this rate, they could reach sustainable debt levels in two years or so.
� Deleveraging in the United Kingdom and Spain is proceeding more slowly. The ratio of UK debt to GDP has continued to rise and UK households have increased debt in absolute terms. In Spain, households have barely reduced debt ratios and corporations continue to carry the highest level of debt relative
1 Debt and deleveraging: The global credit bubble and its economic consequences, McKinsey Global Institute, January 2010 (www.mckinsey.com/mgi).
2 The list comprises, in descending order by GDP: the United States, Japan, Germany, France, the United Kingdom, Italy, Canada, Spain, Australia, and South Korea.
Executive summary

2
to GDP in our ten-country sample. It could take many more years to finish an orderly deleveraging in the United Kingdom and Spain.
� The Swedish and Finnish deleveraging episodes reveal six critical markers of progress before the economic recovery takes off: the financial sector is stabilized and lending volumes are rising; structural reforms have been implemented; credible medium-term public deficit reduction plans are in place; exports are growing; private investment has resumed; and the housing market is stabilized, with residential construction reviving.
Despite concerns over the strength of its recovery and the protracted debate over how to reduce public debt, the United States has reached more of these milestones than other nations and is closest to moving into the second, growth phase of deleveraging. Still, no country has all the conditions in place to revive growth. For business leaders trying to navigate the new world of debt reduction, understanding the course of deleveraging is of critical importance. Although growth in the time of deleveraging may be slower and more volatile in some countries, there are also clear opportunities to invest ahead of demand and exploit pockets of growth even within slowly expanding economies.
Exhibit E1
550
500
450
400
350
300
250
200
150
100
0Q2 2011
080604022000989694921990
SOURCE: Haver Analytics; national central banks; McKinsey Global Institute
1 Includes all loans and fixed-income securities of households, corporations, financial institutions, and government.2 Defined as an increase of 25 percentage points or more.3 Or latest available.
Deleveraging has only just begun in the ten largest developed economiesTotal debt,1 1990–Q2 2011 % of GDP
Canada
Australia
Germany
United States
South Korea
Italy
France
Spain
United Kingdom
Japan
ChangePercentage points2000–08
2008–Q2 20113
Significant increase in leverage2
Deleveraging
75
39
7
37177
89145
68
91
77
-16
17
1
3920
3526
12
-16
-14

3Debt and deleveraging: Uneven progress on the path to growthMcKinsey Global Institute
ThE paTh To dElEvEraGInG: a TalE of ThrEE counTrIEs
In our previous work on debt and deleveraging, we studied 32 episodes of debt reduction following financial crises. We find that the experiences of Sweden and Finland in the 1990s offer case examples for today’s deleveraging economies.3 In the 1980s, both Nordic nations experienced credit booms and housing bubbles that ended in financial crises. Starting in 1990, both nations experienced severe recessions, as private-sector debt was reduced and government debt rose sharply—doubling in Sweden and tripling in Finland. But these countries moved decisively to resolve their financial crises and enacted reforms to set the stage for growth. By 1994, GDP growth had rebounded in both countries and a long period of fiscal discipline and government deleveraging began (Exhibit E2).
Today, the United States is following the Swedish and Finnish examples most closely and may be two years or so away from completing private-sector deleveraging. The United Kingdom and Spain have made less progress and could be a decade away from reducing their private-sector debt to the pre-bubble trend.
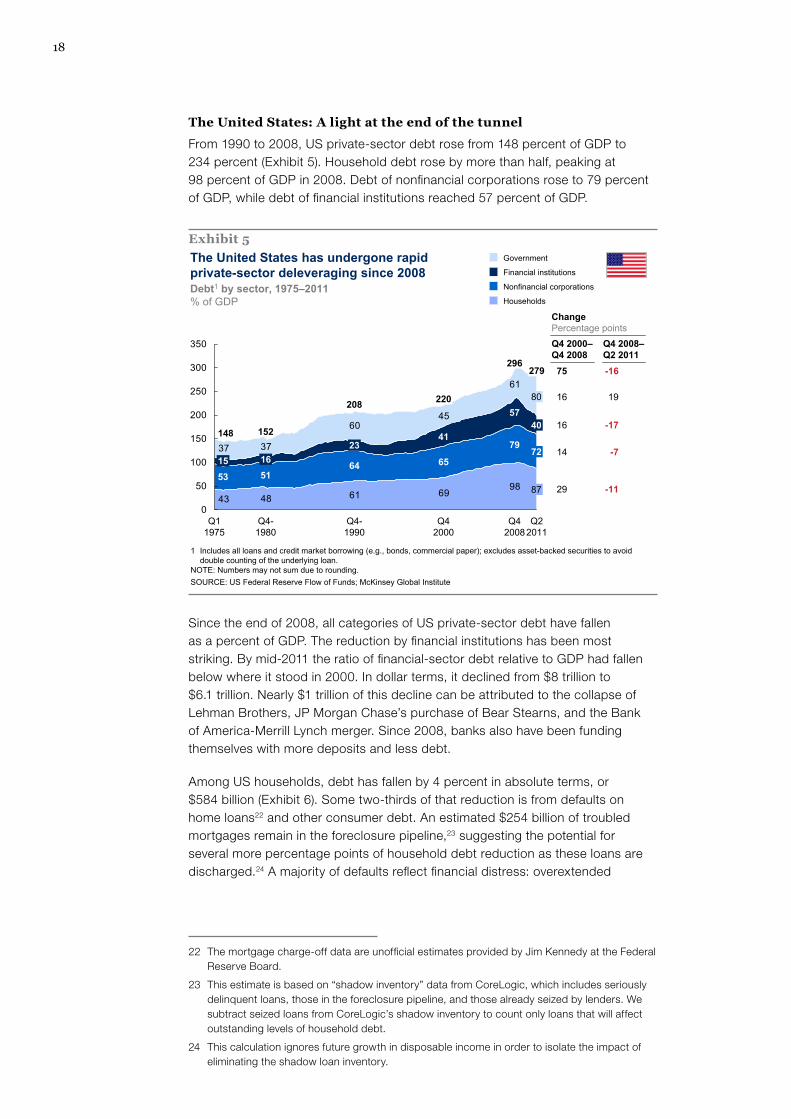
The united states: a light at the end of the tunnel
Since the end of 2008, all categories of US private-sector debt have fallen relative to GDP. Financial-sector debt has declined from $8 trillion to $6.1 trillion and stands at 40 percent of GDP, the same as in 2000. Nonfinancial corporations have also reduced their debt relative to GDP, and US household debt has fallen by $584 billion, or a 15 percentage-point reduction relative to disposable income. Two-thirds of household debt reduction is due to defaults on home loans and consumer debt. With $254 billion of mortgages still in the foreclosure pipeline,
3 Of the 32 episodes, 21 were in emerging markets. Some that occurred in mature economies predate the modern financial era (e.g., the US after the Great Depression and the UK after World War II), and others involved high inflation, which mechanically reduced the ratio of debt to GDP (e.g., Spain in 1976).
Exhibit E2Deleveraging typically begins in the private sector, even as government debt continues to grow Average of Swedish and Finnish deleveraging episodes
SOURCE: International Monetary Fund; Haver Analytics; McKinsey Global Institute
1–2 years 4–6 years ~10 years10 years
Real GDP
RecessionDeleveraging
Early stage of recession
Private-sector deleveraging
Pre-crisis period
Real GDP growthAnnual average (%)
-3% 1% 3%3%
Change in debt/GDPPercentage points
8 -26 8760
Private debt/ GDP
▪ Private sector15 21 -303
Public debt/ GDP
Rebound and public-sector deleveraging
▪ Public sector
Time

4
the United States could see several more percentage points of household deleveraging in the months and years ahead as the foreclosure process continues.
Historical precedent suggests that US households could be as much as halfway through the deleveraging process. If we define household deleveraging to sustainable levels as a return to the pre-bubble trend for the ratio of household debt to disposable income, then at the current pace of debt reduction, US households would complete their deleveraging by mid-2013. When we compare US household progress to the Swedish deleveraging episode, in which the ratio of household debt to income declined by more than 40 percentage points, we see that US household deleveraging is a little more than one-third complete. Because US interest rates today are lower than interest rates were in Sweden during its deleveraging, US households may be able to sustain somewhat higher levels of debt (Exhibit E3).
Even when US consumers finish deleveraging, however, they probably won’t be as powerful an engine of global growth as they were before the crisis. One reason is that they will no longer have easy access to the equity in their homes to use for consumption. From 2003 to 2007, US households took out $2.2 trillion in home equity loans and cash-out refinancing, about one-fifth of which went to fund consumption. Without the extra purchasing that this home equity extraction enabled, we calculate that consumer spending would have grown about 2 percent annually during the boom, rather than the roughly 3 percent recorded. This “steady state” consumption growth of 2 percent a year is similar to the annualized rate in the third quarter of 2011.
US government debt has continued to grow because of the costs of the crisis and the recession. Furthermore, because the United States entered the financial crisis with large deficits, public debt has reached its highest level—80 percent of GDP in the second quarter of 2011—since World War II. The next phase of
Exhibit E3
SOURCE: Haver Analytics; Statistics Sweden; McKinsey Global Institute
Credit boom Deleveraging
NOTE: 2011 figures are as of Q2 2011.
Spain (Year 0 = 2007)
United States(Year 0 = 2008)
United Kingdom(Year 0 = 2008)
Sweden (Year 0 = 1988)
Household debt% of disposable income
-8 -7 -6 -5 -4 -3 -2 -1 0 1 2 3 4 5 6 7 8 9
90
80
160
150
140
130
120
110
100-41 p.p.
-10 p.p.
-6 p.p.-15 p.p.
70
0
US households are about one-third of the way to the Swedish level of debt reduction
Peak household
debt
Years

5Debt and deleveraging: Uneven progress on the path to growthMcKinsey Global Institute
deleveraging, in which the government begins reducing debt, will require difficult political choices that policy makers have thus far been unable to make.
The united Kingdom: deleveraging has only just begun
Total UK public- and private-sector debt has risen slightly, reaching 507 percent of GDP in mid-2011, compared with 487 percent at the end of 2008 and 310 percent in 2000, before the bubble. The composition of UK debt—how much is owed by different sectors of the economy—diverges from that of other countries (Exhibit E4). While the largest component of US debt is household borrowing and the largest share of Japanese debt is government debt, the financial sector accounts for the largest share of debt in the United Kingdom. Although UK banks have significantly improved their capital ratios, nonbank financial companies have increased debt issuance since the crisis. British financial institutions also have significant exposure to troubled eurozone borrowers, mainly in the private sector. Nonfinancial companies in the United Kingdom have reduced their debt since 2008.
UK household debt, in absolute terms, has increased slightly since 2008. Unlike in the United States, where defaults and foreclosures account for the majority of household debt reduction, UK banks have been active in granting forbearance to troubled borrowers, and this may have prevented or deferred many foreclosures. This may obscure the extent of the mortgage debt problem. The Bank of England estimates that up to 12 percent of home loans are in a forbearance process. Another 2 percent are delinquent. Overall, this may mean that the UK has a similar level of mortgages in some degree of difficulty as in the United States. Moreover, around two-thirds of UK mortgages have floating interest rates, which may create distress if interest rates rise—particularly since UK household debt service payments are already one-third higher than in the United States.
Exhibit E4The composition of debt varies widely across countries Households
Nonfinancial corporations
Financial institutions
Government
SOURCE: Haver Analytics; Bank for International Settlements; national central banks; McKinsey Global Institute
1 Includes all loans and fixed-income securities of households, corporations, financial institutions, and government.2 Q1 2011 data.NOTE: Numbers may not sum due to rounding.
Total debt,1 Q2 2011% of GDP
67
98
82
81
87
105
91
226
81
71
90
111
80
8360
48
27653 63
Australia 27759 91 21
Germany 27849 87
United States 27972 40
South Korea 314107 93 33
Italy2 31445 82 76
France 346111 97
Spain 363134
Canada
76
United Kingdom 507109 219
Japan 51299 120
10 largest mature economies
124
82
94
85
71
79
111
13262
765
Italy2 31445 82 76
Portugal2 356
Greece 267
194 259
128 55
Spain 363134 76
Ireland2 663
Eurozone-crisis countries
69

6
The United Kingdom therefore does not appear to be following the deleveraging path of Sweden. At the recent pace of debt reduction, we calculate that the ratio of UK household debt to disposable income would not return to its pre-bubble trend for up to a decade. Overall, the United Kingdom needs to steer a difficult course: reduce government deficits and encourage household debt reduction—without limiting GDP growth. The United Kingdom will need renewed investment by nonfinancial businesses to achieve this.
spain: The long road ahead
The global credit boom accelerated growth in Spain, a country that was already among the fastest-growing economies in Europe. With the launch of the euro in 1999, Spain’s interest rates fell by 40 percent as they converged with rates of other eurozone countries. That helped spark a real estate boom that ultimately created 5 million new housing units over a period when the number of households expanded by 2.5 million. Corporations dramatically increased borrowing as well.
As in the United Kingdom, deleveraging is proceeding slowly. Spain’s total debt rose from 337 percent of GDP in 2008 to 363 percent in mid-2011, due to rapidly growing government debt. Outstanding household debt relative to disposable income has declined just 6 percentage points. Spain also has unusually high levels of corporate debt: the ratio of debt to national output of Spanish nonfinancial firms is 20 percent higher than that of French and UK nonfinancial firms, twice that of US firms, and three times that of German companies. Part of the reason for Spain’s high corporate debt is its large commercial real estate sector, but we find that corporate debt across other industries is higher in Spain than in other countries. Spain’s financial sector faces continuing troubles as well: the Bank of Spain estimates that as many as half of loans for real estate development could be in trouble.4
Spain has fewer policy options to revive growth than the United Kingdom and the United States. As a member of the eurozone, it cannot take on more public debt to stimulate growth, nor can it depreciate its currency to bolster its exports. That leaves restoring business confidence and undertaking structural reforms to improve competitiveness and productivity as the most important steps Spain can take. Its new government, elected in late 2011, is putting forth policy proposals to stabilize the banking sector and spur growth in the private sector.
GrowTh In ThE TIME of dElEvEraGInG
We see from the experience of Sweden and Finland that economies that succeed in restoring growth after deleveraging share certain characteristics. In these nations, we see six critical markers of progress that business and government leaders can look for when they evaluate how today’s deleveraging economies are progressing and what priorities to emphasize. Without these conditions, growth and public-sector deleveraging are unlikely, as illustrated by Japan, which did not reach these markers and has suffered two decades of slow growth and rising debt since its 1990 crisis.
4 This figure is mainly loans to real estate developers and does not apply to home mortgages, where the rate of nonperforming loans is relatively low. Under the Bank of Spain’s definition, troubled loans include nonperforming loans, substandard loans (loans that are performing but are considered at risk of not performing), and foreclosures.

7Debt and deleveraging: Uneven progress on the path to growthMcKinsey Global Institute
1. Is the banking system stable?
In Finland and Sweden, banks were recapitalized and some were nationalized, and the government set up special institutions to take over and dispose of the bad loans that clogged the financial system. This decisive resolution of the banking crises was critical to kick-starting lending during the growth phase of deleveraging. By contrast, in Japan, failure to recognize and resolve nonperforming loans in the corporate sector weighed on Japanese banks for more than a decade.
In response to the crisis, the United States and the United Kingdom moved quickly to provide liquidity and capital to banks, and they forced mergers and nationalized banks where needed. But vulnerabilities remain. In most parts of the United States, the housing market is still depressed, limiting the mortgage origination business. The UK financial sector is heavily exposed to the euro crisis, with $359 billion in loans to private and sovereign borrowers in troubled eurozone countries. Spain shut some regional banks, but only recently began discussing a more comprehensive plan to deal with the large number of troubled loans that its banks hold.
As the euro crisis continues, forced deleveraging—a rapid contraction in bank lending driven by acute funding and capital shortages—remains a risk for all of Europe. To date, access to bank lending has not been an issue in most of Europe, primarily because demand for business credit has been weak since 2008. The eurozone crisis, however, raises the risk of a credit contraction in 2012 if banks face funding constraints at the same time they face rising capital requirements. Such a forced deleveraging would significantly damage the region’s ability to escape recession.
2. Is there a credible plan for long-term fiscal sustainability?
Moving too soon and too aggressively to cut government spending can slow the recovery, as Finland found in 1992. But it is also important for governments to demonstrate a commitment to addressing government debt. In Sweden, the Social Democratic Party campaigned on a platform of fiscal reform and won election in 1994. Through budget restraint and renewed growth, Sweden eliminated its fiscal deficit by 1998. Government debt fell from 82 percent of GDP in 1998 to 45 percent a decade later.
Today’s deleveraging economies face a more difficult situation. Sweden was running government surpluses when its crisis hit, while the United States and the United Kingdom were already posting widening deficits prior to the financial crisis in 2008. In the past two years, the UK and Spanish governments have adopted austerity plans. The UK program to limit government spending is credited with keeping government borrowing rates very low, but the impact of austerity on the strength of the recovery remains a subject of debate. In Spain, despite a commitment to cut the fiscal deficit to 4.4 percent of GDP by 2012 (from 11 percent in 2009), rates on government bonds have continued to rise. In 2011, Spain took the additional step of adopting a constitutional amendment requiring a balanced budget by 2020. The United States, by contrast, has failed to adopt a long-term plan to reduce the federal deficit, leading to the first credit rating downgrade of US government debt.

8
3. are structural reforms in place?
Sweden and Finland enacted significant structural reforms that helped clear the path to stronger recovery and sustainable growth. The most sweeping change was joining the European Union in 1995, which allowed both nations to attract more foreign investment and boost exports. In addition, they enacted reforms to raise productivity and spur growth in sectors such as retail and banking. Japan, by contrast, did not adopt structural reforms, resulting in a two-tier economy with some highly productive, export-oriented companies but many small, less productive firms in domestic sectors.5
Today’s deleveraging economies need reforms tailored to their own circumstances. The United States, for instance, could encourage growth by investing in infrastructure and workforce skills, streamlining regulatory approvals for business investment, and simplifying the corporate tax code.6 UK planning and zoning rules can be reviewed to enable expansion of successful high-growth cities and to accelerate home building. Infrastructure improvement and continuing to allow immigration of skilled labor can help ensure that the United Kingdom remains attractive to multinational companies.7 Spain can drastically simplify business regulations to ease the formation of new companies, help improve productivity by promoting the creation of larger companies, and reform labor laws.8
4. are exports rising?
From 1994 to 1998, Swedish and Finnish exports grew by 9.7 percent and 9.4 percent a year, respectively, helping lift these economies into the second phase of economic growth and public-sector deleveraging. This boom was aided by a small group of strong export-oriented companies, including Finland’s Nokia, whose success in the 1990s generated 25 percent of Finnish exports. Currency depreciations of up to 34 percent during the crisis also helped boost exports.
In larger economies, such as the United States and the United Kingdom, exports alone do not have the same potential to drive GDP growth. However, they are important contributors to rebalancing growth away from consumer spending. Service exports, including the “hidden” ones generated by tourism, are a potential source of further export growth. Both nations also have a competitive advantage in business services, as evidenced by trade surpluses in those sectors. In Spain, increasing goods exports and tourism will be critical.
5. Is private investment rising?
A revival of private investment contributed to GDP growth in Finland and Sweden and helped offset more moderate consumption growth during the second phase of deleveraging. In both countries, investment grew at twice the rate of
5 See Why the Japanese economy is not growing: Micro barriers to productivity growth, McKinsey Global Institute, July 2000 (www.mckinsey.com/mgi).
6 See Growth and renewal in the United States: Retooling America’s economic engine, McKinsey Global Institute, February 2011; and Growth and competitiveness in the United States: The role of its multinational companies, McKinsey Global Institute, June 2010. Both are available at www.mckinsey.com/mgi.
7 See From austerity to prosperity: Seven priorities for long-term growth in the United Kingdom, McKinsey Global Institute, November 2010 (www.mckinsey.com/mgi).
8 See A growth agenda for Spain, McKinsey & Company and FEDEA, December 2010.

9Debt and deleveraging: Uneven progress on the path to growthMcKinsey Global Institute
consumption during the recovery, and in Sweden investment grew nearly as fast as exports, albeit from a very low level during the recession.
Both business and real estate investment declined sharply during the credit crisis and the ensuing recession in the United States, the United Kingdom, and Spain. In the United States and the United Kingdom, private business investment declined by roughly one-third during the crisis, and US residential real estate investment plummeted by twice that amount.
Since the end of the crisis, growth in business investment has remained weak in all three economies, and companies in the United States and the United Kingdom have been adding to cash reserves. As long as the business sector continues to save rather than invest, the strong economic growth that was the biggest factor in reducing government deficits in Sweden and Finland will not materialize. Therefore, a critical policy goal must be to rebuild business confidence and create the conditions in which executives are willing to invest.
Additionally, given current very low interest rates in the United Kingdom and the United States, this would be a good time for private investment in infrastructure, another important enabler of long-term growth. There are ample opportunities to renew the aging energy and transportation systems in both countries, provided that pricing and regulatory structures are in place to generate reasonable returns. Spain, too, has opportunities for infrastructure investment.
6. has the housing market stabilized?
A stabilized housing market and a rebound in construction are important elements in returning to normal economic conditions. Residential real estate construction equaled between 4 and 5 percent of GDP in the United States before the housing bubble, and housing drove sales of durable goods and other consumer products. Today, the number of US housing starts is only one-third of the long-term average, and home prices continue to decline in many parts of the country.
While the United States has a glut of unsold houses, the United Kingdom is in need of new homes, thanks to low investment in housing before the crisis ( just 3.5 percent of GDP, compared with 6 percent in France and Germany and as much as 12 percent in Spain). Land use rules that prevent many tracts from being developed should be reviewed to address the housing shortage.
In Spain, the legacy of the housing boom is more than 1.5 million excess homes. This inventory could take a decade or longer to clear and will likely weigh on property prices and construction employment in the meantime.
fIndInG busInEss opporTunITIEs aMId dElEvEraGInG
Deleveraging has important implications for business executives as they plan investments and consider geographic and strategic priorities. Current macroeconomic models do not fully capture the impact of deleveraging on demand.9 Therefore, standard forecasts must be overlaid with a perspective on how deleveraging is proceeding in different markets. As we have seen, not only
9 See Olivier Blanchard, Giovanni Dell’Ariccia, and Paolo Mauro, “Rethinking Monetary Policy,” IMF Staff Positon Note, February 12, 2010; and Gauti B. Eggertsson and Paul Krugman, “Debt, Deleveraging, and the Liquidity Trap: A Fisher-Minsky-Koo approach,” the Federal Reserve Bank of New York, November 16, 2010.
10
does the pace of debt reduction vary across economic sectors and nations, but it can also vary considerably within states and regions, creating very different demand profiles. Finding opportunities will require a very granular approach to strategy. In this environment, business leaders should:
� Expect constrained consumer demand. As consumers continue to deleverage and rely more on current income than credit to fund purchases, growth in consumer spending will be limited. In many nations, slow housing starts also will dampen demand in many categories. Current growth rates in consumer spending may be the “new normal” for quite some time.
� Emphasize value. When they do spend, consumers are likely to be far more cautious: impulse purchases are no longer in household budgets, and brand loyalty may have less influence than price.
� Accelerate productivity improvements. With consumers reluctant to spend and overall growth tepid, margin pressures will likely increase across industries. This makes additional productivity gains imperative.
� Invest ahead of demand. When private-sector deleveraging concludes, demand will increase. Depending on which economy, this process may take several years or more. Companies that invest before demand picks up will be in position to gain market share. Often in slow periods, future sector leaders make their moves.
� Take a granular view of markets. The after-effects of the debt crisis are not spread evenly across mature economies or within them. While Nevada and Florida struggle under the burden of unsold homes and weak consumer demand, Texas and New York have returned to pre-crisis levels of economic output.
� Consider new opportunities in public-sector projects. There is enormous need, particularly in the United States and the United Kingdom, for infrastructure improvements and other public investment—which governments are not in a position to fund by themselves. Investments by the private sector in such projects may be a solution.
� Think long term. As we have seen, there are no quick fixes when economies are recovering from financial crises and credit bubbles. Nonetheless, there will be opportunities for businesses that understand the economic environment.
* * *
Navigating through the time of deleveraging requires an understanding of how countries can succeed in reducing debt without unduly restraining economic growth. It is a difficult process, requiring structural changes to raise productivity and rebalance sources of growth. But history shows that countries that rise to the challenge can set their economies on a path of sustainable and robust long-term growth.

Debt and deleveraging: Uneven progress on the path to growthMcKinsey Global Institute
11
Three years after the start of the global financial crisis, developed economies continue to struggle with the aftermath of the global credit bubble. To varying degrees, they are reducing debt and trying to find a path to sustainable growth. Two years ago, we published a report that assessed the magnitude of the global credit bubble and examined the 32 episodes of deleveraging after financial crises since the Great Depression.10 The core lesson is that although the process of debt reduction is long and painful, nations that successfully deleverage do return to robust long-term growth.
In this report, we revisit the world’s ten largest mature economies11 to see where they stand in the process of deleveraging. We pay particular attention to the experience and outlook for the United States, the United Kingdom, and Spain, three countries that stood out for high leverage in the original report and which today represent a broad range of deleveraging and growth challenges. We also take a closer look at how countries historically have spurred growth after a crisis, and we assess the progress of today’s deleveraging economies against this experience.
The examples of deleveraging in Sweden and Finland during the 1990s have particular relevance today. Both nations experienced credit bubbles that led to asset bubbles and, ultimately, financial crises. But both also moved decisively to bolster their banking systems and deal with debt overhang. And—after painful recessions—both nations went on to enjoy more than a decade of strong GDP growth.
The experiences of the two Nordic economies illustrate that deleveraging often proceeds in two stages. In the first, households, the financial sector, and nonfinancial corporations reduce debt, while economic growth remains very weak or negative. During this time, government debt typically rises as a result of higher social costs and depressed tax receipts. In the second phase, economic growth rebounds and then the longer process of gradually reducing government debt begins.
These examples illustrate that an economy is ready to resume sustained growth after private-sector deleveraging when certain conditions are in place: the financial sector is stabilized and lending volumes are rising; structural reforms are in place to boost productivity and enable GDP growth; credible medium-term public deficit reduction plans have been adopted and restore confidence; exports are growing; private investment resumes; and the housing market is stabilized and residential construction is reviving.
10 Debt and deleveraging: The global credit bubble and its economic consequences, McKinsey Global Institute, January 2010 (www.mckinsey.com/mgi).
11 This list includes, in descending order by GDP: the United States, Japan, Germany, France, the United Kingdom, Italy, Canada, Spain, Australia, and South Korea.
Debt and deleveraging: Uneven progress on the path to growth

12
Today most developed nations are still in the early stages of deleveraging. Somewhat surprisingly, given the amount of concern over the US economy, we find that the United States is furthest along in private-sector debt reduction and closest to beginning the second phase of deleveraging. The remaining obstacles for its return to growth are its unsettled housing market and its failure to lay out a credible medium-term plan for public debt reduction.
Deleveraging in the United Kingdom and Spain is proceeding at a slower pace. The United Kingdom has made controlling the government deficit a top priority, but its private sector has made little progress in debt reduction. Overall, the United Kingdom maintains a ratio of total debt to GDP that is far higher than the average in mature economies. The UK financial sector accounts for the largest share of UK debt and remains vulnerable to potential losses from lending in the eurozone-crisis countries. Spain not only faces the unresolved aftermath of its real estate bubble, but also has a very high level of corporate leverage and a large overhang of troubled real estate loans. Spain’s membership in the eurozone and its large government debt restrict its ability to revive growth through monetary and fiscal policy. Undertaking structural reforms to raise productivity will be a priority for Spain.
In all deleveraging countries, the challenge in the next few years will be to find the correct balance between the need to reduce debt and the need to revive GDP growth. While clear patterns and markers of success can help guide policy makers, there is no simple formula and each nation has unique challenges.
This report is organized as follows: First we assess how overall debt levels have evolved among the world’s ten largest economies, as well as in emerging markets and in some additional European countries.12 Then we look more closely at the deleveraging process in Sweden and Finland in the 1990s. With this historic record in mind, we assess the progress made by the United States, the United Kingdom, and Spain in reducing debt, and we examine what conditions still need to be in place to revive growth. Finally, we discuss the opportunities for business leaders to gain an advantage and grow in a time of deleveraging.
Global dEbT: whErE wE sTand now
Across the ten largest economies, private-sector debt—defined as the debt of households, corporations, and financial institutions—has fallen by $1.5 trillion, or 2 percent, from the peak in 2008. But, as is typical in the aftermath of financial crises,13 government debt has continued to grow—by $7.8 trillion,14 or 26 percent, since 2008. As a result, the total debt of each of these countries has increased and the ratio of overall debt to GDP has risen in seven of the ten. Debt ratios have fallen in only three of these nations: the United States, South Korea, and Australia (Exhibit 1).
12 We base our analysis on the ten largest economies: the United States, Japan, Germany, France, the United Kingdom, Italy, Canada, Spain, Australia, and South Korea. We also conduct select analyses on several other countries of interest: Greece, Ireland, Portugal, China, India, Brazil, and Russia.
13 See Carmen M. Reinhart and Kenneth S. Rogoff, This time is different: Eight centuries of financial folly (Princeton, NJ: Princeton University Press, 2009).
14 We measure government debt as the sum of gross outstanding marketable government debt securities. Some analysts argue that a net debt measure is more appropriate. See the appendix for a discussion on the different measures of government debt.

13Debt and deleveraging: Uneven progress on the path to growthMcKinsey Global Institute
The distribution and composition of debt vary considerably across the ten largest economies and are important factors for determining how deleveraging may proceed in the coming years (Exhibit 2).
In Japan, for example, government borrowing is by far the largest portion of national debt, while household debt is below the average for mature economies. This is largely the legacy of two decades of government spending aimed at reviving growth following the collapse of a property and stock market bubble in 1990. In the United Kingdom, financial institutions have a large share of total debt, while UK households and nonfinancial businesses also have above-average levels
Exhibit 1
550
500
450
400
350
300
250
200
150
100
0Q2 2011
080604022000989694921990
SOURCE: Haver Analytics; national central banks; McKinsey Global Institute
1 Includes all loans and fixed-income securities of households, corporations, financial institutions, and government.2 Defined as an increase of 25 percentage points or more.3 Or latest available.
Deleveraging has only just begun in the ten largest developed economiesTotal debt,1 1990–Q2 2011 % of GDP
Canada
Australia
Germany
United States
South Korea
Italy
France
Spain
United Kingdom
Japan
ChangePercentage points2000–08
2008–Q2 20113
Significant increase in leverage2
Deleveraging
75
39
7
37177
89145
68
91
77
-16
17
1
3920
3526
12
-16
-14
Exhibit 2The composition of debt varies widely across countries Households
Nonfinancialcorporations
Financialinstitutions
Government
SOURCE: Haver Analytics; national central banks; McKinsey Global Institute
1 Q1 2011 data.2 According to Canada’s national accounts, “household” sector includes nonfinancial, non-corporate business.NOTE: Numbers may not sum due to rounding.
Total debt of ten largest mature economies, Q2 2011% of GDP
67
98
82
48
45
81
87
60
105
91
226
81
71
90
111
33
80
83
69
277
87
21
Germany 49 278
279United States
9159
107 93
Italy1 82 31476
Australia
27653 63Canada2
South Korea
72 40
314
France 346111 97
Spain 363134 76
United Kingdom 507109 219
Japan 51299 120

14
of debt. In the United States, Canada, and Australia, household debt is the largest component of overall debt. In Canada and Australia, there are concerns about the high ratio of household debt relative to GDP, even though neither country has experienced a banking crisis.
The distribution of debt within a class of borrowers also matters. Overall US household debt relative to GDP is lower than in many other countries. Nevertheless, a subset of American households—people who were only able to borrow heavily when lending standards were lax—now carry unsustainable debt burdens.
By itself, a nation’s total debt-to-GDP ratio can be an unreliable gauge of debt sustainability. Among the eurozone-crisis countries in 2011, for example, only Ireland has very high total debt—663 percent of GDP (Exhibit 3). In Greece and Italy, overall leverage is moderate, but the ratio of government debt to GDP is notably higher than in other mature countries. Corporations and households in Spain and Portugal have unusually high ratios of debt to GDP, but these countries entered the financial crisis with relatively modest government debt. Despite their differences, all five countries now face high government borrowing costs due to their weak growth prospects.15
Today, overall debt levels in emerging markets are far lower than those in developed economies,16 although this does not mean that developing nations are now immune to potential debt issues. While the total debt-to-GDP ratio among the ten largest advanced economies averaged 348 percent at the end of 2010, the ratio was 184 percent in China, 148 percent in Brazil, 122 percent in India,
15 Note that the ratio of total debt to GDP is not a measure of sovereign risk: the majority of total debt in any country is owed not by the government, but by private borrowers. Many other factors beyond the ratio of government debt to GDP go into assessing sovereign risk.
16 For more detail on emerging markets, see Mapping global capital markets 2011, McKinsey Global Institute, August 2011 (www.mckinsey.com/mgi).
Exhibit 3
77
62
45
94
82
124
100
132
111
79
71
85Ireland2 663194 259
Spain 363134 76
Portugal2 356128 55
Italy2 31482 76
Greece 26765 7
33982 80
Apart from Ireland, countries associated with the eurozone crisis do not have high levels of overall debt
SOURCE: Haver Analytics; national central banks; McKinsey Global Institute
1 Average of ten largest mature economies: United States, Japan, Germany, France, United Kingdom, Italy, Canada, Spain, Australia, and South Korea.
2 Q1 2011 data.NOTE: Numbers may not sum due to rounding.
Total debt, Q2 2011% of GDP
Mature economy average1
Higher than mature economy average
Households
Nonfinancial corporations
Financial institutions
Government

15Debt and deleveraging: Uneven progress on the path to growthMcKinsey Global Institute
and 72 percent in Russia. This in part reflects the state of development of their financial systems. Even now, however, there may be unsustainable pockets of leverage developing in these countries. Lending in China increased by $1.2 trillion in 2010, a rate of credit growth that raises concerns about the quality of underwriting and the potential for future credit losses.17
Two phasEs of dElEvEraGInG
In our research into historic episodes of deleveraging, we see that countries often progress through two distinct, yet overlapping, phases of private- and public-sector deleveraging. Today’s deleveraging economies face what seems to be a uniquely difficult situation: a weak global economy, banking troubles across many major economies, and little room for fiscal maneuvering. Yet, they share many of the same challenges that faced deleveraging nations in the past.
The way debt reduction played out in Sweden and Finland in the 1990s provides a useful frame of reference. In those countries, bank deregulation in the 1980s led to a credit boom and soaring household borrowing, which in turn fueled real estate and equity market bubbles. In 1990, for different reasons in each country, the bubbles collapsed and their currencies sharply depreciated, sending both economies into deep recessions.18 They faced enormous challenges, including the first attempts to reduce popular social programs and deregulate commercial sectors such as retail. Ultimately, Sweden and Finland addressed their debt problems, adopted structural reforms, and went on to experience more than a decade of robust economic growth.
As economists and other experts we interviewed have stressed, in the midst of these Nordic deleveraging episodes, neither policy makers nor business leaders were certain about the outcome or which measures would lead to the best results. In hindsight, however, we see that both economies went through a distinct, initial phase of deleveraging in the private sector, leading to a second phase of growth and public-sector deleveraging.
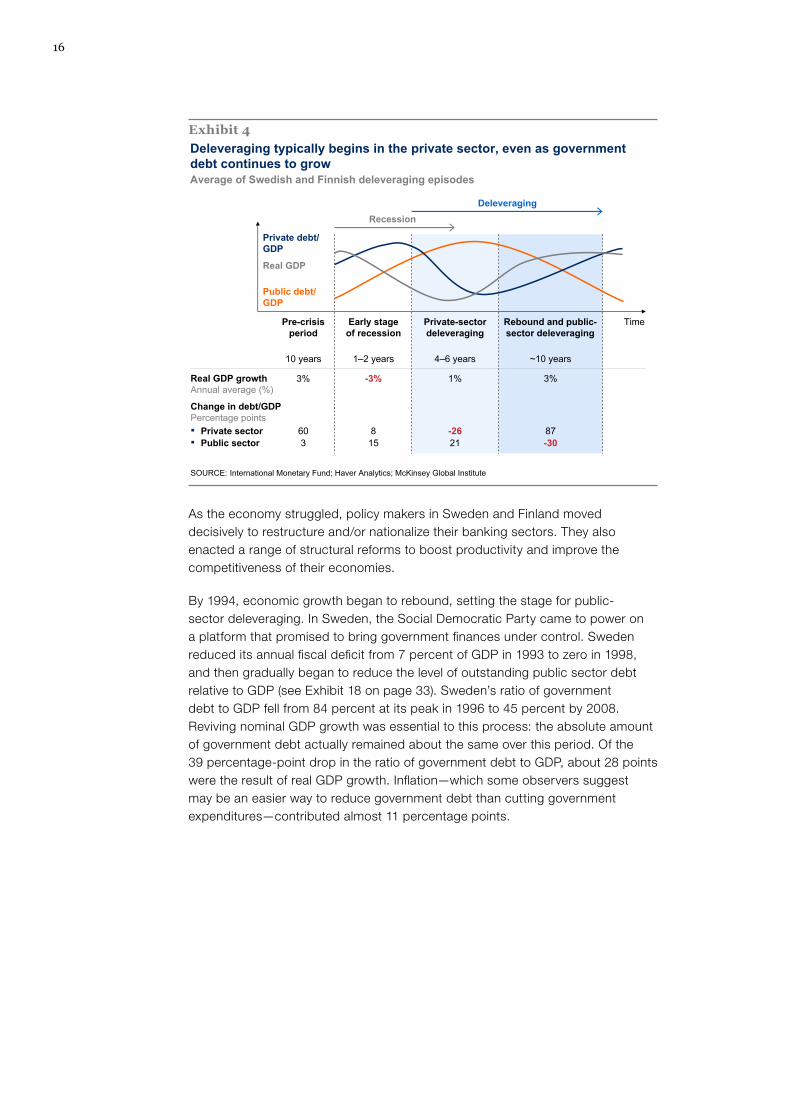
During the first phase of deleveraging, households, corporations, and financial institutions all reduced their debt over several years—a painful period, with little or no real GDP growth and rising government debt. The ratio of private-sector debt to GDP declined by about one-fourth. The household portion declined even more sharply, aided in Sweden by inflation: rapidly rising prices drove nominal GDP growth so that the ratio of household debt to GDP declined without any significant reduction in outstanding household debt. This was also a time of negligible economic growth, in which tax revenues fell and public expenditures grew to support the economy. As a result, government debt rose sharply, growing from 46 percent of GDP to 83 percent in Sweden from 1990 to 1994, and from 14 percent to 57 percent of GDP in Finland over the same period (Exhibit 4).
17 Ibid.
18 For more detail on these episodes, see the appendix.
16
As the economy struggled, policy makers in Sweden and Finland moved decisively to restructure and/or nationalize their banking sectors. They also enacted a range of structural reforms to boost productivity and improve the competitiveness of their economies.
By 1994, economic growth began to rebound, setting the stage for public-sector deleveraging. In Sweden, the Social Democratic Party came to power on a platform that promised to bring government finances under control. Sweden reduced its annual fiscal deficit from 7 percent of GDP in 1993 to zero in 1998, and then gradually began to reduce the level of outstanding public sector debt relative to GDP (see Exhibit 18 on page 33). Sweden’s ratio of government debt to GDP fell from 84 percent at its peak in 1996 to 45 percent by 2008. Reviving nominal GDP growth was essential to this process: the absolute amount of government debt actually remained about the same over this period. Of the 39 percentage-point drop in the ratio of government debt to GDP, about 28 points were the result of real GDP growth. Inflation—which some observers suggest may be an easier way to reduce government debt than cutting government expenditures—contributed almost 11 percentage points.
Exhibit 4Deleveraging typically begins in the private sector, even as government debt continues to grow Average of Swedish and Finnish deleveraging episodes
SOURCE: International Monetary Fund; Haver Analytics; McKinsey Global Institute
1–2 years 4–6 years ~10 years10 years
Real GDP
RecessionDeleveraging
Early stage of recession
Private-sector deleveraging
Pre-crisis period
Real GDP growthAnnual average (%)
-3% 1% 3%3%
Change in debt/GDPPercentage points
8 -26 8760
Private debt/ GDP
▪ Private sector15 21 -303
Public debt/ GDP
Rebound and public-sector deleveraging
▪ Public sector
Time

17Debt and deleveraging: Uneven progress on the path to growthMcKinsey Global Institute
Finland took a slightly different course from Sweden’s in the early years. It attempted to implement fiscal austerity in 1992,19 before its economy had recovered from a recession that was far more severe than Sweden’s. Some observers believe this attempt to cut government spending was premature, contributing to the sharp rise in unemployment and prolonging recovery.20 Finland’s economy began growing again in 1994, aided in part by the sharp devaluation of its currency. It went on to gradually reduce its government debt, from 56 percent of GDP in 1995 to 34 percent in 2008. Over this period, the absolute amount of government debt outstanding actually increased, although less than nominal GDP did. Faster real GDP growth accounted for more than two-thirds of the decline in the ratio of government debt to GDP, while inflation contributed the remainder.
ThrEE counTrIEs, dIffErEnT spEEds
In our 2010 report, we identified the private sectors of the United States, the United Kingdom, and Spain as being most likely to deleverage. Today, we find that all three countries have begun to reduce private-sector debt, although at very different speeds and with very different results.
Determining how much private sector deleveraging is needed in any country is difficult. Unlike government debt, where there is significant empirical evidence about what constitutes a sustainable debt level,21 no guidelines exist for private-sector debt. Switzerland, for example has a far higher ratio of household debt to GDP than the United States (118 percent versus 87 percent), but there is no pressure for Swiss households to shed their debt. This is because Swiss lenders are conservative and most mortgage borrowers have high incomes; the home ownership rate is only around 35 percent. Moreover, these households have significant financial assets to pay their liabilities if needed.
To assess the future outlook for private-sector deleveraging, we therefore look at several measures of debt sustainability. These include comparing the level of debt and debt service ratios with their pre-crisis trends and measuring progress in deleveraging against the historic episodes of Sweden and Finland. We find that US households may have as little as two more years of deleveraging ahead, while the United Kingdom and Spain are likely to see many more years of gradual private-sector deleveraging.
19 In 1992, the ruling Centre Party began a program to trim government deficits, but lost the elections in 1994 to the Social Democratic Party, which then introduced its own austerity program. See Alberto Alesina, Dorian Carloni, and Giampaolo Lecce, “The electoral consequences of large fiscal adjustments,” NBER Working Paper Number 17655, November 2011.
20 For an examination of this point, see Jaakko Kiander and Pentti Vartia, “Lessons from the crisis in Finland and Sweden in the 1990s,” Empirica, 2011, Volume 38.
21 Ninety percent of GDP has been suggested as the limit for sustainable government debt, beyond which growth slows and risks of financial crisis and default rise. See Carmen M. Reinhart and Kenneth S. Rogoff, This time is different: Eight centuries of financial folly (Princeton, NJ: Princeton University Press, 2009); and Stephen G. Cecchetti, M. S. Mohanty, and Fabrizio Zampolli, “The real effects of debt,” Bank for International Settlements Working Paper Number 352, September 2011.
18
The united states: a light at the end of the tunnel
From 1990 to 2008, US private-sector debt rose from 148 percent of GDP to 234 percent (Exhibit 5). Household debt rose by more than half, peaking at 98 percent of GDP in 2008. Debt of nonfinancial corporations rose to 79 percent of GDP, while debt of financial institutions reached 57 percent of GDP.
Since the end of 2008, all categories of US private-sector debt have fallen as a percent of GDP. The reduction by financial institutions has been most striking. By mid-2011 the ratio of financial-sector debt relative to GDP had fallen below where it stood in 2000. In dollar terms, it declined from $8 trillion to $6.1 trillion. Nearly $1 trillion of this decline can be attributed to the collapse of Lehman Brothers, JP Morgan Chase’s purchase of Bear Stearns, and the Bank of America-Merrill Lynch merger. Since 2008, banks also have been funding themselves with more deposits and less debt.
Among US households, debt has fallen by 4 percent in absolute terms, or $584 billion (Exhibit 6). Some two-thirds of that reduction is from defaults on home loans22 and other consumer debt. An estimated $254 billion of troubled mortgages remain in the foreclosure pipeline,23 suggesting the potential for several more percentage points of household debt reduction as these loans are discharged.24 A majority of defaults reflect financial distress: overextended
22 The mortgage charge-off data are unofficial estimates provided by Jim Kennedy at the Federal Reserve Board.
23 This estimate is based on “shadow inventory” data from CoreLogic, which includes seriously delinquent loans, those in the foreclosure pipeline, and those already seized by lenders. We subtract seized loans from CoreLogic’s shadow inventory to count only loans that will affect outstanding levels of household debt.
24 This calculation ignores future growth in disposable income in order to isolate the impact of eliminating the shadow loan inventory.
Exhibit 5The United States has undergone rapid private-sector deleveraging since 2008
9869614843
61
4560
3737
0
50
100
150
200
250
300
350
64
23
208
Q4-1980
5116
Q1 1975
148
5315
220
65
41
Q4-1990
79
57
Q4 2000
Q2 2011
279
87
72
40
80
Q4 2008
296
152
14
29
16
16
75
-7
-11
-17
19
-16
SOURCE: US Federal Reserve Flow of Funds; McKinsey Global Institute
1 Includes all loans and credit market borrowing (e.g., bonds, commercial paper); excludes asset-backed securities to avoid double counting of the underlying loan.
NOTE: Numbers may not sum due to rounding.
Debt1 by sector, 1975–2011% of GDP
Government
Nonfinancial corporations
Financial institutions
Households
ChangePercentage pointsQ4 2000–Q4 2008
Q4 2008–Q2 2011

19Debt and deleveraging: Uneven progress on the path to growthMcKinsey Global Institute
homeowners who lost jobs or faced medical emergencies and found that they could not afford to keep up with payments. Low-income households are affected most by defaults—in areas with high foreclosure rates, the average annual household income is around $35,000, compared with $55,000 in areas with low foreclosure rates.25
Up to 35 percent of US mortgage defaults, it is estimated, are the result of strategic decisions by borrowers to walk away from homes that have negative equity, or those in which the mortgage exceeds the value of the property. This option is more available in the United States than in other countries, because in 11 of the 50 states—including hard-hit Arizona and California—mortgages are nonrecourse loans. This means that lenders cannot pursue other assets or income of borrowers who default. Even in recourse states, US banks historically have rarely pursued nonhousing assets of borrowers who default.26
We estimate that US households could face roughly two more years of deleveraging. As noted above, there is no accepted definition of the safe level of household debt, which might serve as a target for deleveraging. One possible goal is for the ratio of household debt relative to disposable income to return to its historic trend. Between 1952 and 2000, this ratio rose steadily—by about 1.5 percent annually—reflecting growing access to mortgages, consumer credit, student loans, and other forms of credit in the United States. After 2000, growth in household borrowing accelerated, and by 2008, growth in the ratio of household debt to income had climbed more than 30 percentage points above the trend line. By the second quarter of 2011, this ratio had fallen by
25 “The state of the nation’s housing 2011,” Joint Center for Housing Studies of Harvard University, June 2011.
26 Recently, lenders have been more willing to pursue nonhousing assets, where permitted. See Jessica Silver-Greenberg, “House is gone but debt lives on,” The Wall Street Journal, October 1, 2011.
Exhibit 6
126
153
13,258
-584
Q2 2011Other credit1
Consumer credit
153
42
Home mortgages (including home equity loans)
363
Q4 2008
13,842
-4%
US household debt has fallen in absolute terms; two-thirds has been due to defaultsHousehold debt, Q4 2008–Q2 2011$ billion
SOURCE: US Federal Reserve; McKinsey Global Institute
1 “Other credit” comprises commercial mortgages, other bank loans, other loans and advances, and municipal securities.NOTE: Numbers may not sum due to rounding.
Home mortgages
Consumer credit
Home equity loansOther credit1
Q2 2011
13,258
9,053
2,402
924879
Default
Repayment

20
15 percentage points. At the current rate of deleveraging, it could return to trend by mid-2013 (Exhibit 7).
In the wake of a highly destructive financial crisis, it is reasonable to ask whether a continuous upward trend in household borrowing is sustainable. A more conservative goal for US household deleveraging, then, might be to aim for a return to the ratio of debt relative to income of 2000, before the credit bubble.27 This would require a reduction of 22 percentage points from the ratio of mid-2011. Another comparison is with Swedish households in the 1990s, which reduced household debt relative to income by 41 percentage points. By this measure, US households are a bit more than one-third of the way through deleveraging (Exhibit 8).
Another way to gauge progress in household deleveraging is to look at the household debt service ratio. This ratio in the United States has declined from 14 percent of disposable income at the peak in 2007 to 11.5 percent—well below where it stood in 2000. Some of the progress on this metric reflects very low prevailing interest rates, but it is nevertheless a sign that US households are moving in the right direction. It should also be noted, however, that the rate of deleveraging and the strength of recovery vary considerably across the country (see Box 1, “Multispeed recovery in the United States”).
27 We use 2000 for the pre-crisis baseline comparisons throughout.
Exhibit 7
SOURCE: US Federal Reserve; CoreLogic; Haver Analytics; McKinsey Global Institute
40
50
60
70
80
90
100
110
120
130
-15 p.p.
Q22013
05200095908580757065601955
Projected1
Trend line based on 1955–2000 data
HistoricalThe US household debt ratio could return to its long-term trend in 2013
1 This is based on estimates of the foreclosure pipeline in Q2 2011 and ignores future growth in disposable income.
Household debt% of disposable personal income, seasonally adjusted

21Debt and deleveraging: Uneven progress on the path to growthMcKinsey Global Institute
Even after US consumers finish deleveraging, they probably won’t be as powerful an engine of global growth as they were before the crisis. That’s because they no longer have easy access to home equity loans and cash-out refinancing. From 2003 to 2007, US consumers extracted $2.2 trillion of equity from their homes, but since then home prices have fallen and lending standards have tightened. We calculate that without the extra consumption that home equity extraction enabled,28 growth in real consumption would have averaged around 2 percent annually, a percentage point lower than the actual growth rate for that period. In the third quarter of 2011, US consumer spending grew 2 percent on an annualized basis, which may be close to the steady state that can be expected in coming years.
Government debt has risen rapidly in the United States since the crisis, due to the sharp decline in tax revenue and increases in automatic spending for items such as unemployment benefits.29 Because the United States entered the financial crisis with growing deficits, government debt—including that of federal, state, and local governments—has reached its highest level as a percent of GDP since World War II. The next phase of the deleveraging process, in which the government begins the arduous process of reducing deficits and then debt itself, requires difficult political choices that policy makers have thus far been unable to make.
28 An estimated 20 percent of the money from home equity loans and cash-out refinancings was spent on consumption.
29 Falling tax receipts due to lower output account for an estimated 40 percent of the incease in public debt in G-7 economies since the crisis; fiscal stimulus and assistance to the financial sector account for 30 percent. See Carlo Cottarelli and Andrea Schaechter, “Long-term trends in public finances in the G-7 economies,” IMF Staff Position Note 10/13, September 2010.
Exhibit 8
SOURCE: Haver Analytics; Statistics Sweden; McKinsey Global Institute
Credit boom Deleveraging
NOTE: 2011 figures are as of Q2 2011.
Spain (Year 0 = 2007)
United States(Year 0 = 2008)
United Kingdom(Year 0 = 2008)
Sweden (Year 0 = 1988)
Household debt% of disposable income
-8 -7 -6 -5 -4 -3 -2 -1 0 1 2 3 4 5 6 7 8 9
90
80
160
150
140
130
120
110
100-41 p.p.
-10 p.p.
-6 p.p.-15 p.p.
70
0
US households are about one-third of the way to the Swedish level of debt reduction
Peak household
debt
Years

22
box 1. Multispeed recovery in the united states
During the credit boom, levels of debt accumulation and housing price increases varied widely across the United States. Now there are significant differences in the rate of economic recovery across regions, too. For business leaders operating in the United States, understanding these regional differences will be important.
Not surprisingly, states where the real estate bubble was largest are struggling with the economic aftermath. As of Q3 2011, in Nevada, 58 percent of mortgages exceed current home values; in Florida, the figure is 44 percent. These states also have among the highest ratios of household debt to income (Exhibit 9). This not only results in higher foreclosure rates but also contributes to above-average unemployment. Moody’s Analytics predicts that real output will not return to its pre-crisis level before 2014 in Nevada and 2013 in Florida.1
By contrast, in Texas, real output was back to its pre-crisis level by 2009, unemployment is below the national average, and household debt is low. In New York, real output returned to the pre-crisis level in 2010, and unemployment is around 8 percent. In both states, the share of homes with negative equity is well below the 22 percent national average (10 percent in Texas, 6 percent in New York).
The performance of cities varies as well. Real output has recovered to pre-crisis levels in 65 of the largest metropolitan statistical areas, but other cities are unlikely to regain pre-crisis output before 2014.
1 Based on regional output data from Moody’s Analytics, December 2011.
Exhibit 9Household debt levels vary significantly across US states
Debt, 2000% of disposable income
7993100107
120
153
176186
789190
98108
130
157160
Nevada TexasNew YorkMichiganIllinoisFloridaArizonaCalifornia
2010
2008
SOURCE: Federal Reserve; Bureau of Economic Analysis; McKinsey Global Institute
Household debt1
% of disposable income, annual average
1 Household debt balances by state are estimated by the Federal Reserve of New York based on the population with a credit report. We estimate household debt to disposable income by state using additional data from the BEA. The average across states based on this data does not match US Flow of Funds data used elsewhere in this report.
101 90 68 6272 617183

23Debt and deleveraging: Uneven progress on the path to growthMcKinsey Global Institute
The united Kingdom: deleveraging has just begun
In the United Kingdom, total debt has risen continuously since the 2008 financial crisis. In mid-2011, total UK debt stood at 507 percent of GDP, up from 487 percent at the end of 2008 and 310 percent before the bubble (Exhibit 10). Nonfinancial corporate debt, as a share of GDP, has declined since 2008, although it remains 31 percentage points above its 2000 level. The financial sector has continued to issue more debt, which rose from 209 percent of GDP in 2008 to 219 percent in mid-2011. UK banks have significantly improved capital ratios by reducing lending and raising capital, and they replaced short-term debt funding with longer-term debt.30 Nonbank financial institutions have been responsible for the increase in financial-sector debt. Overall, the UK financial sector remains heavily exposed to the euro crisis, particularly loans to private borrowers in countries at the heart of the crisis (Exhibit 11).
30 The largest UK banks (Barclays, RBS, and Lloyds) combined have shrunk their assets by 30 percent from 2008 to 2010, while adding $48 billion (23 percent) to their capital base.
Exhibit 10UK financial sector and government borrowing has continued to grow since 2008
103696551
48
0
100
200
300
400
500
600
Q4 1995
61
80
47253
Q2 2011
507
98
109
219
81
Q4 2008
487
122
209
53
Q4 2000
310
78
189 122
43
Q1 1987
47
42
45
34
87
11
177
-14
-5
11
28
20
SOURCE: Haver Analytics; UK Office for National Statistics; McKinsey Global Institute
1 Includes all loans and credit market borrowing (e.g., bonds, commercial paper); excludes asset-backed securities to avoid double counting of the underlying loan.
NOTE: Numbers may not sum due to rounding.
Debt1 by sector, 1987–2011% of GDP Households
Nonfinancial corporations
Financial institutions
Government
ChangePercentage pointsQ4 2000–Q4 2008
Q4 2008–Q2 2011

24
UK households have reduced debt loads only slightly so far, with the ratio of debt to disposable income declining from 156 percent in 2008 to 146 percent in mid-2011. This level is still significantly higher than that of US households at the bubble’s peak. UK household debt has grown slightly, in absolute terms, since 2008. Residential mortgage lending has continued to expand, albeit slowly, and this new debt has been only partially offset by a £25 billion decline in consumer credit. We find that at the recent rate of deleveraging, the ratio of UK household debt to disposable income would not return to its pre-bubble trend for another decade.31
Slower household deleveraging in the United Kingdom can be attributed in part to the relatively small number of troubled mortgages that have progressed to foreclosure. That picture could change: the Bank of England estimates that up to 12 percent of all UK mortgages are in some state of forbearance; an additional 2 percent are delinquent.32 This implies that the United Kingdom may have about the same proportion of loans that are in some degree of difficulty as the United States has—14 percent of mortgages outstanding (Exhibit 12). The problem could deepen in the years to come, particularly if economic growth remains weak or interest rates rise sharply. Two-thirds of UK mortgages have floating interest rates, and monthly debt payments of UK households as a share of income are already one-third higher than those in the United States. On top of this, 23 percent of UK households report that they are “somewhat” or “heavily” burdened in paying off unsecured debt.33
31 The Office for Budget Responsibility predicts even slower rates of household deleveraging and anticipates no reduction in the household debt-to-disposable income ratio through 2016. See Office for Budget Responsibility, “Economic and fiscal outlook,” November 2011.
32 The true extent of troubled mortgages in the United Kingdom is not known, as banks are not required to report publicly or to regulators the number of mortgages in forbearance.
33 2010 NMG Consulting survey of UK households.
Exhibit 11
Net direct exposure1 to debt of Greece, Italy, Ireland, Portugal, and SpainBanks participating in ECB stress test$ billion
UK banks are highly exposed to the private debt of eurozone-crisis economies
143638
7435
12065
186
115194252
105
173
294
507
Italy2Nether-lands
DenmarkCyprusBelgiumSpain2GermanyUnited Kingdom
France
Private sector
Sovereign
SOURCE: European Banking Authority; McKinsey Global Institute
1 Net direct exposure defined as gross cash long minus gross cash short.2 Excludes exposure to domestic debt.

25Debt and deleveraging: Uneven progress on the path to growthMcKinsey Global Institute
The United Kingdom diverges from the Swedish path not only in its slow rate of household debt reduction relative to GDP, but also in its decision to make reducing public debt a high priority early in the deleveraging process. However, like the United States, the United Kingdom entered the financial crisis with a deficit and growing government debt. By contrast, Sweden entered its crisis with a government fiscal surplus and Finland entered with low government debt. Moreover, the Nordic countries did not operate in an environment of heightened concern about sovereign risk. Today, the UK government appears to have little if any fiscal headroom—although this remains a matter of debate among economists.34 How the current UK approach affects the economy’s ability to move on to the second, growth-led phase of deleveraging remains to be seen. Another question hanging over the UK recovery is how evenly growth is spread. The London region generated half of GDP growth in the decade leading up to the crisis and continues to grow more quickly than the rest of the nation. To contain and then reduce government debt over many years, the United Kingdom will need more broad-based growth.
Examining the net saving position of different sectors of the UK economy helps explain the need to restore UK private-sector investment and contain government debt. Exhibit 13 shows the sharp rise in net saving by the UK private sector in the aftermath of the crisis. Households switched from being large borrowers to becoming net lenders to the rest of the economy and, in the process, reduced consumption. At the same time, public-sector borrowing has grown rapidly because of falling tax revenue, rising automatic payments, and the bailout of troubled banks. If the government is to meet its goal of eliminating the structural deficit, either the current account balance must improve dramatically (to levels
34 The UK’s Office for Budget Responsibility forecasts net government debt to peak at 78 percent of GDP in fiscal year 2014/15, and gross debt to peak at a little over 90 percent of GDP. Sweden’s gross debt peaked at 83 percent of GDP. For a discussion of additional capacity for government borrowing, see Jonathan D. Ostry, Atish R. Ghosh, Jun I. Kim, and Mahvash S. Qureshi, “Fiscal Space,” IMF Staff Position Note, SPN/10/11, September 1, 2010.
Exhibit 12
Number of residential mortgages in difficulty% of total residential mortgage loans
The share of UK mortgage holders in some difficulty is similar to that in the United States
United States1
United Kingdom2 14.22.2 12.0
14.24.5 8.3 1.4
In forbearance
In foreclosure
Delinquent
1 US data as of Q1 2011. Forbearance is estimated for August 2011 based on loan modifications under the US Home Affordable Modification Program (HAMP). Delinquency data represent mortgages more than 30 days delinquent.
2 UK delinquency data are as of Q2 2011 and represent mortgage loans more than 1.5 percent in arrears. Estimates for forbearance are worst-case estimates from the Bank of England Financial Stability Report, June 2011.
SOURCE: Mortgage Bankers Association; Bank of England; McKinsey Global Institute

26
not seen in the past decade) or the private sector must spend more. This could be achieved through higher investment by private firms, since nonfinancial businesses have the largest saving surplus of any UK sector. Or consumers could start borrowing even more as the government reduces its deficits—but that would be risky, given the continuing high levels of consumer debt.
spain: The long road ahead
Spain faces a particularly difficult challenge in reducing debt, since it is constrained in its ability to use fiscal or monetary policy to revive growth. After Spain adopted the euro in 1999, its interest rates fell by approximately 40 percent as lending rates moved closer to the European average. As a result, lending soared and Spain’s already rapid growth accelerated. Nominal GDP grew 8 percent annually from 2000 to 2007. A housing and construction boom produced five million new residential units between 1997 and 2007—a roughly 25 percent increase in supply. Over the same period the number of Spanish households increased by 2.5 million, from 13 million to 15.5 million.35 Household and corporate debt grew significantly from 2000 to 2008, reaching 85 percent of GDP for households and 137 percent of GDP for nonfinancial corporations.
Spain’s private-sector debt has fallen only slightly since the financial crisis began and Spain’s total debt has continued to climb (Exhibit 14). Although Spain’s government debt stood at a modest 47 percent of GDP in 2008, reflecting eight years of a decline in the ratio of government debt to GDP, it has increased by 24 percentage points since then. Spain’s ratio of household debt to disposable income has fallen by 6 percentage points; in absolute terms, outstanding household debt has declined by 3 percent. As in the United Kingdom, home mortgages have continued to grow while consumer credit has fallen sharply.
35 Spanish net immigration was substantial over the same period—around 4 million net migrants in total from 2002 to 2007.
Exhibit 13UK public borrowing has increased dramatically since the crisis;households have become net lenders to the economy
1 Includes nonprofit institutions serving households.SOURCE: UK Office for National Statistics; McKinsey Global Institute
-12
-10
-8
-6
-4
-2
0
2
4
6
Rest of world
Government
Households1
Financial institutions
Nonfinancial corporations
Q2 2011
Q4 2008
Q4 2006
Q4 2004
Q4 2002
Q4 2000
Net borrowing and lending, Q4 2000–Q2 2011% of GDP, four-quarter moving average

27Debt and deleveraging: Uneven progress on the path to growthMcKinsey Global Institute
Spain’s official mortgage default rate remains relatively low, but more trouble may lie ahead for Spanish households. Spain’s unemployment rate is 21.5 percent, up from 9 percent in 2006. For now, households continue to make payments to avoid the country’s stringent recourse laws, which allow lenders to go after borrowers’ assets and income for a long period.
Spain, unlike most other developed economies, also faces a very significant deleveraging challenge in its corporate sector. The debt of nonfinancial corporations nearly doubled relative to GDP during the boom, from 74 percent of GDP in 2000 to 137 percent in 2008. It has dropped only slightly to 134 percent of GDP since then. High corporate debt ratios are partly due to the growth of Spain’s real estate and construction sectors, but leverage is also high across such industries as manufacturing, energy, utilities, and tourism and hospitality. In real estate and construction, the ratio of debt to gross operating profit is more than 50 percent higher in Spain than in a weighted average of eurozone economies. In the tourism and hospitality sector, this ratio is more than twice as high in Spain as in other European countries. Spanish corporations hold 20 percent more debt relative to national output than French and UK companies, twice as much as US companies, and three times as much as firms in Germany (Exhibit 15). Debt reduction in Spain’s corporate sector may weigh on growth in the years to come.
Exhibit 14Spain’s private debt grew rapidly after 2000; public debt has grown faster since 2008
854530
47
63
40
0
100
200
300
400
Q2 2011
363
82
134
76
71
Q4 2008
337
137
68
Q4 2000
192
7410
Q4 1990
131
1249
64
40
58
-16
145
-4
-3
8
24
26
SOURCE: Haver Analytics; McKinsey Global Institute
1 Includes all loans and credit market borrowing (e.g., bonds, commercial paper); excludes asset-backed securities to avoid double counting of the underlying loan.
NOTE: Numbers may not sum due to rounding.
Debt1 by sector, 1990–2011% of GDP Households
Financial institutions
Nonfinancial corporations
Government
ChangePercentage pointsQ4 2000–Q4 2008
Q4 2008–Q2 2011

28
The prospects for Spain’s banking sector remain uncertain. The country’s smaller regional banks, the cajas, are heavily exposed to local real estate markets, and housing price declines have left many loans in trouble. Of the eight banks that failed the European Banking Authority’s stress tests in 2011, five were Spanish and failed largely due to their exposure to real estate. The Bank of Spain estimates that banks hold €340 billion in loans connected to real estate development, and as many as half of these loans may be in trouble.36 Spain’s new center-right government, elected in November 2011, has announced new austerity measures and has signaled its intention to address lingering issues in the financial sector, including recognizing losses related to the real estate bubble.
Spain’s deleveraging challenge is complicated by its restricted range of policy options. Private investors have grown nervous about Spain’s growth prospects, and its borrowing costs have soared; it therefore does not have the option to further increase public debt to stimulate growth. As part of the eurozone, Spain also cannot benefit from currency depreciation to stimulate exports, as occurred in Sweden and Finland.
This leaves structural reforms that boost productivity and private-sector competitiveness as the only real option to revive growth.37 Given the continuing rigidities in the Spanish economy, such structural reforms offer a good long-term prospect for unlocking significant growth. The first priority is to improve performance in tradable goods and tourism, both key strategic sectors for the Spanish economy. Tradable goods, such as food, tobacco, textiles, paper, chemicals, and automotive goods account for more than 65 percent of Spain’s
36 This does not include home mortgages, and is mainly loans to real estate developers. Troubled loans include nonperforming loans, substandard loans (loans that are performing but are considered at risk of not performing), and foreclosures. See Bank of Spain, Financial Stability Report, November 2011.
37 McKinsey & Company and FEDEA, A growth agenda for Spain, December 2010.
Exhibit 15
-5-1
-714
-128
-1445421
-464
150
140
130
120
110
90
80
70
60
50
0
Japan
United States
United Kingdom
Spain
Italy1
Germany
France
Q2 2011
Q4 2008
Q4 2006
Q4 2004
Q4 2002
Q4 2000
100
SOURCE: Haver Analytics; national central banks; McKinsey Global Institute
The debt levels of Spanish corporations grew dramatically from 2000 to 2008
0-26
1 Data through Q1 2011.
Total debt of nonfinancial corporations, Q1 2000–Q2 2011% of GDP Change
Percentage pointsQ4 2000–Q4 2008
Q4 2008–Q2 2011

29Debt and deleveraging: Uneven progress on the path to growthMcKinsey Global Institute
total exports. Meanwhile, tourism accounts for 7 to 8 percent of GDP and 6 percent of all jobs.
Labor reforms, including the decentralization of collective bargaining agreements, could lift performance across tradable goods and other important sectors. Relaxation of regulatory barriers is needed to encourage entry and exit of firms and create an environment more conducive to entrepreneurship. Investing in education and vocational training is needed to raise the competitiveness of Spain’s workforce. Since coming to power at the end of 2011, the new Spanish government has signaled its intent to act decisively on these issues. Further banking reform is also needed. A wave of banking reforms is under way, but more needs to be done. Spain's new finance minister suggested in January 2012 that the banking sector will need to provision an additional €50 billion of capital to absorb losses on its troubled real estate loans.
condITIons for GrowTh In a TIME of dElEvEraGInG
Reviving GDP growth is essential for starting the second phase of deleveraging, in which public-sector deleveraging begins. But growth in times of deleveraging requires more than a cyclical upturn in demand. Both Sweden and Finland made important structural changes to shift their economies from relying mostly on consumption to a new growth model in which exports, investment, and consumption were more balanced. Such a shift has not yet fully taken place in today’s deleveraging economies.
The scale of the challenge for nations like the United States, the United Kingdom, and Spain is far larger than in Sweden or Finland. For example, Sweden’s ten largest multinational companies accounted for around one-third of exports and were fundamental to its economic recovery; its exports as a share of GDP rose from 33 to 47 percent in just seven years. Moreover, strong global growth in the 1990s aided exports in both Sweden and Finland. But exports equal just 15 percent of GDP in the United States and cannot drive overall growth. Today’s deleveraging economies also face weak global demand. Another important advantage for Sweden and Finland: they entered their crises with government finances in good shape. In the United States and the United Kingdom, public debt was on the rise before the crisis.
There is another critical difference: as we write this report, uncertainty over the resolution of the euro crisis threatens the economic recovery and the successful completion of deleveraging. In most European countries, demand for borrowing by businesses has been weak since 2008, so access to credit has not been an issue. However, a worsening euro crisis could lead to a significant credit contraction in 2012 if banks are unable to obtain funding and then cut back on lending. This would be, in effect, a forced deleveraging of the private sector that would damage the region’s ability to avoid recession.
Against this backdrop, government and business leaders will need to assess the prospects of individual economies and sectors. The historical experience in Sweden and Finland reveals six critical markers that leaders in both the public and private sectors should look for as they evaluate where today’s deleveraging economies are heading and which policy priorities to emphasize. Japan’s experience provides a sobering example of how failure to achieve these conditions can stifle growth (see Box 2, “Lessons from Japan”).

30
box 2. lessons from Japan
Japan provides a cautionary tale for economies today. In the 1980s, a lending boom fueled a dual asset bubble in real estate and equities. Household and corporate debt surged; total debt increased from 243 percent of GDP to 387 percent in a decade. The bubbles collapsed in 1989 and sparked a deep recession, but debt has continued to rise, reaching 512 percent of GDP in mid-2011 (Exhibit 16). Even so, Japan has had very little growth—an outcome that no country wishes to replicate.
Japan’s crisis response stands in sharp contrast to those of Sweden and Finland. Private-sector debt reduction did not begin until nearly eight years after Japan’s crash. The very large debt of nonfinancial businesses meant that companies could not afford to invest in growth, slowing the economic recovery and preventing a stock market rebound. Their impaired loans clogged bank balance sheets, curbing lending and raising uncertainty about the health of the banking system. Neither the public nor the private sectors made the structural changes that would enable growth.
Meanwhile, partly as a result of public investments aimed at stimulating the economy, Japan’s public debt has grown steadily. At 226 percent of GDP, it is nearly double the level of some eurozone-crisis economies. Yet Japan has avoided a sovereign debt crisis, largely because more than 90 percent of the debt is owned by Japanese investors: Japanese banks hold nearly $5 trillion in government bonds, and insurers and pension funds hold $4.5 trillion. But the price—two decades of slow growth—has been high, and the final resolution of Japan’s enormous public debt has yet to come.
Exhibit 16
67746646
18913159
050
100150200250300350400450500550
147
116
387
Q4 1980
243
108
4446
99
118
Q4 2000
436
125
106
Q4 1990
Q2 2011
512
67
99
120
226
Q4 2008
473
-26
-7
12
58
37
-1
0
2
37
39
SOURCE: Haver Analytics; McKinsey Global Institute
1 Includes all loans and credit market borrowing (e.g., bonds, commercial paper); excludes asset-backed securities to avoid double counting of the underlying loan.
NOTE: Numbers may not sum due to rounding.
Debt1 by sector, 1980–2011% of GDP Households
Nonfinancial corporations
Financial institutions
Government
ChangePercentage pointsQ4 2000–Q4 2008
Q4 2008–Q2 2011
Japan’s government debt has grown rapidly since 1990

31Debt and deleveraging: Uneven progress on the path to growthMcKinsey Global Institute
Based on these six markers, we see that the United States is closest to finishing private-sector deleveraging and spurring growth in the second phase of recovery, provided the government can credibly tackle the deficit and housing markets stabilize. The United Kingdom and Spain are still missing additional ingredients for a robust recovery.
Marker 1. Is the banking system stable?
The Swedish and Finnish governments moved quickly to stabilize troubled banks and write down nonperforming assets. In Sweden, three of the top six banks were nationalized, requiring significant public funding. In Finland, the government guaranteed bank deposits and took equity stakes in troubled financial institutions to provide fresh capital. Impaired loans were shifted from bank balance sheets to a government-sponsored entity. These measures inflated public debt in both countries, but decisive resolution of the banking crises was critical to restarting lending and enabling growth in the second phase of deleveraging.
At the start of the 2008 crisis, governments in the United States and the United Kingdom provided liquidity and capital to banks, and they forced mergers and nationalized banks where needed. Spain has been slower to restructure its banking sector. As noted, Spain’s new government is now assessing plans for decisive action, including prompting banks to recognize fully the likely losses from troubled loans. This could lead to a new round of consolidation in the sector.
As a result of decisive action during and since the crisis, the US and UK banking systems are now stabilized. However, both systems face some continuing challenges. For US banks, the biggest question remains the final resolution of mortgages with negative equity and the effects of weak housing markets on their mortgage businesses. More than $250 billion in mortgages remain in the foreclosure pipeline, likely depressing the housing market for several years. Net new mortgage lending only recently turned positive in the United States.
UK banks, meanwhile, are heavily exposed to debt of eurozone-crisis countries, with $359 billion in loans to public and private borrowers in those nations. In addition, UK loan officers surveyed by the Bank of England say they are worried about lending to the corporate sector because of economic uncertainty and tight wholesale funding conditions.38 In contrast to the United States, net new lending to the UK corporate sector has remained negative since the start of the crisis, and continuing weakness in lending is likely to remain a drag on economic growth (Exhibit 17).
38 Bank of England, “Credit conditions survey: Survey results 2011 Q3,” September 2011.

32
Marker 2. Is there a credible plan for long-term fiscal sustainability?
Deleveraging economies need to show that they are serious about addressing public debt, even if the actual cuts do not take place immediately. As Finland discovered, it can be extraordinarily difficult to determine the right moment to begin deficit reduction; moving too aggressively before the economy is out of recession can be perilous. Finland’s fiscal austerity program, launched in 1992 when unemployment was high and the economy still weak, is blamed for having exacerbated the Finnish downturn.39
In Sweden, the Social Democratic Party campaigned on the need for fiscal austerity in 1994 and won the election. As the new government began reducing expenditures, economic growth rebounded strongly (Exhibit 18). It then took several years of gradual deficit reduction to reach a balanced budget by 1998. In the subsequent decade—a time of sustained economic growth—Sweden’s public-sector debt relative to GDP declined by half.
Both the United Kingdom and Spain have already adopted fiscal austerity plans. The United Kingdom’s coalition government came to power in 2010 and embarked on a wide-ranging deficit reduction plan. The aggressiveness of the program is credited with keeping government borrowing rates very low. Yet austerity has been blamed for slowing the United Kingdom’s economic recovery. Unlike in Sweden in the early 1990s, however, the new UK coalition government inherited rising public debt and a large structural deficit. This has led to a debate as to the amount of “fiscal space” in which the UK government can maneuver.40 Moreover, as the eurozone crisis demonstrates, in the current environment, issuers of sovereign debt must demonstrate fiscal restraint to maintain credibility with investors.
39 See Jaakko Kiander and Pentti Vartia, “Lessons from the crisis in Finland and Sweden in the 1990s,” Empirica, 2011, Volume 38, Issue 1: 53–69.
40 See Jonathan D. Ostry, Atish R. Ghosh, Jun I. Kim, and Mahvash S. Qureshi, “Fiscal Space,” IMF Staff Position Note, SPN/10/11, September 1, 2010.
Exhibit 17Lending to US private borrowers has recovered;lending to UK corporations remains negative
SOURCE: US Federal Reserve; Bank of England; McKinsey Global Institute
-30-20-10
0102030
Consumer finance
Home mortgages2
Corporations1
-10
0
10
20
30
Q3 2011
Q1 2011
Q1 2010
Q1 2009
Q1 2008
Q1 2007
Q1 2006
1 Includes SMEs; excludes commercial real estate.2 Excludes home equity loans.
Change in loans outstanding to households and corporations, 2006–11Annualized % change, seasonally adjusted
United States
United Kingdom
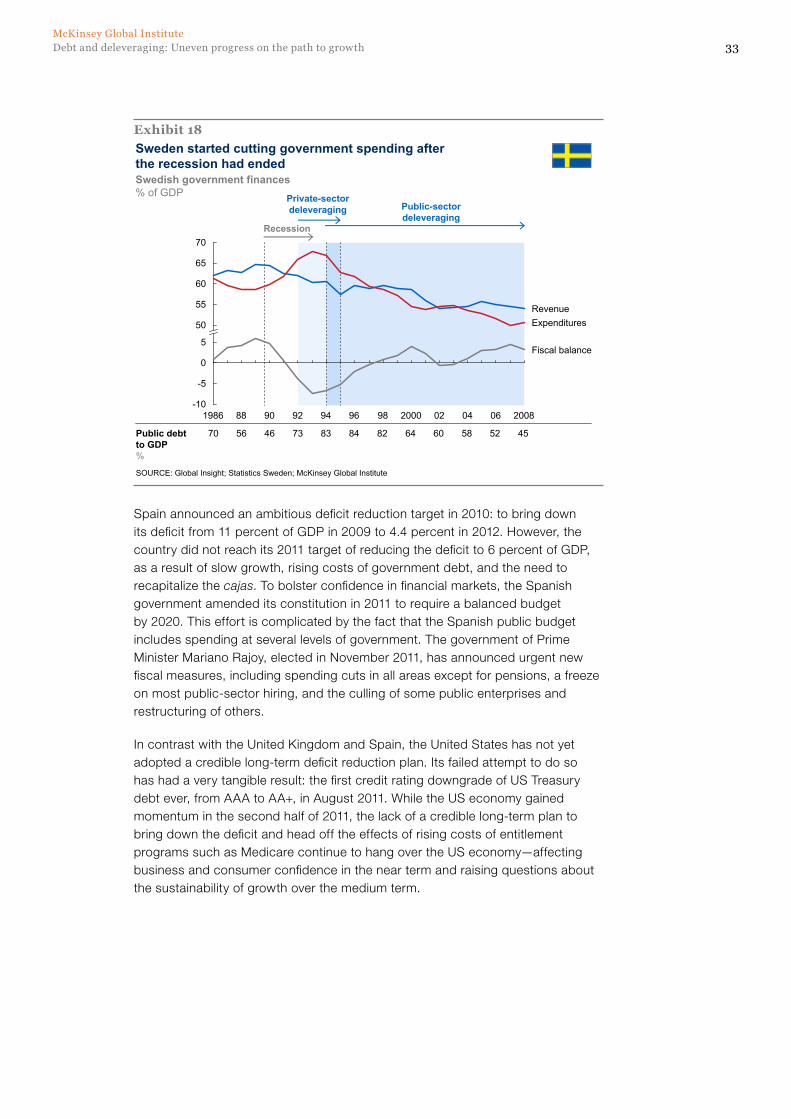
33Debt and deleveraging: Uneven progress on the path to growthMcKinsey Global Institute
Spain announced an ambitious deficit reduction target in 2010: to bring down its deficit from 11 percent of GDP in 2009 to 4.4 percent in 2012. However, the country did not reach its 2011 target of reducing the deficit to 6 percent of GDP, as a result of slow growth, rising costs of government debt, and the need to recapitalize the cajas. To bolster confidence in financial markets, the Spanish government amended its constitution in 2011 to require a balanced budget by 2020. This effort is complicated by the fact that the Spanish public budget includes spending at several levels of government. The government of Prime Minister Mariano Rajoy, elected in November 2011, has announced urgent new fiscal measures, including spending cuts in all areas except for pensions, a freeze on most public-sector hiring, and the culling of some public enterprises and restructuring of others.
In contrast with the United Kingdom and Spain, the United States has not yet adopted a credible long-term deficit reduction plan. Its failed attempt to do so has had a very tangible result: the first credit rating downgrade of US Treasury debt ever, from AAA to AA+, in August 2011. While the US economy gained momentum in the second half of 2011, the lack of a credible long-term plan to bring down the deficit and head off the effects of rising costs of entitlement programs such as Medicare continue to hang over the US economy—affecting business and consumer confidence in the near term and raising questions about the sustainability of growth over the medium term.
Exhibit 18Sweden started cutting government spending after the recession had ended
SOURCE: Global Insight; Statistics Sweden; McKinsey Global Institute
Swedish government finances% of GDP
70 56 73 83 84 82 6064 58 5246Public debt to GDP%
Recession
Private-sector deleveraging Public-sector
deleveraging
45
65
60
55
50
5
0
-5
-10
Fiscal balance
ExpendituresRevenue
2008060402200098
70
96949290881986

34
Marker 3. are structural reforms in place to unleash private-sector growth?
In the 1990s, Sweden and Finland implemented structural reforms, including deregulation in retail and banking, to boost competitiveness. Both countries also joined the European Union in 1995, leading to higher foreign direct investment and greater economies of scale for their industries.41 Together these changes unleashed growth by increasing competition within the economy and raising productivity. From 1992 to 2004, Sweden’s private-sector productivity growth rose to 3.3 percent annually, a much higher rate than in most European countries. Japan, which did not adopt structural reforms to boost productivity after its crisis, has experienced low productivity growth in the past two decades.42
Today’s deleveraging economies need their own structural reforms to raise productivity growth. They should start by making it easier to set up and expand businesses to create jobs and put unemployed people back to work. The United States should encourage business expansion by speeding up regulatory approvals for business investment, particularly by foreign companies, and by simplifying the corporate tax code and lowering marginal tax rates in a revenue-neutral way. Business leaders also say that the United States can improve infrastructure and the skills of its workforce43 and do more to encourage innovation.
The United Kingdom should make revising its planning and zoning rules a priority, which would accelerate home building and enable successful high-growth cities to expand. MGI has argued previously that, given the urgent need to spread growth across the United Kingdom, it is time to experiment with shifting more financial and development responsibility back to cities. This could include the option to negotiate public-sector pay locally.44 To promote productivity and keep the United Kingdom attractive to multinational companies, the nation should also invest in infrastructure and ensure that immigration policy does not limit the ability of companies to attract the skills that they need to remain internationally competitive.45
When it assumed power at the end of 2011, the new Spanish government committed to structural reforms to boost competitiveness. One easy target: business regulations. For example, on the World Bank’s “Doing Business” survey, Spain ranks 133 out of 183 countries in ease of opening a new business. Prime Minister Rajoy has already announced one measure to stimulate entrepreneurship—tax concessions for small companies, set to be introduced by March 2012. The creation of larger companies should also be promoted, since
41 See Kalle Bengtssom, Claes Ekstrom, and Diana Farrell, “Sweden’s growth paradox,” McKinsey Quarterly, June 2006; and Sweden’s economic performance: Recent developments, current priorities, McKinsey Global Institute, May 2006 (www.mckinsey.com/mgi).
42 See Why the Japanese economy is not growing: Micro barriers to productivity growth, McKinsey Global Institute, July 2000 (www.mckinsey.com/mgi).
43 See Growth and renewal in the United States: Retooling America’s economic engine, McKinsey Global Institute, February 2011; and Growth and competitiveness in the United States: The role of its multinational companies, McKinsey Global Institute, June 2010. Both are available at www.mckinsey.com/mgi.
44 The UK government recently pledged to create an independent commission to consider how public-sector pay can be made more responsive to local labor markets. See UK Treasury, “Autumn Statement 2011,” November 2011.
45 See From austerity to prosperity: Seven priorities for long-term growth in the United Kingdom, McKinsey Global Institute, November 2010 (www.mckinsey.com/mgi).
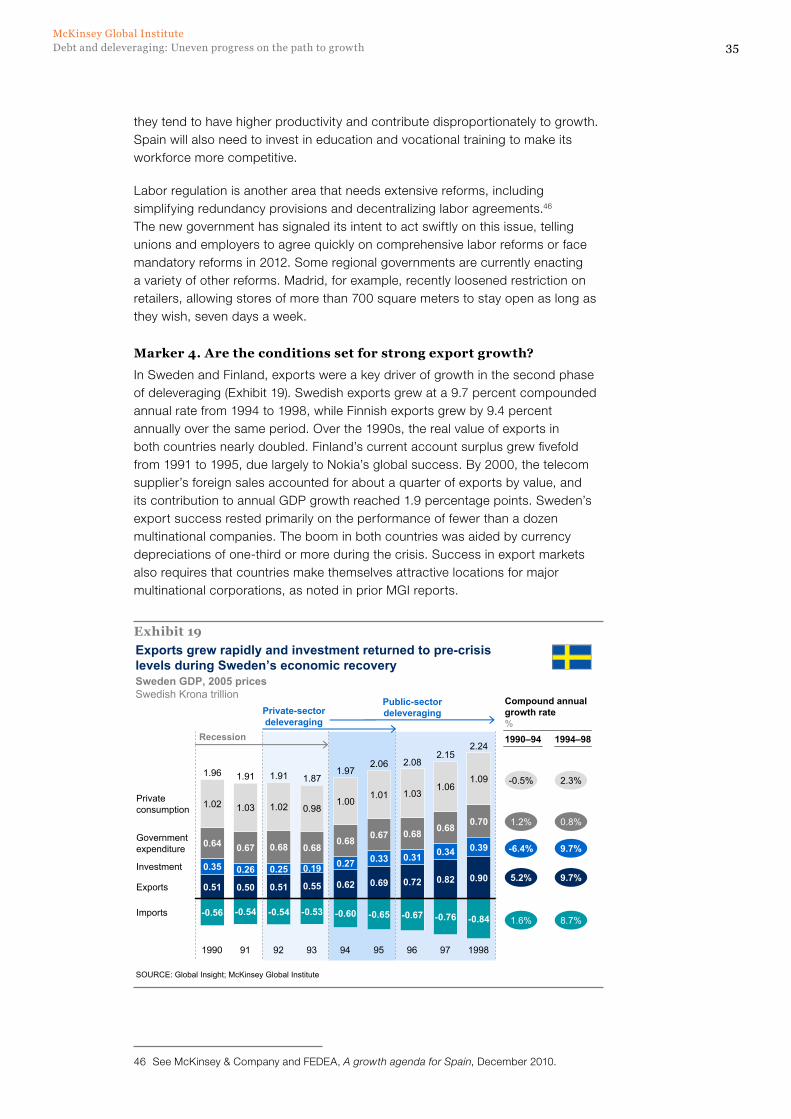
35Debt and deleveraging: Uneven progress on the path to growthMcKinsey Global Institute
they tend to have higher productivity and contribute disproportionately to growth. Spain will also need to invest in education and vocational training to make its workforce more competitive.
Labor regulation is another area that needs extensive reforms, including simplifying redundancy provisions and decentralizing labor agreements.46 The new government has signaled its intent to act swiftly on this issue, telling unions and employers to agree quickly on comprehensive labor reforms or face mandatory reforms in 2012. Some regional governments are currently enacting a variety of other reforms. Madrid, for example, recently loosened restriction on retailers, allowing stores of more than 700 square meters to stay open as long as they wish, seven days a week.
Marker 4. are the conditions set for strong export growth?
In Sweden and Finland, exports were a key driver of growth in the second phase of deleveraging (Exhibit 19). Swedish exports grew at a 9.7 percent compounded annual rate from 1994 to 1998, while Finnish exports grew by 9.4 percent annually over the same period. Over the 1990s, the real value of exports in both countries nearly doubled. Finland’s current account surplus grew fivefold from 1991 to 1995, due largely to Nokia’s global success. By 2000, the telecom supplier’s foreign sales accounted for about a quarter of exports by value, and its contribution to annual GDP growth reached 1.9 percentage points. Sweden’s export success rested primarily on the performance of fewer than a dozen multinational companies. The boom in both countries was aided by currency depreciations of one-third or more during the crisis. Success in export markets also requires that countries make themselves attractive locations for major multinational corporations, as noted in prior MGI reports.
46 See McKinsey & Company and FEDEA, A growth agenda for Spain, December 2010.
Exhibit 19Exports grew rapidly and investment returned to pre-crisis levels during Sweden’s economic recoverySweden GDP, 2005 pricesSwedish Krona trillion
SOURCE: Global Insight; McKinsey Global Institute
-0.5%
1.2%
-6.4%
5.2%
1.6%
2.3%
0.8%
9.7%
9.7%
8.7%
Compound annual growth rate%
1990–94 1994–98Recession
Public-sector deleveraging
1.01
94
1.97
-0.60
0.62
0.27
0.68
1.00
93
1.87
-0.53
0.55
0.19
0.68
0.98
92
1.91
-0.54
0.51
0.25
0.68
1.02
91
1.91
-0.54
0.50
0.26
0.67
1.03
1990
1.96
-0.56
0.51
0.35
0.64
1.02
-0.84
0.90
0.39
0.70
1.09
97
2.15
-0.76
0.82
0.34
0.68
1.06
96
2.08
-0.67
0.72
0.31
0.68
1.03
95
2.06
-0.65
0.69
0.33
0.67
Imports
Exports
Investment
Government expenditure
Private consumption
1998
2.24
Private-sector deleveraging

36
Given the rise of exports from developing economies and the state of global demand, increasing exports will be more challenging for today’s deleveraging economies. It will require a rebalancing of global consumption, with countries such as China and Germany that run surpluses now increasing consumption. In the United States, exports fell sharply during the crisis but have rebounded strongly: exports have contributed more each year to US GDP growth over the past two years than they did in the seven years leading up to the crisis. In the United Kingdom, exports were 30 percent of GDP in 2010, up three percentage points from their pre-crisis level. Spanish exports are at about their pre-crisis level of 29 percent of GDP.
In the United States and the United Kingdom, service exports, including the “hidden” ones that foreign students and tourists generate, are a potential source of export growth. Both nations also have competitive advantages on which to build in business services, as evidenced by trade surpluses in those sectors. However, given the challenges facing the banking sector, the United Kingdom may find it more difficult to maintain growth in financial services exports, which were more than £48 billion in 2010, or about 11 percent of total exports. A decline in these exports would further complicate the UK government’s deficit reduction program. Spain should build on its strengths in tradable sectors and tourism. For instance, the Spanish tourism industry, while highly successful, currently attracts only a tiny share of the fast-growing Asian market. Much more can be done to target nontraditional visitors to open up new and more diversified sources of growth.
Another way these economies can boost net exports is through greater efficiency in their use of imported resources. The United Kingdom recently became a net importer of energy; oil now accounts for 8 percent of imports. The United States and Spain are also large oil importers (oil accounts for 15 percent of imports in both nations). There are many ways that developed nations can cut use of oil and other resources over the coming decades and they will have more reason to do so as prices are likely to rise over the long term.47 In the United States, shale gas and other nontraditional sources of energy hold out the promise of a relatively inexpensive and plentiful energy source, if environmental concerns can be addressed.
Marker 5. Is private investment rising?
A revival of private investment is essential to spurring a recovery and rebalancing economic growth away from consumption. In Sweden, investment fell sharply after the 1990 crash, but it began growing strongly during the recovery. From 1994 to 1998, private investment rose by 9.7 percent annually—the same rate as exports. In Finland, investment grew by 8.6 percent annually from 1994 to 1998. This is triple the rate of consumption growth during that period. Joining the European Union helped both Nordic countries attract foreign investment, in addition to investment by domestic firms. This experience stands in contrast to Japan, where private investment remained low after its financial crisis, as corporations struggled for many years to reduce their unsustainable levels of debt. Lack of private investment hindered growth and prolonged the recovery.
47 See Resource revolution: Meeting the world’s energy, materials, food, and water needs, McKinsey Global Institute, November 2011 (www.mckinsey.com/mgi).

37Debt and deleveraging: Uneven progress on the path to growthMcKinsey Global Institute
Today, annual private investment in the United States and the United Kingdom is equal to roughly 12 percent of GDP, approximately 5 percentage points below pre-crisis peaks (Exhibit 20). Both business investment and residential real estate investment declined sharply during the credit crisis and the ensuing recession. While private business investment has been rising in recent quarters, total investment remains low because of slow housing starts. In Spain, private investment peaked at 27 percent of GDP before the crisis, bolstered by the boom in housing construction. Since the crisis began, private investment outside the real estate sector declined sharply but has started to recover in recent quarters. However, housing construction continues to decline and now stands at 7 percent of GDP, almost 50 percent lower than the pre-2008 level. This is a major drag on Spain’s economic growth.
More should be done to stimulate investment in today’s deleveraging economies. Given the current very low interest rates in the United Kingdom and the United States and the scale of need for improving infrastructure in both countries, there is no better time to embark upon a program of private and public infrastructure investment. In the United States, the American Society of Civil Engineers estimates that the country needs an additional $200 billion of infrastructure investment per year over five years to maintain and upgrade the nation’s infrastructure. In the United Kingdom, it is estimated that more than $500 billion must be spent over the next 20 years merely to maintain the existing transport infrastructure.48
Spain, too, has opportunities to invest in infrastructure. Freight rail transport is one. Freight rail is usually a more efficient mode of transport, yet Spanish rail freight volumes amount to only about 4 percent of the nation’s freight shipping volume, compared with a European average of 18 percent. Spanish rail freight transport has been deregulated, but competition has yet to ignite the
48 See From austerity to prosperity: Seven priorities for the long term in the United Kingdom, McKinsey Global Institute, November 2010 (www.mckinsey.com/mgi).
Exhibit 20In the United States, United Kingdom, and Spain, business investment has begun to recover—but not in residential real estate
SOURCE: US Bureau of Economic Analysis; UK Office for National Statistics; Eurostat; McKinsey Global Institute
9.011.713.0
3.14.42.9
0
5
10
15
-35%
1 Includes commercial real estate.
Private business and residential real estate investment, Q1 2000–Q2 2011% of GDP, seasonally adjusted
10.111.612.7
2.26.14.5
0
5
10
15
-65%
Residential realestate investment
Private businessinvestment1
11.614.613.6
7.012.48.8
0
5
10
15
Q1 2002
Q1 2000
-44%
Q2 2011
Q1 2010
Q1 2008
Q1 2006
Q1 2004
United States
Spain
United Kingdom

38
development of the subsector, and further investments are warranted to enable expansion and capture efficiencies.
With public funding limited in all three countries, the private sector can play an important role in providing equity capital and long-term debt, if pricing and regulatory structures enable companies to earn a fair return. The UK government already has embarked on a campaign to attract private funding for infrastructure projects.49
Marker 6. has the housing market stabilized?
The housing sector helped create excessive debt in the United States, the United Kingdom, and Spain, and it will play an important role in repairing the damage, too. As John Maynard Keynes advised President Franklin Roosevelt after the “second depression” of 1937, “Housing is by far the best aid to recovery because of the large and continuing scale of demand.”50 During the Swedish and Finnish deleveraging episodes, housing markets stabilized and began to expand as the economy rebounded (Exhibit 21). The housing revival, in turn, drove demand for durable goods, and the “wealth effect” of rebounding real estate values encouraged additional consumer spending.
New housing starts in the United States remain at roughly one-third of their long-term average levels and in 2011 home prices continued to decline in many parts of the country. Without price stabilization and an uptick in new housing starts, a stronger recovery of GDP growth will be difficult. In the United States, residential
49 In its 2011 Autumn Statement, the UK government announced a new strategy for coordinating public and private investment in the United Kingdom. Around £1 billion of new private-sector investment in regulated industries will be supported by government guarantee. In addition, the government is working with UK pension funds to attract an additional £20 billion of investment in infrastructure.
50 Private letter from John Maynard Keynes to President Franklin Delano Roosevelt, February 1, 1938.
Exhibit 21In Sweden, housing prices stabilized and then recovered in the second phase of deleveraging
SOURCE: Statistics Sweden; International Monetary Fund; McKinsey Global Institute
House price index (one- or two-dwelling buildings)
0
50
100
150
200
250
300
2004030201200099989796959493929119908988871986
Recession
Private-sector deleveraging Public-sector
deleveraging

39Debt and deleveraging: Uneven progress on the path to growthMcKinsey Global Institute
real estate construction alone equaled 4 to 5 percent of GDP before the bubble and can do so again, once the market is cleared of excess inventory and there is demand for new construction.51 Both Macroeconomic Advisers and the National Association of Home Builders predict that new housing starts will not approach pre-crisis levels until at least 2013—coincidentally the year in which we estimate that US households may be finished deleveraging.
The United Kingdom is in a very different—and more fortunate—position. It has too few houses, particularly in the Southeast, which has experienced the strongest economic growth. For decades, UK housing investment has lagged far behind rates in other developed countries, at just 3.5 percent of GDP, compared with 6 percent in France and Germany and as much as 12 percent in Spain. Increasing housing construction will require changes to urban planning and zoning regulations that prevent many tracts from being developed. Such a change in policy requires a change in public attitudes and understanding; while more than 50 percent of UK residents believe that half or more of England’s land is already built upon, the reality is that only 13.5 percent is developed.52 A large-scale house-building program could address the shortage of homes and support economic growth.
Spain has a glut of unsold and unfinished houses. There are around 1.5 million unsold units, a legacy of the enormous boom in house building during the bubble. At projected household formation rates, this overhang could take a decade or longer to clear. It will weigh on property prices and construction employment in some regions, and housing is not likely to drive Spain’s growth in the near term.
IMplIcaTIons for busInEss ExEcuTIvEs
Deleveraging introduces forces into the economy that are not captured well by major macroeconomic models.53 Indeed, one measure of how difficult it is to manage in a time of deleveraging is how many forecasters consistently have predicted stronger growth than has occurred. To plan and operate effectively in this environment, then, business executives will need to overlay their own assessments of the impacts of deleveraging on general forecasts. We see several trends that are related to deleveraging that business leaders should consider:
� Continued constraints on consumer demand as households reduce debt. The process of household deleveraging entails more saving and less spending, a process we see playing out to different degrees in the United States, the United Kingdom, and Spain. Although many businesses have found growth in US consumer spending disappointing in 2011, this may in fact be the “new normal” for some time to come. Recently, growth in US consumer spending has reverted to about 2 to 2.5 percent annually, roughly where it might have been during the bubble if investors had not used home equity extraction to support consumption. During the recession, demand for durable
51 Household formation rates in the United States have fallen since 2008 as more young people continue to live with their families. Rising employment will likely reverse this trend.
52 From austerity to prosperity: Seven priorities for the long term in the United Kingdom, McKinsey Global Institute, November 2010 (www.mckinsey.com/mgi).
53 See Olivier Blanchard, Giovanni Dell’Ariccia, and Paolo Mauro, “Rethinking Monetary Policy,” IMF Staff Positon Note, February 12, 2010. See also Gauti B. Eggertsson and Paul Krugman, “Debt, Deleveraging, and the Liquidity Trap: A Fisher-Minsky-Koo approach,” the Federal Reserve Bank of New York, November 16, 2010.

40
goods related to housing and big-ticket items such as cars that typically are bought with credit fell far more than demand for other consumer goods.
� Shifting consumer preferences toward value. In a world of deleveraging households, when consumers do spend, they are more likely to focus on value for money. The weak economy continues to constrain budgets, and precautionary saving persists. We would expect to see fewer impulse purchases and weaker brand loyalty. This may be a boon for sellers of private label products and other value-oriented goods. At the same time, the value bent favors certain retail channels. In the United States, sales at discount stores have held up better than those at department stores, and online sales have set new records.
� Need for accelerated productivity improvements in the face of margin pressure. With companies competing over a smaller pool of spending (both in consumer and business-to-business markets), margins are under increasing pressure in many industries. To maintain profitability, companies will need a step change in the productivity and efficiency of their operations. During the pre-crisis boom years, many executives focused mainly on growth strategies and expansion and less on operations; in a deleveraging world, the opposite focus will be needed. For some companies, this may also require assessing whether the current mix of products and business units is the right one for the deleveraging environment that will persist.
� Invest ahead of the recovery in demand. Businesses that invest ahead of a confirmed robust recovery will derive the greatest benefits when demand does return. Those that are too conservative may risk market share loss during the recovery; this is why recessions often shake up leadership rankings within industries. Indeed, future sector leaders often make their moves during downturns. In the 1930s, continuing investment in television made RCA a leader in the new medium. Procter & Gamble raised its market share through radio advertising in that decade, at a time when its rivals were cutting promotion budgets. Today, with interest rates still at historic lows, executives should be prepared to anticipate the transition to the second, growth phase of deleveraging and act quickly when the environment improves.
� Plan for increasingly uneven growth across nations and regions. The current divergence of economic performance across Europe and across different regions within the United States and the United Kingdom is not likely to disappear. As we have noted, in the United States we see that in states with lower debt overhangs, such as Texas and New York, real GDP has already surpassed pre-recession peaks. In other states, where there are large populations of heavily indebted consumers and many homes with negative equity, output is not likely to rebound for another year or two. Business leaders will need an increasingly granular understanding of specific regional prospects to find pockets of growth.
� Growing opportunities for private investment in public projects. Developed economies—particularly the United States and the United Kingdom—are in need of investment in infrastructure, education, and other public goods but are too constrained by debt to fund this work. In addition to the $1 trillion program called for by the American Society of Civil Engineers, separate investment would be needed to add high-speed rail, next-generation air traffic control, or clean energy systems. Given public-sector financial
41Debt and deleveraging: Uneven progress on the path to growthMcKinsey Global Institute
constraints, the majority of incremental investment will have to come from the private sector. This could be a major opportunity for capital goods providers and other investors, including pension funds and corporations.
� There are no quick fixes—and there may be more bumps in the road ahead. The growing eurozone crisis in 2011 illustrated how easily growth can be derailed in highly indebted economies. The policies that drive growth during deleveraging are the same that drive growth in other times—sound fiscal and monetary policy and structural reforms to unleash private-sector business growth. But enacting these policies and realizing results takes time. It is worth remembering that in Sweden the recession lasted from 1990 through 1993 before growth finally resumed in 1994. Deleveraging, even at its most successful, is a long, painful, and uneven process. Nonetheless, there will be opportunities for businesses that understand the economic environment.
* * *
Understanding the interplay between deleveraging and growth can help policy makers and business leaders steer the proper course as their national economies continue to recover from the financial crisis. There is a delicate balance between reducing debt—whether it is public or private—and encouraging the return of demand to the economy. But the historic examples of Sweden and Finland demonstrate that successful deleveraging can put the economy on a path of robust long-term growth. Focusing on the six critical conditions for growth can help today’s indebted economies move safely from deleveraging to growth.


Debt and deleveraging: Uneven progress on the path to growthMcKinsey Global Institute
43
These technical notes provide additional detail on the definitions and methodologies employed in this report. Specifically, the notes expand on the following points:
1. Methodology for compiling time series of debt to GDP
2. Measuring government debt
3. Nordic deleveraging in the 1990s
1. METhodoloGy for coMpIlInG TIME sErIEs of dEbT To Gdp
In this research, we compiled a time series of debt relative to GDP by sector for a sample of the ten largest developed economies, plus a handful of additional mature economies, and four emerging markets. The ten largest developed economies, in descending order of GDP, are: the United States, Japan, Germany, France, the United Kingdom, Italy, Canada, Spain, Australia, and South Korea. Additional European countries are Greece, Ireland, and Portugal. Emerging markets are China, India, Brazil, and Russia.
For our time series, we follow the methodology used in our 2010 report on debt and deleveraging. We draw extensively on national balance sheet statistics published by central banks in their flow of funds or financial accounts.54 Following the methodology of the Federal Reserve System of the United States, we count as debt those instruments that constitute direct credit market borrowing (Exhibit A1). This includes all traded debt instruments, including commercial paper, and all loans regardless of lender. We exclude mutual fund shares, beneficiary certificates, and all other equity-type funds, as well as all types of deposits. We also exclude derivatives, repurchase agreements, and accounting debit items (e.g., accounts payable) reported on corporate balance sheets.
54 See Debt and deleveraging: The global credit bubble and its economic consequences, McKinsey Global Institute, January 2010 (www.mckinsey.com/mgi).
Appendix: Technical notes

44
To define the entities included in each sector, we have followed the System of National Accounts, a standard adopted by most central banks. By this standard, a nation’s household sector includes resident households, nonprofit institutions serving households, and private unincorporated businesses.55 The nonfinancial business sector of a country includes all resident companies, regardless of whether they are publicly or privately held. This category also includes so-called quasi-corporations such as partnerships (e.g., law firms) as well as state-owned enterprises.
The estimates of government-sector debt include debt raised by central, local, and provincial/state governments. In most cases, government debt is presented on a gross, consolidated basis, meaning intra-government debt holdings are netted out. However, some countries report some types of debt, such as holdings of government bonds in public pension trust funds, differently. This can result in large variations in reported figures on government debt. Some analysts and policy makers argue that net debt is a more appropriate measure of government obligations. (See section 2 of this appendix for more detail on alternative measures of government debt.)
The financial sector includes a broad range of financial institutions in each country, including central banks, all deposit-taking institutions, and many non–deposit-taking institutions such as broker-dealers, finance companies, public financial agencies, and financial auxiliaries such as stock exchanges. We count as debt all medium- and long-term bonds that banks and other parts of the financial system issue to finance their activities. Our debt figures exclude all retail and corporate deposits, deposits at the central bank, and short-term interbank borrowing. We then make a significant adjustment to officially reported figures of debt issued by financial institutions by removing asset-backed securities issued by these entities. We do this to avoid double-counting, since the underlying
55 In the case of Canada, this category also includes nonfinancial noncorporate business. Thus, Canada’s “household” debt levels can appear particularly high.
Exhibit a1Our definition of “debt” covers credit market instruments: loans and bonds
Financial institutions
▪ Commercial paper and bonds issued by banks and other parts of financial sector (e.g., broker-dealers, special purpose vehicles, insurers)
▪ Mortgage- and asset-backed securities (e.g., liabilities of Fannie Mae and Freddie Mac in US)
▪ Short-term interbank borrowing▪ Retail and corporate deposits, central
bank deposits
Households▪ Home mortgages▪ Home equity loans▪ Consumer credit▪ Other loans (e.g., student loans)
▪ All accounts payable▪ All physical and financial assets
Government▪ Central government bonds and loans▪ State, local, and municipal government
bonds and loans
▪ Loans from one branch of government to another
▪ Unfunded pension liabilities
Nonfinancial corporations
▪ Commercial paper and corporate bonds issued
▪ Loans from banks and other sectors
▪ All accounts payable▪ Pension liabilities
SOURCE: McKinsey Global Institute
Include ExcludeOur debt figures . . .

45Debt and deleveraging: Uneven progress on the path to growthMcKinsey Global Institute
loan is already counted as debt in the relevant sector. The possible drawback to this approach is that it may not provide a full picture of financial-sector liabilities. In the US, for example, the liabilities of Fannie Mae and Freddie Mac are largely excluded from our financial-sector debt figures, since the bonds they issue cover mortgage lending that we count in the household sector. Whenever possible, we rely on central bank data on the size of securitization markets to make these adjustments. Where such data are unavailable, we use data from the Securities Industry and Financial Markets Association (SIFMA), the Association for Financial Markets in Europe (AFME), and Dealogic to create our own estimates of outstanding asset-backed securities in each country.
For countries such as the United Kingdom that are financial and business hubs, the definition of “resident” financial institutions has a direct bearing on the size of aggregate debt reported. Central banks follow balance of payments methodology in compiling national balance sheet statistics, in which every business domiciled in the host country counts as a “resident” of that country, regardless of whether it is domestically owned or foreign-owned. For instance, the UK subsidiary of an American company counts as a UK company in national balance sheet statistics for the United Kingdom. Data on the United Kingdom therefore contain significant amounts of foreign assets and liabilities in the financial and nonfinancial business sectors. Subtracting some of the liabilities of foreign-owned banks gives a significantly lower estimate of debt issued by the UK financial sector (Exhibit A2).56
56 Since some foreign liabilities fund local domestic activities, we adjust financial-sector debt by multiplying it by the share of financial-sector assets that are local rather than foreign in nature. For more detail on this adjustment, see Debt and deleveraging: The global credit bubble and its economic consequences, McKinsey Global Institute, January 2010 (www.mckinsey.com/mgi).
Exhibit a2UK debt-to-GDP ratio remains higher than every mature country except Japan, even after subtracting foreign lending by UK banks
SOURCE: Bank of England; McKinsey Global Institute
UK financial-sector assets,1 Q4 2010% of total sector assets (% of GDP)
UK total borrowing, Q4 2010 % of GDP
1 Excludes Bank of England assets; excludes pension funds.
100% =
40(296)Foreign assets
Domestic loans 36(270)
24(176)Other assets
742
414
100% =
Households
Nonfinancialcorporations
Financialinstitutions
Government
Foreign assets
Adjusted
498
20(99)
23(113)
25(125)
15(77)
17(84)
Unadjusted
498
20(99)
23(113)
42(209)
15(77)
498

46
For our emerging-market sample, we have constructed our estimates on debt from a variety of sources. These include estimates of domestic bank loans from central banks, figures on domestic private credit from the International Monetary Fund’s International Financial Statistics, and data on outstanding bonds and external loans from the Bank for International Settlements. While these estimates are not comprehensive, they capture the major channels of credit. One notable exclusion, due to lack of data, is estimates of local government debt in China and other emerging markets.57
For the GDP figures of each country, we use seasonally adjusted quarterly GDP figures, following the methodology of the US Department of Commerce’s Bureau of Economic Analysis. When comparing our quarterly GDP estimates with annual estimates, this may result in small differences in the aggregate ratio of debt to GDP.
2. MEasurInG GovErnMEnT dEbT
Our figures on government debt capture credit market borrowing of governments at all levels, including national, state/provincial, and local, as reported by national central banks or finance ministries. This typically includes all bond market issuance, including local and municipal government bonds, as well as loans. Debt is usually presented on a consolidated basis, meaning that a loan by the federal government to a local government is netted out. Japan, which reports unconsolidated debt, is an exception.
Analysts and policy makers differ on the best way to measure government debt, and national governments often do not present their statistics on government debt in a consistent or transparent fashion. For example, most government debt figures are presented on a gross basis and do not take into account the asset side of the government’s balance sheet. Net debt figures, which subtract financial assets owned by the government from its gross debt liabilities, can differ substantially from gross debt figures for countries with large central bank holdings, such as Japan (Exhibit A3).58
57 In June 2011, China’s National Audit Office released a report stating the local government debt in China totaled $1.7 trillion, or 27 percent of GDP. However, this figure may be an underestimate, as it excludes some types of quasi-government entities and local lending vehicles. See Victor Shih, “China’s local debt problem is bigger than it looks,” Financial Times, June 28, 2011.
58 For a detailed discussion on gross versus net government debt, see “Addressing fiscal challenges to reduce economic risks,” IMF World Economic and Financial Surveys, Fiscal Monitor, September 2011.

47Debt and deleveraging: Uneven progress on the path to growthMcKinsey Global Institute
The definition of the government sector itself can differ between countries and reports. Many governments and journalists focus on debt at the national level, although in most countries, state and local governments also have their own obligations. In the United States, state and local debt comprises 20 percent of all government debt. Because state and local debt is not monitored centrally in most countries, such obligations can rise to unsustainable levels before drawing attention. For example, some analysts are concerned that local governments in China are incurring unsustainable levels of debt, including through stimulus loans from the central government for infrastructure and other projects.
Treatment of public pension obligations also differs across countries. In the United States, holdings of nonmarketable Treasury securities by the Social Security Administration are not considered to be part of the federal debt. If such credit market instruments were to be included, the US government debt would increase by $4.6 trillion, or to 111 percent of GDP. Japan does count its national pension trust holdings of Japanese government bonds as part of government debt.
Almost no government reports its unfunded pension and health care obligations to former and current public employees as part of their debt. Estimates vary widely, but these liabilities can be substantial, especially at the state and local level. Including the unfunded liabilities of state and local governments could add up to $4.4 trillion to US government debt (Exhibit A4).59
59 We do not have estimates of the unfunded liabilities of the US federal government.
Exhibit a3
SOURCE: Economic and Social Research Institute, Japan; Japanese Cabinet Office; International Monetary Fund; McKinsey Global Institute
Japan’s net government debt is significantly lower than its gross government debtJapan general government debt, FY 2009 (end March 2010)% of GDP
19
Other financial assets3
13
30
17 -85 p.p.
7
125
Net debt4Investments in bonds and other fixed-income securities2
Loan assetsCurrency and deposit assets
210
Uncon-solidatedgeneral government debt
Intragovern-mental holdings1
1 Netting out JGBs and Fiscal Investment and Loan Program (FLIP) bonds held by local governments and social security funds.2 Includes bond investments as part of social security trust fund; excludes equity assets.3 Includes central bank foreign exchange reserves.4 Gross debt minus financial assets, excluding shares and other equity.NOTE: Numbers may not sum due to rounding.

48
Consistent government debt measurement across countries should be a priority and would allow policy makers and citizens to better evaluate the sustainability of tax and expenditure policies. Understanding government debt levels is also important for the banks, institutional investors, and households that rely on government bonds as collateral for financial transactions or as investments.
3. nordIc dElEvEraGInG In ThE 1990s
In this report, we use the deleveraging episodes in Sweden and Finland during the 1990s as a benchmark for current deleveraging in the United States, the United Kingdom, and Spain. Both Sweden and Finland experienced credit booms in the 1980s that led to banking crises, recessions, and deleveraging in the 1990s. Their experiences provide lessons and progress markers for other deleveraging nations.
sweden
Sweden’s financial sector underwent extensive liberalization in the 1980s, leading to a significant expansion of credit between 1980 and 1989. Private debt rose from 46 percent of GDP to 124 percent, of which more than half was household debt. The rapid expansion of credit fueled a boom in real estate and equities. Housing prices rose by about 60 percent in five years, and general inflation followed.
The period of 1990 through 1994 was one of financial crisis, recession, and significant private-sector deleveraging (Exhibit A5). Household debt as a percent of GDP had already begun declining slightly in the late 1980s, because inflation caused high nominal GDP growth. Sweden fell into recession and abandoned its currency peg during the crisis in the European Exchange Rate Mechanism in 1992. The Swedish krona lost a third of its value against the US dollar in 1992–93. Corporate and financial-sector deleveraging got under way in the second half of the recession (1992–95). Several leading banks had to be nationalized
Exhibit a4Total US government debt ranges from 80 to 140 percent of GDP, depending on what is includedGovernment debt, Q2 2011$ trillion
4.6
State and local debt 2.5
Federal publicly held debt 9.7
Total government debt 18.0-21.2
State and local unfundedpension liabilities and health benefits for retirees1
1.2-4.4
Federal debt in government accounts
80
31
8-29
119–140
1 Amount of unfunded liabilities varies according to the measurement metric depending on discount rate, assets market value, and cost allocation between past and future service.
Included in our government debt figures
SOURCE: Federal Reserve; Government Accountability Office; US Department of the Treasury, Financial Management Services; McKinsey Global Institute
% of GDP

49Debt and deleveraging: Uneven progress on the path to growthMcKinsey Global Institute
and required recapitalizations by government. That, along with the fall in tax receipts and fiscal stimulus measures, caused Swedish public debt to grow by 36 percentage points over those years.
Exhibit a5
9080706050
0
Public
Corporate(including financial)
100
Household
20080604022000989694921990881986
SOURCE: Haver Analytics; International Monetary Fund; Statistics Sweden; McKinsey Global Institute
Swedish deleveraging began in the household sector; government deleveraged only when recovery was well under way
Total debt% of GDP
166 174 198 193
Real GDP growth%
5 3 -1 -2 4
189
2
189
5
199
2
177
5
236
4
302
-1
168
Recession
Corporatedeleveraging
Sweden debt by sector, 1986–2008% of GDP
257
5
Household deleveraging
Public-sector deleveraging
In 1994, the economic recovery began, and 15 years of gradual public-sector deleveraging commenced. The economic rebound was helped by strong performance in exports and a surge in private investment. Private consumption revived but did not reach the pre-crisis levels. The Swedish government began reducing expenditures in 1994, the year that GDP growth rebounded strongly. The fiscal deficit was gradually reduced and fully eliminated in 1998. Government debt fell from 82 percent of GDP in 1998 to 45 percent in 2008. Growth was key to deleveraging: the absolute amount of Swedish government debt was held roughly constant over those years, while the economy grew.
finland
Finland also experienced a credit boom in the 1980s. Banking deregulation relaxed interest rate controls, allowed variable-rate loans for households, loosened mortgage lending requirements, and opened the doors to foreign borrowing by banks and corporations. Private-sector debt increased from 47 percent of GDP to 90 percent, and bubbles developed in real estate and equities. A weak Finnish markka, pegged to the European Currency Unit (predecessor of the euro), supported strong exports but also sparked domestic inflation.
Starting in 1990, Finland went through a financial crisis and then recession. The government raised interest rates to maintain its currency peg after Germany’s reunification, but the currency depreciated sharply nonetheless. That left many businesses with foreign currency loans facing sharply higher debt repayments. A severe recession followed, exacerbated by the collapse of the Soviet Union, a trading partner that accounted for one-fifth of Finnish exports. Unemployment

50
rose to more than 20 percent. Private-sector debt started declining only after the recession started, but fell much more strongly than in Sweden—from 103 percent of GDP in 1991 to 58 percent by 1998 (Exhibit A6). Government debt increased more than threefold during this period, from 14 percent of GDP in 1990 to 57 percent in 1994.
Finland attempted to implement fiscal austerity in 1992,60 before its economy had recovered from a recession that was far more severe than Sweden’s. Some observers believe this attempt to cut government spending contributed to the sharp rise in unemployment and prolonged the recovery.61 Finland’s economy began growing again in 1994, aided in part by the sharp devaluation of its currency. Finland experienced a stronger rebound than Sweden—real GDP growth averaged 4.6 percent between 1994 and 1999. Export growth was a major factor, driven by the success of telecom supplier Nokia. Exports contributed more than half of the average real annual GDP growth over this period. Finland went on to gradually reduce its government debt, from 57 percent of GDP in 1994 to 34 percent of GDP by 2008. Over this period, the absolute amount of government debt outstanding actually increased, although less than nominal GDP did. As in Sweden, faster real GDP growth accounted for the majority of the decline in the ratio of government debt to GDP, while inflation contributed the remainder.
60 In 1992, the ruling Centre Party began a fiscal consolidation program. It lost the elections in 1995 to the Social Democratic Party, which then introduced its own austerity program. For further details, see Alberto Alesina, Dorian Carloni, and Giampaolo Lecce, “The electoral consequences of large fiscal adjustments,” NBER Working Paper Number 17655, November 2011.
61 For an examination of this point, see Jaakko Kiander and Pentti Vartia, “Lessons from the crisis in Finland and Sweden in the 1990s,” Empirica, 2011, Volume 38, Issue 1: 53–69.
Exhibit a6
0
20
40
60
80
100
120
140
Private1
Public
20080604022000989694921990881986
1 Private debt comprises household debt, nonfinancial corporate debt, and financial-sector debt.SOURCE: Haver Analytics; International Monetary Fund; Bank of Finland; McKinsey Global Institute
In Finland, public-sector deleveraging started quickly after the economic rebound, but the path of decline was very gradual
88 103 140 135
4 8 0 -5 5
121
3
105
7
106
1
103
4
119
4
125
5
108
Finland debt by sector, 1986–2008% of GDP
127
1
Total debt% of GDP
Real GDP growth%
Recession
Private-sector deleveragingPublic-sector deleveraging

Debt and deleveraging: Uneven progress on the path to growthMcKinsey Global Institute
51
Akerlof, George A. and Robert J. Shiller, Animal Spirits: How Human Psychology Drives the Economy, and Why It Matters for Global Capitalism (Princeton, NJ: Princeton University Press, 2009).
Alesina, Alberto, Dorian Carloni, and Giampaolo Lecce, “The electoral consequences of large fiscal adjustments,” National Bureau of Economic Research (NBER) Working Paper Number 17655, November 2011.
Bank of England, “Credit conditions survey: Survey results 2011 Q3,” September 2011.
Bank of England, “Credit risks to the banking system,” Financial Stability Report, June 2011: 17–28.
Bank of England, “Credit conditions survey: Survey results 2011 Q2,” June 2011.
Bank of England, “The role of macroprudential policy,” a Bank of England discussion paper, November 2009.
Bank of England, “Trends in lending,” April 2011.
Bank of Spain, Financial Stability Report, Unidad de Publicaciones, Madrid, November, 2011.
Bengtssom, Kalle, Claes Ekstrom, and Diana Farrell, “Sweden’s growth paradox,” McKinsey Quarterly, June 2006.
Blanchard, Olivier, Giovanni Dell’Ariccia, and Paolo Mauro, “Rethinking Monetary Policy,” IMF Staff Position Note, February 12, 2010
Bhutta, Neil, Jane Dokko, and Hui Shan, “The depth of negative equity and mortgage default decisions,” Federal Reserve Board Finance and Economics discussion series, 2010–35, May 2010.
Cecchetti, Stephen G., M. S. Mohanty, and Fabrizio Zampolli, “The real effects of debt,” Bank for International Settlements (BIS) Working Paper Number 352, September 2011.
Cerra, Valerie and Sweta Chaman Saxena, “Eurosclerosis or financial collapse: Why did Swedish incomes fall behind?” International Monetary Fund (IMF) Working Paper Number WP/05/29, February 2005.
Chamberlin, Graeme, “Economic Review,” Office for National Statistics, Economic & Labour Market Review, 2011, Volume 5, Number 2 (January): 20–31.
CoreLogic, “CoreLogic reports shadow inventory continues to decline,” September 27, 2011.
Bibliography

52
CoreLogic, “Third quarter 2011 negative equity data shows slight decline but remains elevated,” November 29, 2011.
Cottarelli, Carlo and Andrea Schaechter, “Long-term trends in public finances in the G-7 economies,” IMF Staff Position Note 10/13, September 2010.
Darvas, Zsolt, “A tale of three countries: Recovery after banking crises,” Bruegel Policy Contribution, Issue 2011/9, December 2011.
Eggertsson, Gauti B. and Paul Krugman, “Debt, Deleveraging, and the Liquidity Trap: A Fisher-Minsky-Koo approach,” the Federal Reserve Bank of New York, November 16, 2010.
Englund, Peter, “The Swedish banking crisis: Roots and consequences,” Oxford Review of Economic Policy, 1999, Volume 15, Number 3: 80–97.
European Central Bank, “Housing finance in the euro area,” Structural Issues Report, March 2009.
Fair Isaac Corporation, “Predicting strategic default,” FICO Insights, 2011, Number 50 (April).
Fisher, Irving, “The debt-deflation theory of great depressions,” Econometrica, 1933, Volume 1, Number 4: 337–357.
Galbraith, John Kenneth, The Great Crash: 1929, Revised edition (Boston: Houghton Mifflin, 1997; original 1954).
Geanakoplos, John, “The leverage cycle,” Cowles Foundation Discussion Paper Number 1715, July 2009.
Glick, Reuven, and Kevin Lansing, “US household deleveraging and future consumption growth,” Federal Reserve Bank of San Francisco Economic Letter, 2009–16, May 15, 2009.
Guiso, Luigi, Paola Sapienza, and Luigi Zingales, “Moral and social constraints to strategic default on mortgages,” NBER working paper Number 15145, preliminary version, June 2009.
Guiso, Luigi, Paola Sapienza, and Luigi Zingales, “The determinants of attitudes towards strategic default on mortgages,” Fama-Miller working paper forthcoming, Chicago Booth Research Paper Number 11–14, March 2011.
Han, Song, Benjamin J. Keys, and Geng Li, “Credit supply to personal bankruptcy filers: Evidence from credit card mailings,” Federal Reserve Board Finance and Economics discussion series, 2011–29, May 2011.
Institute of International Finance, “Japan’s public debt mountain: What’s the end game?” IIF Research Note, July 22, 2011.
Institute of International Finance, Global Economic Monitor, November 2011.
IMF, “Durable financial stability: Getting there from here,” IMF World Economic and Financial Surveys, Global Financial Stability Report, April 2011.
IMF, “Spain: Selected issues,” IMF Country Report Number 11/216, July 2011.

53Debt and deleveraging: Uneven progress on the path to growthMcKinsey Global Institute
IMF, “Addressing fiscal challenges to reduce economic risks,” IMF World Economic and Financial Surveys, Fiscal Monitor, September 2011.
IMF, “Grappling with crisis legacies,” IMF World Economic and Financial Surveys, Global Financial Stability Report, September 2011.
IMF, “Slowing growth, rising risks,” IMF World Economic and Financial Surveys, World Economic Outlook, September 2011.
Joint Center for Housing Studies of Harvard University, “The state of the nation’s housing 2011,” June 2011.
Jonung, Lars, “The Swedish model for resolving the banking crisis of 1991–93: Seven reasons why it was successful,” European Commission, European Economy, Economic Papers Number 360, February 2009.
Kanaya, Akihiro and David Woo, “The Japanese banking crisis of the 1990s: Sources and lessons,” IMF Working Paper Number WP/00/7, January 2000.
Kiander, Jaakko and Pentti Vartia, “Lessons from the crisis in Finland and Sweden in the 1990s,” Conference on the Aftermath of the Financial Crises, Austrian National Bank, Vienna, November 5–6, 2009.
Kiander, Jaakko and Pentti Vartia, “Lessons from the crisis in Finland and Sweden in the 1990s,” Empirica, 2011, Volume 38, Issue 1: 53–69.
Kindleberger, Charles P. and Robert Aliber, Manias, Panics, and Crashes: A History of Financial Crises, Fifth edition (Hoboken, NJ: John Wiley & Sons, 2005).
Koo, Richard C., The Holy Grail of Macroeconomics: Lessons from Japan’s Great Recession (Singapore: John Wiley & Sons, 2009).
Lansing, Kevin J., “Gauging the impact of the great recession,” Federal Reserve Bank of San Francisco Economic Letter, 2011-21, July 11, 2011.
Lender Processing Services, “March 2011 mortgage performance observations,” LPS Mortgage Monitor, March 16, 2011.
Lombard Street Research, “Spain as the new Japan? Possibly, maybe even likely,” September 19, 2011.
McKinsey & Company and FEDEA, A growth agenda for Spain, December 2010.
McKinsey Global Institute, Why the Japanese economy is not growing: Micro barriers to productivity growth, July 2000.
McKinsey Global Institute, Sweden’s economic performance: Recent developments, current priorities, May 2006.
McKinsey Global Institute, Debt and deleveraging: The global credit bubble and its economic consequences, January 2010.
McKinsey Global Institute, Growth and competitiveness in the United States: The role of its multinational companies, June 2010.

54
McKinsey Global Institute, From austerity to prosperity: Seven priorities for long-term growth in the United Kingdom, November 2010.
McKinsey Global Institute, Growth and renewal in the United States: Retooling America’s economic engine, February 2011.
McKinsey Global Institute, Mapping global capital markets 2011, August 2011.
McKinsey Global Institute, Resource revolution: Meeting the world’s energy, materials, food, and water needs, November 2011.
Mian, Atif and Amir Sufi, “Household leverage and the recession of 2007 to 2009,” NBER Working Paper Number 15896, April 2010.
Mian, Atif and Amir Sufi, “Consumers and the economy, part II: Household debt and the weak US recovery,” Federal Reserve Bank of San Francisco Economic Letter, 2011-02, January 18, 2011.
Mortgage Bankers Association, “National delinquency survey: First quarter,” 2011.
Nielsen, Mette, Silvia Pezzini, Kate Reinold, and Richard Williams, “The financial position of British households: Evidence from the 2010 NMG Consulting survey,” Bank of England Quarterly Bulletin, 2010, Volume 50, Number 4: 333–45.
Office for Budget Responsibility, “Economic and fiscal outlook,” November 2011.
Ostry, Jonathan D., Atish R. Ghosh, Jun I. Kim, and Mahvash S. Qureshi, “Fiscal Space,” IMF Staff Position Note, SPN/10/11, September 1, 2010.
Posner, Eric A. and Luigi Zingales, “A loan modification approach to the housing crisis,” American Law and Economics Review, 2009, Volume 11, Number 2: 575–607.
Reinhart, Carmen M. and Kenneth S. Rogoff, This time is different: Eight centuries of financial folly, (Princeton, NJ: Princeton University Press, 2009).
Reinhart, Carmen M. and Kenneth S. Rogoff, “A decade of debt,” NBER Working Paper Number 16827, February 2011.
Reinhart, Carmen M. and Kenneth S. Rogoff, “From financial crash to debt crisis,” American Economic Review, 2011, Volume 101, Number 5 (August): 1676–1706.
Romer, Christina, “Lessons from the Great Depression for 2009,” presentation at the Brookings Institution, March 9, 2009.
Silver-Greenberg, Jessica, “House is gone but debt lives on,” The Wall Street Journal, October 1, 2011
Singh, Anoop, “Japan’s policy response to its financial crisis: Parallels with the US today,” opening remarks at an IMF seminar, Washington, DC, March 19, 2009.
UK Treasury, “Autumn statement 2011,” November 2011.

Related McKinsey Global Institute publications
www.mckinsey.com/mgi
eBook versions of selected MGI reports are available at MGI’s website, Amazon’s Kindle bookstore, and Apple’s iBookstore.
Download and listen to MGI podcasts on iTunes or at www.mckinsey.com/mgi/publications/multimedia/
Debt and deleveraging: The global credit bubble and its economic consequences (January 2010)
The bursting of the great global credit bubble left a large burden of debt weighing on many households, businesses, and governments—directly affecting the prospects for economic recovery in countries around the world. Leverage levels are still high in ten sectors of five major economies. If history is a guide, one would expect many years of debt reduction.
McKinsey Global Institute
January 2010
Debt and deleveraging: The global credit bubble and its economic consequences
Mapping global capital markets 2011 (August 2011)
The 2008 financial crisis and worldwide recession halted a three-decade expansion of global capital and banking markets. Today, growth has resumed, fueled by expansion in developing economies but also by a $4.4 trillion increase in sovereign debt. The total value of the world’s financial stock has increased from $175 trillion in 2008 to $212 trillion at the end of 2010, surpassing the previous 2007 peak.
McKinsey Global Institute
Global capital markets:Entering a new era
September 2009
The emerging equity gap: Growth and stability in the new investor landscape (December 2011)
The rapid accumulation of wealth and financial assets in emerging economies, and aging, changing pension regimes, growth of alternative investments, and new financial regulations in developed economies, are changing how money is invested. These forces point to significantly reduced investor demand for publicly listed equities, causing a projected decline in the share of global financial assets held in equities.
McKinsey Global Institute
McK
insey Global Institute
December 2011
The emerging equity gap: G
rowth and stability in the new
investor landscape
The emerging equity gap: Growth and stability in the new investor landscape
Growth and renewal in the United States: Retooling America's economic engine (February 2011)
As baby boomers retire and the female labor participation rate plateaus, increases in the workforce will no longer provide the lift to US growth that they once did. To match the GDP growth of the past 20 years, the United States needs to boost labor productivity growth from 1.7 to 2.3 percent a year. That’s an acceleration of 34 percent to a rate not seen since the 1960s.
McKinsey Global Institute
Growth and renewal in the United States: Retooling America’s economic engine
February 2011
From austerity to prosperity: Seven priorities for the long term in the United Kingdom (November 2010)
Over the last 15 years the United Kingdom’s productivity growth has been encouraging, matching the strong performance of the United States and closing the productivity gap with the EU-15. Overall productivity levels, however, are still nearly 20 percent below the US and 10 percent lower than those of Germany.
November 2010
McKinsey & Company, LondonMcKinsey Global Institute
From austerity to prosperity: Seven priorities for the long term
Beyond austerity: A path to economic growth and renewal in Europe (October 2010)
Europe faces multiple, simultaneous pressures on GDP growth at a time when scope to stimulate growth from public funds is limited by high debt and deficit levels. The threat to growth is unlikely to dissipate in the short or even medium term and significant imbalances in unit labor costs and current account positions between European economies intensify the strain.
McKinsey Global Institute
Beyond austerity: A path to economic growth and renewal in Europe
October 2010

McKinsey Global Institute January 2012Copyright © McKinsey & Companywww.mckinsey.com/mgi
@McKinsey_MGI
McKinseyGlobalInstitute


![MGI Debt and Del Ever Aging Uneven Progress to Growth Executive Summary[1]](https://static.fdocuments.in/doc/165x107/577d21b21a28ab4e1e95c392/mgi-debt-and-del-ever-aging-uneven-progress-to-growth-executive-summary1.jpg)