Deaths related to drug poisoning in England and Wales
27
Page 1 of 27 Next release: September 2017 Release date: 9 September 2016 Contact: Vanessa Fearn [email protected] Statistical bulletin Deaths related to drug poisoning in England and Wales: 2015 registrations Deaths related to drug poisoning in England and Wales from 1993 onwards, by cause of death, sex, age and substances involved in the death. Table of contents 1. Main points 2. Statistician’s quote 3. Things you need to know 4. Number of drug-related deaths increase again to highest level recorded 5. Drug misuse deaths increased significantly in males but remained stable in females 6. How to interpret data on deaths involving specific substances 7. Deaths involving substances that are commonly abused 8. Over half of drug deaths involve an opioid 9. Deaths involving heroin and/or morphine doubled in the last 3 years and are now the highest on record 10. Deaths involving tramadol fell for the first time 11. Cocaine-related deaths reach an all time high 12. Amphetamine deaths (including ecstasy) continue to climb 13. Deaths involving new psychoactive substances (so called “legal highs”) increase again in 2015 14. Diazepam deaths remain stable in 2015 15. Deaths involving medicinal substances 16. Paracetamol-related deaths remain stable in 2015 17. Deaths involving zopiclone and zolpidem fall slightly in 2015
Transcript of Deaths related to drug poisoning in England and Wales

Page 1 of 27
Next release: September 2017
Release date: 9 September 2016
Contact: Vanessa Fearn [email protected]
Statistical bulletin
Deaths related to drug poisoning in England and Wales: 2015 registrationsDeaths related to drug poisoning in England and Wales from 1993 onwards, by cause of death, sex, age and substances involved in the death.
Table of contents
1. Main points
2. Statistician’s quote
3. Things you need to know
4. Number of drug-related deaths increase again to highest level recorded
5. Drug misuse deaths increased significantly in males but remained stable in females
6. How to interpret data on deaths involving specific substances
7. Deaths involving substances that are commonly abused
8. Over half of drug deaths involve an opioid
9. Deaths involving heroin and/or morphine doubled in the last 3 years and are now the highest on record
10. Deaths involving tramadol fell for the first time
11. Cocaine-related deaths reach an all time high
12. Amphetamine deaths (including ecstasy) continue to climb
13. Deaths involving new psychoactive substances (so called “legal highs”) increase again in 2015
14. Diazepam deaths remain stable in 2015
15. Deaths involving medicinal substances
16. Paracetamol-related deaths remain stable in 2015
17. Deaths involving zopiclone and zolpidem fall slightly in 2015

Page 2 of 27
18. Deaths involving antidepressants go down in 2015
19. Deaths involving antipsychotics decrease by 20% in 2015
20. Propranolol deaths continue to rise
21. People aged 30 to 49 have the highest rate of drug misuse deaths
22. North East had the highest drug misuse mortality rate in England in 2015
23. Comparisons with other countries
24. Most drug misuse deaths are accidental poisonings
25. Impact of registration delays on drug misuse deaths
26. Links to related ONS information
27. Quality and methodology
28. References
Page 3 of 27
1 . Main points
There were 3,674 drug poisoning deaths involving both legal and illegal drugs registered in England and Wales in 2015, the highest since comparable records began in 1993.
Of these, 2,479 (or 67%) were drug misuse deaths involving illegal drugs only.
The mortality rate from drug misuse was the highest ever recorded, at 43.8 deaths per million population.
Males were almost 3 times more likely to die from drug misuse than females (65.5 and 22.4 deaths per million population for males and females respectively).
Deaths involving heroin and/or morphine doubled in the last 3 years to 1,201 in 2015, and are now the highest on record.
Deaths involving cocaine reached an all time high in 2015 when there were 320 deaths – up from 247 in 2014.
People aged 30 to 39 had the highest mortality rate from drug misuse (98.4 deaths per million population), followed by people aged 40 to 49 (95.1 deaths per million).
In 2015, the mortality rate from drug misuse was significantly lower in England than in Wales (42.9 compared with 58.3 deaths per million population).
Within England, the North East had the highest mortality rate from drug misuse in 2015 for the third year running (68.2 deaths per million population), while the East Midlands had the lowest (29.8 deaths per million).
All figures presented in this bulletin are based on deaths registered in a particular calendar year. Out of the 2,479 drug-related deaths registered in 2015, half (1,132) occurred in years before 2015.
2 . Statistician’s quote
"Deaths involving heroin and morphine have more than doubled since 2012, partly driven by a rise in heroin purity and availability over the last 3 years. Age is also a factor in the record levels of drug deaths, as heroin users are getting older and they often have other conditions, such as lung disease and hepatitis, that make them particularly vulnerable."
Vanessa Fearn, Researcher, Office for National Statistics
3 . Things you need to know
Drug use and drug dependence are known causes of premature mortality, with drug poisoning accounting for 1 in 6 deaths among people in their 20s and 30s in 2015. Drug-related deaths occur in a variety of circumstances, each with different social and policy implications. Consequently, there is considerable political, media and public interest in these figures.

Page 4 of 27
Figures are presented for deaths related to drug poisoning (involving both legal and illegal drugs) and drug misuse (involving illegal drugs) in England and Wales from 1993 onwards. The definition of a drug poisoning death is based on the (ICD) code assigned as the underlying cause of International Classification of Diseasesdeath. A list of the ICD codes included in the definition can be found in the Quality and Methodology Information(QMI).
The majority of this release focuses on drug misuse deaths. The definition of a drug misuse death is either (a) a death where the underlying cause is drug abuse or drug dependence or (b) a death where the underlying cause is drug poisoning and where any of the substances controlled under the are involved. Misuse of Drugs Act 1971This definition is used across the UK, and more details can be found in the .Quality and Methodology Information
The figures include accidents and suicides involving drug poisonings, as well as deaths from drug abuse and drug dependence. They do not include other adverse effects of drugs (for example, anaphylactic shock), or other types of accidents (for example, a car crash) where the driver was under the influence of drugs.
Drug poisoning deaths involve a broad spectrum of substances, including legal and illegal drugs, prescription-type drugs (either prescribed to the individual or obtained by other means) and over-the-counter medications. Some of these deaths may also be from complications of drug abuse, such as deep vein thrombosis or septicaemia from intravenous drug use, rather than an acute drug overdose.
It is important to be aware that over half of all drug poisoning deaths involve more than 1 drug and/or alcohol, and it is not possible to tell which substance was primarily responsible for the death. Users must read the How to interpret data on death involving specific substances to enable them to correctly understand our drug-related deaths data.
The figures presented show deaths registered each year, rather than deaths occurring each year. Almost all drug-related deaths are certified by a coroner. Due to the length of time it takes a coroner to complete an inquest, around half of drug-related deaths registered in 2015 will have actually occurred prior to 2015. See the Impact of registration delays on drug-related deaths section for more information. Nevertheless, at an England and Wales level, general trends in drug-related deaths are broadly equivalent, regardless of whether the data is analysed by year of occurrence or year of registration. Figures based on registration year for smaller geographical areas (for example, Wales, English regions, and local authorities) can be influenced by variations in registration delays, and should be treated with caution. Extra information is provided in the commentary where differences in the trends do exist.
4 . Number of drug-related deaths increase again to highest level recorded
There were 3,674 drug poisoning deaths (involving both legal and illegal drugs) registered in 2015. The mortality rate increased significantly between 2014 and 2015 from 59.6 to 65.1 deaths per million population – the highest rate since comparable records began in 1993. This upward trend is driven by a sharp increase in heroin/morphine related deaths, particularly in men.
As in previous years, the majority (just over two-thirds) of drug-related deaths were males (2,547 male deaths and 1,127 female deaths).

Page 5 of 27
1.
2.
3.
Figure 1: Number of male and female drug-related deaths, registered in 2015
England and Wales
Source: Office for National Statistics
Notes:
Cause of death was defined using the International Classification of Diseases, Tenth Revision (ICD-10). The underlying cause of death codes used to select 'all drug poisonings' can be found in the Quality and Methodology Information.
Figures are for deaths registered, rather than deaths occurring in 2015.
Figures for England and Wales include deaths of non-residents.
5 . Drug misuse deaths increased significantly in males but remained stable in females
As shown in Figure 2, of the 3,674 drug poisoning deaths in 2015, 2,479 (67%) were from drug misuse which involves illegal drugs. Therefore, the pattern of mortality from drug misuse closely matches the overall trend seen for all drug-related deaths.

Page 6 of 27
1.
2.
3.
Figure 2: Number of deaths from drug-related poisoning and drug misuse, registered in 2015
England and Wales
Source: Office for National Statistics
Notes:
Cause of death was defined using the International Classification of Diseases, Tenth Revision (ICD-10). The underlying cause of death codes used to select 'all drug poisonings' can be found in the Quality and Methodology Information.
Figures are for deaths registered, rather than deaths occurring in 2015.
Figures for England and Wales include deaths of non-residents
In 2015, there were 1,843 male drug misuse deaths and 636 female drug misuse deaths. Figure 3 shows that the male mortality rate has increased sharply over the past 3 years to reach a new peak of 65.5 deaths per million population. This is a statistically significant increase of 13% compared with the 2014 mortality rate. In contrast, the female mortality rate remained relatively stable with no significant increase between 2014 and 2015, though the rate of 22.4 deaths per million population in 2015 was the highest since records began in 1993.
The difference in trends between males and females suggests that different factors are involved in deaths related to drug misuse between the sexes. The (Home Office, 2016–PDF Crime Survey for England and Walesdownload) showed that men are more likely to take illicit drugs than women This partly explains the higher mortality rate from drug misuse in males, but does not explain the sharper rises seen in males in recent years. It is possible that the greater proportion of accidental poisoning deaths in males (see Figures 8 and 9 below) contributes to this steeper increase in deaths related to drug misuse as compared to females. There are differences in the types of controlled substances used by males and females, which may also influence trends in drug misuse deaths.

Page 7 of 27
1.
2.
3.
4.
Figure 3: Age-standardised mortality rate for deaths related to drug misuse, by sex, deaths registered in 1993 to 2015
England and Wales
Source: Office for National Statistics
Notes:
Age-standardised mortality rates per 1 million population, standardised to the 2013 European Standard Population.
Cause of death was defined using the International Classification of Diseases, Ninth Revision (ICD-9) for the years 1993 to 2000 and Tenth Revision (ICD-10) from 2001 onwards. More details can be found in the Quality and Methodology Information.
Figures are for deaths registered, rather than deaths occurring in each calendar year.
Figures for England and Wales include deaths of non-residents.
6 . How to interpret data on deaths involving specific substances
The following sections provide figures for deaths involving specific substances, but they need to be interpreted with caution for the following reasons:

Page 8 of 27
these figures are based only on information reported on the coroner’s death certificate and may not include every substance involved in the death; this is because not all substances are tested for during the post mortem examination, and coroners do not always report all of the substances that were found during testing
in around 1 in 8 drug poisoning deaths, only a general description is recorded on the coroner’s death certificate (such as drug overdose or multiple drug toxicity); deaths where the certificate contains only non-specific information cannot contribute to the counts of deaths involving specific substances
in an additional third of all drug poisoning deaths, the death certificate mentions more than 1 specific drug; where more than 1 drug is mentioned, it is not possible to tell which was primarily responsible for the death
where more than 1 drug is mentioned on a death certificate, the death may be counted in more than one category in Tables 1 and 2 (and may appear in both tables); for example, if both heroin and methadone are mentioned, the death will be recorded once under heroin and once under methadone, therefore the numbers for different substances cannot be added together to give a total number of deaths
approximately 30% of all drug-related poisoning deaths also contain a mention of alcohol or long-term alcohol abuse (for example, cirrhosis) in addition to a drug.
Analysis of deaths involving specific substances has been split into deaths involving substances that are commonly abused and deaths from a range of prescription and over the counter medicines that are less commonly abused. Though it should be noted that the distinction between the 2 categories is blurred, as some prescription drugs, such as opiates and benzodiazepines can be abused. Also, a death may mention substances falling into both categories.

Page 9 of 27
7 . Deaths involving substances that are commonly abused
Table 1: Number of drug-related deaths where selected substances that are commonly abused were mentioned on the death certificate, deaths registered in England and Wales between 2011 to 2015
England and Wales
2011 2012 2013 2014 2015
All drug poisoning deaths 2,652 2,597 2,955 3,346 3,674
Any opioid4 1,439 1,290 1,592 1,786 1,989
Heroin and/or morphine 596 579 765 952 1,201
Methadone 486 414 429 394 434
Tramadol 154 175 220 240 208
Codeine 88 73 130 136 128
Dihydrocodeine 109 103 102 86 94
Other specified opioid 90 80 93 129 113
Unspecified opioid 131 92 145 169 196
Cocaine 112 139 169 247 320
Any amphetamine 62 97 120 151 157
Amphetamine 46 49 56 85 90
MDMA/Ecstasy 13 31 43 50 57
Cannabis 7 14 11 28 21
Any new psychoactive substance 31 55 63 82 114
Any benzodiazepine 293 284 342 372 366
Diazepam 179 207 228 258 252
Gabapentin 4 8 9 26 49
Pregabalin 4 4 33 38 90
Source: Office for National statistics
Notes:
1. Cause of death was defined using the International Classification of Diseases, Tenth Revision (ICD-10) (see the Quality and Methodology Information for more details).
2. Figures are for deaths registered, rather than deaths occurring in 2011-2015.
3. Figures for England and Wales include deaths of non-residents.
4. Figures for opioids exclude opioids contained in a paracetamol compound, ie co-codamol, co-dydramol and co-proxamol.

Page 10 of 27
1.
2.
3.
4.
Figure 4: Age-standardised mortality rates for selected substances, deaths registered in 1993 to 2015
England and Wales
Source: Office for National Statistics
Notes:
Age-standardised mortality rates per 1 million population, standardised to the 2013 European Standard Population.
Cause of death was defined using the International Classification of Diseases, Ninth Revision (ICD-9) for the years 1993 to 2000 and Tenth Revision (ICD-10) from 2001 onwards. More details can be found in the Quality and Methodology Information. Deaths were included where the underlying cause was drug related and the specified substance was mentioned on the death certificate.
Figures are for deaths registered, rather than deaths occurring in each calendar year.
Figures for England and Wales include deaths of non-residents.
The trends in deaths involving the substances shown in Table 1 and Figure 4 are discussed in more detail in each of the following sections.
8 . Over half of drug deaths involve an opioid
Over half (54%) of all deaths related to drug poisoning in 2015 involved an opioid drug (excluding opioids which are contained in paracetamol compounds such as co-codamol). This proportion has been relatively stable since 2007.
Opioid drugs include opiates that are derived from opium such as heroin and morphine and synthetic or semi-synthetic opioids such as tramadol and fentanyl. They can be prescribed to treat moderate to severe pain, but repeated use can lead to dependence and tolerance (meaning the user needs to take more of the drug to achieve the same effect). These drugs also have psychoactive effects and many opioids are taken illicitly due to this high abuse potential.

Page 11 of 27
9 . Deaths involving heroin and/or morphine doubled in the last 3 years and are now the highest on record
Deaths involving heroin and/or morphine doubled between 2012 and 2015 from 579 to 1,201, and these 2 substances remain the most commonly mentioned opiates in drug-related deaths.
Figure 4 shows that the mortality rate for deaths involving heroin/morphine declined between 2008 and 2012, with a particularly sharp fall between 2009 and 2011. The recent reversal means the mortality rate in 2015 was the highest since records began in 1993 and now exceeds the previous peak in 2008 which occurred before the “heroin drought” (see following paragraph). The number of deaths involving heroin/morphine reported here is likely to be an underestimate, as some coroners simply record “opiate overdose” on the death certificate and do not specify which opiate drug was involved. Many of these deaths will actually involve heroin.
Increases in the number of deaths involving heroin/morphine were seen across all ages between 2014 and 2015, with the biggest rises occurring in those aged 50 to 69 (see Reference Table 7 in the downloadable datasets for deaths involving selected substances broken down by age). Both the male and female mortality rate for deaths involving heroin/morphine increased in 2015, but the increase was sharper in males (31% compared with 9%). Males and females have tended to show different trends in heroin/morphine related mortality over time; for example, the sharp fall between 2009 and 2011 was only seen in males, while female rates remained stable during this time.
Some of this difference between the sexes can be explained by the fact that a greater proportion of female deaths involving heroin/morphine are suicides (rather than accidental overdoses), which are less likely to be affected by changes in the purity of heroin. In addition, the figures presented here are for deaths involving either heroin and/or morphine. This is because heroin (diamorphine) breaks down in the body into morphine, so either heroin and/or morphine may be detected at post mortem and recorded on the death certificate. Reporting only deaths which specifically mention heroin may underestimate the numbers. A more detailed analysis of the data suggests that a greater proportion of female deaths included in this section involve morphine rather than heroin – less than 40% of female heroin/morphine deaths actually mention heroin on the death certificate compared with more than 60% of male deaths. This means that female deaths are less likely to be affected by changes in the heroin market in England and Wales.
Evidence suggests that in 2010/11, there was a “heroin drought” in the UK, with reduced availability of heroin persisting in some areas in 2011/12 and 2012/13 (Serious Organised Crime Agency (SOCA), 2011, 2012, 2013, 2014). The heroin drought affected the purity of user-level or “street” heroin, which fell from 46% in September 2009 ( ) to 17% in mid-2012, but then increased again in each of the last 3 years SOCA annual report, 2011reaching an average of 44% in 2015 (National Crime Agency, 2016). Prices of heroin have also changed over this period – the purity-adjusted price has fallen considerably from a peak of around £74 per gram in 2011 to around £45 in 2014 as a result of the increased quality of the substance typically being sold at street-level ( United
). This suggests people are able to buy stronger Kingdom Drug Situation report by Public Health England, 2016heroin for the same price.
The suggested that global opium poppy cultivation (the source of United Nations World Drug Report (2015)heroin) reached its highest level in 2014 since the 1930s, but then fell by 38% in 2015 to the levels of the late 1990s. This decrease was primarily a result of poor opium yields in Afghanistan ( United Nations World Drug
). The UN report suggested it was unlikely that the sharp decline in opium production in 2015 will Report, 2016lead to major shortages in the global heroin market, given the high opium production levels of previous years. Evidence suggests it has not had an impact on the UK heroin market in 2015.
Evidence suggests that overdoses are associated with higher drug purity ( ) so the Bazazi and others, 2015increase in user-level purity, and the changes in price, may partly explain the increase in heroin-related deaths since 2012.
Page 12 of 27
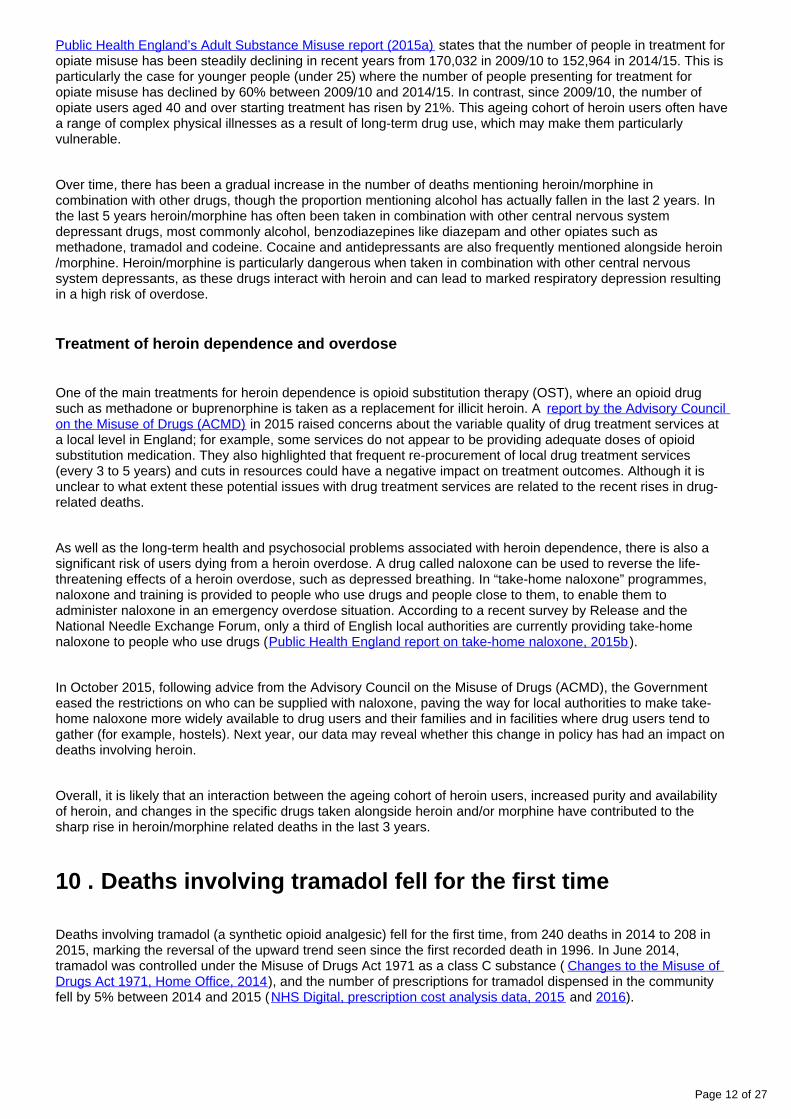
Public Health England’s Adult Substance Misuse report (2015a) states that the number of people in treatment for opiate misuse has been steadily declining in recent years from 170,032 in 2009/10 to 152,964 in 2014/15. This is particularly the case for younger people (under 25) where the number of people presenting for treatment for opiate misuse has declined by 60% between 2009/10 and 2014/15. In contrast, since 2009/10, the number of opiate users aged 40 and over starting treatment has risen by 21%. This ageing cohort of heroin users often have a range of complex physical illnesses as a result of long-term drug use, which may make them particularly vulnerable.
Over time, there has been a gradual increase in the number of deaths mentioning heroin/morphine in combination with other drugs, though the proportion mentioning alcohol has actually fallen in the last 2 years. In the last 5 years heroin/morphine has often been taken in combination with other central nervous system depressant drugs, most commonly alcohol, benzodiazepines like diazepam and other opiates such as methadone, tramadol and codeine. Cocaine and antidepressants are also frequently mentioned alongside heroin/morphine. Heroin/morphine is particularly dangerous when taken in combination with other central nervous system depressants, as these drugs interact with heroin and can lead to marked respiratory depression resulting in a high risk of overdose.
Treatment of heroin dependence and overdose
One of the main treatments for heroin dependence is opioid substitution therapy (OST), where an opioid drug such as methadone or buprenorphine is taken as a replacement for illicit heroin. A report by the Advisory Council
in 2015 raised concerns about the variable quality of drug treatment services at on the Misuse of Drugs (ACMD)a local level in England; for example, some services do not appear to be providing adequate doses of opioid substitution medication. They also highlighted that frequent re-procurement of local drug treatment services (every 3 to 5 years) and cuts in resources could have a negative impact on treatment outcomes. Although it is unclear to what extent these potential issues with drug treatment services are related to the recent rises in drug-related deaths.
As well as the long-term health and psychosocial problems associated with heroin dependence, there is also a significant risk of users dying from a heroin overdose. A drug called naloxone can be used to reverse the life-threatening effects of a heroin overdose, such as depressed breathing. In “take-home naloxone” programmes, naloxone and training is provided to people who use drugs and people close to them, to enable them to administer naloxone in an emergency overdose situation. According to a recent survey by Release and the National Needle Exchange Forum, only a third of English local authorities are currently providing take-home naloxone to people who use drugs ( ).Public Health England report on take-home naloxone, 2015b
In October 2015, following advice from the Advisory Council on the Misuse of Drugs (ACMD), the Government eased the restrictions on who can be supplied with naloxone, paving the way for local authorities to make take-home naloxone more widely available to drug users and their families and in facilities where drug users tend to gather (for example, hostels). Next year, our data may reveal whether this change in policy has had an impact on deaths involving heroin.
Overall, it is likely that an interaction between the ageing cohort of heroin users, increased purity and availability of heroin, and changes in the specific drugs taken alongside heroin and/or morphine have contributed to the sharp rise in heroin/morphine related deaths in the last 3 years.
10 . Deaths involving tramadol fell for the first time
Deaths involving tramadol (a synthetic opioid analgesic) fell for the first time, from 240 deaths in 2014 to 208 in 2015, marking the reversal of the upward trend seen since the first recorded death in 1996. In June 2014, tramadol was controlled under the Misuse of Drugs Act 1971 as a class C substance ( Changes to the Misuse of
), and the number of prescriptions for tramadol dispensed in the community Drugs Act 1971, Home Office, 2014fell by 5% between 2014 and 2015 ( and ).NHS Digital, prescription cost analysis data, 2015 2016

Page 13 of 27
11 . Cocaine-related deaths reach an all time high
There were 320 deaths involving cocaine in 2015, up from 247 in 2014. Mortality rates have increased for 4 years in a row, and reached an all time high of 5.6 deaths per million population in 2015, which was nearly 3 times higher than the rate in 2011 (1.9 deaths per million). The majority of cocaine-related deaths occur in men aged 30 to 49, though there was an increase in deaths of men and women of all ages (except those aged under 20 and 70 and over) in 2015.
It is not possible to separately identify crack cocaine from other forms of cocaine at post mortem, and other evidence to distinguish the form of cocaine taken is rarely provided on death certificates. Therefore the figure for cocaine in Table 1 will include some deaths where cocaine was taken in the form of crack cocaine.
The Home Office Crime Survey for England and Wales (2016) suggests that cocaine is the second most commonly used drug (after cannabis), with 2.3% of adults aged 16 to 59 using cocaine in 2014/15. This was a similar proportion to 2013/14, in contrast to the increase in deaths. Moreover, the number of users remains lower now than the peak of 3.0% in 2008/09 when deaths involving cocaine were significantly lower. The National Crime Agency (2016) reports that there was a significant increase in user-level cocaine purity in 2015 (up from 37% in 2014 to 45% in 2015), which may partly explain the increase in deaths.
More than 3 out of 4 of deaths involving cocaine also mention another drug or alcohol, and this proportion has not changed over the last 5 years. The substances most commonly mentioned alongside cocaine are central nervous system depressants such as alcohol, opioids like heroin, morphine and methadone and benzodiazepines like diazepam. In particular, by 2015 almost half of cocaine-related deaths also mentioned heroin and/or morphine, and this proportion has steadily increased in the last 3 years (since the end of the “heroin drought”).
Since cocaine is often taken alongside heroin, it is likely that changes in the purity and availability of heroin, as well as increases in the purity of cocaine, are contributing to the rise in deaths involving cocaine in recent years.
12 . Amphetamine deaths (including ecstasy) continue to climb
The number of deaths involving amphetamines increased from 151 in 2014 to 157 in 2015. This is a mortality rate of 2.7 deaths per million population, which is the highest since records began in 1993.
In addition to amphetamine itself, the amphetamines group includes substances such as methylenedioxymethamphetamine (MDMA, also known as ecstasy), methylamphetamine, paramethoxyamphetamine (PMA) and Para-methoxymethamphetamine (PMMA).
The number of deaths involving ecstasy has varied across the years, but has been climbing consistently over the last 5 years, reaching 57 deaths in 2015 – the highest since 2005. The Crime Survey for England and Wales
suggests ecstasy use by adults aged 15 to 59 remained relatively stable between 2013/14 (Home Office, 2016)and 2014/15.
The reports that ecstasy purity levels have increased significantly and have now DrugScope Street Drug Surveyreached 1990s levels. However, this is not supported by the latest figures from the National Crime Agency (2016), which suggest that the range of MDMA content in tablets was similar in 2014 and 2015 and only marginally higher than in 2013 and the purity of MDMA powder has also remained stable over this period. So the reasons behind the rise in ecstasy deaths in recent years are unclear.

Page 14 of 27
13 . Deaths involving new psychoactive substances (so called “legal highs”) increase again in 2015
New psychoactive substances (NPS) contain chemicals which produce similar psychoactive effects to “traditional” illegal drugs like cocaine, cannabis and ecstasy. They started to become more popular on the UK drugs scene around 2008 to 2009, with synthetic stimulants such as benzylpiperazine (BZP) and mephedrone, and synthetic cannabinoids (such as “spice”), among the first to gain popularity. NPS are sometimes referred to as “legal highs”, but the majority are controlled under the , so are no longer legal.Misuse of Drugs Act 1971
The mortality rate from deaths involving NPS is very low compared with heroin and/or morphine (1.9 deaths per million compared with 21.3). However, NPS deaths have increased sharply over the last 5 years, with 114 deaths registered in 2015 (up from 82 deaths in 2014).
In 2015, there were 25 deaths involving NPS drugs which were still legal at the time of death. The government introduced the in May 2016, which establishes a blanket ban on the importation, Psychoactive Substances Actproduction or supply of most psychoactive substances. However, it is likely to be several years before our data shows whether this ban has had any impact on deaths involving NPS.
Deaths involving mephedrone and synthetic cannabinoids like “spice” increase in 2015
Reference table 8 gives the number of deaths involving specific types of NPS. Since 2012, the single most commonly mentioned NPS has been mephedrone – and deaths involving mephedrone doubled from 22 in 2014 to 44 in 2015, the highest on record. shows that Public Health England’s 2015 report on adult substance misusethe number of people presenting to drug treatment services for mephedrone misuse has increased slightly in the last 3 years (from 1,836 in 2012/13 to 2,024 in 2014/15). In contrast, evidence from the Home Office Crime
suggests that the proportion of 16- to 59-year-olds using mephedrone remained Survey for England and Walesstable in 2014/15. There is a more detailed discussion of the relationship between mephedrone use and mephedrone deaths in our special article on .Deaths involving legal highs in England and Wales (ONS, 2016)
There has been growing concern in recent years about the harms caused by use of synthetic cannabinoids, such as “spice”, particularly in prisons ( ). Although, the number of deaths HM Inspectorate of Prisons 2015 reportmentioning these substances is very small, there was an increase between 2014 and 2015 (up from 2 to 8 deaths).
There is no officially agreed list of substances that are categorised as NPS, but we include the following types of substances: gamma-hydroxybutyrate (GHB) and its precursor gamma-butyrolactone (GBL), piperazines, cathinones such as mephedrone, benzofurans, and prescription-type drugs, for example, benzodiazepine analogues. All drugs included in our definition for the purposes of this bulletin are listed the “Definition” tab of the
and reference Deaths Related to Drug Poisoning, England and Wales Drug misuse deaths by local authoritytables. Additional NPS will be added to the list in future years, as and when they are identified in the drug-related deaths data. We welcome comments on the drugs included in this category.
14 . Diazepam deaths remain stable in 2015
There were 366 deaths involving benzodiazepines in 2015, and the mortality rate of 6.5 deaths per million population was similar to the rate seen in 2014.
Diazepam was the most common type of benzodiazepine mentioned on deaths certificates in 2015, and was involved in 252 deaths. The role of diazepam and other benzodiazepines in drug-related deaths is unclear, as more than 9 out of 10 deaths of this type also mentioned another, often more potent, drug such as heroin or methadone.

Page 15 of 27
15 . Deaths involving medicinal substances
Table 2: Number of drug-related deaths where selected medicinal substances were mentioned on the death certificate, deaths registered in 2011 to 2015
England and Wales
2011 2012 2013 2014 2015
All drug poisoning deaths 2,652 2,597 2,955 3,346 3,674
Paracetamol4 207 182 226 200 197
Antidepressants 393 468 466 517 447
Tricyclic antidepressants 200 233 235 253 215
Selective serotonin re-uptake inhibitors 127 158 150 159 150
Other antidepressants 84 104 124 155 133
Antipsychotics 104 102 107 126 101
Zopiclone or Zolpidem 71 83 86 100 87
Propranolol 32 39 46 54 55
Source: Office for National Statistics
Notes:
1. Cause of death was defined using the International Classification of Diseases, Tenth Revision (ICD-10) (see the Quality and Methodology Information for more details).
2. Figures are for deaths registered, rather than deaths occurring in 2011-2015.
3. Figures for England and Wales include deaths of non-residents.
4. Dextropropoxyphene is very rarely ingested except in combination with paracetamol, therefore figures include dextropropoxyphene mentioned without paracetamol.
The trends in deaths involving each medicinal substance shown in Table 2 are discussed in more detail in the sections below.
16 . Paracetamol-related deaths remain stable in 2015
Table 2 shows that there were 197 deaths involving paracetamol and its compounds in 2015, and the trend has remained relatively stable in recent years. About two-thirds of these deaths involve paracetamol not from a compound, and the remaining third involve a paracetamol compound, most commonly co-codamol (paracetamol and codeine).
17 . Deaths involving zopiclone and zolpidem fall slightly in 2015
As shown in Table 2, the number of deaths involving zopiclone or zolpidem had been steadily increasing since 2010 peaking at 100 deaths in 2014, but they decreased to 87 deaths in 2015, a fall of 13% since 2014.

Page 16 of 27
These drugs are prescribed to treat insomnia in the short-term and have the potential to be misused. In June 2014, zopiclone was controlled under the Misuse of Drugs Act 1971 as a class C substance ( Changes to the
). This appears to have had little impact on the level of zopiclone Misuse of Drugs Act 1971, Home Office, 2014being prescribed in the community (a 1% decrease between 2014 and 2015 – ( NHS Digital, prescription cost
and ), but may have reduced the level of misuse. As with benzodiazepines, 8 out of 10 analysis data, 2015 2016deaths involving zopiclone or zolpidem also involve another drug (often an opiate, antidepressant or a benzodiazepine), making it difficult to disentangle the precise role of zopiclone or zolpidem in these deaths.
18 . Deaths involving antidepressants go down in 2015
After opiates, antidepressants make up the largest category of drug poisoning deaths in England and Wales. There were 447 deaths involving antidepressants in 2015, a decrease of 14% since 2014, bringing the numbers back down to the levels observed several years ago. This pattern was seen for all types of antidepressants.
Tricyclic antidepressants (TCAs) were involved in the most deaths in this broad category in 2015. The majority of the TCA deaths involved amitriptyline, where there was a 15% decrease in 2015 to 166 deaths, possibly marking the reversal of the upward trend that had been apparent since 2010. Although TCAs are still involved in more deaths than other types of antidepressants, the number of deaths from TCA poisoning is now much lower than its peak of 497 deaths in 1998.
Deaths involving selective serotonin re-uptake inhibitors (SSRIs), such as citalopram, are higher than they were in the 1990s and 2000s. However the number of deaths appears to have stabilised in the last few years, with 150 deaths recorded in 2015. Evidence suggests that SSRIs are less toxic in overdose than TCAs ( study on the
), but SSRIs are prescribed more frequently.toxicity of antidepressants by Hawton and others, 2010
In 2015 deaths involving other types of antidepressants (such as venlafaxine or mirtazapine) fell for the first time since 2010, decreasing by 14% between 2014 and 2015 to 133 deaths. The National Institute for Health and
suggest that these drugs should not be used as a first-line Clinical Excellence (NICE) guidelines from 2009treatment for depression, and should only be prescribed to people who have not responded to SSRIs. Venlafaxine in particular is associated with a greater risk of death from overdose. Prescriptions for these antidepressants have increased in recent years, but still only accounted for only 20% of all antidepressant prescriptions in 2015 ( ) and yet they were responsible for Prescription cost analysis data from NHS Digital, 201630% of deaths where antidepressants were mentioned.
In contrast to the decreasing number of deaths involving antidepressants, between 2014 and 2015 prescriptions for these drugs rose by 7% ( and ).NHS Digital, prescription cost analysis data, 2015 2016
19 . Deaths involving antipsychotics decrease by 20% in 2015
There were 101 deaths related to antipsychotics (most commonly quetiapine) in 2015 (a 20% decrease from 2014), which reverses the gradually increasing trend that had been seen since around 2000. In contrast, the number of prescriptions for antipsychotic drugs increased by 5% in 2015 ( NHS Digital, prescription cost analysis
and ). It is unclear why the trends in deaths for prescription medications such as antidepressants data, 2015 2016and antipsychotics are decreasing but prescriptions are increasing.
20 . Propranolol deaths continue to rise
Propranolol is a beta blocker that is used to treat a range of conditions such as hypertension, angina, migraine and anxiety. Deaths involving propranolol have been increasing since 2009 and reached a new peak of 55 deaths in 2015. This is consistent with prescription data which shows an increase of 7% between 2014 and 2015.

Page 17 of 27
1.
2.
3.
4.
21 . People aged 30 to 49 have the highest rate of drug misuse deaths
Figure 5: Age-specific mortality rates for deaths related to drug misuse, deaths registered in 1993 to 2015
England and Wales
Source: Office for National Statistics
Notes:
Age-standardised mortality rates per 1 million population, standardised to the 2013 European Standard Population.
Cause of death was defined using the International Classification of Diseases, Ninth Revision (ICD-9) for the years 1993 to 2000 and Tenth Revision (ICD-10) from 2001 onwards. More details can be found in the Quality and Methodology Information.
Figures are for deaths registered, rather than deaths occurring in each calendar year.
Figures for England and Wales include deaths of non-residents.
In 2015, as in recent years, people aged 30 to 49 had the highest rate of drug misuse deaths (significantly higher than any other age group). Moreover, there have been very sharp increases in drug misuse mortality rates in this age group since 2012. In people aged 30 to 39, the rate has increased by 46% between 2012 and 2015 to 98.4 deaths per million population; and in 40 to 49-year-olds the rate increased by 52% over the same period, reaching 95.1 deaths per million in 2015. The 2015 rates are the highest on record for these age groups.

Page 18 of 27
The mortality rate from drug misuse has also increased sharply in people aged 50 to 69 over this period. In contrast, the rate in people aged 20 to 29 has levelled off in the last 2 years. This means that for the first time since records began in 1993, the mortality rate in 2015 was higher in people aged 50 to 69 than the 20 to 29 age group (40.1 and 39.8 deaths per million respectively).
Figure 5 shows that the mortality rate for deaths related to drug misuse in the youngest and oldest age groups has remained relatively stable in 2015: 2.7 deaths per million population for those aged under 20 and 11.5 deaths per million in people aged 70 and over.
Reference table 7 contains the number of deaths involving selected substances by age group. This table shows that the increase in deaths in 2015 for people aged 30 to 49 is largely due to a rise in deaths involving heroin and/or morphine and cocaine. For those aged 50 to 69, the increase in 2015 appears to be due to deaths involving heroin/morphine and methadone.
Additional exploratory analysis of other health conditions reported on the death certificate of drug misuse deaths indicate that mentions of respiratory diseases such as chronic obstructive pulmonary disease (COPD) and diseases of the liver such as hepatitis have increased since 2001. These findings support the idea that there is an increasing prevalence of poor physical health amongst those dying from drug misuse.
22 . North East had the highest drug misuse mortality rate in England in 2015
In England as a whole, the mortality rate from drug misuse has increased for 3 consecutive years, marking a reversal of the declining trend which was seen between 2008 and 2012. In 2015, the rate increased by 8% from 39.7 to 42.9 deaths per million population – reaching an all time high.
Nevertheless, there was considerable regional variation within England in deaths relating to drug misuse. In 2015, as in the previous 2 years, the highest mortality rates were in the North East (68.2 deaths per million population) and the North West (59.6 deaths per million).
Of the 9 regions of England, Yorkshire and the Humber and London saw significant increases in the mortality rates from drug misuse between 2014 and 2015. The largest of these increases was in Yorkshire and the Humber where the mortality rate rose by 52%, from 38.1 in 2014 to 57.8 per million population in 2015. It is too soon to say whether the large increase in mortality in Yorkshire and the Humber is the start of an upward trend, or an artefact of registration delays. The largest decrease in rates was in the West Midlands where the rate fell by 8% from 44.7 to 41.1 deaths per million population, however this decrease was not statistically significant. The mortality rates in the remaining regions remained stable in 2015.
In Wales, there was a 49% increase in the mortality rate for deaths related to drug misuse in 2015, up from 39.0 in 2014 to 58.3 deaths per million population. This follows a period of declining mortality rates between 2010 and 2014. However, when data are analysed by the year the death occurred rather than the year of registration (Figure 11) there is a much smoother trend in deaths related to drug misuse in Wales. There is a sharp decline in deaths between 2009 and 2011, followed by a more gradual rise since then. This suggests that the large increase in the mortality rate in 2015 is likely an artefact of registration delays and the rate for deaths registered in 2014 was artificially low. See the section on registration delays below for a further discussion of this issue.

Page 19 of 27
Figure 6: Age-standardised mortality rate for drug misuse deaths, 2015 registrations
England and Wales
23 . Comparisons with other countries
Figures on drug-related deaths in Scotland are available from National Records of Scotland. These show that there were 706 deaths related to drug misuse registered in Scotland in 2015, 15% higher than in 2014, and the highest on record. Additional data on Scottish drug-related deaths is available from the Information Services
.Division of NHS Scotland
Figures for Northern Ireland are available from the . The latest Northern Ireland Statistics and Research Agencyfigures show that there were 88 drug misuse deaths registered in Northern Ireland in 2014, up 11% compared with 2013.
Statistics for Europe are available from the European Monitoring Centre for Drugs and Drug Addiction (EMCDDA). The latest figures show the drug-related mortality rate among adults in the United Kingdom (aged 15 to 64) was almost 3 times greater than the average European rate ( ).EMCDDA, 2016
Figures for other countries may not be comparable with those presented here for England and Wales, due to differences in data collection methods and in the death registration system.
24 . Most drug misuse deaths are accidental poisonings
In both males and females, the largest proportion of drug misuse deaths were from accidental poisonings, though a greater proportion of male deaths are accidents (83% of male deaths and 67% of female deaths). In males, both the proportion and the actual number of accidental poisonings increased between 2014 and 2015 – from 1,291 (79%) to 1,536 (83%) deaths. In females, the number of accidental poisonings increased sharply between 2013 and 2014, but then stabilised – with 429 deaths in 2014 and 428 deaths in 2015.
Page 20 of 27
1.
2.
3.
4.
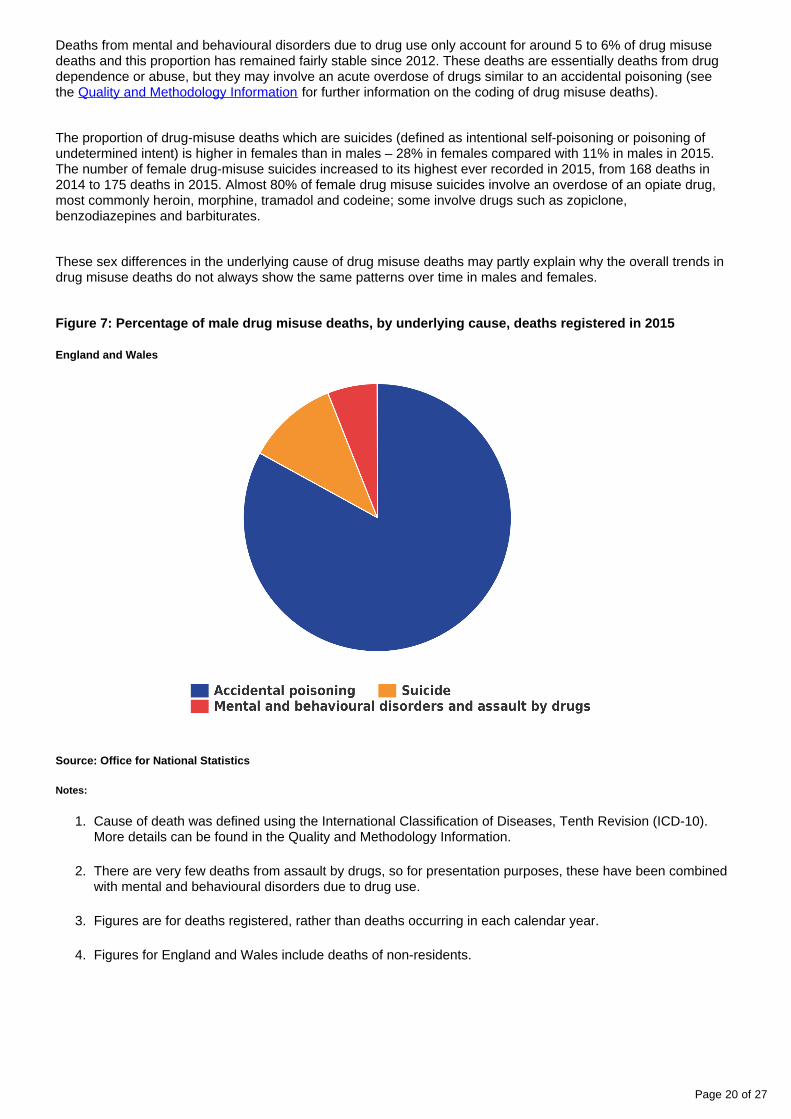
Deaths from mental and behavioural disorders due to drug use only account for around 5 to 6% of drug misuse deaths and this proportion has remained fairly stable since 2012. These deaths are essentially deaths from drug dependence or abuse, but they may involve an acute overdose of drugs similar to an accidental poisoning (see the for further information on the coding of drug misuse deaths).Quality and Methodology Information
The proportion of drug-misuse deaths which are suicides (defined as intentional self-poisoning or poisoning of undetermined intent) is higher in females than in males – 28% in females compared with 11% in males in 2015. The number of female drug-misuse suicides increased to its highest ever recorded in 2015, from 168 deaths in 2014 to 175 deaths in 2015. Almost 80% of female drug misuse suicides involve an overdose of an opiate drug, most commonly heroin, morphine, tramadol and codeine; some involve drugs such as zopiclone, benzodiazepines and barbiturates.
These sex differences in the underlying cause of drug misuse deaths may partly explain why the overall trends in drug misuse deaths do not always show the same patterns over time in males and females.
Figure 7: Percentage of male drug misuse deaths, by underlying cause, deaths registered in 2015
England and Wales
Source: Office for National Statistics
Notes:
Cause of death was defined using the International Classification of Diseases, Tenth Revision (ICD-10). More details can be found in the Quality and Methodology Information.
There are very few deaths from assault by drugs, so for presentation purposes, these have been combined with mental and behavioural disorders due to drug use.
Figures are for deaths registered, rather than deaths occurring in each calendar year.
Figures for England and Wales include deaths of non-residents.

Page 21 of 27
1.
2.
3.
4.
Figure 8: Percentage of female drug misuse deaths, by underlying cause, deaths registered in 2015
England and Wales
Source: Office for National Statistics
Notes:
Cause of death was defined using the International Classification of Diseases, Tenth Revision (ICD-10). More details can be found in the Quality and Methodology Information.
There are very few deaths from assault by drugs, so for presentation purposes, these have been combined with mental and behavioural disorders due to drug use.
Figures are for deaths registered, rather than deaths occurring in each calendar year.
Figures for England and Wales include deaths of non-residents.
25 . Impact of registration delays on drug misuse deaths
In England and Wales, almost all drug-related deaths are certified by a coroner following an inquest. The death cannot be registered until the inquest is completed, which can take many months or even years and we are not notified that a death has occurred until it is registered.
In common with most other mortality statistics, figures for drug-related deaths are presented for deaths registered in a particular calendar year, rather than deaths occurring each year. This enables figures to be published in a more timely manner, but can make the trends more difficult to interpret, especially for smaller geographical areas.
Out of the 2,479 deaths related to drug misuse registered in 2015, just under half (1,132) occurred in years prior to 2015. This proportion is slightly lower than in recent years.

Page 22 of 27
1.
2.
3.
4.
Figure 9: Average registration delay for deaths related to drug misuse, by country, deaths registered in 1993 to 2015
England and Wales
Source: Office for National Statistics
Notes:
The registration delay is calculated as the difference between the date each death occurred and the date it was registered, measured in days. The average delay is represented using the median.
Cause of death was defined using the International Classification of Diseases, Ninth Revision (ICD-9) for the years 1993 to 2000 and Tenth Revision (ICD-10) from 2001 onwards. More details can be found in the Quality and Methodology Information.
Figures are for deaths registered, rather than deaths occurring in each calendar year.
Figures are for persons usually resident in England and Wales, based on boundaries as of May 2016.
Figure 9 illustrates that the average (median) registration delay for deaths related to drug misuse differs between England and Wales. Overall, England has shown a much smoother pattern in registration delays compared with Wales (due to the larger population and greater number of drug misuse deaths). From 1993 (when records began) registration delays rose steadily in England, peaking in 2013, but have fallen in the last 2 years to 157 days in 2015. Moreover, despite registration delays, for England, the number of drug misuse deaths that were registered in a year and those that occurred in a year show a similar trend.
In Wales, registration delays peaked in 2006, but then generally decreased quite sharply until 2014, when the delay was 140 days. The delay has since increased to 155 days in 2015, and is now in line with the figure for England. These fluctuations in registration delays in Wales have made it difficult to interpret trends in drug misuse deaths in recent years as, unlike in England, the trend based on registration year is inconsistent with the trend based on occurrence year (see Figures 10 and 11 below).

Page 23 of 27
1.
2.
3.
Figure 11 shows that, for Wales, trends in drug misuse deaths by registration year and occurrence year began to differ substantially from 2010 onwards. In 2014, the trend based on registration year suggested a fairly large decrease in drug misuse deaths, but when the data is analysed by occurrence year, deaths were actually increasing in 2014. Deaths in 2015 are not shown in Figure 11, as occurrences data is too incomplete for 2015. Once we have the late registrations, we would expect that occurrences data will show that drug misuse deaths continued to rise in 2015, but the increase will not be as dramatic as the 49% increase in 2015 suggested by the registrations data. While we have not been able to precisely identify the reason why trends based on registration year were less accurate in Wales in 2014 and 2015, it is likely to be related to changes in the time taken to register drug misuse deaths in some coroners’ areas in Wales in recent years.
Figure 10: Number of deaths from drug misuse by registration year and occurrence year, 1993 to 2014
England
Source: Office for National Statistics
Notes:
Cause of death was defined using the International Classification of Diseases, Ninth Revision (ICD-9) for the years 1993 to 2000 and Tenth Revision (ICD-10) from 2001 onwards. More details can be found in the Quality and Methodology Information.
Figures only include deaths that were registered by 31 December 2015. Due to the length of time it takes to complete a coroner’s inquest, it can take months or even years for a drug-related death to be registered, so figures for deaths occurring in 2014 will be an underestimate.
Deaths of persons usually resident in England, based on boundaries as of May 2016.

Page 24 of 27
1.
2.
3.
Figure 11: Number of deaths from drug misuse by registration year and occurrence year, 1993 to 2014
Wales
Source: Office for National Statistics
Notes:
Cause of death was defined using the International Classification of Diseases, Ninth Revision (ICD-9) for the years 1993 to 2000 and Tenth Revision (ICD-10) from 2001 onwards. More details can be found in the Quality and Methodology Information.
Figures only include deaths that were registered by 31 December 2015. Due to the length of time it takes to complete a coroner’s inquest, it can take months or even years for a drug-related death to be registered, so figures for deaths occurring in 2014 will be an underestimate.
Deaths of persons usually resident in Wales, based on boundaries as of May 2016.
26 . Links to related ONS information
All of the data used to compile the tables and charts in this bulletin can be downloaded in Excel format from our website. Data on all drug-related deaths (including legal and illegal drug poisonings) are also available in the same Excel file. A second Excel document containing statistics on drug misuse deaths by local authority can also be downloaded from our website.
A list of the names of those given pre-publication access to the statistics and written commentary for deaths related to drug poisoning in England and Wales in 2015 is available in this pre-release access list. The rules and principles which govern pre-release access are featured in the Pre-release Access to Official Statistics Order
.2008
Special extracts and tabulations of drug-related deaths data for England and Wales are available to order (subject to legal frameworks, disclosure control, resources and the , where appropriate). ONS charging policy User
will be published on our website. Enquiries should be made to the Mortality Analysis Team: Email requested data Telephone +44 (0) 1633 455341)[email protected]

Page 25 of 27
1.
2.
3.
4.
5.
6.
7.
We publish a wide range of mortality statistics, the most detailed of these being the Deaths registered in England series, which contains a detailed breakdown of the deaths by sex age group and underlying cause of and Wales
death, as well as other mortality statistics.
Trends in deaths by suicide are often closely related to drug-related deaths, and a bulletin containing statistics on is published annually on our website.Suicides in the United Kingdom
We also release statistics on trends in . This includes deaths from alcohol-related deaths in the United Kingdomchronic conditions associated with long-term alcohol abuse like liver cirrhosis, as well as acute alcohol poisoning.
Local area mortality data by sex, age and underlying cause of death can be downloaded from the .Nomis website
27 . Quality and methodology
Statistics on drug-related deaths are used by a range of public bodies, such as Public Health England (PHE), the Department of Health (DH), the Home Office, Public Health Wales and the Welsh government to evaluate the effectiveness of various strategies in reducing drug-related deaths. They are also used by The European Monitoring Centre for Drugs and Drug Addiction (EMCDDA) to compare trends in drug deaths across Europe.
The drug-related deaths document contains important information on:Quality and Methodology Information
the strengths and limitations of the data
the quality of the output: including the accuracy of the data, how it compares with related data
policy context and uses of the data
how the output was created
comparability between countries of the UK
Cause of death is coded using the World Health Organization’s (WHO) International Classification of (ICD). All deaths where the underlying cause is drug-related are included on a special database, Diseases
and additional processing is carried out to identify the specific substances involved in the death. Further details about the drug poisoning database, including the ICD codes used to define a drug-related death can be found in the .Quality and Methodology Information
Age-standardised mortality rates were calculated using the number of drug-related deaths registered in each year as the numerator and the mid-year population estimate for that year as the denominator. Please see the for more details about the calculation of confidence intervals Quality and Methodology Informationand the interpretation of age-standardised rates.
In common with most other mortality statistics, figures for drug-related deaths are presented for deaths registered in a particular calendar year, rather than deaths occurring each year. Due to the length of time it takes to complete a coroner’s inquest, there can be a considerable delay between when the death occurred and when it was registered. See the Impact of registration delays on drug misuse deaths statistics section above for more information.
The provides further information on the collection, production and quality User guide to mortality statisticsof the underlying mortality data on which drug-related death statistics are based.
The is available on our website.Revisions policy for mortality statistics

Page 26 of 27
1.
2.
3.
4.
5.
6.
7.
8.
9.
10.
11.
12.
13.
14.
15.
16.
17.
18.
19.
20.
21.
28. References
The Advisory Council on the Misuse of Drugs – ACMD (2015) How can Opioid Substitution Therapy (and , drug treatment and recovery systems) be optimised to maximise recovery outcomes for service users?
accessed on 31 August 2016
Bazazi A.R. and others (2015) High prevalence of non-fatal overdose among people who inject drugs in , Malaysia: correlates of overdose and implications for overdose prevention from a cross-sectional study
International Journal of Drug Policy, 26, 675 to 681, accessed on 26 August 2015
Drugscope (2015) Down a stony road: The 2014 DrugScope Street Drug Survey
European Monitoring Centre for Drugs and Drug Addiction – EMCDDA (2016) European Drug Report 2016: , accessed on 31 August 2016Trends and Developments
Hawton K, Bergen H, Simkin S, Cooper J, Waters K, Gunnell D and Kapur N (2010) Toxicity of , The British Journal of antidepressants: rates of suicide relative to prescribing and non-fatal overdose
Psychiatry 196, 354 to 358, accessed 31 August 2016
HM Inspectorate of Prisons (2015) Changing patterns of substance misuse in adult prisons and service , Accessed on 16 August 2016responses: A thematic review
Home office (2014) , accessed on 31 August Circular 008/2014: changes to the Misuse of Drugs Act 19712016
Home Office (2016) , Drug misuse: Findings from the 2015/16 Crime Survey for England and Walesaccessed on 17 August 2016
The Stationery Office Ltd, , accessed on 19 August 2015The Misuse of Drugs Act (1971)
National Crime Agency (2016), personal communication
National Institute for Health and Clinical Excellence – NICE (2009) Depression in adults: The treatment and , accessed on 31 August 2016management of depression in adults
NHS Digital (2015) , accessed on 31 August 2016Prescription Cost Analysis: England – 2014
NHS Digital (2016) , accessed on 31 August 2016Prescription Cost Analysis, England – 2015
Office for National Statistics – ONS (2016) Deaths involving legal highs in England and Wales: between , accessed on 31 August 20162004 and 2013
The Stationery Office Ltd, (2016),accessed on 17 August 2016The Psychoactive Substances Act
Public Health England (2015a) Adult substance misuse statistics from the National Drug Treatment , accessed on 11 August 2016Monitoring System (NDTMS) 1 April 2014 to 31 March 2015
Public Health England (2015b) , Take-home naloxone for opioid overdose in people who use drugsaccessed on 30 August 2016
Public Health England (2016) – UK Focal Point On Drugs United Kingdom Drug Situation, 2015 EditionAnnual Report to the European Monitoring Centre for Drugs and Drug Addiction (EMCDDA), accessed on 11 August 2016
Serious Organised Crime Agency – SOCA (2011) Serious Organised Crime Agency Annual Report and , accessed on 31 August 2016Accounts 2010/11
Serious Organised Crime Agency – SOCA (2012) Serious Organised Crime Agency Annual Report and , accessed on 31 August 2016Accounts 2011/12

Page 27 of 27
21.
22.
23.
24.
25.
Serious Organised Crime Agency – SOCA (2013) Serious Organised Crime Agency Annual Report and , accessed on 31 August 2016Accounts 2012/13
Serious Organised Crime Agency – SOCA (2014) Serious Organised Crime Agency Annual Report and , accessed on 31 August 2016Accounts 2013/14
United Nations (2015) , accessed on 11 August 2016World Annual Drug Report, 2015
United Nations (2016) , accessed on 11 August 2016World Annual Drug Report, 2016
World Health Organisation – WHO (2014) International Statistical Classification of Diseases and Related . WHO: Geneva, accessed on 31 August 2016Health Problems, volumes 1, 2 and 3 (Tenth Revision)
https://www.gov.uk/government/publications/serious-organised-crime-agency-annual-report-2013-to-2014