Dear Acxiom Shareholder,Dear Acxiom Shareholder, Our 40th year in business was a time of...
96
Transcript of Dear Acxiom Shareholder,Dear Acxiom Shareholder, Our 40th year in business was a time of...

Acxiom is a recognized leader in marketing technology and services that enable marketers to successfully manage audiences, personalize consumer experiences and create profi table customer relationships. Our superior industry-focused, consultative approach combines consumer data and analytics, databases, data integration and consulting solutions for personalized, multichannel marketing strategies. Acxiom leverages over 40 years of experience of data management to deliver high-performance, highly secure, reliable information management services. Founded in 1969, Acxiom is headquartered in Little Rock, Arkansas, USA, and serves clients around the world from locations in the United States, Europe, Asia-Pacifi c and the Middle East. For more information about Acxiom, visit Acxiom.com
UNITED STATESConway, ArkansasFayetteville, ArkansasLittle Rock, ArkansasFoster City, CaliforniaBroomfi eld, ColoradoCape Coral, FloridaAlpharetta, GeorgiaChicago, IllinoisDowners Grove, IllinoisElk Grove Village, IllinoisSouthfi eld, MichiganShoreview, MinnesotaNew York, New YorkRochester, New YorkFairlawn, OhioIndependence, Ohio
Durham, North CarolinaMemphis, TennesseeNashville, Tennessee
EUROPELondon, United KingdomNormanton, United KingdomSunderland, United KingdomTeddington, United KingdomLille, FranceParis, FranceFrankfurt, GermanyMunich, GermanyAmsterdam, The NetherlandsGdansk, PolandWarsaw, PolandLisbon, Portugal
AUSTRALIA/NEW ZEALANDMelbourne, AustraliaSydney, AustraliaAuckland, New Zealand
ASIABeijing, ChinaNantong, ChinaShanghai, ChinaSingapore
MIDDLE EAST AND NORTH AFRICAJeddah, Saudi ArabiaDubai, United Arab Emirates
Dear Acxiom Shareholder,
Our 40th year in business was a time of unprecedented challenges and unfolding opportunities. With the global economy struggling to recover from the worst recession in generations, many of our clients began fiscal 2010 reluctant to invest in marketing initiatives. In response, we remained focused on expense management and cash generation while continuing to invest in innovations designed to drive growth when the market recovers. This balanced approach has created an opportunity for us to emerge from the recession a stronger competitor in a new position: better able to deliver targeted marketing campaigns for our clients while creating value for our shareholders and opportunity for our associates.
I want to emphasize that none of this progress would have been possible without the hard work and dedication of our associates worldwide. I am grateful for all they do and am proud to be part of the Acxiom Team.
As we consider fiscal 2011, one thing is certain: Our clients are confronting a rapidly changing and increasingly fragmented media landscape. In such a complex environment, marketing is about recognizing customers across a broader spectrum of channels – mail, e-mail, banner ads, mobile, addressable TV and social media – and delivering highly personalized messages to those customers in a way that preserves security and privacy. Acxiom is uniquely positioned to meet these demands.
We believe only Acxiom has all the necessary tools under one roof: the largest and most accurate consumer database, deep analytics, robust communication technologies, and the world’s foremost consumer recognition engine, leveraging a commercial cloud computing environment and award-winning, secure processing. This unique combination enables repeatable, scalable, and measurable marketing programs.
In short, Acxiom has the competitive capabilities to become the leading engine for real-time audience targeting and consumer engagement across all devices and channels.
Operational Transformation
It’s important to note that we did not reach this position overnight. In fact, we have been engaged in a disciplined, two-year initiative to change the way we do business. In fiscal 2009, we paired fiscal controls with individual accountability for achieving results, centralized our sales force and enhanced the focus of our account relationship practices.
In fiscal 2010, we stepped up the effort to standardize our marketing solutions process. While many of our very large customers value a highly customized solution, our approach is to have a standardized framework of components to enhance efficiency and speed to deployment while allowing for unique capabilities in the higher value parts of the process. That approach has created operational effectiveness and economic leverage which can be scaled to meet the needs of a broad array of clients, regardless of industry or marketing philosophy. At the same time, we recognize the need for flexibility and have retained the
ability to customize value-added solutions for clients where it makes sense for them and for Acxiom.
Internally, we have remained focused on expense management. The economic downturn forced some layoffs, but we sought to limit the number by employing alternative cost control measures, including a tiered reduction in compensation. We did this to minimize the disruptive effects on the business – which requires a stable, skilled workforce – and on the lives of our associates.
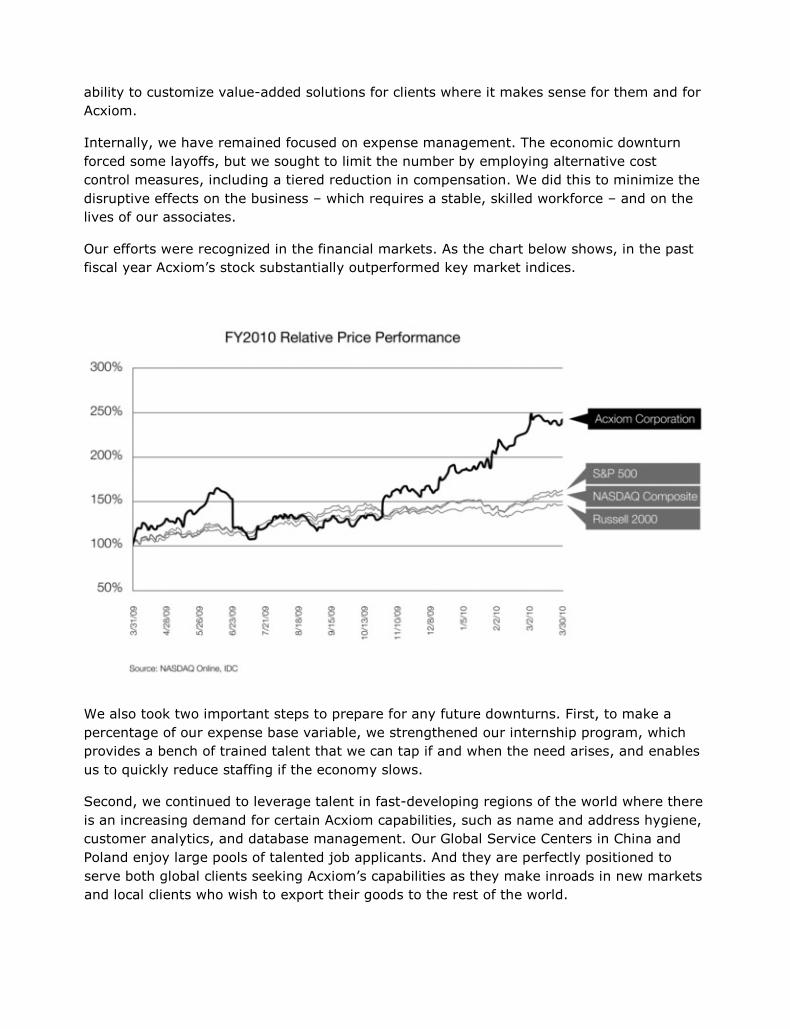
Our efforts were recognized in the financial markets. As the chart below shows, in the past fiscal year Acxiom’s stock substantially outperformed key market indices.
We also took two important steps to prepare for any future downturns. First, to make a percentage of our expense base variable, we strengthened our internship program, which provides a bench of trained talent that we can tap if and when the need arises, and enables us to quickly reduce staffing if the economy slows.
Second, we continued to leverage talent in fast-developing regions of the world where there is an increasing demand for certain Acxiom capabilities, such as name and address hygiene, customer analytics, and database management. Our Global Service Centers in China and Poland enjoy large pools of talented job applicants. And they are perfectly positioned to serve both global clients seeking Acxiom’s capabilities as they make inroads in new markets and local clients who wish to export their goods to the rest of the world.
Innovative Thinking
Innovation is central to our continued success. I would like to touch on three examples that demonstrate our commitment to cutting-edge thinking.
We recently announced the ability to create targeted online media based on offline data. Acxiom’s Relevance-X® is a multichannel targeting suite that uses multiple methods of targeting to deliver audiences of consumers through a variety of channels, including online, mobile, addressable TV and social media without compromising privacy or security.
We continue to invest in our patented AbiliTec® matching technology to create a robust platform that recognizes customers across all channels, like email, mobile and home phone numbers, and drives the performance and precision of our multichannel marketing services. Those services currently are employed by 33 percent of our largest clients.
Finally, our infrastructure cloud service provides clients with a way to increase computing capabilities without designing and investing in new infrastructure, training new personnel, or licensing new infrastructure software. It includes a variety of secure, on-demand services, including utility server, storage, and network and data protection, and delivers immediate value to our clients.
International Opportunities
Expanding our international footprint remains key to Acxiom’s growth strategy as well as that of our clients. Our multinational clients demand uniform marketing services across all of their markets, and we are aggressively building our capacity in that arena.
To that end, we recently announced the purchase of a controlling interest in GoDigital, a data quality and precision marketing company in Sao Paulo and Porto Alegre, Brazil. This acquisition will extend Acxiom’s reach into South America and give our company additional platforms for executing and analyzing multichannel marketing campaigns.
Other developments:
In March, we opened a new Global Service Center in Nantong, China. In addition to the services mentioned above, it will provide software development, systems management, data analysis and statistical analysis to clients in China and around the world.
In September, we acquired a majority ownership interest in DMS (Direct Marketing Services) in Saudi Arabia and the United Arab Emirates, giving us an entry point into
the Middle East. DMS is the premier provider of direct marketing services in the region.
In Poland, our Global Service Center has grown from 25 associates three years ago to more than 200 in two locations, Warsaw and Gdansk, as demand for its services has increased. Taking advantage of the time difference between the U.S. and Poland, our U.S. associates hand off jobs to their Polish counterparts at the end of their work day, increasing efficiency and shortening delivery times.
Signs of Growth
In summary, the fact that Acxiom has such a broad array of sophisticated capabilities under one roof means we can deliver personalized marketing messages in the integrated and efficient way that today’s consumers expect. As a result, marketers increasingly understand and appreciate Acxiom’s value proposition, and look to us more and more as a combination of trusted adviser and execution engine who can make their programs successful.
I want to close by thanking our shareholders for the confidence you have placed in our board, our management team and our associates. We look forward to serving you in 2011.
Best regards,
John A. Meyer
CEO & President
Underscoring that progress, more clients agreed to long-term contracts in fiscal 2010 despite lingering economic headwinds. And, in the second half of the year, we began to see our clients step up their marketing activities. These signs of growth are encouraging as we focus on fiscal 2011, and I truly believe we start the new year a stronger organization, better positioned than ever to seize our opportunities while weathering economic uncertainties.
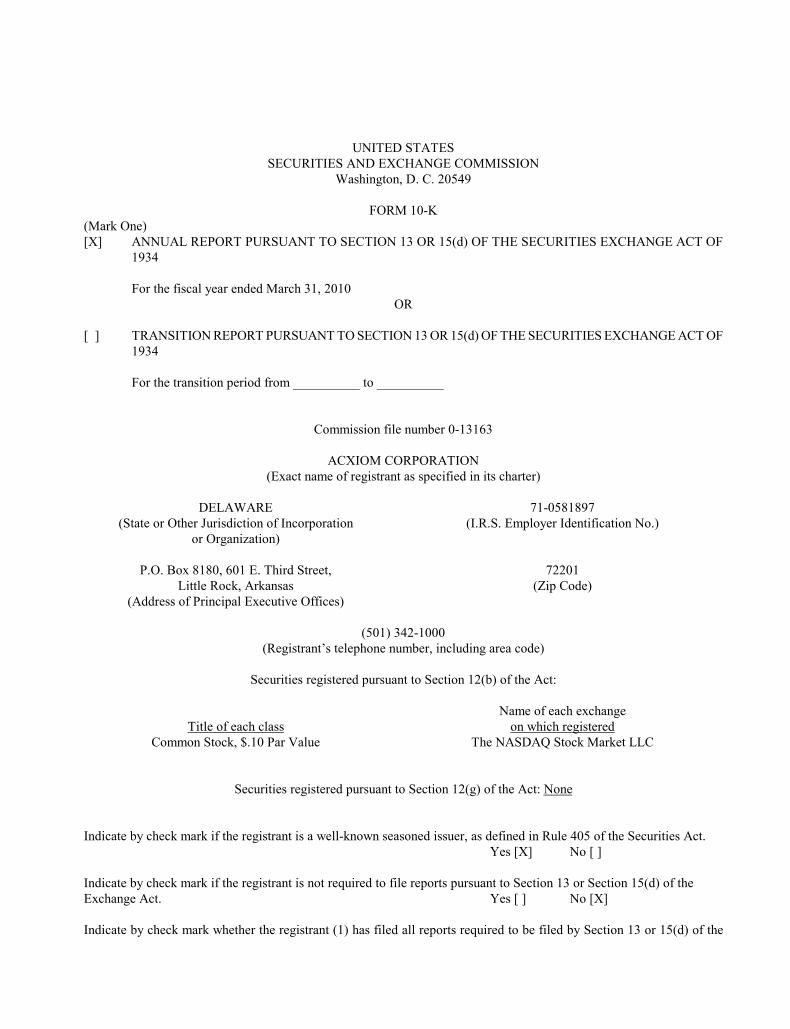
UNITED STATESSECURITIES AND EXCHANGE COMMISSION
Washington, D. C. 20549
FORM 10-K(Mark One)[X] ANNUAL REPORT PURSUANT TO SECTION 13 OR 15(d) OF THE SECURITIES EXCHANGE ACT OF
1934
For the fiscal year ended March 31, 2010OR
[ ] TRANSITION REPORT PURSUANT TO SECTION 13 OR 15(d) OF THE SECURITIES EXCHANGE ACT OF 1934
For the transition period from __________ to __________
Commission file number 0-13163
ACXIOM CORPORATION(Exact name of registrant as specified in its charter)
DELAWARE(State or Other Jurisdiction of Incorporation
or Organization)
71-0581897(I.R.S. Employer Identification No.)
P.O. Box 8180, 601 E. Third Street,Little Rock, Arkansas
(Address of Principal Executive Offices)
72201(Zip Code)
(501) 342-1000(Registrant’s telephone number, including area code)
Securities registered pursuant to Section 12(b) of the Act:
Title of each className of each exchange
on which registeredCommon Stock, $.10 Par Value The NASDAQ Stock Market LLC
Securities registered pursuant to Section 12(g) of the Act: None
Indicate by check mark if the registrant is a well-known seasoned issuer, as defined in Rule 405 of the Securities Act. Yes [X] No [ ]
Indicate by check mark if the registrant is not required to file reports pursuant to Section 13 or Section 15(d) of the Exchange Act. Yes [ ] No [X]
Indicate by check mark whether the registrant (1) has filed all reports required to be filed by Section 13 or 15(d) of the
2
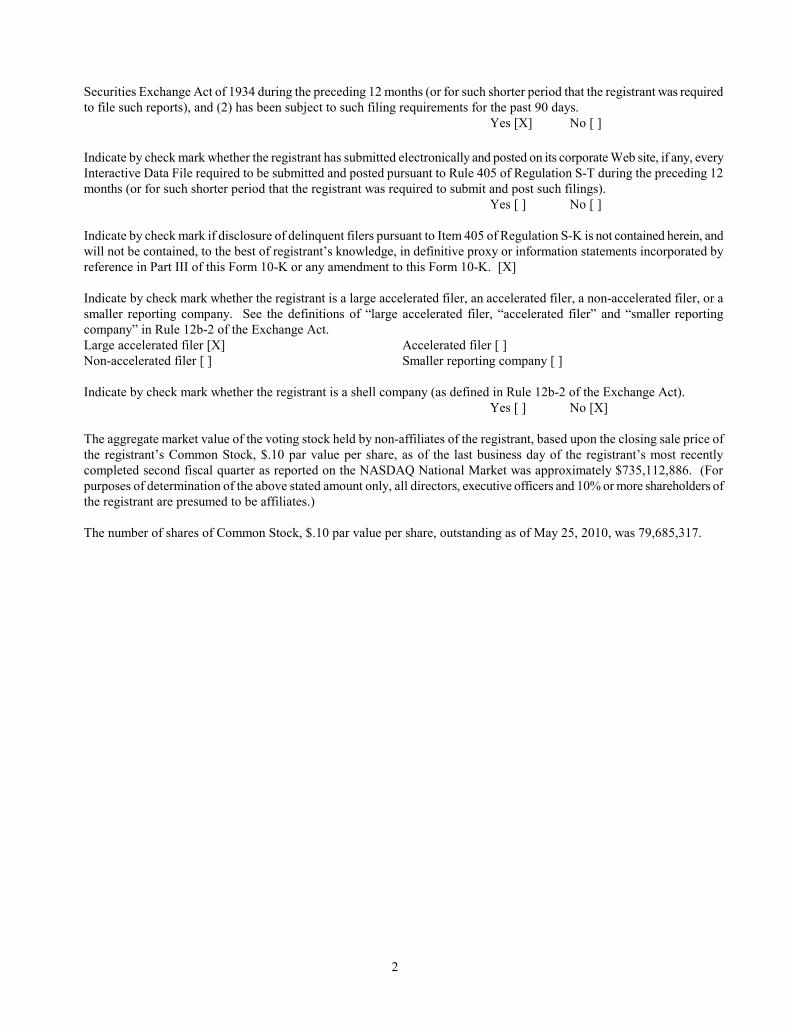
Securities Exchange Act of 1934 during the preceding 12 months (or for such shorter period that the registrant was required to file such reports), and (2) has been subject to such filing requirements for the past 90 days.
Yes [X] No [ ]
Indicate by check mark whether the registrant has submitted electronically and posted on its corporate Web site, if any, every Interactive Data File required to be submitted and posted pursuant to Rule 405 of Regulation S-T during the preceding 12 months (or for such shorter period that the registrant was required to submit and post such filings).
Yes [ ] No [ ]
Indicate by check mark if disclosure of delinquent filers pursuant to Item 405 of Regulation S-K is not contained herein, and will not be contained, to the best of registrant’s knowledge, in definitive proxy or information statements incorporated by reference in Part III of this Form 10-K or any amendment to this Form 10-K. [X]
Indicate by check mark whether the registrant is a large accelerated filer, an accelerated filer, a non-accelerated filer, or a smaller reporting company. See the definitions of “large accelerated filer, “accelerated filer” and “smaller reporting company” in Rule 12b-2 of the Exchange Act.Large accelerated filer [X] Accelerated filer [ ]Non-accelerated filer [ ] Smaller reporting company [ ]
Indicate by check mark whether the registrant is a shell company (as defined in Rule 12b-2 of the Exchange Act).Yes [ ] No [X]
The aggregate market value of the voting stock held by non-affiliates of the registrant, based upon the closing sale price of the registrant’s Common Stock, $.10 par value per share, as of the last business day of the registrant’s most recently completed second fiscal quarter as reported on the NASDAQ National Market was approximately $735,112,886. (For purposes of determination of the above stated amount only, all directors, executive officers and 10% or more shareholders of the registrant are presumed to be affiliates.)
The number of shares of Common Stock, $.10 par value per share, outstanding as of May 25, 2010, was 79,685,317.
3
Table of Contents PageDocuments Incorporated by Reference ................................................................................................................. 4
Part I
Availability of SEC Filings and Corporate Governance Information; Cautionary Statements.............................. 4
Item 1. Business ................................................................................................................................................ 6
Item 1A. Risk Factors .......................................................................................................................................... 13
Item 1B. Unresolved Staff Comments ................................................................................................................. 17
Item 2. Properties .............................................................................................................................................. 18
Item 3. Legal Proceedings ................................................................................................................................. 20
Part II
Item 5. Market for Registrant’s Common Equity, Related Stockholder Matters and Issuer Purchases of Equity Securities ................................................................................................................................... 20
Item 6. Selected Financial Data ........................................................................................................................ 23
Item 7. Management’s Discussion and Analysis of Financial Condition and Results of Operations ................ 23
Item 7A. Quantitative and Qualitative Disclosures About Market Risk .............................................................. 23
Item 8. Financial Statements and Supplementary Data ..................................................................................... 23
Item 9. Changes in and Disagreements With Accountants on Accounting and Financial Disclosure ............... 23
Item 9A. Controls and Procedures ....................................................................................................................... 23
Item 9B. Other Information ................................................................................................................................. 24
Part III
Item 10. Directors, Executive Officers and Corporate Governance..................................................................... 24
Item 11. Executive Compensation ...................................................................................................................... 24
Item 12. Security Ownership of Certain Beneficial Owners and Management and Related Stockholder Matters................................................................................................................................................... 24
Item 13. Certain Relationships and Related Transactions, and Director Independence…………………........... 24
Item 14. Principal Accountant Fees and Services .............................................................................................. 25
Part IV
Item 15. Exhibits and Financial Statement Schedules.......................................................................................... 25
Signatures ............................................................................................................................................................. 29
Financial Supplement ........................................................................................................................................... F-1 – F-58
4
DOCUMENTS INCORPORATED BY REFERENCE
Portions of Acxiom’s Proxy Statement for the 2010 Annual Meeting of Shareholders (“2010 Proxy Statement”) are incorporated by reference into Part III of this Form 10-K.
PART I
AVAILABILITY OF SEC FILINGS AND CORPORATE GOVERNANCE INFORMATION
Our website address is www.acxiom.com, where copies of documents which we have filed with the Securities and Exchange Commission may be obtained free of charge as soon as reasonably practicable after being filed electronically. Included among those documents are our Annual Report on Form 10-K, Quarterly Reports on Form 10-Q, Current Reports on Form 8-K, and amendments to those reports filed or furnished pursuant to Section 13(a) or 15(d) of the Exchange Act. Copies may also be obtained through the SEC’s EDGAR site, or by sending a writtenrequest for copies to Acxiom Investor Relations, 601 East Third Street, Little Rock, AR 72201. Copies of all of ourSEC filings were available on our website during the past fiscal year covered by this Form 10-K. In addition, at the “Corporate Governance” section of our website, we have posted copies of our Corporate Governance Principles, the charters for the Audit/Finance, Compensation, Executive and Governance/Nominating Committees of the Board of Directors, the codes of ethics applicable to directors, financial personnel and all employees, and other information relating to the governance of the Company.
CAUTIONARY STATEMENTS RELEVANT TO FORWARD-LOOKING INFORMATION
This Annual Report on Form 10-K, including, without limitation, the items set forth on pages F-3 – F-18 in Management’s Discussion and Analysis of Financial Condition and Results of Operations, contains and may incorporate by reference certain statements that may be deemed to be “forward-looking statements” within the meaning of the Private Securities Litigation Reform Act of 1995, as amended (as amended, the “PSLRA”), and that are intended to enjoy the protection of the safe harbor for forward-looking statements provided by the PSLRA.These statements, which are not statements of historical fact, may contain estimates, assumptions, projections and/or expectations regarding the Company’s financial position, results of operations, market position, product development, growth opportunities, economic conditions, and other similar forecasts and statements of expectation. Forward-looking statements are often identified by words or phrases such as “anticipate,” “estimate,” “plan,” “expect,” “believe,” “intend,” “foresee,” and similar words or phrases. These forward-looking statements are not guarantees of future performance and are subject to a number of factors and uncertainties that could cause the Company’s actual results and experiences to differ materially from the anticipated results and expectations expressed in the forward-looking statements.
Forward-looking statements may include but are not limited to the following:management’s expectations about the macro economy;that the amounts for restructuring and impairment charges and accruals for litigation will be within estimated ranges;that the cash flows used in estimating the recoverability of assets will be within the estimated ranges; andthat items which management currently believes are not material will continue to not be material in the future.
Among the factors that may cause actual results and expectations to differ from anticipated results and expectations expressed in such forward-looking statements are the following:
the risk factors described in Part I, “Item 1A. Risk Factors” and elsewhere in this report and those described from time to time in our future reports filed with the Securities and Exchange Commission;the possibility that in the event a change of control of the Company is sought that certain clients may attempt to invoke provisions in their contracts resulting in a decline in revenue and profit; the possibility that the integration of acquired businesses may not be as successful as planned;
5
the possibility that the fair value of certain of our assets may not be equal to the carrying value of those assets now or in future time periods; the possibility that sales cycles may lengthen; the possibility that we won’t be able to properly motivate our sales force or other associates; the possibility that we may not be able to attract and retain qualified technical and leadership associates, or that we may lose key associates to other organizations; the possibility that we won’t be able to continue to receive credit upon satisfactory terms and conditions; the possibility that competent, competitive products, technologies or services will be introduced into the marketplace by other companies; the possibility that there will be changes in consumer or business information industries and markets that negatively impact the Company; the possibility that we won’t be able to protect proprietary information and technology or to obtain necessary licenses on commercially reasonable terms; the possibility that there will be changes in the legislative, accounting, regulatory and consumer environments affecting our business, including but not limited to litigation, legislation, regulations and customs relating to our ability to collect, manage, aggregate and use data; the possibility that data suppliers might withdraw data from us, leading to our inability to provide certain products and services; the possibility that we may enter into short-term contracts which would affect the predictabilityof our revenues; the possibility that the amount of ad hoc, volume-based and project work will not be as expected; the possibility that we may experience a loss of data center capacity or interruption of telecommunication links or power sources; the possibility that we may experience failures or breaches of our network and data security systems, leading to potential adverse publicity, negative customer reaction, or liability to third parties; the possibility that our clients may cancel or modify their agreements with us; the possibility that we will not successfully complete customer contract requirements on time or meet the service levels specified in the contracts, which may result in contract penalties or lost revenue; the possibility that we experience processing errors which result in credits to customers, re-performance of services or payment of damages to customers; andgeneral and global negative economic conditions
With respect to the provision of products or services outside our primary base of operations in the United States, all of the above factors apply, along with the difficulty of doing business in numerous sovereign jurisdictions due to differences in scale, competition, culture, laws and regulations.
Other factors are detailed from time to time in periodic reports and registration statements filed with the United States Securities and Exchange Commission. The Company believes that we have the product and technology offerings, facilities, associates and competitive and financial resources for continued business success, but future revenues, costs, margins and profits are all influenced by a number of factors, including those discussed above, all of which are inherently difficult to forecast.
In light of these risks, uncertainties and assumptions, the Company cautions readers not to place undue reliance on any forward-looking statements. The Company undertakes no obligation to publicly update or revise any forward-looking statements based on the occurrence of future events, the receipt of new information or otherwise.
6
Item 1. Business
Overview
Acxiom is a recognized leader in marketing technology and services that enable marketers to successfully manage audiences, personalize consumer experiences and create profitable customer relationships. Our superior industry-focused, consultative approach combines consumer data and analytics, databases, data integration and consulting solutions for personalized, multichannel marketing strategies. Acxiom leverages over 40 years of experience of data management to deliver high-performance, highly secure, reliable information management services. Founded in 1969, Acxiom is headquartered in Little Rock, Arkansas, USA, and serves clients around the world from locations in the United States, Europe, Asia-Pacific and the Middle East. For more information about Acxiom, visit www.acxiom.com.
Our client base in the U.S. consists primarily of Fortune 1000 companies in the financial services, insurance, information services, direct marketing, media, retail, consumer packaged goods, technology, automotive, healthcare, travel and telecommunications industries. Our solutions are designed to meet the specific needs of our clients in the industries in which they operate. We target organizations that view data as a strategic competitive advantage and an integral component of their business decision-making process. Every day, Acxiom clients benefit from over 40 yearsof experience serving their information, technology and marketing services needs. We help our clients with:
Recognition of consumers at any touchpoint, leveraging targeting techniques, such as consumer lifestage and retargeting, and creating a single customer view without compromising privacy or securityMultichannel marketing solutions for campaign management across multimedia channels, including personalized email, targeted website, banner and other Web advertisements, search engines, mobile devices, digital TV and direct mail Marketing solutions built on our acquisition- and customer-marketing database framework for customer acquisition, customer growth and retention, and multichannel integrationProfessional consulting that provides analytical tools, household segmentation products, and marketing support infrastructure to help our clients better understand their prospects and customersLarge-scale data and systems management through strategic IT infrastructure servicesIdentity verification and risk information, scoring and analytics for fraud and risk management
Market Growth Drivers
In today’s technologically advanced and competitive business environment, companies are using vast amounts of customer, prospect and marketplace information to manage their businesses. The information services industry provides a broad range of products and services designed to help companies recognize and engage prospects and customers across the broad spectrum of channels. Acxiom’s consultative capabilities, industry and analytic knowledge, premier data content, and technological innovations combine to enable our clients to efficiently access and manage information throughout the enterprise and on a global scale.
We believe the following trends and dynamics of the information services industry provide us with multiple growth opportunities:
Increasing demand for business intelligence by transforming huge stores of data into insight for real-time and operational decision makingIncreasingly targeted, interactive and integrated marketing strategiesConsumer empowerment that enables individuals to better choose, receive and reject information Technological advances in data managementMovement toward multiple communication tools/technology, from search engines to blogs to social networking to addressable TVConsumer privacy, security and fraud management demandsIncreasing demand for identity verification/authenticationGlobalization
7
Our Sales Growth Strategy
Acxiom’s growth strategy will continue to build on our strengths in the direct and digital information-based marketing arenas, serving the largest companies in nearly all marketing industries in the U.S and, increasingly, internationally.
Our current strategy, which builds on past strategies, includes:
Global – Building a strong base outside the U.S.
Multichannel Focus – Expanding our emphasis on marketing technology and services by combining our data and technology assets, including consumer data, consumer recognition, analytics, client databases, digital and direct marketing strategy, media targeting and delivery optimization to create multichannel, insights-driven solutions that enable marketers to reach audiences with greater certainty. Channels include e-mail, SMS, targeted banner ads, mobile advertising and addressable TV.
Consultative Solutions – Designing programs and approaches, from start to finish, which deliver innovation and new returns on investments (ROIs) designed to add significant value for our clients.
Multi-Industry Emphasis – Extending our expertise in financial services to other sectors and markets.
Our growth strategy includes four primary components:
1. Leveraging the depth of Acxiom’s client relationships for increased cross-sell offerings using multiple marketing channels:
Increased focus on designing and recommending integrated multi-element solutions (vs. single-point solutions)Penetration into identified gaps in services provided to existing clientsDevelopment of new multichannel strategies to increase the scope of Acxiom’s offerings for each clientIdentification of new industry, geography and product growth areasAggressive customer sales opportunity management
2. Developing more standardized market-driven and solution-driven products and services:
Productizing our marketing offerings, leveraging our vast case study experiencesIdentifying and cultivating new industry-specific solutionsBetter packaging multi-product solution offerings to appeal to clients and prospectsStandardizing technical product bundlings for operational scale
3. Improving operational effectiveness in all aspects of our business by:
Centralizing our technology architecture and development functions to drive standards and consistencyDriving down unit costs by leveraging “Centers of Excellence” both onshore and offshore Enforcing centralized and prioritized investment across research/development, mergers/acquisitions and infrastructure programs Driving “leaner” practices across client accounts as well as internal business processes
4. Strengthening the culture and mindset of “One Culture, One Team, One Company” by:
Disciplined account planning and business management functionsRigorous pursuit review processes with cross-organizational sign-offsA stronger matrix leadership structure to support our organizational model and foster collaboration
8
Our Competitive Strengths
Using primarily the following competencies, Acxiom seeks to capitalize on market trends to drive growth. These competencies also represent competitive differentiators that we believe uniquely position us to deliver high-value solutions to our clients.
We help our clients transform information into insight to improve their marketing and business results. Our ability to deliver the right data to the right place at the right time enhances our clients’ marketing, risk management, and business decisions. Those abilities revolve around our:
Global multichannel marketing capabilities that can be integrated to form full solutions with measurable ROIConsumer insight products, including data and segmentation Data integration, management and delivery capabilities Information systems technology and managementFraud/risk management and identity authentication
We believe we have the most comprehensive and accurate collection of U.S. consumer, property and telephone marketing data available from a single supplier. Our InfoBase-X® consumer database contains more than 40 billion data elements and covers almost all households in the U.S. We also have strong “reference” data assets – information that clients use for non-marketing purposes, including data used in our employment screening and risk management solution.
We originated the term “Customer Data Integration” (CDI) and believe we are unmatched in our ability to transform and integrate massive amounts of data. We believe our CDI capabilities, combined with related real-time customer recognition software and infrastructure, constitute the leading solution for companies seeking to better integrate their customer data and engage broader audiences across all devices and channels.
As information grows at unprecedented rates and its value increases, companies face a growing need to effectively manage the massive data volumes and transform the information into meaningful insights that drive business results. As one of the world’s largest processors of data, processing well over a trillion records per month, Acxiom’s IT services are well positioned to help information-intensive companies.
We help companies optimize their IT infrastructures, reduce costs and transform information into meaningful intelligence. We achieve this by delivering standardized computing platforms, innovative technology solutions, best-in-class processes and expertise in data management that we believe is unrivaled by any competitor.
The growth of e-commerce and companies’ needs for consumer information mean that we must work even harder to assure that our history of privacy leadership translates to adequate protection of consumer information. We actively promote a set of effective privacy guidelines for the direct marketing, e-commerce, risk management and information industries as a whole. Industry-wide compliance helps address privacy concerns across the globe. Furthermore, we are certified under the European Union safe harbor and contractually comply with other international data protectionrequirements to ensure the continued ability to process information across borders. We have a dedicated team in place to oversee our compliance with the privacy regulations that govern our business activities in the various countries in which we operate.
The U.S. Congress continues to debate privacy legislation, and there are many different types of privacy legislation pending in the 50 states. In most of the non-U.S. locations in which we do business, legislation restricting the collection and use of personal data already exists. We expect this trend to continue and that privacy legislation in various forms will be implemented in both the U.S. and abroad. We are supportive of legislation that codifies the current industry guidelines of notice and opt-out regarding whether a consumer’s personal information is shared with independent third parties for marketing purposes. We also support legislation requiring all custodians of sensitive information to deploy reasonable information security safeguards to protect that information.
9
Business Segments
Acxiom reports segment information consistent with the way we internally disaggregate our operations to assess performance and to allocate resources. In fiscal 2010 our business segments consisted of Information Services and Information Products. The Information Services segment includes the Company’s global lines of business for CDI,Multichannel Marketing Services, Infrastructure Management Services and Consulting Services. The Information Products segment is comprised of the Company’s global Consumer Insights and Risk Mitigation Products lines of business and the U.S. Background Screening Products line of business. We evaluate performance of the segments based on segment operating income, which excludes certain gains, losses and other items. Information concerning the financial results of our fiscal year 2010 business segments is included in note 18 of the Notes to Consolidated Financial Statements and in Management’s Discussion and Analysis of Financial Condition and Results of Operations, which are attached to this Annual Report as part of the Financial Supplement.
Information Services develops, sells and delivers industry-tailored solutions globally through integration of products, services and consulting. Those services include the design and creation of marketing databases and data warehouses; data integration and customer-recognition systems; marketing applications; list processing; and information technology services.
Information Products develops and sells all global data products, including segmentation products and domestic fraud and risk mitigation products as well as online advertising products. For decades, Acxiom has been a leader in creating and making advances in data and segmentation products. Today these include InfoBase-X ,, a customer-centric foundation for all marketing needs with the largest collection of U.S. consumer information available in one source; PersonicX , the industry-leading household segmentation and visualization system; and Acxiom Relevance-X , an online advertising network that lets marketers reach the consumers most likely to be interested in their particular product or service.
Financial information about geographic areas in which we operate, including revenues generated in foreign countriesand long-lived assets located in foreign countries, is set forth in note 16, “Foreign Operations” of the Notes to Consolidated Financial Statements, which is attached to this Annual Report as part of the Financial Supplement.
Seasonality and Inflation
Historically our traditional direct marketing operations experience their lowest revenue in the first quarter of each fiscal year. In order to minimize the impact of these fluctuations, we continue to seek long-term strategic partnerships with more predictable revenues. Revenue from clients who have long-term contracts with the Company (defined as two years or longer), as a percentage of consolidated revenue, was approximately 77% in fiscal 2010compared to 75% in fiscal 2009 and 74% in fiscal 2008.
Although we cannot accurately determine the amounts attributable to inflation, we are affected by inflation through increased costs of compensation, and other operating expenses. If inflation were to increase over the low levels of recent years, the impact in the short run would be to cause an increase in costs, which we would attempt to pass on to clients, although there is no assurance we would be able to do so. Generally, the effects of inflation in recent years have been offset by technological advances, economies of scale and other operational efficiencies.
Clients
Our client base consists primarily of Fortune 1000 companies in the financial services, insurance, information services, direct marketing, media, retail, consumer packaged goods, technology, automotive, healthcare, travel andtelecommunications industries.
Our 10 largest clients represented approximately 32% percent of our revenue in fiscal 2010. No single client accounted for more than 10 percent of the revenues of the Company as a whole or 10% of the revenues of any individual business segment during the last fiscal year. We seek to maintain long-term relationships with our clients.
10
Many of our clients typically operate under contracts with initial terms of at least two years. We have historically experienced high retention rates among our clients.
Sales and Marketing
Our global sales and marketing organizations are focused on ensuring that clients and prospects understand that only Acxiom is equipped with the data assets, technology and intellectual capital required to implement fully integrated marketing and business solutions across multiple channels with readily measurable results.
Our centralized sales force is focused exclusively on new business development across all markets – primarily new clients and new lines of business with existing clients. Additionally, we have associates in account management roles in our market industry groups who are focused on revenue growth within existing accounts as well as leading implementations and service delivery.
Our global marketing organization has actively promoted our ability to integrate services across the interactive channels now in use globally. In keeping with external market dynamics, our marketing teams have been increasingly focused on merging online and offline channels for greater market impact.
Pricing
Given the diverse nature of the markets and industries it serves, we deploy a number of pricing techniques designed to yield acceptable margins and returns on invested capital. In its top-tier markets, a substantial portion of Acxiom’s revenue is generated from highly customized, outsourced solutions in which prices are dictated by the scope, complexity, nature of assets deployed and service levels required for the individual client engagements. For its mid-tier markets, Acxiom offers pre-packaged or standard solutions for which prices are driven by standard rates applied to the volumes and frequencies of client inputs and outputs. Our product offerings, such as consumer data or data hygiene, are priced under a transactional model and others are priced under a subscription or license model. Acxiom’s consulting and analytical services are typically priced per engagement, using a professional services model or on a fee per model basis.
Competition
We believe we are the U.S. leader in a competitive field of expertise. Within the industry, we compete against data content providers, database marketing service providers, analytical data application vendors, enterprise software providers, systems integrators, consulting firms, advertising agencies, list brokerage/list management firms, and teleservices companies. Many firms offer a limited number of services within a particular geographic area, and several are national or international companies that offer a broad array of information services. However, we do not know of any single competitor that offers our entire range of products and services and has the ability to integrate these services effectively for interactive marketing.
In the U.S. services arena, we compete primarily with in-house information technology departments of current and prospective clients, as well as firms that provide data warehousing and database services, mailing list processing and consulting services. Competition is based on the quality and reliability of products and services, industry and technological expertise, historical success, ability to develop customized solutions for clients, processing capabilities and price.
In the U.S. products sector, we compete with two types of firms: data providers and list providers. Competition is based on the quality and comprehensiveness of the information provided, the ability to deliver the information in products and formats that our clients need and, to a lesser extent, the pricing of information products and services.
In the IT management market, competition is based on technical expertise and innovation, financial stability, past experience with the provider, marketplace reputation, cultural fit, quality and reliability of services, project management capabilities, processing environments and price.
In Europe, we face similar competition as in the U.S. in terms of scope and type. While there is a broader range of
11
competitors across Europe, particularly for customer data, the major competitors in both the services and theproducts markets are very similar to those in the U.S.
In Australia and New Zealand, our competitors in the services arena are predominantly well-established localbusinesses or companies’ in-house IT departments; however, some large global competitors have begun to offer their services in these countries. Our competitors in the products arena are generally local Australian and New Zealand companies, with the exception of one global business-to-business data provider.
In China, where we have had a presence since 2004, the competition is fragmented, with only a few local firms providing similar services. Well-known global providers, however, have recently been attracted by the potential of the Chinese market and appear to be investing heavily.
Maintaining technological competitiveness in our data products, processing functionality, software systems and services is key to our continued success. Our ability to continually improve our current processes and to develop and introduce new products and services is essential in order to maintain our competitive position and meet the increasingly sophisticated requirements of our clients. If we fail to do so, we could lose clients to current or future competitors, which could result in decreased revenues, net income and earnings per share.
Our industry has experienced a variety of business combinations that consolidate our competitors. The possibility of the consolidation or merger of companies who might combine forces to create a single-source provider of multiple services to the marketplace in which we compete could result in increased price competition for us which would negatively affect our business results. As noted above, we currently compete against numerous providers of a single service or product in several separate market spaces. Since we offer a larger variety of services than many of our current competitors, we have been able to successfully compete against them in most instances. However, the dynamics of the marketplace could be significantly altered if some of the single-service providers were to combine with each other to provide a wider variety of services.
The complexity and uncertainty regarding the development of new technologies affect our business greatly, as does the loss of market share through competition, or the extent and timing of market acceptance of innovative products and technology. We are also potentially affected by:
Longer sales cycles for our solutions due to the nature of that technology as an enterprise-wide solution;
The introduction of competent, competitive products or technologies by other companies;
Changes in the consumer and/or business information industries and markets, including the decline in the use of direct mail marketing and the ever-increasing use of alternative marketing channels such as onlineadvertising, which could result in lower profit margins;
The ability to protect our proprietary information and technology or to obtain necessary licenses on commercially reasonable terms; and
The impact of changing legislative, judicial, accounting, regulatory, cultural and consumer environments in the geographies where our products and services are deployed.
Employees
Acxiom employs approximately 6,400 employees (associates) worldwide. No U.S. associates are represented by a labor union or are the subject of a collective bargaining agreement. To the best of management’s knowledge, approximately 20 associates are elected members of work councils representing Acxiom associates in the EU.Acxiom has never experienced a work stoppage and believes that its employee relations are good.
12
Executive Officers of the Registrant
Acxiom’s executive officers, their current positions, ages and business experience are listed below. They are elected by the board of directors annually or as necessary to fill vacancies or to fill new positions. There are no family relationships among any of the officers.
John A. Meyer, age 53, is the Company’s Chief Executive Officer and President. Mr. Meyer joined the Company in February 2008. From 2003 - 2008 he was employed by Alcatel-Lucent, a global communications network firm, as president of the Alcatel-Lucent Services Group, in which position he was responsible for more than $6 billion in annual revenue and the management of more than 20,000 people. The group he led designed, implemented and managed some of the most sophisticated communications networks in the world. Prior to joining Lucent, Mr. Meyer was employed for nearly 20 years at Electronic Data Systems Corporation (EDS), where he held a number of positions including head of the Northeast business in the United States and president of the Europe, Middle East and Africa region. He served in the U.S. Air Force from 1979 to 1983 as a flight commander, achieving the rank of captain. Mr. Meyer serves as chairman of the advisory board of the College of Information Sciences and Technology at Pennsylvania State University and serves on the governing board of the Direct Marketing Association. He is also a member of the board of directors of the Arkansas Arts Center and the Arkansas Symphony Orchestra. He holds an MBA with honors in quantitative methods from the University of Missouri and a bachelor’s degree in management from Pennsylvania State University.
John A. Adams, age 55, is the Company’s Chief Operating Officer and Executive Vice President and is responsible for directing the operational areas of the business which include the market facing industry units, Europe and Asia Pacific, service development and delivery, and information technology. He joined Acxiom May 2008. Previously Mr. Adams was executive vice president of customer solutions for Eclipsys, a healthcare information software and services vendor. In that capacity, he was responsible for the company’s outsourcing and hosting units as well as a number of administrative functions. From 2003 – 2004, he served as chief financial officer for Exult, Inc., a human resources business process outsourcing company that was subsequently sold to Hewitt Associates during Mr. Adams’ tenure. From 2000 – 2003 Mr. Adams served as chief financial officer and vice president of AT&T Business Services, a subsidiary of AT&T Corporation. In this role, he led a successful restructuring of the subsidiary’s operations. Prior to that, Mr. Adams was employed by EDS for 15 years, serving most recently as vice president and controller, in which capacity he oversaw the accounting and finance functions for EDS worldwide. Mr. Adams, a British citizen, is a member of the Institute of Chartered Accountants in England and Wales. He holds a bachelor’s degree with honors in economics from the University of Exeter, England.
Christopher W. Wolf, age 48, is the Company’s Chief Financial Officer and Executive Vice President. He joinedAcxiom in 2007 and is responsible for all aspects of Acxiom’s financial management. He has over 20 years experience as a financial executive and consultant to companies in the marketing, retail and technology sectors. He most recently served as an independent consultant, providing consultation on financial reporting, Sarbanes-Oxley compliance, corporate governance, capital structure, mergers and acquisitions, and tax planning to a variety of public and private entities. From 2005 - 2006, Mr. Wolf served as CFO of NiuTech LLC, an internet marketing services company, where he was responsible for the accounting, financial planning and analysis, treasury, and risk management activities of the company. From 1996 - 2004, Mr. Wolf was employed in various finance and tax positions with Catalina Marketing Corporation, culminating in his service as chief financial officer from 2002 -2004. He also served as executive vice president from 2003 - 2004; senior vice president from 2002 - 2003; vice president –finance and treasurer from 2000 - 2002; executive director of tax, treasury and international finance from 1998 - 2000; senior director of tax and international finance from 1997 - 1998; and senior director of tax from 1996 -1997. Prior to joining Catalina, Mr. Wolf served for 10 years as a tax manager and consultant for Arthur Andersen & Co. He is a certified public accountant and holds a master’s degree in accounting from the University of North Carolina and a bachelor’s degree in the same field from Florida State University.
Jerry C. Jones, age 54, is the Company’s Chief Legal Officer, Senior Vice President and Assistant Secretary. He joined Acxiom in 1999 and is responsible for leading the strategy and execution of mergers and alliances, assists in the Company’s strategic initiatives, and oversees legal matters. Prior to joining Acxiom, he was employed for 19 years as an attorney with the Rose Law Firm in Little Rock, Arkansas, representing a broad range of business interests. He was a member of the board of directors of Entrust, Inc. until it was purchased by private investors in
13
2009, and he is chairman of the board of the Arkansas Virtual Academy, a statewide online public school. Mr. Jones holds a juris doctorate degree and a bachelor’s degree in public administration from the University of Arkansas.
Shawn M. Donovan, age 47, is the Company's Senior Vice President Global Sales. He joined Acxiom in 2008 and is responsible for sales and sales support operations. In this role, he leads the teams directly responsible for developing new business and supporting the growth of existing accounts through consultative, value-based selling. Prior to joining Acxiom, he was employed by EDS where he most recently was vice president of Banking & Capital Markets for the financial services industry. In his 20 years at EDS, Mr. Donovan served in numerous sales and sales leadership roles and was often enlisted to create or reinvigorate large sales organizations responsible for billions of dollars in revenue. He holds a bachelor’s degree in public administration from George Mason University.
Cindy K. Childers, age 50, is the Company's Senior Vice President – Human Resources. She joined Acxiom in 1985. In her current role, Ms. Childers leads strategic planning and execution in the areas of human resources, business culture, organizational effectiveness, associate development, recruiting and talent management. Previously, she served as leader of the financial services business unit and oversaw all of the financial and accounting functions of the Company. Before joining Acxiom, she was a certified public accountant in audit and tax for KPMG Peat Marwick. Ms. Childers holds a bachelor’s degree in business administration from the University of Central Arkansas.
Michael N. Darviche, age 49, is the Company’s Chief Marketing Officer and Senior Vice President. He joined Acxiom in February 2009 and is responsible for the Company’s global product marketing, marketing communications, sales support, strategy and business development activities. In 2006 he founded and served as CEO of Flash Capital Systems, a data and technology customer-monitoring services company. He was a senior vice president for Citi 360, a data business division of Citigroup, where he led strategy, sales and marketing from 2004 -2005. From 2001 – 2003 Mr. Darviche was the managing director at Marsh, Inc., a global insurance/brokerage firm, where he was responsible for global e-business and digital products and platforms. Prior to that, Mr. Darviche was a co-founder and general manager of Bigfoot Interactive, one of the world’s first e-marketing service providers, after beginning his career as a direct marketer at American Express. He serves on the board of the Greenburgh Nature Center, an environmental education center in New York. He also serves in an advisory capacity to The LEAGUE, an internet-based education curriculum business in New Jersey. Mr. Darviche holds a master’s degree in business administration from Harvard Business School and a bachelor’s degree in economics from Tufts University.
Item 1A. Risk Factors
The risks described below could materially and adversely affect our business, financial condition and results of future operations. These risks are not the only ones we face. Our business operations could also be impaired by additional risks and uncertainties that are not presently known to us or that we currently consider immaterial.
Failure to keep up with rapidly changing technologies and marketing practices could cause our products and services to become less competitive.
The complexity and uncertainty regarding the development of new technologies affect our business greatly, as does the loss of market share through competition, and the extent and timing of market acceptance of innovative products and technology. We are also potentially affected by:
Longer sales cycles for our solutions due to the nature of that technology as an enterprise-wide solution;
The introduction of competent, competitive products or technologies by other companies;
Changes in the consumer and/or business information industries and markets, including the decline in the use of direct mail marketing and the ever-increasing use of alternative marketing channels such as onlineadvertising, which could result in lower profit margins for the Company;
14
The ability to protect our proprietary information and technology or to obtain necessary licenses on commercially reasonable terms; and
The impact of changing legislative, judicial, accounting, regulatory, cultural and consumer environments in the geographies where our products and services are deployed.
Maintaining technological competitiveness in our data products, processing functionality, software systems and services is key to our continued success. Our ability to continually improve our current processes and to develop and introduce new products and services is essential in order to maintain our competitive position and meet the increasingly sophisticated requirements of our clients. If we fail to do so, we could lose clients to current or future competitors, which could result in decreased revenues, net income and earnings per share.
Changes in legislative, judicial, regulatory, cultural or consumer environments relating to consumer privacy or information collection and use may affect our ability to collect and use data.
There could be a material adverse impact on our business due to the enactment of legislation or industry regulations, the issuance of judicial interpretations, or simply a change in customs, arising from the increasing public concern over consumer privacy issues. In the U.S., both the Congress and the legislatures of various states have recently focused their attention on matters concerning the collection and use of consumer data. In most of the non-U.S. locations in which we do business, legislation restricting the collection and use of personal data already exists. Many times restrictions are placed on the use of data upon the occurrence of unanticipated events that rapidly drive the adoption of legislation or regulation. Restrictions could be placed upon the collection, management, aggregation and use of information, which could result in a material increase in the cost of collecting some kinds of data. In the U.S. the general data collection regime is that non-sensitive data is usable so long as the person does not affirmatively “opt-out” of the collection. In Europe the reverse is true. If the European model were adopted in the U.S. it would lead to less data being available and at a higher cost. It is also possible that we could be prohibited from collecting or disseminating certain types of data, which could in turn materially adversely affect our ability to meet our clients’ requirements, potentially resulting in decreased revenues, net income, and earnings per share.
We could experience a breach of the confidentiality of the information we hold or of the security of our computer systems.
We operate extremely complex computer systems that contain personally identifiable data. Unauthorized third parties could attempt to gain entry to such systems for the purpose of stealing data or disrupting the systems. We believe that we have taken adequate measures to protect them from intrusion, but in the event that our efforts are unsuccessful we could suffer significant harm. Further, we handle large quantities of personally identifiable information that must be maintained on a confidential basis. In the event the confidentiality of such information was compromised, we could suffer significant harm.
Data suppliers might withdraw data from us, leading to our inability to provide products and services to our clients which could lead to decreases in our operating results.
Much of the data that we use is either purchased or licensed from third parties. We compile the remainder of the data that we use from public record sources. We could suffer a material adverse effect if owners of the data we use were to withdraw the data from us. Data providers could withdraw their data from us if there is a competitive reason to do so, or if legislation is passed restricting the use of the data, or if judicial interpretations are issued restricting use of data. If a substantial number of data providers were to withdraw their data, our ability to provide products and services to our clients could be materially adversely impacted, which could result in decreased revenues, net income and earnings per share.
The nature and volume of our customer contracts may affect the predictability of our revenues.
While approximately 77% of our total revenue is currently derived from clients who have long-term contracts (defined as contracts with initial terms of two years or more), these contracts have been entered into at various times and therefore some of them are in the latter part of their terms and are approaching their originally scheduled
15
expiration dates. If renewed by the customer, the terms of the renewal contract may not have a term as long as, or may otherwise be on terms less favorable than, the original contract. Revenue from customers with long-term contracts is not necessarily “fixed” or guaranteed as portions of the revenue from these customers is volume-driven or project-related. With respect to the portion of our business that is not under long-term contract, revenues are less predictable and are almost completely volume-driven or project-related. Therefore, we must engage in continual sales efforts to maintain revenue stability and future growth with these customers. In addition, if a significant customer fails to renew a contract, our business could be negatively impacted if additional business is not obtained to replace the business which was lost.
Our operations outside the U.S. subject us to risks normally associated with international operations.
During the last fiscal year, we received approximately 14% of our revenues from business outside the United States. As part of our growth strategy, we plan to continue to pursue opportunities outside the U.S. and in order to do this we must continue to strengthen our foreign operations, hire additional personnel, and continue to identify and execute beneficial strategic alliances. To the extent that we are unable to do these things in a timely manner, our growth, if any, in non-U.S. revenues will be limited and our operating results could be materially adversely affected. In general, each of our foreign locations is expected to fund its own operations and cash flows, although periodically funds may be loaned or invested from the U.S. to the foreign subsidiaries. Therefore, exchange rate movements of foreign currencies may have an impact on our future costs or on future cash flows from foreign investments. We have not entered into any foreign currency forward exchange contracts or other derivative instruments to hedge the effects of adverse fluctuations in foreign currency exchange rates. Additional risks inherent in our non-U.S. business activities generally include, among others, potentially longer accounts receivable payment cycles, the costs and difficulties of managing international operations, potentially adverse tax consequences, and greater difficulty enforcing intellectual property rights. The various risks which are inherent in doing business in the United States are also generally applicable to doing business outside of the United States and may be exaggerated by the difficulty of doing business in numerous sovereign jurisdictions due to differences in culture, laws and regulations.
Loss of data center capacity or interruption of telecommunication links could adversely affect our business.
Our business is heavily dependent upon highly complex data processing capability. Our ability to protect our data centers against damage or interruption from fire, power loss, telecommunications failure or other disasters is critical to our future. The online services we provide are dependent on links to telecommunication providers. We believe we have taken reasonable precautions to protect our data centers and telecommunication links from events that could interrupt our operations. Any damage to our data centers or any failure of our telecommunications links that causes interruptions in our operations could materially adversely affect our ability to meet our clients' requirements, which could result in decreased revenues, net income, and earnings per share.
Failure to favorably negotiate or effectively integrate acquisitions or alliances could adversely affect our business.
As part of our growth strategy we may continue to acquire other complementary businesses, products and technologies or enter into joint ventures or similar strategic relationships. While we believe we will be able to successfully integrate recently acquired businesses into our existing operations, there is no certainty that future acquisitions or alliances will be consummated on acceptable terms or that we will be able to integrate successfully the services, content, products and personnel of any such transaction into our operations. In addition, any future acquisitions, joint ventures or similar relationships may cause a disruption in our ongoing business and distract our management. There is also no assurance that we would derive the revenue improvements, cost savings and other intended benefits of any such transaction. The occurrence of any of these events could result in decreased revenues, net income and earnings per share.
Our traditional direct marketing business could be negatively affected by rising postal costs, the green movement and the shift to alternative marketing channels, including online communications.
Postal rate increases are now expected to occur every year. The most recent increase in the U.S. became effective inMay 2009. Although the USPS has indicated that no rate increase will occur in 2010, rates are anticipated to rise
16
annually at approximately the rate of inflation. As they rise, we expect to see increased pressure on direct mailers to leverage digital and other forms of online communication and to mail fewer pieces.
Those in the traditional direct mail business, as well as the postal service, are under growing pressure to reduce their impact on the environment. It is uncertain at this time what either marketers or the postal service will do to lessen their impact. From a postal service perspective, the actions to be taken may involve changing certain aspects of mail service that would negatively affect direct marketers. From a marketer’s perspective, such actions could have the same effect as increased rates, thereby causing them to mail fewer pieces.
We are actively investing in multichannel marketing services in addition to maintaining our ability to continue servicing traditional direct mail customers and expect to offset some of the declining revenues associated with regular mail. This dual focus could, however, result in the loss of business with some direct mailers, thereby negatively affecting us by decreasing the amount of processing services our clients purchase from us, which could result in lower revenues, net income and earnings per share.
Industry consolidations could result in increased competition for our products and services.
Our industry has experienced a variety of business combinations that have consolidated our competitors. The possibility of the consolidation or merger of companies who might combine forces to create a single-source provider of multiple services to the marketplace in which we compete could result in increased price competition for us which would negatively affect our business results. We currently compete against numerous providers of a single service or product in several separate market spaces. (See the discussion above under “Competition.”) Since we offer a larger variety of services than many of our current competitors, we have been able to successfully compete against them in most instances. However, the dynamics of the marketplace could be significantly altered if some of the single-service providers were to combine with each other to provide a wider variety of services.
Processing errors or delays in completing service level requirements for our clients could result in negative financial consequences.
Processing errors could result in the issuance of credits to clients, the re-performance of work, and/or the payment of damages. Likewise, the failure to meet contractual service level requirements or to meet specified goals with contractual timeframes could result in monetary penalties or lost revenue.
Our engagements with certain clients, particularly those with long-term, fixed-priced agreements, may not be profitable.
The pricing and other terms of our client contracts, particularly our long-term IT outsourcing agreements, require us to make estimates and assumptions at the time we enter into these contracts that could differ from actual results. These estimates reflect our best judgments regarding the nature of the engagement and our expected costs to provide the contracted services. Any increased or unexpected costs or unanticipated delays in connection with the performance of these engagements, including delays caused by factors outside our control, could make these contracts less profitable or unprofitable, which would have an adverse affect on our profit margin. Our exposure to this risk increases generally in proportion to the scope of the client contract and is higher in the early stages of such a contract. In addition, a majority of our IT outsourcing contracts contain some fixed-price, incentive-based or other pricing terms that condition our fee on our ability to meet defined goals. Our failure to meet a client's expectations inany type of contract may result in an unprofitable engagement which could adversely affect our operating results.
Our ability to recover significant up-front capital investments required by certain client contracts is subject to risks.
A few of our client contracts require significant investment in the early stages which is expected to be recovered through billings over the life of the contract. These contracts often involve the construction of new computer systems and communications networks and the development and deployment of new technologies. Substantial performance risk exists in each contract with these characteristics, and some or all elements of service delivery under these contracts are dependent upon successful completion of the development, construction and deployment phases.
17
Failure to recover such capital investments could materially adversely affect our operating results.
Failure to attract and retain qualified employees could adversely affect our business.
Competition for qualified technical, sales and other personnel is often intense, and we periodically are required to pay premium wages to attract and retain good employees. There can be no assurance that we will be able to continue to hire and retain sufficient qualified management, technical, sales and other employees necessary to conduct our operations successfully.
Deterioration of economic conditions could negatively impact our business.
Our business may be adversely affected by changes in national or global economic conditions, including inflation, interest rates, availability of capital markets, consumer spending rates, and the effects of governmental initiatives to manage economic conditions. Any such changes could adversely affect our customers’ desire and ability to engage our services, thereby negatively affecting our financial results.
The recent disruptions in credit and other financial markets and deterioration of national and global economic conditions, could, among other things:
make it more difficult or costly for us to obtain financing for our operations or investments or to refinance our debt in the future;cause our lenders to depart from prior credit industry practice and make more difficult or expensive the granting of any technical or other waivers under our credit agreements to the extent we may seek them in the future;impair the financial condition of some of our customers and suppliers, thereby increasing customer bad debts;decrease the value of our investments in equity and debt securities;impair the financial viability of our insurers.
Item 1B. Unresolved Staff Comments
Not applicable.
[THIS SPACE LEFT BLANK INTENTIONALLY]
18
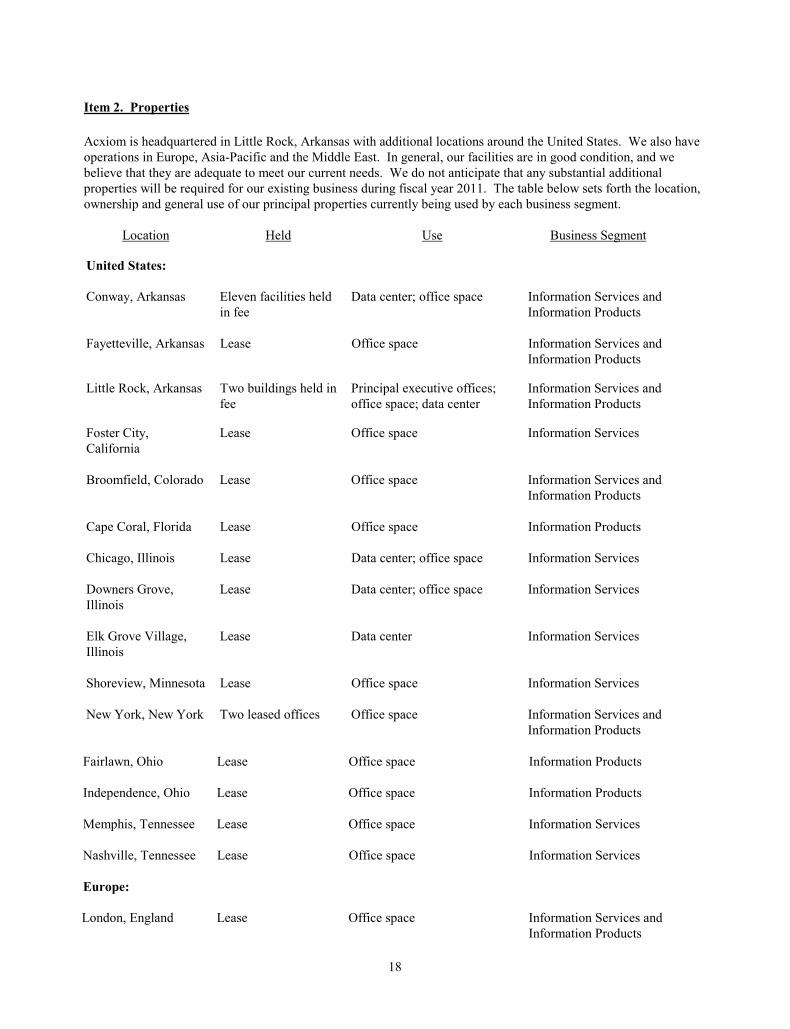
Item 2. Properties
Acxiom is headquartered in Little Rock, Arkansas with additional locations around the United States. We also have operations in Europe, Asia-Pacific and the Middle East. In general, our facilities are in good condition, and we believe that they are adequate to meet our current needs. We do not anticipate that any substantial additional properties will be required for our existing business during fiscal year 2011. The table below sets forth the location, ownership and general use of our principal properties currently being used by each business segment.
Fairlawn, Ohio Lease Office space Information Products
Independence, Ohio Lease Office space Information Products
Memphis, Tennessee Lease Office space Information Services
Nashville, Tennessee Lease Office space Information Services
Europe:
London, England Lease Office space Information Services and Information Products
Location Held Use Business Segment
United States:
Conway, Arkansas Eleven facilities held in fee
Data center; office space Information Services and Information Products
Fayetteville, Arkansas Lease Office space Information Services and Information Products
Little Rock, Arkansas Two buildings held in fee
Principal executive offices; office space; data center
Information Services andInformation Products
Foster City, California
Lease Office space Information Services
Broomfield, Colorado Lease Office space Information Services and Information Products
Cape Coral, Florida Lease Office space Information Products
Chicago, Illinois Lease Data center; office space Information Services
Downers Grove, Illinois
Lease Data center; office space Information Services
Elk Grove Village, Illinois
Lease Data center Information Services
Shoreview, Minnesota Lease Office space Information Services
New York, New York Two leased offices Office space Information Services and Information Products

19
Normanton, England Lease Data center; office space Information Services and Information Products
Sunderland, England Lease Data center; fulfillment service center; office space; warehouse space
Information Services andInformation Products
Teddington, England Lease Office space Information Services and Information Products
Paris, France Lease Data center; office space Information Services and Information Products
Frankfurt, Germany Lease Office space Information Services and Information Products
Munich, Germany Lease Office space Information Services and Information Products
Amsterdam, Netherlands
Lease Office space Information Services and Information Products
Gdansk, Poland Lease Office space Information Services andInformation Products
Warsaw, Poland Lease Office space Information Services andInformation Products
Australia:
Sydney, Australia Lease Office space Information Services
China:
Shanghai, China Lease Office space Information Services
Nantong, China Lease Data center; office space Information Services
Saudi Arabia:
Jeddah, Saudi Arabia Lease Office space Information Services and Information Products
20
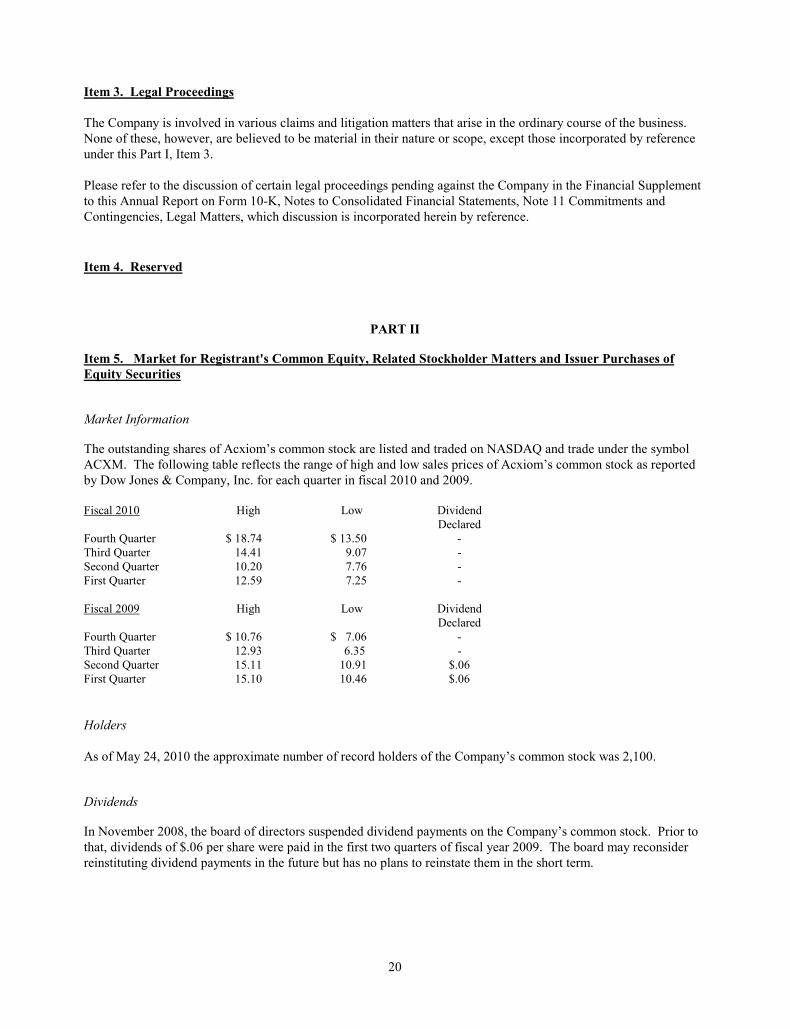
Item 3. Legal Proceedings
The Company is involved in various claims and litigation matters that arise in the ordinary course of the business. None of these, however, are believed to be material in their nature or scope, except those incorporated by reference under this Part I, Item 3.
Please refer to the discussion of certain legal proceedings pending against the Company in the Financial Supplement to this Annual Report on Form 10-K, Notes to Consolidated Financial Statements, Note 11 Commitments and Contingencies, Legal Matters, which discussion is incorporated herein by reference.
Item 4. Reserved
PART II
Item 5. Market for Registrant's Common Equity, Related Stockholder Matters and Issuer Purchases of Equity Securities
Market Information
The outstanding shares of Acxiom’s common stock are listed and traded on NASDAQ and trade under the symbol ACXM. The following table reflects the range of high and low sales prices of Acxiom’s common stock as reported by Dow Jones & Company, Inc. for each quarter in fiscal 2010 and 2009.
Fiscal 2010 High Low Dividend Declared
Fourth Quarter $ 18.74 $ 13.50 -Third Quarter 14.41 9.07 -Second Quarter 10.20 7.76 -First Quarter 12.59 7.25 -
Fiscal 2009 High Low Dividend Declared
Fourth Quarter $ 10.76 $ 7.06 -Third Quarter 12.93 6.35 -Second Quarter 15.11 10.91 $.06First Quarter 15.10 10.46 $.06
Holders
As of May 24, 2010 the approximate number of record holders of the Company’s common stock was 2,100.
Dividends
In November 2008, the board of directors suspended dividend payments on the Company’s common stock. Prior to that, dividends of $.06 per share were paid in the first two quarters of fiscal year 2009. The board may reconsider reinstituting dividend payments in the future but has no plans to reinstate them in the short term.
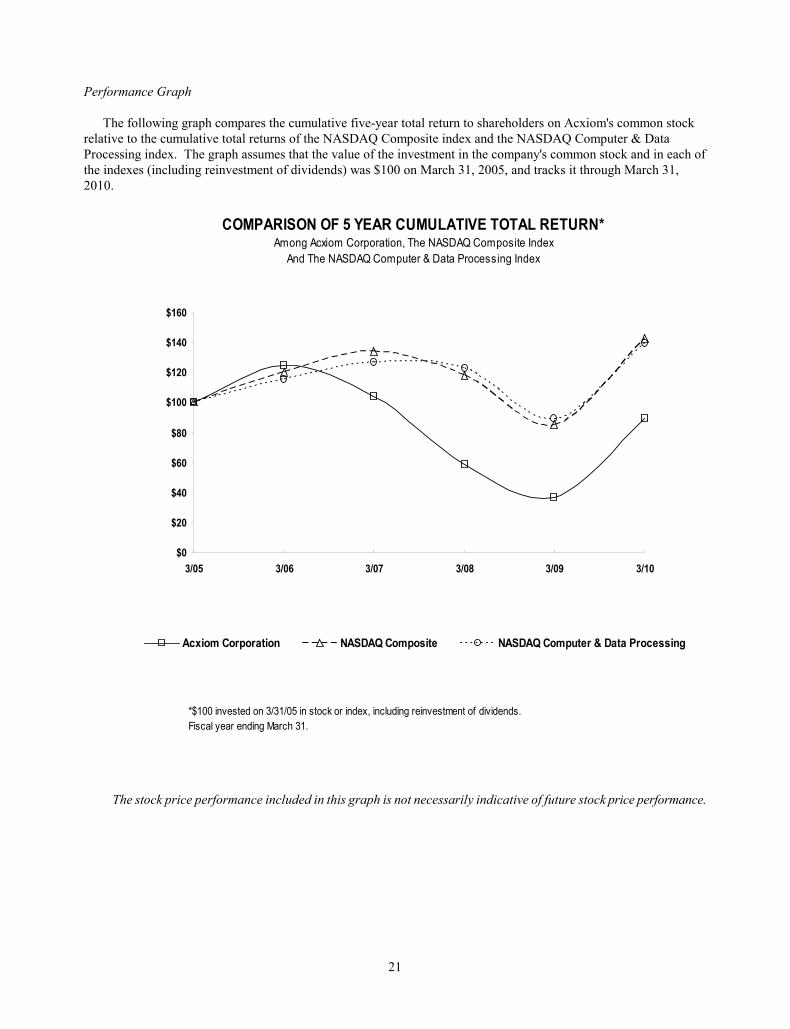
21
Performance Graph
The following graph compares the cumulative five-year total return to shareholders on Acxiom's common stock relative to the cumulative total returns of the NASDAQ Composite index and the NASDAQ Computer & Data Processing index. The graph assumes that the value of the investment in the company's common stock and in each of the indexes (including reinvestment of dividends) was $100 on March 31, 2005, and tracks it through March 31,2010.
COMPARISON OF 5 YEAR CUMULATIVE TOTAL RETURN*Among Acxiom Corporation, The NASDAQ Composite Index
And The NASDAQ Computer & Data Processing Index
$0
$20
$40
$60
$80
$100
$120
$140
$160
3/05 3/06 3/07 3/08 3/09 3/10
Acxiom Corporation NASDAQ Composite NASDAQ Computer & Data Processing
*$100 invested on 3/31/05 in stock or index, including reinvestment of dividends.Fiscal year ending March 31.
The stock price performance included in this graph is not necessarily indicative of future stock price performance.
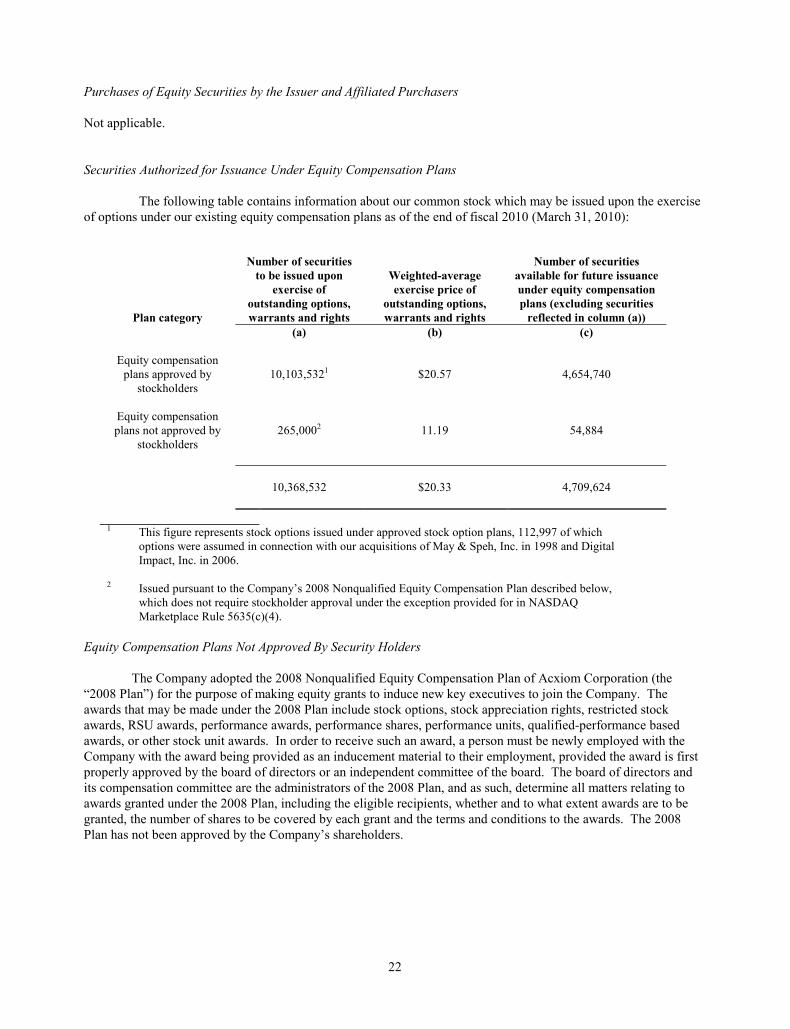
22
Purchases of Equity Securities by the Issuer and Affiliated Purchasers
Not applicable.
Securities Authorized for Issuance Under Equity Compensation Plans
The following table contains information about our common stock which may be issued upon the exercise of options under our existing equity compensation plans as of the end of fiscal 2010 (March 31, 2010):
Plan category
Number of securitiesto be issued upon
exercise ofoutstanding options,warrants and rights
Weighted-averageexercise price of
outstanding options,warrants and rights
Number of securitiesavailable for future issuanceunder equity compensationplans (excluding securities
reflected in column (a))(a) (b) (c)
Equity compensation plans approved by
stockholders10,103,5321 $20.57 4,654,740
Equity compensation plans not approved by
stockholders265,0002 11.19 54,884
10,368,532 $20.33 4,709,624
1 This figure represents stock options issued under approved stock option plans, 112,997 of which options were assumed in connection with our acquisitions of May & Speh, Inc. in 1998 and Digital Impact, Inc. in 2006.
2 Issued pursuant to the Company’s 2008 Nonqualified Equity Compensation Plan described below, which does not require stockholder approval under the exception provided for in NASDAQ Marketplace Rule 5635(c)(4).
Equity Compensation Plans Not Approved By Security Holders
The Company adopted the 2008 Nonqualified Equity Compensation Plan of Acxiom Corporation (the“2008 Plan”) for the purpose of making equity grants to induce new key executives to join the Company. The awards that may be made under the 2008 Plan include stock options, stock appreciation rights, restricted stock awards, RSU awards, performance awards, performance shares, performance units, qualified-performance based awards, or other stock unit awards. In order to receive such an award, a person must be newly employed with the Company with the award being provided as an inducement material to their employment, provided the award is first properly approved by the board of directors or an independent committee of the board. The board of directors and its compensation committee are the administrators of the 2008 Plan, and as such, determine all matters relating to awards granted under the 2008 Plan, including the eligible recipients, whether and to what extent awards are to be granted, the number of shares to be covered by each grant and the terms and conditions to the awards. The 2008Plan has not been approved by the Company’s shareholders.
23
Item 6. Selected Financial Data
For information pertaining to Selected Financial Data of Acxiom, refer to page F-2 of the Financial Supplement, which is attached hereto.
Item 7. Management's Discussion and Analysis of Financial Condition and Results of Operations
The information required by this Item appears in the Financial Supplement at pp. F-3 – F-18, which is attached hereto.
Item 7A. Quantitative and Qualitative Disclosures About Market Risk
Acxiom’s earnings are affected by changes in short-term interest rates primarily as a result of its term loan agreement and its revolving credit agreement, which bear interest at a floating rate. Acxiom currently uses an interest rate swap agreement to mitigate the interest rate risk on $95 million of its term loan. Risk can be estimated by measuring the impact of a near-term adverse movement of one percentage point in short-term market interest rates. If short-term market interest rates increase one percentage point during the next four quarters compared to the previous four quarters, there would be no material adverse impact on Acxiom’s results of operations. Acxiom has no material future earnings or cash flow expenses from changes in interest rates related to its other long-term debt obligations, as substantially all of Acxiom’s remaining long-term debt instruments have fixed rates. At both March 31, 2010 and 2009, the fair value of the Company’s fixed rate long-term obligations approximated carrying value.
Acxiom has a presence in the United Kingdom, France, The Netherlands, Germany, Portugal, Poland, the Middle East, Australia and China. In general, each of the foreign locations is expected to fund its own operations and cash flows, although funds may be loaned or invested from the U.S. to the foreign subsidiaries. Therefore, exchange rate movements of foreign currencies may have an impact on Acxiom’s future costs or on future cash flows from foreign investments. Acxiom has not entered into any foreign currency forward exchange contracts or other derivative instruments to hedge the effects of adverse fluctuations in foreign currency exchange rates.
Item 8. Financial Statements and Supplementary Data
The Financial Statements required by this Item appear in the Financial Supplement at pp. F-22 – F-58, which isattached hereto.
Item 9. Changes in and Disagreements With Accountants on Accounting and Financial Disclosure
Not applicable.
Item 9A. Controls and Procedures
Evaluation of Disclosure Controls and Procedures
As of March 31, 2010, under the supervision and with the participation of our management, including our Chief Executive Officer (principal executive officer) and our Chief Financial Officer (principal financial and accountingofficer), we evaluated the effectiveness of our disclosure controls and procedures as defined in Rules 13a-15(e) and 15d-15(e) under the Securities Exchange Act of 1934, as amended (“Exchange Act”). Based on this evaluation, our management, including our Chief Executive Officer and our Chief Financial Officer, concluded that as of March 31, 2010, our disclosure controls and procedures were effective to ensure that information required to be disclosed by the Company in reports that it files or submits under the Exchange Act is (i) recorded, processed, summarized and reported within the time periods specified in the Securities and Exchange Commission rules and forms; and (ii)
24
accumulated and communicated to the Company's management, including its principal executive officer and principal financial officer, as appropriate to allow timely decisions regarding required disclosure.
Management’s Report on Internal Control over Financial Reporting
Management’s report on Acxiom’s internal control over financial reporting (as such term is defined in Rules 13a-15(f) and 15d-15(f) under the Exchange Act), and the related report of Acxiom’s independent public accounting firm, are included in the Financial Supplement on pages F-19 and F-21, respectively, and are incorporated by reference.
Changes in Internal Controls over Financial Reporting
There has been no change in our internal control over financial reporting that occurred during our last fiscal quarter that has materially affected, or is reasonably likely to materially affect, our internal control over financial reporting.
Item 9B. Other Information
Not applicable.
PART III
Item 10. Directors, Executive Officers and Corporate Governance
Please see the information concerning our executive officers contained in Part I of this Annual Report on Form 10-Kunder the caption “Executive Officers of the Registrant” which is included there pursuant to Instruction 3 to Item 401(b) of the SEC’s Regulation S-K.
The Acxiom board of directors has adopted a code of ethics applicable to our principal executive, financial and accounting officers and all other persons performing similar functions. A copy of this code of ethics is posted on Acxiom’s website at www.acxiom.com under the Corporate Governance section of the site. The remaining information required by this Item appears under the captions “Election of Directors,” and “Section 16(a) Beneficial Ownership Reporting Compliance” in Acxiom's 2010 Proxy Statement, which information is incorporated herein by reference.
Item 11. Executive Compensation
The information required by this Item appears under the heading “Executive Compensation” in Acxiom's 2010 Proxy Statement, which information is incorporated herein by reference.
Item 12. Security Ownership of Certain Beneficial Owners and Management and Related Stockholder Matters
The information required by this Item appears under the heading “Stock Ownership” in Acxiom's 2010 Proxy Statement, which information is incorporated herein by reference.
Item 13. Certain Relationships and Related Transactions, and Director Independence
The information required by this Item appears under the headings “Related-Party Transactions” and “Board and Committee Matters” in Acxiom's 2010 Proxy Statement, which information is incorporated herein by reference.
25
Item 14. Principal Accountant Fees and Services
The information required by this Item appears under the heading “Ratification of Independent Registered Public Accountant - Fees Billed for Services Rendered by Independent Auditor” in Acxiom's 2010 Proxy Statement, which information is incorporated herein by reference.
PART IV
Item 15. Exhibits and Financial Statement Schedules
(a) The following documents are filed as a part of this report:
1. Financial Statements.
The following consolidated financial statements of the registrant and its subsidiaries included in the Financial Supplement and the Independent Auditors' Reports thereof are attached hereto. Page references are to page numbers in the Financial Supplement.
Page
Reports of Independent Registered Public AccountingFirm F-20 - F-21
Consolidated Balance Sheets as of March 31, 2010 and 2009 F-22
Consolidated Statements of Operations for the years endedMarch 31, 2010, 2009 and 2008 F-23
Consolidated Statements of Equity and Comprehensive Income (Loss) for the years ended March 31, 2010, 2009 and 2008 F-24
Consolidated Statements of Cash Flows for the years endedMarch 31, 2010, 2009 and 2008 F-25 - F-26
Notes to the Consolidated Financial Statements F-27- F-58
2. Financial Statement Schedules.
All schedules are omitted because they are not applicable or not required or because the required information is included in the consolidated financial statements or notes thereto.
[THIS SPACE LEFT BLANK INTENTIONALLY]
26
3. Exhibits.
The following exhibits are filed with this report or are incorporated by reference to previously filed material:
Exhibit No.
3(a) Amended and Restated Certificate of Incorporation (previously filed as Exhibit 3(i) to AcxiomCorporation's Quarterly Report on Form 10-Q for the quarterly period ended June 30, 1996, Commission File No. 0-13163, and incorporated herein by reference)
3(b) Amended and Restated Bylaws (previously filed as Exhibit 3(b) to Acxiom Corporation’s Annual Report on Form 10-K for the fiscal year ended March 31, 2008, and incorporated herein by reference)
10(a) 2005 Stock Purchase Plan of Acxiom Corporation (previously filed as Appendix B to Acxiom Corporation’s Proxy Statement dated June 24, 2005, and incorporated herein by reference)
10(b) Amended and Restated Key Associate Stock Option Plan of Acxiom Corporation (previously filed as Exhibit 10(e) to Acxiom Corporation’s Annual Report on Form 10-K for the fiscal year ended March 31, 2000, Commission File No. 0-13163, and incorporated herein by reference)
10(c) 2005 Equity Compensation Plan of Acxiom Corporation (formerly known as the Amended and Restated 2000 Associate Stock Option Plan of Acxiom Corporation) (previously filed as Appendix B to Acxiom Corporation’s Proxy Statement dated November 16, 2007, and incorporated herein by reference)
10(d) 2008 Nonqualified Equity Compensation Plan of Acxiom Corporation (previously filed on May 15, 2008,as Exhibit 10.2 to Acxiom Corporation’s Current Report on Form 8-K, and incorporated herein by reference)
10(e) Acxiom Corporation U.K. Share Option Scheme (previously filed as Exhibit 10(f) to Acxiom Corporation's Annual Report on Form 10-K for the fiscal year ended March 31, 1997, Commission File No. 0-13163, and incorporated herein by reference)
10(f) Acxiom Corporation Non-Qualified Deferred Compensation Plan (previously filed as Exhibit 10(i) to Acxiom Corporation's Annual Report on Form 10-K for the fiscal year ended March 31, 1996, Commission File No. 0-13163, and incorporated herein by reference)
10(g) 2010 Executive Cash Incentive Plan of Acxiom Corporation
10(h) Acxiom Corporation Executive Officer FY 2011 Cash Incentive Plan
10(i) General Electric Capital Corporation Master Lease Agreement, dated as of September 30, 1999 (previously filed as Exhibit 10(m) to Acxiom Corporation’s Annual Report on Form 10-K for the fiscal year ended March 31, 2001, Commission File No. 0-13163, and incorporated herein by reference)
10(j) Amendment to General Electric Capital Corporation Master Lease Agreement dated as of December 6, 2002 (previously filed as Exhibit 10 (j) to Acxiom Corporation’s Annual Report of Form 10-K for the fiscal year ended March 31, 2003, Commission File No. 0-13163, and incorporated herein by reference)
10(k) Third Amended and Restated Credit Agreement dated as of March 24, 2005, by and among Acxiom Corporation, as borrower, J.P. Morgan, N.A., as agent, and the lenders who are party thereto (previously filed as Exhibit 10.2 to Acxiom Corporation’s Report on Form 8-K dated March 24, 2005, and incorporated herein by reference)
10(l) Second Amendment to Third Amended and Restated Credit Agreement, dated as of April 22, 2005, by and
27
among Acxiom Corporation, as borrower, J.P. Morgan, N.A., as agent, and the lenders who are a party thereto (previously filed as Exhibit 10(j) to Acxiom Corporation’s Annual Report on Form 10-K for the fiscal year ended March 31, 2005, Commission File No. 0-13163, and incorporated herein by reference)
10(m) First Amendment to Fourth Amended and Restated Credit Agreement dated as of November 13, 2009,among Acxiom Corporation, a Delaware corporation, the lenders party thereto and JPMorgan Chase Bank, N.A. (previously filed on November 19, 2009, as Exhibit 10.1 to Acxiom Corporation’s Current Report on Form 8-K, and incorporated herein by reference)
10(n) Increased Commitment Supplement to Third Amended and Restated Credit Agreement, dated as of May 13, 2005, by and among Acxiom Corporation, as borrower, J.P. Morgan, N.A., as agent, and the lenders who are a party thereto (previously filed as Exhibit 10(k) to Acxiom Corporation’s Annual Report on Form 10-Kfor the fiscal year ended March 31, 2005, Commission File No. 0-13163, and incorporated herein by reference)
10(o) Assignment of Head Lease dated as of February 10, 2003, by and between Wells Fargo Bank Northwest, National Association, as Owner Trustee under the AC Trust 2001-1 (“Assignor”) and Acxiom Corporation, assigning all of Assignor’s rights, title and interest in that certain Head Lease Agreement dated as of May 1, 2000, between the City of Little Rock, AR and Assignor, each relating to the lease of an office building in downtown Little Rock which was previously financed pursuant to a terminated synthetic real estate facility (previously filed as Exhibit 10 (l) to Acxiom Corporation’s Annual Report of Form 10-K for the fiscal year ended March 31, 2003, Commission File No. 0-13163, and incorporated herein by reference)
10(p) Form of Executive Security Agreement effective as of April 8, 2008 (previously filed as Exhibit 10(n) to Acxiom Corporation’s Annual Report on Form 10-K for the fiscal year ended March 31, 2008 and incorporated herein by reference)
10(q) Asset Purchase and License Agreement dated December 29, 2005, between Acxiom Corporation and EMC Corporation and EMC (Benelux) B.V., S.à.r.l. (previously filed as Exhibit 10(s) to Acxiom Corporation’s Annual Report on Form 10-K for the fiscal year ended March 31, 2008, and incorporated herein by reference)
10(r) Transition Amendment dated March 31, 2008, between Acxiom Corporation and EMC Corporation and EMC (Benelux) B.V., S.à.r.l. (previously filed as Exhibit 10(t) to Acxiom Corporation’s Annual Report on Form 10-K for the fiscal year ended March 31, 2008, and incorporated herein by reference)
10(s) Offer Letter dated May 9, 2007, between Acxiom Corporation and Christopher W. Wolf (previously filed on May 16, 2007, as Exhibit 99.2 to Acxiom Corporation’s Current Report on Form 8-K, and incorporatedherein by reference)
10(t) Employment Agreement dated January 14, 2008, between Acxiom Corporation and John A. Meyer (previously filed on January 17, 2008, as Exhibit 10.1 to Acxiom Corporation’s Current Report on Form 8-K, and incorporated herein by reference)
10(u) Employment Agreement dated May 14, 2008, between the Acxiom Corporation and John A. Adams(previously filed on May 15, 2008 as Exhibit 10.1 to Acxiom Corporation’s Current Report on Form 8-K, and incorporated herein by reference)
10(v) Offer Letter dated April 21, 2008, between Acxiom Corporation and Shawn M. Donovan (previously filed as Exhibit 10(x) to Acxiom Corporation’s Annual Report on Form 10-K/A for the fiscal year ended March 31, 2009, and incorporated herein by reference)
10(w) Acceptance Letter dated May 19, 2008, between Acxiom Corporation and Shawn M. Donovan (previously filed as Exhibit 10(y) to Acxiom Corporation’s Annual Report on Form 10-K/A for the fiscal year ended March 31, 2009, and incorporated herein by reference)
28
10(x) Form of director indemnity agreement dated February 11, 2010
21 Subsidiaries of Acxiom Corporation
23 Consent of KPMG LLP
24 Powers of Attorney
31(a) Certification of Chief Executive Officer pursuant to SEC Rule 13a-14(a)/15d-14(a), as adopted pursuant to Sections 302 and 404 of Sarbanes-Oxley Act of 2002
31(b) Certification of Chief Financial Officer pursuant to SEC Rule 13a-14(a)/15d-14(a), as adopted pursuant to Sections 302 and 404 of Sarbanes-Oxley Act of 2002
32(a) Certification of Chief Executive Officer pursuant to 18 U.S.C. Section 1350, as adopted pursuant to Section 906 of the Sarbanes-Oxley Act of 2002
32(b) Certification of Chief Financial Officer pursuant to 18 U.S.C. Section 1350, as adopted pursuant to Section 906 of the Sarbanes-Oxley Act of 2002
[THIS SPACE LEFT BLANK INTENTIONALLY]
29
SIGNATURES
Pursuant to the requirements of Section 13 or 15(d) of the Securities Exchange Act of 1934, the registrant has duly caused this report to be signed on its behalf by the undersigned, thereunto duly authorized.
ACXIOM CORPORATION
Date: May 26, 2010 By: /s/ Catherine L. HughesCatherine L. HughesCorporate Governance Officer & Secretary
Pursuant to the requirements of the Securities Exchange Act of 1934, this report has been signed below by the following persons on behalf of the registrant and in the capacities and on the dates indicated.
Signature
William T. Dillard II* Director May 26, 2010William T. Dillard II
Michael J. Durham* Director (Non-Executive Chairman of the Board) May 26, 2010Michael J. Durham
Mary L. Good* Director May 26, 2010Mary L. Good
Jerry D. Gramaglia* Director May 26, 2010Jerry D. Gramaglia
Ann Die Hasselmo* Director May 26, 2010Ann Die Hasselmo
William J. Henderson* Director May 26, 2010William J. Henderson
Clark M. Kokich* Director May 26, 2010Clark M. Kokich
Thomas F. McLarty, III* Director May 26, 2010Thomas F. McLarty, III
John A. Meyer* Director, CEO & PresidentJohn A. Meyer (principal executive officer) May 26, 2010
Stephen M. Patterson* Director May 26, 2010Stephen M. Patterson
Kevin M. Twomey* Director May 26, 2010Kevin M. Twomey
R. Halsey Wise* Director May 26, 2010R. Halsey Wise
Christopher W. Wolf* CFO & Executive Vice President (principal financialChristopher W. Wolf and accounting officer) May 26, 2010
*By: /s/ Catherine L. HughesCatherine L. HughesAttorney-in-Fact

[THIS PAGE INTENTIONALLY LEFT BLANK]
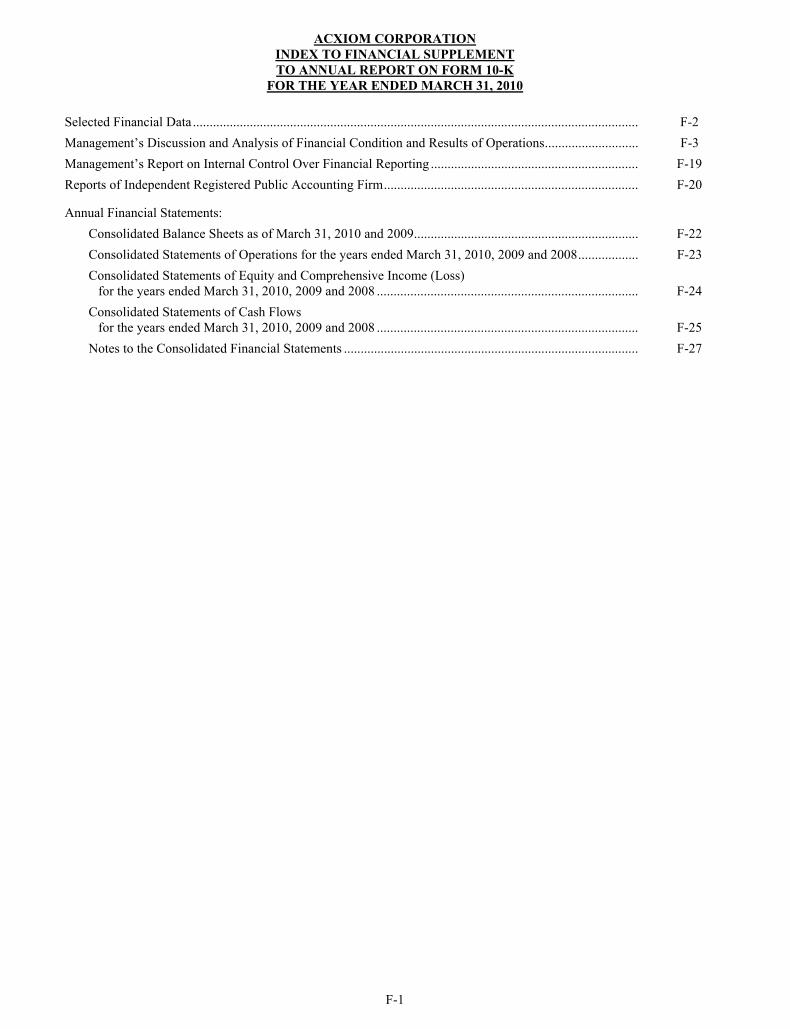
F-1
ACXIOM CORPORATIONINDEX TO FINANCIAL SUPPLEMENTTO ANNUAL REPORT ON FORM 10-K
FOR THE YEAR ENDED MARCH 31, 2010
Selected Financial Data ..................................................................................................................................... F-2 Management’s Discussion and Analysis of Financial Condition and Results of Operations ............................ F-3 Management’s Report on Internal Control Over Financial Reporting .............................................................. F-19 Reports of Independent Registered Public Accounting Firm ............................................................................ F-20
Annual Financial Statements: Consolidated Balance Sheets as of March 31, 2010 and 2009 ................................................................... F-22Consolidated Statements of Operations for the years ended March 31, 2010, 2009 and 2008 .................. F-23 Consolidated Statements of Equity and Comprehensive Income (Loss)
for the years ended March 31, 2010, 2009 and 2008 .............................................................................. F-24 Consolidated Statements of Cash Flows
for the years ended March 31, 2010, 2009 and 2008 .............................................................................. F-25 Notes to the Consolidated Financial Statements ........................................................................................ F-27
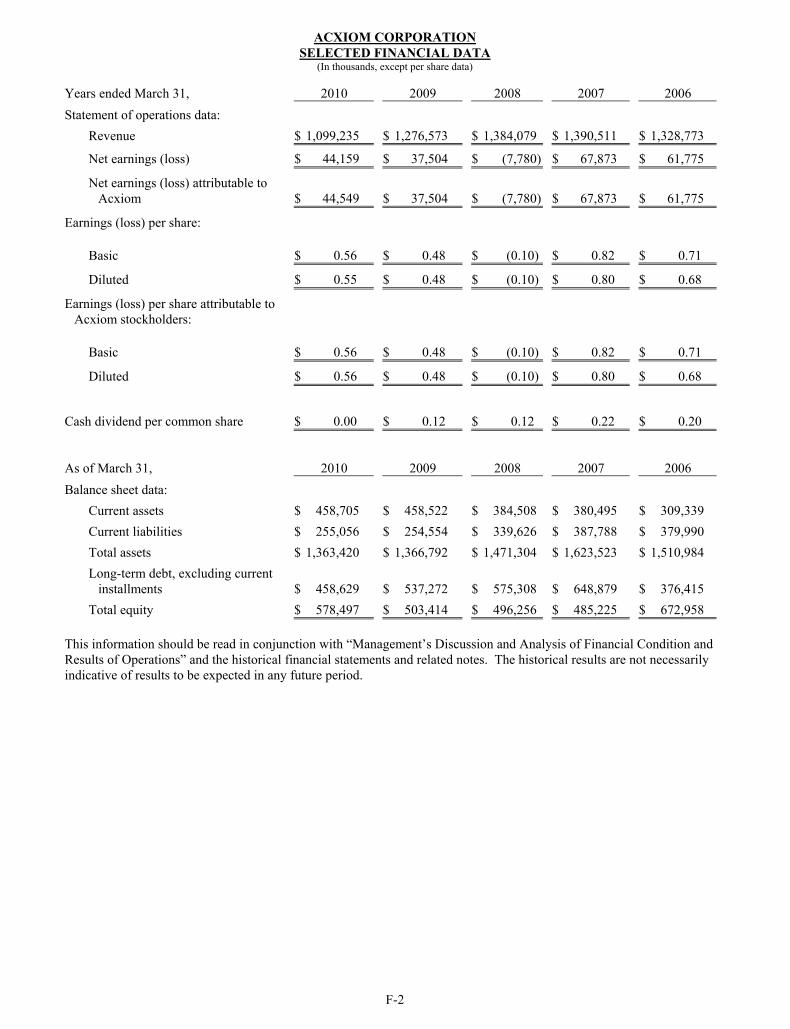
F-2
ACXIOM CORPORATION SELECTED FINANCIAL DATA
(In thousands, except per share data)
Years ended March 31, 2010 2009 2008 2007 2006 Statement of operations data:
Revenue $ 1,099,235 $ 1,276,573 $ 1,384,079 $ 1,390,511 $ 1,328,773
Net earnings (loss) $ 44,159 $ 37,504 $ (7,780) $ 67,873 $ 61,775
Net earnings (loss) attributable to Acxiom $ 44,549
$ 37,504
$ (7,780) $ 67,873 $ 61,775
Earnings (loss) per share:
Basic $ 0.56
$ 0.48
$ (0.10) $ 0.82 $ 0.71
Diluted $ 0.55 $ 0.48 $ (0.10) $ 0.80 $ 0.68
Earnings (loss) per share attributable to Acxiom stockholders:
Basic $ 0.56
$ 0.48
$ (0.10) $ 0.82 $ 0.71
Diluted $ 0.56 $ 0.48 $ (0.10) $ 0.80 $ 0.68
Cash dividend per common share $ 0.00
$ 0.12
$ 0.12 $ 0.22 $ 0.20
As of March 31, 2010 2009 2008 2007 2006 Balance sheet data:
Current assets $ 458,705 $ 458,522 $ 384,508 $ 380,495 $ 309,339 Current liabilities $ 255,056 $ 254,554 $ 339,626 $ 387,788 $ 379,990 Total assets $ 1,363,420 $ 1,366,792 $ 1,471,304 $ 1,623,523 $ 1,510,984 Long-term debt, excluding current
installments $ 458,629
$ 537,272
$ 575,308 $ 648,879 $ 376,415 Total equity $ 578,497 $ 503,414 $ 496,256 $ 485,225 $ 672,958
This information should be read in conjunction with “Management’s Discussion and Analysis of Financial Condition and Results of Operations” and the historical financial statements and related notes. The historical results are not necessarily indicative of results to be expected in any future period.
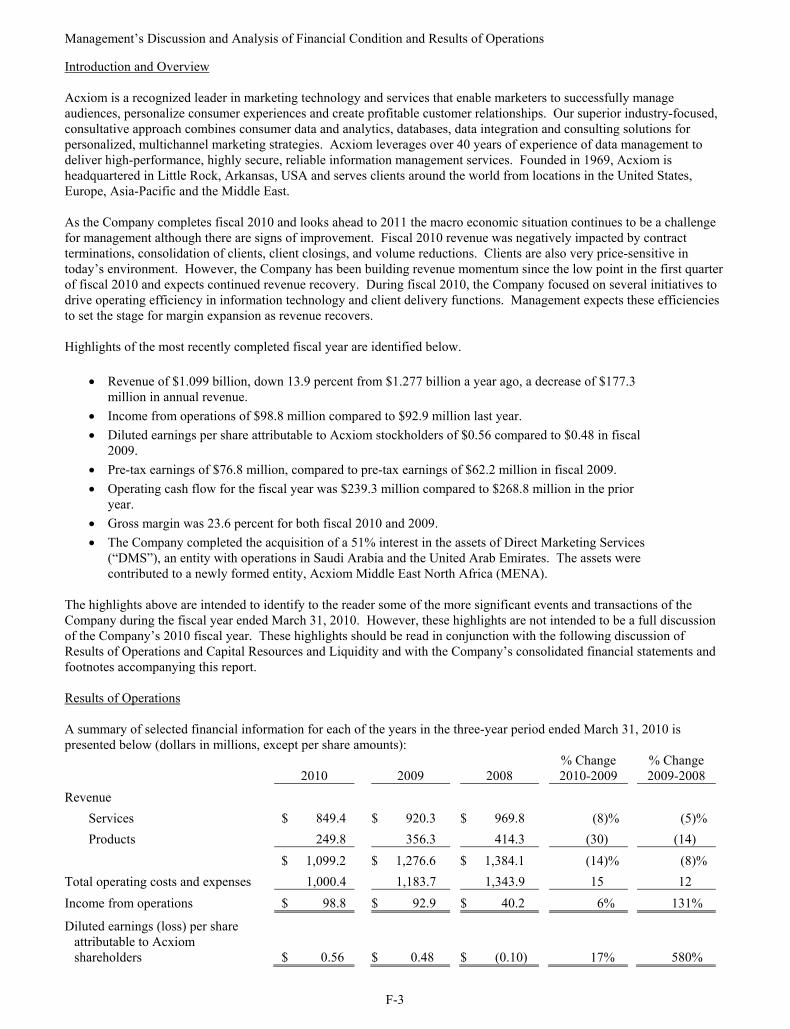
F-3
Management’s Discussion and Analysis of Financial Condition and Results of Operations
Introduction and Overview
Acxiom is a recognized leader in marketing technology and services that enable marketers to successfully manage audiences, personalize consumer experiences and create profitable customer relationships. Our superior industry-focused, consultative approach combines consumer data and analytics, databases, data integration and consulting solutions for personalized, multichannel marketing strategies. Acxiom leverages over 40 years of experience of data management to deliver high-performance, highly secure, reliable information management services. Founded in 1969, Acxiom is headquartered in Little Rock, Arkansas, USA and serves clients around the world from locations in the United States, Europe, Asia-Pacific and the Middle East.
As the Company completes fiscal 2010 and looks ahead to 2011 the macro economic situation continues to be a challenge for management although there are signs of improvement. Fiscal 2010 revenue was negatively impacted by contract terminations, consolidation of clients, client closings, and volume reductions. Clients are also very price-sensitive in today’s environment. However, the Company has been building revenue momentum since the low point in the first quarter of fiscal 2010 and expects continued revenue recovery. During fiscal 2010, the Company focused on several initiatives to drive operating efficiency in information technology and client delivery functions. Management expects these efficiencies to set the stage for margin expansion as revenue recovers.
Highlights of the most recently completed fiscal year are identified below.
Revenue of $1.099 billion, down 13.9 percent from $1.277 billion a year ago, a decrease of $177.3 million in annual revenue. Income from operations of $98.8 million compared to $92.9 million last year. Diluted earnings per share attributable to Acxiom stockholders of $0.56 compared to $0.48 in fiscal 2009.Pre-tax earnings of $76.8 million, compared to pre-tax earnings of $62.2 million in fiscal 2009. Operating cash flow for the fiscal year was $239.3 million compared to $268.8 million in the prior year.Gross margin was 23.6 percent for both fiscal 2010 and 2009. The Company completed the acquisition of a 51% interest in the assets of Direct Marketing Services (“DMS”), an entity with operations in Saudi Arabia and the United Arab Emirates. The assets were contributed to a newly formed entity, Acxiom Middle East North Africa (MENA).
The highlights above are intended to identify to the reader some of the more significant events and transactions of the Company during the fiscal year ended March 31, 2010. However, these highlights are not intended to be a full discussion of the Company’s 2010 fiscal year. These highlights should be read in conjunction with the following discussion of Results of Operations and Capital Resources and Liquidity and with the Company’s consolidated financial statements and footnotes accompanying this report.
Results of Operations
A summary of selected financial information for each of the years in the three-year period ended March 31, 2010 is presented below (dollars in millions, except per share amounts):
2010 2009 2008 % Change 2010-2009
% Change2009-2008
RevenueServices $ 849.4 $ 920.3 $ 969.8 (8)% (5)% Products 249.8 356.3 414.3 (30) (14)
$ 1,099.2 $ 1,276.6 $ 1,384.1 (14)% (8)% Total operating costs and expenses 1,000.4 1,183.7 1,343.9 15 12 Income from operations $ 98.8 $ 92.9 $ 40.2 6% 131%
Diluted earnings (loss) per share attributable to Acxiom shareholders $ 0.56 $ 0.48 $ (0.10) 17% 580%
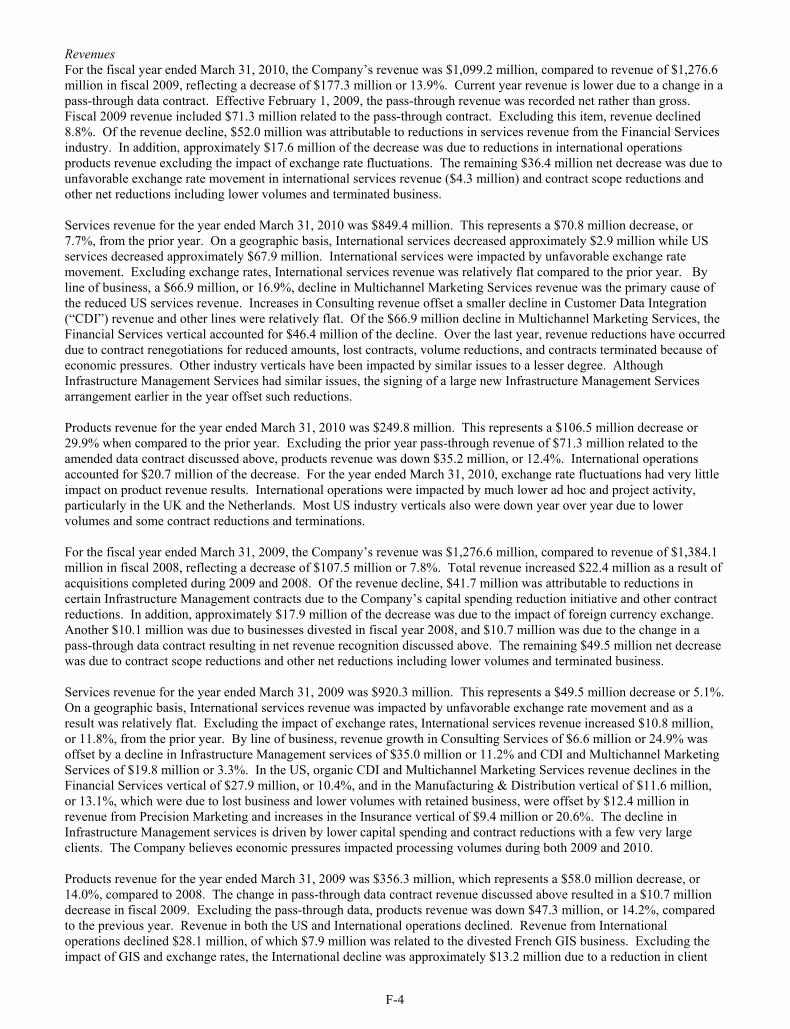
F-4
RevenuesFor the fiscal year ended March 31, 2010, the Company’s revenue was $1,099.2 million, compared to revenue of $1,276.6 million in fiscal 2009, reflecting a decrease of $177.3 million or 13.9%. Current year revenue is lower due to a change in a pass-through data contract. Effective February 1, 2009, the pass-through revenue was recorded net rather than gross. Fiscal 2009 revenue included $71.3 million related to the pass-through contract. Excluding this item, revenue declined 8.8%. Of the revenue decline, $52.0 million was attributable to reductions in services revenue from the Financial Services industry. In addition, approximately $17.6 million of the decrease was due to reductions in international operations products revenue excluding the impact of exchange rate fluctuations. The remaining $36.4 million net decrease was due to unfavorable exchange rate movement in international services revenue ($4.3 million) and contract scope reductions and other net reductions including lower volumes and terminated business.
Services revenue for the year ended March 31, 2010 was $849.4 million. This represents a $70.8 million decrease, or 7.7%, from the prior year. On a geographic basis, International services decreased approximately $2.9 million while US services decreased approximately $67.9 million. International services were impacted by unfavorable exchange rate movement. Excluding exchange rates, International services revenue was relatively flat compared to the prior year. By line of business, a $66.9 million, or 16.9%, decline in Multichannel Marketing Services revenue was the primary cause of the reduced US services revenue. Increases in Consulting revenue offset a smaller decline in Customer Data Integration (“CDI”) revenue and other lines were relatively flat. Of the $66.9 million decline in Multichannel Marketing Services, the Financial Services vertical accounted for $46.4 million of the decline. Over the last year, revenue reductions have occurred due to contract renegotiations for reduced amounts, lost contracts, volume reductions, and contracts terminated because of economic pressures. Other industry verticals have been impacted by similar issues to a lesser degree. Although Infrastructure Management Services had similar issues, the signing of a large new Infrastructure Management Services arrangement earlier in the year offset such reductions.
Products revenue for the year ended March 31, 2010 was $249.8 million. This represents a $106.5 million decrease or 29.9% when compared to the prior year. Excluding the prior year pass-through revenue of $71.3 million related to the amended data contract discussed above, products revenue was down $35.2 million, or 12.4%. International operations accounted for $20.7 million of the decrease. For the year ended March 31, 2010, exchange rate fluctuations had very little impact on product revenue results. International operations were impacted by much lower ad hoc and project activity, particularly in the UK and the Netherlands. Most US industry verticals also were down year over year due to lower volumes and some contract reductions and terminations.
For the fiscal year ended March 31, 2009, the Company’s revenue was $1,276.6 million, compared to revenue of $1,384.1 million in fiscal 2008, reflecting a decrease of $107.5 million or 7.8%. Total revenue increased $22.4 million as a result of acquisitions completed during 2009 and 2008. Of the revenue decline, $41.7 million was attributable to reductions in certain Infrastructure Management contracts due to the Company’s capital spending reduction initiative and other contract reductions. In addition, approximately $17.9 million of the decrease was due to the impact of foreign currency exchange. Another $10.1 million was due to businesses divested in fiscal year 2008, and $10.7 million was due to the change in a pass-through data contract resulting in net revenue recognition discussed above. The remaining $49.5 million net decrease was due to contract scope reductions and other net reductions including lower volumes and terminated business.
Services revenue for the year ended March 31, 2009 was $920.3 million. This represents a $49.5 million decrease or 5.1%. On a geographic basis, International services revenue was impacted by unfavorable exchange rate movement and as a result was relatively flat. Excluding the impact of exchange rates, International services revenue increased $10.8 million, or 11.8%, from the prior year. By line of business, revenue growth in Consulting Services of $6.6 million or 24.9% was offset by a decline in Infrastructure Management services of $35.0 million or 11.2% and CDI and Multichannel Marketing Services of $19.8 million or 3.3%. In the US, organic CDI and Multichannel Marketing Services revenue declines in the Financial Services vertical of $27.9 million, or 10.4%, and in the Manufacturing & Distribution vertical of $11.6 million, or 13.1%, which were due to lost business and lower volumes with retained business, were offset by $12.4 million in revenue from Precision Marketing and increases in the Insurance vertical of $9.4 million or 20.6%. The decline in Infrastructure Management services is driven by lower capital spending and contract reductions with a few very large clients. The Company believes economic pressures impacted processing volumes during both 2009 and 2010.
Products revenue for the year ended March 31, 2009 was $356.3 million, which represents a $58.0 million decrease, or 14.0%, compared to 2008. The change in pass-through data contract revenue discussed above resulted in a $10.7 million decrease in fiscal 2009. Excluding the pass-through data, products revenue was down $47.3 million, or 14.2%, compared to the previous year. Revenue in both the US and International operations declined. Revenue from International operations declined $28.1 million, of which $7.9 million was related to the divested French GIS business. Excluding the impact of GIS and exchange rates, the International decline was approximately $13.2 million due to a reduction in client
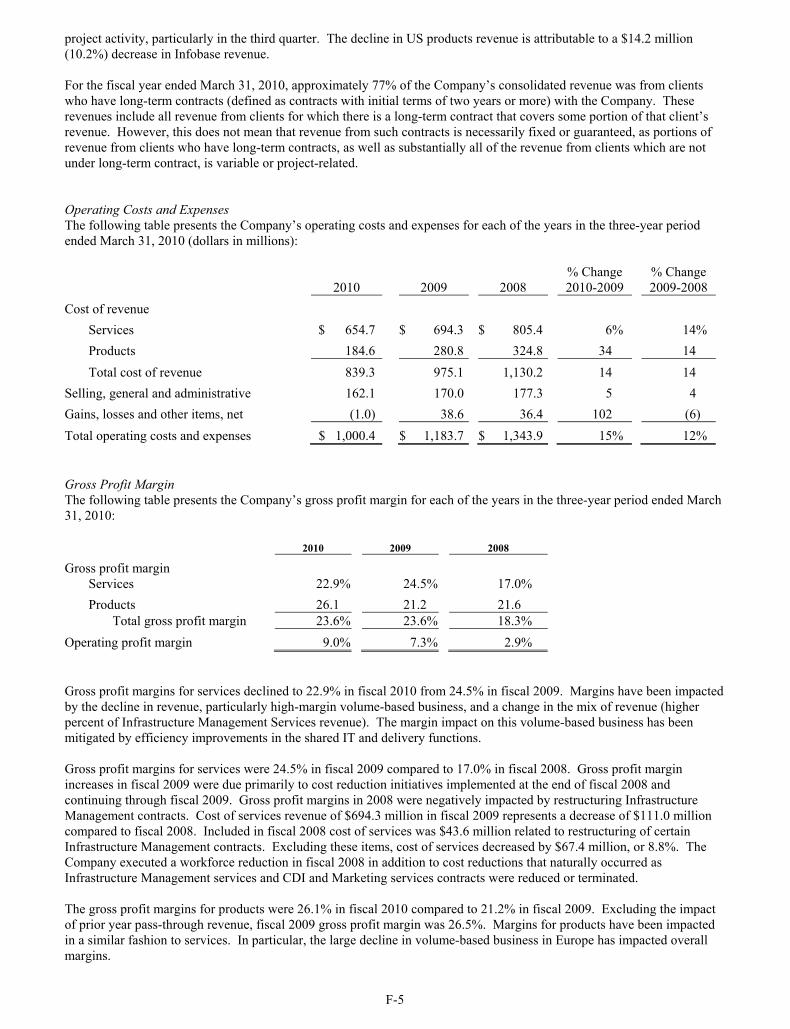
F-5
project activity, particularly in the third quarter. The decline in US products revenue is attributable to a $14.2 million (10.2%) decrease in Infobase revenue.
For the fiscal year ended March 31, 2010, approximately 77% of the Company’s consolidated revenue was from clients who have long-term contracts (defined as contracts with initial terms of two years or more) with the Company. These revenues include all revenue from clients for which there is a long-term contract that covers some portion of that client’s revenue. However, this does not mean that revenue from such contracts is necessarily fixed or guaranteed, as portions of revenue from clients who have long-term contracts, as well as substantially all of the revenue from clients which are not under long-term contract, is variable or project-related.
Operating Costs and Expenses The following table presents the Company’s operating costs and expenses for each of the years in the three-year period ended March 31, 2010 (dollars in millions):
2010 2009 2008 % Change 2010-2009
% Change2009-2008
Cost of revenue Services $ 654.7 $ 694.3 $ 805.4 6% 14% Products 184.6 280.8 324.8 34 14 Total cost of revenue 839.3 975.1 1,130.2 14 14
Selling, general and administrative 162.1 170.0 177.3 5 4 Gains, losses and other items, net (1.0) 38.6 36.4 102 (6) Total operating costs and expenses $ 1,000.4 $ 1,183.7 $ 1,343.9 15% 12%
Gross Profit MarginThe following table presents the Company’s gross profit margin for each of the years in the three-year period ended March 31, 2010:
2010 2009 2008
Gross profit margin Services 22.9% 24.5% 17.0% Products 26.1 21.2 21.6
Total gross profit margin 23.6% 23.6% 18.3% Operating profit margin 9.0% 7.3% 2.9%
Gross profit margins for services declined to 22.9% in fiscal 2010 from 24.5% in fiscal 2009. Margins have been impacted by the decline in revenue, particularly high-margin volume-based business, and a change in the mix of revenue (higher percent of Infrastructure Management Services revenue). The margin impact on this volume-based business has been mitigated by efficiency improvements in the shared IT and delivery functions.
Gross profit margins for services were 24.5% in fiscal 2009 compared to 17.0% in fiscal 2008. Gross profit margin increases in fiscal 2009 were due primarily to cost reduction initiatives implemented at the end of fiscal 2008 and continuing through fiscal 2009. Gross profit margins in 2008 were negatively impacted by restructuring Infrastructure Management contracts. Cost of services revenue of $694.3 million in fiscal 2009 represents a decrease of $111.0 million compared to fiscal 2008. Included in fiscal 2008 cost of services was $43.6 million related to restructuring of certain Infrastructure Management contracts. Excluding these items, cost of services decreased by $67.4 million, or 8.8%. The Company executed a workforce reduction in fiscal 2008 in addition to cost reductions that naturally occurred as Infrastructure Management services and CDI and Marketing services contracts were reduced or terminated.
The gross profit margins for products were 26.1% in fiscal 2010 compared to 21.2% in fiscal 2009. Excluding the impact of prior year pass-through revenue, fiscal 2009 gross profit margin was 26.5%. Margins for products have been impacted in a similar fashion to services. In particular, the large decline in volume-based business in Europe has impacted overall margins.
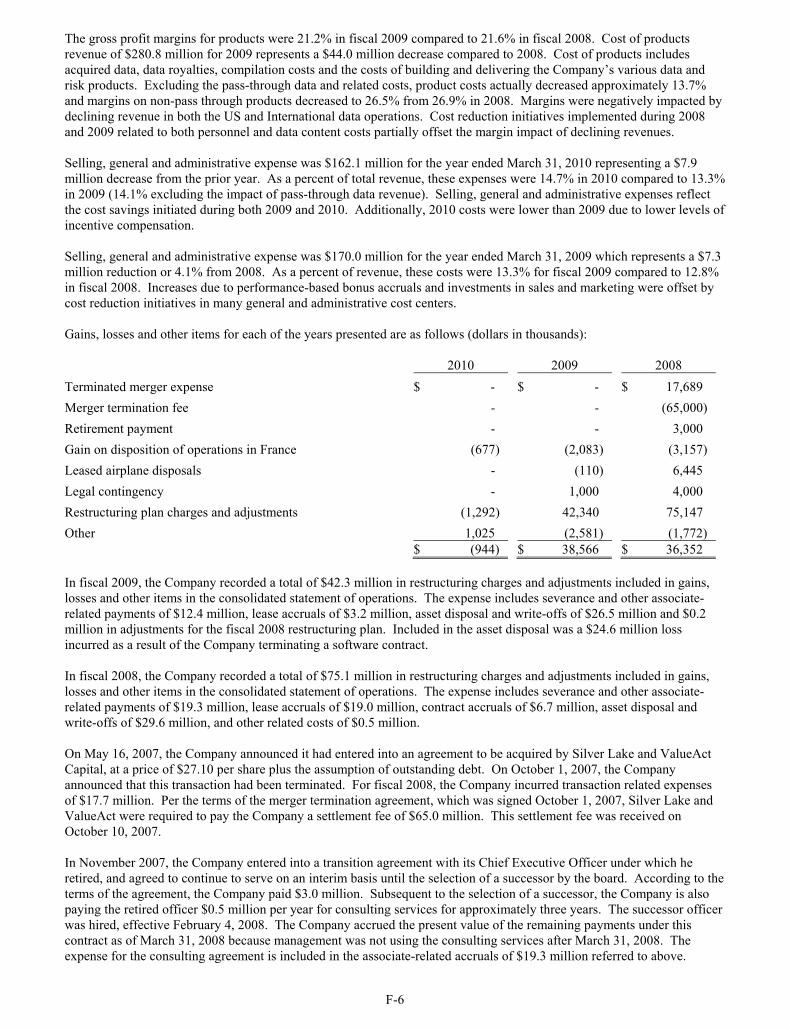
F-6
The gross profit margins for products were 21.2% in fiscal 2009 compared to 21.6% in fiscal 2008. Cost of products revenue of $280.8 million for 2009 represents a $44.0 million decrease compared to 2008. Cost of products includes acquired data, data royalties, compilation costs and the costs of building and delivering the Company’s various data and risk products. Excluding the pass-through data and related costs, product costs actually decreased approximately 13.7% and margins on non-pass through products decreased to 26.5% from 26.9% in 2008. Margins were negatively impacted by declining revenue in both the US and International data operations. Cost reduction initiatives implemented during 2008 and 2009 related to both personnel and data content costs partially offset the margin impact of declining revenues.
Selling, general and administrative expense was $162.1 million for the year ended March 31, 2010 representing a $7.9 million decrease from the prior year. As a percent of total revenue, these expenses were 14.7% in 2010 compared to 13.3% in 2009 (14.1% excluding the impact of pass-through data revenue). Selling, general and administrative expenses reflect the cost savings initiated during both 2009 and 2010. Additionally, 2010 costs were lower than 2009 due to lower levels of incentive compensation.
Selling, general and administrative expense was $170.0 million for the year ended March 31, 2009 which represents a $7.3 million reduction or 4.1% from 2008. As a percent of revenue, these costs were 13.3% for fiscal 2009 compared to 12.8% in fiscal 2008. Increases due to performance-based bonus accruals and investments in sales and marketing were offset by cost reduction initiatives in many general and administrative cost centers.
Gains, losses and other items for each of the years presented are as follows (dollars in thousands):
2010 2009 2008 Terminated merger expense $ - $ - $ 17,689 Merger termination fee - - (65,000)Retirement payment - - 3,000Gain on disposition of operations in France (677) (2,083) (3,157)Leased airplane disposals - (110) 6,445 Legal contingency - 1,000 4,000 Restructuring plan charges and adjustments (1,292) 42,340 75,147 Other 1,025 (2,581) (1,772)
$ (944) $ 38,566 $ 36,352
In fiscal 2009, the Company recorded a total of $42.3 million in restructuring charges and adjustments included in gains, losses and other items in the consolidated statement of operations. The expense includes severance and other associate-related payments of $12.4 million, lease accruals of $3.2 million, asset disposal and write-offs of $26.5 million and $0.2 million in adjustments for the fiscal 2008 restructuring plan. Included in the asset disposal was a $24.6 million loss incurred as a result of the Company terminating a software contract.
In fiscal 2008, the Company recorded a total of $75.1 million in restructuring charges and adjustments included in gains, losses and other items in the consolidated statement of operations. The expense includes severance and other associate-related payments of $19.3 million, lease accruals of $19.0 million, contract accruals of $6.7 million, asset disposal and write-offs of $29.6 million, and other related costs of $0.5 million.
On May 16, 2007, the Company announced it had entered into an agreement to be acquired by Silver Lake and ValueAct Capital, at a price of $27.10 per share plus the assumption of outstanding debt. On October 1, 2007, the Company announced that this transaction had been terminated. For fiscal 2008, the Company incurred transaction related expenses of $17.7 million. Per the terms of the merger termination agreement, which was signed October 1, 2007, Silver Lake and ValueAct were required to pay the Company a settlement fee of $65.0 million. This settlement fee was received on October 10, 2007.
In November 2007, the Company entered into a transition agreement with its Chief Executive Officer under which he retired, and agreed to continue to serve on an interim basis until the selection of a successor by the board. According to theterms of the agreement, the Company paid $3.0 million. Subsequent to the selection of a successor, the Company is also paying the retired officer $0.5 million per year for consulting services for approximately three years. The successor officer was hired, effective February 4, 2008. The Company accrued the present value of the remaining payments under this contract as of March 31, 2008 because management was not using the consulting services after March 31, 2008. The expense for the consulting agreement is included in the associate-related accruals of $19.3 million referred to above.
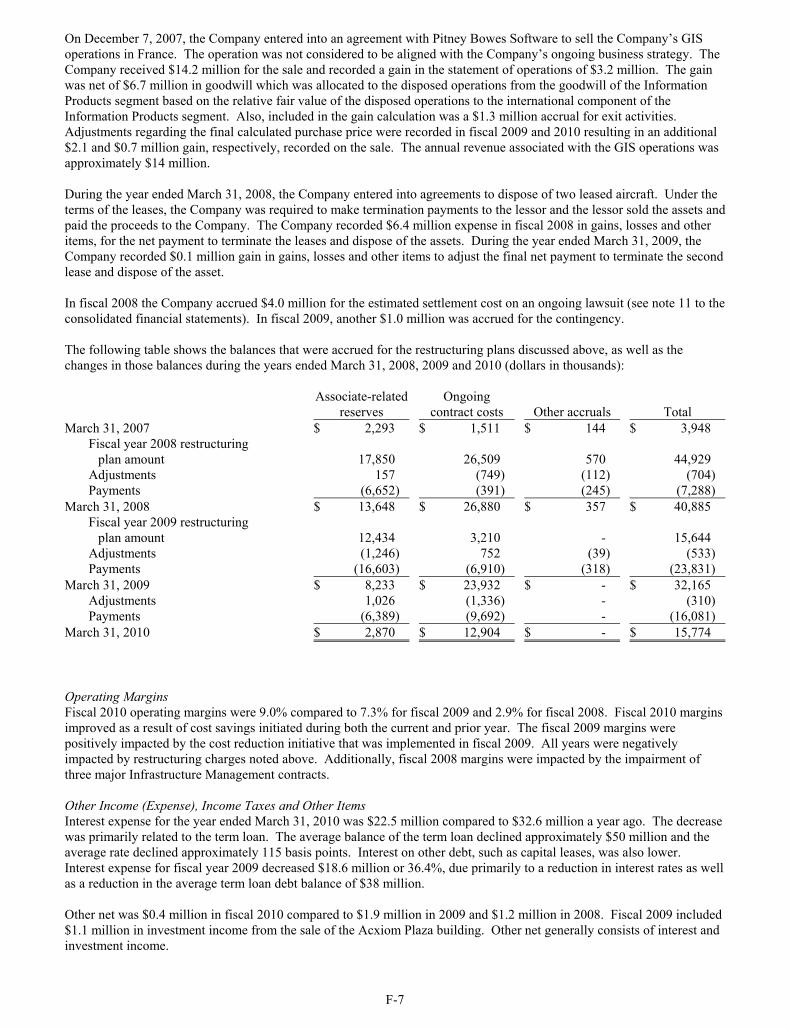
F-7
On December 7, 2007, the Company entered into an agreement with Pitney Bowes Software to sell the Company’s GIS operations in France. The operation was not considered to be aligned with the Company’s ongoing business strategy. The Company received $14.2 million for the sale and recorded a gain in the statement of operations of $3.2 million. The gain was net of $6.7 million in goodwill which was allocated to the disposed operations from the goodwill of the Information Products segment based on the relative fair value of the disposed operations to the international component of the Information Products segment. Also, included in the gain calculation was a $1.3 million accrual for exit activities. Adjustments regarding the final calculated purchase price were recorded in fiscal 2009 and 2010 resulting in an additional $2.1 and $0.7 million gain, respectively, recorded on the sale. The annual revenue associated with the GIS operations was approximately $14 million.
During the year ended March 31, 2008, the Company entered into agreements to dispose of two leased aircraft. Under the terms of the leases, the Company was required to make termination payments to the lessor and the lessor sold the assets and paid the proceeds to the Company. The Company recorded $6.4 million expense in fiscal 2008 in gains, losses and other items, for the net payment to terminate the leases and dispose of the assets. During the year ended March 31, 2009, the Company recorded $0.1 million gain in gains, losses and other items to adjust the final net payment to terminate the second lease and dispose of the asset.
In fiscal 2008 the Company accrued $4.0 million for the estimated settlement cost on an ongoing lawsuit (see note 11 to the consolidated financial statements). In fiscal 2009, another $1.0 million was accrued for the contingency.
The following table shows the balances that were accrued for the restructuring plans discussed above, as well as the changes in those balances during the years ended March 31, 2008, 2009 and 2010 (dollars in thousands):
Associate-relatedreserves
Ongoing contract costs Other accruals Total
March 31, 2007 $ 2,293 $ 1,511 $ 144 $ 3,948 Fiscal year 2008 restructuring
plan amount 17,850 26,509 570 44,929 Adjustments 157 (749) (112) (704) Payments (6,652) (391) (245) (7,288)
March 31, 2008 $ 13,648 $ 26,880 $ 357 $ 40,885 Fiscal year 2009 restructuring
plan amount 12,434 3,210 - 15,644 Adjustments (1,246) 752 (39) (533) Payments (16,603) (6,910) (318) (23,831)
March 31, 2009 $ 8,233 $ 23,932 $ - $ 32,165 Adjustments 1,026 (1,336) - (310) Payments (6,389) (9,692) - (16,081)
March 31, 2010 $ 2,870 $ 12,904 $ - $ 15,774
Operating Margins Fiscal 2010 operating margins were 9.0% compared to 7.3% for fiscal 2009 and 2.9% for fiscal 2008. Fiscal 2010 margins improved as a result of cost savings initiated during both the current and prior year. The fiscal 2009 margins were positively impacted by the cost reduction initiative that was implemented in fiscal 2009. All years were negatively impacted by restructuring charges noted above. Additionally, fiscal 2008 margins were impacted by the impairment of three major Infrastructure Management contracts.
Other Income (Expense), Income Taxes and Other Items Interest expense for the year ended March 31, 2010 was $22.5 million compared to $32.6 million a year ago. The decrease was primarily related to the term loan. The average balance of the term loan declined approximately $50 million and the average rate declined approximately 115 basis points. Interest on other debt, such as capital leases, was also lower. Interest expense for fiscal year 2009 decreased $18.6 million or 36.4%, due primarily to a reduction in interest rates as well as a reduction in the average term loan debt balance of $38 million.
Other net was $0.4 million in fiscal 2010 compared to $1.9 million in 2009 and $1.2 million in 2008. Fiscal 2009 included $1.1 million in investment income from the sale of the Acxiom Plaza building. Other net generally consists of interest and investment income.
F-8
The Company’s effective tax rate was 42.5% in fiscal 2010 compared to 39.7% in fiscal 2009 and 20.3% in fiscal 2008. The rate in all periods was adversely impacted by losses in foreign jurisdictions for which no tax benefit is recorded. In 2009 the Company also reduced income tax expense by $2.1 million as a result of reducing valuation reserves previously recorded for net operating loss carryforwards in France. The rate for 2008 was also impacted by the expiration of state net operating loss carryforwards. These items were offset in 2008 by a $0.7 million reversal of the reserve for potential penalties due to failure to file foreign information returns. The Company received notice that such penalties would not be incurred. Additionally, fiscal 2008 included adjustments related to the finalization of the fiscal 2007 and fiscal 2006 amended tax returns for both the US and International operations, as well as finalization of US tax audits from fiscal 2003-2005.
Capital Resources and Liquidity
Working Capital and Cash Flow Working capital at March 31, 2010 totaled $203.6 million compared to $204.0 million at March 31, 2009. Total current assets decreased $0.2 million, including a $46.9 million increase in cash and a $7.3 million increase in other current assets offset by a $16.3 million decrease in accounts receivable, a $33.8 million decrease in deferred income taxes, and a $4.0 million decrease in refundable income taxes. Current liabilities increased $0.5 million, including a $15.1 million increase in trade accounts payable and a $2.5 million increase in income taxes offset by a $10.4 million decrease in other accrued expenses and an $8.3 million decrease in accrued payroll. Cash provided by operating activities was $239.3 million compared to $268.8 million in fiscal 2009 and $267.8 million in fiscal 2008. Increases in earnings each year have been offset by decreases in depreciation and amortization and changes in operating assets and liabilities.
Accounts receivable days sales outstanding (“DSO”) was 53 days at March 31, 2010 as compared to 56 days at March 31, 2009, and is calculated as follows (dollars in thousands):
March 31, 2010
March 31, 2009
Numerator – trade accounts receivable, net $ 168,522 $ 184,814 Denominator:
Quarter revenue 288,342 295,509 Number of days in quarter 90 90
Average daily revenue $ 3,204 $ 3,283 Days sales outstanding 53 56
Investing activities used $89.3 million in fiscal 2010 compared to $65.4 million in fiscal 2009 and $80.5 million in fiscal 2008. Investing activities in fiscal 2010 included capitalized software development costs of $8.3 million as compared to $16.2 million in fiscal 2009 and $33.3 million in fiscal 2008. Capital expenditures were $57.9 million in 2010 compared to $31.4 million in fiscal 2009 and $21.6 million in fiscal 2008. Data acquisition costs were $18.8 million in 2010 compared to $30.6 million in fiscal 2009 and $32.2 million in fiscal 2008.
Investing activities also reflect net cash paid for acquisitions of $3.4 million in fiscal 2010 compared to $15.9 million in fiscal 2009 and $11.2 million in fiscal 2008. In fiscal 2010 the Company paid $3.8 million for the acquisition of a 51% interest in the assets of DMS, offset by $0.4 million cash returned from escrow related to the Precision Marketing acquisition. Fiscal 2009 included cash paid for the acquisition of Precision Marketing for $9.0 million, the acquisition of Quinetia for $2.9 million and the acquisition of Alvion for $3.6 million. Fiscal 2008 included cash paid for the acquisition of EchoTarget for $2.1 million and MKTG for $3.7 million. The remainder of the cash paid for acquisitions each year relates to fees and earnout payments paid on acquisitions made in a prior year and purchases of minority interests on prior acquisitions.
Investing activities in fiscal 2010 also included $1.1 million in proceeds from the sale of fixed assets. In fiscal 2009 the Company received $24.2 million in proceeds from the sale of the Company’s Phoenix facility. In fiscal 2008 the Company received $14.2 million for the sale of its GIS operations in France (see note 4 to the consolidated financial statements). In fiscal 2010 the Company paid $2.0 million for a minority investment in Kynetx. Payments received on investments of $2.6 million in 2009 and $3.6 million in 2008 include sales or collections on a number of investments. There were no payments received on investments during fiscal 2010.
With respect to certain of its investments in joint ventures and other companies, the Company may provide cash advances to fund losses and cash flow deficits. The Company may, at its discretion, decide not to provide financing to these investments during future periods. In the event that it does not provide funding and these investments have not achieved
F-9
profitable operations, the Company may be required to record an impairment charge up to the amount of the carrying value of these investments ($3.2 million at March 31, 2010). In fiscal 2008, the Company determined that one of its investments was impaired and wrote off its value of $2.7 million to other, net. In the event that declines in the value of its investmentsoccur and continue, the Company may be required to record further impairment charges related to its investments.
During the fiscal year ended March 31, 2009, the Company repurchased 0.3 million shares for $2.1 million. During the fiscal year ended March 31, 2008, the Company repurchased 4.2 million shares for $50.6 million. Cash paid for repurchases differs from the aggregate purchase price due to trades made at the end of the period which were settled in the following period. There were no share repurchases in fiscal 2010.
Financing activities in fiscal 2010 used $103.7 million including $104.5 million in debt payments and $4.6 million in debt financing fees offset by $5.9 million in sales of common stock. Financing activities in fiscal 2009 used $86.9 million including $86.8 million in debt payments, dividends paid of $9.3 million and stock repurchases of $1.8 million offset by $10.9 million in sales of stock. Financing activities in fiscal 2008 used $163.1 million including $158.7 million in debt payments, dividends paid of $9.5 million and stock repurchases of $50.6 million offset by $47.9 million in sales of stock. Also included in financing activities in fiscal 2008 was the tax benefit from stock options, warrants and restricted stock of $5.5 million.
In each of the fiscal years 2010, 2009 and 2008, the Company has incurred debt to finance the acquisition of data, software licenses, property and equipment, acquisitions and construction. The incurrence of this debt appears on the Consolidated Statements of Cash Flows under “supplemental cash flow information.” Acquisitions under capital leases and installment payment arrangements were $24.2 million in 2010 compared to $11.0 million in 2009 and $24.8 million in 2008 Construction and other financing was $11.0 million in 2008. Assets acquired under a data obligation were $15.3 million in 2008. Software licenses acquired under software obligations were $2.2 million in 2010, $10.0 million in 2009 and $0.5 million in 2008. Payment of this debt in future periods will be reflected as a financing activity. The Company has also included details of its debt payments within the “supplemental cash flow” information.
Credit and Debt Facilities Effective September 15, 2006, the Company entered into an amended and restated credit agreement allowing (1) term loans up to an aggregate principal amount of $600 million and (2) revolving credit facility borrowings consisting of revolving loans, letter of credit participations and swing-line loans up to an aggregate amount of $200 million.
In November 2009, the Company entered into an amendment to its term loan credit facility (the “Amendment”). Under the terms of the Amendment, certain of the lenders have agreed to extend the maturity date of the existing term loan, becoming Tranche 2 Term Lenders. Lenders who did not agree to extend the maturity date became Tranche 1 Term Lenders. Certain lenders also agreed to extend the maturity date of the existing revolving loan commitment, becoming Tranche 2 Revolving Lenders. Lenders who did not agree to extend the maturity date of the revolving loan commitment became Tranche 1 Revolving Lenders. Of the $450 million balance of the existing term loan on the date of the Amendment, approximately $75 million was held by Tranche 1 Term Lenders and $375 million was held by Tranche 2 Term Lenders. Of the $200 million revolving loan commitment, $80 million is held by Tranche 1 Revolving Lenders and $120 million is held by Tranche 2 Revolving Lenders.
Tranche 1 of the term loan is payable in quarterly installments of approximately $0.2 million each, through September 30, 2011, followed by four quarterly installments of approximately $13.1 million each with the last payment due September 15, 2012. Tranche 2 of the term loan is payable in quarterly installments of approximately $1.3 million each, through September 30, 2011, followed by thirteen quarterly installments of $1.5 million each with a final payment of approximately $345.9 million due March 15, 2015. The Tranche 1 revolving loan commitment expires September 15, 2011 and the Tranche 2 revolving loan commitment expires March 15, 2014.
Revolving credit facility borrowings currently bear interest at LIBOR plus a credit spread, or at an alternative base rate or at the Federal Funds rate plus a credit spread, depending on the type of borrowing. The LIBOR credit spread is 1.5% for Tranche 1 and 2.75% for Tranche 2. There were no revolving credit borrowings outstanding at March 31, 2010 or March 31, 2009. Term loan borrowings bear interest at LIBOR plus a credit spread which is 1.75% for Tranche 1, and 3.00% for Tranche 2. The weighted average interest rate on term loan borrowings at March 31, 2010 was 3.8%.
The term loan allows prepayments before maturity. The credit agreement is secured by the accounts receivable of Acxiom and its domestic subsidiaries, as well as by the outstanding stock of certain Acxiom subsidiaries.
Under the terms of the term loan, the Company is required to maintain certain debt-to-cash flow and debt service coverage ratios, among other restrictions. At March 31, 2010, the Company was in compliance with these covenants and restrictions. In addition, if certain financial ratios and other conditions are not satisfied, the revolving credit facility limits
F-10
the Company’s ability to pay dividends in excess of $30 million in any fiscal year (plus additional amounts in certain circumstances). The principal factor that could cause the Company to not be able to maintain compliance with its debt covenants would be if the level of operating income (as adjusted for certain non-cash charges, rent expense, and gains, losses, and other items) were to decline, without a corresponding decrease in the Company’s debt levels. The most likely scenario that could cause such a decrease in operating income would be a significant decrease in revenue, without a corresponding decrease in operating expenses. Management, however, maintains a focus on operating income to mitigate any such risk. Failure to maintain compliance with debt covenants could lead to the lender declaring the debt to be due and payable immediately, or the Company could be required to renegotiate the debt at terms which are less favorable than the current terms, and the Company could be required to incur fees and expenses to renegotiate or refinance the debt. There can be no assurance that if such a failure were to occur, the Company would be able to renegotiate or refinance the debt.
On October 20, 2008, the Company entered into an interest rate swap agreement. The agreement provides for the Company to pay interest through July 25, 2011 at a fixed rate of 3.25% plus the applicable credit spread on $95.0 million notional amount while receiving interest for the same period at the LIBOR rate on the same notional amount. The LIBOR rate as of March 31, 2010 was 0.25%. The swap was entered into as a cash flow hedge against LIBOR interest rate movements on the term loan. As of March 31, 2010, the hedge relationship qualified as an effective hedge under applicable accounting standards. Consequently, all changes in fair value of the derivative are deferred and recorded in other comprehensive income until the related forecasted transaction is recognized in the consolidated statement of operations. The fair market value of the derivative was zero at inception and an unrealized loss of $3.2 million since inception is recorded in other comprehensive income (loss) with the offset recorded to other noncurrent liabilities. The fair value of the interest rate swap agreement recorded in accumulated other comprehensive income (loss) may be recognized in the statement of operations if certain terms of the floating-rate debt change, if the floating-rate debt is extinguished or ifthe interest rate swap agreement is terminated prior to maturity.
Off-Balance Sheet Items and Commitments The Company is party to a 50/50 joint venture with a real estate developer in connection with the ownership of a building in Little Rock, Arkansas. The Company is guaranteeing a portion of the loan for the building. In addition, in connection with the disposal of certain assets, the Company has guaranteed loans for the buyers of the assets. Substantially all of the third party indebtedness for which the Company has provided guarantees is collateralized by various pieces of real property. The aggregate amount of the guarantees at March 31, 2010 was $1.5 million.
Outstanding letters of credit, which reduce the borrowing capacity under the Company’s revolving credit facility, were $0.7 million at March 31, 2010 and $4.3 million at March 31, 2009.
Contractual Commitments The following table presents Acxiom’s contractual cash obligations, exclusive of interest, and purchase commitments at March 31, 2010 (dollars in thousands). The table does not include the future payment of gross unrealized tax benefit liabilities of $6.4 million or the future payment, if any, against the Company’s non-current interest rate swap liability of $3.2 million as the Company is not able to predict the periods in which these payments will be made (dollars in thousands):
Term loan $ 6,000 $ 32,296 $ 32,296 $ 6,000 $ 350,408 $ 0 $ 427,000
For the years ending March 31 2011 2012 2013 2014 2015 Thereafter Total
Total purchase commitments $ 72,654 $ 33,113 $ 19,695 $ 9,721 $ 9,721 $ 9,319 $ 154,223
For the years ending March 31 2011 2012 2013 2014 2015 Thereafter Total
Capital lease and installment payment obligations 17,739 8,951 4,771 631 740 8,956 41,788
Software and data license liabilities 4,785 3,448 1,768 - - - 10,001
Other long-term debt 13,582 1,629 1,646 529 4,560 - 21,946 Total long-term debt 42,106 46,324 40,481 7,160 355,708 8,956 500,735
Operating lease payments 26,158 17,220 13,703 11,289 8,069 35,834 112,273 Total contractual cash
obligations $ 68,264 $ 63,544 $ 54,184 $ 18,449 $ 363,777 $ 44,790 $ 613,008
F-11
Purchase commitments include contractual commitments for the purchase of data and open purchase orders for equipment, paper, office supplies, construction and other items. Purchase commitments in some cases will be satisfied by entering into future operating leases, capital leases, or other financing arrangements, rather than payment of cash. The above commitments relating to long-term obligations do not include future payments of interest. The Company estimates interest payments on debt and capital leases for fiscal 2011 of $26.9 million.
The following table shows contingencies or guarantees under which the Company could be required, in certain circumstances, to make cash payments as of March 31, 2010 (dollars in thousands):
Guarantees on certain partnership and other loans 1,481Outstanding letters of credit 731
The total of partnership and other loans of which the Company guarantees the portion noted in the above table, are $5.8 million as of March 31, 2010.
While the Company does not have any other material contractual commitments for capital expenditures, certain levels of investments in facilities and computer equipment continue to be necessary to support the growth of the business. In some cases, the Company also sells software and hardware to clients. In addition, new outsourcing or facilities management contracts frequently require substantial up-front capital expenditures to acquire or replace existing assets. Management believes that the Company’s existing available debt and cash flow from operations will be sufficient to meet the Company’s working capital and capital expenditure requirements for the foreseeable future. The Company also evaluates acquisitions from time to time, which may require up-front payments of cash. Depending on the size of the acquisition it may be necessary to raise additional capital. If additional capital becomes necessary as a result of any material variance of operating results from projections or from potential future acquisitions, the Company would first use available borrowing capacity under its revolving credit agreement, followed by the issuance of debt or equity securities. However, no assurance can be given that the Company would be able to obtain funding through the issuance of debt or equity securities at terms favorable to the Company, or that such funding would be available.
For a description of certain risks that could have an impact on results of operations or financial condition, including liquidity and capital resources, see “Risk Factors” contained in Part I, Item 1A, of this Annual Report.
Acquisitions In December 2009, the Company acquired a 51% interest in DMS, with operations in Saudi Arabia and the United Arab Emirates. Upon acquisition DMS was reorganized as a limited liability company registered under the laws and regulations of the Kingdom of Saudi Arabia and renamed Acxiom Middle East and North Africa, LTD (“MENA”). The acquisition allows the Company to expand into this strategic geographic area. The purchase price for DMS was $3.8 million in cash, not including the amount, if any, to be paid pursuant to an earnout agreement where additional payment is contingent on MENA’s financial performance for the period ending on December 31, 2012. Financial performance under the earnout will be measured based on MENA’s calculation of earnings before interest, taxes, depreciation and amortization (“EBITDA”). The actual EBITDA will be divided by $18.3 million and that percentage multiplied by $6.1 million to determine the earnout payment. There will be no earnout payment if the actual EBITDA does not exceed $12.8 million. DMS has annual revenue of less than $5 million. The results of operations for MENA are included in the Company’s consolidated results beginning December 1, 2009.
On November 7, 2008, the Company acquired the assets of Quinetia, LLC, a Rochester, New York-based provider of analytics and predictive modeling for large and medium size businesses. The acquisition provides the Company additional consumer insight capabilities that enable clients to more effectively retain and grow their customer base and optimize pricing. The Company paid $2.7 million, net of cash acquired, for the acquisition not including amounts, if any, paid pursuant to an earnout agreement. The earnout agreement allows for payment of up to $1.2 million if the acquired business achieves certain EBITDA goals. Payments, if any, under the earnout agreement are determined based on results in the target measurement periods ending March 31, 2009, 2010 and 2011. The first earnout payment of $0.2 million in fiscal 2009, and the second earnout payment of $0.2 million in fiscal 2010 have been added to the purchase price. The acquired business has annual revenues of less than $5.0 million. Quinetia’s results of operations are included in the Company’s consolidated results beginning November 7, 2008.
On September 15, 2008, the Company acquired the direct marketing technology unit of Alvion, LLC. The acquisition allowed the Company to obtain a proven online marketing list fulfillment platform that can be used by small and medium-size businesses that need immediate access to marketing information through a software-as-service environment. The Company paid $3.6 million in cash, net of cash acquired, for the acquisition. The acquired business has annual revenues of
F-12
less than $5.0 million. Alvion’s results of operations are included in the Company’s consolidated results beginning September 15, 2008.
In July 2008, the Company acquired the database marketing unit of ChoicePoint Precision Marketing, LLC (“Precision Marketing”). The Company paid $9.0 million, of which $4.5 million was paid into two escrow accounts which were subject to escrow arrangements which were finally resolved during fiscal 2010. A total of $0.5 million of one of the escrow funds has been released to reimburse the Company for costs incurred. Of the remaining $4.0 million escrow fund, $3.6 million was paid to the sellers and approximately $0.4 million was returned to the Company as a reduction of the purchase price. The acquired business has annual revenue of approximately $16.0 million. Precision Marketing’s results of operations are included in the Company’s consolidated results beginning July 1, 2008.
On November 9, 2007, the Company entered into an agreement with Automatic Research, Inc., to purchase certain assets collectively known as MKTG. MKTG is a traditional direct marketing operation that provides its customers with data processing, list sales and list management services. The acquisition extends offerings to markets with favorable growth that were not previously serviced by the Company. The Company paid $3.7 million for MKTG. There are no earnout agreements or other contingencies related to this acquisition. The operations of MKTG are included in the consolidated results beginning November 9, 2007. The annual revenues of MKTG are approximately $7.4 million.
On August 28, 2007, the Company acquired EchoTarget, Inc., an on-line behavioral targeting and ad-serving company based in New York. The Company paid $1.8 million net of cash acquired and executed a promissory note in the amount of $0.3 million which was paid March 31, 2008. The operations of EchoTarget are included in the consolidated results beginning September 1, 2007. The annual revenues of EchoTarget are less than $0.5 million.
On March 27, 2007, the Company acquired Kefta, Inc., a leader in real-time, dynamic personalization solutions for the Internet that was based in San Francisco, California. The acquisition bolsters the Company’s ability to integrate one-to-one personalized communications across digital channels. The Company paid $8.9 million, net of cash acquired, for Kefta not including amounts, if any, payable pursuant to the terms and conditions of two deferred payment agreements. The first was a deferred cash compensation agreement that required the Company to pay up to $1.5 million if three of Kefta’s key employees were retained by the Company for eight consecutive quarters following the acquisition. The second was an earnout agreement that allowed for payment of up to $1.5 million if the acquired business achieved certain revenue goals.During fiscal 2008 the Company paid $0.8 million under the earnout agreement, which was treated as additional purchase price. The Company also amended the deferred compensation arrangement and made a required payment of an additional $0.8 million during fiscal 2009. Payments under the original deferred compensation arrangement were treated partially as purchase price (57%) and partially as compensation expense (43%). Payments under the amended deferred compensation agreement were all treated as compensation expense. Kefta’s results of operations are included in the Company’s consolidated results beginning April 1, 2007. Kefta’s total annual revenue at acquisition was approximately $2.7 million.
On March 15, 2007, the Company purchased Harbinger Associates, LLC and its wholly owned subsidiary Harbinger Technologies, Inc. (“Harbinger”) from ICx Technologies, Inc. The Company paid $9.5 million in cash, net of cash acquired, and executed a promissory note for another $1.3 million to acquire Harbinger, all of which has since been paid. Harbinger’s results of operations are included in the Company’s consolidated results beginning March 15, 2007. During the year ended March 31, 2008, the Company shut down the operations of Harbinger and recorded charges of $9.5 million in gains, losses and other items for the write-off of goodwill and other intangible assets. The Company also accrued $1.1 million of exit costs, primarily lease accruals.
Seasonality and Inflation
Although the Company cannot accurately determine the amounts attributable to inflation, the Company is affected by inflation through increased costs of compensation and other operating expenses. If inflation were to increase over the low levels of recent years, the impact in the short run would be to cause increases in costs, which the Company would attempt to pass on to clients, although there is no assurance that it would be able to do so. Generally, the effects of inflation in recent years have been offset by technological advances, economies of scale and other operational efficiencies.
The Company’s traditional direct marketing operations experience their lowest revenue in the first quarter of the fiscal year, with higher revenue in the second, third, and fourth quarters. In order to minimize the impact of these fluctuations, the Company continues to seek long-term strategic partnerships with more predictable revenues. Revenue from clients who have long-term contracts with the Company (defined as two years or longer), as a percentage of consolidated revenue, was approximately 77% in fiscal 2010 compared to 75% in fiscal 2009 and 74% in fiscal 2008.
F-13
Non-U.S. Operations
The Company has a presence in the United Kingdom, France, the Netherlands, Germany, Portugal, Poland, the Middle East, Australia and China. Most of the Company’s exposure to exchange rate fluctuation is due to translation gains and losses as there are no material transactions that cause exchange rate impact. In general, each of the foreign locations is expected to fund its own operations and cash flows, although funds may be loaned or invested from the U.S. to the foreign subsidiaries subject to limitations in the Company’s revolving credit facility. These advances are considered to be long-term investments, and any gain or loss resulting from changes in exchange rates as well as gains or losses resulting from translating the foreign financial statements into U.S. dollars are included in accumulated other comprehensive income (loss). Exchange rate movements of foreign currencies may have an impact on the Company’s future costs or on future cash flows from foreign investments. The Company has not entered into any foreign currency forward exchange contracts or other derivative instruments to hedge the effects of adverse fluctuations in foreign currency exchange rates.
Critical Accounting Policies
We prepare our consolidated financial statements in conformity with accounting principles generally accepted in the United States of America. These accounting principles require management to make certain judgments and assumptions that affect the reported amounts of assets and liabilities and the disclosure of contingent assets and liabilities as of the date of the financial statements and the reported amounts of revenues and expenses during the reporting periods. Note 1 to the accompanying consolidated financial statements includes a summary of significant accounting policies used in the preparation of Acxiom’s consolidated financial statements. Of those policies, we have identified the following as the most critical because they require management’s use of complex and/or significant judgments:
Revenue Recognition – The Company provides database management and IT management services under long-term arrangements. These arrangements may require the Company to perform setup activities such as the design and build of a database for the customer under the database management contracts and migration of the customer’s IT environment under IT management contracts. In the case of database management contracts, the customer does not acquire any ownership rights to the Company’s intellectual property used in the database and the database itself provides no benefit to the customer outside of the utilization of the system during the term of the database management arrangement. In some cases, the arrangements also contain provisions requiring customer acceptance of the setup activities prior to commencement of the ongoing services arrangement. Up-front fees billed during the setup phase for these arrangements are deferred and setup costs that are direct and incremental to the contract are capitalized and amortized on a straight-line basis over the service term of the contract. Revenue recognition does not begin until after customer acceptance in cases where contracts contain acceptance provisions. Once the setup phase is complete and customer acceptance occurs, the Company recognizes revenue over the remaining service term of the contract. In situations where the arrangement does not require customer acceptance before the Company begins providing services, revenue is recognized over the contract period and no costs are deferred.
The Company accounts for revenue arrangements with multiple elements in accordance with applicable accounting standards which provides guidance on (a) how arrangement consideration should be measured, (b) whether the arrangement should be divided into separate units of accounting, and (c) how the arrangement consideration should be allocated among the separate units of accounting. The Emerging Issues Task Force of the FASB has issued additional guidance on accounting for revenue arrangements with multiple elements, which the Company is required to implement effective April 1, 2011. The Company does not currently expect implementation of the amended guidance to have a material effect on revenue recognition.
The Company currently accounts for all elements under its database management and IT management arrangements as a single unit, since the initial setup activities performed under the arrangements may not have stand-alone value to the client and under the current accounting standards the Company is unable to determine the relative fair values of the delivered elements and the undelivered elements. Therefore, when third party software, hardware and certain other equipment are sold along with services, the Company records such sales over the related service period. Additionally, the Company evaluates revenue from the sale of data, software, hardware and equipment to determine whether such revenue should be recognized on a gross or a net basis over the term of the related service agreement. All of the factors in the accounting standards are considered with the primary factor being whether the Company is the primary obligor in the arrangement. Out-of-pocket expenses incurred by, and reimbursed to, the Company in connection with customer contracts are recorded as gross revenue.
The Company evaluates its database management and IT management arrangements to determine whether the arrangement contains a lease. If the arrangement is determined to contain a lease, applicable accounting standards require the Company to account for the lease component separately from the remaining components of the arrangement. In cases where database management or IT management arrangements are determined to include a lease,
F-14
the lease is evaluated to determine whether it is a capital lease or operating lease and accounted for accordingly. The lease revenues are not significant to the Company’s financial statements.
All taxes assessed on revenue-producing transactions described above are presented on a net basis, or excluded from revenues.
The Company also performs services on a project basis outside of, or in addition to, the scope of long-term arrangements. The Company recognizes revenue from these services as the services are performed.
Revenues from the licensing of data are recognized upon delivery of the data to the customer in circumstances where no update or other obligations exist. Revenue from the licensing of data in which the Company is obligated to provide future updates on a monthly, quarterly or annual basis is recognized on a straight-line basis over the license term. Revenue from the licensing of data to the customer in circumstances where the license agreement contains a volume cap is recognized in proportion to the total records to be delivered under the arrangement.
Included in the Company’s consolidated balance sheets are deferred revenues resulting from billings and/or client payments in advance of revenue recognition. Deferred revenue at March 31, 2010 was $55.6 million compared to $55.0 million at March 31, 2009.
Accounts receivable include amounts billed to clients as well as unbilled amounts recognized in accordance with the Company’s revenue recognition policies. Unbilled amounts included in accounts receivable were $19.8 million and $22.7 million, respectively, at March 31, 2010 and 2009.
The Company does not provide end-users with price-protection or rights of return. The Company’s contracts provide a warranty that the services or products will meet the agreed-upon criteria or any necessary modifications will be made. The Company ensures that services or products delivered meet the agreed-upon criteria prior to recognition of revenue.
Software, Purchased Software Licenses, and Research and Development Costs – The Company capitalizes software development costs under accounting standards regarding the costs of computer software to be sold, leased or otherwise marketed or the costs of computer software developed or obtained for internal use. Although there are differences in the two accounting standards, depending on whether a product is intended for internal use or to be provided to customers, both accounting standards generally require that research and development costs incurred prior to establishing technological feasibility or the beginning of the application development stage of software products are charged to operations as incurred. Costs of internally developed software, upon its general release, are amortized on a straight-line basis over the estimated economic life of the product, generally two to five years, or the amortization that would be recorded by using the ratio of gross revenues for a product to total current and anticipated future gross revenues for that product, whichever is greater. The Company recorded amortization expense and impairment charges related to internally developed computer software of $23.6 million in fiscal 2010, $21.1 million in fiscal 2009 and $19.3 million in fiscal 2008. Additionally, research and development costs associated with internally developed software incurred prior to becoming eligible for capitalization or other research activities of $6.8 million in fiscal 2010, $19.4 million in fiscal 2009 and $19.8 million in fiscal 2008 were charged to operations during those years.
Purchased software licenses include both prepaid software and capitalized future software obligations for which the liability is included in long-term debt. Costs of purchased software licenses are amortized using a units-of-production basis over the estimated economic life of the license, generally not to exceed ten years. The Company recorded amortization of purchased software licenses of $14.5 million in fiscal 2010, $27.2 million in fiscal 2009 and $35.9 million in fiscal 2008. Some of these purchased software licenses are, in effect, volume purchase agreements for software licenses needed for internal use and to provide services to customers over the terms of the agreements. Therefore, amortization lives are periodically reevaluated and, if necessary, adjusted to reflect current and future expected usage based on units-of-production amortization. Factors considered in estimating remaining useful life include, but are not limited to, contract provisions of the underlying licenses, introduction of new mainframe hardware which is compatible with previous generation software, predictions of continuing viability of mainframe architecture, and customers’ continuing commitments to utilize mainframe architecture and the software under contract. While the Company believes current license lives are appropriate and material changes in amortization periods are not anticipated, changes in relevant factors cannot be predicted.

F-15
Capitalized software, including both purchased and internally developed, is reviewed each period and, if necessary, the Company reduces the carrying value of each product to its net realizable value. In performing the net realizable value evaluation of capitalized software, the Company’s projection of potential future cash flows from future gross revenues by product, reduced by the costs of completing and disposing of that product are compared to the carrying value of each product. A write-down of the carrying amount of a product is made to the extent that the carrying value of a product exceeds its net realizable value. During fiscal 2008, the Company recorded software impairment charges of $5.2 million. No software impairment charges were recorded during fiscal 2009 or 2010. At March 31, 2010, the Company’s most recent impairment analysis of its purchased and internally developed software indicates that no further impairment exists. However, no assurance can be given that future analysis of the Company’s capitalized software will not result in an impairment charge. Additionally, should future projected revenues not materialize and/or the cost of completing and disposing of software products significantly exceed the Company’s estimates, further write-downs of purchased or internally developed software might be required up to and including the total carrying value of such software ($90.2 million at March 31, 2010).
Valuation of Long-Lived Assets– Long-lived assets and certain identifiable intangibles are reviewed for impairment whenever events or changes in circumstances indicate that the carrying amount of an asset may not be recoverable. Recoverability of assets to be held and used is measured by a comparison of the carrying amount of an asset to the undiscounted cash flows expected to result from the use and eventual disposition of the asset. In cases where cash flows cannot be associated with individual assets, assets are grouped together in order to associate cash flows with the asset group. If such assets or asset groups are considered to be impaired, the impairment to be recognized is measured by the amount by which the carrying amount of the assets exceeds the fair value of the assets. Assets to be disposed of are reported at the lower of the carrying amount or fair value less costs to sell. During fiscal 2008 the Company recorded impairment charges for long-lived assets associated with restructuring activities of $29.6 million, included in gains, losses and other items. In addition the Company recorded $43.6 million of asset impairment charges in cost of operations related to impaired capitalized contract costs. (See note 2 to the consolidated financial statements.) No long-lived asset impairment charges were recorded during fiscal 2009 or 2010. At March 31, 2010, the Company believes that no further impairment exists with respect to its long-lived assets. However, no assurance can be given by management of the Company that future impairment charges to its long-lived assets will not be required as a result of changes in events and/or circumstances.
Valuation of Goodwill– Goodwill represents the excess of acquisition costs over the fair value of net assets acquired in business combinations. Under the provisions of applicable accounting standards goodwill is not amortized, but is reviewed at least annually for impairment under a two-part test. In the event that part one of the impairment test indicates potential impairment of goodwill, performance of part two of the impairment test is required. Any impairment that results from the completion of the two-part test is recorded as a charge to operations during the period in which the impairment test is completed.
The Company completed part one of its annual goodwill impairment test during the quarter ended June 30, 2009 and determined that no impairment of its goodwill existed as of the date of that test. Accordingly, step two of the goodwill impairment test was not required.
Goodwill is tested for impairment at the reporting unit level, which is defined as either an operating segment or one step below operating segment, known as a component. Acxiom’s two segments are the Information Services segment and the Information Products segment. Because each of these segments contains both a US component and an International component, and there are some differences in economic characteristics between the US and International components, management has tested a total of four components. The goodwill amounts as of April 1, 2009 included in each component tested were US Information Services, $300.8 million; US Information Products, $51.2 million; International Information Services, $35.6 million; and International Information Products $67.3 million.
In order to estimate a valuation for each of the four components tested, management used an income approach based on a discounted cash flow model. Additionally, the analysis was enhanced to include a public company market multiple and a similar transactions comparison.
F-16
The income approach involves projecting cash flows for each component into the future and discounting these cash flows at an appropriate discount rate. Management used preliminary budget figures for the first year of the projection model, then projected those figures out into the future years using management’s best estimates of future revenue growth, operating margins, and other cash flow assumptions. The discount rates used for each component in order to arrive at an estimated fair value were estimated as a weighted-average cost of capital which a marketplace participant would use to value each unit. These weighted-average costs of capital rates include a market risk, added to a risk-free rate of return, and a size premium that is specific to the components being tested. The resulting cost of equity is then weighted-averaged with the after-tax cost of debt.
The public company market multiple method was used to estimate values for each of the components by looking at market value multiples to revenue and EBITDA for selected public companies that are believed to be representative of companies that marketplace participants would use to arrive at comparable multiples for the individual component being tested. These multiples are then used to develop a market value for that component.
The similar transactions method compared multiples based on acquisition prices of other companies believed to be those that marketplace participants would use to compare to the individual components being tested. Those multiples are then used to develop a market value for that component.
In order to arrive at an estimated value for each component, management used a weighted-average approach to combine the results of each analysis. Management believes that using multiple valuation approaches and then weighting them appropriately is a technique that a marketplace participant would use.
As a final test of the valuation results, the total of the values of the components was reconciled to the actual market value of Acxiom Corporation stock as of the April 1, 2009 valuation date. This reconciliation indicated an implied control premium. Management believes this control premium is reasonable compared to historical control premiums observed in actual transactions.
Each of the components tested had fair values in excess of the carrying value of the unit, indicating no impairment. All of the components had a significant excess fair value, except for the International Products component, for which the excess fair value was 15%. Management believes that the valuations arrived at are reasonable and consistent with what other marketplace participants would use in valuing the Company’s components. However, management cannot give any assurance that market values will not change in the future. For example, if discount rates demanded by the market increase, this could lead to a reduction under the income approach. If the Company’s projections are not achieved in the future, this could lead management to reassess their assumptions and lead to a reduction under the income approach. If the market price of the Company’s stock decreases, this could cause the Company to reassess the reasonableness of the control premium, which might cause management to assume a higher discount rate under the income approach. If future similar transactions exhibit lower multiples than those observed in the past, this could lead to a reduction under the similar transactions approach. And finally, if there is a general decline in the stock market, and particularly in those companies selected as comparable to the Company’s components, this could lead to a reduction under the public company market multiple approach. The Company’s annual impairment test is performed during the first quarter of each fiscal year, however if there are further triggering events, the Company may be required to perform additional testing at other dates.
Deferred Costs and Data Acquisition Costs – The Company defers certain costs, primarily salaries and benefits and other direct and incremental third party costs, in connection with client contracts and various other contracts and arrangements. Direct and incremental costs incurred during the setup phase under client contracts for database management or for infrastructure management arrangements are deferred until such time as the database or the IT services are operational and revenue recognition begins. These costs are directly related to the individual client, are to be used specifically for the individual client and have no other use or future benefit. In addition, revenue recognition of billings, if any, related to these setup activities are deferred during the setup phase under client contracts. All costs and billings deferred are then amortized as contract revenue recognition occurs, generally ratably over the remaining term of the arrangement. During the period when costs are being deferred, the Company performs a net realizable value review on a quarterly basis to ensure that the deferred costs are recoverable through either 1) recognition of previously deferred revenue, 2) future minimum contractual billings or 3) billings in excess of contractual minimum billings that can be reasonably estimated and are deemed likely to occur. Once revenue recognition begins, these deferred costs are assessed for impairment when events or changes in circumstances indicate the carrying value may not be recoverable. Some contracts contain provisions allowing the customer to request reductions in pricing if they can demonstrate that the Company charges lower prices for similar services to other customers, or if the prices charged are higher than certain benchmarks. If pricing is renegotiated, deferred costs are assessed for impairment.
F-17
The test of recoverability is performed by comparing the carrying value of the asset to its undiscounted expected future cash flows. If such review indicates that the carrying amount of an asset exceeds the sum of its expected future cash flows, the asset’s carrying amount is written down to its estimated fair value. Fair value is determined by an internally developed discounted projected cash flow analysis of the asset. Due to a renegotiation of contracts with three different infrastructure management customers during fiscal 2008, the Company performed a test for potential impairment of the related capitalized costs. The Company determined that the future cash flows relating to these renegotiated contracts would not be sufficient to recover the costs that were capitalized. Based on these analyses, the Company recorded write-downs relating to the capitalized costs of these contracts. The combined $43.6 million charge is recorded in cost of operations in the accompanying condensed consolidated statement of operations and in the Services segment for segment disclosures. The charge included $46.0 million in deferred costs, $0.1 million in property and equipment, $2.5 million in other assets and an accrual of $4.0 million, offset by $8.9 million in deferred revenue.
In addition to client contract costs, the Company defers direct and incremental costs incurred in connection with obtaining other contracts, including debt facilities, lease facilities, and various other arrangements. Costs deferred in connection with obtaining scheduled debt facilities are amortized over the term of the arrangement using the interest method. Costs deferred in connection with lease facilities or revolving credit facilities are amortized over the term of the arrangement on a straight-line basis.
The Company also defers costs related to the acquisition or licensing of data for the Company’s proprietary databases which are used in providing data products and services to customers. These costs are amortized over the useful life of the data, which is from two to seven years. In order to estimate the useful life of any acquired data, the Company considers several factors including 1) the type of data acquired, 2) whether the data becomes stale over time, 3) to what extent the data will be replaced by updated data over time, 4) whether the “stale” data continues to have value as historical data, 5) whether a license places restrictions on the use of the data, and 6) the term of the license.
Restructuring – The Company records costs associated with employee terminations and other exit activity in accordance with applicable accounting standards, depending on whether the costs relate to exit or disposal activities under the accounting standards, or whether they are other postemployment termination benefits. Under applicable accounting standards related to exit or disposal costs, the Company records employee termination benefits as an operating expense when the benefit arrangement is communicated to the employee and no significant future services are required. Under the accounting standards related to postemployment termination benefits, the Company records employee termination benefits when the termination benefits are probable and can be estimated. The Company recognizes the present value of facility lease termination obligations, net of estimated sublease income and other exit costs, when the Company has future payments with no future economic benefit or a commitment to pay the termination costs of a prior commitment. In future periods the Company will record accretion expense to increase the liability to an amount equal to the estimated future cash payments necessary to exit the leases. This requires a significant amount of judgment and management estimation in order to determine the expected time frame it will take to secure a subtenant, the amount of sublease income to be received and the appropriate discount rate to calculate the present value of the future cash flows. Should actual lease exit costs differ from estimates, the Company may be required to adjust the restructuring charge which would impact net income in the period any adjustment was recorded.
New Accounting Pronouncements
In December 2007, the FASB issued Statement of Financial Accounting Standards No. 141(R), “Business Combinations,” (“SFAS 141R”), which replaces SFAS 141. SFAS 141R has subsequently been codified in the FASB Accounting Standards Codification Topic 805 (“ASC 805”). ASC 805 requires most assets acquired and liabilities assumed in a business combination, contingent consideration, and certain acquired contingencies to be measured at their fair values as of the date of acquisition. The new standard also requires that acquisition-related costs and restructuring costs be recognized separately from the business combination. The new standard was adopted by the Company as of April 1, 2009 and is effective prospectively for business combinations entered into after that date.
In December 2007, the FASB issued Statement of Financial Accounting Standards No. 160, “Noncontrolling Interest in Consolidated Financial Statements,” (“SFAS 160”). SFAS 160 has subsequently been codified in the FASB Accounting Standards Codification Topic 810 (“ASC 810”). The new standard amends previous accounting standards to establish new accounting and reporting standards for the noncontrolling interest in a subsidiary and for the deconsolidation of a subsidiary. The new standard was adopted by the Company as of April 1, 2009. As a result of adoption of this standard, the Company classifies noncontrolling interests as a component of equity and the results of operations attributable to noncontrolling interests is reported as a part of net earnings.
The FASB’s Emerging Issues Task Force has issued new accounting guidance for revenue arrangements with multiple deliverables. Under current accounting guidance, one of the requirements for recognition of revenue for a delivered item

F-18
under a multiple element arrangement is that there must be objective and verifiable evidence of the standalone selling price of the undelivered item. The new guidance eliminates that requirement and requires an entity to estimate the selling price of each element in the arrangement. The result will likely be that more arrangements will be separated into multiple elements of accounting than was previously the case.
The new guidance is effective for the Company as of April 1, 2011 and must be applied prospectively to new arrangements entered into beginning on that date. Early adoption is permitted as of the beginning of a fiscal year. If the new guidance isadopted early in a period other than the first period of the fiscal year, the guidance must be adopted retrospectively to the beginning of the fiscal year of adoption. Retrospective application to prior years is allowed, but not required. In the initialyear of application, certain qualitative and quantitative disclosures about the impact of the adoption are required.Management has not completed its analysis of the impact of the new standard, but currently does not expect the impact of the new guidance to be material to the financial statements.
F-19
Management’s Report on Internal Control Over Financial Reporting
The management of Acxiom Corporation (the Company) is responsible for establishing and maintaining adequate internal control over financial reporting.
The Company’s internal control over financial reporting is a process designed to provide reasonable assurance regarding the reliability of financial reporting and the preparation of financial statements for external purposes in accordance with generally accepted accounting principles, and includes those policies and procedures that:
Pertain to the maintenance of records that, in reasonable detail, accurately and fairly reflect the transactions and dispositions of the assets of the Company;
Provide reasonable assurance that transactions are recorded as necessary to permit preparation of financial statements in accordance with generally accepted accounting principles, and that receipts and expenditures of the Company are being made only in accordance with authorizations of management and directors of the Company; and
Provide reasonable assurance regarding prevention or timely detection of unauthorized acquisition, use or disposition of the Company’s assets that could have a material effect on the financial statements.
Because of its inherent limitations, internal control over financial reporting may not prevent or detect misstatements. Also, projections of any evaluations of effectiveness to future periods are subject to the risk that controls may become inadequate because of changes in conditions, or that the degree of compliance with the policies or procedures may deteriorate.
The Company’s management assessed the effectiveness of the Company’s internal control over financial reporting as of March 31, 2010. In making this assessment, the Company’s management used the criteria set forth by the Committee of Sponsoring Organizations of the Treadway Commission (COSO) in Internal Control-Integrated Framework.
Based on management’s assessment and those criteria, the Company’s management determined that the Company’s internal control over financial reporting was effective as of March 31, 2010.
KPMG LLP, the Company’s independent registered public accounting firm that audited the financial statements included in this annual report, has issued an attestation report, appearing on the following page, regarding its assessment of the Company’s internal control over financial reporting as of March 31, 2010.
F-20
Report of Independent Registered Public Accounting Firm
The Board of Directors and Stockholders Acxiom Corporation:
We have audited the accompanying consolidated balance sheets of Acxiom Corporation and subsidiaries (the Company) as of March 31, 2010 and 2009, and the related consolidated statements of operations, equity and comprehensive income (loss), and cash flows for each of the years in the three-year period ended March 31, 2010. These consolidated financial statements are the responsibility of the Company’s management. Our responsibility is to express an opinion on these consolidated financial statements based on our audits.
We conducted our audits in accordance with the standards of the Public Company Accounting Oversight Board (United States). Those standards require that we plan and perform the audit to obtain reasonable assurance about whether the financial statements are free of material misstatement. An audit includes examining, on a test basis, evidence supporting the amounts and disclosures in the financial statements. An audit also includes assessing the accounting principles used and significant estimates made by management, as well as evaluating the overall financial statement presentation. We believe that our audits provide a reasonable basis for our opinion.
In our opinion, the consolidated financial statements referred to above present fairly, in all material respects, the financial position of Acxiom Corporation and subsidiaries as of March 31, 2010 and 2009, and the results of their operations and their cash flows for each of the years in the three-year period ended March 31, 2010, in conformity with U.S. generally accepted accounting principles.
We also have audited, in accordance with the standards of the Public Company Accounting Oversight Board (United States), Acxiom Corporation’s internal control over financial reporting as of March 31, 2010, based on criteria established in Internal Control – Integrated Framework issued by the Committee of Sponsoring Organizations of the Treadway Commission (COSO), and our report dated May 26, 2010 expressed an unqualified opinion on the effectiveness of the Company’s internal control over financial reporting.
As discussed in note 1 to the consolidated financial statements, the Company has changed their method of accounting for noncontrolling interests as of April 1, 2009 due to the adoption of FASB Statement No. 160, Noncontrolling Interests in Consolidated Financial Statements (included in FASB ASC Topic 810, Consolidation). In addition, as discussed in note 1 to the consolidated financial statements, the Company changed its method of accounting for business combinations as of April 1, 2009 due to the adoption of FASB Statement No. 141R, Business Combinations (included in FASB ASC Topic 805, Business Combinations).
KPMG LLP
Dallas, Texas May 26, 2010
F-21
Report of Independent Registered Public Accounting Firm
The Board of Directors and Stockholders Acxiom Corporation:
We have audited Acxiom Corporation’s (the Company) internal control over financial reporting as of March 31, 2010, based on criteria established in Internal Control – Integrated Framework issued by the Committee of Sponsoring Organizations of the Treadway Commission (COSO). Acxiom Corporation’s management is responsible for maintaining effective internal control over financial reporting and for its assessment of the effectiveness of internal control over financial reporting, included in the accompanying Management’s Report on Internal Control over Financial Reporting. Our responsibility is to express an opinion on the Company’s internal control over financial reporting based on our audit.
We conducted our audit in accordance with the standards of the Public Company Accounting Oversight Board (United States). Those standards require that we plan and perform the audit to obtain reasonable assurance about whether effective internal control over financial reporting was maintained in all material respects. Our audit included obtaining an understanding of internal control over financial reporting, assessing the risk that a material weakness exists, and testing and evaluating the design and operating effectiveness of internal control based on the assessed risk. Our audit also included performing such other procedures as we considered necessary in the circumstances. We believe that our audit provides a reasonable basis for our opinion.
A company’s internal control over financial reporting is a process designed to provide reasonable assurance regarding the reliability of financial reporting and the preparation of financial statements for external purposes in accordance with generally accepted accounting principles. A company’s internal control over financial reporting includes those policies and procedures that (1) pertain to the maintenance of records that, in reasonable detail, accurately and fairly reflect the transactions and dispositions of the assets of the company; (2) provide reasonable assurance that transactions are recorded as necessary to permit preparation of financial statements in accordance with generally accepted accounting principles, and that receipts and expenditures of the company are being made only in accordance with authorizations of management and directors of the company; and (3) provide reasonable assurance regarding prevention or timely detection of unauthorized acquisition, use, or disposition of the company’s assets that could have a material effect on the financial statements.
Because of its inherent limitations, internal control over financial reporting may not prevent or detect misstatements. Also, projections of any evaluation of effectiveness to future periods are subject to the risk that controls may become inadequate because of changes in conditions, or that the degree of compliance with the policies or procedures may deteriorate.
In our opinion, Acxiom Corporation maintained, in all material respects, effective internal control over financial reporting as of March 31, 2010, based on criteria established in Internal Control – Integrated Framework issued by the Committee of Sponsoring Organizations of the Treadway Commission.
We also have audited, in accordance with the standards of the Public Company Accounting Oversight Board (United States), the consolidated balance sheets of Acxiom Corporation and subsidiaries as of March 31, 2010 and 2009, and the related consolidated statements of operations, equity and comprehensive income (loss), and cash flows for each of the years in the three-year period ended March 31, 2010, and our report dated May 26, 2010 expressed an unqualified opinion on those consolidated financial statements.
KPMG LLP
Dallas, Texas May 26, 2010
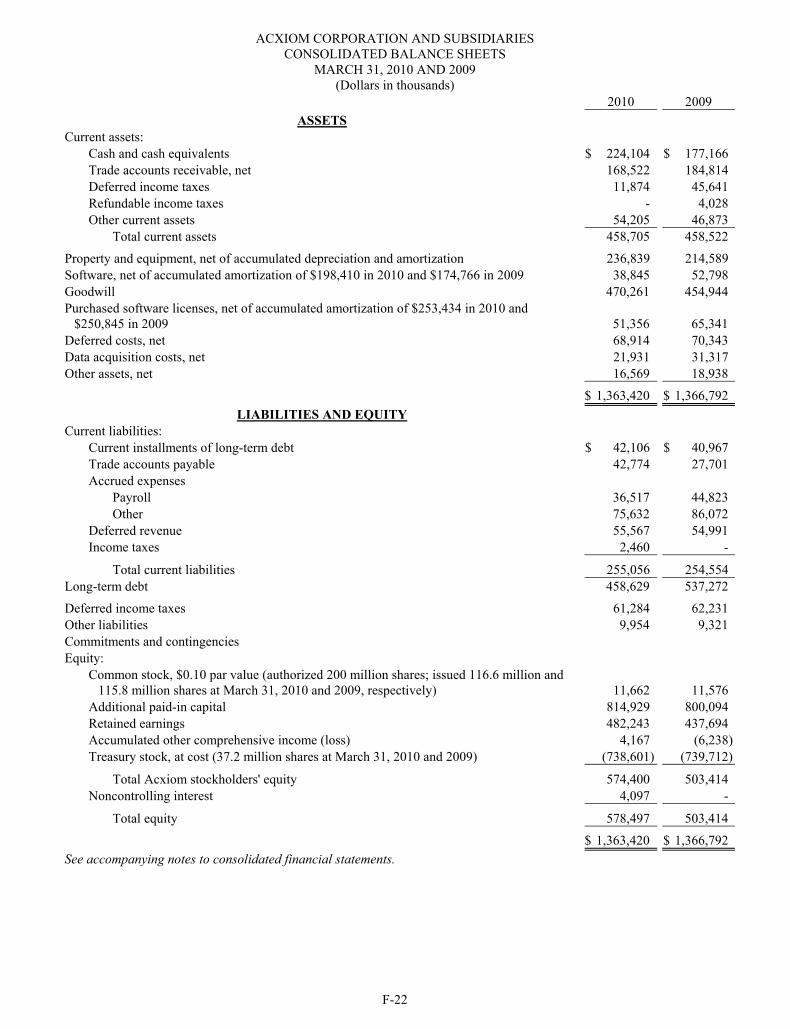
F-22
ACXIOM CORPORATION AND SUBSIDIARIES CONSOLIDATED BALANCE SHEETS
MARCH 31, 2010 AND 2009 (Dollars in thousands)
2010 2009 ASSETS
Current assets: Cash and cash equivalents $ 224,104 $ 177,166Trade accounts receivable, net 168,522 184,814Deferred income taxes 11,874 45,641Refundable income taxes - 4,028Other current assets 54,205 46,873
Total current assets 458,705 458,522
Property and equipment, net of accumulated depreciation and amortization 236,839 214,589Software, net of accumulated amortization of $198,410 in 2010 and $174,766 in 2009 38,845 52,798Goodwill 470,261 454,944Purchased software licenses, net of accumulated amortization of $253,434 in 2010 and
$250,845 in 2009 51,356 65,341Deferred costs, net 68,914 70,343Data acquisition costs, net 21,931 31,317Other assets, net 16,569 18,938
$ 1,363,420 $ 1,366,792LIABILITIES AND EQUITY
Current liabilities: Current installments of long-term debt $ 42,106 $ 40,967Trade accounts payable 42,774 27,701Accrued expenses
Payroll 36,517 44,823Other 75,632 86,072
Deferred revenue 55,567 54,991Income taxes 2,460 -
Total current liabilities 255,056 254,554Long-term debt 458,629 537,272
Deferred income taxes 61,284 62,231Other liabilities 9,954 9,321Commitments and contingencies Equity:
Common stock, $0.10 par value (authorized 200 million shares; issued 116.6 million and 115.8 million shares at March 31, 2010 and 2009, respectively) 11,662 11,576
Additional paid-in capital 814,929 800,094Retained earnings 482,243 437,694Accumulated other comprehensive income (loss) 4,167 (6,238)Treasury stock, at cost (37.2 million shares at March 31, 2010 and 2009) (738,601) (739,712)
Total Acxiom stockholders' equity 574,400 503,414Noncontrolling interest 4,097 -
Total equity 578,497 503,414
$ 1,363,420 $ 1,366,792See accompanying notes to consolidated financial statements.
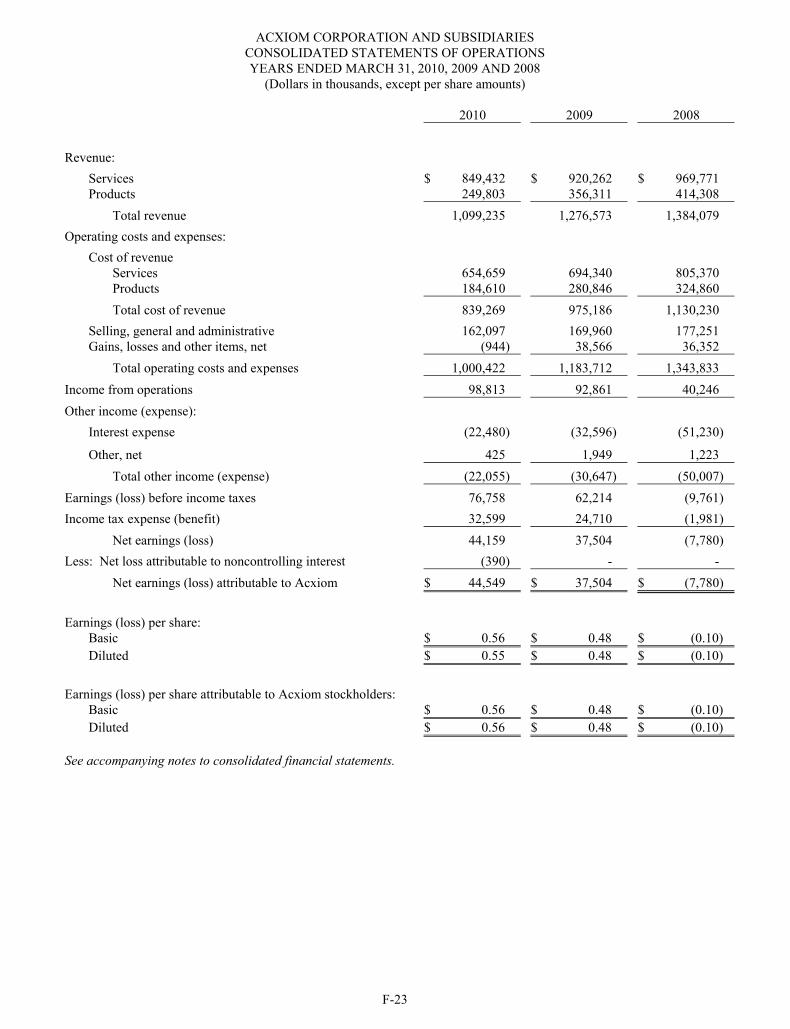
F-23
ACXIOM CORPORATION AND SUBSIDIARIES CONSOLIDATED STATEMENTS OF OPERATIONS YEARS ENDED MARCH 31, 2010, 2009 AND 2008
(Dollars in thousands, except per share amounts)
2010 2009 2008
Revenue: Services $ 849,432 $ 920,262 $ 969,771 Products 249,803 356,311 414,308
Total revenue 1,099,235 1,276,573 1,384,079 Operating costs and expenses:
Cost of revenue Services 654,659 694,340 805,370 Products 184,610 280,846 324,860 Total cost of revenue 839,269 975,186 1,130,230
Selling, general and administrative 162,097 169,960 177,251 Gains, losses and other items, net (944) 38,566 36,352
Total operating costs and expenses 1,000,422 1,183,712 1,343,833 Income from operations 98,813 92,861 40,246 Other income (expense):
Interest expense (22,480) (32,596) (51,230)
Other, net 425 1,949 1,223 Total other income (expense) (22,055) (30,647) (50,007)
Earnings (loss) before income taxes 76,758 62,214 (9,761) Income tax expense (benefit) 32,599 24,710 (1,981)
Net earnings (loss) 44,159 37,504 (7,780) Less: Net loss attributable to noncontrolling interest (390) - -
Net earnings (loss) attributable to Acxiom $ 44,549 $ 37,504 $ (7,780) Earnings (loss) per share:
Basic $ 0.56 $ 0.48 $ (0.10) Diluted $ 0.55 $ 0.48 $ (0.10)
Earnings (loss) per share attributable to Acxiom stockholders:
Basic $ 0.56 $ 0.48 $ (0.10) Diluted $ 0.56 $ 0.48 $ (0.10)
See accompanying notes to consolidated financial statements.
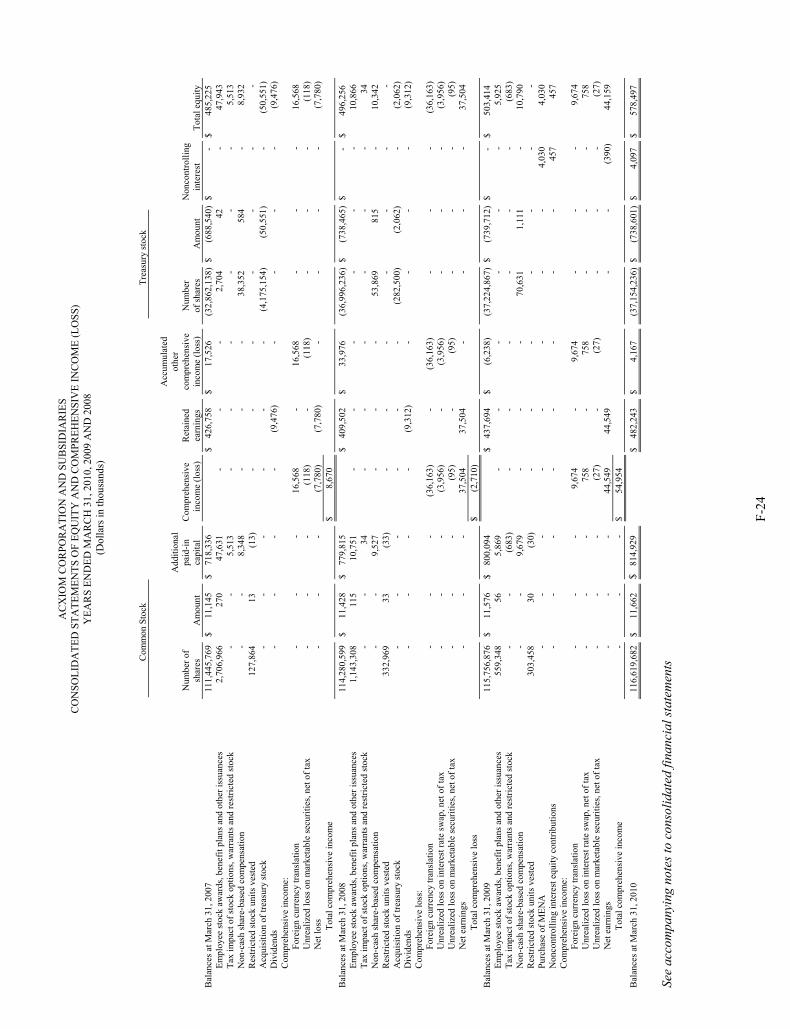
F-24
AC
XIO
M C
OR
POR
ATI
ON
AN
D S
UB
SID
IAR
IES
CO
NSO
LID
ATE
D S
TATE
MEN
TS O
F EQ
UIT
Y A
ND
CO
MPR
EHEN
SIV
E IN
CO
ME
(LO
SS)
YEA
RS
END
ED M
AR
CH
31,
201
0, 2
009
AN
D 2
008
(Dol
lars
in th
ousa
nds)
Num
ber o
f sh
ares
A
mou
nt
Add
ition
al
paid
-inca
pita
lC
ompr
ehen
sive
in
com
e (lo
ss)
Ret
aine
d ea
rnin
gs
Acc
umul
ated
ot
her
com
preh
ensi
ve
inco
me
(loss
) N
umbe
r of
shar
es
Am
ount
N
onco
ntro
lling
inte
rest
To
tal e
quity
B
alan
ces a
t Mar
ch 3
1, 2
007
111,
445,
769
$
11,1
45
$ 7
18,3
36
$
426
,758
$
17
,526
(3
2,86
2,13
8)$
(6
88,5
40)
$
- $
48
5,22
5 Em
ploy
ee st
ock
awar
ds, b
enef
it pl
ans a
nd o
ther
issu
ance
s 2,
706,
966
270
47,6
31
- -
-
2,70
442
- 47
,943
Ta
x im
pact
of s
tock
opt
ions
, war
rant
s and
rest
ricte
d st
ock
--
5,51
3 -
-
- -
--
5,51
3 N
on-c
ash
shar
e-ba
sed
com
pens
atio
n -
- 8,
348
- -
-
38,3
5258
4-
8,93
2 R
estri
cted
stoc
k un
its v
este
d 12
7,86
413
(1
3)
- -
-
--
- -
Acq
uisi
tion
of tr
easu
ry st
ock
--
- -
-
- (4
,175
,154
)(5
0,55
1)-
(50,
551)
Div
iden
ds
--
- -
(9,4
76)
-
--
- (9
,476
)C
ompr
ehen
sive
inco
me:
Fo
reig
n cu
rren
cy tr
ansl
atio
n -
- -
16,5
68
-
16,5
68
--
- 16
,568
U
nrea
lized
loss
on
mar
keta
ble
secu
ritie
s, ne
t of t
ax
--
- (1
18)
-
(118
) -
--
(118
)N
et lo
ss
--
- (7
,780
) (7
,780
)
- -
--
(7,7
80)
Tota
l com
preh
ensi
ve in
com
e
$
8,
670
B
alan
ces a
t Mar
ch 3
1, 2
008
114,
280,
599
$
11,4
28
$ 7
79,8
15
$
409
,502
$
33
,976
(3
6,99
6,23
6)$
(7
38,4
65)
$
- $
49
6,25
6 Em
ploy
ee st
ock
awar
ds, b
enef
it pl
ans a
nd o
ther
issu
ance
s 1,
143,
308
115
10,7
51
- -
-
--
- 10
,866
Ta
x im
pact
of s
tock
opt
ions
, war
rant
s and
rest
ricte
d st
ock
--
34
- -
-
--
- 34
N
on-c
ash
shar
e-ba
sed
com
pens
atio
n -
- 9,
527
- -
-
53,8
6981
5-
10,3
42
Res
trict
ed st
ock
units
ves
ted
332,
969
33
(33)
-
-
- -
--
- A
cqui
sitio
n of
trea
sury
stoc
k -
- -
- -
-
(282
,500
)(2
,062
)-
(2,0
62)
Div
iden
ds
--
- -
(9,3
12)
-
--
- (9
,312
)C
ompr
ehen
sive
loss
:
Fo
reig
n cu
rren
cy tr
ansl
atio
n -
- -
(36,
163)
-
(3
6,16
3)
--
- (3
6,16
3)U
nrea
lized
loss
on
inte
rest
rate
swap
, net
of t
ax
--
- (3
,956
) -
(3
,956
) -
--
(3,9
56)
Unr
ealiz
ed lo
ss o
n m
arke
tabl
e se
curit
ies,
net o
f tax
-
- -
(95)
-
(9
5)
--
- (9
5)N
et e
arni
ngs
--
- 37
,504
37
,504
- -
--
37,5
04
Tota
l com
preh
ensi
ve lo
ss
$
(2,7
10)
B
alan
ces a
t Mar
ch 3
1, 2
009
115,
756,
876
$
11,5
76
$ 8
00,0
94
$
437
,694
$
(6
,238
) (3
7,22
4,86
7)$
(7
39,7
12)
$
- $
50
3,41
4 Em
ploy
ee st
ock
awar
ds, b
enef
it pl
ans a
nd o
ther
issu
ance
s 55
9,34
856
5,
869
- -
-
--
- 5,
925
Tax
impa
ct o
f sto
ck o
ptio
ns, w
arra
nts a
nd re
stric
ted
stoc
k -
- (6
83)
- -
-
--
- (6
83)
Non
-cas
h sh
are-
base
d co
mpe
nsat
ion
--
9,67
9 -
-
- 70
,631
1,11
1-
10,7
90
Res
trict
ed st
ock
units
ves
ted
303,
458
30
(30)
-
-
- -
--
- Pu
rcha
se o
f MEN
A
--
- -
-
- -
-4,
030
4,03
0 N
onco
ntro
lling
inte
rest
equ
ity c
ontri
butio
ns
--
- -
-
- -
-45
7 45
7 C
ompr
ehen
sive
inco
me:
Fo
reig
n cu
rren
cy tr
ansl
atio
n -
- -
9,67
4 -
9,
674
--
- 9,
674
Unr
ealiz
ed lo
ss o
n in
tere
st ra
te sw
ap, n
et o
f tax
-
- -
758
-
758
--
- 75
8 U
nrea
lized
loss
on
mar
keta
ble
secu
ritie
s, ne
t of t
ax
--
- (2
7)
-
(27)
-
--
(27)
Net
ear
ning
s -
- -
44,5
49
44,5
49
--
(390
)44
,159
To
tal c
ompr
ehen
sive
inco
me
--
- $
54
,954
Bal
ance
s at M
arch
31,
201
011
6,61
9,68
2$
11
,662
$
814
,929
$ 4
82,2
43
$
4,16
7 (3
7,15
4,23
6)$
(7
38,6
01)
$
4,09
7 $
57
8,49
7
See
acco
mpa
nyin
g no
tes t
o co
nsol
idat
ed fi
nanc
ial s
tate
men
ts
Com
mon
Sto
ck
Tr
easu
ry st
ock
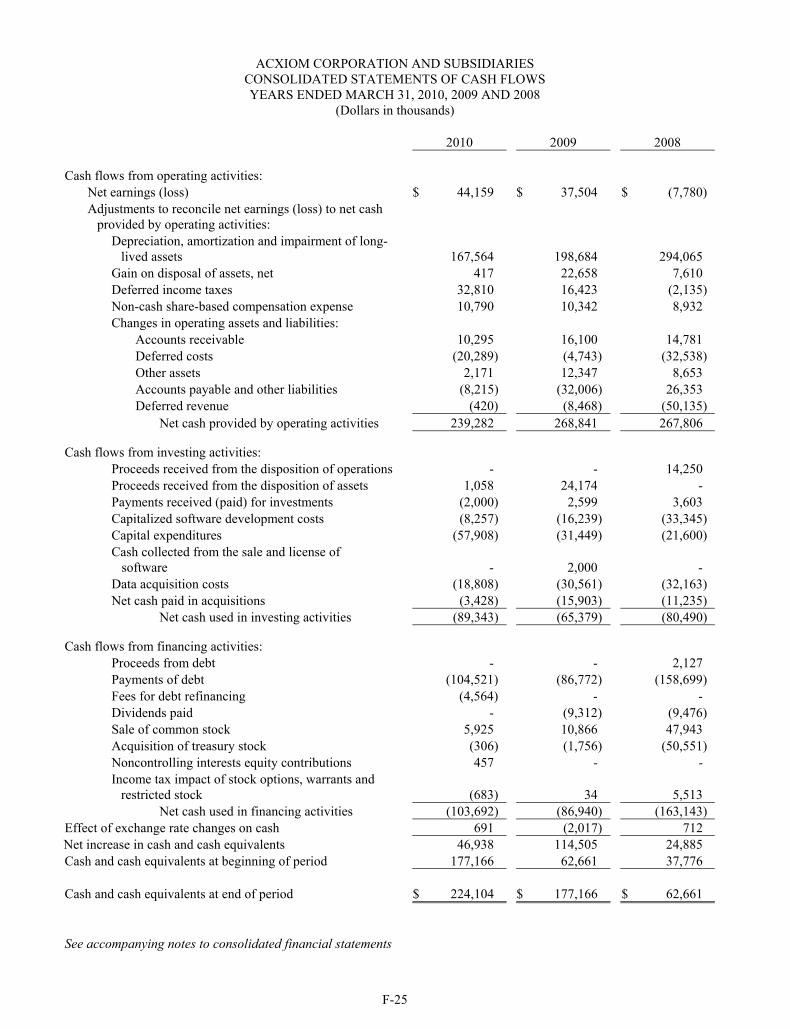
F-25
ACXIOM CORPORATION AND SUBSIDIARIES CONSOLIDATED STATEMENTS OF CASH FLOWS YEARS ENDED MARCH 31, 2010, 2009 AND 2008
(Dollars in thousands)
2010 2009 2008
Cash flows from operating activities: Net earnings (loss) $ 44,159 $ 37,504 $ (7,780) Adjustments to reconcile net earnings (loss) to net cash
provided by operating activities: Depreciation, amortization and impairment of long-
lived assets 167,564 198,684 294,065 Gain on disposal of assets, net 417 22,658 7,610 Deferred income taxes 32,810 16,423 (2,135) Non-cash share-based compensation expense 10,790 10,342 8,932 Changes in operating assets and liabilities:
Accounts receivable 10,295 16,100 14,781 Deferred costs (20,289) (4,743) (32,538) Other assets 2,171 12,347 8,653 Accounts payable and other liabilities (8,215) (32,006) 26,353 Deferred revenue (420) (8,468) (50,135)
Net cash provided by operating activities 239,282 268,841 267,806
Cash flows from investing activities: Proceeds received from the disposition of operations - - 14,250 Proceeds received from the disposition of assets 1,058 24,174 - Payments received (paid) for investments (2,000) 2,599 3,603 Capitalized software development costs (8,257) (16,239) (33,345) Capital expenditures (57,908) (31,449) (21,600) Cash collected from the sale and license of software - 2,000 - Data acquisition costs (18,808) (30,561) (32,163) Net cash paid in acquisitions (3,428) (15,903) (11,235)
Net cash used in investing activities (89,343) (65,379) (80,490)
Cash flows from financing activities: Proceeds from debt - - 2,127 Payments of debt (104,521) (86,772) (158,699) Fees for debt refinancing (4,564) - - Dividends paid - (9,312) (9,476) Sale of common stock 5,925 10,866 47,943 Acquisition of treasury stock (306) (1,756) (50,551) Noncontrolling interests equity contributions 457 - - Income tax impact of stock options, warrants and
restricted stock (683) 34 5,513 Net cash used in financing activities (103,692) (86,940) (163,143)
Effect of exchange rate changes on cash 691 (2,017) 712 Net increase in cash and cash equivalents 46,938 114,505 24,885 Cash and cash equivalents at beginning of period 177,166 62,661 37,776
Cash and cash equivalents at end of period $ 224,104 $ 177,166 $ 62,661
See accompanying notes to consolidated financial statements
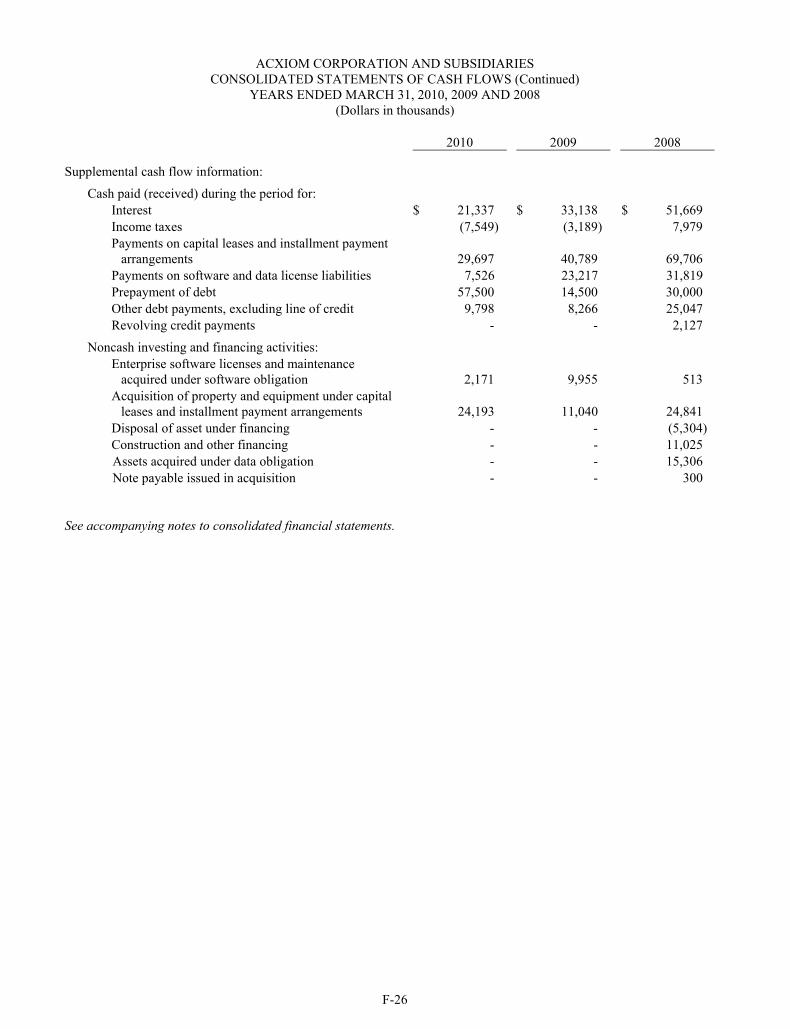
F-26
ACXIOM CORPORATION AND SUBSIDIARIES CONSOLIDATED STATEMENTS OF CASH FLOWS (Continued)
YEARS ENDED MARCH 31, 2010, 2009 AND 2008 (Dollars in thousands)
2010 2009 2008
Supplemental cash flow information:
Cash paid (received) during the period for: Interest $ 21,337 $ 33,138 $ 51,669 Income taxes (7,549) (3,189) 7,979 Payments on capital leases and installment payment
arrangements 29,697 40,789 69,706 Payments on software and data license liabilities 7,526 23,217 31,819 Prepayment of debt 57,500 14,500 30,000 Other debt payments, excluding line of credit 9,798 8,266 25,047 Revolving credit payments - - 2,127
Noncash investing and financing activities: Enterprise software licenses and maintenance
acquired under software obligation 2,171 9,955 513 Acquisition of property and equipment under capital
leases and installment payment arrangements 24,193 11,040 24,841 Disposal of asset under financing - - (5,304) Construction and other financing - - 11,025 Assets acquired under data obligation - - 15,306 Note payable issued in acquisition - - 300
See accompanying notes to consolidated financial statements.
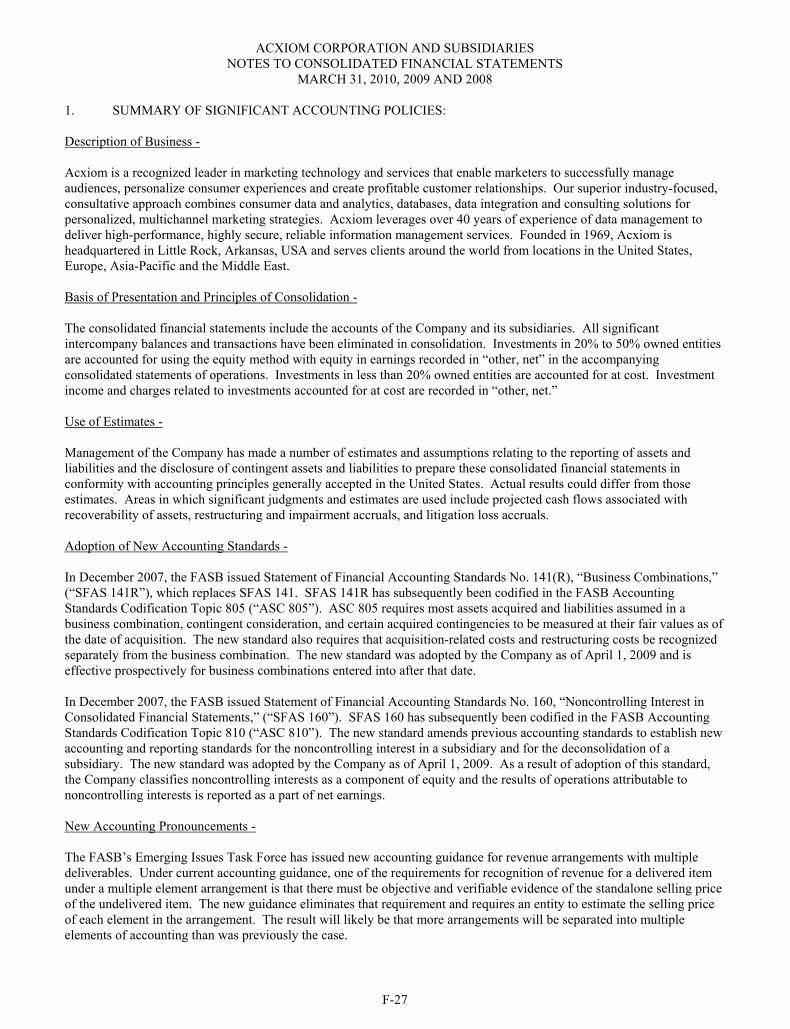
ACXIOM CORPORATION AND SUBSIDIARIES NOTES TO CONSOLIDATED FINANCIAL STATEMENTS
MARCH 31, 2010, 2009 AND 2008
F-27
1. SUMMARY OF SIGNIFICANT ACCOUNTING POLICIES:
Description of Business -
Acxiom is a recognized leader in marketing technology and services that enable marketers to successfully manage audiences, personalize consumer experiences and create profitable customer relationships. Our superior industry-focused, consultative approach combines consumer data and analytics, databases, data integration and consulting solutions for personalized, multichannel marketing strategies. Acxiom leverages over 40 years of experience of data management to deliver high-performance, highly secure, reliable information management services. Founded in 1969, Acxiom is headquartered in Little Rock, Arkansas, USA and serves clients around the world from locations in the United States, Europe, Asia-Pacific and the Middle East.
Basis of Presentation and Principles of Consolidation -
The consolidated financial statements include the accounts of the Company and its subsidiaries. All significant intercompany balances and transactions have been eliminated in consolidation. Investments in 20% to 50% owned entities are accounted for using the equity method with equity in earnings recorded in “other, net” in the accompanying consolidated statements of operations. Investments in less than 20% owned entities are accounted for at cost. Investment income and charges related to investments accounted for at cost are recorded in “other, net.”
Use of Estimates -
Management of the Company has made a number of estimates and assumptions relating to the reporting of assets and liabilities and the disclosure of contingent assets and liabilities to prepare these consolidated financial statements in conformity with accounting principles generally accepted in the United States. Actual results could differ from those estimates. Areas in which significant judgments and estimates are used include projected cash flows associated with recoverability of assets, restructuring and impairment accruals, and litigation loss accruals.
Adoption of New Accounting Standards -
In December 2007, the FASB issued Statement of Financial Accounting Standards No. 141(R), “Business Combinations,” (“SFAS 141R”), which replaces SFAS 141. SFAS 141R has subsequently been codified in the FASB Accounting Standards Codification Topic 805 (“ASC 805”). ASC 805 requires most assets acquired and liabilities assumed in a business combination, contingent consideration, and certain acquired contingencies to be measured at their fair values as of the date of acquisition. The new standard also requires that acquisition-related costs and restructuring costs be recognized separately from the business combination. The new standard was adopted by the Company as of April 1, 2009 and is effective prospectively for business combinations entered into after that date.
In December 2007, the FASB issued Statement of Financial Accounting Standards No. 160, “Noncontrolling Interest in Consolidated Financial Statements,” (“SFAS 160”). SFAS 160 has subsequently been codified in the FASB Accounting Standards Codification Topic 810 (“ASC 810”). The new standard amends previous accounting standards to establish new accounting and reporting standards for the noncontrolling interest in a subsidiary and for the deconsolidation of a subsidiary. The new standard was adopted by the Company as of April 1, 2009. As a result of adoption of this standard, the Company classifies noncontrolling interests as a component of equity and the results of operations attributable to noncontrolling interests is reported as a part of net earnings.
New Accounting Pronouncements -
The FASB’s Emerging Issues Task Force has issued new accounting guidance for revenue arrangements with multiple deliverables. Under current accounting guidance, one of the requirements for recognition of revenue for a delivered item under a multiple element arrangement is that there must be objective and verifiable evidence of the standalone selling price of the undelivered item. The new guidance eliminates that requirement and requires an entity to estimate the selling price of each element in the arrangement. The result will likely be that more arrangements will be separated into multiple elements of accounting than was previously the case.
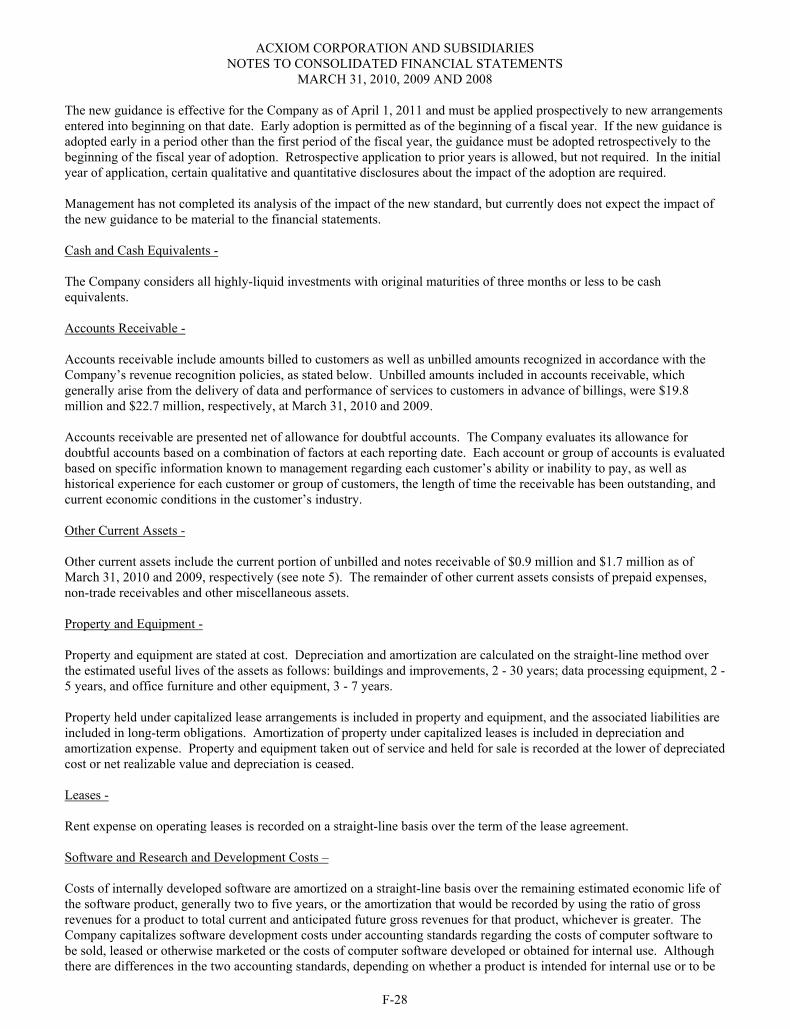
ACXIOM CORPORATION AND SUBSIDIARIES NOTES TO CONSOLIDATED FINANCIAL STATEMENTS
MARCH 31, 2010, 2009 AND 2008
F-28
The new guidance is effective for the Company as of April 1, 2011 and must be applied prospectively to new arrangements entered into beginning on that date. Early adoption is permitted as of the beginning of a fiscal year. If the new guidance isadopted early in a period other than the first period of the fiscal year, the guidance must be adopted retrospectively to the beginning of the fiscal year of adoption. Retrospective application to prior years is allowed, but not required. In the initialyear of application, certain qualitative and quantitative disclosures about the impact of the adoption are required.
Management has not completed its analysis of the impact of the new standard, but currently does not expect the impact of the new guidance to be material to the financial statements.
Cash and Cash Equivalents -
The Company considers all highly-liquid investments with original maturities of three months or less to be cash equivalents.
Accounts Receivable -
Accounts receivable include amounts billed to customers as well as unbilled amounts recognized in accordance with the Company’s revenue recognition policies, as stated below. Unbilled amounts included in accounts receivable, which generally arise from the delivery of data and performance of services to customers in advance of billings, were $19.8 million and $22.7 million, respectively, at March 31, 2010 and 2009.
Accounts receivable are presented net of allowance for doubtful accounts. The Company evaluates its allowance for doubtful accounts based on a combination of factors at each reporting date. Each account or group of accounts is evaluated based on specific information known to management regarding each customer’s ability or inability to pay, as well as historical experience for each customer or group of customers, the length of time the receivable has been outstanding, and current economic conditions in the customer’s industry.
Other Current Assets -
Other current assets include the current portion of unbilled and notes receivable of $0.9 million and $1.7 million as of March 31, 2010 and 2009, respectively (see note 5). The remainder of other current assets consists of prepaid expenses, non-trade receivables and other miscellaneous assets.
Property and Equipment -
Property and equipment are stated at cost. Depreciation and amortization are calculated on the straight-line method over the estimated useful lives of the assets as follows: buildings and improvements, 2 - 30 years; data processing equipment, 2 - 5 years, and office furniture and other equipment, 3 - 7 years.
Property held under capitalized lease arrangements is included in property and equipment, and the associated liabilities are included in long-term obligations. Amortization of property under capitalized leases is included in depreciation and amortization expense. Property and equipment taken out of service and held for sale is recorded at the lower of depreciated cost or net realizable value and depreciation is ceased.
Leases -
Rent expense on operating leases is recorded on a straight-line basis over the term of the lease agreement.
Software and Research and Development Costs –
Costs of internally developed software are amortized on a straight-line basis over the remaining estimated economic life of the software product, generally two to five years, or the amortization that would be recorded by using the ratio of gross revenues for a product to total current and anticipated future gross revenues for that product, whichever is greater. The Company capitalizes software development costs under accounting standards regarding the costs of computer software to be sold, leased or otherwise marketed or the costs of computer software developed or obtained for internal use. Although there are differences in the two accounting standards, depending on whether a product is intended for internal use or to be
ACXIOM CORPORATION AND SUBSIDIARIES NOTES TO CONSOLIDATED FINANCIAL STATEMENTS
MARCH 31, 2010, 2009 AND 2008
F-29
provided to customers, both accounting standards generally require that research and development costs incurred prior to establishing technological feasibility or the beginning of the application development stage of software products are charged to operations as such costs are incurred. Once technological feasibility is established or the application development stage has begun, costs are capitalized until the software is available for general release. Amortization expense related to both internally developed and purchased software is included in cost of revenue in the accompanying consolidated statements of operations.
Purchased Software Licenses -
Purchased software licenses include both prepaid software and capitalized future software obligations for which the liability is included in long-term debt. Costs of purchased software licenses are amortized using a units-of-production basis over the estimated economic life of the license, generally not to exceed ten years. Amortization of software is included in cost of revenue in the accompanying consolidated statements of operations.
Some of these licenses are, in effect, volume purchase agreements for software licenses needed for internal use and to provide services to customers over the terms of the agreements. Therefore, amortization lives are periodically reevaluated and, if justified, adjusted to reflect current and future expected usage based on units-of-production amortization. Factors considered in estimating remaining useful life include, but are not limited to, contract provisions of the underlying licenses,introduction of new mainframe hardware which is compatible with previous generation software, predictions of continuing viability of mainframe architecture, and customers’ continuing commitments to utilize mainframe architecture and the software under contract.
Goodwill -
Goodwill represents the excess of acquisition costs over the fair values of net assets acquired in business combinations. Goodwill is reviewed at least annually for impairment under a two-part test. Part one of the goodwill impairment test involves a determination of whether the total book value of each reporting unit of the Company (generally defined as the carrying value of assets minus the carrying value of liabilities) exceeds the reporting unit’s estimated fair value. In the event that part one of the impairment test indicates an excess of book value over the estimated fair value of net assets, performance of part two of the impairment test is required, whereby estimated fair values are assigned to identifiable assets with any residual fair value assigned to goodwill. Impairment exists to the extent that the reporting unit’s recorded goodwill exceeds the residual fair value assigned to such goodwill. Any impairment that results from the completion of the two-part test is recorded as a charge to operations during the period in which the impairment test is completed. Completion of the Company’s most recent annual impairment test during the quarter ended June 30, 2009 indicated that no potential impairment of its goodwill balances exists. The Company expects to complete its next annual impairment test during the quarter ending June 30, 2010.
Impairment of Long-lived Assets and Long-lived Assets to Be Disposed Of -
Long-lived assets and certain identifiable intangibles are reviewed for impairment whenever events or changes in circumstances indicate that the carrying amount of an asset may not be recoverable (see note 2). Recoverability of assets to be held and used is measured by a comparison of the carrying amount of an asset to the undiscounted cash flows expected to result from the use and eventual disposition of the asset. If such assets are considered to be impaired, the impairment to be recognized is measured by the amount by which the carrying amount of the assets exceeds the fair value of the assets.Assets to be disposed of shall be classified as held for sale and are reported at the lower of the carrying amount or fair value less costs to sell.
Deferred Costs and Data Acquisition Costs -
The Company defers certain costs, primarily salaries and benefits and other direct and incremental third party costs, in connection with client contracts and various other contracts and arrangements. Direct and incremental costs incurred during the setup phase under client contracts for database management or for IT management arrangements are deferred until such time as the database or the outsourcing services are operational and revenue recognition begins. These costs are directly related to the individual client, are to be used specifically for the individual client and have no other use or futurebenefit. In addition, revenue recognition of billings, if any, related to these setup activities are deferred during the setupphase under client contracts. All costs and billings deferred are then amortized as contract revenue recognition occurs,
ACXIOM CORPORATION AND SUBSIDIARIES NOTES TO CONSOLIDATED FINANCIAL STATEMENTS
MARCH 31, 2010, 2009 AND 2008
F-30
generally ratably over the remaining term of the arrangement. During the period when costs are being deferred, the Company performs a net realizable value review on a quarterly basis to ensure that the deferred costs are recoverable through either 1) recognition of previously deferred revenue, 2) future minimum contractual billings or 3) billings in excess of contractual minimum billings that can be reasonably estimated and are deemed likely to occur. Once revenue recognition begins, these deferred costs are assessed for impairment when events or changes in circumstances indicate the carrying value may not be recoverable. Some contracts contain provisions allowing the customer to request reductions in pricing if they can demonstrate that the Company charges lower prices for similar services to other customers, or if the prices charged are higher than certain benchmarks. If pricing is renegotiated, deferred costs are assessed for impairment.
In addition to client contract costs, the Company defers direct and incremental costs incurred in connection with obtaining other contracts, including debt facilities, lease facilities, and various other arrangements. Costs deferred in connection withobtaining scheduled debt facilities are amortized over the term of the arrangement using the interest method. Costs deferred in connection with lease facilities or revolving credit facilities are amortized over the term of the arrangement on astraight-line basis.
The Company also defers costs related to the acquisition or licensing of data for the Company’s proprietary databases which are used in providing data products and services to customers. These costs are amortized over the useful life of the data, which is from two to seven years. In order to estimate the useful life of any acquired data, the Company considers several factors including 1) the kind of data acquired, 2) whether the data becomes stale over time, 3) to what extent the data will be replaced by updated data over time, 4) whether the stale data continues to have value as historical data, 5) whether a license places restrictions on the use of the data, and 6) the term of the license.
Deferred Revenue -
Deferred revenue consists of amounts billed in excess of revenue recognized on sales of data licenses, services and equipment. Deferred revenues are subsequently recorded as revenue in accordance with the Company’s revenue recognition policies.
Revenue Recognition -
The Company provides database management and IT management services under long-term arrangements. These arrangements may require the Company to perform setup activities such as the design and build of a database for the customer under the database management contracts and migration of the customer’s IT environment under IT management contracts. In the case of database management contracts, the customer does not acquire any ownership rights to the Company’s intellectual property used in the database and the database itself provides no benefit to the customer outside of the utilization of the system during the term of the database management arrangement. In some cases, the arrangements also contain provisions requiring customer acceptance of the setup activities prior to commencement of the ongoing services arrangement. Up-front fees billed during the setup phase for these arrangements are deferred and setup costs that are direct and incremental to the contract are capitalized and amortized on a straight-line basis over the service term of the contract. Revenue recognition does not begin until after customer acceptance in cases where contracts contain acceptance provisions. Once the setup phase is complete and customer acceptance occurs, the Company recognizes revenue over the remaining service term of the contract. In situations where the arrangement does not require customer acceptance before the Company begins providing services, revenue is recognized over the contract period and no costs are deferred.
The Company accounts for revenue arrangements with multiple elements in accordance with applicable accounting literature, which provides guidance on (a) how arrangement consideration should be measured, (b) whether the arrangement should be divided into separate units of accounting, and (c) how the arrangement consideration should be allocated among the separate units of accounting. The Emerging Issues Task Force of the FASB has issued additional guidance on accounting for revenue arrangements with multiple elements, which the Company is required to implement effective April 1, 2011. The Company does not currently expect implementation of the amended guidance to have a material effect on revenue recognition.
The Company currently accounts for all elements under its database management and IT management arrangements as a single unit, since the initial setup activities performed under the arrangements may not have stand-alone value to the client and under the current accounting standards the Company is unable to determine the relative fair values of the delivered elements and the undelivered elements. Therefore, when third party software, hardware and certain other equipment are
ACXIOM CORPORATION AND SUBSIDIARIES NOTES TO CONSOLIDATED FINANCIAL STATEMENTS
MARCH 31, 2010, 2009 AND 2008
F-31
sold along with services, the Company records such sales over the related service period. Additionally, the Company evaluates revenue from the sale of data, software, hardware and equipment in accordance with accounting standards to determine whether such revenue should be recognized on a gross or a net basis over the term of the related service agreement. All of the factors in the accounting standards are considered with the primary factor being whether the Company is the primary obligor in the arrangement. “Out-of-pocket” expenses incurred by, and reimbursed to, the Company in connection with customer contracts are recorded as gross revenue.
The Company evaluates its database management and IT management arrangements to determine whether the arrangement contains a lease. If the arrangement is determined to contain a lease, applicable accounting standards require the Company to account for the lease component separately from the remaining components of the arrangement. In cases where database management or IT management arrangements are determined to include a lease, the lease is evaluated to determine whether it is a capital lease or operating lease and accounted for accordingly. These lease revenues are not significant to the Company’s consolidated financial statements.
All taxes assessed on revenue-producing transactions described above are presented on a net basis, or excluded from revenues.
The Company also performs services on a project basis outside of, or in addition to, the scope of long-term arrangements. The Company recognizes revenue from these services as the services are performed.
Revenues from the licensing of data are recognized upon delivery of the data to the customer in circumstances where no update or other obligations exist. Revenue from the licensing of data in which the Company is obligated to provide future updates on a monthly, quarterly or annual basis is recognized on a straight-line basis over the license term. Revenue from the licensing of data to the customer in circumstances where the license agreement contains a volume cap is recognized in proportion to the total records to be delivered under the arrangement.
The Company does not provide end-users with price-protection or rights of return. The Company’s contracts provide a warranty that the services or products will meet the agreed-upon criteria or any necessary modifications will be made. The Company ensures that services or products delivered meet the agreed-upon criteria prior to recognition of revenue.
Concentration of Credit Risk -
Financial instruments that potentially subject the Company to concentrations of credit risk consist primarily of trade accounts, unbilled and notes receivable. The Company’s receivables are from a large number of customers. Accordingly, the Company’s credit risk is affected by general economic conditions. The Company maintains deposits in federally insured financial institutions in excess of federally insured limits. Management, however, believes the Company is not exposed to significant credit risk due to the financial position of the depository institutions in which those deposits are held.
Income Taxes -
The Company and its domestic subsidiaries file a consolidated federal income tax return. The Company’s foreign subsidiaries file separate income tax returns in the countries in which their operations are based.
The Company provides for deferred taxes under the asset and liability method. Deferred tax assets and liabilities are recognized for the future tax consequences attributable to differences between the financial statement carrying amounts of existing assets and liabilities and their respective tax bases. Deferred tax assets and liabilities are measured using enacted tax rates expected to apply to taxable income in the years in which those temporary differences are expected to be reversed. Valuation allowances are recorded to reduce deferred tax assets to an amount whose realization is more likely than not. In determining the recognition of uncertain tax positions, the Company applies a more-likely-than-not recognition threshold and determines the measurement of uncertain tax positions considering the amounts and probabilities of the outcomes that could be realized upon ultimate settlement with taxing authorities. Income taxes payable are classified in the accompanying consolidated balance sheets based on their estimated payment date.
Foreign Currency Translation -
ACXIOM CORPORATION AND SUBSIDIARIES NOTES TO CONSOLIDATED FINANCIAL STATEMENTS
MARCH 31, 2010, 2009 AND 2008
F-32
The balance sheets of the Company’s foreign subsidiaries are translated at period-end rates of exchange, and the statements of operations are translated at the weighted-average exchange rate for the period. Gains or losses resulting from translating foreign currency financial statements are included in accumulated other comprehensive income (loss) in the consolidated statements of stockholders’ equity and comprehensive income (loss).
Advertising Expense -
The Company expenses advertising costs as incurred. Advertising expense was approximately $8.1 million, $10.7 million and $10.1 million for the years ended March 31, 2010, 2009 and 2008, respectively. Advertising expense is included in selling, general and administrative expense on the accompanying consolidated statements of operations.
Guarantees -
The Company accounts for the guarantees of indebtedness of others under applicable accounting standards which require a guarantor to recognize, at the inception of the guarantee, a liability for the fair value of the obligation undertaken in issuingthe guarantee. A guarantor is also required to make additional disclosures in its financial statements about obligations under certain guarantees issued. The Company is required to recognize a liability in its consolidated financial statements equal to the fair value of its guarantees, including any guarantees issued in connection with its synthetic equipment arrangements. However, these provisions are applied only on a prospective basis to guarantees issued or modified after December 31, 2002. The Company’s liability for the fair value of guarantees is not material.
Loss Contingencies and Legal Expenses -
The Company records a liability for loss contingencies when the liability is probable and reasonably estimable. Legal fees associated with loss contingencies are recorded when the legal fees are incurred.
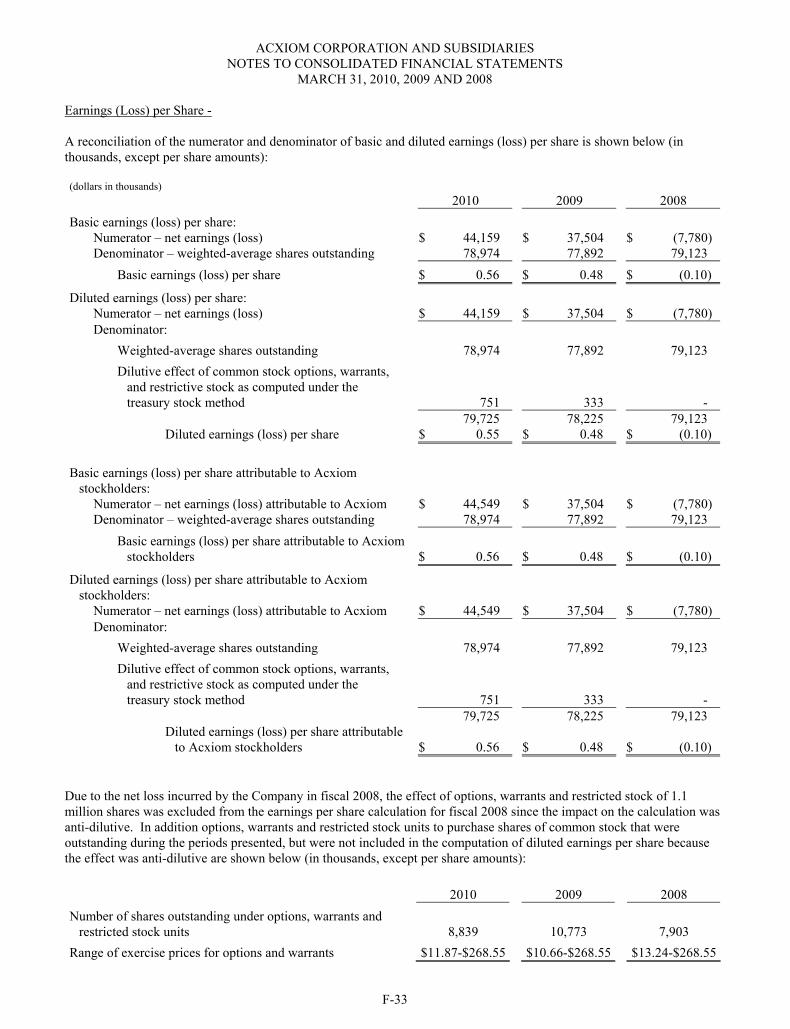
ACXIOM CORPORATION AND SUBSIDIARIES NOTES TO CONSOLIDATED FINANCIAL STATEMENTS
MARCH 31, 2010, 2009 AND 2008
F-33
Earnings (Loss) per Share - A reconciliation of the numerator and denominator of basic and diluted earnings (loss) per share is shown below (in thousands, except per share amounts): (dollars in thousands) 2010 2009 2008 Basic earnings (loss) per share:
Numerator – net earnings (loss) $ 44,159 $ 37,504 $ (7,780) Denominator – weighted-average shares outstanding 78,974 77,892 79,123
Basic earnings (loss) per share $ 0.56 $ 0.48 $ (0.10)
Diluted earnings (loss) per share: Numerator – net earnings (loss) $ 44,159 $ 37,504 $ (7,780) Denominator:
Weighted-average shares outstanding 78,974 77,892 79,123 Dilutive effect of common stock options, warrants,
and restrictive stock as computed under the treasury stock method 751 333
- 79,725 78,225 79,123
Diluted earnings (loss) per share $ 0.55 $ 0.48 $ (0.10)
Basic earnings (loss) per share attributable to Acxiom stockholders:
Numerator – net earnings (loss) attributable to Acxiom $ 44,549 $ 37,504 $ (7,780) Denominator – weighted-average shares outstanding 78,974 77,892 79,123
Basic earnings (loss) per share attributable to Acxiom stockholders $ 0.56
$ 0.48
$ (0.10)
Diluted earnings (loss) per share attributable to Acxiom stockholders:
Numerator – net earnings (loss) attributable to Acxiom $ 44,549 $ 37,504 $ (7,780) Denominator:
Weighted-average shares outstanding 78,974 77,892 79,123 Dilutive effect of common stock options, warrants,
and restrictive stock as computed under the treasury stock method 751 333
- 79,725 78,225 79,123
Diluted earnings (loss) per share attributable to Acxiom stockholders $ 0.56
$ 0.48
$ (0.10)
Due to the net loss incurred by the Company in fiscal 2008, the effect of options, warrants and restricted stock of 1.1 million shares was excluded from the earnings per share calculation for fiscal 2008 since the impact on the calculation was anti-dilutive. In addition options, warrants and restricted stock units to purchase shares of common stock that were outstanding during the periods presented, but were not included in the computation of diluted earnings per share because the effect was anti-dilutive are shown below (in thousands, except per share amounts): 2010 2009 2008 Number of shares outstanding under options, warrants and
restricted stock units 8,839 10,773
7,903 Range of exercise prices for options and warrants $11.87-$268.55 $10.66-$268.55 $13.24-$268.55
ACXIOM CORPORATION AND SUBSIDIARIES NOTES TO CONSOLIDATED FINANCIAL STATEMENTS
MARCH 31, 2010, 2009 AND 2008
F-34
Share-Based Compensation -
The Company accounts for share-based compensation under applicable accounting standards which require the cost of employee services received in exchange for an award of equity instruments (including stock options) based on the grant-date fair value of the award to be recognized in the statement of earnings over the service period of the award.
Share-based Compensation Plans -
The Company has stock option plans and equity compensation plans (collectively referred to as the “share-based plans”) administered by the compensation committee of the board of directors under which options and restricted stock units were outstanding as of March 31, 2010.
The Company’s equity compensation plan provides that all associates (employees, officers, directors, affiliates, independent contractors or consultants) are eligible to receive awards (grant of any option, stock appreciation right, restricted stock award, restricted stock unit award, performance award, performance share, performance unit, qualified performance-based award, or other stock unit award) pursuant to the plan with the terms and conditions applicable to an award set forth in applicable grant documents. In the future, the Company expects to grant restricted stock awards, stock options and performance-based awards.
Incentive stock option awards granted pursuant to the share-based plans cannot be granted with an exercise price less than 100% of the per-share market value of the Company’s shares at the date of grant and have a maximum duration of ten years from the date of grant. Board policy currently requires that nonqualified options be priced at or above the fair market value of the common stock at the time of grant with a maximum duration of ten years.
Restricted stock units may be issued pursuant to the equity compensation plan and represent the right to receive shares in the future by way of an award agreement which includes vesting provisions. Award agreements can further provide for forfeitures triggered by certain prohibited activities, such as breach of confidentiality. All restricted stock units will be expensed over the vesting period as adjusted for estimated forfeitures. The vesting of some restricted stock units is subject to the Company’s achievement of certain performance criteria, as well as the individual remaining employed by the Company for a period of years.
The Company receives income tax deductions as a result of the exercise of stock options and the vesting of restricted stock units. The tax benefit of share-based compensation expense in excess of the book compensation expense is reflected as a financing cash inflow and operating cash outflow included in changes in operating assets and liabilities. The Company has elected the short-cut method in accounting for the tax benefits of share-based payment awards.
Derivatives and Hedging -
The Company has entered into an interest rate swap as a cash flow hedge against LIBOR interest rate movements on the term loan. The Company assesses the effectiveness of the hedge based on the hypothetical derivative method. Under the hypothetical derivative method, the cumulative change in fair value of the actual swap is compared to the cumulative change in fair value of the hypothetical swap, which has terms that identically match the critical terms of the hedged transaction. Thus, the hypothetical swap is presumed to perfectly offset the hedged cash flows. The change in the fair value of the perfect hypothetical swap will then be regarded as a proxy for the present value of the cumulative change in the expected future cash flows from the hedged transactions. All of the fair values are derived from an interest-rate futures model. All changes in fair value of the derivative are deferred and recorded in other comprehensive income (loss) until the related forecasted transaction is recognized in the consolidated statement of operations. The fair value of the interest rate swap agreement recorded in accumulated other comprehensive income (loss) may be recognized in the statement of operations if certain terms of the floating-rate debt change, if the floating-rate debt is extinguished or if the interest rateswap agreement is terminated prior to maturity.
Restructuring -
The Company records costs associated with employee terminations and other exit activity in accordance with applicable accounting standards, depending on whether the costs relate to exit or disposal activities under the accounting standards, or whether they are other post employment termination benefits, Under applicable accounting standards related to exit or
ACXIOM CORPORATION AND SUBSIDIARIES NOTES TO CONSOLIDATED FINANCIAL STATEMENTS
MARCH 31, 2010, 2009 AND 2008
F-35
disposal costs, the Company records employee termination benefits as an operating expense when the benefit arrangement is communicated to the employee and no significant future services are required. Under the accounting standards related to post employment termination benefits the Company records employee termination benefits when the termination benefits are probable and can be estimated. The Company recognizes the present value of facility lease termination obligations, net of estimated sublease income and other exit costs, when the Company has future payments with no future economic benefit or a commitment to pay the termination costs of a prior commitment. In future periods the Company will record accretion expense to increase the liability to an amount equal to the estimated future cash payments necessary to exit the leases. This requires a significant amount of judgment and management estimation in order to determine the expected time frame it will take to secure a subtenant, the amount of sublease income to be received and the appropriate discount rate to calculate the present value of the future cash flows. Should actual lease exit costs differ from estimates, the Company may be required to adjust the restructuring charge which will impact net income in the period any adjustment is recorded.
Classification of revenue and expense -
During fiscal 2009, the Company, under the leadership of its new CEO and President, reorganized the Company’s internal organization and, as a result, management reevaluated its segment organization. The Company’s CEO and President is the “chief operating decision maker” (“CODM”) as defined in applicable accounting standards. Based upon the review, management determined the Company has two reportable segments, reflecting how the CODM reviews results in terms of allocating resources and assessing performance. The reportable segments are Information Services and Information Products. The Information Services segment represents the Company’s four services lines of business which have been aggregated into one reportable segment, and the Information Products segment represents three products lines of business which have been aggregated into one reportable segment. Prior period disclosures have been revised to reflect the change in reportable segments. See note 18 for further information.
During fiscal 2009, management also reviewed its classification of revenue and expense on its statement of operations. Previously, the Company reported services and data revenues. As a result of the review, the Company is now reporting services and products revenues instead of services and data revenues, and certain background screening and risk mitigation revenues that were previously reported as services revenues have been reclassified to be included in products revenue along with data product revenue, with a corresponding reclassification of the related cost of revenue. For fiscal 2008 the change in classification results in a decrease of services revenue of $80.0 million and a corresponding increase in products revenue.
In addition, account management costs that were previously included in selling, general and administrative expense have been reclassified to cost of revenue. Classification of revenue and expense varies within the Company’s industry and management believes the new classification of revenue and expense more closely reflects the nature of these items, is consistent with the revised organizational structure, and will result in an improved financial statement presentation. Expenses for prior periods have been reclassified to conform to the current-year presentation. For fiscal 2008, the change in classification results in a decrease to selling, general and administrative expense of $42.5 million and a corresponding increase in cost of revenue.
Correction of immaterial errors in prior period consolidated financial statements -
In accordance with the guidance of SEC Staff Accounting Bulletin No. 99, “Materiality” (“SAB 99”) and SEC Staff Accounting Bulletin No. 108, “Considering the Effects of Prior Year Misstatements when Quantifying Misstatements in Current Year Financial Statements” (“SAB 108”), the accompanying consolidated financial statements reflect the correction of immaterial errors related to income taxes. The correction is due to deferred tax assets and liabilities that originated prior to March 31, 2007. The corrections resulted in an increase in deferred income tax liability of $3.7 million, a decrease in refundable income taxes of $0.6 million and a decrease in retained earnings of $4.3 million (amount prior to adjustment was $431.0 million).
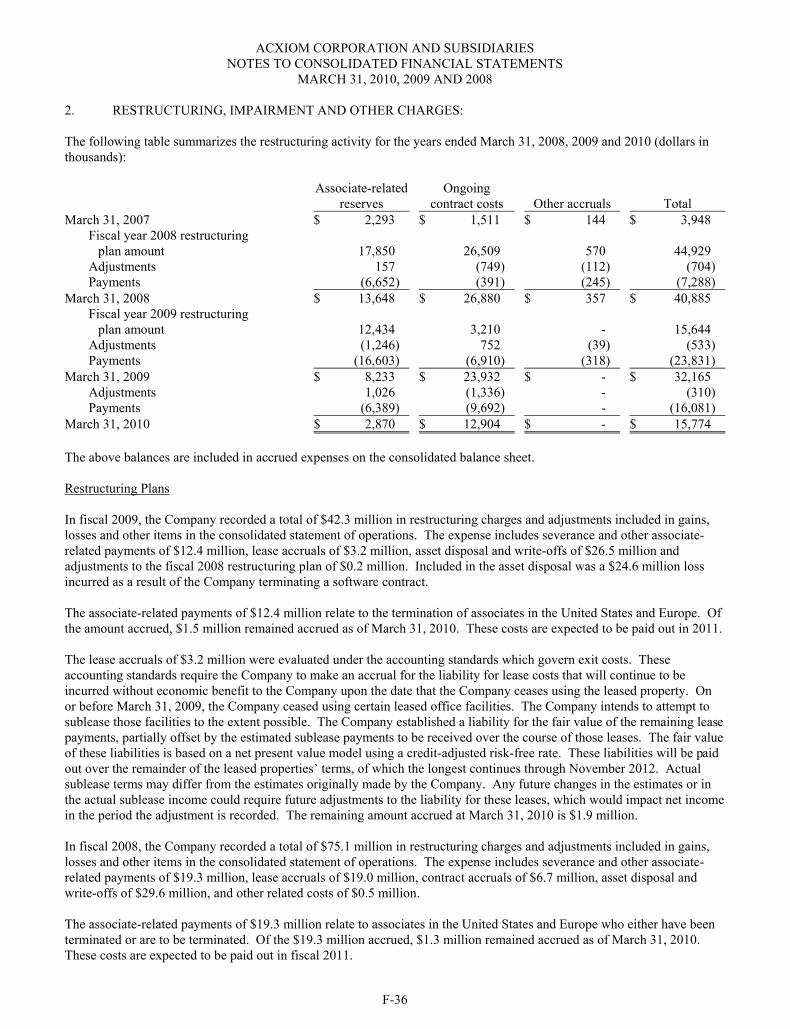
ACXIOM CORPORATION AND SUBSIDIARIES NOTES TO CONSOLIDATED FINANCIAL STATEMENTS
MARCH 31, 2010, 2009 AND 2008
F-36
2. RESTRUCTURING, IMPAIRMENT AND OTHER CHARGES:
The following table summarizes the restructuring activity for the years ended March 31, 2008, 2009 and 2010 (dollars in thousands):
Associate-relatedreserves
Ongoing contract costs Other accruals Total
March 31, 2007 $ 2,293 $ 1,511 $ 144 $ 3,948 Fiscal year 2008 restructuring
plan amount 17,850 26,509 570 44,929 Adjustments 157 (749) (112) (704) Payments (6,652) (391) (245) (7,288)
March 31, 2008 $ 13,648 $ 26,880 $ 357 $ 40,885 Fiscal year 2009 restructuring
plan amount 12,434 3,210 - 15,644 Adjustments (1,246) 752 (39) (533) Payments (16,603) (6,910) (318) (23,831)
March 31, 2009 $ 8,233 $ 23,932 $ - $ 32,165 Adjustments 1,026 (1,336) - (310) Payments (6,389) (9,692) - (16,081)
March 31, 2010 $ 2,870 $ 12,904 $ - $ 15,774
The above balances are included in accrued expenses on the consolidated balance sheet.
Restructuring Plans
In fiscal 2009, the Company recorded a total of $42.3 million in restructuring charges and adjustments included in gains, losses and other items in the consolidated statement of operations. The expense includes severance and other associate-related payments of $12.4 million, lease accruals of $3.2 million, asset disposal and write-offs of $26.5 million and adjustments to the fiscal 2008 restructuring plan of $0.2 million. Included in the asset disposal was a $24.6 million loss incurred as a result of the Company terminating a software contract.
The associate-related payments of $12.4 million relate to the termination of associates in the United States and Europe. Of the amount accrued, $1.5 million remained accrued as of March 31, 2010. These costs are expected to be paid out in 2011.
The lease accruals of $3.2 million were evaluated under the accounting standards which govern exit costs. These accounting standards require the Company to make an accrual for the liability for lease costs that will continue to be incurred without economic benefit to the Company upon the date that the Company ceases using the leased property. On or before March 31, 2009, the Company ceased using certain leased office facilities. The Company intends to attempt to sublease those facilities to the extent possible. The Company established a liability for the fair value of the remaining leasepayments, partially offset by the estimated sublease payments to be received over the course of those leases. The fair value of these liabilities is based on a net present value model using a credit-adjusted risk-free rate. These liabilities will be paidout over the remainder of the leased properties’ terms, of which the longest continues through November 2012. Actual sublease terms may differ from the estimates originally made by the Company. Any future changes in the estimates or in the actual sublease income could require future adjustments to the liability for these leases, which would impact net income in the period the adjustment is recorded. The remaining amount accrued at March 31, 2010 is $1.9 million.
In fiscal 2008, the Company recorded a total of $75.1 million in restructuring charges and adjustments included in gains, losses and other items in the consolidated statement of operations. The expense includes severance and other associate-related payments of $19.3 million, lease accruals of $19.0 million, contract accruals of $6.7 million, asset disposal and write-offs of $29.6 million, and other related costs of $0.5 million.
The associate-related payments of $19.3 million relate to associates in the United States and Europe who either have been terminated or are to be terminated. Of the $19.3 million accrued, $1.3 million remained accrued as of March 31, 2010. These costs are expected to be paid out in fiscal 2011.
ACXIOM CORPORATION AND SUBSIDIARIES NOTES TO CONSOLIDATED FINANCIAL STATEMENTS
MARCH 31, 2010, 2009 AND 2008
F-37
The lease accruals of $19.0 million were evaluated under accounting standards which govern exit costs. The remaining amount accrued at March 31, 2010 is $10.8 million. These liabilities will be paid out over the remainder of the leased properties’ terms, of which the longest continues through November 2021.
The contract accruals of $6.7 million were evaluated under accounting standards which govern exit costs, which require that a liability to terminate a contract before the end of its term be recognized when the contract is terminated in accordancewith its terms. Prior to March 31, 2008, the Company gave notice under certain service contracts to the other parties which caused the Company to incur termination payments under those contracts. As of March 31, 2010, all amounts have been paid.
The asset disposal and write-offs of $29.6 million include $7.6 million to write off goodwill and $1.9 million to write off other intangible assets related to the Harbinger acquisition (see note 3). In the fourth quarter of fiscal 2008, the Company completely shut down the operations of Harbinger because this acquisition had not performed in accordance with the Company’s expectations since its acquisition March 15, 2007. Because this business was never integrated into the Company’s operations, the entire amount of goodwill related to the acquisition was written off upon the closing of the Harbinger operations. The other intangible assets were tested for impairment under applicable accounting standards. Since the intangible assets do not generate any cash flow, they were determined to be fully impaired.
The asset disposal write-offs also include a $10.2 million loss on disposal of a software asset which was sold during the fourth quarter of fiscal 2008. The Company had an over-capacity of software licenses relating to a particular software agreement. The supplier of the software agreed to purchase the excess software license capacity from the Company in return for providing software maintenance to the Company for other software. The loss represents the excess of the carrying value of the software over the fair value of the software maintenance received.
Other asset disposal write-offs included $3.8 million of assets, primarily furniture and leasehold improvements that were abandoned and written off as a result of exiting leased buildings and contracts referred to above, and $6.1 million in write-offs related primarily to abandoned software products. All of these assets were evaluated under applicable accounting standards which require the Company to test assets for impairment whenever events or changes in circumstances indicate that the asset may be impaired. In each of these cases, there was a triggering event during the fourth quarter of fiscal 2008 which required the Company to test the asset for impairment. In order to test the asset for impairment, the Company estimated future cash flows for the asset, and if the future cash flows were not enough to recover the carrying value of the asset, the asset was written down to its estimated fair value. In most of these cases, the fair value was zero and the asset was completely written off.
The other related costs of $0.5 million are primarily moving costs associated with the closing of the leased facilities referred to above.
Terminated Acquisition of the Company
On May 16, 2007, the Company announced it had entered into an agreement to be acquired by Silver Lake and ValueAct Capital, at a price of $27.10 per share plus the assumption of outstanding debt. On October 1, 2007, the Company announced that this transaction had been terminated. For fiscal 2008, the Company incurred transaction related expenses of $17.7 million which are included in gains, losses and other items. Per the terms of the merger termination agreement, which was signed October 1, 2007, Silver Lake and ValueAct were required to pay the Company a settlement fee of $65.0 million. This settlement fee was received on October 10, 2007 and recorded in gains, losses and other items in fiscal 2008.
Leased Asset Disposal
During the year ended March 31, 2008, the Company entered into agreements to dispose of two leased aircraft. Under the terms of the leases, the Company was required to make termination payments to the lessor and the lessor sold the assets and paid the proceeds to the Company. The Company has recorded $6.4 million expense in fiscal 2008 in gains, losses and other items, for the net payment to terminate these leases and dispose of the assets. During the year ended March 31, 2009, the Company recorded $0.1 million gain in gains, losses and other items to adjust the final net payment to terminate the second lease and dispose of the asset.
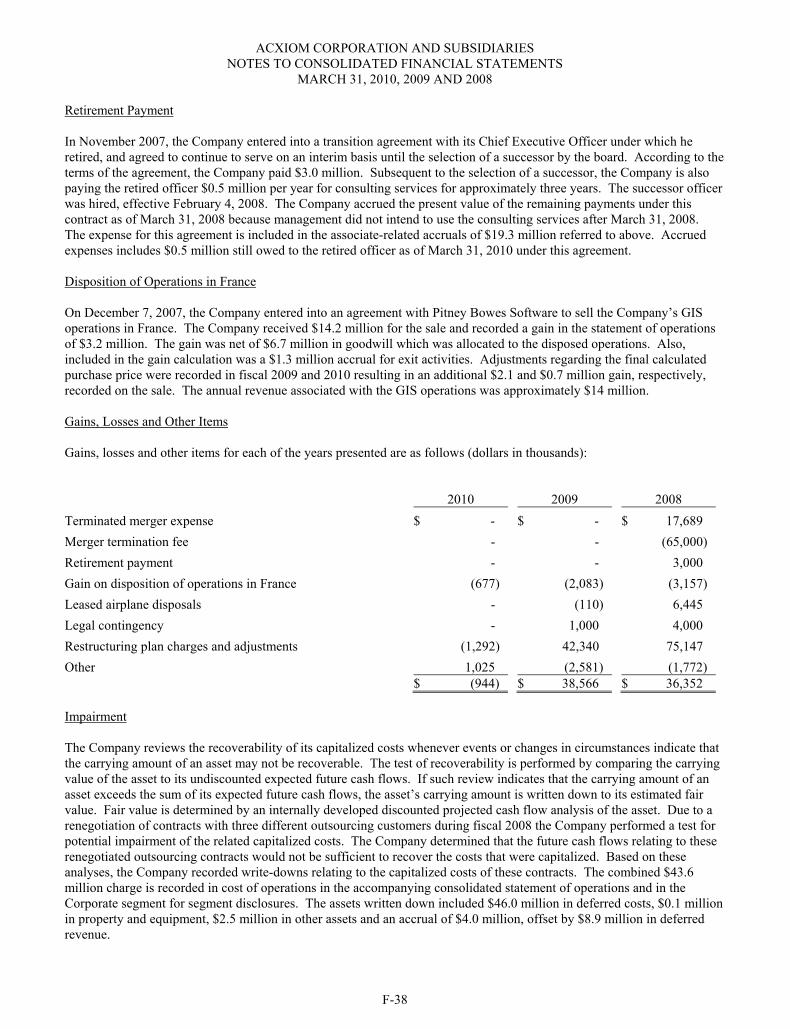
ACXIOM CORPORATION AND SUBSIDIARIES NOTES TO CONSOLIDATED FINANCIAL STATEMENTS
MARCH 31, 2010, 2009 AND 2008
F-38
Retirement Payment
In November 2007, the Company entered into a transition agreement with its Chief Executive Officer under which he retired, and agreed to continue to serve on an interim basis until the selection of a successor by the board. According to theterms of the agreement, the Company paid $3.0 million. Subsequent to the selection of a successor, the Company is also paying the retired officer $0.5 million per year for consulting services for approximately three years. The successor officer was hired, effective February 4, 2008. The Company accrued the present value of the remaining payments under this contract as of March 31, 2008 because management did not intend to use the consulting services after March 31, 2008.The expense for this agreement is included in the associate-related accruals of $19.3 million referred to above. Accrued expenses includes $0.5 million still owed to the retired officer as of March 31, 2010 under this agreement.
Disposition of Operations in France
On December 7, 2007, the Company entered into an agreement with Pitney Bowes Software to sell the Company’s GIS operations in France. The Company received $14.2 million for the sale and recorded a gain in the statement of operations of $3.2 million. The gain was net of $6.7 million in goodwill which was allocated to the disposed operations. Also, included in the gain calculation was a $1.3 million accrual for exit activities. Adjustments regarding the final calculated purchase price were recorded in fiscal 2009 and 2010 resulting in an additional $2.1 and $0.7 million gain, respectively, recorded on the sale. The annual revenue associated with the GIS operations was approximately $14 million.
Gains, Losses and Other Items
Gains, losses and other items for each of the years presented are as follows (dollars in thousands):
2010 2009 2008 Terminated merger expense $ - $ - $ 17,689 Merger termination fee - - (65,000)Retirement payment - - 3,000Gain on disposition of operations in France (677) (2,083) (3,157)Leased airplane disposals - (110) 6,445 Legal contingency - 1,000 4,000 Restructuring plan charges and adjustments (1,292) 42,340 75,147 Other 1,025 (2,581) (1,772)
$ (944) $ 38,566 $ 36,352
Impairment
The Company reviews the recoverability of its capitalized costs whenever events or changes in circumstances indicate that the carrying amount of an asset may not be recoverable. The test of recoverability is performed by comparing the carrying value of the asset to its undiscounted expected future cash flows. If such review indicates that the carrying amount of an asset exceeds the sum of its expected future cash flows, the asset’s carrying amount is written down to its estimated fair value. Fair value is determined by an internally developed discounted projected cash flow analysis of the asset. Due to a renegotiation of contracts with three different outsourcing customers during fiscal 2008 the Company performed a test for potential impairment of the related capitalized costs. The Company determined that the future cash flows relating to these renegotiated outsourcing contracts would not be sufficient to recover the costs that were capitalized. Based on these analyses, the Company recorded write-downs relating to the capitalized costs of these contracts. The combined $43.6 million charge is recorded in cost of operations in the accompanying consolidated statement of operations and in the Corporate segment for segment disclosures. The assets written down included $46.0 million in deferred costs, $0.1 million in property and equipment, $2.5 million in other assets and an accrual of $4.0 million, offset by $8.9 million in deferred revenue.
ACXIOM CORPORATION AND SUBSIDIARIES NOTES TO CONSOLIDATED FINANCIAL STATEMENTS
MARCH 31, 2010, 2009 AND 2008
F-39
3. ACQUISITIONS:
In December 2009, the Company acquired a 51% interest in Direct Marketing Services (“DMS”), with operations in Saudi Arabia and the United Arab Emirates. Upon acquisition DMS was reorganized as a limited liability company registered under the laws and regulations of the Kingdom of Saudi Arabia and renamed Acxiom Middle East and North Africa, LTD (“MENA”). The acquisition allows the Company to expand into this strategic geographic area. The purchase price for DMS was $3.8 million in cash, not including the amount, if any, to be paid pursuant to an earnout agreement where additional payment is contingent on MENA’s financial performance for the period ending on December 31, 2012. Financial performance under the earnout will be measured based on MENA’s calculation of earnings before interest, taxes, depreciation and amortization (“EBITDA”). The actual EBITDA will be divided by $18.3 million and that percentage multiplied by $6.1 million to determine the earnout payment. There will be no earnout payment if the actual EBITDA does not exceed $12.8 million. The Company has omitted pro forma disclosures related to this acquisition as the pro forma effect of this acquisition is not material to the Company’s consolidated results for any period presented. DMS has annual revenue of less than $5 million. The results of operations for MENA are included in the Company’s consolidated results beginning December 1, 2009.
On November 7, 2008, the Company acquired the assets of Quinetia, LLC, a Rochester, New York-based provider of analytics and predictive modeling for large and medium size businesses. The acquisition provides the Company additional consumer insight capabilities that enable clients to more effectively retain and grow their customer base and optimize pricing. The Company paid $2.7 million, net of cash acquired, for the acquisition not including amounts, if any, paid pursuant to an earnout agreement. The earnout agreement allows for payment of up to $1.2 million if the acquired business achieves certain earnings before interest, tax, depreciation and amortization goals. Payments under the earnout agreement are determined based on results in the target measurement periods ending March 31, 2009, 2010 and 2011. The first earnout payment of $0.2 million in fiscal 2009 and the second earnout payment of $0.2 million in fiscal 2010 have been added to the purchase price. The acquired business has annual revenues of less than $5.0 million. The Company has omitted pro forma disclosures related to this acquisition as the pro forma effect of this acquisition is not material to the Company’s consolidated results for any period presented. Quinetia’s results of operations are included in the Company’s consolidated results beginning November 7, 2008.
On September 15, 2008, the Company acquired the direct marketing technology unit of Alvion, LLC. The acquisition allowed the Company to obtain a proven online marketing list fulfillment platform that can be used by small and medium-size businesses that need immediate access to marketing information through a software-as-service environment. The Company paid $3.6 million in cash, net of cash acquired, for the acquisition. The acquired business has annual revenues of less than $5.0 million. The Company has omitted pro forma disclosures related to this acquisition as the pro forma effect of this acquisition is not material to the Company’s consolidated results for any period presented. Alvion’s results of operations are included in the Company’s consolidated results beginning September 15, 2008.
In July 2008, the Company acquired the database marketing unit of ChoicePoint Precision Marketing, LLC (“Precision Marketing”). The Company paid $9.0 million, of which $4.5 million was paid into two escrow accounts which were subject to escrow arrangements which were finally resolved during the quarter ended September 30, 2009. A total of $0.5 million of one of the escrow funds has been released to reimburse the Company for costs incurred. Of the remaining $4.0 million escrow fund, $3.6 million has been paid to the sellers and approximately $0.4 million has been returned to the Company. The $4.0 million placed into escrow was originally treated as purchase price, therefore the $0.4 million returned to the Company has been recorded as a reduction of purchase price and the $3.6 million has been charged to goodwill. The acquired business had annual revenue of approximately $16.0 million. The Company has omitted pro forma disclosures related to this acquisition as the pro forma effect of this acquisition is not material to the Company’s consolidated results for any period presented. Precision Marketing’s results of operations are included in the Company’s consolidated results beginning July 1, 2008.
On November 9, 2007, the Company entered into an agreement with Automatic Research, Inc., to purchase certain assets collectively known as MKTG. MKTG is a traditional direct marketing operation that provides its customers with data processing, list sales and list management services. The acquisition extends offerings to markets with favorable growth that were not previously serviced by the Company. The Company paid $3.7 million for MKTG. There are no earnout agreements or other contingencies related to this acquisition. The operations of MKTG are included in the consolidated results beginning November 9, 2007. The annual revenues of MKTG are approximately $7.4 million. The Company has
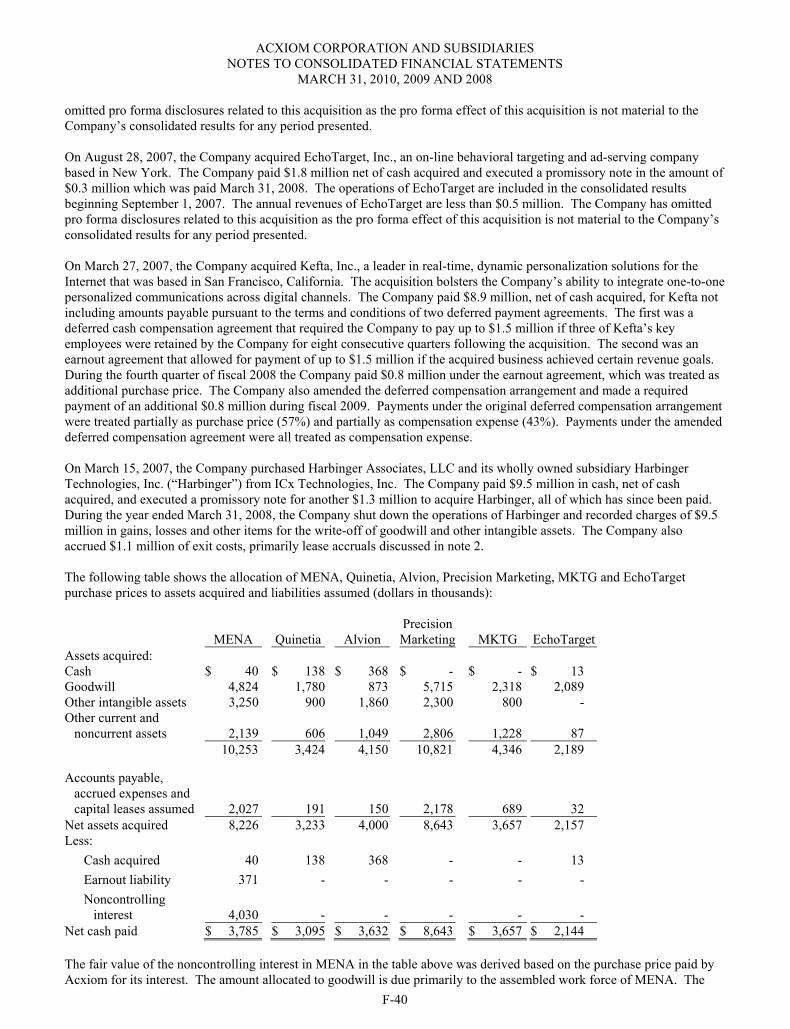
ACXIOM CORPORATION AND SUBSIDIARIES NOTES TO CONSOLIDATED FINANCIAL STATEMENTS
MARCH 31, 2010, 2009 AND 2008
F-40
omitted pro forma disclosures related to this acquisition as the pro forma effect of this acquisition is not material to the Company’s consolidated results for any period presented.
On August 28, 2007, the Company acquired EchoTarget, Inc., an on-line behavioral targeting and ad-serving company based in New York. The Company paid $1.8 million net of cash acquired and executed a promissory note in the amount of $0.3 million which was paid March 31, 2008. The operations of EchoTarget are included in the consolidated results beginning September 1, 2007. The annual revenues of EchoTarget are less than $0.5 million. The Company has omitted pro forma disclosures related to this acquisition as the pro forma effect of this acquisition is not material to the Company’s consolidated results for any period presented.
On March 27, 2007, the Company acquired Kefta, Inc., a leader in real-time, dynamic personalization solutions for the Internet that was based in San Francisco, California. The acquisition bolsters the Company’s ability to integrate one-to-one personalized communications across digital channels. The Company paid $8.9 million, net of cash acquired, for Kefta not including amounts payable pursuant to the terms and conditions of two deferred payment agreements. The first was a deferred cash compensation agreement that required the Company to pay up to $1.5 million if three of Kefta’s key employees were retained by the Company for eight consecutive quarters following the acquisition. The second was an earnout agreement that allowed for payment of up to $1.5 million if the acquired business achieved certain revenue goals.During the fourth quarter of fiscal 2008 the Company paid $0.8 million under the earnout agreement, which was treated as additional purchase price. The Company also amended the deferred compensation arrangement and made a required payment of an additional $0.8 million during fiscal 2009. Payments under the original deferred compensation arrangement were treated partially as purchase price (57%) and partially as compensation expense (43%). Payments under the amended deferred compensation agreement were all treated as compensation expense.
On March 15, 2007, the Company purchased Harbinger Associates, LLC and its wholly owned subsidiary Harbinger Technologies, Inc. (“Harbinger”) from ICx Technologies, Inc. The Company paid $9.5 million in cash, net of cash acquired, and executed a promissory note for another $1.3 million to acquire Harbinger, all of which has since been paid. During the year ended March 31, 2008, the Company shut down the operations of Harbinger and recorded charges of $9.5 million in gains, losses and other items for the write-off of goodwill and other intangible assets. The Company also accrued $1.1 million of exit costs, primarily lease accruals discussed in note 2.
The following table shows the allocation of MENA, Quinetia, Alvion, Precision Marketing, MKTG and EchoTarget purchase prices to assets acquired and liabilities assumed (dollars in thousands):
MENA Quinetia Alvion PrecisionMarketing MKTG EchoTarget
Assets acquired: Cash $ 40 $ 138 $ 368 $ - $ - $ 13 Goodwill 4,824 1,780 873 5,715 2,318 2,089 Other intangible assets 3,250 900 1,860 2,300 800 - Other current and
noncurrent assets 2,139 606 1,049 2,806 1,228 87 10,253 3,424 4,150 10,821 4,346 2,189
Accounts payable, accrued expenses and capital leases assumed 2,027 191 150 2,178 689 32
Net assets acquired 8,226 3,233 4,000 8,643 3,657 2,157 Less:
Cash acquired 40 138 368 - - 13 Earnout liability 371 - - - - - Noncontrolling
interest 4,030 - - - - - Net cash paid $ 3,785 $ 3,095 $ 3,632 $ 8,643 $ 3,657 $ 2,144
The fair value of the noncontrolling interest in MENA in the table above was derived based on the purchase price paid by Acxiom for its interest. The amount allocated to goodwill is due primarily to the assembled work force of MENA. The
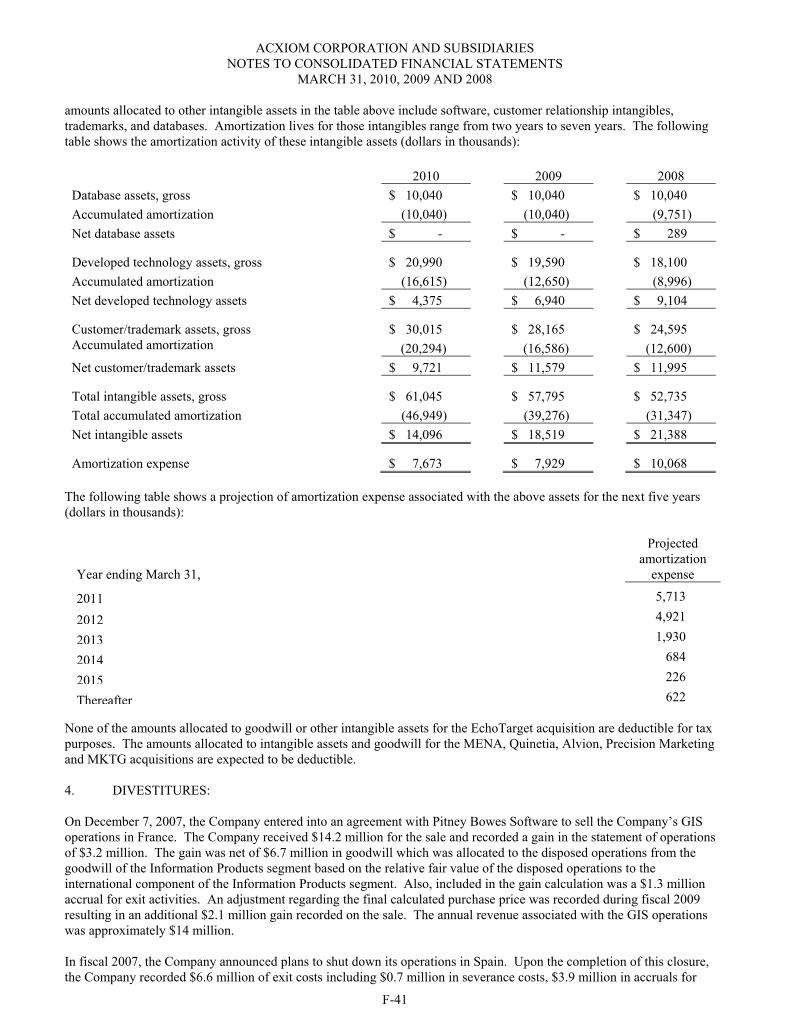
ACXIOM CORPORATION AND SUBSIDIARIES NOTES TO CONSOLIDATED FINANCIAL STATEMENTS
MARCH 31, 2010, 2009 AND 2008
F-41
amounts allocated to other intangible assets in the table above include software, customer relationship intangibles, trademarks, and databases. Amortization lives for those intangibles range from two years to seven years. The following table shows the amortization activity of these intangible assets (dollars in thousands):
2010 2009 2008 Database assets, gross $ 10,040 $ 10,040 $ 10,040 Accumulated amortization (10,040) (10,040) (9,751) Net database assets $ - $ - $ 289
Developed technology assets, gross $ 20,990 $ 19,590 $ 18,100 Accumulated amortization (16,615) (12,650) (8,996) Net developed technology assets $ 4,375 $ 6,940 $ 9,104
Customer/trademark assets, gross $ 30,015 $ 28,165 $ 24,595 Accumulated amortization (20,294) (16,586) (12,600) Net customer/trademark assets $ 9,721 $ 11,579 $ 11,995
Total intangible assets, gross $ 61,045 $ 57,795 $ 52,735 Total accumulated amortization (46,949) (39,276) (31,347) Net intangible assets $ 14,096 $ 18,519 $ 21,388
Amortization expense $ 7,673 $ 7,929 $ 10,068
The following table shows a projection of amortization expense associated with the above assets for the next five years (dollars in thousands):
Year ending March 31,
Projectedamortization
expense
2011 5,713
2012 4,921
2013 1,930
2014 684
2015 226
Thereafter 622
None of the amounts allocated to goodwill or other intangible assets for the EchoTarget acquisition are deductible for tax purposes. The amounts allocated to intangible assets and goodwill for the MENA, Quinetia, Alvion, Precision Marketing and MKTG acquisitions are expected to be deductible.
4. DIVESTITURES:
On December 7, 2007, the Company entered into an agreement with Pitney Bowes Software to sell the Company’s GIS operations in France. The Company received $14.2 million for the sale and recorded a gain in the statement of operations of $3.2 million. The gain was net of $6.7 million in goodwill which was allocated to the disposed operations from the goodwill of the Information Products segment based on the relative fair value of the disposed operations to the international component of the Information Products segment. Also, included in the gain calculation was a $1.3 million accrual for exit activities. An adjustment regarding the final calculated purchase price was recorded during fiscal 2009 resulting in an additional $2.1 million gain recorded on the sale. The annual revenue associated with the GIS operations was approximately $14 million.
In fiscal 2007, the Company announced plans to shut down its operations in Spain. Upon the completion of this closure, the Company recorded $6.6 million of exit costs including $0.7 million in severance costs, $3.9 million in accruals for
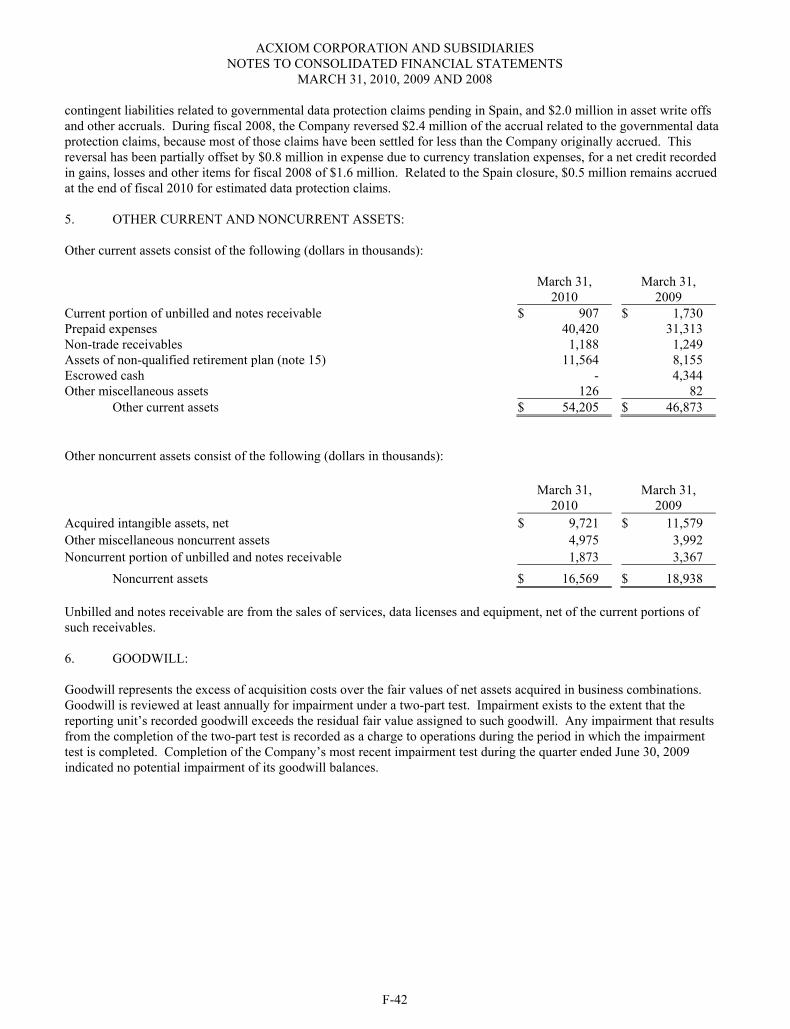
ACXIOM CORPORATION AND SUBSIDIARIES NOTES TO CONSOLIDATED FINANCIAL STATEMENTS
MARCH 31, 2010, 2009 AND 2008
F-42
contingent liabilities related to governmental data protection claims pending in Spain, and $2.0 million in asset write offs and other accruals. During fiscal 2008, the Company reversed $2.4 million of the accrual related to the governmental data protection claims, because most of those claims have been settled for less than the Company originally accrued. This reversal has been partially offset by $0.8 million in expense due to currency translation expenses, for a net credit recorded in gains, losses and other items for fiscal 2008 of $1.6 million. Related to the Spain closure, $0.5 million remains accrued at the end of fiscal 2010 for estimated data protection claims.
5. OTHER CURRENT AND NONCURRENT ASSETS:
Other current assets consist of the following (dollars in thousands):
March 31, 2010
March 31, 2009
Current portion of unbilled and notes receivable $ 907 $ 1,730 Prepaid expenses 40,420 31,313 Non-trade receivables 1,188 1,249 Assets of non-qualified retirement plan (note 15) 11,564 8,155 Escrowed cash - 4,344 Other miscellaneous assets 126 82
Other current assets $ 54,205 $ 46,873
Other noncurrent assets consist of the following (dollars in thousands):
Unbilled and notes receivable are from the sales of services, data licenses and equipment, net of the current portions of such receivables.
6. GOODWILL:
Goodwill represents the excess of acquisition costs over the fair values of net assets acquired in business combinations. Goodwill is reviewed at least annually for impairment under a two-part test. Impairment exists to the extent that the reporting unit’s recorded goodwill exceeds the residual fair value assigned to such goodwill. Any impairment that results from the completion of the two-part test is recorded as a charge to operations during the period in which the impairment test is completed. Completion of the Company’s most recent impairment test during the quarter ended June 30, 2009 indicated no potential impairment of its goodwill balances.
March 31, 2010
March 31, 2009
Acquired intangible assets, net $ 9,721 $ 11,579 Other miscellaneous noncurrent assets 4,975 3,992 Noncurrent portion of unbilled and notes receivable 1,873 3,367
Noncurrent assets $ 16,569 $ 18,938
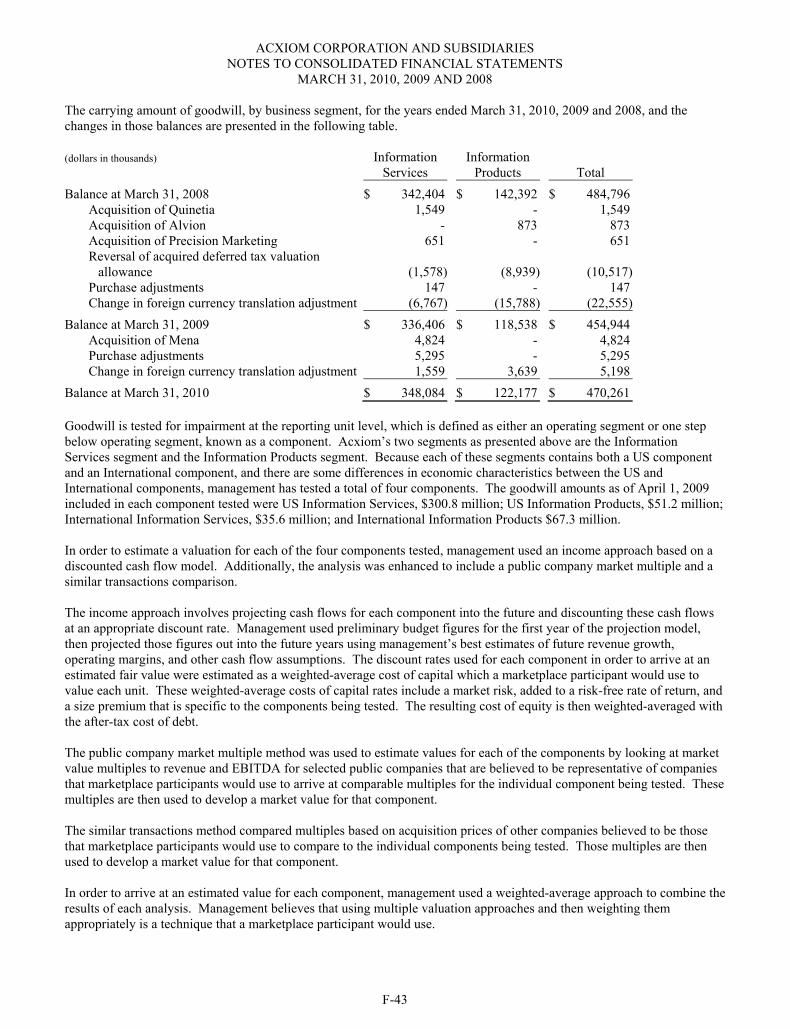
ACXIOM CORPORATION AND SUBSIDIARIES NOTES TO CONSOLIDATED FINANCIAL STATEMENTS
MARCH 31, 2010, 2009 AND 2008
F-43
The carrying amount of goodwill, by business segment, for the years ended March 31, 2010, 2009 and 2008, and the changes in those balances are presented in the following table.
(dollars in thousands) Information Services
Information Products Total
Balance at March 31, 2008 $ 342,404 $ 142,392 $ 484,796 Acquisition of Quinetia 1,549 - 1,549Acquisition of Alvion - 873 873Acquisition of Precision Marketing 651 - 651Reversal of acquired deferred tax valuation
allowance (1,578) (8,939) (10,517)Purchase adjustments 147 - 147Change in foreign currency translation adjustment (6,767) (15,788) (22,555)
Balance at March 31, 2009 $ 336,406 $ 118,538 $ 454,944 Acquisition of Mena 4,824 - 4,824 Purchase adjustments 5,295 - 5,295 Change in foreign currency translation adjustment 1,559 3,639 5,198
Balance at March 31, 2010 $ 348,084 $ 122,177 $ 470,261
Goodwill is tested for impairment at the reporting unit level, which is defined as either an operating segment or one step below operating segment, known as a component. Acxiom’s two segments as presented above are the Information Services segment and the Information Products segment. Because each of these segments contains both a US component and an International component, and there are some differences in economic characteristics between the US and International components, management has tested a total of four components. The goodwill amounts as of April 1, 2009 included in each component tested were US Information Services, $300.8 million; US Information Products, $51.2 million; International Information Services, $35.6 million; and International Information Products $67.3 million.
In order to estimate a valuation for each of the four components tested, management used an income approach based on a discounted cash flow model. Additionally, the analysis was enhanced to include a public company market multiple and a similar transactions comparison.
The income approach involves projecting cash flows for each component into the future and discounting these cash flows at an appropriate discount rate. Management used preliminary budget figures for the first year of the projection model, then projected those figures out into the future years using management’s best estimates of future revenue growth, operating margins, and other cash flow assumptions. The discount rates used for each component in order to arrive at an estimated fair value were estimated as a weighted-average cost of capital which a marketplace participant would use to value each unit. These weighted-average costs of capital rates include a market risk, added to a risk-free rate of return, anda size premium that is specific to the components being tested. The resulting cost of equity is then weighted-averaged with the after-tax cost of debt.
The public company market multiple method was used to estimate values for each of the components by looking at market value multiples to revenue and EBITDA for selected public companies that are believed to be representative of companies that marketplace participants would use to arrive at comparable multiples for the individual component being tested. These multiples are then used to develop a market value for that component.
The similar transactions method compared multiples based on acquisition prices of other companies believed to be those that marketplace participants would use to compare to the individual components being tested. Those multiples are then used to develop a market value for that component.
In order to arrive at an estimated value for each component, management used a weighted-average approach to combine the results of each analysis. Management believes that using multiple valuation approaches and then weighting them appropriately is a technique that a marketplace participant would use.
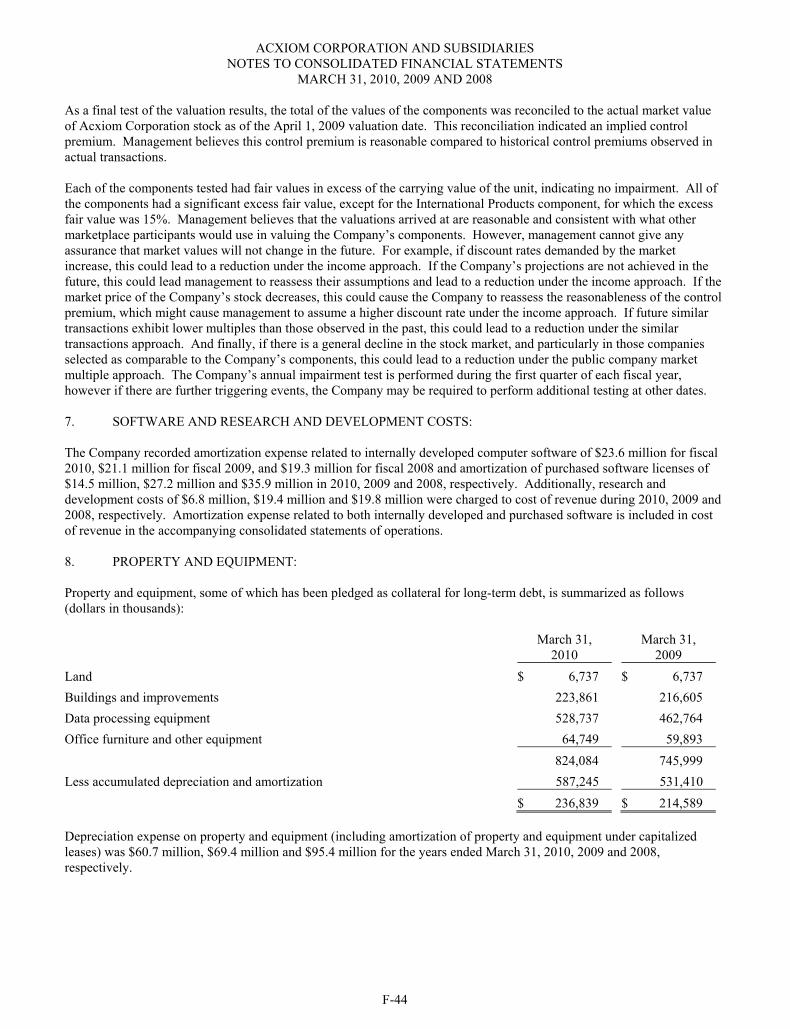
ACXIOM CORPORATION AND SUBSIDIARIES NOTES TO CONSOLIDATED FINANCIAL STATEMENTS
MARCH 31, 2010, 2009 AND 2008
F-44
As a final test of the valuation results, the total of the values of the components was reconciled to the actual market value of Acxiom Corporation stock as of the April 1, 2009 valuation date. This reconciliation indicated an implied control premium. Management believes this control premium is reasonable compared to historical control premiums observed in actual transactions.
Each of the components tested had fair values in excess of the carrying value of the unit, indicating no impairment. All of the components had a significant excess fair value, except for the International Products component, for which the excess fair value was 15%. Management believes that the valuations arrived at are reasonable and consistent with what other marketplace participants would use in valuing the Company’s components. However, management cannot give any assurance that market values will not change in the future. For example, if discount rates demanded by the market increase, this could lead to a reduction under the income approach. If the Company’s projections are not achieved in the future, this could lead management to reassess their assumptions and lead to a reduction under the income approach. If the market price of the Company’s stock decreases, this could cause the Company to reassess the reasonableness of the control premium, which might cause management to assume a higher discount rate under the income approach. If future similar transactions exhibit lower multiples than those observed in the past, this could lead to a reduction under the similar transactions approach. And finally, if there is a general decline in the stock market, and particularly in those companies selected as comparable to the Company’s components, this could lead to a reduction under the public company market multiple approach. The Company’s annual impairment test is performed during the first quarter of each fiscal year, however if there are further triggering events, the Company may be required to perform additional testing at other dates.
7. SOFTWARE AND RESEARCH AND DEVELOPMENT COSTS:
The Company recorded amortization expense related to internally developed computer software of $23.6 million for fiscal 2010, $21.1 million for fiscal 2009, and $19.3 million for fiscal 2008 and amortization of purchased software licenses of $14.5 million, $27.2 million and $35.9 million in 2010, 2009 and 2008, respectively. Additionally, research and development costs of $6.8 million, $19.4 million and $19.8 million were charged to cost of revenue during 2010, 2009 and 2008, respectively. Amortization expense related to both internally developed and purchased software is included in cost of revenue in the accompanying consolidated statements of operations.
8. PROPERTY AND EQUIPMENT:
Property and equipment, some of which has been pledged as collateral for long-term debt, is summarized as follows (dollars in thousands):
March 31, 2010
March 31, 2009
Land $ 6,737 $ 6,737 Buildings and improvements 223,861 216,605 Data processing equipment 528,737 462,764 Office furniture and other equipment 64,749 59,893
824,084 745,999 Less accumulated depreciation and amortization 587,245 531,410
$ 236,839 $ 214,589
Depreciation expense on property and equipment (including amortization of property and equipment under capitalized leases) was $60.7 million, $69.4 million and $95.4 million for the years ended March 31, 2010, 2009 and 2008, respectively.
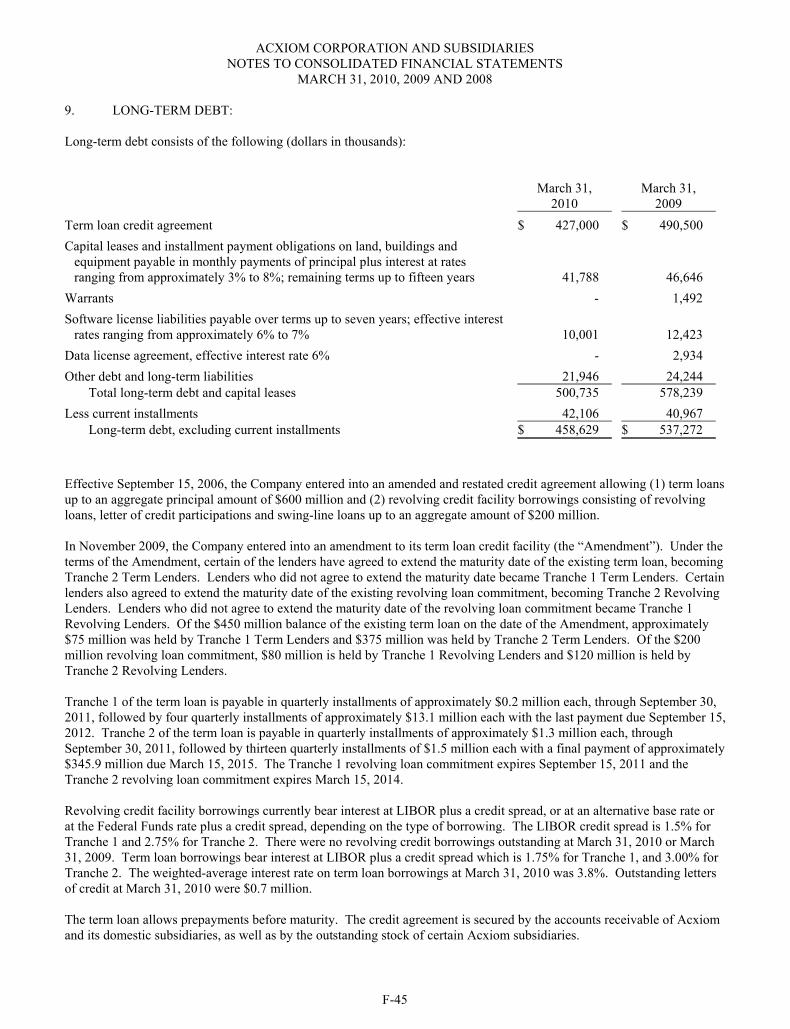
ACXIOM CORPORATION AND SUBSIDIARIES NOTES TO CONSOLIDATED FINANCIAL STATEMENTS
MARCH 31, 2010, 2009 AND 2008
F-45
9. LONG-TERM DEBT:
Long-term debt consists of the following (dollars in thousands):
March 31, 2010
March 31, 2009
Term loan credit agreement $ 427,000 $ 490,500 Capital leases and installment payment obligations on land, buildings and
equipment payable in monthly payments of principal plus interest at rates ranging from approximately 3% to 8%; remaining terms up to fifteen years 41,788 46,646
Warrants - 1,492 Software license liabilities payable over terms up to seven years; effective interest
rates ranging from approximately 6% to 7% 10,001 12,423Data license agreement, effective interest rate 6% - 2,934 Other debt and long-term liabilities 21,946 24,244
Total long-term debt and capital leases 500,735 578,239 Less current installments 42,106 40,967
Long-term debt, excluding current installments $ 458,629 $ 537,272
Effective September 15, 2006, the Company entered into an amended and restated credit agreement allowing (1) term loans up to an aggregate principal amount of $600 million and (2) revolving credit facility borrowings consisting of revolving loans, letter of credit participations and swing-line loans up to an aggregate amount of $200 million.
In November 2009, the Company entered into an amendment to its term loan credit facility (the “Amendment”). Under the terms of the Amendment, certain of the lenders have agreed to extend the maturity date of the existing term loan, becoming Tranche 2 Term Lenders. Lenders who did not agree to extend the maturity date became Tranche 1 Term Lenders. Certain lenders also agreed to extend the maturity date of the existing revolving loan commitment, becoming Tranche 2 Revolving Lenders. Lenders who did not agree to extend the maturity date of the revolving loan commitment became Tranche 1 Revolving Lenders. Of the $450 million balance of the existing term loan on the date of the Amendment, approximately $75 million was held by Tranche 1 Term Lenders and $375 million was held by Tranche 2 Term Lenders. Of the $200 million revolving loan commitment, $80 million is held by Tranche 1 Revolving Lenders and $120 million is held by Tranche 2 Revolving Lenders.
Tranche 1 of the term loan is payable in quarterly installments of approximately $0.2 million each, through September 30, 2011, followed by four quarterly installments of approximately $13.1 million each with the last payment due September 15, 2012. Tranche 2 of the term loan is payable in quarterly installments of approximately $1.3 million each, through September 30, 2011, followed by thirteen quarterly installments of $1.5 million each with a final payment of approximately $345.9 million due March 15, 2015. The Tranche 1 revolving loan commitment expires September 15, 2011 and the Tranche 2 revolving loan commitment expires March 15, 2014.
Revolving credit facility borrowings currently bear interest at LIBOR plus a credit spread, or at an alternative base rate or at the Federal Funds rate plus a credit spread, depending on the type of borrowing. The LIBOR credit spread is 1.5% for Tranche 1 and 2.75% for Tranche 2. There were no revolving credit borrowings outstanding at March 31, 2010 or March 31, 2009. Term loan borrowings bear interest at LIBOR plus a credit spread which is 1.75% for Tranche 1, and 3.00% for Tranche 2. The weighted-average interest rate on term loan borrowings at March 31, 2010 was 3.8%. Outstanding letters of credit at March 31, 2010 were $0.7 million.
The term loan allows prepayments before maturity. The credit agreement is secured by the accounts receivable of Acxiom and its domestic subsidiaries, as well as by the outstanding stock of certain Acxiom subsidiaries.
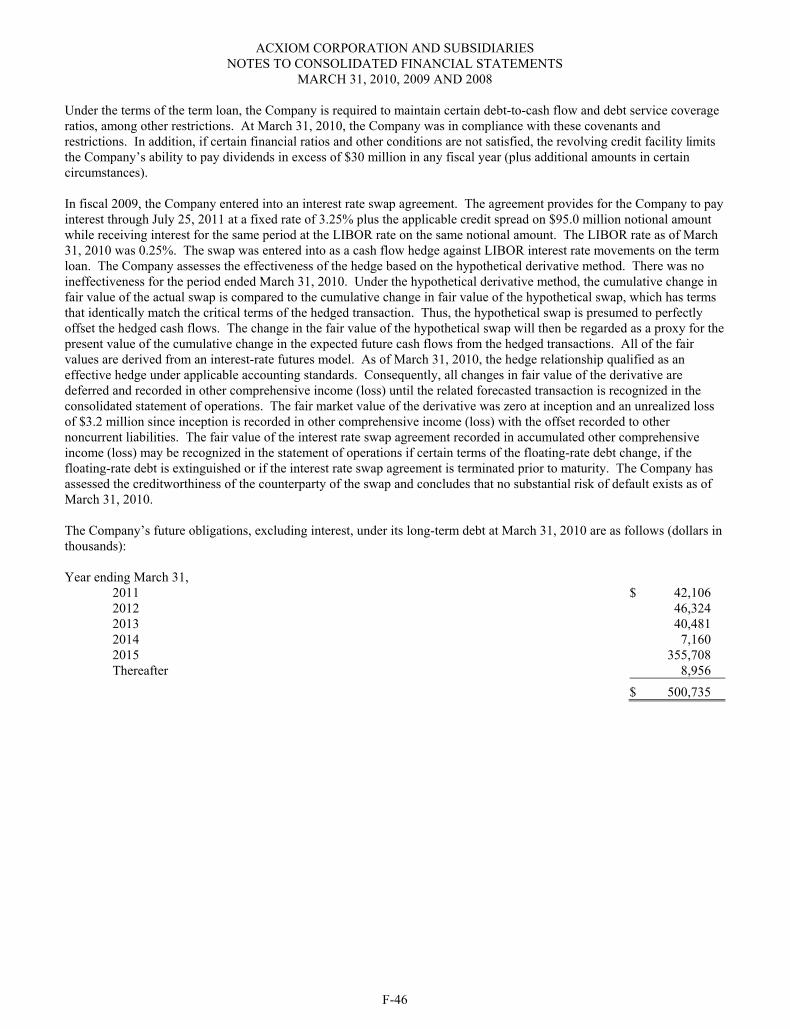
ACXIOM CORPORATION AND SUBSIDIARIES NOTES TO CONSOLIDATED FINANCIAL STATEMENTS
MARCH 31, 2010, 2009 AND 2008
F-46
Under the terms of the term loan, the Company is required to maintain certain debt-to-cash flow and debt service coverage ratios, among other restrictions. At March 31, 2010, the Company was in compliance with these covenants and restrictions. In addition, if certain financial ratios and other conditions are not satisfied, the revolving credit facility limits the Company’s ability to pay dividends in excess of $30 million in any fiscal year (plus additional amounts in certain circumstances).
In fiscal 2009, the Company entered into an interest rate swap agreement. The agreement provides for the Company to pay interest through July 25, 2011 at a fixed rate of 3.25% plus the applicable credit spread on $95.0 million notional amount while receiving interest for the same period at the LIBOR rate on the same notional amount. The LIBOR rate as of March 31, 2010 was 0.25%. The swap was entered into as a cash flow hedge against LIBOR interest rate movements on the term loan. The Company assesses the effectiveness of the hedge based on the hypothetical derivative method. There was no ineffectiveness for the period ended March 31, 2010. Under the hypothetical derivative method, the cumulative change in fair value of the actual swap is compared to the cumulative change in fair value of the hypothetical swap, which has terms that identically match the critical terms of the hedged transaction. Thus, the hypothetical swap is presumed to perfectly offset the hedged cash flows. The change in the fair value of the hypothetical swap will then be regarded as a proxy for the present value of the cumulative change in the expected future cash flows from the hedged transactions. All of the fair values are derived from an interest-rate futures model. As of March 31, 2010, the hedge relationship qualified as an effective hedge under applicable accounting standards. Consequently, all changes in fair value of the derivative are deferred and recorded in other comprehensive income (loss) until the related forecasted transaction is recognized in the consolidated statement of operations. The fair market value of the derivative was zero at inception and an unrealized loss of $3.2 million since inception is recorded in other comprehensive income (loss) with the offset recorded to other noncurrent liabilities. The fair value of the interest rate swap agreement recorded in accumulated other comprehensive income (loss) may be recognized in the statement of operations if certain terms of the floating-rate debt change, if the floating-rate debt is extinguished or if the interest rate swap agreement is terminated prior to maturity. The Company has assessed the creditworthiness of the counterparty of the swap and concludes that no substantial risk of default exists as of March 31, 2010.
The Company’s future obligations, excluding interest, under its long-term debt at March 31, 2010 are as follows (dollars in thousands):
Year ending March 31, 2011 $ 42,106 2012 46,3242013 40,4812014 7,1602015 355,708Thereafter 8,956
$ 500,735
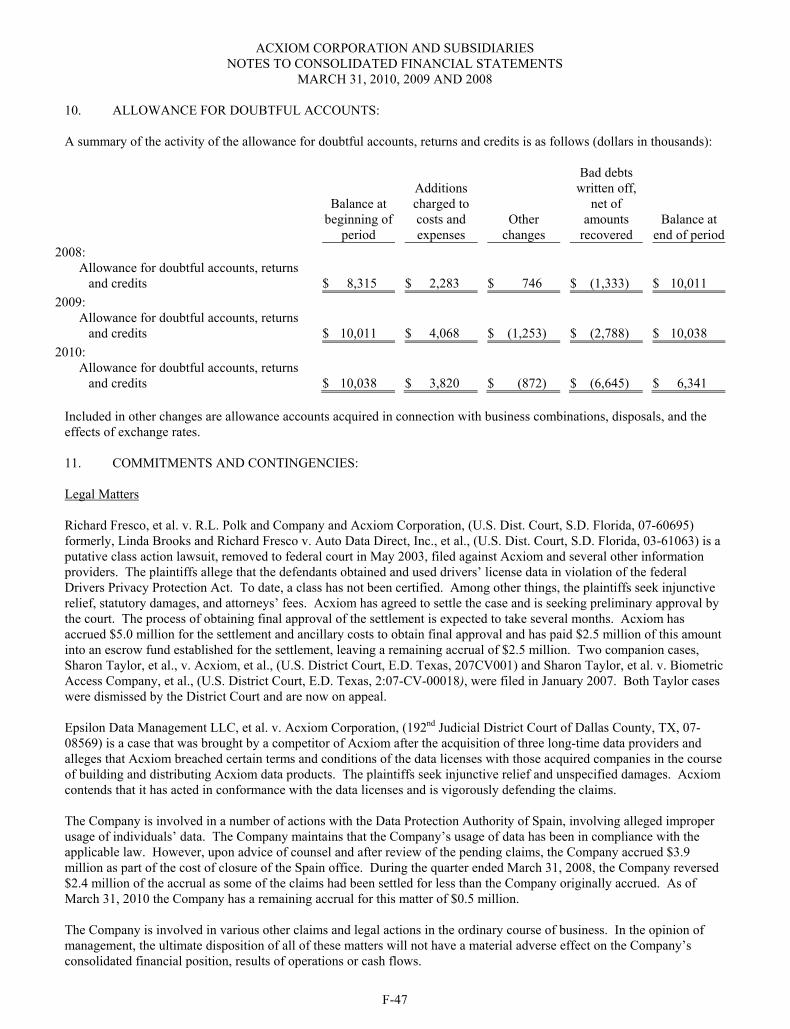
ACXIOM CORPORATION AND SUBSIDIARIES NOTES TO CONSOLIDATED FINANCIAL STATEMENTS
MARCH 31, 2010, 2009 AND 2008
F-47
10. ALLOWANCE FOR DOUBTFUL ACCOUNTS:
A summary of the activity of the allowance for doubtful accounts, returns and credits is as follows (dollars in thousands):
Balance at beginning of
period
Additions charged to costs and expenses
Other changes
Bad debts written off,
net of amounts
recoveredBalance at
end of period2008:
Allowance for doubtful accounts, returns and credits $ 8,315 $ 2,283 $ 746 $ (1,333) $ 10,011
2009: Allowance for doubtful accounts, returns
and credits $ 10,011 $ 4,068 $ (1,253) $ (2,788) $ 10,038 2010:
Allowance for doubtful accounts, returns and credits $ 10,038 $ 3,820 $ (872) $ (6,645) $ 6,341
Included in other changes are allowance accounts acquired in connection with business combinations, disposals, and the effects of exchange rates.
11. COMMITMENTS AND CONTINGENCIES:
Legal Matters
Richard Fresco, et al. v. R.L. Polk and Company and Acxiom Corporation, (U.S. Dist. Court, S.D. Florida, 07-60695) formerly, Linda Brooks and Richard Fresco v. Auto Data Direct, Inc., et al., (U.S. Dist. Court, S.D. Florida, 03-61063) is a putative class action lawsuit, removed to federal court in May 2003, filed against Acxiom and several other information providers. The plaintiffs allege that the defendants obtained and used drivers’ license data in violation of the federal Drivers Privacy Protection Act. To date, a class has not been certified. Among other things, the plaintiffs seek injunctive relief, statutory damages, and attorneys’ fees. Acxiom has agreed to settle the case and is seeking preliminary approval by the court. The process of obtaining final approval of the settlement is expected to take several months. Acxiom has accrued $5.0 million for the settlement and ancillary costs to obtain final approval and has paid $2.5 million of this amount into an escrow fund established for the settlement, leaving a remaining accrual of $2.5 million. Two companion cases, Sharon Taylor, et al., v. Acxiom, et al., (U.S. District Court, E.D. Texas, 207CV001) and Sharon Taylor, et al. v. Biometric Access Company, et al., (U.S. District Court, E.D. Texas, 2:07-CV-00018), were filed in January 2007. Both Taylor cases were dismissed by the District Court and are now on appeal.
Epsilon Data Management LLC, et al. v. Acxiom Corporation, (192nd Judicial District Court of Dallas County, TX, 07-08569) is a case that was brought by a competitor of Acxiom after the acquisition of three long-time data providers and alleges that Acxiom breached certain terms and conditions of the data licenses with those acquired companies in the course of building and distributing Acxiom data products. The plaintiffs seek injunctive relief and unspecified damages. Acxiom contends that it has acted in conformance with the data licenses and is vigorously defending the claims.
The Company is involved in a number of actions with the Data Protection Authority of Spain, involving alleged improper usage of individuals’ data. The Company maintains that the Company’s usage of data has been in compliance with the applicable law. However, upon advice of counsel and after review of the pending claims, the Company accrued $3.9 million as part of the cost of closure of the Spain office. During the quarter ended March 31, 2008, the Company reversed $2.4 million of the accrual as some of the claims had been settled for less than the Company originally accrued. As of March 31, 2010 the Company has a remaining accrual for this matter of $0.5 million.
The Company is involved in various other claims and legal actions in the ordinary course of business. In the opinion of management, the ultimate disposition of all of these matters will not have a material adverse effect on the Company’s consolidated financial position, results of operations or cash flows.
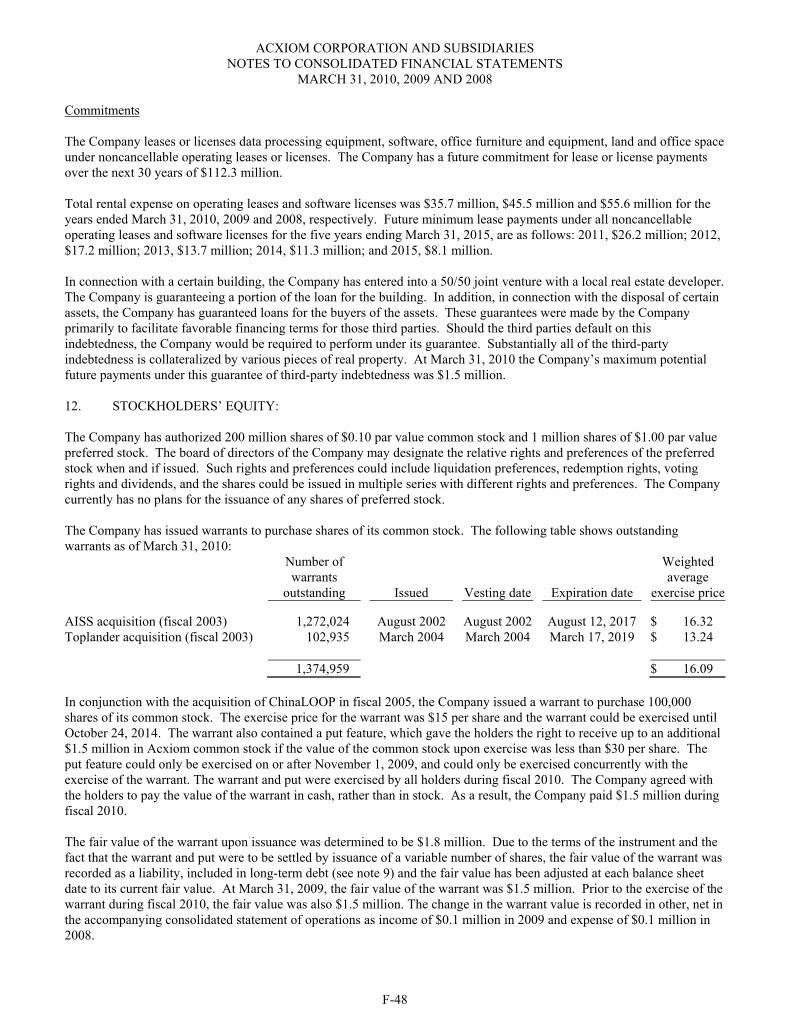
ACXIOM CORPORATION AND SUBSIDIARIES NOTES TO CONSOLIDATED FINANCIAL STATEMENTS
MARCH 31, 2010, 2009 AND 2008
F-48
Commitments
The Company leases or licenses data processing equipment, software, office furniture and equipment, land and office space under noncancellable operating leases or licenses. The Company has a future commitment for lease or license payments over the next 30 years of $112.3 million.
Total rental expense on operating leases and software licenses was $35.7 million, $45.5 million and $55.6 million for the years ended March 31, 2010, 2009 and 2008, respectively. Future minimum lease payments under all noncancellable operating leases and software licenses for the five years ending March 31, 2015, are as follows: 2011, $26.2 million; 2012, $17.2 million; 2013, $13.7 million; 2014, $11.3 million; and 2015, $8.1 million.
In connection with a certain building, the Company has entered into a 50/50 joint venture with a local real estate developer. The Company is guaranteeing a portion of the loan for the building. In addition, in connection with the disposal of certain assets, the Company has guaranteed loans for the buyers of the assets. These guarantees were made by the Company primarily to facilitate favorable financing terms for those third parties. Should the third parties default on this indebtedness, the Company would be required to perform under its guarantee. Substantially all of the third-party indebtedness is collateralized by various pieces of real property. At March 31, 2010 the Company’s maximum potential future payments under this guarantee of third-party indebtedness was $1.5 million.
12. STOCKHOLDERS’ EQUITY:
The Company has authorized 200 million shares of $0.10 par value common stock and 1 million shares of $1.00 par value preferred stock. The board of directors of the Company may designate the relative rights and preferences of the preferred stock when and if issued. Such rights and preferences could include liquidation preferences, redemption rights, voting rights and dividends, and the shares could be issued in multiple series with different rights and preferences. The Company currently has no plans for the issuance of any shares of preferred stock.
The Company has issued warrants to purchase shares of its common stock. The following table shows outstanding warrants as of March 31, 2010:
Number of warrants
outstanding Issued Vesting date Expiration date
Weighted average
exercise price AISS acquisition (fiscal 2003) 1,272,024 August 2002 August 2002 August 12, 2017 $ 16.32 Toplander acquisition (fiscal 2003) 102,935 March 2004 March 2004 March 17, 2019 $ 13.24
1,374,959 $ 16.09
In conjunction with the acquisition of ChinaLOOP in fiscal 2005, the Company issued a warrant to purchase 100,000 shares of its common stock. The exercise price for the warrant was $15 per share and the warrant could be exercised until October 24, 2014. The warrant also contained a put feature, which gave the holders the right to receive up to an additional $1.5 million in Acxiom common stock if the value of the common stock upon exercise was less than $30 per share. The put feature could only be exercised on or after November 1, 2009, and could only be exercised concurrently with the exercise of the warrant. The warrant and put were exercised by all holders during fiscal 2010. The Company agreed with the holders to pay the value of the warrant in cash, rather than in stock. As a result, the Company paid $1.5 million during fiscal 2010.
The fair value of the warrant upon issuance was determined to be $1.8 million. Due to the terms of the instrument and the fact that the warrant and put were to be settled by issuance of a variable number of shares, the fair value of the warrant was recorded as a liability, included in long-term debt (see note 9) and the fair value has been adjusted at each balance sheet date to its current fair value. At March 31, 2009, the fair value of the warrant was $1.5 million. Prior to the exercise of thewarrant during fiscal 2010, the fair value was also $1.5 million. The change in the warrant value is recorded in other, net in the accompanying consolidated statement of operations as income of $0.1 million in 2009 and expense of $0.1 million in 2008.
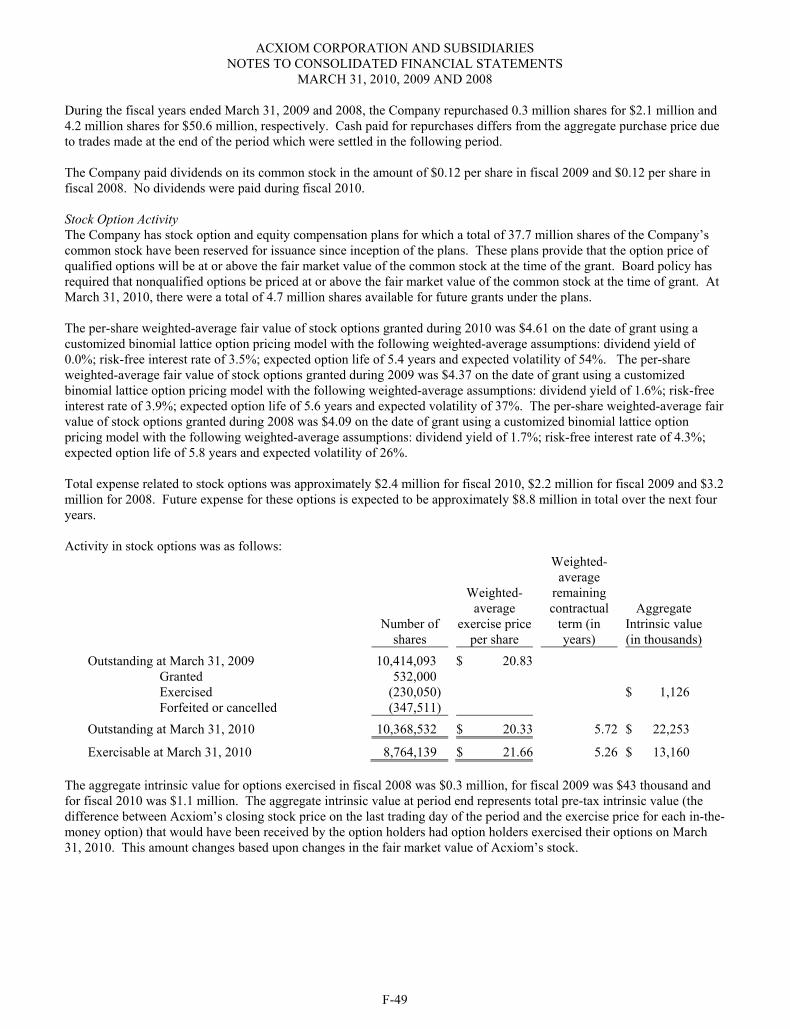
ACXIOM CORPORATION AND SUBSIDIARIES NOTES TO CONSOLIDATED FINANCIAL STATEMENTS
MARCH 31, 2010, 2009 AND 2008
F-49
During the fiscal years ended March 31, 2009 and 2008, the Company repurchased 0.3 million shares for $2.1 million and 4.2 million shares for $50.6 million, respectively. Cash paid for repurchases differs from the aggregate purchase price due to trades made at the end of the period which were settled in the following period.
The Company paid dividends on its common stock in the amount of $0.12 per share in fiscal 2009 and $0.12 per share in fiscal 2008. No dividends were paid during fiscal 2010.
Stock Option Activity The Company has stock option and equity compensation plans for which a total of 37.7 million shares of the Company’s common stock have been reserved for issuance since inception of the plans. These plans provide that the option price of qualified options will be at or above the fair market value of the common stock at the time of the grant. Board policy has required that nonqualified options be priced at or above the fair market value of the common stock at the time of grant. At March 31, 2010, there were a total of 4.7 million shares available for future grants under the plans.
The per-share weighted-average fair value of stock options granted during 2010 was $4.61 on the date of grant using a customized binomial lattice option pricing model with the following weighted-average assumptions: dividend yield of 0.0%; risk-free interest rate of 3.5%; expected option life of 5.4 years and expected volatility of 54%. The per-share weighted-average fair value of stock options granted during 2009 was $4.37 on the date of grant using a customized binomial lattice option pricing model with the following weighted-average assumptions: dividend yield of 1.6%; risk-free interest rate of 3.9%; expected option life of 5.6 years and expected volatility of 37%. The per-share weighted-average fair value of stock options granted during 2008 was $4.09 on the date of grant using a customized binomial lattice option pricing model with the following weighted-average assumptions: dividend yield of 1.7%; risk-free interest rate of 4.3%; expected option life of 5.8 years and expected volatility of 26%.
Total expense related to stock options was approximately $2.4 million for fiscal 2010, $2.2 million for fiscal 2009 and $3.2million for 2008. Future expense for these options is expected to be approximately $8.8 million in total over the next four years.
Activity in stock options was as follows:
Number of shares
Weighted-average
exercise price per share
Weighted-average
remaining contractual
term (in years)
AggregateIntrinsic value (in thousands)
Outstanding at March 31, 2009 10,414,093 $ 20.83Granted 532,000 Exercised (230,050) $ 1,126 Forfeited or cancelled (347,511)
Outstanding at March 31, 2010 10,368,532 $ 20.33 5.72 $ 22,253
Exercisable at March 31, 2010 8,764,139 $ 21.66 5.26 $ 13,160
The aggregate intrinsic value for options exercised in fiscal 2008 was $0.3 million, for fiscal 2009 was $43 thousand and for fiscal 2010 was $1.1 million. The aggregate intrinsic value at period end represents total pre-tax intrinsic value (the difference between Acxiom’s closing stock price on the last trading day of the period and the exercise price for each in-the-money option) that would have been received by the option holders had option holders exercised their options on March 31, 2010. This amount changes based upon changes in the fair market value of Acxiom’s stock.
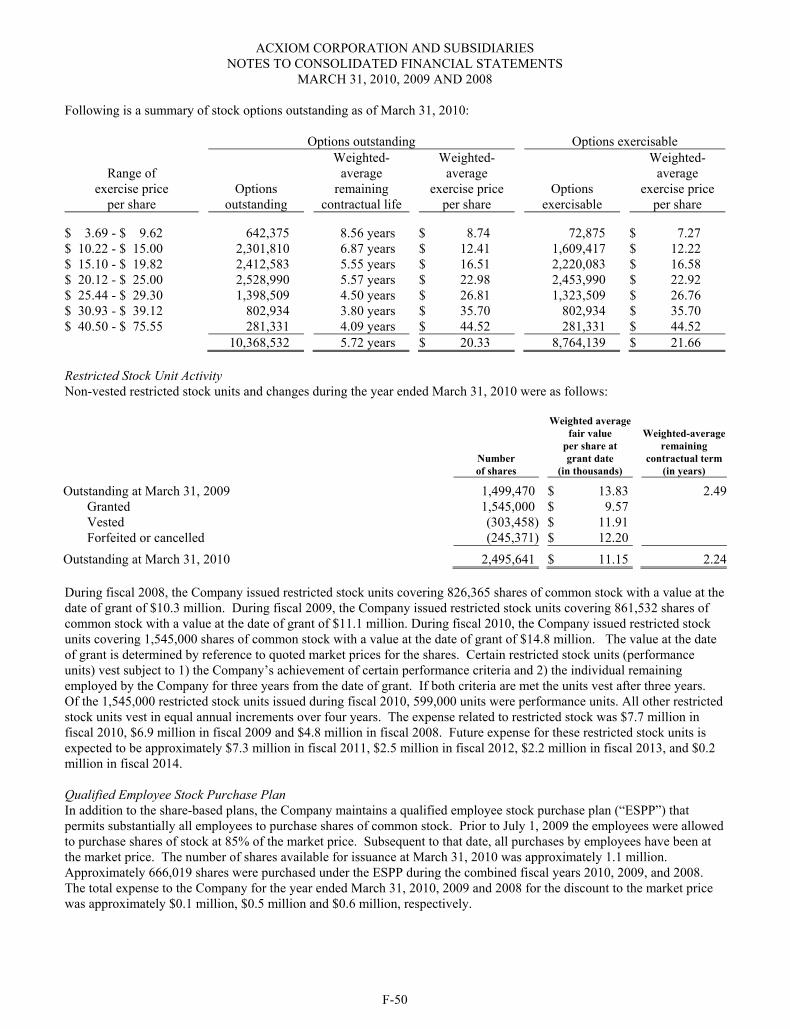
ACXIOM CORPORATION AND SUBSIDIARIES NOTES TO CONSOLIDATED FINANCIAL STATEMENTS
MARCH 31, 2010, 2009 AND 2008
F-50
Following is a summary of stock options outstanding as of March 31, 2010:
Options outstanding Options exercisable
Range of exercise price
per share Options
outstanding
Weighted- average
remaining contractual life
Weighted-average
exercise priceper share
Options exercisable
Weighted-average
exercise priceper share
$ 3.69 - $ 9.62 642,375 8.56 years $ 8.74 72,875 $ 7.27 $ 10.22 - $ 15.00 2,301,810 6.87 years $ 12.41 1,609,417 $ 12.22 $ 15.10 - $ 19.82 2,412,583 5.55 years $ 16.51 2,220,083 $ 16.58 $ 20.12 - $ 25.00 2,528,990 5.57 years $ 22.98 2,453,990 $ 22.92 $ 25.44 - $ 29.30 1,398,509 4.50 years $ 26.81 1,323,509 $ 26.76 $ 30.93 - $ 39.12 802,934 3.80 years $ 35.70 802,934 $ 35.70 $ 40.50 - $ 75.55 281,331 4.09 years $ 44.52 281,331 $ 44.52 10,368,532 5.72 years $ 20.33 8,764,139 $ 21.66
Restricted Stock Unit Activity Non-vested restricted stock units and changes during the year ended March 31, 2010 were as follows:
Number of shares
Weighted average fair value
per share atgrant date
(in thousands)
Weighted-average remaining
contractual term (in years)
Outstanding at March 31, 2009 1,499,470 $ 13.83 2.49Granted 1,545,000 $ 9.57 Vested (303,458) $ 11.91 Forfeited or cancelled (245,371) $ 12.20
Outstanding at March 31, 2010 2,495,641 $ 11.15 2.24
During fiscal 2008, the Company issued restricted stock units covering 826,365 shares of common stock with a value at the date of grant of $10.3 million. During fiscal 2009, the Company issued restricted stock units covering 861,532 shares of common stock with a value at the date of grant of $11.1 million. During fiscal 2010, the Company issued restricted stock units covering 1,545,000 shares of common stock with a value at the date of grant of $14.8 million. The value at the date of grant is determined by reference to quoted market prices for the shares. Certain restricted stock units (performance units) vest subject to 1) the Company’s achievement of certain performance criteria and 2) the individual remaining employed by the Company for three years from the date of grant. If both criteria are met the units vest after three years. Of the 1,545,000 restricted stock units issued during fiscal 2010, 599,000 units were performance units. All other restricted stock units vest in equal annual increments over four years. The expense related to restricted stock was $7.7 million in fiscal 2010, $6.9 million in fiscal 2009 and $4.8 million in fiscal 2008. Future expense for these restricted stock units is expected to be approximately $7.3 million in fiscal 2011, $2.5 million in fiscal 2012, $2.2 million in fiscal 2013, and $0.2 million in fiscal 2014.
Qualified Employee Stock Purchase Plan In addition to the share-based plans, the Company maintains a qualified employee stock purchase plan (“ESPP”) that permits substantially all employees to purchase shares of common stock. Prior to July 1, 2009 the employees were allowed to purchase shares of stock at 85% of the market price. Subsequent to that date, all purchases by employees have been at the market price. The number of shares available for issuance at March 31, 2010 was approximately 1.1 million.Approximately 666,019 shares were purchased under the ESPP during the combined fiscal years 2010, 2009, and 2008. The total expense to the Company for the year ended March 31, 2010, 2009 and 2008 for the discount to the market price was approximately $0.1 million, $0.5 million and $0.6 million, respectively.
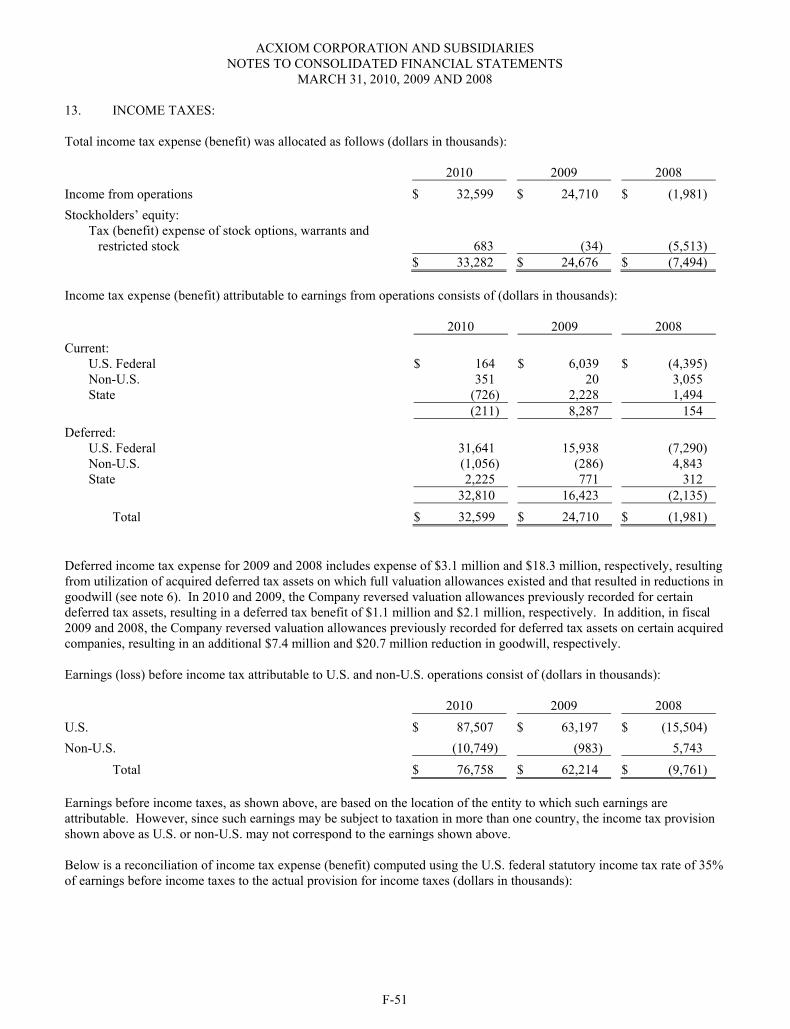
ACXIOM CORPORATION AND SUBSIDIARIES NOTES TO CONSOLIDATED FINANCIAL STATEMENTS
MARCH 31, 2010, 2009 AND 2008
F-51
13. INCOME TAXES:
Total income tax expense (benefit) was allocated as follows (dollars in thousands):
2010 2009 2008 Income from operations $ 32,599 $ 24,710 $ (1,981) Stockholders’ equity:
Tax (benefit) expense of stock options, warrants and restricted stock 683 (34) (5,513)
$ 33,282 $ 24,676 $ (7,494)
Income tax expense (benefit) attributable to earnings from operations consists of (dollars in thousands):
2010 2009 2008 Current:
U.S. Federal $ 164 $ 6,039 $ (4,395) Non-U.S. 351 20 3,055 State (726) 2,228 1,494
(211) 8,287 154 Deferred:
U.S. Federal 31,641 15,938 (7,290) Non-U.S. (1,056) (286) 4,843 State 2,225 771 312
32,810 16,423 (2,135) Total $ 32,599 $ 24,710 $ (1,981)
Deferred income tax expense for 2009 and 2008 includes expense of $3.1 million and $18.3 million, respectively, resulting from utilization of acquired deferred tax assets on which full valuation allowances existed and that resulted in reductions in goodwill (see note 6). In 2010 and 2009, the Company reversed valuation allowances previously recorded for certain deferred tax assets, resulting in a deferred tax benefit of $1.1 million and $2.1 million, respectively. In addition, in fiscal2009 and 2008, the Company reversed valuation allowances previously recorded for deferred tax assets on certain acquired companies, resulting in an additional $7.4 million and $20.7 million reduction in goodwill, respectively.
Earnings (loss) before income tax attributable to U.S. and non-U.S. operations consist of (dollars in thousands):
2010 2009 2008 U.S. $ 87,507 $ 63,197 $ (15,504) Non-U.S. (10,749) (983) 5,743
Total $ 76,758 $ 62,214 $ (9,761)
Earnings before income taxes, as shown above, are based on the location of the entity to which such earnings are attributable. However, since such earnings may be subject to taxation in more than one country, the income tax provision shown above as U.S. or non-U.S. may not correspond to the earnings shown above.
Below is a reconciliation of income tax expense (benefit) computed using the U.S. federal statutory income tax rate of 35% of earnings before income taxes to the actual provision for income taxes (dollars in thousands):
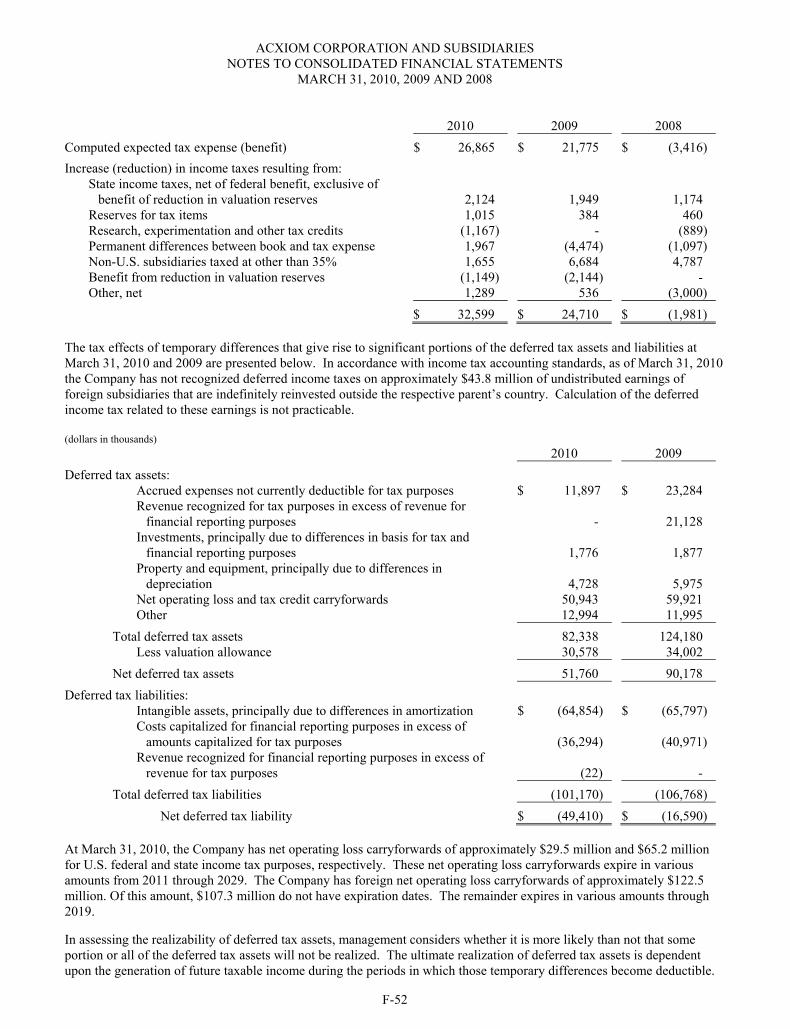
ACXIOM CORPORATION AND SUBSIDIARIES NOTES TO CONSOLIDATED FINANCIAL STATEMENTS
MARCH 31, 2010, 2009 AND 2008
F-52
2010 2009 2008 Computed expected tax expense (benefit) $ 26,865 $ 21,775 $ (3,416) Increase (reduction) in income taxes resulting from:
State income taxes, net of federal benefit, exclusive of benefit of reduction in valuation reserves 2,124 1,949 1,174
Reserves for tax items 1,015 384 460 Research, experimentation and other tax credits (1,167) - (889) Permanent differences between book and tax expense 1,967 (4,474) (1,097) Non-U.S. subsidiaries taxed at other than 35% 1,655 6,684 4,787 Benefit from reduction in valuation reserves (1,149) (2,144) - Other, net 1,289 536 (3,000)
$ 32,599 $ 24,710 $ (1,981)
The tax effects of temporary differences that give rise to significant portions of the deferred tax assets and liabilities at March 31, 2010 and 2009 are presented below. In accordance with income tax accounting standards, as of March 31, 2010 the Company has not recognized deferred income taxes on approximately $43.8 million of undistributed earnings of foreign subsidiaries that are indefinitely reinvested outside the respective parent’s country. Calculation of the deferred income tax related to these earnings is not practicable.
(dollars in thousands) 2010 2009
Deferred tax assets: Accrued expenses not currently deductible for tax purposes $ 11,897 $ 23,284 Revenue recognized for tax purposes in excess of revenue for
financial reporting purposes - 21,128 Investments, principally due to differences in basis for tax and
financial reporting purposes 1,776 1,877 Property and equipment, principally due to differences in
depreciation 4,728 5,975 Net operating loss and tax credit carryforwards 50,943 59,921 Other 12,994 11,995
Total deferred tax assets 82,338 124,180 Less valuation allowance 30,578 34,002
Net deferred tax assets 51,760 90,178 Deferred tax liabilities:
Intangible assets, principally due to differences in amortization $ (64,854) $ (65,797) Costs capitalized for financial reporting purposes in excess of
amounts capitalized for tax purposes (36,294) (40,971) Revenue recognized for financial reporting purposes in excess of
revenue for tax purposes (22) - Total deferred tax liabilities (101,170) (106,768)
Net deferred tax liability $ (49,410) $ (16,590)
At March 31, 2010, the Company has net operating loss carryforwards of approximately $29.5 million and $65.2 million for U.S. federal and state income tax purposes, respectively. These net operating loss carryforwards expire in various amounts from 2011 through 2029. The Company has foreign net operating loss carryforwards of approximately $122.5 million. Of this amount, $107.3 million do not have expiration dates. The remainder expires in various amounts through 2019.
In assessing the realizability of deferred tax assets, management considers whether it is more likely than not that some portion or all of the deferred tax assets will not be realized. The ultimate realization of deferred tax assets is dependent upon the generation of future taxable income during the periods in which those temporary differences become deductible.
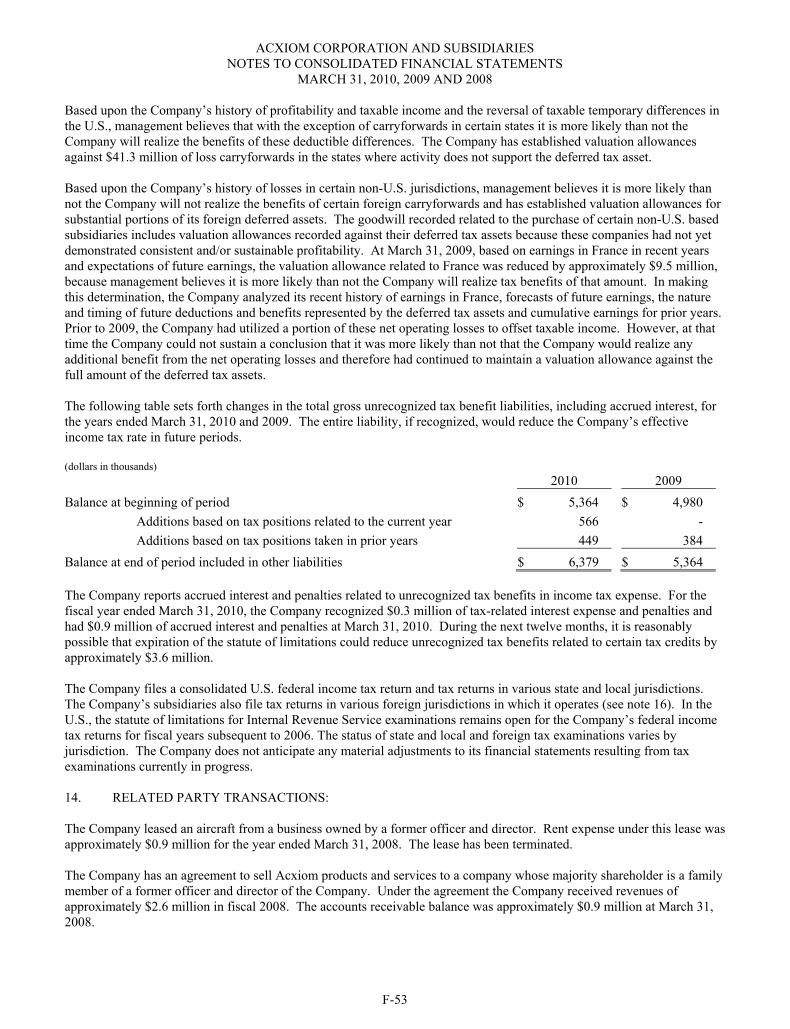
ACXIOM CORPORATION AND SUBSIDIARIES NOTES TO CONSOLIDATED FINANCIAL STATEMENTS
MARCH 31, 2010, 2009 AND 2008
F-53
Based upon the Company’s history of profitability and taxable income and the reversal of taxable temporary differences in the U.S., management believes that with the exception of carryforwards in certain states it is more likely than not the Company will realize the benefits of these deductible differences. The Company has established valuation allowances against $41.3 million of loss carryforwards in the states where activity does not support the deferred tax asset.
Based upon the Company’s history of losses in certain non-U.S. jurisdictions, management believes it is more likely than not the Company will not realize the benefits of certain foreign carryforwards and has established valuation allowances for substantial portions of its foreign deferred assets. The goodwill recorded related to the purchase of certain non-U.S. based subsidiaries includes valuation allowances recorded against their deferred tax assets because these companies had not yet demonstrated consistent and/or sustainable profitability. At March 31, 2009, based on earnings in France in recent years and expectations of future earnings, the valuation allowance related to France was reduced by approximately $9.5 million, because management believes it is more likely than not the Company will realize tax benefits of that amount. In making this determination, the Company analyzed its recent history of earnings in France, forecasts of future earnings, the nature and timing of future deductions and benefits represented by the deferred tax assets and cumulative earnings for prior years. Prior to 2009, the Company had utilized a portion of these net operating losses to offset taxable income. However, at that time the Company could not sustain a conclusion that it was more likely than not that the Company would realize any additional benefit from the net operating losses and therefore had continued to maintain a valuation allowance against the full amount of the deferred tax assets.
The following table sets forth changes in the total gross unrecognized tax benefit liabilities, including accrued interest, forthe years ended March 31, 2010 and 2009. The entire liability, if recognized, would reduce the Company’s effective income tax rate in future periods.
(dollars in thousands) 2010 2009
Balance at beginning of period $ 5,364 $ 4,980 Additions based on tax positions related to the current year 566 - Additions based on tax positions taken in prior years 449 384
Balance at end of period included in other liabilities $ 6,379 $ 5,364
The Company reports accrued interest and penalties related to unrecognized tax benefits in income tax expense. For the fiscal year ended March 31, 2010, the Company recognized $0.3 million of tax-related interest expense and penalties and had $0.9 million of accrued interest and penalties at March 31, 2010. During the next twelve months, it is reasonably possible that expiration of the statute of limitations could reduce unrecognized tax benefits related to certain tax credits byapproximately $3.6 million.
The Company files a consolidated U.S. federal income tax return and tax returns in various state and local jurisdictions. The Company’s subsidiaries also file tax returns in various foreign jurisdictions in which it operates (see note 16). In the U.S., the statute of limitations for Internal Revenue Service examinations remains open for the Company’s federal income tax returns for fiscal years subsequent to 2006. The status of state and local and foreign tax examinations varies by jurisdiction. The Company does not anticipate any material adjustments to its financial statements resulting from tax examinations currently in progress.
14. RELATED PARTY TRANSACTIONS:
The Company leased an aircraft from a business owned by a former officer and director. Rent expense under this lease was approximately $0.9 million for the year ended March 31, 2008. The lease has been terminated.
The Company has an agreement to sell Acxiom products and services to a company whose majority shareholder is a family member of a former officer and director of the Company. Under the agreement the Company received revenues of approximately $2.6 million in fiscal 2008. The accounts receivable balance was approximately $0.9 million at March 31, 2008.
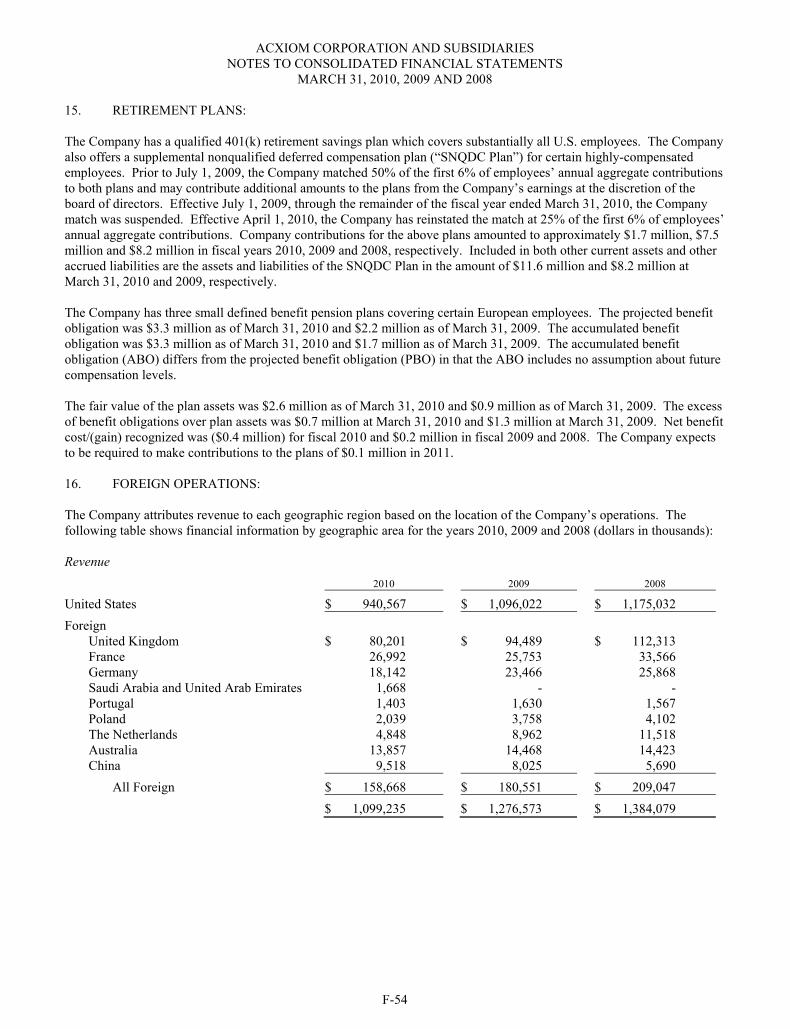
ACXIOM CORPORATION AND SUBSIDIARIES NOTES TO CONSOLIDATED FINANCIAL STATEMENTS
MARCH 31, 2010, 2009 AND 2008
F-54
15. RETIREMENT PLANS:
The Company has a qualified 401(k) retirement savings plan which covers substantially all U.S. employees. The Company also offers a supplemental nonqualified deferred compensation plan (“SNQDC Plan”) for certain highly-compensated employees. Prior to July 1, 2009, the Company matched 50% of the first 6% of employees’ annual aggregate contributions to both plans and may contribute additional amounts to the plans from the Company’s earnings at the discretion of the board of directors. Effective July 1, 2009, through the remainder of the fiscal year ended March 31, 2010, the Company match was suspended. Effective April 1, 2010, the Company has reinstated the match at 25% of the first 6% of employees’ annual aggregate contributions. Company contributions for the above plans amounted to approximately $1.7 million, $7.5 million and $8.2 million in fiscal years 2010, 2009 and 2008, respectively. Included in both other current assets and other accrued liabilities are the assets and liabilities of the SNQDC Plan in the amount of $11.6 million and $8.2 million at March 31, 2010 and 2009, respectively.
The Company has three small defined benefit pension plans covering certain European employees. The projected benefit obligation was $3.3 million as of March 31, 2010 and $2.2 million as of March 31, 2009. The accumulated benefit obligation was $3.3 million as of March 31, 2010 and $1.7 million as of March 31, 2009. The accumulated benefit obligation (ABO) differs from the projected benefit obligation (PBO) in that the ABO includes no assumption about future compensation levels.
The fair value of the plan assets was $2.6 million as of March 31, 2010 and $0.9 million as of March 31, 2009. The excess of benefit obligations over plan assets was $0.7 million at March 31, 2010 and $1.3 million at March 31, 2009. Net benefit cost/(gain) recognized was ($0.4 million) for fiscal 2010 and $0.2 million in fiscal 2009 and 2008. The Company expects to be required to make contributions to the plans of $0.1 million in 2011.
16. FOREIGN OPERATIONS:
The Company attributes revenue to each geographic region based on the location of the Company’s operations. The following table shows financial information by geographic area for the years 2010, 2009 and 2008 (dollars in thousands):
Revenue 2010 2009 2008
United States $ 940,567 $ 1,096,022 $ 1,175,032 Foreign
United Kingdom $ 80,201 $ 94,489 $ 112,313 France 26,992 25,753 33,566Germany 18,142 23,466 25,868Saudi Arabia and United Arab Emirates 1,668 - -Portugal 1,403 1,630 1,567Poland 2,039 3,758 4,102The Netherlands 4,848 8,962 11,518Australia 13,857 14,468 14,423China 9,518 8,025 5,690
All Foreign $ 158,668 $ 180,551 $ 209,047 $ 1,099,235 $ 1,276,573 $ 1,384,079
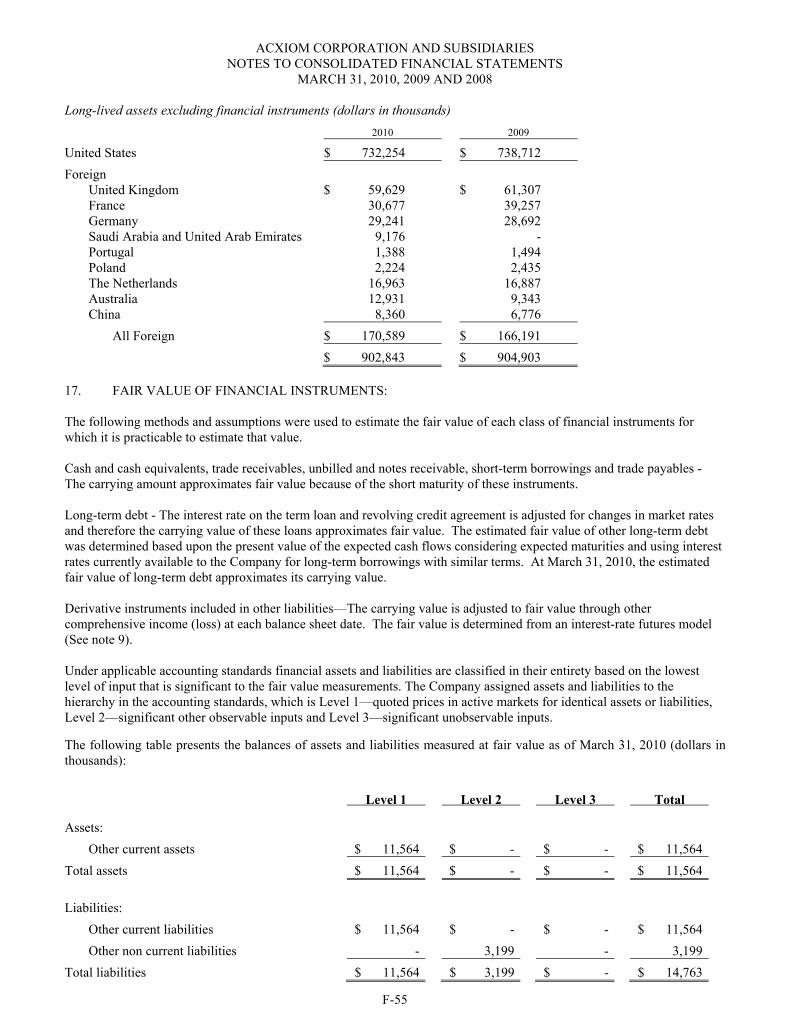
ACXIOM CORPORATION AND SUBSIDIARIES NOTES TO CONSOLIDATED FINANCIAL STATEMENTS
MARCH 31, 2010, 2009 AND 2008
F-55
Long-lived assets excluding financial instruments (dollars in thousands) 2010 2009
United States $ 732,254 $ 738,712 Foreign
United Kingdom $ 59,629 $ 61,307 France 30,677 39,257 Germany 29,241 28,692 Saudi Arabia and United Arab Emirates 9,176 - Portugal 1,388 1,494 Poland 2,224 2,435 The Netherlands 16,963 16,887 Australia 12,931 9,343 China 8,360 6,776
All Foreign $ 170,589 $ 166,191 $ 902,843 $ 904,903
17. FAIR VALUE OF FINANCIAL INSTRUMENTS:
The following methods and assumptions were used to estimate the fair value of each class of financial instruments for which it is practicable to estimate that value.
Cash and cash equivalents, trade receivables, unbilled and notes receivable, short-term borrowings and trade payables - The carrying amount approximates fair value because of the short maturity of these instruments.
Long-term debt - The interest rate on the term loan and revolving credit agreement is adjusted for changes in market rates and therefore the carrying value of these loans approximates fair value. The estimated fair value of other long-term debt was determined based upon the present value of the expected cash flows considering expected maturities and using interest rates currently available to the Company for long-term borrowings with similar terms. At March 31, 2010, the estimated fair value of long-term debt approximates its carrying value.
Derivative instruments included in other liabilities—The carrying value is adjusted to fair value through other comprehensive income (loss) at each balance sheet date. The fair value is determined from an interest-rate futures model (See note 9).
Under applicable accounting standards financial assets and liabilities are classified in their entirety based on the lowest level of input that is significant to the fair value measurements. The Company assigned assets and liabilities to the hierarchy in the accounting standards, which is Level 1—quoted prices in active markets for identical assets or liabilities, Level 2—significant other observable inputs and Level 3—significant unobservable inputs.
The following table presents the balances of assets and liabilities measured at fair value as of March 31, 2010 (dollars in thousands):
Level 1 Level 2 Level 3 Total
Assets: Other current assets $ 11,564 $ - $ - $ 11,564
Total assets $ 11,564 $ - $ - $ 11,564
Liabilities: Other current liabilities $ 11,564 $ - $ - $ 11,564Other non current liabilities - 3,199 - 3,199
Total liabilities $ 11,564 $ 3,199 $ - $ 14,763
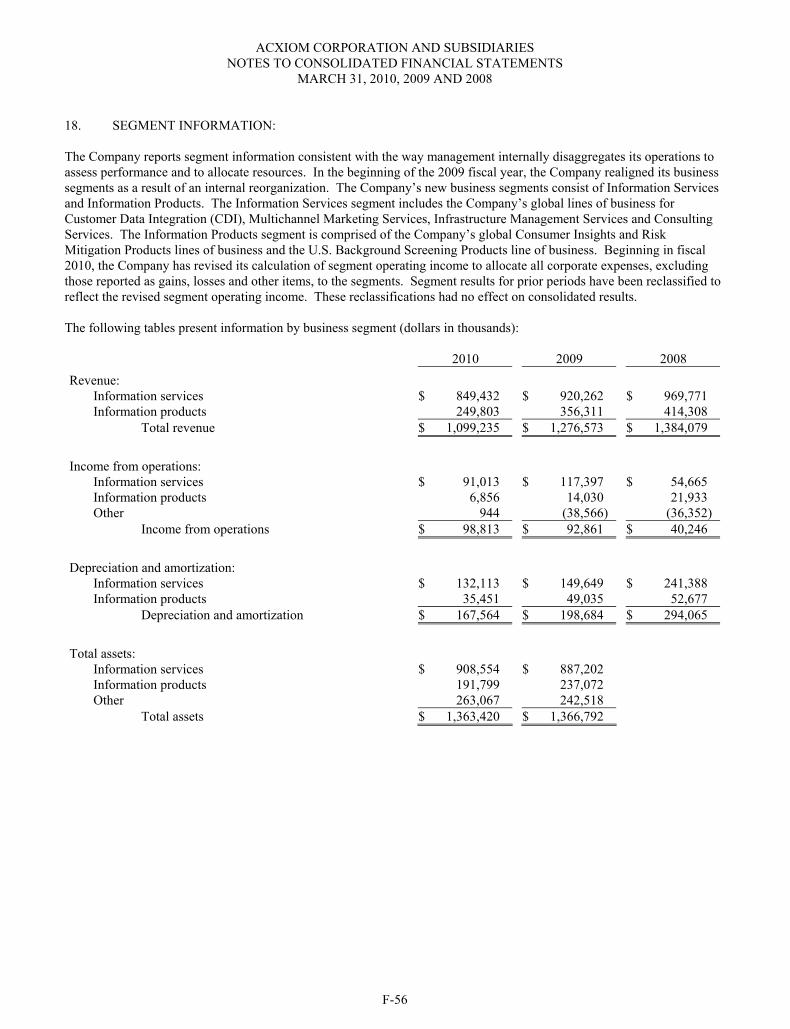
ACXIOM CORPORATION AND SUBSIDIARIES NOTES TO CONSOLIDATED FINANCIAL STATEMENTS
MARCH 31, 2010, 2009 AND 2008
F-56
18. SEGMENT INFORMATION: The Company reports segment information consistent with the way management internally disaggregates its operations to assess performance and to allocate resources. In the beginning of the 2009 fiscal year, the Company realigned its business segments as a result of an internal reorganization. The Company’s new business segments consist of Information Services and Information Products. The Information Services segment includes the Company’s global lines of business for Customer Data Integration (CDI), Multichannel Marketing Services, Infrastructure Management Services and Consulting Services. The Information Products segment is comprised of the Company’s global Consumer Insights and Risk Mitigation Products lines of business and the U.S. Background Screening Products line of business. Beginning in fiscal 2010, the Company has revised its calculation of segment operating income to allocate all corporate expenses, excluding those reported as gains, losses and other items, to the segments. Segment results for prior periods have been reclassified to reflect the revised segment operating income. These reclassifications had no effect on consolidated results. The following tables present information by business segment (dollars in thousands): 2010 2009 2008 Revenue:
Information services $ 849,432 $ 920,262 $ 969,771 Information products 249,803 356,311 414,308
Total revenue $ 1,099,235 $ 1,276,573 $ 1,384,079
Income from operations: Information services $ 91,013 $ 117,397 $ 54,665 Information products 6,856 14,030 21,933 Other 944 (38,566) (36,352)
Income from operations $ 98,813 $ 92,861 $ 40,246
Depreciation and amortization: Information services $ 132,113 $ 149,649 $ 241,388 Information products 35,451 49,035 52,677
Depreciation and amortization $ 167,564 $ 198,684 $ 294,065
Total assets: Information services $ 908,554 $ 887,202 Information products 191,799 237,072 Other 263,067 242,518
Total assets $ 1,363,420 $ 1,366,792
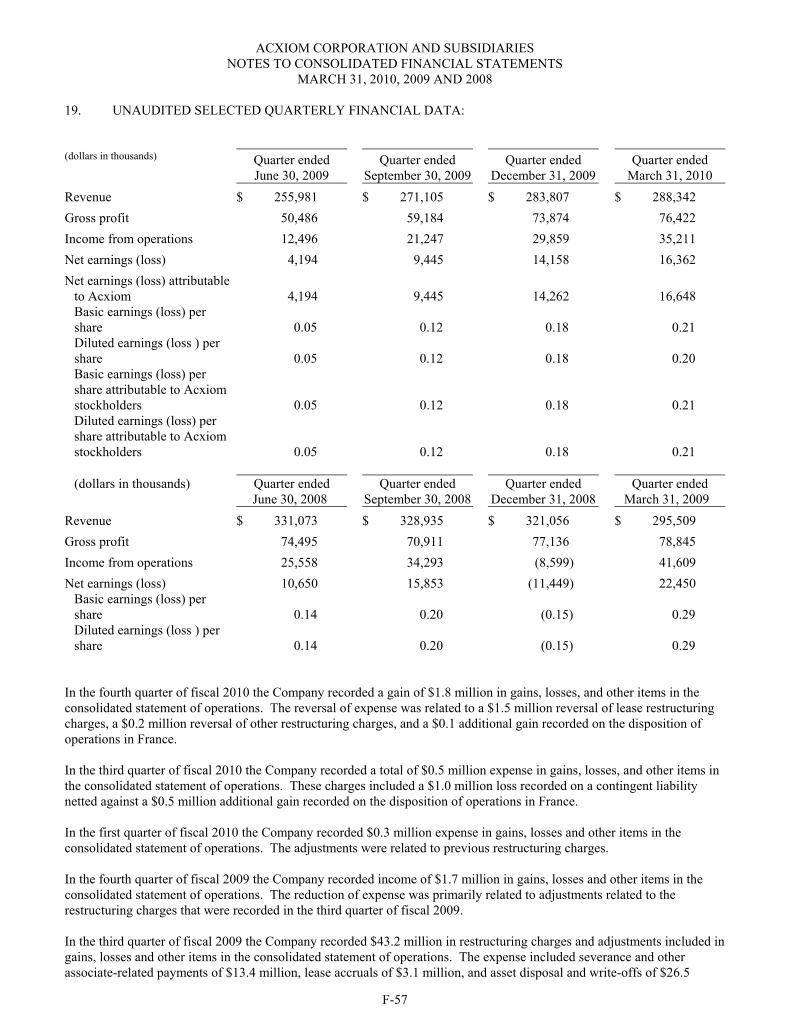
ACXIOM CORPORATION AND SUBSIDIARIES NOTES TO CONSOLIDATED FINANCIAL STATEMENTS
MARCH 31, 2010, 2009 AND 2008
F-57
19. UNAUDITED SELECTED QUARTERLY FINANCIAL DATA:
(dollars in thousands) Quarter endedJune 30, 2009
Quarter ended September 30, 2009
Quarter ended December 31, 2009
Quarter ended March 31, 2010
Revenue $ 255,981 $ 271,105 $ 283,807 $ 288,342 Gross profit 50,486 59,184 73,874 76,422 Income from operations 12,496 21,247 29,859 35,211 Net earnings (loss) 4,194 9,445 14,158 16,362 Net earnings (loss) attributable
to Acxiom 4,194 9,445 14,262 16,648 Basic earnings (loss) per share 0.05 0.12 0.18 0.21 Diluted earnings (loss ) per share 0.05 0.12 0.18 0.20 Basic earnings (loss) per share attributable to Acxiom stockholders 0.05 0.12 0.18 0.21 Diluted earnings (loss) per share attributable to Acxiom stockholders 0.05 0.12 0.18 0.21 (dollars in thousands) Quarter ended
June 30, 2008 Quarter ended
September 30, 2008Quarter ended
December 31, 2008 Quarter ended
March 31, 2009 Revenue $ 331,073 $ 328,935 $ 321,056 $ 295,509 Gross profit 74,495 70,911 77,136 78,845 Income from operations 25,558 34,293 (8,599) 41,609 Net earnings (loss) 10,650 15,853 (11,449) 22,450
Basic earnings (loss) per share 0.14 0.20 (0.15) 0.29 Diluted earnings (loss ) per share 0.14 0.20 (0.15) 0.29
In the fourth quarter of fiscal 2010 the Company recorded a gain of $1.8 million in gains, losses, and other items in the consolidated statement of operations. The reversal of expense was related to a $1.5 million reversal of lease restructuring charges, a $0.2 million reversal of other restructuring charges, and a $0.1 additional gain recorded on the disposition of operations in France.
In the third quarter of fiscal 2010 the Company recorded a total of $0.5 million expense in gains, losses, and other items in the consolidated statement of operations. These charges included a $1.0 million loss recorded on a contingent liability netted against a $0.5 million additional gain recorded on the disposition of operations in France.
In the first quarter of fiscal 2010 the Company recorded $0.3 million expense in gains, losses and other items in the consolidated statement of operations. The adjustments were related to previous restructuring charges.
In the fourth quarter of fiscal 2009 the Company recorded income of $1.7 million in gains, losses and other items in the consolidated statement of operations. The reduction of expense was primarily related to adjustments related to the restructuring charges that were recorded in the third quarter of fiscal 2009.
In the third quarter of fiscal 2009 the Company recorded $43.2 million in restructuring charges and adjustments included in gains, losses and other items in the consolidated statement of operations. The expense included severance and other associate-related payments of $13.4 million, lease accruals of $3.1 million, and asset disposal and write-offs of $26.5

ACXIOM CORPORATION AND SUBSIDIARIES NOTES TO CONSOLIDATED FINANCIAL STATEMENTS
MARCH 31, 2010, 2009 AND 2008
F-58
million. In addition, the Company recorded expense of $1.2 million in adjustments to restructuring charges from the prior year, and a gain of $1.1 million on the disposition of GIS.
In the second quarter of fiscal 2009 the Company recorded $2.4 million of gains in gains, losses and other items in the consolidated statement of operations, including $1.1 million for the sale of a building and $1.3 million in adjustments to restructuring plans and previous disposals.
In the first quarter of fiscal 2009 the Company recorded $0.5 million of net gains in gains, losses and other items consisting of a $1.0 million gain on collection of a previously unrecognized note, and other adjustments to previous restructuring plans and disposals. The Company also recorded a gain of $1.1 million on a joint venture in other, net.

Acxiom CorporationMembers of the Board of Directors
Michael J. Durham - Non-Executive Chairman of the BoardCognizant Associates, Inc.CEO and PresidentDallas, Texas
William T. Dillard IIDillard’s, Inc.Chairman of the Board and CEOLittle Rock, Arkansas
Mary L. Good, Ph.D.University of Arkansas at Little RockDean of Donaghey College of Engineering and Information TechnologyLittle Rock, Arkansas
Jerry D. GramagliaPrivate Investor/AdvisorAtherton, California
Ann Die Hasselmo, Ph.D.American Academic Leadership InstitutePresidentWashington, D.C.
William J. HendersonFormer U.S. Postmaster GeneralLos Gatos, California
Clark M. KokichRazorfi shChairmanSeattle, Washington
Thomas F. (Mack) McLarty, IIIMcLarty AssociatesPresidentWashington, D.C.
John A. MeyerAcxiom CorporationCEO and PresidentLittle Rock, Arkansas
Stephen M. PattersonPatterson EnterprisesPresidentNaples, Florida
Kevin M. TwomeyPrivate InvestorPonte Vedra Beach, Florida
R. Halsey WiseIntergraph CorporationChairman of the Board, CEO and PresidentHuntsville, Alabama
Acxiom Corporation601 E. Third Street • Little Rock, AR • 72201www.acxiom.com or call:
1.888.3ACXIOM
Transfer Agent and RegistrarComputershare Investor Services • 2 North La Salle Street • Chicago, IL • 60602 • 312.499.7033
Acxiom is an equal opportunity and affi rmative action employer and does not discriminate in recruiting, hiring, training,promotion or other employment of associates or the awarding of subcontracts because of a person’s race, color, sex, age,religion, national origin, veteran status, disability, sexual orientation, genetics or other protected status.
AC-0064-10 AR 1M 06/10 © 2
010
Acx
iom
Cor
por
atio
n. A
ll rig
hts
rese
rved
. Acx
iom
is a
reg
iste
red
tra
dem
ark
of A
cxio
m C
orp
orat
ion.
All
othe
r tr
adem
arks
or
serv
ice
mar
ks m
entio
ned
her
ein
are
pro
per
ties
of t
heir
resp
ectiv
e ow
ners
.