![endogeneity 2.ppt [호환 모드]](https://static.fdocuments.in/doc/165x107/61ed282de663cc41923b0a15/endogeneity-2ppt-.jpg)
Dealing with Endogeneity Bias-GMM Method
38
This is a repository copy of Dealing with endogeneity bias: The generalized method of moments (GMM) for panel data. White Rose Research Online URL for this paper: http://eprints.whiterose.ac.uk/124363/ Version: Accepted Version Article: Ullah, S, Akhtar, P and Zaefarian, G orcid.org/0000-0001-5824-8445 (2018) Dealing with endogeneity bias: The generalized method of moments (GMM) for panel data. Industrial Marketing Management, 71. pp. 69-78. ISSN 0019-8501 https://doi.org/10.1016/j.indmarman.2017.11.010 © 2017 Elsevier Inc. This manuscript version is made available under the CC-BY-NC-ND 4.0 license http://creativecommons.org/licenses/by-nc-nd/4.0/ [email protected] https://eprints.whiterose.ac.uk/ Reuse This article is distributed under the terms of the Creative Commons Attribution-NonCommercial-NoDerivs (CC BY-NC-ND) licence. This licence only allows you to download this work and share it with others as long as you credit the authors, but you can’t change the article in any way or use it commercially. More information and the full terms of the licence here: https://creativecommons.org/licenses/ Takedown If you consider content in White Rose Research Online to be in breach of UK law, please notify us by emailing [email protected] including the URL of the record and the reason for the withdrawal request.
Transcript of Dealing with Endogeneity Bias-GMM Method
This is a repository copy of Dealing with endogeneity bias The generalized method of moments (GMM) for panel data
White Rose Research Online URL for this paperhttpeprintswhiteroseacuk124363
Version Accepted Version
Article
Ullah S Akhtar P and Zaefarian G orcidorg0000-0001-5824-8445 (2018) Dealing with endogeneity bias The generalized method of moments (GMM) for panel data Industrial Marketing Management 71 pp 69-78 ISSN 0019-8501
httpsdoiorg101016jindmarman201711010
copy 2017 Elsevier Inc This manuscript version is made available under the CC-BY-NC-ND 40 license httpcreativecommonsorglicensesby-nc-nd40
eprintswhiteroseacukhttpseprintswhiteroseacuk
Reuse
This article is distributed under the terms of the Creative Commons Attribution-NonCommercial-NoDerivs (CC BY-NC-ND) licence This licence only allows you to download this work and share it with others as long as you credit the authors but you canrsquot change the article in any way or use it commercially More information and the full terms of the licence here httpscreativecommonsorglicenses
Takedown
If you consider content in White Rose Research Online to be in breach of UK law please notify us by emailing eprintswhiteroseacuk including the URL of the record and the reason for the withdrawal request
1
Dealing with endogeneity bias The generalized method of moments for panel data
Subhan Ullah Accounting and Finance
Faculty of Business Law and Politics University of Hull United Kingdom
Pervaiz Akhtar
Management Systems Logistics Institute Faculty of Business Law and Politics
University of Hull United Kingdom
IESEG School of Management France
Ghasem Zaefarian
Leeds University Business School University of Leeds
United Kingdom
Corresponding author Dr Subhan Ullah Lecturer in Accounting and Finance Faculty of Business Law and Politics Hull University Business School
Email subhanullahhullacuk
2
Acknowledgement
The authors would like to thank Adam Lindgreen and Anthony Di Benedetto for encouraging
us to write about the topic of how to deal with endogeneity bias in panel data as well as Peter
Naudeacute for his suggestions and help with the manuscript
3
Dealing with endogeneity bias The generalized method of moments for panel data
Abstract
Endogeneity bias can lead to inconsistent estimates and incorrect inferences which may
provide misleading conclusions and inappropriate theoretical interpretations Sometimes such
bias can even lead to coefficients having the wrong sign Although this is a long-standing issue
it is now emerging in marking and management science with high-ranked journals increasingly
exploring the issue In this paper we methodologically demonstrate how to detect and deal
with endogeneity issues in panel data For illustration purposes we used a dataset consisting
of observations over a 15-year period (ie 2002 to 2016) from 101 UK listed companies and
examined the direct effect of RampD expenditures corporate governance and firmsrsquo
characteristics on performance Due to endogeneity bias the result of our analyses indicates
significant differences in findings reported under the ordinary least square (OLS) approach
fixed effects and the generalized method of moments (GMM) estimations We also provide
generic STATA commands that can be utilized by marketing researchers in implementing a
GMM model that better controls for the three sources of endogeneity namely unobserved
heterogeneity simultaneity and dynamic endogeneity
Keyword endogeneity bias generalized method of moments methodological issues
panel data
4
1 Introduction
Endogeneity in regression models refers to the condition in which an explanatory (endogenous
eg research and development expenditure) variable correlates with the error term or if two
error terms correlate when dealing with structural equation modelling Endogeneity bias can
therefore cause inconsistent estimates (ie not tend to be the true value as sample size
increases) which potentially leads to wrong inferences misleading conclusions and incorrect
theoretical interpretations Ketokivi and McIntosh (2017) even stated that researchers might
not get the correct sign of coefficients if endogeneity bias exits Research suggests
approximately 90 of papers published in premier journals have not adequately addressed
endogeneity bias (eg Antonakis Bendahan Jacquart amp Lalive 2010 Hamilton amp Nickerson
2003) Based on a study of over 100 articles in top journals it is claimed that ldquoresearchers fail
to address at least 66 and up to 90 of design and estimation conditions that make causal
claims invalidrdquo (Antonakis et al 2010 p 1086)
Despite recent methodological advances and the relevant literature in econometricspsychology
other social science disciplines (eg marketing operations management international business
and supply chain management) have largely produced inconsistent estimates due to not
addressing endogeneity biases However marketing (eg Journal of Marketing Journal of
Marketing Research and more recently Industrial Marketing Management) and operations
management (eg Journal of Operations Management) journals have started to take it more
seriously and asked authors to fully address endogeneity in their studies (eg Ketokivi amp
McIntosh 2017 Reeb Sakakibara amp Mahmood2012 Zaefarian et al 2017) Researchers are
responding to this call for example the Industrial Marketing Management journal has seen an
increase number of authors addressing endogeneity bias in their studies published in 2017 (a
total of 6 papers to be exact) compared to that of the previous year (only 1 paper) The reviewers
associated with these journals have also played their part in directing researchers to address
5
such methodological complications Nonetheless many researchers in management disciplines
are not yet fully aware of endogeneity its sources and relevant remedies (Antonakis Bendahan
amp Lalive 2014 Guide amp Ketokivi 2015 Zaefarian et al 2017)
Importantly endogeneity bias can have different origins and different methods exist to address
them For example the dynamic generalized method of moments model (GMM) is used to
address panel data (ie dynamic endogeneity bias) and two-stage least squares (2SLS)three-
stage least squares (3SLS) are often used for survey data Some researchers have recently
provided reviews to understand the key endogeneity concepts and relevant techniques (eg see
Zaefarian et al 2017) However a step-by-step procedure on how to execute these techniques
for a particular research problem is still missing We therefore provide a succinct overview of
the key endogeneity sources and solutions and comprehensively demonstrate the GMM
method using a case study of a panel dataset consisting of 15 years of observations Specifically
this study explores how the dynamic nature of investment in RampD expenditures together with
corporate governance affect firm performance To better illustrate how endogeneity bias may
cause incorrect estimates we examine our proposed model using three different approaches
namely ordinary least square (OLS) fixed effects and the generalized method of moments
(GMM) Practically our main aim and contribution is to provide a comprehensive procedure
for researchers to produce consistent estimates and to draw valid inferences when dealing with
panel data
In addition panel data is used far less frequently in business-to-business than in the business-
to-consumer marketing domain and this article could provide a starting point as to how
industrial marketing and management researchers can utilize such datasets to provide insights
for business practitioners For instance the research and development expenditure and its
relationship to firm financial performance in industrial marketing can be explored by using
6
panel datasets that are available from different databases (eg DataStream) unfortunately
researchers are often unaware of such resources)
2 Sources of endogeneity
The error term in endogeneity bias is unobservable so there is no direct way to statistically test
that an endogenous variable is correlated with the error term Also exogenous variables are
probably never exogenous precisely (Ketokivi amp McIntosh 2017) It is therefore almost
impossible to statistically ensure that an endogeneity problem can be completely resolved
(Roberts amp Whited 2012) That is why such dilemmas do not ask for solutions they require
better choices (Ketokivi amp McIntosh 2017) For choices researchers need to understand the
sources of the problem and then take reasonable actions to reduce the negative impact in order
to deal with endogeneity effectively As there are no direct tests for endogeneity the choices
of indirect tests and precautionary measures can help to guide relevant insights and conclusions
(Ketokivi amp McIntosh 2017) Endogeneity encompasses common-method variance
measurement errors omitted variablesselections and simultaneity It is important to address
them theoretically (eg extensively reviewing literature and providing comprehensive research
designs that could help to apply appropriate statistical tools) as well as empirically (eg using
statistical techniques to ensure that data is rigorously investigated) (Antonakis et al 2010
Ketokivi amp McIntosh 2017)
21 Common-method variance and its remedies
Common-method variance (CMV) is related to measurement methods CMV is problematic
due to its interlinks with the sources of measurement errors These sources can come from
common-rater effects (eg only collecting information from similar respondents) common
measurement content (eg time location and a single-medium used to collect data) common-
item context or item characteristics (eg wording length and clarity) scale types respondents
7
response formats and the general content (Malhotra Kim amp Patil 2006 Podsakoff
MacKenzie Lee amp Podsakoff 2003) Research suggests that the difference between the
amounts of variance accounted is 24 when CMV is controlled (ie 35) versus when it is
not controlled (ie 11) Thus CMV can have a substantial effect on the relationships
between measures or constructs (Podsakoff et al 2003)
A series of steps can be taken to minimize the CMV bias Theoretically one can use research
to develop a systematic questionnaire and measures (items) to form the constructs which can
be further refined statistically using exploratory factor analysis and reliability measures It is
good practice to avoid unfamiliar words double-barrelled questions and technical words and
to keep items simple specific and concise The items could be further grouped with different
construct items (ie not in conceptual dimensions) (Tourangeau Rips amp Rasinski 2000)
Some researchers also suggest to avoid adding (many) negatively-worded items because of a
lack of confidence in respondentsrsquo ability to fully understand them as highlighted by
Podsakoff et al (2003) Researchers often have to delete such items because their loadings are
not strong enough to meet the minimum criterion In addition respondents should be informed
of the anonymity of the survey - individuals and companies should not be identified and only
aggregate data used Moreover to avoid a single-informant bias data could be collected from
multiple informants For example a survey data collection may involve multiple management
positions such as chief executive officers managing directors project managers marketing
managers senior operations managers and team leaders (eg Akhtar Tse Khan amp Rao-
Nicholson 2016)
In order to test for CMV researchers commonly use Harmanrsquos one-factor test (Malhotra et al
2006 Podsakoff et al 2003) In this method the analysis produced from multiple factors
(based on eigenvalues greater than 1 and scree plot observations) with reasonable variances is
compared to a single factor solution or other combinations However this test is insensitive
8
and as such it is insufficient test to rule out the potential existence of common method bias
(Podsakoff et al 2003) Although all statistical approaches to control for CMV bias have their
particular advantages and disadvantages (Malhotra et al 2006 Podsakoff et al 2003) it is
also useful to use the marker variable technique (eg the number of languages that respondents
speak as a marker variable) proposed by Lindell and Whitney (2001) which is a good
alternative to assess the CMV bias Additionally the latent factor approach can be used for
assessing CMV (see Malhotra et al 2006) It is a good practice to use these mentioned multiple
remedies to minimize possible concerns This leads to employ different methods and one can
follow a rigorous statistical procedure by using these techniques to deal with CMV
22 Measurement errors
Measurement error is a common problem in marketing management business and other social
science research This is because the constructs of interest cannot be measured perfectly as
researchers can do in natural sciences Consequently the estimates are inconsistent and the
error affects other variables involved (Antonakis et al 2010 Antonakis et al 2014 DeShon
1998)
Although structural equation modelling analysis (eg maximum likelihood estimate) does
correct for the biasing effects of measurement errors (Frone Russell amp Cooper 1994) or
correct for the small amount of measurement errors (DeShon 1998) researchers still need to
control for measurement errors when they use a single indicator approach that is parcelling
using multi-item scales (DeShon 1998) For example if researchers use parcelling (averaging
the relevant items) for environmental and financial (performance) constructs they should be
corrected for the random measurement error by constraining the relevant random error variance
equal to the product of the variance multiply by one minus the reliability The relevant loadings
(ie SD square-root of alpha) for the parcels are also fixed (Antonakis et al 2014 Bollen
9
1989 DeShon 1998) By controlling for the errors besides minor changes in significance
levels researchers can find that the difference between the amounts of variance accounted is
improved when measurement error is controlled versus when it is not controlled This indicates
the importance of correcting measurement errors and following a methodological rigorous
approach
23 Omitted bias and simultaneity
Omitted bias results in various forms (See for details Antonakis et al 2010 Antonakis et al
2014) One possibility of omitted bias can be when researchers test the validity of a construct
without including other important variablesconstructs For instance one measures operational
performance of supply chain partners without including social performance among them In
this regard Anonakis and Dietz (2011) Antonakis et al (2014) and Ketoviki and McIntosh
(2017) all emphasize the comprehensive integration of theories It is also useful to use the
multiple dimensions of constructs which themselves may consist of sub-constructs (eg
service quality and product quality forming operational construct trust in and satisfaction with
supply chain partners representing social construct) built based on extensive theories After
this statistical analysis such as exploratory factor analysis reliability and validity tests can be
applied to further refine them
The problem of simultaneity occurs when two variables simultaneously affectcause each other
and have reciprocal feedback loops (non-recursive models) Though the problem is easy to
understand it is complicated to resolve statistically particularly when a study involves multiple
constructs The problem may be addressed using instrumental variables Zaefarian et al (2017)
provide details of how to use instrumental variables by utilizing two-stage or three stage least
square approaches However finding instrumental variables for a number of constructs is not
easy sometimes even it is impossible (Antonakis et al 2010 Antonakis et al 2014) The
10
fundamental problem for such models in structural models is the identification of the models
due to numerous complications such as not having sufficient data high correlations of
instrumental variables and deficient order and rank conditions (Bentler amp Chou 1987 Martens
amp Haase 2006) It is a good academic practice to acknowledge that alternative models may
exist which are equally possible on logical grounds Researchers should use strong theoretical
arguments to build the directions of hypotheses and models Interested readers may also want
to consult available studies on the topic (eg Bentler amp Chou 1987 Martens amp Haase 2006)
Cumulatively by investigating the datasets in detail and addressing different types of
endogeneity bias from research designs to statistical analysis researchers can provide evidence
that they have made efforts to follow a rigorous theoretical procedure and comprehensively
investigated datasets to comply with psychometric properties and lsquourban legendsrsquo As there is
no hard and fast rule or a yes or no answer for such types of bias and urban rules that is why
some of the lsquourban legendsrsquo (the cut-off criteria) have recently been criticized For example
Lance Butts and Michels (2006) unambiguously debunk the 070 rule for reliability This is
not discussed further here and we recommend readers to consult recent methodological
advances in the area (eg Cortina 2002 Lance 2011 Lance et al 2006)
Returning to the main focus of this study a series of techniques to deal with endogeneity are
succinctly provided by researchers (Guide amp Ketokivi 2015 Ketokivi amp McIntosh 2017
Zaefarian et al 2017) Our purpose is to provide an in-depth step-by-step procedure as to how
the general dynamic generalized method of moments (GMM) model can be used to address
endogeneity in panel data For other types of data and understanding concepts and relevant
techniques (eg cross-sectional and structural equation modelling) researchers can consult
recent studies (eg Ketokivi amp McIntosh 2017 Zaefarian et al 2017) A systematic
procedure for handling endogeneity in panel data is provided in the next section
11
24 GMM models and dealing with endogeneity in panel data
The emergence of GMM models in marketing research when using panel data can resolve some
of unanswered questions raised in the recent literature when discussing econometric techniques
Arellano and Bond (1991) and Blundell and Bond (1998) developed the generalized method of
moments model which can be used for dynamic panel data In dynamic panel data the cause
and effect relationship for underlying phenomena is generally dynamic over time For example
it may not be the current yearrsquos marketing expenses that are affecting performance but rather
the previous yearrsquos expenses that could be playing a significant role
To capture this dynamic panel data estimation techniques use lags of the dependent variables
as explanatory variables Lagged values of the dependent variables are therefore used as
instruments to control this endogenous relationship These instruments are often called
lsquointernal instrumentsrsquo as they are used from the existing econometric model (Roodman 2009)
The GMM model which is generally used for panel data provides consistent results in the
presence of different sources of endogeneity namely ldquounobserved heterogeneity simultaneity
and dynamic endogeneityrdquo (Wintoki Linck amp Netter 2012 p 588) Traditionally researchers
(Schultz et al 2010 Wintoki et al 2012) have used two lags of the dependent variables and
they argue that two lags are sufficient to capture the persistence of the dependent variable (say
for example firm performance)
The GMM model removes endogeneity by ldquointernally transforming the datardquo ndash transformation
refers to a statistical process where a variablersquos past value is subtracted from its present value
(Roodman 2009 p 86) In this way the number of observations is reduced and this process
(internal transformation) enhances the efficiency of the GMM model (Wooldridge 2012)
Furthermore two kinds of transformation methods known as first-difference transformation
(one-step GMM) and second-order transformation (two-step GMM) can also be used as GMM
12
estimators However the first-difference transformation (one-step GMM) has some limitations
For instance if a variablersquos recent value is missing then the first-difference transformation
(where a variablersquos past value is deducted from its current value) could result in the loss of too
many observations (Roodman 2009) To avoid potential data loss owing to the internal
transformation problem with the first-step GMM Arellano and Bover (1995) recommended
the use of a second order transformation (two-step GMM)
The second-order transformation (two-step GMM) applies lsquoforward orthogonal deviationsrsquo
which means that instead of subtracting the previous observations of a variable from its current
value the two-step GMM model subtracts the average of all future available observations of a
particular variable (Roodman 2009 p 86) Using a two-step GMM model researchers can
prevent unnecessary data loss Therefore in the case of a balanced panel dataset a two-step
GMM model provides more efficient and consistent estimates for the involved coefficients
(Arellano and Bover 1995
Following Arellano and Bond (1991) and Blundell and Bond (1998) we use the following
general dynamic generalized method of moments model (GMM)
ititititittiit XnGRDSALESPP 1 (1)
Where Pit denotes firm performance which in our example is measured in terms of return on
assets (ROA) Pit-1 is a one period lag operator (previous year firm performance) RDSALESit
represents our main explanatory variable RampD expenditures Gくit represents corporate
governance variables Xnit represents control variables over the time period it is firm-
specific fixed effects and it represents the error term
In this paper our methodical demonstration and discussion are relating to the impact of RampD
expenditures firm-level governance and financial characteristics on the return on assets (ROA)
13
as an indicator of firmrsquos financial performance The birth of a corporate form of business
organization resulted in a separation of ownership and control (Berle and Means 1932) with
managers having sufficient control in running the day-to-day affairs of an organization It is
unlikely that managers would always act in the best interest of the owners This phenomenon
was first pointed out by Adam Smith in 1776 and was formally presented in the form of agency
theory by Jensen and Meckling (1976) According to Jensen and Meckling (1976) the
opportunistic behavior by managers would cause a conflict of interests between owners and
managers thereby negatively affecting a firmrsquos financial performance Jensen and Meckling
(1976) also suggested that incentive mechanisms (executive compensation) and effective
control (corporate governance) mechanisms are likely to re-align the interests of owners and
managers The board of directors thus play an important role in aligning the interests of owners
and managers
We include a number of firm-level governance (monitoring) mechanisms and incentives paid
to senior directors to test how these mechanisms affect firmsrsquo performance in addition to other
firmsrsquo specific characteristics such assize sales growth and RampD expenditures The literature
uses several proxies for strong internal governance that enhances firmsrsquo performance (Beiner
Drobetz amp Schmid 2006) Some attributes of board of directors that represent strong
governance and monitoring include smaller board size highest percentage of non-executive
directors appropriate executive compensation a highest percentage of gender diversity and a
higher number of board meetings We therefore include these proxy measures to demonstrate
the application of GMM in panel data research
Roodman (2009) presented assumptions that need to be fulfilled when employing GMM
estimations namely (a) some regressors may be endogenously determined (b) the nature of
the relationship is dynamic implying that current performance is affected by previous ones (c)
the idiosyncratic disturbances are uncorrelated across individual (d) some regressors may not
14
necessarily be strictly exogenous and finally (e) the time periods in panel data T may be
small (ie ldquosmall T large Nrdquo) The inclusion of lag performance variables changes the static
nature of this econometric model to a dynamic panel data model Two-step system GMM relies
on internal instruments (lagged values internal transformation) to address the different sources
of endogeneity discussed in the literature review section
3 Method
31 Data and Sample Selection Procedures
Researchers in the Journal of Marketing and Journal of Marketing Research have been using
panel data for many years (see for example McAlister Srinivasan amp Kim 2007 Nierop
Bronnenberg Paap Wedel amp Franses 2010 Ma Ailawadi Gauri amp Grewal 2011 Sridhar
Germann Kang amp Grewal 2016 Han Mittal amp Zhang 2017) while IMM researchers are still
predominantly relying on the use of survey data The emergence of businessfinancial databases
(Bloomberg Datastream Thomson One Compustat) provides more flexibility to marketing
researchers to effectively utilize the marketing and product related data available in these
databases As panel datasets combine the characteristics of cross-sectional and time series data
we believe that the IMM community could benefit from the marketing related data available in
these databases
For example corporate investment and financial data for US and non-US companies can be
collected from Compustat The Thompson Financials Securities Data Corporation (SDC)
database provide detailed information on different types of joint ventures This database
compiles information from different publicly available sources Datastream includes global
data on patents brand value number of consumer controversies directly linked to companiesrsquo
products or services product recall eco-design products energy footprint reduction organic-
product initiatives among others If IMM community could utilize such massive global
15
marketing datasets for listed companies they could capture interesting insights about the on-
going marketing management issues around the world The companies associated with these
databases put enormous efforts in collecting and reporting this data that is largely unexplored
particularly in the context of industrial marketing Furthermore using a panel data approach
researchers can use more observations and panel data has the capability to control for
unobserved heterogeneity mdash a potential source of endogeneity discussed in the literature
To demonstrate a step-by-step and rigorous procedure we first collected the data of UK listed
companies (FTSE ALL Share index) ndash available on the Datastream The data included 15-year
observations ranging from 2002 to 2016 We included corporate governance data in our
analysis although this data is only available from 2002 onwards in Datastream Our final
sample includes data from the 101 UK listed companies after excluding companies which were
subsequently delisted and whose financial data was not available in the database Where
financial data was not available for the sample we collected such data from the alternative
databases (ie Bloomberg) Table 1 shows the industrial classification of our sample firms
The chosen 101 sample firms belong to 25 different industrial sectors with over 1500
observations Table 2 includes the definitions of these variables and relevant codes available
for downloading data from the Datastream which is a powerful database and it allows to
scrutinise patterns generate and test research questions and develop research on market trends
--------------------------------- Insert Table 1 about here
---------------------------------
32 Variables and descriptive statistics
Table 2 includes a list of variables used in this research The explanatory variables are RampD
expenditure corporate governance variables including board size the percentage of
independent non-executive directors the number of board meetings gender diversity CEO-
Chairman duality total senior executive compensation and the percentage of shares owned by
16
the single largestbiggest shareholderowner We included firm-level governance variables as
prior research shows that strong corporate governance (monitoring) have implications on the
performance of firms (Beiner et al 2006) The dependent variable in our model is firm
performance which is measured by return on assets (ROA) We also control for firm-specific
characteristics including debt financing firm size and sales growth
--------------------------------- Insert Table 2 about here
---------------------------------
Table 3 presents descriptive statistics The mean value for our key explanatory variable RampD
expenditure is 4 of sales with a maximum value of 50 of sales This provides the insights
about the level of RampD investment by the UK listed companies The average board size of the
UK listed companies is 907 and the maximum board size is 18 The average value for the
percentage of non-executive directors (NEDs) in the UK companies is 6526 with a
maximum number of 8869 NEDs appointed by the UK companies Except for smaller
companies which are not constituent members of the FTSE 350 index in the UK corporate
regulations in the UK require at least 50 non-executive directors for companies listed on the
London Stock Exchange (See regulation B21 in the Financial Reporting Council 2016 p11)
A higher percentage of external non-executive directors implies strong monitoring at board
levels which could also be observed in corporate financial performance
Number of board meetings is another monitoring mechanism affecting corporate financial
performance The average number of board meetings (NBS) is 9 and the maximum value is 22
As companies are different in their size and structure such variations in the number of board
meetings are expected The mean value for the percentage of women on the corporate boards
of UK listed companies is 9 and the maximum value is 50 This represents gender diversity
that is another governance (monitoring) mechanism having implications for corporate financial
performance In this regard the Lord Davies Report in the UK entitled lsquoImproving the Gender
17
Balance on British Boardsrsquo sets out a 33 women quota for companies listed on the London
Stock Exchange by the end of 2020 (Davies 2011)
The average value for DUAL is 013 suggesting that 13 of the CEOs in UK listed companies
hold the positions of CEO and Chairmanship simultaneously while the regulations require
splitting these role as one person may get too much powerful at the top Hence such dual
positions may negatively affect corporate financial performance The mean value for the
logarithm of total senior executive compensation (TSEC) is 668 and the maximum value is
913 In terms of large shareholdings the mean value for single largest blockholder ownership
(SBO) is 1406 Generally large investors are considered effective monitors compared to
small and dispersed shareholders
On average 23 debt financing activities are carried out by UK companies during the reported
period Debt financing (LEVER) is also a monitoring mechanism as a lender of finance keep
strict surveillance over their investee companies (Beiner et al 2006) and hence we expect its
implications on corporate performance Firm size (SIZE) is measured by the natural logarithm
of total assets and the mean value for the size is 1428 and the maximum value is 1971 The
descriptive statistics indicate that the average sales growth of sample UK companies is 10
for the reporting period of 15 years 2002-2016 Finally the operating performance measure
return on assets (ROA) shows that the mean ROA for the UK companies is 14 and the
maximum value is 50
--------------------------------- Insert Table 3 about here
---------------------------------
4 Steps used in the estimation process (demonstration)
In the following section we use a step-by-step procedure to demonstrate how GMM offers
robust estimates compared to OLS and fixed-effects estimates We first start with OLS analysis
18
and identify endogeneity issues by utilizing Durbin-Wu-Hausman test followed by a fixed-
effects model The procedure then demonstrates that fixed-effects fail to capture dynamic
endogeneity The GMM model finally incorporates lagged-values of the dependent variable
(previous yearrsquos financial performance) Thereby the endogeneity concerns are addressed and
the valid estimates are produced by using a rigorous GMM process
Step1 ndashBasic OLS analysis
Owing to its wide usage in prior research initially an OLS analysis was carried out to examine
the direct effect of our independent variables (ie RampD expenditures corporate governance
and firmsrsquo characteristics) on our dependent variable ROA and the results are reported under
model (1) column in Table 4 However following Schultz et al (2010) and Wintoki et al
(2012) before interpreting the results from OLS regression a test for endogeneity was carried
out to determine whether the results reported under the OLS models are consistent (see Step
2) Our main results in the OLS model shows that RampD has a positive effect on the performance
of firms This finding is consistent with the recent research of Ehie amp Olibe (2010) who
reported a positive relationship between investment in RampD expenditures and the market
valuation of firms for a sample of 26500 firm-years observations for a period of 18 years In
model (1) majority of the governance variables BSIZE TSEC GD and SBO have a positive
impact on the performance of firms which suggests that strong firm-level (internal) corporate
governance mechanisms can improve the performance of firms This is in line with the
assumptions of agency theory that strong firm-level monitoring mechanisms are likely to have
positive implications on corporate performance (Beiner et al 2006)
Step 2ndash Detecting endogeneity bias
The Durbin-Wu-Hausman test is commonly used to detect endogeneity of individual regressors
Theoretically the explanatory variable on the right-hand side should be uncorrelated with the
19
error term and this test determines whether the residuals (error term) are correlated with the
explanatory variable A Durbin-Wu-Hausman test is thus used to detect endogeneity in the
OLS regression For the general understanding of IMM readers we comprehensively
demonstrate the procedures used to test the endogeneity and illustrate it by using an example
of an explanatory variable RDSALES To do that we follow the procedures suggested by
Beiner et al (2006) Schultz et al (2010) and Wintoki et al (2012) The following steps were
implemented to carry out the DurbinndashWundashHausman test
a To test whether an independent variable for example investment in RampD expenditures (eg
RDSALES) is endogenous or exogenous a regression was estimated on each independent
variable with all other independent variables and control variables to predict the relevant
residuals
Example
itititit
itititititititit
SGSIZELEVER
SBOTSECDUALGDNBMNEDsBSIZERDSALES
(2)
In our standard model the dependent variable is ROA (see equation 1itP ) To test for
endogeneityexogeneity of RDSALES variable this variable is now included as a dependent
variable rather than as an exploratory variable This is the first step to conduct Durbin-Wu-
Hausman test
b In the second step the coefficients for the residuals were estimated to test whether the
residuals (error termsit ) are significant The null hypothesis states that investment in RampD
expenditures and corporate governance mechanisms are exogenous implying they are
uncorrelated with the residuals For each individual explanatory variable in the model (eg
RDSALES) we estimated residuals using the generic STATA command lsquopredict new-
20
variable residualsrsquo The residuals for RDSALES were then included in our basic OLS model
which takes the following form
itititit
ititititititititit
SGSIZELEVER
SBOTSECDUALGDNBMNEDsBSIZERDSALESROA
(3)
c A significant test statistic of Durbin-WundashHausman test for an explanatory variable indicates
that the variable is endogenous ndash the explanatory variable is correlated with the residuals (error
term)1
If a single variable in the econometric specification is endogenous obviously researchers need
to implement a superior estimation technique that provides consistent estimates than OLS In
the next step we identify a list of endogenous variables and we discuss the implications of
endogeneity issues and suggest the use of fixed-effects estimation
Step 3 ndash Understanding the nature of endogenous variables
The Durbin-Wu-Hausman test statistics shows that majority variables in Model 1 (eg BSIZE
NEDs DUAL LEVER SIZE SG) are endogenously determined From an econometrics
perspective and theoretically it makes sense that some of the corporate governance
mechanisms and investment in RampD could be endogenously determined For example a firm
with poor performance in one year may change its board size or the percentage of non-
executive directors in the following year (Beiner et al 2006 Schultz et al 2010 Wintoki et
al 2012) Similarly poorly performing firms are likely to take more risks in the following
years (Bromiley 1991) In addition firms with higher market valuations may choose to invest
more in RampD expenditures in subsequent years (Gupta Banerjee amp Onur 2017) Overall the
results from Durbin-Wu Hausman test statistics suggest that endogeneity is a major problem in
1 The procedures to carry out a Durbin-Wu-Hausman test in any version of the STATA is explained at httpswwwstatacomsupportfaqsstatisticsdurbin-wu-hausman-test
21
our OLS model If only one variable is endogenous in a regression model the results reported
from OLS are inconsistent (Beiner et al 2006 Schultz et al 2010 Wintoki et al 2012) This
implies that the results reported from OLS are inconsistent because of the endogeneity issues
Step 4 ndash Applying Fixed-effects estimation
In Model 2 (Table 4) we employ a fixed-effects estimation technique which can potentially
control for unobservable heterogeneity under the assumption of strict exogeneity Strict
endogeneity means that a firmrsquos current governance mechanisms investment in RampD
expenditures (independent variables) are not affected by any changes in a firm past and
present financial performance (eg dependent variable ROA) (Schultz et al 2010 Wintoki
et al 2012)
However in reality this assumption of strict exogeneity is violated because a firmrsquos
pastcurrent performance may affect the currentfuture governance structure of a firm In a
fixed-effects model firm-specific fixed effects are incorporated in the econometric model by
either including a set of firm-specific indicator variables into the regression or by internally
transforming (differencing) to eliminate the time invariant components (Hamilton and
Nickerson 2003) Internal transformation (first-differencing) is a procedure in which each
firmrsquos relative observation in the period t-1 is subtracted from the corresponding observation
in period t for example )( 1 ititit RDSALESRDSALESRDSALES This process eliminates
the time-invariant industry- and firm-level unmeasured variables from the right-hand side of
the regression equation
In qualitative terms fixed effects models help in controlling unobserved heterogeneity which
is lsquoconstantrsquo over time and is also correlated with the explanatory variables This constanttime
invariant component of the model is usually removed from internal transformation A general
example of unobserved time-invariant individual effects is managerial capabilities and firm-
22
level institutional quality which cannot be captured in the econometric specification The time
invariant error term is treated as fixed effects (Gujarati 1999) Furthermore fixed-effects
estimation is a static panel data model which means it does not allow for the lag of the
dependent variables (firm financial performance) to be included as an explanatory variable in
the econometric model (Wooldridge 2012) An ordinary least squares regression model fails
to control for unobserved heterogeneity and the fixed-effects or random-effects models could
potentially overcome this problem However fixed-effects estimation is employed to deal with
endogeneity in circumstances where firm-specific characteristics (time invariant) are correlated
with the explanatory variable (Wintoki et al 2012)
In our example the relationship between our explanatory variables and firm performance is
dynamic mdash past realization of dependent variables (performance) may also affect current year
performance Simultaneity could potentially violate the strict exogeneity assumptions (Schultz
et al 2010) For example in a fixed effect model the relationship between RampD corporate
governance control variables and operating performance of the firms may be determined
simultaneously mdash investment in RampD and governance structure could be determined based on
the expected corporate performance in the same year Consequently traditional fixed-effects
and random-effects panel data static models would provide inconsistent and biased results
(Wooldridge 2012) As a GMM is more robust in dealing with these sources of endogeneity
we carried out a final check with the two-step system GMM An important difference between
fixed-effects and GMM is that fixed-effects estimation uses lsquostrict exogeneityrsquo assumptions
resulting into a static fixed-effects model in the following form
Performance (ROA) = f (RDSALES Corporate governance firm-level characteristics and
fixed effects)2
2 The following generic STATA command can be executed to run a fixed-effects model xtreg depvar indepvars
fe
23
We suggest that an appropriate econometric model should be a ldquodynamicrdquo model of the form
Performance (ROA) = f (Past performancelag ROA RDSALES Corporate governance firm-
level characteristics and fixed effects)
By including lagged values of past performance we differentiated between a lsquodynamicrsquo and a
lsquostaticrsquo panel data model A depiction of the endogenous relationships is also presented in
Figure 1
--------------------------------- Insert Figure 1 about here
---------------------------------
Based on the existing literature about endogeneity Figure 1 indicates how the impact of
investment in RampD expenditure corporate governance characteristics and firm-level
characteristics on the financial performance could be endogenously determined Larger firms
may choose to invest more in RampD expenditures Similarly firms with poor financial
performance (ROA) in one year may also choose different governance arrangements in
subsequent years Furthermore poor financial performance may also affect the
likelihoodpercentage of investment in RampD expenditures Therefore this complex and
dynamic relationship could not be captured through lsquostaticrsquo OLSfixed-effects models In
applying a fixed-effects model time-invariant explanatory variables (eg the industry
classification of a firm) are not included and failing to estimate such time-constant variables
the fixed-effects estimator has been criticized for lsquowastingrsquo very relevant information from the
econometric specification (Owusu-Gyapong 1986)
In the next step we explain how the two-step GMM system could address these endogeneity
concerns
lsquoxtregrsquo fits regression models to panel data lsquoDepvarrsquo indicates the dependent variable (ROA in our case) indepvar represents independent variables and lsquofersquo implies the fixed-effects option
24
Step 5 ndash Two-Step System of GMM and Comparisons
In model 3 (Table 4) we use a dynamic panel data estimation to overcome the endogeneity
issues arising from reverse causality
Our two-step system GMM model is presented in the following equation
ititititit
ititititititititititit
SGSIZELEVER
SBOTSECDUALGDNBMNEDsBSIZERDSALESROAROAROA
21 (4)
The definitions for all explanatory variables are presented in Table 2 1itROA indicates one lag
of the dependent variable ROA (previous year performance) and 2itROA denotes second lag
of the dependent variable representing performance in the year before previous year These
lags are included as explanatory variables in our GMM estimation
The GMM model controls for endogeneity by internally transforming the data and by including
lagged values of the dependent variable In this way the GMM model offers a superior
estimation technique compared to the OLS model In the next step we report a revised analysis
of the governance-performance relationship using a GMM method As the GMM model
control for endogeneity and includes lagged values and applies internal transformation process
the results reported under the GMM could be significantly different than those reported in the
OLS column (Table 4 Model 1) For instance using an OLS approach Schultz et al (2010)
find a significantly negative relationship between executive remuneration and the performance
of Australian firms However after controlling for unobserved heterogeneity simultaneity and
dynamic endogeneity by using the GMM approach Schultz et al (2010) did not find any
significant impact of executive remuneration on the performance of firms
We find that the relationships of RDSALES TSEC and SG with the operating performance of
firms is consistent using OLS fixed-effects and system GMM (no change in significance levels
for all three models ndash see italic-values in Table 4) The impact of the remaining explanatory
25
variables changed significantly (or significant levels changed even some of them turned out to
be significant or insignificant) when we use static panel data model (fixed effects) and dynamic
panel model (GMM) which captured the lagged values of previous two yearsrsquo financial
performance For example with regard to control variable firm size (SIZE) has a negative
relation with ROA in all three models which is consistent with the argument that larger firms
have higher operating costs (Beiner et al 2006) However it showed the changes in the
significance levels (the fixed model shows that it is significant at p = 01 while other two models
show it is significant at p =001) Similarly the variable NEDs showed an insignificant
relationship due to endogeneity in the OLS model in fact it is significantly associated as
demonstrated by the GMM model (with p = 0000213) The Duality (DUAL) shows a
negative relationship in the OLS model but it is positively and significantly associated as
demonstrated by other two models Table 4 shows other similar examples highlighted with
bold text
--------------------------------- Insert Table 4 about here
---------------------------------
In short the GMM controlled for different kinds of endogeneity by including previous financial
performance (lagged values of the dependent variable ROA) as an explanatory variable in the
model The GMM model controlled for the three major sources of endogeneity (i) unobserved
heterogeneity (ii) simultaneity (iii) dynamic endogeneity The emergence of the GMM
technique could be considered as the new methodological development in business research
after it was recently employed by Wintoki et al (2012) in governance research The nature of
the data (panel data) and the dynamic nature of the governance-performance relationship
suggest that a GMM model offers more efficient and consistent estimates for the coefficients
as compared with other estimation techniques
26
When applying the generalized method of moments model researchers need to apply two post-
estimation tests to determine that an appropriate econometric model is applied These tests are
(i) the Sargan test and (ii) the Arellano-Bond test for first-order and second-order correlation
A critical assumption for the validity of GMM estimates requires that instruments are
exogenous In other words the findings from GMM will not be valid if the instruments are
endogenously determined The Sargan test is used to determine whether the econometric model
is valid or not and whether the instruments are correctly specified or not In other words if the
null hypothesis is rejected the researcher needs to reconsider the model or the instruments used
in the estimation process The post-estimation (Sargan test) can be executed in STATA using
estat sargan command Subsequently if the Sargan test turns out to be insignificant it implies
that the instruments included in the econometric specifications are exogenous
To examine the validity of a strong exogeneity assumption the Arellano-Bond test for no auto-
correlation (or no serial correlation) is used under the null hypothesis that the error terms of
two different time periods are uncorrelated In other words it means that the lagged variables
are not correlated with the error term in the governance-performance equation To execute this
post-estimation test in STATA the user needs to employ the estat abond command The values
for these two post-estimation tests are reported in Table 4 which confirms the validity of the
instruments (model) used in our estimation process
5 Implementing GMM in STATA
This study uses STATA software to execute a generalized method of moments (GMM) model
to deal with endogeneity showing how this robust technique can control for different kinds of
endogeneity issues and thus providing unbiased estimates However it may be complicated to
implement in STATA as Roodman (2009) argues that such analysis is complicated and can
easily mislead researchers ldquoImplementing them with a Stata command stuffs them into a black
27
box creating the risk that users not understanding the estimatorsrsquo purpose designs and
limitations will unwittingly misuse itrdquo (Roodman 2009 p 87) This is another reason that our
step-by-step procedure can help researchers to better understand endogeneity sources and
address them accordingly
For implementing the GMM operations in STATA users can apply a number of inbuilt
commands eg xtabond xtdpd and xtdpdsys commands The STATA syntax can be used to
apply the ArellanondashBoverBlundellndashBondrsquos dynamic panel data estimator For a sample dataset
with a dependent variable y and explanatory variables x1 x2 x3 and x4 Roodman (2009)
developed the following xtabond23 STATA codes for dynamic panel data model
xtabond2 y ly x1 x2 x3 x4 gmm(y x1 x2 x3 x4 lag(a b)) noconstant twostep (5)
Lagged values (ly) in the above two step dynamic model are included as regressors These
lagged levels of the dependent variable in the ArellanondashBondrsquos (1991) estimator are used as
instruments to deal with endogeneity Also lag(a b) means the number of lags that researchers
wish to include in the model Owing to the internal transformation process the numbers of
observations are reduced by using the system GMM In Appendix 1 we report generic STATA
commands for implementing GMM in STATA and applying the post-estimation tests
6 Conclusions
Endogeneity bias is an emerging issue in marketing and management science Different sources
of endogeneity in panel data could generate bias and inconsistent estimates We used panel
data for RampD expenditures governance and financial performance of 101 UK listed companies
over a period of 15 years from 2002 to 2016 as an example to empirically demonstrate how
endogeneity can be addressed in panel data using generalized method of moments
3 STATA users can install this command in STATA using the following code ssc install xtabond2
28
We explained step-by-step procedures that can be used to deal with endogeneity bias in panel
data Succinctly OLS regression provides inconsistent results in the presence of any source of
endogeneity bias This is confirmed using Durbin-Wu Hausman test To overcome unobserved
heterogeneity and to capture firm-specific effects we employed the fixed effects estimation
approach which removes unobserved heterogeneity by internally transforming the data This
means that a variable (eg RDSALES) value in previous year is subtracted from its value in
current year RDSALESit = RDSALESit ndash RDSALESit-1
However fixed-effects model is also known as a lsquostatic panel data modelrsquo which implies that
implementing this model does not allow to use lagged values of the dependent variable The
dynamic panel data GMM model further extends the fixed-effects model and in addition to
the internal transformation process the lagged values of the dependent variable are also
included as instruments to control for dynamic endogeneity Thereby we systematically move
from basic OLS estimation to more sophisticated econometric techniques to control the
different sources of endogeneity bias We also provided user-friendly generic STATA
commands that can be used by marketing researchers when they deal with marketing related
panel datasets
Finally we briefly introduced a number of potential databases (Bloomberg Datastream
Thomson One and Compustat) that can be utilized by IMM researchers in extracting recent
marketing related global datasets on advertising expenditures patents brand values number
of consumer controversies directly linked to companiesrsquo products or services product recall
eco-design products energy-footprint reduction and organic-product initiatives While the
quantitative side of the IMM community has predominantly relied on surveys we believe that
these databases would potentially overcome some of the data collection challenges faced by
marketing researchers
29
References
Akhtar P Tse YK Khan Z amp Rao-Nicholson R 2016 Data-driven and adaptive leadership contributing to sustainability Global agri-food supply chains connected with emerging markets International Journal of Production Economics 181(Part B) 392-401
Antonakis J Bendahan S Jacquart P amp Lalive R (2010) On making causal claims A review and recommendations The Leadership Quarterly 21(6) 1086-1120
Antonakis J Bendahan S amp Lalive R (2014) Causality and endogeneity Problems and solutions The Oxford handbook of leadership and organizations
Antonakis J amp Dietz J (2011) More on testing for validity instead of looking for it Personality and Individual Differences 50(3) 418-421
Arellano M amp Bond S (1991) Some tests of specification for panel data Monte Carlo evidence and an application to employment equations Review of Economic Studies 58(2) 277ndash297
Arellano M amp Bover O (1995) Another look at the instrumental variable estimation of error-components models Journal of Econometrics 68(1) 29ndash51
Beiner S Drobetz W Schmid MM amp Zimmermann H (2006) An integrated framework of corporate governance and firm valuation European Financial Management 12(2) 249-283
Berle A A amp Means G C (1932) The Modern Corporation and Private Property New York Macmillan Publishing Co
Bentler P M amp Chou CP (1987) Practical issues in structural modeling Sociological Methods amp Research 16(1) 78-117
Bollen K A (1989) Structural equations with latent variables John Wiley amp Sons
Blundell R amp Bond S (1998) Initial conditions and moment restrictions in dynamic panel data models Journal of Econometrics 87(1) 115ndash143
Bromiley P (1991) Testing a causal model of corporate risk taking and performance Academy of Management Journal 34(1) 37ndash59
Cortina J M (2002) Big things have small beginnings An assortment of ldquominorrdquo methodological misunderstandings Journal of Management 28(3) 339-362
Davies A (2011) Women on boards February 2011 Department for Business Innovations and Skills URL httpswwwgovukgovernmentuploadssystemuploadsattachment_datafile3148011-745-women-on-boardspdf
DeShon R P (1998) A cautionary note on measurement error corrections in structural equation models Psychological Methods 3(4) 412-423
Ehie IC and Olibe K (2010) The effect of RampD investment on firm value An examination of US manufacturing and service industries International Journal of Production Economics 128(1) pp127-135
30
Financial reporting Council (2016) The UK corporate governance code Available at URL httpswwwfrcorgukgetattachmentca7e94c4-b9a9-49e2-a824-ad76a322873cUK-Corporate-Governance-Code-April-2016pdf (accessed 28 September 2017)
Frone M R Russell M amp Cooper M L (1994) Relationship between job and family satisfaction Causal or noncausal covariation Journal of Management 20(3) 565-579
Guide V D R amp Ketokivi M (2015) Notes from the editors Redefining some methodological criteria for the journal Journal of Operations Management (37) v-viii
Gujarati DN (2009) Basic Econometrics Tata McGraw-Hill Education
Gupta K Banerjee R amp Onur I (2017) The effects of RampD and competition on firm value International evidence International Review of Economics amp Finance 51391ndash404
Hamilton B H amp Nickerson J A (2003) Correcting for endogeneity in strategic management research Strategic organization 1(1) 51-78
Han K Mittal V amp Zhang Y (2017) Relative strategic emphasis and firm idiosyncratic risk The moderating role of relative performance and demand instability Journal of Marketing 81(4) 25-44
Jensen M C amp Meckling W H (1976) Theory of the firm Managerial behavior agency costs and ownership structure Journal of Financial Economics 3(4) 305ndash360
Ketokivi M amp McIntosh C N (2017) Addressing the endogeneity dilemma in operations management research Theoretical empirical and pragmatic considerations Journal of Operations Management (52) 1-14
Lance C E (2011) More statistical and methodological myths and urban legends Organizational Research Methods 14(2) 279-286
Lance C E Butts M M amp Michels L C (2006) The sources of four commonly reported cutoff criteria what did they really say Organizational Research Methods 9(2) 202-220
Lindell M K amp Whitney D J (2001) Accounting for common method variance in cross-sectional research designs Journal of Applied Psychology 86(1) 114-121
Ma Y Ailawadi KL Gauri DK amp Grewal D (2011) An empirical investigation of the impact of gasoline prices on grocery shopping behavior Journal of Marketing 75(2) 18-35
Malhotra N K Kim S S amp Patil A (2006) Common method variance in IS research A comparison of alternative approaches and a reanalysis of past research Management Science 52(12) 1865-1883
Martens M P amp Haase R F (2006) Advanced applications of structural equation modeling in counseling psychology research The Counseling Psychologist 34(6) 878-911
McAlister L Srinivasan R and Kim M (2007) Advertising research and development and systematic risk of the firm Journal of Marketing 71(1) 35-48
Nierop VE Bronnenberg B Paap R Wedel M and Franses PH (2010) Retrieving unobserved consideration sets from household panel data Journal of Marketing Research 47(1) 63-74
31
Owusu-Gyapong A (1986) Alternative estimating techniques for panel data on strike activity Review of Economics and Statistics 68(3) 526-531
Podsakoff P M MacKenzie S B Lee J-Y amp Podsakoff N P (2003) Common method biases in behavioral research a critical review of the literature and recommended remedies Journal of Applied Psychology 88(5) 879-903
Reeb D Sakakibara M amp Mahmood I P (2012) From the editors Endogeneity in international business research Journal of International Business Studies 43(3) 211-218
Roberts M R amp Whited T M (2012) Endogeneity in empirical corporate finance SSRN paper Simon School Working Paper No FR 11-29
Roodman D (2009) How to do xtabond2 An introduction to difference and system GMM in Stata The Stata Journal Vol 9 No 1 pp 86ndash136
Schultz E L Tan D T amp Walsh K D (2010) Endogeneity and the corporate governance-performance relation Australian Journal of Management 35(2) 145ndash163
Sridhar S Germann F Kang C amp Grewal R (2016) Relating online regional and national advertising to firm value Journal of Marketing 80(4) 39-55
Tourangeau R Rips L J amp Rasinski K (2000) The psychology of survey response Cambridge University Press
Wintoki M B Linck J S amp Netter J M (2012) Endogeneity and the dynamics of internal corporate governance Journal of Financial Economics (105)3 581ndash606
Wooldridge JM (2012) Introductory Econometrics A Modern Approach (Boston Cengage Learning)
Zaefarian G Kadile V Henneberg S C amp Leischnig A (2017) Endogeneity bias in marketing research Problems causes and remedies Industrial Marketing Management (65) 39-46
32
Figure1 Conceptual framework
33
Table 1 Industrial Classification Name of industry No of companies
Aerospace 4
Auto Parts 1
Biotechnology 2
Beverages 4
Business Support System 7
Utilities 6
Containers and Packages 3
Defense 4
Industrial PartsMachinery 9
ElectricalElectronic Equipment 8
Exploration and Production 1
Telecommunications 5
Food Products 8
Mining 4
Construction 6
Oil and Gas 3
Media 2
Pharmaceuticals 6
Household products 4
Paper 1
Software 5
Chemicals 5
Retailors 1
Tobacco 1
Transport Services 1
Total 101
34
Table 2 Definitions of variables Variable name Definition
Dtatastream Codes
RampD Expenditures (RDSALES) Research and development expenditures divided by sales 119104
Governance Variables Board size (BSIZE) The total number of board members at the end of the fiscal year CGBSDP060
Non-executive directors (NEDs) Percentage of non-executive board members CGBSO06V
Number of board meetings (NBM) The number of board meetings during the year CGBFDP024
Gender diversity (GD) Percentage of women on the board of directors CGBSO17V
Duality (DUAL) 1 if chairman and CEO are the same person 0 otherwise CGBSO09V
Total senior executivesrsquo compensation (TSEC) Logarithm of the total compensation paid to all senior executives (if total aggregate is reported by the company)
CGCPDP054
Single largestbiggest shareholderowner (SBO) The percentage ownership of the single largestbiggest owner (by voting power) having shares ownership ge 3
CGSRDP045
Firm-specific CharacteristicsControl
Debt financing (LEVER) A firms total debt divided by its total assets WC03255DWTA
Firm size (SIZE) Natural l logarithm of a firms total assets at the end of a financial year DWTA
Sales growth (SG) Current years sales minus previous years sales divided by previous years sales
104-104104
Operating performance-Dependent variable Return on assets (ROA) Operating income divided by total assets at the end of a financial year WC01250DWTA
35
Table 3 Descriptive Statistics Variable Observations Mean Standard deviation Min Max
RDSALES 1515 004 008 000 050
BSIZE 1515 907 250 500 1800
NEDs 1515 6526 999 2222 8869
NBM 1515 875 251 200 2600
GD 1514 918 1046 000 5000
DUAL 1515 013 034 000 100
TSEC 1515 668 045 344 913
SBO 1027 1406 1144 300 7230
LEVER 1515 023 017 000 089
SIZE 1515 1428 188 893 1971
SG 1515 010 039 -089 486
ROA 1513 014 010 -022 050
36
Table 4 Empirical Results Reported for OLS Fixed-effects and System GMM
Standard errors in parentheses plt001 plt005 plt01
Model(1) Model(2) Model(3) VARIABLES OLS Fixed effects System GMM LROA 0594 (00176) L2ROA 00706 (00130) RDSALES BSIZE
0376 (00413) 000636
0140 (00529) -000263
0193 (00302) 0000626
(000182) (000137) (0000341) NEDs 0000355 0000444 0000213 (0000312) (0000236) (456e-05) DUAL -000884 00165 000891 (000928) (000760) (000340) TSEC 00650 00331 00325 (000963) (000617) (000394) LEVER 0137 -00364 -000839 (00191) (00187) (000769) NBM -000263 -000127 -000154 (000106) (0000710) (0000161) GD 000108 0000341 -0000121 (0000313) (0000215) (762e-05) SBO 0000606 -000144 0000816 (0000270) (0000346) (0000109) SIZE -00163 -000855 -000676 (000306) (000480) (000171) SG 00525 00246 00496 (00115) (000616) (000330) Constant -0181 00729 -00972 (00499) (00685) (00171) Observations 1026 1026 1006 R-squared 0207 0089 Number of firms AR(1) AR(2) Sargan test statistics
101 101 101 00022 01411 8610505
37
Appendix 1 Generic STATA Commands for Implementing GMM in STATA and Applying Post-estimation Tests
Fixed effects xtreg depvar indepvars fe
Installing xtabond2 in STATA ssc install xtabond2
Applying Two-step GMM using xtabond2 command
xtabond2 y ly x1 x2 x3 x4 gmm(y x1 x2 x3 x4 lag(a b)) noconstant twostep
Sargan test estat sargan
The Arellano-Bond test for first-order and second-order correlation
estat abond
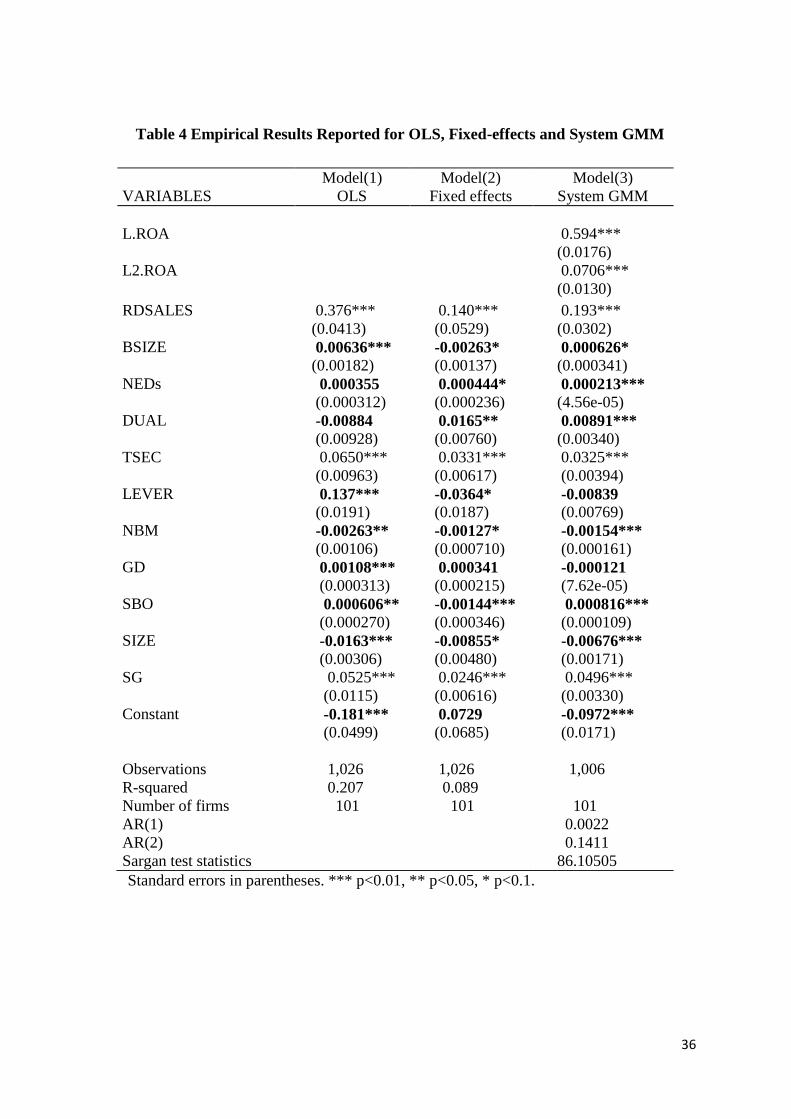