Dealership Competition in the U.S. Automobile Industry The American Economist. 2001, Ramrattan,...
20
Dealership Competition in the U.S. Automobile Industry The American Economist. 2001, Ramrattan, Lall.
-
Upload
lenard-williamson -
Category
Documents
-
view
219 -
download
1
Transcript of Dealership Competition in the U.S. Automobile Industry The American Economist. 2001, Ramrattan,...

Dealership Competition in the U.S. Automobile Industry
The American Economist. 2001, Ramrattan, Lall.

Presentation Format
Introduction Historic Events
Model
Technical Analysis Results
Conclusion
Introduction
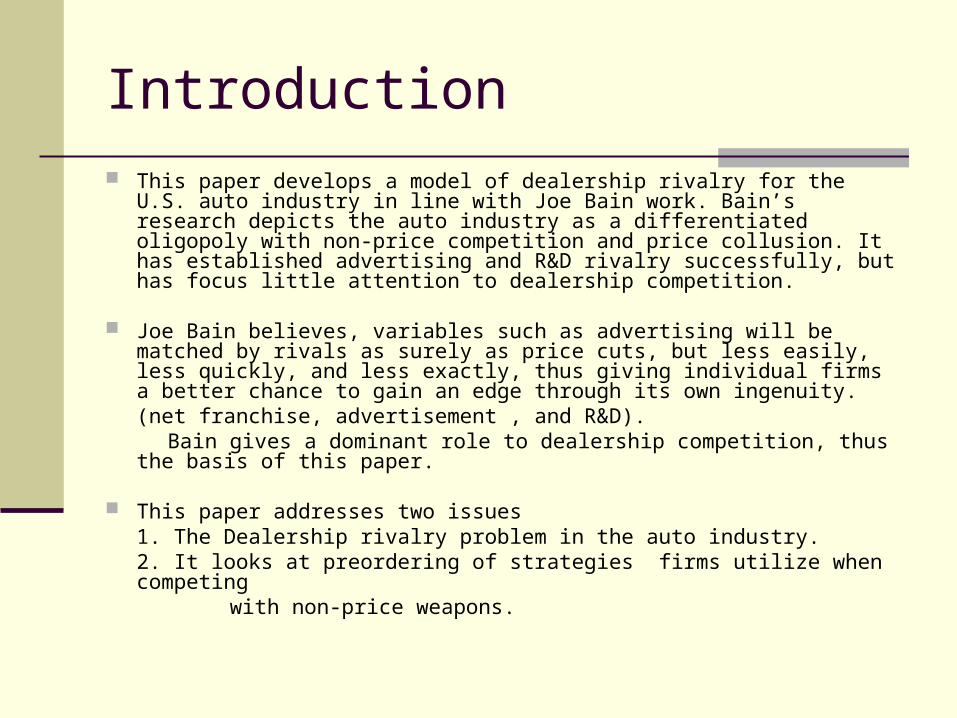
This paper develops a model of dealership rivalry for the U.S. auto industry in line with Joe Bain work. Bain’s research depicts the auto industry as a differentiated oligopoly with non-price competition and price collusion. It has established advertising and R&D rivalry successfully, but has focus little attention to dealership competition.
Joe Bain believes, variables such as advertising will be matched by rivals as surely as price cuts, but less easily, less quickly, and less exactly, thus giving individual firms a better chance to gain an edge through its own ingenuity. (net franchise, advertisement , and R&D).
Bain gives a dominant role to dealership competition, thus the basis of this paper.
This paper addresses two issues1. The Dealership rivalry problem in the auto industry. 2. It looks at preordering of strategies firms utilize when competing
with non-price weapons.

The Ongoing Debate
In1960 Joe Bain first states hypothesis and finds Auto industry colludes in price. Firms compete by utilizing non-price variables.
In 1994 Ramrattan test for rivalry in Advertising in auto industry, Uses Cournot game theory model and data from 1970 to 1980. Advertising Rivalry in the U.S.
Automobile Industry: A Test of Bain’s Hypothesis. In 1998 Ramrattan test for R&D rivalry, in largest
sample size, and modifies model. R&D Rivalry in the U.S. Automobile Industry: A Simultaneous Equation Model approach to Bain’s Hypothesis.
2001 Ranrattan builds on previous findings and adds Dealership competition using lest square model.
Model
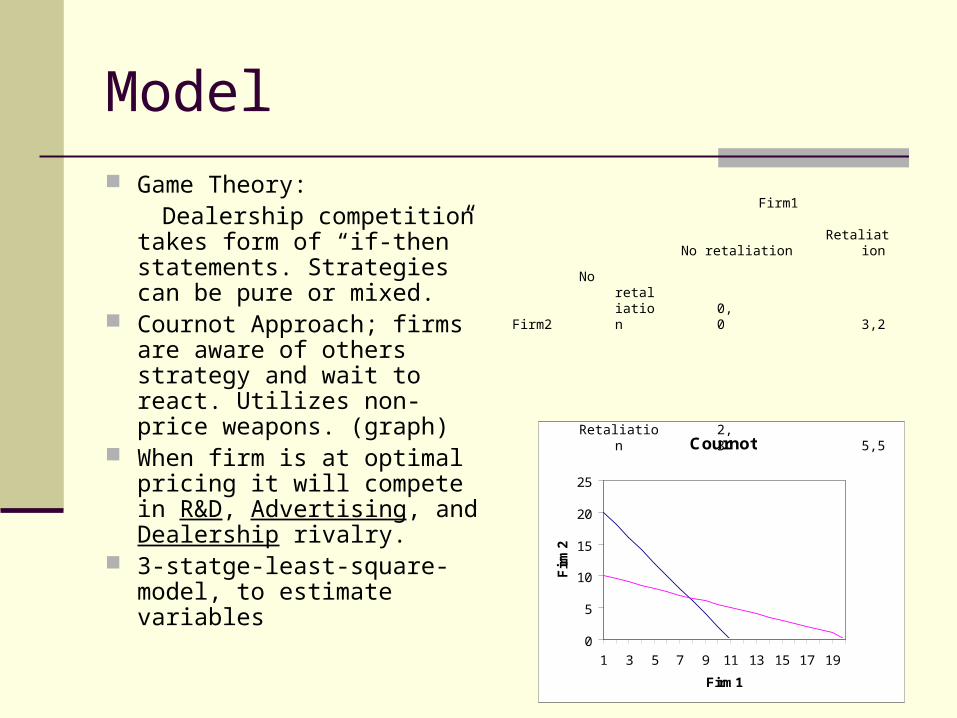
Game Theory: Dealership competition takes
form of “if-then” statements. Strategies can be pure or mixed.
Cournot Approach; firms are aware of others strategy and wait to react. Utilizes non-price weapons. (graph)
When firm is at optimal pricing it will compete in R&D, Advertising, and Dealership rivalry.
3-statge-least-square-model, to estimate variables
Cournot
0
5
10
15
20
25
1 3 5 7 9 11 13 15 17 19
Firm1
Firm2
Firm1
No retaliation Retaliation
Firm2 No retaliation 0,0 3,2
Retaliation 2,3 5,5

Specification
Volume of sales is an important determinant of number of geographical dealers.
Sales are dependent of number of dealers with either exclusive or dual franchises.Vertical integration nature of auto industry allows for sufficient consumer surplus to be extracted.
Positive reaction among firms regarding advertising. When dealers are in close proximity advertisement by one dealer does not interrupt other firms sales.
Financial variables is coupled with R&D in a simultaneous equation framework to account for feedback.

Sample
Three Firms; Ford, GM, and Chrysler. Measures behavioral response of Firms
Observation Period from 1970-1996
Variable; Advertisement, R&D, and net franchise (Dealership) Data taken from S&P Compustat tapes, Moody’s Industrial
Manual and firms Annual Reports are the sources of financial variables. R&D data is from firms 10K reports. Dealership data is from Automotive News Market Data Report. Advertising data is taken from Advertising Age’s Leading National Advertisers.

Variables NF = Net Franchise. VC = Index of Vertical Integration. A = Advertising expenditure. P = Cashflow (NI + Depreciation). NI = Net Income. i,j = ith and jth firm. Coefficients = alpha, beta, gamma, lambda, tau, upsilon, PHI, phi, a, b, c, g are Estimates. t = Time. Opec = Dummy (Zero for 1970-74, one Otherwise). change = Change. change Di, t = Cyclical Dummy: one when both sales and cashflow fall and zero otherwise. Ln = loge Inv = Investment in Plant and Equipment. Div = Common Stock Dividend Disbursements. S = Sales. S* = Capacity Accelerator = (Salest - Salest-3)/ Salest-3. K = Total Invested Capital. N = Short-term position: Excess of inventories, cash, short-term securities, and accounts receivable over
accounts payable and other short term liabilities. V = Firm's outstanding debt and money value of common and preferred stock. R = A firm's R&D outlays. F = External Bond Financing: First Difference of LTD. LTD = Long-Term Debt outstanding. r = An interest rate appropriate to LTD.

Equations

Equations
1 is our specification for rivalry in net franchise dealership.
2 Advertising equation. 3-5 Financial equations from previous test
and show significant rivalry in Advertising and R&D between GM, Ford, and Chrysler.
6 R&D equation. 7 Identity for firms budget constraint.


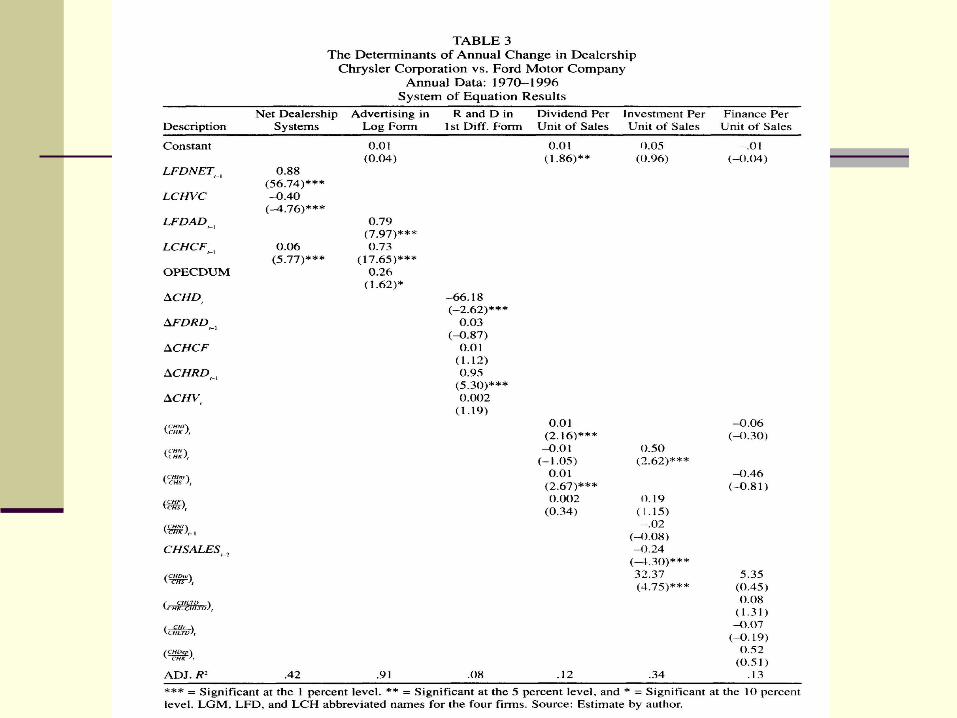


Results Does a firm prefer to play one particular non-price weapon-
Advertising, R&D, or Dealership system over another? If estimated coefficients are close to one, this signals full competition. The average level of significant coefficients for table 1-3R are .90 for Advertising, .80 for Dealership, and .70 for R&D.
The concern is whether the 10 percent observation between coefficients is significant.
Ex: looking at only GM and Ford the coefficients are rounded to one in Dealership competition and is .94 for Advertising.
The statistical view gives a mix result of the preordering of strategies.

Results
A t-test on the pair wise differences of coefficients between Advertising, R&D, and Dealership did not turn out significant statistics.
The p-values are
0.32 for Net franchise vs. Advertising
0.76 for Net franchise vs. R&D
0.27 for Advertising vs. R&D
indicating we can not reject the null hypothesis.

Conclusion Because of mix results we can view the results for preordering
competition of non-price variables in two ways.
1. In the case of GM and Ford we can imply that advertising is
where greater competition resides.
2. Since the average significant statistic for coefficients are .90 for Advertising, .80 for Dealership, and .70 for R&D.
Therefore it is probable that Dealership rivalry does about the same as Advertising, but better than R&D.

Conclusion
This paper successfully expands the empirical on Bain’s paradigm to include dealership rivalry.
Except for the GM and Chrysler relationship, the reaction patterns fail to falsify Bain’s prediction of franchise dealership. (leader firm).
In preordering the average level of reaction coefficient favored Advertising(.90), Dealership(.80), and R&D(.70).
Overall the results do lend greater empirical support for Bain’s differentiated oligopoly hypothesis of the auto industry.