Deaggregation of NBCC 2015 Seismic Hazard for Selected ...€¦ · Deaggregation of NBCC 2015...
9
Deaggregation of NBCC 2015 Seismic Hazard for Selected Canadian Cities Stephen Halchuk 1 , John Adams 1 , Michal Kolaj 1 , Trevor Allen 2 1 Seismologist, Canadian Hazards Information Service, Natural Resources Canada – Ottawa, ON, Canada. 2 Seismologist, Positioning and Community Safety Division, Geoscience Australia – Canberra, ACT, Australia. ABSTRACT Canada's 5 th Generation seismic hazard model forms the basis for the seismic design provisions of the 2015 National Building Code of Canada (NBCC). We deaggregate the seismic hazard results for selected cities to help understand the relative contributions of the earthquake sources in terms of distance and magnitude. Deaggregation for a range of probabilities and spectral accelerations (Sa) from 0.2 to 10.0 seconds is performed to examine in detail the hazard for two of Canada's largest urban centres at highest risk, Vancouver in the west and Montréal in the east. A summary table of deaggregated seismic hazard is provided for other selected Canadian cities, for Sa(0.2), Sa(2.0) and peak ground acceleration (PGA) at a probability of exceedence of 2%/50 years. In most cases, as the probability decreases, the hazard sources closer to the site dominate. Larger, more distant earthquakes contribute more significantly to hazard for longer periods than shorter periods. The deaggregations allow better-informed choices of scenario events and for the selection of representative time histories for engineering design. Keywords: Montréal, Vancouver, deaggregation, hazard, national building code INTRODUCTION In 2015 the Geological Survey of Canada produced its 5 th Generation seismic hazard model and from it produced a suite of seismic hazard maps for Canada. The model and maps were issued as GSC Open Files 7576 [1] and 7893 [2], respectively. The results formed the basis for the seismic design provisions that SCED (Standing Committee on Earthquake Design) recommended for the 2015 edition of the National Building Code of Canada (NBCC). Additional background information is provided by [3], [4], and [5]. This paper supplements those results by presenting results of a deaggregation process that provides additional insights into how the size and distance of earthquakes defined for each source zone in the 5 th Generation seismic hazard model contribute to the probability of exceeding 2%/50 ground motion levels for selected cities across Canada. The process of deaggregation [6-8] has come to be an important tool for understanding seismic hazard. Allocating the total hazard into contributions based on distance and magnitude helps to close the gap between the thousands of earthquakes that go into the hazard models and the scenario design earthquake(s) required for engineering purposes. Identifying the predominant sources of hazard leads to better choices for the design earthquake’s characteristics, as well as the better choice of time histories. Performing deaggregations at more than one period helps to determine if one source dominates at all periods, and also clarifies whether more than one design earthquake is needed. METHOD The NBCC2015 seismic hazard results were generated using GSCFRISK, a customized version of the FRISK88 hazard code (FRISK88 is a proprietary software product of Risk Engineering Inc.). Results in this paper are provided for six ground motion parameters, Sa(0.2), Sa(0.5), Sa(1.0), Sa(2.0), Sa(5.0), Sa(10.0) and PGA, where Sa(T) represents the 5% damped spectral acceleration for period T in seconds, and PGA is the peak horizontal ground acceleration. The deaggregations determined by GSCFRISK do not show the relative contributions from various levels of epsilon (ε). Epsilon represents the contribution made to the hazard from ground motions different from the mean (ε = 1 indicates a contribution from the mean plus one standard deviation). In general, where both small and large earthquakes are contributing, the smallest earthquakes contribute at ε > 1 and the largest at ε < 1. Differences between this paper’s deaggregated hazard and standard NBCC hazard values Slight differences exist between “standard” values (published in NBCC2015 [9] and available through the online calculator [10]) and “deaggregated” hazard values determined for this paper. They arise from the improved computation parameters needed: a) Standard hazard calculations are interpolated from a set of ground motion levels evenly spaced at approximately 1/8
Transcript of Deaggregation of NBCC 2015 Seismic Hazard for Selected ...€¦ · Deaggregation of NBCC 2015...
Deaggregation of NBCC 2015 Seismic Hazard for Selected Canadian Cities
Stephen Halchuk1, John Adams1, Michal Kolaj1, Trevor Allen2
1 Seismologist, Canadian Hazards Information Service, Natural Resources Canada – Ottawa, ON, Canada. 2 Seismologist, Positioning and Community Safety Division, Geoscience Australia – Canberra, ACT, Australia.
ABSTRACT
Canada's 5th Generation seismic hazard model forms the basis for the seismic design provisions of the 2015 National Building
Code of Canada (NBCC). We deaggregate the seismic hazard results for selected cities to help understand the relative
contributions of the earthquake sources in terms of distance and magnitude. Deaggregation for a range of probabilities and
spectral accelerations (Sa) from 0.2 to 10.0 seconds is performed to examine in detail the hazard for two of Canada's largest
urban centres at highest risk, Vancouver in the west and Montréal in the east. A summary table of deaggregated seismic hazard
is provided for other selected Canadian cities, for Sa(0.2), Sa(2.0) and peak ground acceleration (PGA) at a probability of
exceedence of 2%/50 years. In most cases, as the probability decreases, the hazard sources closer to the site dominate. Larger,
more distant earthquakes contribute more significantly to hazard for longer periods than shorter periods. The deaggregations
allow better-informed choices of scenario events and for the selection of representative time histories for engineering design.
Keywords: Montréal, Vancouver, deaggregation, hazard, national building code
INTRODUCTION
In 2015 the Geological Survey of Canada produced its 5th Generation seismic hazard model and from it produced a suite of
seismic hazard maps for Canada. The model and maps were issued as GSC Open Files 7576 [1] and 7893 [2], respectively.
The results formed the basis for the seismic design provisions that SCED (Standing Committee on Earthquake Design)
recommended for the 2015 edition of the National Building Code of Canada (NBCC). Additional background information is
provided by [3], [4], and [5]. This paper supplements those results by presenting results of a deaggregation process that provides
additional insights into how the size and distance of earthquakes defined for each source zone in the 5th Generation seismic
hazard model contribute to the probability of exceeding 2%/50 ground motion levels for selected cities across Canada.
The process of deaggregation [6-8] has come to be an important tool for understanding seismic hazard. Allocating the total
hazard into contributions based on distance and magnitude helps to close the gap between the thousands of earthquakes that go
into the hazard models and the scenario design earthquake(s) required for engineering purposes. Identifying the predominant
sources of hazard leads to better choices for the design earthquake’s characteristics, as well as the better choice of time histories.
Performing deaggregations at more than one period helps to determine if one source dominates at all periods, and also clarifies
whether more than one design earthquake is needed.
METHOD
The NBCC2015 seismic hazard results were generated using GSCFRISK, a customized version of the FRISK88 hazard code
(FRISK88 is a proprietary software product of Risk Engineering Inc.). Results in this paper are provided for six ground motion
parameters, Sa(0.2), Sa(0.5), Sa(1.0), Sa(2.0), Sa(5.0), Sa(10.0) and PGA, where Sa(T) represents the 5% damped spectral
acceleration for period T in seconds, and PGA is the peak horizontal ground acceleration. The deaggregations determined by
GSCFRISK do not show the relative contributions from various levels of epsilon (ε). Epsilon represents the contribution made
to the hazard from ground motions different from the mean (ε = 1 indicates a contribution from the mean plus one standard
deviation). In general, where both small and large earthquakes are contributing, the smallest earthquakes contribute at ε > 1
and the largest at ε < 1.
Differences between this paper’s deaggregated hazard and standard NBCC hazard values
Slight differences exist between “standard” values (published in NBCC2015 [9] and available through the online calculator
[10]) and “deaggregated” hazard values determined for this paper. They arise from the improved computation parameters
needed: a) Standard hazard calculations are interpolated from a set of ground motion levels evenly spaced at approximately 1/8
12th Canadian Conference on Earthquake Engineering, Quebec City, June 17-20, 2019
logarithmic units. Deaggregated values are reached once the difference between the last 2 iterations is less than 0.1%, or 12
iterations, whichever comes first. b) Standard hazard calculations are done with 50 zone slices, deaggregations are done with
100 zone slices. The slice parameter defines the number of integration slices for each contributing source zone. Finer slicing is
used to minimize bias in the number of slices that are used to determine the contributions from each magnitude distance bin.
There is a trade-off between number of slices and computation time – 100 slices was felt to be a reasonable compromise for
routine deaggregation analysis. The differences in values between the standard NBCC and deaggregated hazard are small (1-
5%) for the cities used in this paper. The NBCC values should be used for design computations, but as the shapes and values
of the deaggregated contributions given in this paper will be virtually identical to a deaggregation of the NBCC hazard value,
the deaggregated results can be used for the choice of time histories, scenario earthquakes, etc.
Layout of the deaggregation plots
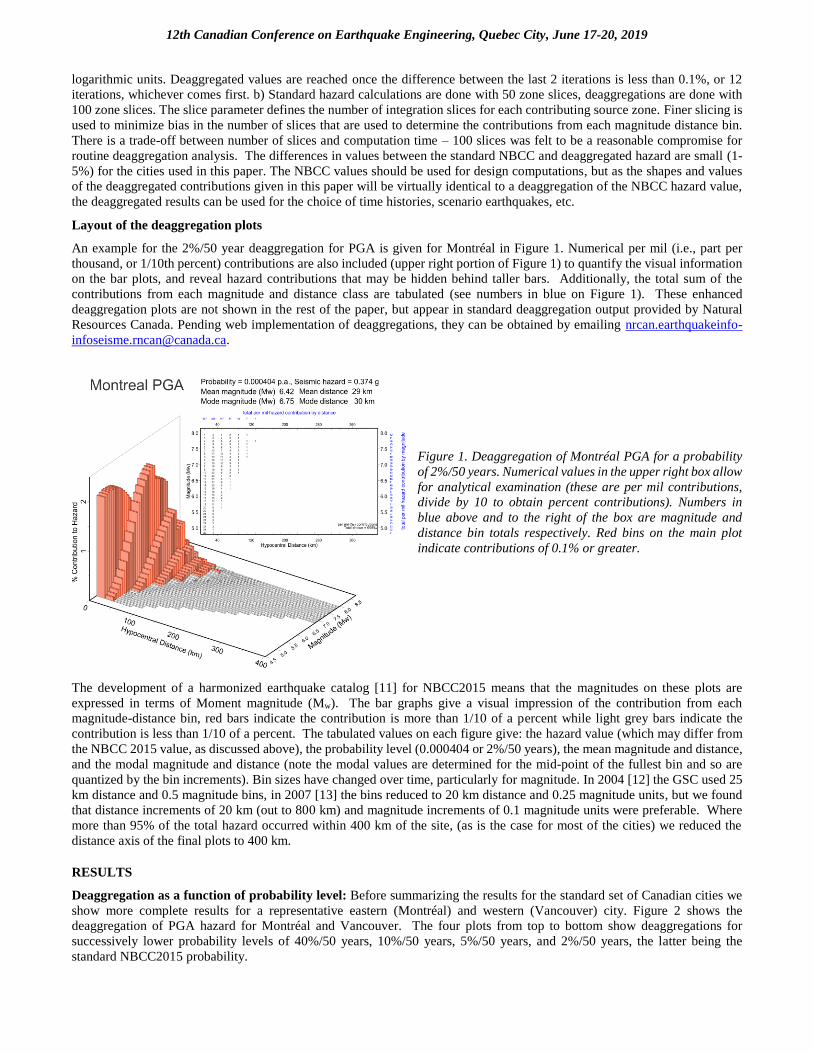
An example for the 2%/50 year deaggregation for PGA is given for Montréal in Figure 1. Numerical per mil (i.e., part per
thousand, or 1/10th percent) contributions are also included (upper right portion of Figure 1) to quantify the visual information
on the bar plots, and reveal hazard contributions that may be hidden behind taller bars. Additionally, the total sum of the
contributions from each magnitude and distance class are tabulated (see numbers in blue on Figure 1). These enhanced
deaggregation plots are not shown in the rest of the paper, but appear in standard deaggregation output provided by Natural
Resources Canada. Pending web implementation of deaggregations, they can be obtained by emailing nrcan.earthquakeinfo-
Figure 1. Deaggregation of Montréal PGA for a probability
of 2%/50 years. Numerical values in the upper right box allow
for analytical examination (these are per mil contributions,
divide by 10 to obtain percent contributions). Numbers in
blue above and to the right of the box are magnitude and
distance bin totals respectively. Red bins on the main plot
indicate contributions of 0.1% or greater.
The development of a harmonized earthquake catalog [11] for NBCC2015 means that the magnitudes on these plots are
expressed in terms of Moment magnitude (Mw). The bar graphs give a visual impression of the contribution from each
magnitude-distance bin, red bars indicate the contribution is more than 1/10 of a percent while light grey bars indicate the
contribution is less than 1/10 of a percent. The tabulated values on each figure give: the hazard value (which may differ from
the NBCC 2015 value, as discussed above), the probability level (0.000404 or 2%/50 years), the mean magnitude and distance,
and the modal magnitude and distance (note the modal values are determined for the mid-point of the fullest bin and so are
quantized by the bin increments). Bin sizes have changed over time, particularly for magnitude. In 2004 [12] the GSC used 25
km distance and 0.5 magnitude bins, in 2007 [13] the bins reduced to 20 km distance and 0.25 magnitude units, but we found
that distance increments of 20 km (out to 800 km) and magnitude increments of 0.1 magnitude units were preferable. Where
more than 95% of the total hazard occurred within 400 km of the site, (as is the case for most of the cities) we reduced the
distance axis of the final plots to 400 km.
RESULTS
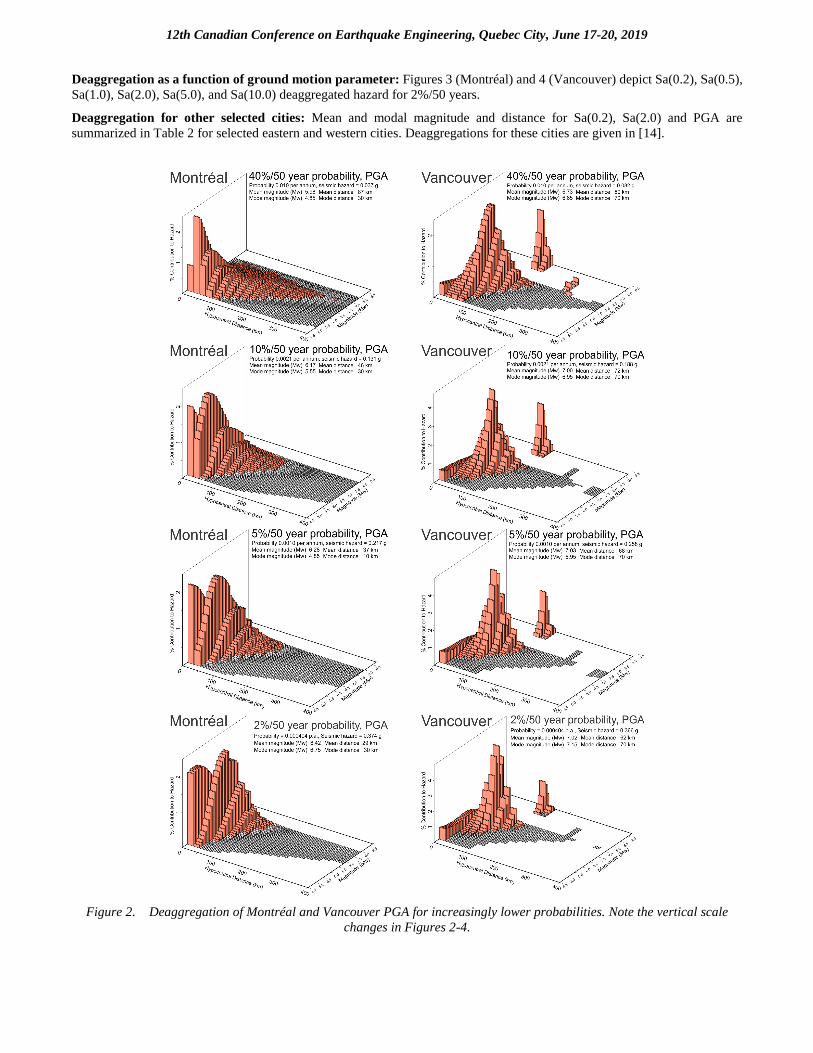
Deaggregation as a function of probability level: Before summarizing the results for the standard set of Canadian cities we
show more complete results for a representative eastern (Montréal) and western (Vancouver) city. Figure 2 shows the
deaggregation of PGA hazard for Montréal and Vancouver. The four plots from top to bottom show deaggregations for
successively lower probability levels of 40%/50 years, 10%/50 years, 5%/50 years, and 2%/50 years, the latter being the
standard NBCC2015 probability.
12th Canadian Conference on Earthquake Engineering, Quebec City, June 17-20, 2019
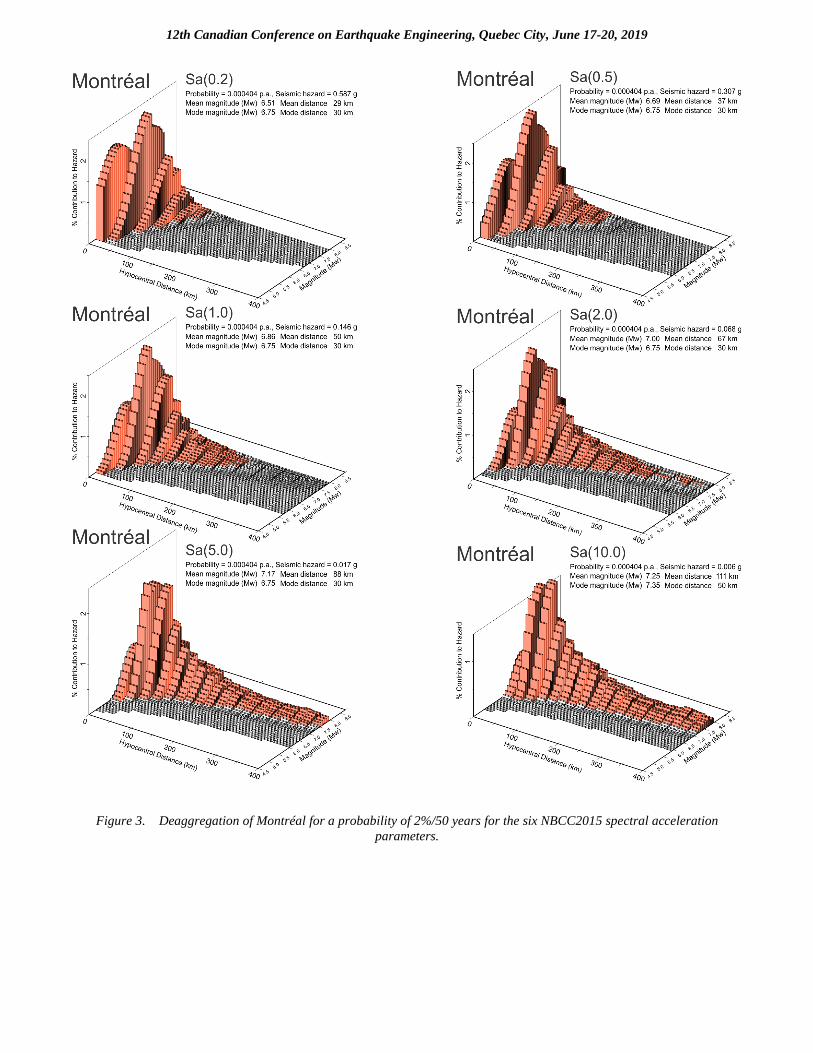
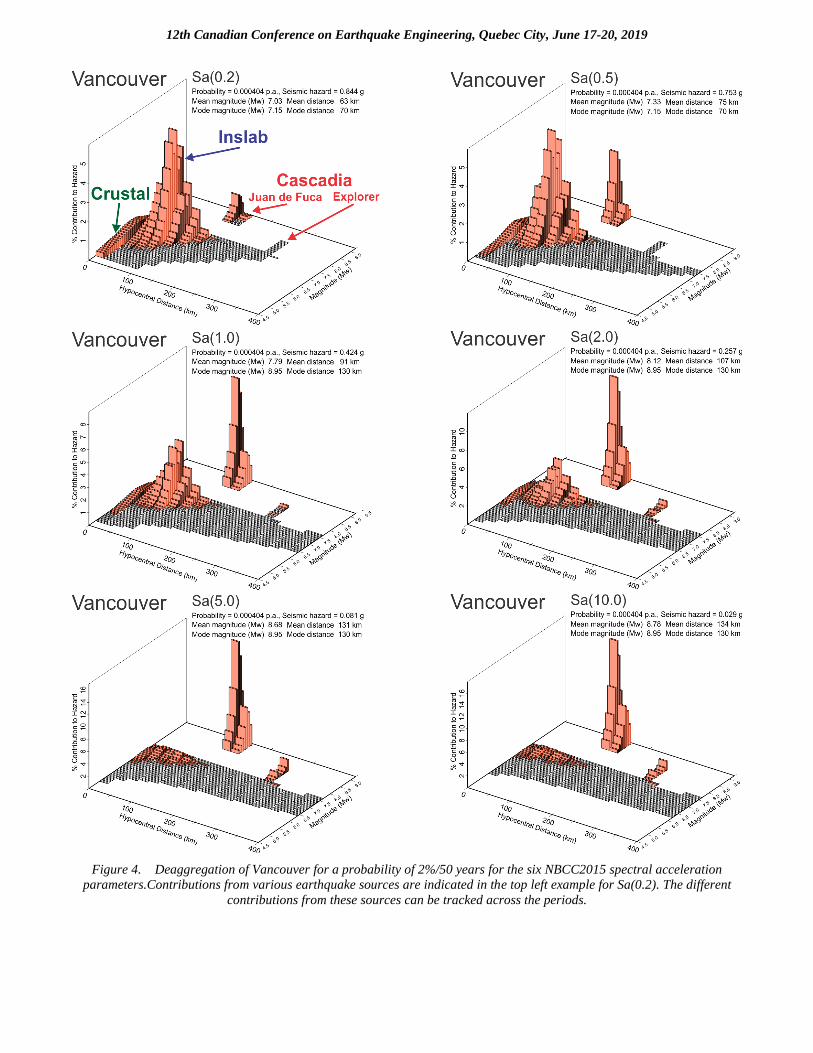
Deaggregation as a function of ground motion parameter: Figures 3 (Montréal) and 4 (Vancouver) depict Sa(0.2), Sa(0.5),
Sa(1.0), Sa(2.0), Sa(5.0), and Sa(10.0) deaggregated hazard for 2%/50 years.
Deaggregation for other selected cities: Mean and modal magnitude and distance for Sa(0.2), Sa(2.0) and PGA are
summarized in Table 2 for selected eastern and western cities. Deaggregations for these cities are given in [14].
Figure 2. Deaggregation of Montréal and Vancouver PGA for increasingly lower probabilities. Note the vertical scale
changes in Figures 2-4.
12th Canadian Conference on Earthquake Engineering, Quebec City, June 17-20, 2019
Figure 3. Deaggregation of Montréal for a probability of 2%/50 years for the six NBCC2015 spectral acceleration
parameters.
12th Canadian Conference on Earthquake Engineering, Quebec City, June 17-20, 2019
Figure 4. Deaggregation of Vancouver for a probability of 2%/50 years for the six NBCC2015 spectral acceleration
parameters.Contributions from various earthquake sources are indicated in the top left example for Sa(0.2). The different
contributions from these sources can be tracked across the periods.
12th Canadian Conference on Earthquake Engineering, Quebec City, June 17-20, 2019
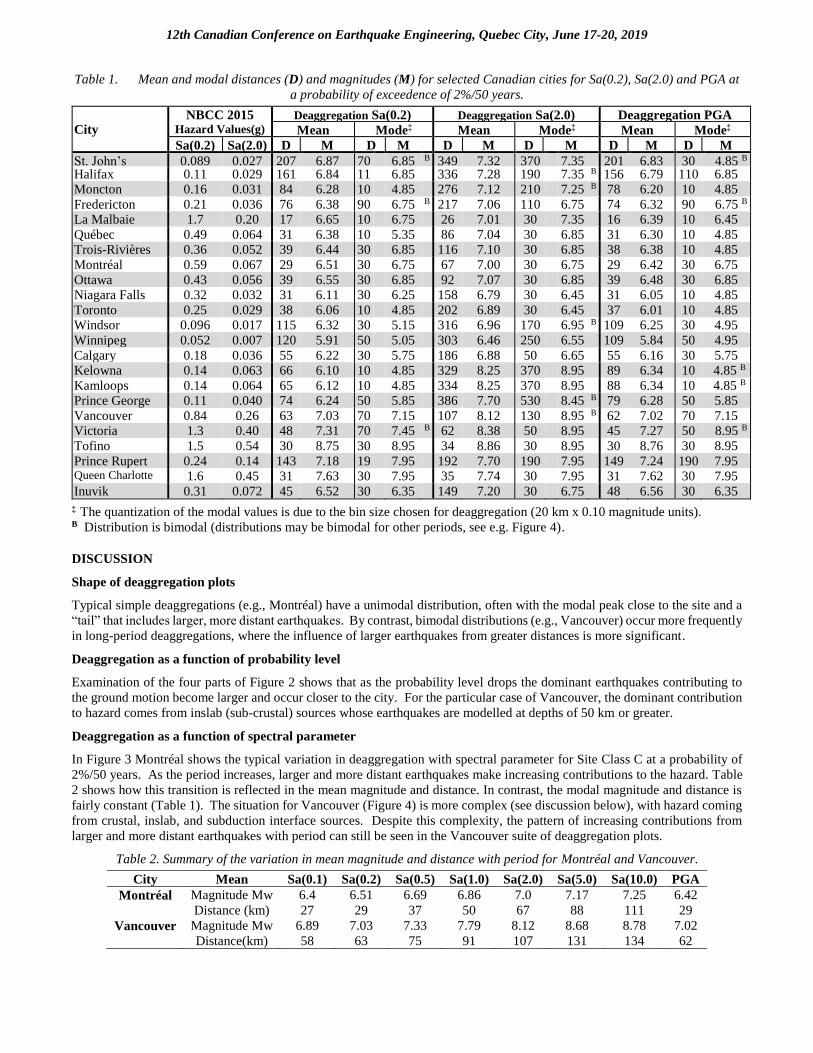
Table 1. Mean and modal distances (D) and magnitudes (M) for selected Canadian cities for Sa(0.2), Sa(2.0) and PGA at
a probability of exceedence of 2%/50 years.
City NBCC 2015 Deaggregation Sa(0.2) Deaggregation Sa(2.0) Deaggregation PGA
Hazard Values(g) Mean Mode‡ Mean Mode‡ Mean Mode‡
Sa(0.2) Sa(2.0) D M D M D M D M D M D M
St. John’s 0.089 0.027 207 6.87 70 6.85 B 349 7.32 370 7.35 201 6.83 30 4.85 B Halifax 0.11 0.029 161 6.84 11
0
6.85 336 7.28 190 7.35 B 156 6.79 110 6.85 Moncton 0.16 0.031 84 6.28 10 4.85 276 7.12 210 7.25 B 78 6.20 10 4.85
Fredericton 0.21 0.036 76 6.38 90 6.75 B 217 7.06 110 6.75 74 6.32 90 6.75 B La Malbaie 1.7 0.20 17 6.65 10 6.75 26 7.01 30 7.35 16 6.39 10 6.45
Québec 0.49 0.064 31 6.38 10 5.35 86 7.04 30 6.85 31 6.30 10 4.85 Trois-Rivières 0.36 0.052 39 6.44 30 6.85 116 7.10 30 6.85 38 6.38 10 4.85
Montréal 0.59 0.067 29 6.51 30 6.75 67 7.00 30 6.75 29 6.42 30 6.75
Ottawa 0.43 0.056 39 6.55 30 6.85 92 7.07 30 6.85 39 6.48 30 6.85 Niagara Falls 0.32 0.032 31 6.11 30 6.25 158 6.79 30 6.45 31 6.05 10 4.85
Toronto 0.25 0.029 38 6.06 10 4.85 202 6.89 30 6.45 37 6.01 10 4.85 Windsor 0.096 0.017 115 6.32 30 5.15 316 6.96 170 6.95 B 109 6.25 30 4.95
Winnipeg 0.052 0.007 120 5.91 50 5.05 303 6.46 250 6.55 109 5.84 50 4.95
Calgary 0.18 0.036 55 6.22 30 5.75 186 6.88 50 6.65 55 6.16 30 5.75 Kelowna 0.14 0.063 66 6.10 10 4.85 329 8.25 370 8.95 89 6.34 10 4.85 B
Kamloops 0.14 0.064 65 6.12 10 4.85 334 8.25 370 8.95 88 6.34 10 4.85 B Prince George 0.11 0.040 74 6.24 50 5.85 386 7.70 530 8.45 B 79 6.28 50 5.85
Vancouver 0.84 0.26 63 7.03 70 7.15 107 8.12 130 8.95 B 62 7.02 70 7.15 Victoria 1.3 0.40 48 7.31 70 7.45 B 62 8.38 50 8.95 45 7.27 50 8.95 B
Tofino 1.5 0.54 30 8.75 30 8.95 34 8.86 30 8.95 30 8.76 30 8.95
Prince Rupert 0.24 0.14 143 7.18 19
0
7.95 192 7.70 190 7.95 149 7.24 190 7.95 Queen Charlotte 1.6 0.45 31 7.63 30 7.95 35 7.74 30 7.95 31 7.62 30 7.95
Inuvik 0.31 0.072 45 6.52 30 6.35 149 7.20 30 6.75 48 6.56 30 6.35
‡ The quantization of the modal values is due to the bin size chosen for deaggregation (20 km x 0.10 magnitude units). B Distribution is bimodal (distributions may be bimodal for other periods, see e.g. Figure 4).
DISCUSSION
Shape of deaggregation plots
Typical simple deaggregations (e.g., Montréal) have a unimodal distribution, often with the modal peak close to the site and a
“tail” that includes larger, more distant earthquakes. By contrast, bimodal distributions (e.g., Vancouver) occur more frequently
in long-period deaggregations, where the influence of larger earthquakes from greater distances is more significant.
Deaggregation as a function of probability level
Examination of the four parts of Figure 2 shows that as the probability level drops the dominant earthquakes contributing to
the ground motion become larger and occur closer to the city. For the particular case of Vancouver, the dominant contribution
to hazard comes from inslab (sub-crustal) sources whose earthquakes are modelled at depths of 50 km or greater.
Deaggregation as a function of spectral parameter
In Figure 3 Montréal shows the typical variation in deaggregation with spectral parameter for Site Class C at a probability of
2%/50 years. As the period increases, larger and more distant earthquakes make increasing contributions to the hazard. Table
2 shows how this transition is reflected in the mean magnitude and distance. In contrast, the modal magnitude and distance is
fairly constant (Table 1). The situation for Vancouver (Figure 4) is more complex (see discussion below), with hazard coming
from crustal, inslab, and subduction interface sources. Despite this complexity, the pattern of increasing contributions from
larger and more distant earthquakes with period can still be seen in the Vancouver suite of deaggregation plots.
Table 2. Summary of the variation in mean magnitude and distance with period for Montréal and Vancouver.
City Mean Sa(0.1) Sa(0.2) Sa(0.5) Sa(1.0) Sa(2.0) Sa(5.0) Sa(10.0) PGA
Montréal Magnitude Mw 6.4 6.51 6.69 6.86 7.0 7.17 7.25 6.42
Distance (km) 27 29 37 50 67 88 111 29
Vancouver Magnitude Mw 6.89 7.03 7.33 7.79 8.12 8.68 8.78 7.02
Distance(km) 58 63 75 91 107 131 134 62
12th Canadian Conference on Earthquake Engineering, Quebec City, June 17-20, 2019
Deaggregation of Sa(0.2) and Sa(2.0) for selected cities
Comments on each city are provided below (three or four letter codes refer to the contributing seismic source zones as detailed
in [1]). Deaggregation plots can be found in [14].
St. John’s and Halifax. This region has relatively low hazard from local sources, significant contributions are from the offshore
Eastern continental margin (ECM) and Laurentian slope (LSP) zones.
Moncton and Fredericton. Short-period hazard is dominated by local moderate earthquakes; longer period hazard has a
contribution from the Passamaquoddy Bay (PMQ) and Miramichi (MIR) zones, and some from the distant Charlevoix
zone (CHV).
La Malbaie. Short- and long-period hazard dominated by CHV earthquakes at close distances.
Québec. Short-period hazard dominated by moderate to large earthquakes nearby (Quebec City (QUE) and Iapetan Rifted
Margin (IRM) zones); long-period hazard has some contribution from (CHV). Compared to 2005 deaggregations [13]
there is much less contribution from CHV.
Trois-Rivières. Short-period hazard dominated by moderate and large earthquakes of the underlying IRM zone. CHV still has
some influence at longer periods.
Montréal. Short- and long-period hazard comes from a combination of three local sources – IRM, Montréal (MNT) and
Gatineau (GAT). The latter has greater influence at longer periods
Ottawa. Similar to Montréal but with a more important short-period contribution from moderate-distance, large-magnitude
events (GAT).
Niagara Falls and Toronto. Dominant contributions are from nearby events in the Western Lake Ontario (WLO) zone, with
a small contribution at long periods from more distant events (IRM).
Windsor. Short-period hazard contributions from moderate earthquakes of the underlying Southern Great Lakes (SGL) and
Southern Lake Erie (SLE) zones. IRM continues to make a (small) input at long-periods.
Winnipeg. Represents the large central portion of Canada designated as the “stable Canada” region. Nearby low-probability
moderate-sized earthquakes provide the bulk of the short-period hazard. Long-period hazard is made up of a large
number of small contributions from distances out to several hundred kilometers.
Calgary. Short-period hazard dominated by small, nearby earthquakes in the Foothills (FTH) source; long-period hazard has
small inputs from Flat head Lake (FHL) and the Cascadia Interface source (CIS).
Kelowna and Kamloops. Short-period hazard from moderate nearby earthquakes of Southern British Columbia (SBC); long-
period hazard is dominated by large distant earthquakes (CIS).
Prince George. Similar to Kamloops and Kelowna for short periods, but the long-period hazard comes from very large, distant
earthquakes of the CIS, Queen Charlotte Strike-Slip (QCSS), and Haida Gwaii Thrust (HGT) sources.
Vancouver. Simple deaggregation works well where simple areal crustal sources are involved. In Vancouver (and most of
southwestern British Columbia) the situation is more complex. The crustal and inslab earthquake sources have very
different activity rates and also result in very different ground motions at the surface. In contrast to the 4th Generation
hazard model [11], the contribution of great earthquakes on the Cascadia subduction zone are now included
probabilistically. For short-period hazard the largest contribution comes from earthquakes at distances just larger than
50 km. This is due to the dominant contribution of the Georgia Strait/Puget Sound (GTP) inslab zone representing
earthquakes within the down-going slab. At longer periods CIS dominates – Figures 3 and 4.
Victoria. Similar to Vancouver, except that the deep (GTP) and subduction (CIS) earthquakes provide sub-equal contributions
at short periods while CIS controls at long periods.
Tofino. CIS dominates at all periods. Small contributions from the Explorer Interface (EIS) and Winona Thrust (WIN) fault
source are visible at long-periods.
Prince Rupert and Village of Queen Charlotte. Short- and long-period hazard comes from large, distant earthquakes of the
offshore QCSS and HGT sources.
Inuvik. The short-period hazard comes from the nearby Eskimo Lakes region (ELR) zone. The long-period hazard has
contributions from larger earthquakes at roughly 200 km from the Beaufort Sea (BFT) and Richardson Mountains
North (RMN) zones.
12th Canadian Conference on Earthquake Engineering, Quebec City, June 17-20, 2019
Comparison of Table 1 in this paper to Table 1 in [13] show changes that are due mainly to the differences in philosophy behind
the 4th and 5th Generation model. The 4th Generation model used a “robust” approach, where the hazard value was taken from
the alternative source model that produced the highest hazard and its deaggregation considered only the sources in that
alternative. In contrast, the 5th Generation model is fully probabilistic, considering sources from all alternatives at their
appropriate weights. The most dramatic effect can be seen in the inclusion of the Cascadia sources in a probabilistic fashion
which provides a more accurate distribution of its hazard contributions.
Tentative deaggregation of the 6th Generation hazard model as proposed for NBCC2020
The discussion above reports deaggregations of the NBCC2015 values using GSCFRISK. We are currently developing the 6th
Generation model, proposed for NBCC2020 [15], which uses the OpenQuake computational engine (OQ). While the seismic
source model is similar to the 5th Generation model (identical for all but southwestern B.C.; see [15]), the GMMs used differ
[16], as does the way of calculating hazard on the various site classes. Because of OQ’s computational requirements it has
been challenging to run the 6th Generation model as intended (full branches of the logic tree), and to generate deaggregations.
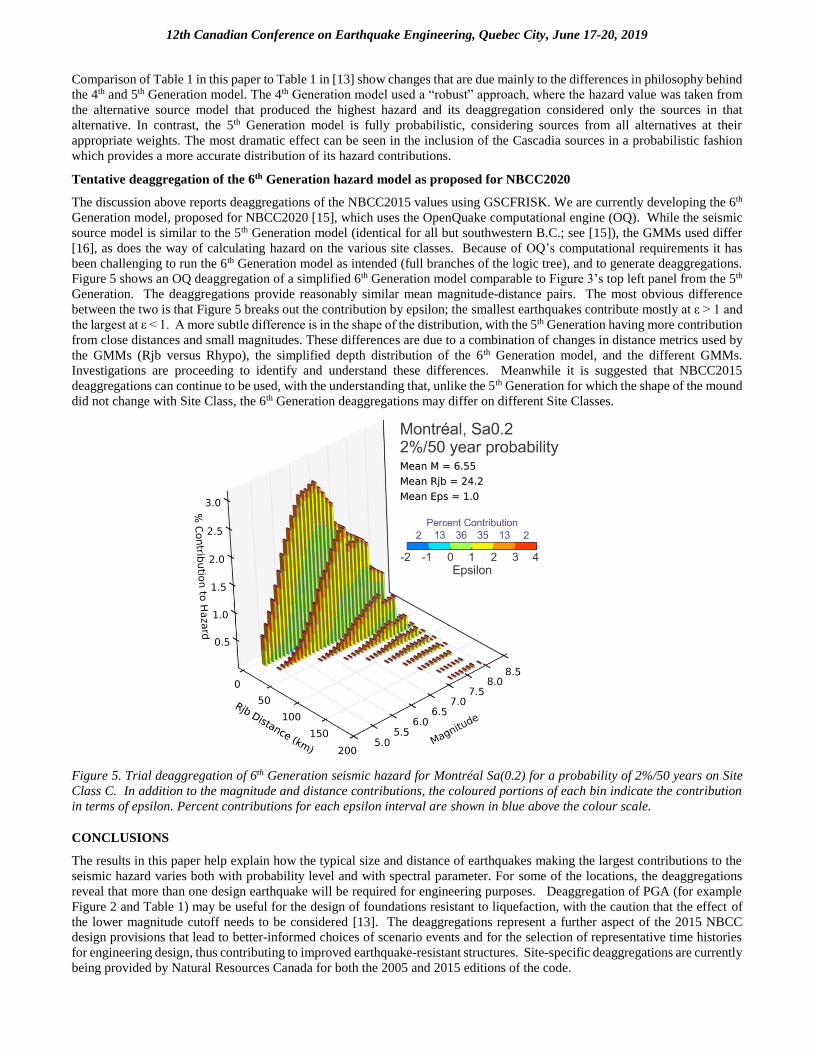
Figure 5 shows an OQ deaggregation of a simplified 6th Generation model comparable to Figure 3’s top left panel from the 5th
Generation. The deaggregations provide reasonably similar mean magnitude-distance pairs. The most obvious difference
between the two is that Figure 5 breaks out the contribution by epsilon; the smallest earthquakes contribute mostly at ε > 1 and
the largest at ε < 1. A more subtle difference is in the shape of the distribution, with the 5th Generation having more contribution
from close distances and small magnitudes. These differences are due to a combination of changes in distance metrics used by
the GMMs (Rjb versus Rhypo), the simplified depth distribution of the 6th Generation model, and the different GMMs.
Investigations are proceeding to identify and understand these differences. Meanwhile it is suggested that NBCC2015
deaggregations can continue to be used, with the understanding that, unlike the 5th Generation for which the shape of the mound
did not change with Site Class, the 6th Generation deaggregations may differ on different Site Classes.
Figure 5. Trial deaggregation of 6th Generation seismic hazard for Montréal Sa(0.2) for a probability of 2%/50 years on Site
Class C. In addition to the magnitude and distance contributions, the coloured portions of each bin indicate the contribution
in terms of epsilon. Percent contributions for each epsilon interval are shown in blue above the colour scale.
CONCLUSIONS
The results in this paper help explain how the typical size and distance of earthquakes making the largest contributions to the
seismic hazard varies both with probability level and with spectral parameter. For some of the locations, the deaggregations
reveal that more than one design earthquake will be required for engineering purposes. Deaggregation of PGA (for example
Figure 2 and Table 1) may be useful for the design of foundations resistant to liquefaction, with the caution that the effect of
the lower magnitude cutoff needs to be considered [13]. The deaggregations represent a further aspect of the 2015 NBCC
design provisions that lead to better-informed choices of scenario events and for the selection of representative time histories
for engineering design, thus contributing to improved earthquake-resistant structures. Site-specific deaggregations are currently
being provided by Natural Resources Canada for both the 2005 and 2015 editions of the code.
12th Canadian Conference on Earthquake Engineering, Quebec City, June 17-20, 2019
ACKNOWLEDGMENTS
The deaggregation and percentile version of GSCFRISK is a legacy of Frank Anglin (1935-2016). We thank Murray Journeay
for his review and comments which have improved the paper. Trevor Allen publishes with the permission of the CEO of
Geoscience Australia.
REFERENCES
1. Halchuk, S., Allen, T.I., Adams, J., and Rogers, G. C. (2014). Fifth generation seismic hazard model input files as
proposed to produce values for the 2015 National Building Code of Canada, Geological Survey of Canada Open File
7576, 15 pp, https://doi.org/10.4095/293907 .
2. Halchuk, S C; Adams, J E; Allen, T I. (2015). Fifth generation seismic hazard model for Canada: grid values of mean
hazard to be used with the 2015 National Building Code of Canada. Geological Survey of Canada, Open File 7893,
26 pp, https://doi.org/10.4095/297378
3. Adams, J., Halchuk, S., Allen, T.I., and Rogers, G.C., 2015. Canada's 5th Generation seismic hazard model as prepared
for the 2015 National Building Code of Canada Proceedings, 11th Canadian Conference on Earthquake Engineering,
21–24 July 2015, Victoria, Canada, Paper 93775, 10p.
4. Allen, T., Adams, J., Rogers, G., and Halchuk, S. (2015). New seismic hazard model for north-western Canada, 11th
Canadian Conference on Earthquake Engineering, Paper 93782.
5. Rogers, G., Halchuk, S., Adams, J., and Allen, T. 5th Generation seismic hazard model for southwest British Columbia,
Proceedings, 11th Canadian Conference on Earthquake Engineering, 21–24 July 2015, Victoria, Canada, Paper
94178, 10p.
6. McGuire, R.K., 1995. Probabilistic seismic hazard analysis and design earthquakes: closing the loop. Bull. Seism.
Soc. Am. 85: 1275-1284
7. Bazzurro, P., and Cornell, C.A., 1999. Disaggregation of seismic hazard. Bull. Seism. Soc. Am. 89: 501-520.
8. Harmsen, S., Perkins, D., and Frankel, A., 1999. Deaggregation of Probabilistic Ground Motions in the Central and
Eastern United States. Bull. Seism. Soc. Am. 89: 1-13.
9. NBCC2015. (2015). National Building Code of Canada 2015. National Research Council of Canada, Ottawa, NRCC
56190 Vol 1 & 2.
10. Seismic hazard calculators available from the Earthquake Hazard section of the Earthquakes Canada website:
http://earthquakescanada.nrcan.gc.ca
11. Halchuk, S; Allen, T I; Rogers, G C; Adams, J. (2015). Seismic Hazard Earthquake Epicentre File (SHEEF2010) used
in the fifth generation seismic hazard maps of Canada. Geological Survey of Canada, Open File 7724, 21 pp,
https://doi.org/10.4095/296908
12. Halchuk S., Adams J. 2004. Deaggregation of Seismic Hazard for Selected Canadian Cities. Proceedings of the 13 th
World Conference on Earthquake Engineering, Vancouver, Canada. Paper 2470 on CD-ROM
13. Halchuk, S., Adams, J. and Anglin, F. (2007). Revised Deaggregation of Seismic Hazard for Selected Canadian Cities,
Proceedings, Ninth Canadian Conference on Earthquake Engineering, 25-29 June 2007, Ottawa, Canada, Paper 1188,
13p.
14. Halchuk et al 2019 Fifth generation seismic hazard model for Canada: Deaggregation of 2015 hazard results for
selected Canadian localities, Geological Survey of Canada Open File XXXX, (in preparation)
15. Adams, J., Allen, T., Halchuk, S., Kolaj, M. (2019). Canada's 6th Generation Seismic Hazard Model, as Prepared for
the 2020 National Building Code of Canada. 12th Can. Conf. Earthquake Engineering, Quebec City, paper 192-
WGm8-169, 8 pp.
16. Kolaj, M., Allen, T., Mayfield, R., Adams, J., and Halchuk, S. (2019). Ground-motion models for the 6th Generation
Seismic Hazard Model of Canada. 12th Can. Conf. Earthquake Engineering, Quebec City, paper 192-hHtH-159, 9pp.