De novo transcriptome assembly of sugarcane leaves ... · Total RNA was extracted from 250 mg...
20
Genetics and Molecular Research 16 (2): gmr16028845 De novo transcriptome assembly of sugarcane leaves submitted to prolonged water-deficit stress A.A. Belesini 1 , F.M.S. Carvalho 1 , B.R. Telles 1 , G.M. de Castro 2 , P.F. Giachetto 2 , J.S. Vantini 3 , S.D. Carlin 4 , J.O. Cazetta 1 , D.G. Pinheiro 1 and M.I.T. Ferro 1 1 Universidade Estadual Paulista, Faculdade de Ciências Agrárias e Veterinárias, Jaboticabal, Departamento de Tecnologia, Jaboticabal, SP, Brasil 2 Embrapa Informática Agropecuária, Campinas, SP, Brasil 3 Universidade Estadual Paulista, Faculdade de Ciências Agrárias e Veterinárias, Jaboticabal, Departamento de Engenharia Rural, Jaboticabal, SP, Brasil 4 Centro Avançado da Pesquisa Tecnológica do Agronegócio de Cana, Ribeirão Preto, SP, Brasil Corresponding author: F.M.S. Carvalho E-mail: fl[email protected] Genet. Mol. Res. 16 (2): gmr16028845 Received June 2, 2017 Accepted April 25, 2017 Published May 25, 2017 DOI http://dx.doi.org/10.4238/gmr16028845 Copyright © 2017 The Authors. This is an open-access article distributed under the terms of the Creative Commons Attribution ShareAlike (CC BY-SA) 4.0 License. ABSTRACT. Sugarcane production is strongly influenced by drought, which is a limiting factor for agricultural productivity in the world. In this study, the gene expression profiles obtained by de novo assembly of the leaf transcriptome of two sugarcane cultivars that differ in their physiological response to water deficit were evaluated by the RNA- Seq method: drought-tolerant cultivar (SP81-3250) and drought- sensitive cultivar (RB855453). For this purpose, plants were grown in a greenhouse for 60 days and were then submitted to three treatments: control (-0.01 to -0.015 MPa), moderate water deficit (-0.05 to -0.055 MPa), and severe water deficit (-0.075 to -0.08 MPa). The plants were evaluated 30, 60, and 90 days after the beginning of treatment.
Transcript of De novo transcriptome assembly of sugarcane leaves ... · Total RNA was extracted from 250 mg...

Genetics and Molecular Research 16 (2): gmr16028845
De novo transcriptome assembly of sugarcane leaves submitted to prolonged water-deficit stress
A.A. Belesini1, F.M.S. Carvalho1, B.R. Telles1, G.M. de Castro2, P.F. Giachetto2, J.S. Vantini3, S.D. Carlin4, J.O. Cazetta1, D.G. Pinheiro1 and M.I.T. Ferro1
1Universidade Estadual Paulista, Faculdade de Ciências Agrárias e Veterinárias, Jaboticabal, Departamento de Tecnologia, Jaboticabal, SP, Brasil2Embrapa Informática Agropecuária, Campinas, SP, Brasil3Universidade Estadual Paulista, Faculdade de Ciências Agrárias e Veterinárias, Jaboticabal, Departamento de Engenharia Rural, Jaboticabal, SP, Brasil4Centro Avançado da Pesquisa Tecnológica do Agronegócio de Cana, Ribeirão Preto, SP, Brasil
Corresponding author: F.M.S. CarvalhoE-mail: [email protected]
Genet. Mol. Res. 16 (2): gmr16028845Received June 2, 2017Accepted April 25, 2017Published May 25, 2017DOI http://dx.doi.org/10.4238/gmr16028845
Copyright © 2017 The Authors. This is an open-access article distributed under the terms of the Creative Commons Attribution ShareAlike (CC BY-SA) 4.0 License.
ABSTRACT. Sugarcane production is strongly influenced by drought, which is a limiting factor for agricultural productivity in the world. In this study, the gene expression profiles obtained by de novo assembly of the leaf transcriptome of two sugarcane cultivars that differ in their physiological response to water deficit were evaluated by the RNA-Seq method: drought-tolerant cultivar (SP81-3250) and drought-sensitive cultivar (RB855453). For this purpose, plants were grown in a greenhouse for 60 days and were then submitted to three treatments: control (-0.01 to -0.015 MPa), moderate water deficit (-0.05 to -0.055 MPa), and severe water deficit (-0.075 to -0.08 MPa). The plants were evaluated 30, 60, and 90 days after the beginning of treatment.

2A.A. Belesini et al.
Genetics and Molecular Research 16 (2): gmr16028845
Sequencing on an Illumina platform (RNA-Seq) generated more than one billion sequences, resulting in 177,509 and 185,153 transcripts for the tolerant and sensitive cultivar, respectively. These transcripts were aligned with sequences from Saccharum spp, Sorghum bicolor, Miscanthus giganteus, and Arabidopsis thaliana available in public databases. The differentially expressed genes detected during the prolonged period of water deficit permit to increase our understanding of the molecular patterns involved in the physiological response of the two cultivars. The tolerant cultivar differentially expressed a larger number of genes at 90 days, while in the sensitive cultivar the number of differentially expressed genes was higher in 30 days. Both cultivars perceived the lack of water, but the tolerant cultivar responded more slowly than the sensitive cultivar. The latter requires rapid activation of different water-deficit stress response mechanisms for its survival. This rapid activation of metabolic pathways in response to water stress does not appear to be the key mechanism of drought tolerance in sugarcane. There is still much to clarify on the molecular and physiological pattern of plants in response to drought.
Key words: Drought; Gene expression; Saccharum spp.; RNA-Seq
INTRODUCTION
Sugarcane (Saccharum spp) is an important crop in the world because of its use for the production of sugar and ethanol. Besides, sugarcane is one of the best options for the generation of bioenergy (Silva et al., 2007). Brazil is the world’s number one producer of sugarcane, with a production of 33.5 million tons of sugar and 30.5 billion liters of ethanol per year (2015/2016 harvest), followed by India and China (CONAB - Companhia Nacional de Abastecimento, 2016). In Brazil, sugarcane cultivation is expanding to new regions, which is one of the reasons for the high production of this crop in the country. However, these new regions are characterized by long periods of water restriction over the year and the negative effects of this stress, such as the indirect reduction in sucrose content and low production, have become increasingly evident (Carlin and Santos, 2009). Studies of the complete genome of sugarcane are necessary to minimize these and other negative effects caused by water restriction and to develop and improve cultivars that are better adapted to these adverse regions. Thus, the identification of highly productive and drought-tolerant cultivars could further boost sugar, alcohol, and bioenergy production in the world.
However, despite the economic importance of sugarcane, no reference genome of this crop is available mainly because of the high complexity of its genome and the lack of tools for the specific analysis of polyploid organisms. One of the most common resources used for the study of sugarcane gene content has been the sequencing of Expressed Sequence Tags (ESTs) (Carson and Botha, 2000, 2002). The largest EST collection of sugarcane was obtained by the SUCEST project (Vettore et al., 2001, 2003). The database generated by this project permitted to identify genes associated with cold stress (Nogueira et al., 2003), oxidative stress (Kurama et al., 2002), and protease inhibitor genes associated with pathogen resistance (Soares-Costa et al., 2002; Falco and Silva-Filho, 2003; Mello et al., 2003), as well as to evaluate the tissue
3De novo assembly and analysis of DEGs in sugarcane
Genetics and Molecular Research 16 (2): gmr16028845
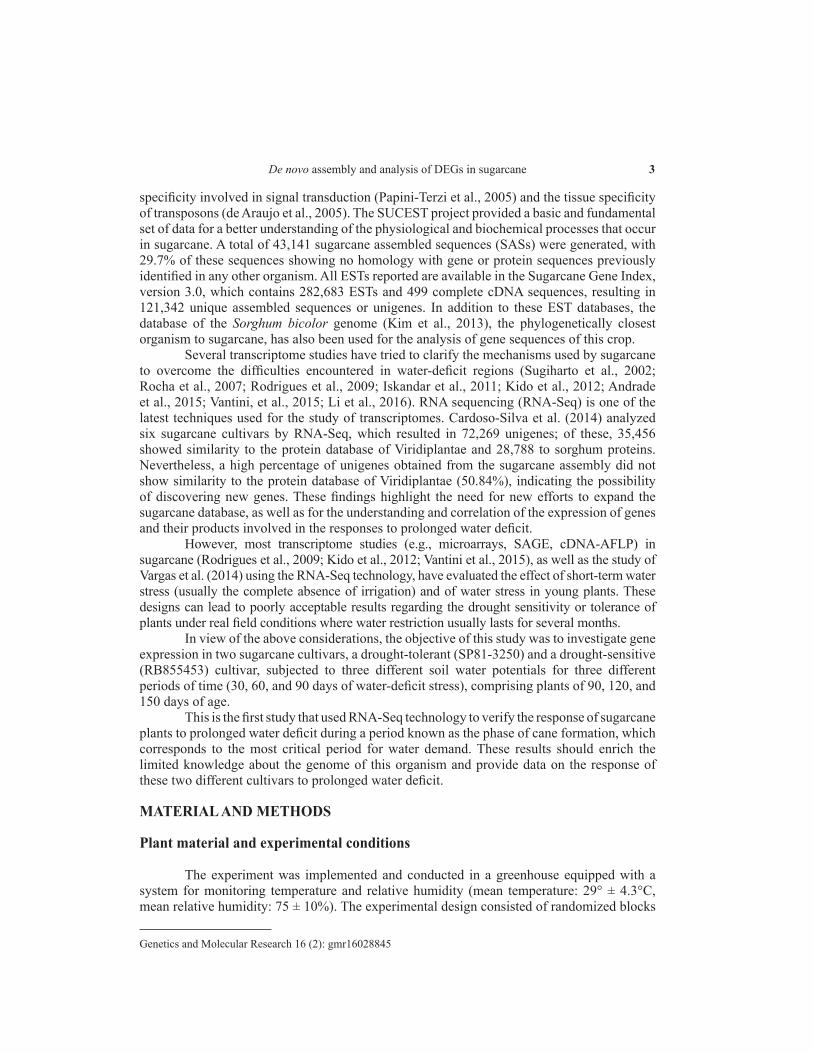
specificity involved in signal transduction (Papini-Terzi et al., 2005) and the tissue specificity of transposons (de Araujo et al., 2005). The SUCEST project provided a basic and fundamental set of data for a better understanding of the physiological and biochemical processes that occur in sugarcane. A total of 43,141 sugarcane assembled sequences (SASs) were generated, with 29.7% of these sequences showing no homology with gene or protein sequences previously identified in any other organism. All ESTs reported are available in the Sugarcane Gene Index, version 3.0, which contains 282,683 ESTs and 499 complete cDNA sequences, resulting in 121,342 unique assembled sequences or unigenes. In addition to these EST databases, the database of the Sorghum bicolor genome (Kim et al., 2013), the phylogenetically closest organism to sugarcane, has also been used for the analysis of gene sequences of this crop.
Several transcriptome studies have tried to clarify the mechanisms used by sugarcane to overcome the difficulties encountered in water-deficit regions (Sugiharto et al., 2002; Rocha et al., 2007; Rodrigues et al., 2009; Iskandar et al., 2011; Kido et al., 2012; Andrade et al., 2015; Vantini, et al., 2015; Li et al., 2016). RNA sequencing (RNA-Seq) is one of the latest techniques used for the study of transcriptomes. Cardoso-Silva et al. (2014) analyzed six sugarcane cultivars by RNA-Seq, which resulted in 72,269 unigenes; of these, 35,456 showed similarity to the protein database of Viridiplantae and 28,788 to sorghum proteins. Nevertheless, a high percentage of unigenes obtained from the sugarcane assembly did not show similarity to the protein database of Viridiplantae (50.84%), indicating the possibility of discovering new genes. These findings highlight the need for new efforts to expand the sugarcane database, as well as for the understanding and correlation of the expression of genes and their products involved in the responses to prolonged water deficit.
However, most transcriptome studies (e.g., microarrays, SAGE, cDNA-AFLP) in sugarcane (Rodrigues et al., 2009; Kido et al., 2012; Vantini et al., 2015), as well as the study of Vargas et al. (2014) using the RNA-Seq technology, have evaluated the effect of short-term water stress (usually the complete absence of irrigation) and of water stress in young plants. These designs can lead to poorly acceptable results regarding the drought sensitivity or tolerance of plants under real field conditions where water restriction usually lasts for several months.
In view of the above considerations, the objective of this study was to investigate gene expression in two sugarcane cultivars, a drought-tolerant (SP81-3250) and a drought-sensitive (RB855453) cultivar, subjected to three different soil water potentials for three different periods of time (30, 60, and 90 days of water-deficit stress), comprising plants of 90, 120, and 150 days of age.
This is the first study that used RNA-Seq technology to verify the response of sugarcane plants to prolonged water deficit during a period known as the phase of cane formation, which corresponds to the most critical period for water demand. These results should enrich the limited knowledge about the genome of this organism and provide data on the response of these two different cultivars to prolonged water deficit.
MATERIAL AND METHODS
Plant material and experimental conditions
The experiment was implemented and conducted in a greenhouse equipped with a system for monitoring temperature and relative humidity (mean temperature: 29° ± 4.3°C, mean relative humidity: 75 ± 10%). The experimental design consisted of randomized blocks

4A.A. Belesini et al.
Genetics and Molecular Research 16 (2): gmr16028845
in a 2x 3-factorial scheme (two cultivars x three soil water potentials) at three sampling time points, with three repetitions, totaling 18 experimental units and 54 samples.
Two commercial productive sugarcane cultivars were used: SP81-3250, a drought-tolerant variety, and RB855453, a drought-sensitive variety (Pincelli and Silva, 2012). The seedlings of each cultivar were collected from sugarcane billets with one bud (6 cm in length) obtained from the Jaú Research and Development Unit of APTA Pólo Centro Oeste. These billets had been previously treated and planted in 0.5-dm3 plastic recipients containing washed and sieved sand, where they were maintained in the absence of any water deficit for 30 days. After this period, healthy and homogenous seedlings were selected, and one seedling per experimental unit was transplanted. These seedlings were grown in soil (Latosol typical of the sugarcane regions of the State of São Paulo) for 30 days in the absence of water deficit (a period necessary for establishment and adaptation of the root system), i.e., until they had completed 60 days of age. Next, the treatments consisting of three different soil water potentials were applied: no water deficit (-0.010 to -0.015 MPa), moderate water deficit (-0.050 to -0.055 MPa), and severe water deficit (-0.075 to -0.080 MPa). These water potentials were determined from a soil water retention curve and literature data and were evaluated at three-time points (T): T1 (30 days of stress application, T2 (60 days of stress application), and T3 (90 days of stress application), corresponding to ages of 90, 120, and 150 days after planting. The soil water content was controlled by daily monitoring of soil tension with a digital tensiometer to ensure the moisture level corresponding to each treatment. The soil moisture content of each pot was estimated based on the average reading obtained with the tensiometers installed in the pots. Water was replaced with a PVC pipe containing holes along its length, which was located in the geometric center of the pot, thus ensuring rapid distribution of soil moisture throughout the layers of the pot.
Sample collection
Samples for the molecular tests were collected 30, 60, and 90 days after the beginning of treatment. After removal of the midrib, leaves at the first position were wrapped in aluminum foil and immediately transferred to liquid nitrogen. The fragments were stored in an ultra-freezer (-80°C) until the time of use.
Total RNA extraction
Total RNA was extracted from 250 mg leaves using the Purelink RNA Mini Kit (Life Technologies Corporation) according to manufacturer recommendations. The purified RNA was resuspended in 50 µL ultrapure water and stored at -80°C.
The quality and quantity of the total RNA samples were determined in a NanoDrop ND-1000 spectrophotometer (Thermo Fisher Scientific, Inc.) and Qubit® 2.0 fluorometer (Invitrogen) using the Qubit® RNA HS Assay Kit, respectively. Integrity was evaluated in a Bioanalyzer 2100 (Agilent Technologies) using the Agilent RNA 6000 Nano Kit according to manufacturer recommendations.
Construction of the cDNA libraries and sequencing
Messenger RNA (mRNA) was isolated and purified from 1.5 µg leaf total RNA using

5De novo assembly and analysis of DEGs in sugarcane
Genetics and Molecular Research 16 (2): gmr16028845
the TruSeq RNA Sample Preparation v2 Kit (Illumina) and cDNA libraries were constructed according to manufacturer recommendations.
Sequencing of the cDNAs by RNA-Seq was performed on the Illumina HiScanSQ System and HiSeq 2500 platforms according to the protocol of the manufacturer for paired-end sequencing of fragments of 50 and 100 bp, respectively.
De novo assembly and data analysis
The sequencing reads were assigned to libraries and stored in FASTQ files. These reads were processed, including removal of the adapters and low-quality regions, using the SeqyClean program (version 1.8.10) (https://bitbucket.org/izhbannikov/seqyclean). The parameters of the SeqyClean program were maintained, and a Phred Q30 quality index was used to eliminate low-quality regions. These libraries without adapters, which only contained high-quality regions, were used to assemble the transcriptome with the Trinity program (version r20140717) (Grabherr et al., 2013). The transcriptomes were assembled separately for each cultivar, i.e., one assembly for the sensitive cultivar (RB855453) and one for the tolerant cultivar (SP81-3250). The modified Trinity parameters were a minimum count of 3 k-mers to consider them valid and a minimum count of reads necessary to merge 2 contigs with the Inchworm algorithm of Trinity. To obtain reference genes for the two assemblies, a clustering procedure was performed based on the similarity of sequences of the two assemblies. This similarity among sequences was obtained with the CD-HIT-EST program (Li and Godzik, 2006). The sequences were then named according to the clusters formed. Besides, previous gene information present in the Trinity identifiers was used.
The reads were mapped in the reference transcriptome using the Bowtie2 program (v.2.1.0) (Langmead and Salzberg, 2012) whose parameters were adjusted to increase the sensitivity of the search for a valid (very sensitive) alignment. The abundance of the assembled transcripts was estimated with the align_and_estimate_abundance.pl module of the Trinity package using the method implemented in the eXpress program (v.1.5.1). These abundance data were also normalized to FPKM (fragments per kilobase of exon per million fragments mapped) within each library and between libraries by TMM (trimmed mean of M-values) comparison using auxiliary scripts of the Trinity program.
Two methods were used for the comparison of gene expression between sample groups: edgeR (v.3.8.5) (McCarthy et al., 2012) and DESeq2 (1.6.3) (Love et al., 2014). Both programs contain statistical methods based on generalized linear models (GLM) for the detection of differential gene expression. All pairwise comparisons between the 18 sample groups (153 analysis) were done using the two methods, and the differentially expressed genes (DEGs) were selected according to an absolute log2 fold-change (log2FC) value ≥1 and to a false discovery rate (FDR) adjusted P value ≤ 0.01, concordantly in both methods in at least one comparison. Additionally, genes with a mean count per million (CPM) less than 1 per sample group were excluded from that comparison.
For annotation of the transcripts, we used other reference databases: the transcriptomes and proteomes predicted for Arabidopsis thaliana and Sorghum bicolor, both obtained from the repository of the Phytozome platform (v.10) (Goodstein et al., 2012), the available sugarcane transcriptomes SoGI (v.3.0) (Saccharum officinarum Gene Index) and SCG (SugarCane Genes) (v.1.0) (Grativol et al., 2014), ESTs of the dbEST database (Boguski et al., 1993), GenBank mRNAs for Saccharum spp., UniGene of
6A.A. Belesini et al.
Genetics and Molecular Research 16 (2): gmr16028845
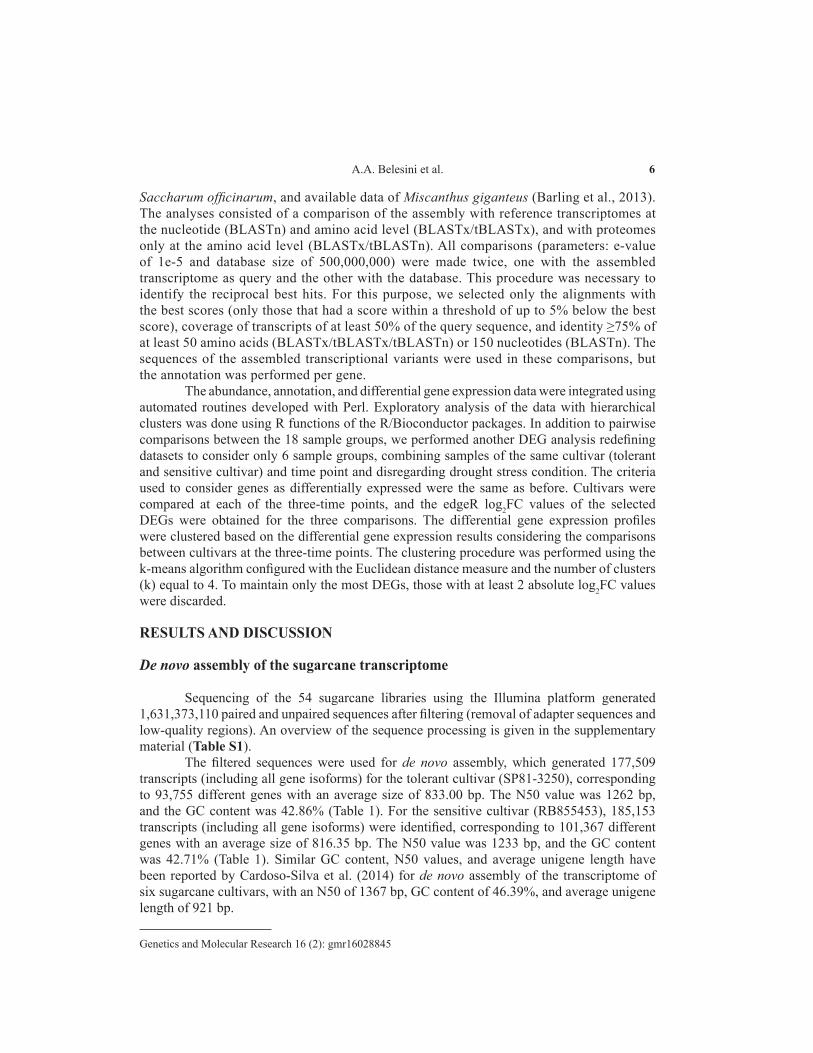
Saccharum officinarum, and available data of Miscanthus giganteus (Barling et al., 2013). The analyses consisted of a comparison of the assembly with reference transcriptomes at the nucleotide (BLASTn) and amino acid level (BLASTx/tBLASTx), and with proteomes only at the amino acid level (BLASTx/tBLASTn). All comparisons (parameters: e-value of 1e-5 and database size of 500,000,000) were made twice, one with the assembled transcriptome as query and the other with the database. This procedure was necessary to identify the reciprocal best hits. For this purpose, we selected only the alignments with the best scores (only those that had a score within a threshold of up to 5% below the best score), coverage of transcripts of at least 50% of the query sequence, and identity ≥75% of at least 50 amino acids (BLASTx/tBLASTx/tBLASTn) or 150 nucleotides (BLASTn). The sequences of the assembled transcriptional variants were used in these comparisons, but the annotation was performed per gene.
The abundance, annotation, and differential gene expression data were integrated using automated routines developed with Perl. Exploratory analysis of the data with hierarchical clusters was done using R functions of the R/Bioconductor packages. In addition to pairwise comparisons between the 18 sample groups, we performed another DEG analysis redefining datasets to consider only 6 sample groups, combining samples of the same cultivar (tolerant and sensitive cultivar) and time point and disregarding drought stress condition. The criteria used to consider genes as differentially expressed were the same as before. Cultivars were compared at each of the three-time points, and the edgeR log2FC values of the selected DEGs were obtained for the three comparisons. The differential gene expression profiles were clustered based on the differential gene expression results considering the comparisons between cultivars at the three-time points. The clustering procedure was performed using the k-means algorithm configured with the Euclidean distance measure and the number of clusters (k) equal to 4. To maintain only the most DEGs, those with at least 2 absolute log2FC values were discarded.
RESULTS AND DISCUSSION
De novo assembly of the sugarcane transcriptome
Sequencing of the 54 sugarcane libraries using the Illumina platform generated 1,631,373,110 paired and unpaired sequences after filtering (removal of adapter sequences and low-quality regions). An overview of the sequence processing is given in the supplementary material (Table S1).
The filtered sequences were used for de novo assembly, which generated 177,509 transcripts (including all gene isoforms) for the tolerant cultivar (SP81-3250), corresponding to 93,755 different genes with an average size of 833.00 bp. The N50 value was 1262 bp, and the GC content was 42.86% (Table 1). For the sensitive cultivar (RB855453), 185,153 transcripts (including all gene isoforms) were identified, corresponding to 101,367 different genes with an average size of 816.35 bp. The N50 value was 1233 bp, and the GC content was 42.71% (Table 1). Similar GC content, N50 values, and average unigene length have been reported by Cardoso-Silva et al. (2014) for de novo assembly of the transcriptome of six sugarcane cultivars, with an N50 of 1367 bp, GC content of 46.39%, and average unigene length of 921 bp.

7De novo assembly and analysis of DEGs in sugarcane
Genetics and Molecular Research 16 (2): gmr16028845
Sequence annotation and DEGs in response to prolonged water deficit
The set of transcripts identified was aligned with sequences from other sugarcane reference databases and closely related organisms. Maximum annotation was found for the sugarcane varieties used in the study of Cardoso-Silva et al. (2014), with 40.38% annotated genes followed by the sugarcane EST database with 21.07%. About 20% of the genes were annotated against the M. giganteus, S. bicolor, and SoGI databases. The lowest percentage of annotation was found using the A. thaliana and Saccharum mRNA databases, with 0.24and 0.41% of annotated genes, respectively (Table 2). It is suggested that part of these uncatalogued transcripts are new genes not yet described in sugarcane. Furthermore, the small number of annotated transcripts against M. giganteus, S. bicolor, A. thaliana, and SoGI may be related to fragmentation of transcripts and noncoding RNAs during assembly.
Table 1. Descriptive statistics of transcriptome assembly of drought-tolerant and drought-sensitive sugarcane cultivars obtained with the Trinity program.
Total number of genes Total number of transcripts GC content (%) N50 (bp) Median Mean (bp) Total number of bases Tolerant cultivar (SP81-3250) Genes 93,755 177,509 42.86 1262 539 833.06 147,875,185 Longest transcript - - - 1126 417 715.95 67,123,628 Sensitive cultivar (RB855453) Genes 101,367 185,153 42.71 1233 524 816.35 151,148,742 Longest transcript - - - 1072 412 700.05 70,961,559
N50: number in which 50% of the genes/isoforms are above this value and 50% are below this value.
Table 2. Results of annotation of the sugarcane transcriptome against different databases.
Reference database Number of annotated genes in the assembly
% of annotated genes in the assembly
Number of single records annotated in the assembly
% of single records annotated in the assembly
Total records of the reference database
PRINTS 3,236 2.43 480 0.36 2,106 Pfam 21,214 15.96 3,858 2.90 14,831 InterPro 21,195 15.94 4,609 3.47 27,002 ProDom 202 0.15 101 0.08 1,894 SMART 6,355 4.78 564 0.42 1,008 TIGRFAM 2,077 1.56 664 0.50 4,284 ProSiteProfiles 8,943 6.73 605 0.46 1,087 KEGG 1,573 1.18 108 0.08 - Reactome 1,209 0.91 52 0.04 - MetaCyc 1,014 0.76 457 0.34 - UniPathway 1,002 0.75 138 0.10 - SwissProt 5,213 3.92 15,224 11,45 547,357 Transcriptomes BLASTn/BLASTn S. bicolor 25,577 19.24 19,497 14.67 33,032 A. thaliana 320 0.24 351 0.26 27,416 M. giganteus 22,762 17.12 24,076 18.11 61,055 Cardoso-Silva et al. (2014) 53,678 40.38 51,697 38.89 72,269 SOGI 27,245 20.50 41,374 31.13 121,342 SCG 9,002 6.77 11,061 8.32 36,871 S. officinarum (UNIGENE) 15,841 11.92 12,398 9.33 15,394 Saccharum (ESTs) 28,007 21.07 105,915 79.68 285,138 Saccharum (mRNA) 541 0.41 555 0.42 744 tBLASTx/tBLASTx S. bicolor 18,800 14.14 14,838 11.16 33,032 A. thaliana 3,449 2.59 3,772 2.84 27,416 M. giganteus 19,118 14.38 19,867 14.94 61,055 Cardoso-Silva et al. (2014) 53,684 40.38 48,971 36.84 72,269 SOGI 25,783 19.40 38,734 29.14 121,342 SCG 7641 5.75 9,330 7.02 36,871 S. officinarum (UNIGENE) 15,667 11.79 12,111 9.11 15,394 Saccharum (ESTs) 26,538 19.96 101,068 76.03 285,138 Saccharum (mRNA) 600 0.45 535 0.40 744 Proteomes BLASTx/tBLASTn S. bicolor 16,701 12.56 15,606 11.74 33,032 A. thaliana 3,512 2.64 4,255 3.20 27,416
8A.A. Belesini et al.
Genetics and Molecular Research 16 (2): gmr16028845
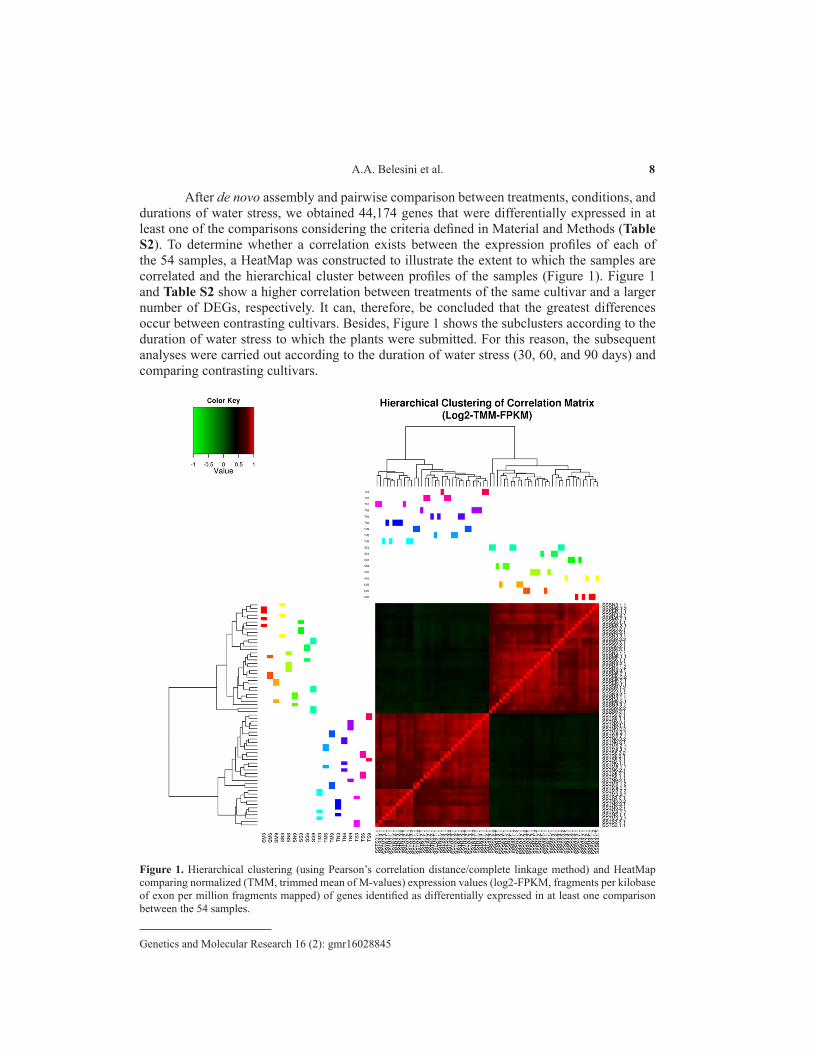
After de novo assembly and pairwise comparison between treatments, conditions, and durations of water stress, we obtained 44,174 genes that were differentially expressed in at least one of the comparisons considering the criteria defined in Material and Methods (Table S2). To determine whether a correlation exists between the expression profiles of each of the 54 samples, a HeatMap was constructed to illustrate the extent to which the samples are correlated and the hierarchical cluster between profiles of the samples (Figure 1). Figure 1 and Table S2 show a higher correlation between treatments of the same cultivar and a larger number of DEGs, respectively. It can, therefore, be concluded that the greatest differences occur between contrasting cultivars. Besides, Figure 1 shows the subclusters according to the duration of water stress to which the plants were submitted. For this reason, the subsequent analyses were carried out according to the duration of water stress (30, 60, and 90 days) and comparing contrasting cultivars.
Figure 1. Hierarchical clustering (using Pearson’s correlation distance/complete linkage method) and HeatMap comparing normalized (TMM, trimmed mean of M-values) expression values (log2-FPKM, fragments per kilobase of exon per million fragments mapped) of genes identified as differentially expressed in at least one comparison between the 54 samples.

9De novo assembly and analysis of DEGs in sugarcane
Genetics and Molecular Research 16 (2): gmr16028845
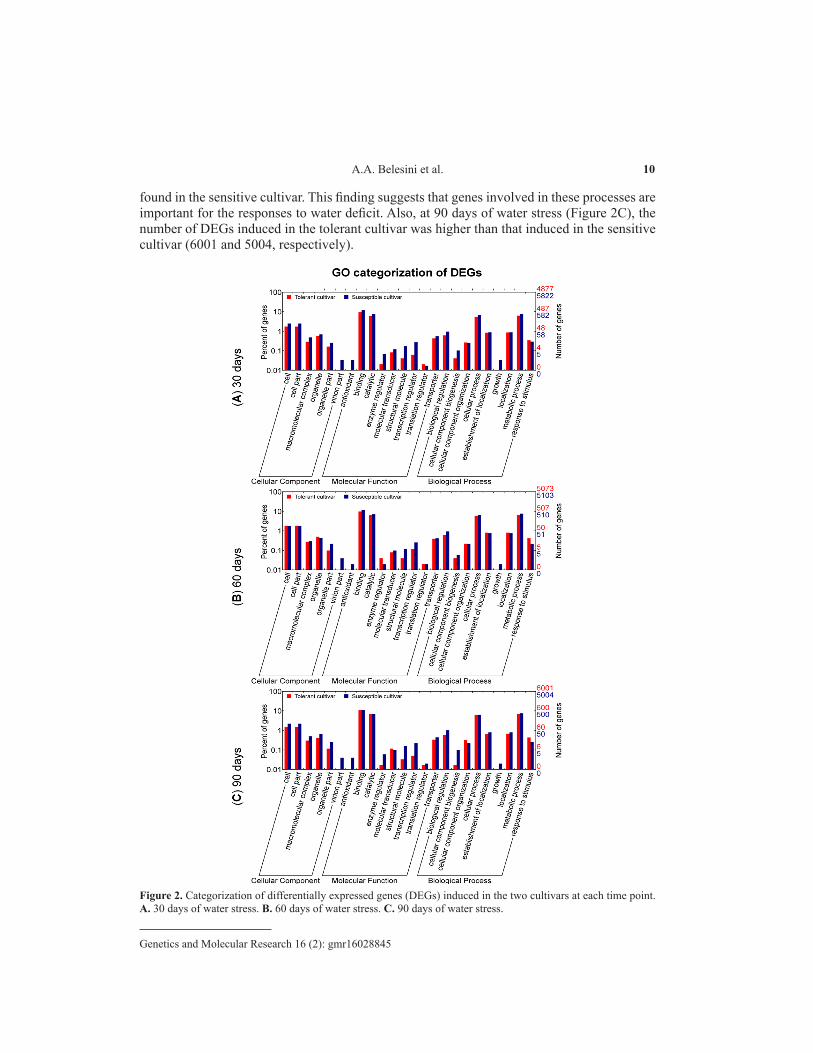
These comparisons resulted in 15,965 DEGs in at least one of the comparisons considering the previously defined criteria. Among these genes, 5997 had an edgeR log2FC value >2 or <-2 in all comparisons. After annotation, all DEGs identified in the two cultivars at 30, 60, and 90 days were categorized using GO terms (Figure 2). The categories most expressed in the two cultivars and at all water-deficit times were binding and catalytic, followed by the categories cellular process, metabolic process, cell, and cell part. Our results agree with those obtained by Li et al. (2016) who analyzed the expression of genes in only one drought-tolerant sugarcane cultivar (GT21) using microarray technology. The most expressed categories were the cell, cell part, organelle, cellular component organization, cellular process, catalytic activity, and binding. Although these authors had subjected plants at 5 months of age to the water-deficit condition (total moisture content of 9 ± 2%), the response was only determined at 3, 7, and 9 days after stress application. These categories were the most representative in the cultivar tolerant to short-term water deficit (Li et al., 2016) and the two cultivars tolerant and sensitive to prolonged water deficit of this study (30, 60, and 90 days). These observations suggest that either the genes belonging to these categories are involved in basic events that are essential for the maintenance of sugarcane, regardless of its tolerant/sensitive nature, or the modulation of expression of these genes in one or the other cultivar is responsible for the different characteristics when subjected to water deficit.
At 30 days, there was a larger number of induced genes in the sensitive cultivar (5822) compared to the tolerant cultivar (4877). Interestingly, the sensitive cultivar had induced DEGs in categories in which no genes were detected in the tolerant cultivar including the categories growth, antioxidant, and virion part (Figure 2A). These categories were exclusively detected in the sensitive cultivar at the three-time points (Figure 2A, B, and C). Since the sensitive cultivar is probably more susceptible to the lack of water, it would be expected that the repair systems (antioxidant category) are usually more expressed during situations of stress. It is known that stress caused by salt, drought, thermal shock, cold, heavy metals, and lack of nutrients lead to oxidative stress (Mittler, 2002). In this respect, several types of stress can trigger the production of H2O2 and other reactive oxygen species (ROS) in cells, such as superoxide radical (O2
-), hydroxyl radical (HO-), and singlet oxygen (1O2), which induce the expression of some stress-related genes. On the one hand, the production of ROS (oxidative stress) in the cell in response to different types of stress represents a threat to the cell; on the other hand, it is believed that ROS act as a signal for the rapid activation of stress response and defense pathways (Desikan et al., 2001; Knight and Knight, 2001). ROS can, therefore, be seen as cellular indicators of stress and as second messengers that participate in the signal transduction pathways involved in stress responses (Mittler, 2002). Similarly, many genes related to plant growth are likely to be induced in the sensitive cultivar so that the plant can overcome the difficulties encountered in a water-deficient environment, thus permitting its growth, albeit slower. On the other hand, the tolerant cultivar seems to have greater ability to adapt to water-deficit situations, and consequently does not increase the expression of genes related to these categories since it tolerates the lack of water, showing continuous growth even in these environments.
As can be seen in Figure 2B, the number of induced DEGs declined in the sensitive cultivar at 60 days of water stress compared to 30 days (from 5822 to 5103). The opposite was observed in the tolerant cultivar, with an increase in the number of DEGs from 4877 at 30 days to 5073 at 60 days. This cultivar also exhibited an increase in the number of genes involved in enzyme regulation and response to stimuli, with a larger number of genes than that
10A.A. Belesini et al.
Genetics and Molecular Research 16 (2): gmr16028845
found in the sensitive cultivar. This finding suggests that genes involved in these processes are important for the responses to water deficit. Also, at 90 days of water stress (Figure 2C), the number of DEGs induced in the tolerant cultivar was higher than that induced in the sensitive cultivar (6001 and 5004, respectively).
Figure 2. Categorization of differentially expressed genes (DEGs) induced in the two cultivars at each time point. A. 30 days of water stress. B. 60 days of water stress. C. 90 days of water stress.

11De novo assembly and analysis of DEGs in sugarcane
Genetics and Molecular Research 16 (2): gmr16028845
In general, it can be easily visualized that, while the tolerant cultivar increases the number of genes induced along the water-deficit period (30, 60, and 90 days of stress), the sensitive cultivar decreases the number of induced genes. This scenario suggests that the tolerant cultivar responds later to this water-deficit condition, while the sensitive cultivar responds more quickly, with a consequent increase in the expression of various genes in an attempt to circumvent the problems resulting from the lack of water.
After categorization of DEGs induced in the two cultivars at the three-time points (30, 60, and 90 days), the Venn diagram shown in Figure 3 was generated. The number of exclusive or shared DEGs induced in the tolerant cultivar over time is illustrated in Figure 3A and DEGs induced in the sensitive cultivar are shown in Figure 3B. As observed in the categorization analysis, the diagram permits to identify a larger number of DEGs induced in the tolerant cultivar at 90 days, while in the sensitive cultivar this number was higher at 30 days.
Figure 3. Venn diagram showing the number of genes that were induced in the tolerant (A) and sensitive (B) cultivar after 30, 60, and 90 days of water stress. The diagrams show the number of genes induced at each time point and the number of shared or exclusive genes at each time.
Additionally, the number of shared induced genes at the three-time points was 3154 in the tolerant cultivar and 3207 in the sensitive cultivar, corresponding to 6361 shared genes.
These genes were used for k-means clustering analysis, which clustered the genes into four groups defined by the k-means algorithm: two clusters containing genes induced in the tolerant cultivar and two containing genes induced in the sensitive cultivar. The genes with the highest log2FC values that could be annotated by the methods described in Material and Methods were analyzed per cluster. This analysis identified some genes described in the literature, which are related to the response of the plant to water deficit, in addition to genes not yet catalogued in public databases (Tables S3 and S4). Efforts to characterize these so far undescribed genes are important since they can contribute to the understanding of the complex interactions between gene expression and the physiological modifications involved in the network of water-deficit responses in sugarcane.

12A.A. Belesini et al.
Genetics and Molecular Research 16 (2): gmr16028845
Genes induced in the tolerant cultivar
Our results showed that RNA-Seq generated an enormous amount of data and the analysis of DEGs was therefore performed only between sampling time points (30, 60, and 90 days after the beginning of treatment). It should be pointed out that this article is one of the few available studies investigating prolonged water deficit. The expression of transcripts related to ankyrin and ascorbate peroxidase (Table S3) was increased in the tolerant cultivar along the prolonged water-deficit period. The expression profiles of these genes were similar. The presence of antioxidant enzymes such as catalase, ascorbate peroxidase, polyphenol oxidase, and superoxide dismutase is known to indicate that the plant is under oxidative stress, probably caused by water deficit. In the present study, the increased expression of an ascorbate peroxidase transcript suggests that the plant is using the enzyme to eliminate ROS in response to water deficit. Ascorbate peroxidase 3 (APX3) is involved in the elimination of H2O2 during the antioxidant metabolism of plants. Shen et al. (2010) suggested that APX3 interacts with AKR2A (ankyrin repeat-containing protein 2A), which functions as a molecular chaperone for APX3, with its binding inhibiting the formation of APX3 aggregates after translation and consequently preventing the degradation of proteins. For proteins containing a domain of ankyrin (ANK) repeats, it is known that the largest group of these proteins possesses transmembrane domains and these ANK domains have been well characterized in plants. AKR was one of the first ANK domains characterized in Arabidopsis. A direct relationship exists between ankyrin repeat-containing proteins and plant development and growth. However, few studies have demonstrated a regulatory role of ANK during stress conditions (Sharma and Pandey, 2016). This interaction network suggests a role of AKR2 in plant ROS scavenging and metabolism. We, therefore, suggest that ascorbate peroxidase and ankyrin interact in the tolerant cultivar, promoting the elimination of ROS (generated as a result of water deficit) and the development and growth of undamaged sugarcane.
Transcription factors regulate the expression of stress-responsive genes and thus help plants overcome abiotic and biotic stress. One stress-related transcription factor with an MYB DNA-binding domain was highly expressed along the water-deficit period (Table S3). MYB factors are a large family of proteins that are involved in the control of different processes in plants such as responses to biotic and abiotic stress, development, differentiation, defense, and metabolism. It has been demonstrated that an MYC transcription factor, AtMYC2 (RD22BP1), and an MYB transcription factor, AtMYB2, bind to cis elements in the promoter of the RD22 gene, which is induced by drought and whose expression depends on abscisic acid. MYC and MYB proteins are synthesized accompanying the accumulation of endogenous abscisic acid and might, therefore, act in more advanced stages of the stress response. Our results corroborate literature data since we observed high expression of MYB during prolonged water deficit (Abe et al., 2003).
We also identified a transcript for E3 SUMO-protein ligase SIZ2 (Table S3), which is related to the response to environmental stimuli such as heat, cold, and drought, in addition to modulating abscisic acid signaling and other hormones (Zhang et al., 2013). In Arabidopsis, drought induces the accumulation of SUMO proteins, a process that partially depends on E3-SIZ1 ligase. This ligase seems to act as a positive regulator of drought tolerance, showing sensitivity to short- to long-term dehydration (Castro et al., 2012). The identification of a growing number of E3 ligases that regulate the responses to abiotic stress has permitted a better definition of the mechanisms of action of these enzymes. These ligases may act by

13De novo assembly and analysis of DEGs in sugarcane
Genetics and Molecular Research 16 (2): gmr16028845
suppressing the stress signaling pathway during favorable conditions of growth, eliminating negative regulators of the stress signaling pathway in response to a stimulus, or attenuating this pathway when conditions improve, permitting growth. E3 ligases may also participate in a positive feedback loop to increase stress signaling (Figure 4) (Lyzenga and Stone, 2012). In experiments on Arabidopsis, Catala et al. (2007) demonstrated that E3-SIZ1-deficient mutants subjected to water deficit were less tolerant to drought and exhibited a shorter stature because of the lower expression of genes involved in the biosynthesis and signaling of brassinosteroids. In the genome of Arabidopsis, 1700 genes were found to be induced by drought, with SIZ1 mediating the expression of 300 of these genes. These results support the important role of E3 ligases in the drought response through the regulation of gene expression. In sugarcane, the long period of stress may have induced the accumulation of these proteins and consequently the tolerance to water deficit.
Figure 4. Regulation of abiotic stress through E3 ligase signaling. The plant perceives the stress signals through sensors (unknown), and the signal is transmitted through plant hormones, secondary messengers, and transcription regulators. The induced expression of stress genes is facilitated by transcription factors (TFs). E3 ligases tend to regulate components of the signaling pathway, especially TFs. In the absence of a signal, ligases can suppress the signaling pathway, for example by promoting the degradation of a TF. E3 ligases can exert their function within a feedback mechanism to improve or attenuate the stress signal (Source: Lyzenga and Stone, 2012).
14A.A. Belesini et al.
Genetics and Molecular Research 16 (2): gmr16028845
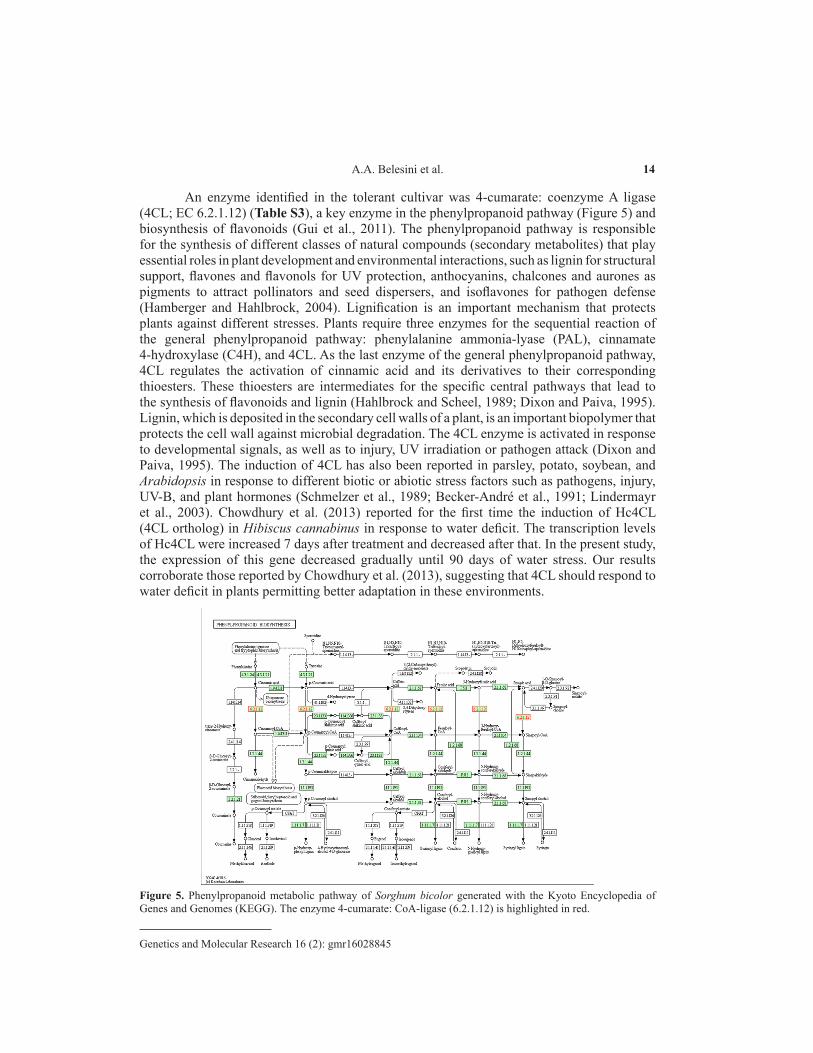
An enzyme identified in the tolerant cultivar was 4-cumarate: coenzyme A ligase (4CL; EC 6.2.1.12) (Table S3), a key enzyme in the phenylpropanoid pathway (Figure 5) and biosynthesis of flavonoids (Gui et al., 2011). The phenylpropanoid pathway is responsible for the synthesis of different classes of natural compounds (secondary metabolites) that play essential roles in plant development and environmental interactions, such as lignin for structural support, flavones and flavonols for UV protection, anthocyanins, chalcones and aurones as pigments to attract pollinators and seed dispersers, and isoflavones for pathogen defense (Hamberger and Hahlbrock, 2004). Lignification is an important mechanism that protects plants against different stresses. Plants require three enzymes for the sequential reaction of the general phenylpropanoid pathway: phenylalanine ammonia-lyase (PAL), cinnamate 4-hydroxylase (C4H), and 4CL. As the last enzyme of the general phenylpropanoid pathway, 4CL regulates the activation of cinnamic acid and its derivatives to their corresponding thioesters. These thioesters are intermediates for the specific central pathways that lead to the synthesis of flavonoids and lignin (Hahlbrock and Scheel, 1989; Dixon and Paiva, 1995). Lignin, which is deposited in the secondary cell walls of a plant, is an important biopolymer that protects the cell wall against microbial degradation. The 4CL enzyme is activated in response to developmental signals, as well as to injury, UV irradiation or pathogen attack (Dixon and Paiva, 1995). The induction of 4CL has also been reported in parsley, potato, soybean, and Arabidopsis in response to different biotic or abiotic stress factors such as pathogens, injury, UV-B, and plant hormones (Schmelzer et al., 1989; Becker-André et al., 1991; Lindermayr et al., 2003). Chowdhury et al. (2013) reported for the first time the induction of Hc4CL (4CL ortholog) in Hibiscus cannabinus in response to water deficit. The transcription levels of Hc4CL were increased 7 days after treatment and decreased after that. In the present study, the expression of this gene decreased gradually until 90 days of water stress. Our results corroborate those reported by Chowdhury et al. (2013), suggesting that 4CL should respond to water deficit in plants permitting better adaptation in these environments.
Figure 5. Phenylpropanoid metabolic pathway of Sorghum bicolor generated with the Kyoto Encyclopedia of Genes and Genomes (KEGG). The enzyme 4-cumarate: CoA-ligase (6.2.1.12) is highlighted in red.
15De novo assembly and analysis of DEGs in sugarcane
Genetics and Molecular Research 16 (2): gmr16028845
One gene annotated as cullin-1-like showed higher expression at 30 days of water stress, followed by a reduction after that (Table S3). Cullin proteins are molecular scaffolds that play crucial roles in the post-translational modification of cellular proteins involving ubiquitin (Sarikas et al., 2011). Ubiquitins regulate a series of processes in eukaryotic cells and exert their functions through binding to other cellular proteins, thereby altering the stability, localization or activity of the target protein (Pickart and Eddins, 2004). These proteins, therefore, play a fundamental role in the biology of plants, including the abiotic stress response, immunity, and hormone signaling, interfering with the main components of these pathways (Sharma et al., 2016).
An induced gene that encodes an aquaporin was also identified in the tolerant cultivar. Expression of this gene was reduced at 30 and 90 days and increased at 60 days (Table S3). The growth and development of plants are known to depend on the regulation of water movement through the plant, and the diffusion of water across cell membranes is facilitated by aquaporins, which provide the means to rapidly and reversibly modify water permeability; this is achieved by changing the density and activity of aquaporins in the membrane, including post-translational modifications and interactions with proteins that act on their transit. In this way, aquaporins may act in concert with stomatal regulation and control water conductivity from the root to the leaf (Chaumont and Tyerman, 2014; Jarzyniak and Jasiński, 2014).
Genes induced in the sensitive cultivar
About genes induced in the sensitive cultivar, several transcripts related to kinases were observed, whose expression was increased along the water-deficit period (Table S4). Kinases are involved in various signal transduction pathways in response to different types of biotic and abiotic stress (Ho, 2015).
A large number of external stimuli perceived by plants and translated into signals could be related to the sufficient number of receptor-like protein kinases (RLK) genes described in plants (at least 610 receptor kinases in Arabidopsis thaliana) (Torii, 2004). RLKs are important for the response of plants to biotic and abiotic stress, but little is known about their functions in response to the latter (de Lorenzo et al., 2009). Receptor kinases typically contain an extracellular domain followed by a transmembrane domain and a cytoplasmic kinase domain. Recognition of an extracellular ligand leads to the activation of the intracellular (cytoplasmic kinase) domain and consequent signal transduction (Torii, 2004). Receptor kinases can phosphorylate different residues such as serine/threonine, cysteine, and tyrosine. Plant receptor kinases are classified based on the structure of the extracellular domains: leucine-rich repeats (LRRs), S domains [homologous to the S (self-incompatibility) locus glycoprotein], domains with epidermal growth factor repeats, and lectin domains (Torii and Clark, 2000; Shiu and Bleecker, 2001). Leucine-rich repeat receptor kinases comprise the largest subfamily of RLKs in plants and have been widely studied. A large number of LRR-RLKs in plants are probably related to the specific recognition of a wide range of extracellular signals (de Lorenzo et al., 2009). The high expression of a large number of kinase-related transcripts (LRR-containing protein kinase, serine/threonine kinase, cysteine-rich receptor-like protein kinase, death-associated protein kinase 3-like, receptor-like protein kinase 5) in the sensitive cultivar (Table S4) suggests their role in the detection of external signals to activate signal transduction pathways and to regulate the expression of genes involved in the adaptation during water deficit. Although these plants are considered sensitive to drought, it should be remembered that the water deficit applied did not consist of the complete absence
16A.A. Belesini et al.
Genetics and Molecular Research 16 (2): gmr16028845
of irrigation. Also, even under the water deficit applied, these plants were able to develop and grow until the end of treatment, apparently without major damage. Comparison of the cultivars showed differences in height between sampling time points in the tolerant cultivar; however, no significant differences were observed when compared to the height of the sensitive cultivar (data not shown). These results suggest that the tolerant cultivar is very well adapted to this water-deficit condition, without the need to activate receptor kinase genes.
Basic helix-loop-helix transcription factors (HLH/bHLH) were identified in the sensitive cultivar along the water-deficit period, with the observation of higher expression at 30 days of water stress (Table S4). These proteins belong to a family of transcription regulators found in three eukaryotic kingdoms (Heim et al., 2003). Little is known about the bHLH family in plants. Vantini et al. (2015), investigating the effects of water deficit in sugarcane, observed the expression of bHLH after 3 days of water stress (complete absence of irrigation). Studying A. thaliana, Hao et al. (2012) concluded that bHLH, together with factors that interact with phytochromes, regulates cell elongation and plant development in response to light and hormones.
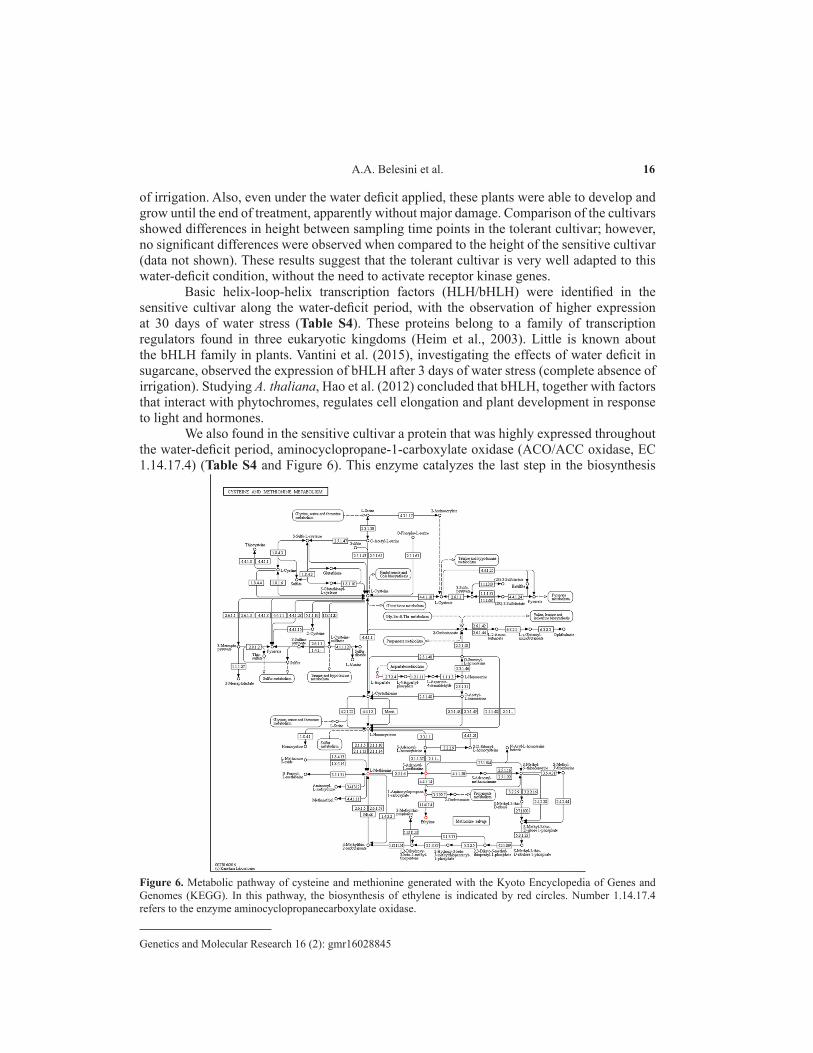
We also found in the sensitive cultivar a protein that was highly expressed throughout the water-deficit period, aminocyclopropane-1-carboxylate oxidase (ACO/ACC oxidase, EC 1.14.17.4) (Table S4 and Figure 6). This enzyme catalyzes the last step in the biosynthesis
Figure 6. Metabolic pathway of cysteine and methionine generated with the Kyoto Encyclopedia of Genes and Genomes (KEGG). In this pathway, the biosynthesis of ethylene is indicated by red circles. Number 1.14.17.4 refers to the enzyme aminocyclopropanecarboxylate oxidase.
17De novo assembly and analysis of DEGs in sugarcane
Genetics and Molecular Research 16 (2): gmr16028845
of ethylene, a hormone that plays an important role in different stages of plant growth and development such as the germination, maturation, and senescence of fruits (Mirica and Klinman, 2008). In tomato, ACC oxidase accumulates in various tissues during different stages of development and during leaf, fruit, and flower senescence (Barry et al., 1996). In 2014, silencing of the ACC genes was performed in a study on corn to modulate the levels of ethylene production. The results showed that a reduction in the biosynthesis pathway of ethylene could improve grain production by inhibiting their senescence (Habben et al., 2014). In the sensitive cultivar, this gene probably acts by increasing the synthesis of ethylene, inducing the maturation and senescence of leaves, which indeed was observed in this cultivar, although yellowing was discrete but perceptible when compared to the tolerant cultivar (data not shown). In this respect, the expression of a transcript related to apoptosis (death-associated protein kinase 3-like) was only observed in the sensitive cultivar (Table S4). The high expression of this transcript, as well as of aminocyclopropane-1-carboxylate-1-like protein, suggests the combined action of these genes, causing mild leaf senescence and yellowing.
Some transcripts showed no similarity with the databases analyzed (Tables S3 and S4), suggesting that these transcripts encode proteins that have not yet been described in public databases. These data, together with the de novo transcriptome assembly, contribute to studies on sugarcane and enrich the knowledge about this crop whose genome sequence is not yet available, thus permitting a better understanding and correlation of gene expression during periods of prolonged water deficit.
Conflicts of interest
The authors declare no conflict of interest.
ACKNOWLEDGMENTS
We thank Coordenação de Aperfeiçoamento de Pessoal de Nível Superior (CAPES) and Fundação de Amparo à Pesquisa do Estado de São Paulo (FAPESP) (Grants #2013/22122-0 and #2013/11617-9) for financial support. We are also grateful to the team of Prof. Dr. Jairo Cazetta for providing the plant material for the study, and to Embrapa Informática Agropecuária (Campinas, São Paulo, Brazil) for permitting the use of the Laboratório Multiusuário de Bioinformática da Embrapa (LMB).
REFERENCES
Abe H, Urao T, Ito T, Seki M, et al. (2003). Arabidopsis AtMYC2 (bHLH) and AtMYB2 (MYB) function as transcriptional activators in abscisic acid signaling. Plant Cell 15: 63-78. https://doi.org/10.1105/tpc.006130
Andrade JCF, Terto J, Silva JV and Almeida C (2015). Expression profiles of sugarcane under drought conditions: Variation in gene regulation. Genet. Mol. Biol. 38: 465-469. https://doi.org/10.1590/S1415-475738420140288
Barling A, Swaminathan K, Mitros T, James BT, et al. (2013). A detailed gene expression study of the Miscanthus genus reveals changes in the transcriptome associated with the rejuvenation of spring rhizomes. BMC Genomics 14: 864-879. https://doi.org/10.1186/1471-2164-14-864
Barry CS, Blume B, Bouzayen M, Cooper W, et al. (1996). Differential expression of the 1-aminocyclopropane-1-carboxylate oxidase gene family of tomato. Plant J. 9: 525-535. https://doi.org/10.1046/j.1365-313X.1996.09040525.x
Becker-André M, Schulze-Lefert P and Hahlbrock K (1991). Structural comparison, modes of expression, and putative cis-acting elements of the two 4-coumarate: CoA ligase genes in potato. J. Biol. Chem. 266: 8551-8559.
Boguski MS, Lowe TM and Tolstoshev CM (1993). dbEST--database for “expressed sequence tags”. Nat. Genet. 4: 332-
18A.A. Belesini et al.
Genetics and Molecular Research 16 (2): gmr16028845
333. https://doi.org/10.1038/ng0893-332Cardoso-Silva CB, Costa EA, Mancini MC, Balsalobre TW, et al. (2014). De novo assembly and transcriptome analysis of
contrasting sugarcane varieties. PLoS One 9: e88462. https://doi.org/10.1371/journal.pone.0088462Carlin SD and Santos DMM (2009). Indicadores fisiológicos da interação entre déficit hídrico e acidez do solo em cana-de-
açúcar. Pesqui. Agropecu. Bras. 44: 1106-1113. https://doi.org/10.1590/S0100-204X2009000900006Carson DL and Botha FC (2000). Preliminary analysis of expressed sequence tags for sugarcane. Crop Sci. 40: 1769-1779.
https://doi.org/10.2135/cropsci2000.4061769xCarson DL and Botha FC (2002). Genes expressed in sugarcane maturing intermodal tissue. Plant Cell Rep. 20: 1075-
1081. https://doi.org/10.1007/s00299-002-0444-1Castro PHL, Tavares RM, Bejarano ER and Azevedo H (2012). SUMO, a heavyweight player in plant abiotic stress
responses. Cell. Mol. Life Sci. 69: 3269-3283. https://doi.org/10.1007/s00018-012-1094-2Catala R, Ouyang J, Abreu IA, Hu Y, et al. (2007). The Arabidopsis E3 SUMO ligase SIZ1 regulates plant growth and
drought responses. Plant Cell 19: 2952-2966. https://doi.org/10.1105/tpc.106.049981Chaumont F and Tyerman SD (2014). Aquaporins: highly regulated channels controlling plant water relations. Plant
Physiol. 164: 1600-1618. https://doi.org/10.1104/pp.113.233791Chowdhury EK, Choi B, Cho B-K, Kim JK, et al. (2013). Regulation of 4CL, encoding 4-coumarate: coenzyme A ligase,
expression in kenaf under diverse stress conditions. Plant Omics 6: 254-262.CONAB - Companhia Nacional de Abastecimento (2016). Acompanhamento de safra brasileira: Cana-de-açúcar. Quarto
levantamento, abril/2016. Available at [http://www.conab.gov.br/OlalaCMS/uploads/arquivos/16_04_14_09_06_31_boletim_cana_portugues_-_4o_lev_-_15-16.pdf ]. Accessed May 19, 2016.
de Araujo PG, Rossi M, de Jesus EM, Saccaro Jr NL, et al. (2005). Transcriptionally active transposable elements in recent hybrid sugarcane. Plant J. 44: 707-717. https://doi.org/10.1111/j.1365-313X.2005.02579.x
Desikan R, A-H-Mackerness S, Hancock JT and Neill SJ (2001). Regulation of the Arabidopsis transcriptome by oxidative stress. Plant Physiol. 127: 159-172. https://doi.org/10.1104/pp.127.1.159
Dixon RA and Paiva NL (1995). Stress-induced phenilpropanoid metabolism. Plant Cell 7: 1085-1097. https://doi.org/10.1105/tpc.7.7.1085
Falco MC and Silva-Filho MC (2003). Expression of soybean proteinase inhibitors in transgenic sugarcane plants: Effects on natural defense against Diatraea saccharalis (Lepidoptera: Crambidae). Plant Physiol. Biochem. 41: 761-766. https://doi.org/10.1016/S0981-9428(03)00100-1
Goodstein DM, Shu S, Howson R, Neupane R, et al. (2012). Phytozome: a comparative platform for green plant genomics. Nucleic Acids Res. 40: D1178-D1186. https://doi.org/10.1093/nar/gkr944
Grabherr MG, Haas BJ, Yassour M, Levin JZ, et al. (2013). Trinity: reconstructing a full-length transcriptome without a genome from RNA-Seq data. Nat. Biotechnol. 29: 644-652. https://doi.org/10.1038/nbt.1883
Grativol C, Regulski M, Bertalan M, McCombie WR, et al. (2014). Sugarcane genome sequencing by methylation filtration provides tools for genomic research in the genus Saccharum. Plant J. 79: 162-172. https://doi.org/10.1111/tpj.12539
Gui J, Shen J and Li L (2011). Functional characterization of evolutionarily divergent 4-coumarate:coenzyme a ligases in rice. Plant Physiol. 157: 574-586. https://doi.org/10.1104/pp.111.178301
Habben JE, Bao X, Bate NJ, DeBruin JL, et al. (2014). Transgenic alteration of ethylene biosynthesis increases grain yield in maize under field drought-stress conditions. Plant Biotechnol. J. 12: 685-693. https://doi.org/10.1111/pbi.12172
Hahlbrock B and Scheel D (1989). Physiology and molecular biology of phenylpropanoid metabolism. Annu. Rev. Plant Physiol. Plant Mol. Biol. 40: 1-569. https://doi.org/10.1146/annurev.pp.40.060189.002023
Hamberger B and Hahlbrock K (2004). The 4-coumarate: CoA ligase gene family in Arabidopsis thaliana comprises one rare, sinapate-activating and three commonly occurring isoenzymes. Proc. Natl. Acad. Sci. USA 101: 2209-2214. https://doi.org/10.1073/pnas.0307307101
Hao Y, Oh E, Choi G, Liang Z, et al. (2012). Interactions between HLH and bHLH factors modulate light-regulated plant development. Mol. Plant 5: 688-697. https://doi.org/10.1093/mp/sss011
Heim MA, Jakoby M, Werber M, Martin C, et al. (2003). The basic helix-loop-helix transcription factor family in plants: a genome-wide study of protein structure and functional diversity. Mol. Biol. Evol. 20: 735-747. https://doi.org/10.1093/molbev/msg088
Ho HL (2015). Functional roles of plant protein kinases in signal transduction pathways during abiotic and biotic stress. J. Biodivers. Biopros. Dev 2: 147-154.
Iskandar HM, Casu RE, Fletcher AT, Schmidt S, et al. (2011). Identification of drought-response genes and a study of their expression during sucrose accumulation and water deficit in sugarcane culms. BMC Plant Biol. 11: 12. https://doi.org/10.1186/1471-2229-11-12
Jarzyniak KM and Jasiński M (2014). Membrane transporters and drought resistance - a complex issue. Front. Plant Sci.
19De novo assembly and analysis of DEGs in sugarcane
Genetics and Molecular Research 16 (2): gmr16028845
5: 687-701. https://doi.org/10.3389/fpls.2014.00687Kido EA, Ferreira Neto JRC, Silva RLO, Pandolfi V, et al. (2012). New insights in the sugarcane transcriptome responding
to drought stress as revealed by super SAGE. Sci. World J. 2012: 821062. https://doi.org/10.1100/2012/821062Kim C, Lee TH, Compton RO, Robertson JS, et al. (2013). A genome-wide BAC end-sequence survey of sugarcane
elucidates genome composition, and identifies BACs covering much of the euchromatin. Plant Mol. Biol. 81: 139-147. https://doi.org/10.1007/s11103-012-9987-x
Knight H and Knight MR (2001). Abiotic stress signalling pathways: specificity and cross-talk. Trends Plant Sci. 6: 262-267. https://doi.org/10.1016/S1360-1385(01)01946-X
Kurama EE, Fenille RC, Rosa VE, Jr., Rosa DD, et al. (2002). Mining the enzymes involved in the detoxification of reactive oxygen species (ROS) in sugarcane. Mol. Plant Pathol. 3: 251-259. https://doi.org/10.1046/j.1364-3703.2002.00119.x
Langmead B and Salzberg SL (2012). Fast gapped-read alignment with Bowtie 2. Nat. Methods 9: 357-359. https://doi.org/10.1038/nmeth.1923
Li M, Liang Z, Zeng Y, Jing Y, et al. (2016). Differential expression profiles and pathways of genes in sugarcane leaf at elongation stage in response to drought stress. BMC Genomics 17: 195-206. https://doi.org/10.1186/s12864-016-2552-2
Li W and Godzik A (2006). Cd-hit: a fast program for clustering and comparing large sets of protein or nucleotide sequences. Bioinformatics 22: 1658-1659. https://doi.org/10.1093/bioinformatics/btl158
Lindermayr C, Möllers B, Fliegmann J, Uhlmann A, et al. (2003). Deletion of a Single Amino Acid Residue from Different 4-Coumarate: CoA Ligases from Soybean Results in the Generation of New Substrate Specificitie. Eur. J. Biochem. 269: 1304-1315. https://doi.org/10.1046/j.1432-1033.2002.02775.x
de Lorenzo L, Merchan F, Laporte P, Thompson R, et al. (2009). A novel plant leucine-rich repeat receptor kinase regulates the response of Medicago truncatula roots to salt stress. Plant Cell 21: 668-680. https://doi.org/10.1105/tpc.108.059576
Love MI, Huber W and Anders S (2014). Moderated estimation of fold change and dispersion for RNA-seq data with DESeq2. Genome Biol. 15: 550. https://doi.org/10.1186/s13059-014-0550-8
Lyzenga WJ and Stone SL (2012). Abiotic stress tolerance mediated by protein ubiquitination. J. Exp. Bot. 63: 599-616. https://doi.org/10.1093/jxb/err310
McCarthy DJ, Chen Y and Smyth GK (2012). Differential expression analysis of multifactor RNA-Seq experiments with respect to biological variation. Nucleic Acids Res. 40: 4288-4297. https://doi.org/10.1093/nar/gks042
Mello MO, Tanaka AS and Silva-Filho MC (2003). Molecular evolution of Bowman-Birk type proteinase inhibitors in flowering plants. Mol. Phylogenet. Evol. 27: 103-112. https://doi.org/10.1016/S1055-7903(02)00373-1
Mirica LM and Klinman JP (2008). The nature of O2 activation by the ethylene-forming enzyme 1-aminocyclopropane-1-carboxylic acid oxidase. Proc. Natl. Acad. Sci. USA 105: 1814-1819. https://doi.org/10.1073/pnas.0711626105
Mittler R (2002). Oxidative stress, antioxidants and stress tolerance. Trends Plant Sci. 7: 405-410. https://doi.org/10.1016/S1360-1385(02)02312-9
Nogueira FT, De Rosa VE, Jr., Menossi M, Ulian EC, et al. (2003). RNA expression profiles and data mining of sugarcane response to low temperature. Plant Physiol. 132: 1811-1824. https://doi.org/10.1104/pp.102.017483
Papini-Terzi FS, Rocha FR, Vêncio RZ, Oliveira KC, et al. (2005). Transcription profiling of signal transduction-related genes in sugarcane tissues. DNA Res. 12: 27-38. https://doi.org/10.1093/dnares/12.1.27
Pickart CM and Eddins MJ (2004). Ubiquitin: structures, functions, mechanisms. Biochim. Biophys. Acta 1695: 55-72. https://doi.org/10.1016/j.bbamcr.2004.09.019
Pincelli RP and Silva MA (2012). Alterações morfológicas foliares em cultivares de cana-de-açúcar em resposta à deficiência hídrica. Biosci. J. 28: 546-556.
Rocha FR, Papini-Terzi FS, Nishiyama MY, Jr., Vêncio RZN, et al. (2007). Signal transduction-related responses to phytohormones and environmental challenges in sugarcane. BMC Genomics 8: 71-93. https://doi.org/10.1186/1471-2164-8-71
Rodrigues FA, Laia ML and Zingaretti SM (2009). Analysis of gene expression profiles under water stress in tolerant and sensitive sugarcane plants. Plant Sci. 176: 286-302. https://doi.org/10.1016/j.plantsci.2008.11.007
Sarikas A, Hartmann T and Pan ZQ (2011). The cullin protein family. Genome Biol. 12: 220. https://doi.org/10.1186/gb-2011-12-4-220
Schmelzer E, Kruger-Lebus S and Hahlbrock K (1989). Temporal and Spatial Patterns of Gene Expression around Sites of Attempted Fungal Infection in Parsley Leaves. Plant Cell 1: 993-1001. https://doi.org/10.1105/tpc.1.10.993
Sharma M and Pandey GK (2016). Expansion and function of repeat domain proteins during stress and development in plants. Front. Plant Sci. 6:1218.

20A.A. Belesini et al.
Genetics and Molecular Research 16 (2): gmr16028845
Sharma B, Joshi D, Yadav PK, Gupta AK, et al. (2016). Role of ubiquitin-mediated degradation system in plant biology. Front. Plant Sci. 7: 806. https://doi.org/10.3389/fpls.2016.00806
Shen G, Kuppu S, Venkataramani S, Wang J, et al. (2010). ANKYRIN REPEAT-CONTAINING PROTEIN 2A is an essential molecular chaperone for peroxisomal membrane-bound ASCORBATE PEROXIDASE3 in Arabidopsis. Plant Cell 22: 811-831. https://doi.org/10.1105/tpc.109.065979
Shiu SH and Bleecker AB (2001). Plant receptor-like kinase gene family: diversity, function, and signaling. Sci. STKE 2001: re22.
Silva MA, Jifon JL, Silva JAG and Sharma V (2007). Use of physiological parameters as fast tools to screen for drought tolerance in sugarcane. Braz. J. Plant Physiol. 19: 193-201. https://doi.org/10.1590/S1677-04202007000300003
Soares-Costa A, Beltramini LM, Thiemann OH and Henrique-Silva F (2002). A sugarcane cystatin: recombinant expression, purification, and antifungal activity. Biochem. Biophys. Res. Commun. 296: 1194-1199. https://doi.org/10.1016/S0006-291X(02)02046-6
Sugiharto B, Ermawati N, Mori H, Aoki K, et al. (2002). Identification and characterization of a gene encoding drought-inducible protein localizing in the bundle sheath cell of sugarcane. Plant Cell Physiol. 43: 350-354. https://doi.org/10.1093/pcp/pcf039
Torii KU (2004). Leucine-rich repeat receptor kinases in plants: structure, function, and signal transduction pathways. Int. Rev. Cytol. 234: 1-46. https://doi.org/10.1016/S0074-7696(04)34001-5
Torii KU and Clark SE (2000). Receptor-like kinases in plant development. Adv. Bot. Res. 32: 225-267. https://doi.org/10.1016/S0065-2296(00)32026-2
Vantini JS, Dedemo GC, Jovino Gimenez DF, Fonseca LF, et al. (2015). Differential gene expression in drought-tolerant sugarcane roots. Genet. Mol. Res. 14: 7196-7207. https://doi.org/10.4238/2015.June.29.13
Vargas L, Santa Brígida AB, Mota Filho JP, de Carvalho TG, et al. (2014). Drought tolerance conferred to sugarcane by association with Gluconacetobacter diazotrophicus: a transcriptomic view of hormone pathways. PLoS One 9: e114744. https://doi.org/10.1371/journal.pone.0114744
Vettore AL, Silva FR, Kemper EL and Arruda P (2001). The libraries that made SUCEST. Genet. Mol. Biol. 24: 1-7. https://doi.org/10.1590/S1415-47572001000100002
Vettore AL, da Silva FR, Kemper EL, Souza GM, et al. (2003). Analysis and functional annotation of an expressed sequence tag collection for tropical crop sugarcane. Genome Res. 13: 2725-2735. https://doi.org/10.1101/gr.1532103
Zhang S, Qi Y, Liu M and Yang C (2013). SUMO E3 ligase AtMMS21 regulates drought tolerance in Arabidopsis thaliana (F). J. Integr. Plant Biol. 55: 83-95. https://doi.org/10.1111/jipb.12024
Supplementary material
Table S1. Initial pre- and post-processing result of the data after sequencing of the 54 libraries.
Table S2. Number of genes differentially expressed between treatments (row x column).
Table S3. Genes induced in the tolerant sugarcane cultivar subjected to prolonged water deficit.
Table S4. Genes induced in the sensitive sugarcane cultivar subjected to prolonged water deficit.