de l’angiogénèse tumroale - Ektopic Imag angiogenese DES cuenod.pdf · Regional blood perfusion...
78
Transcript of de l’angiogénèse tumroale - Ektopic Imag angiogenese DES cuenod.pdf · Regional blood perfusion...

Détection des petites masses
Seuil de détection
= 1cm

La prolifération cellulaire entraîne de
nombreuses conséquences

Concept d’angiogénèse en oncologie
1971 Judah Folkman
New England Journal of Medecine

Phase prévasculaire ===>Switch ==> Phase vasculaire


Architecture
chaotique
Jain RK. Science. 2005, 307(5706): 58-62
Propriétés des
vaisseaux tumoraux

Remodelage Maturation
• Griebel et Brix (Neuhenberg)

Microcirculation des tumeurs
(fonction)
• GR ralentis,
• Diminution brutale de flux,
• Stagnation, flux inversé,
• Obstruction de vx d’alimentation (périphérie ++)
• Vasomotion artériolaire spontanée absente
• Hypoxie tissulaire ( Nécrose/Angiogénèse)
• Hyperperméabilité (macromolécules) oedème

Dynamic Contrast Enhanced MRI
DCE-MRI


PRE RV RV - PA
LV +250 sec +500 sec
Images from a dynamic T1w sequence

PRE RV RV - PA
LV +250 sec +500 sec
Images from a dynamic T1w sequence

0
5
10
15
20
0 50 100 150 200 250 300
Delt
a 1
/T1 (
sec-1
)
t (sec)
Cinétiques de rehaussement

(s)
AIF
Arterial input function
Interstitium
Plasma
Tissue qT = qpc + qi
Décomposition du
rehaussement tissulaire

Agents de contraste diffusants dans
l’interstitium
Ne diffusent pas dans les cellules +++

IN
OUT
Paramètres de microcirculation
Regional blood perfusion (ml/min/100ml)
Fractional Blood volume
(%)
Permeability
x surface (ml/min/100ml)
Dependent on tracer
Fractional intersitial volume (%)

Paramètres de microcirculation
IN
OUT
FT (ml/min/100ml)
BV (%)
PS (ml/min/100ml)
Dependent on tracer
Ve (%)
Mean Transit time TTM= VB/FT

Wash-out => malignant
Resolution temporelle faible (1i/60s)
Acquisition longue (8 min)
Résolution temporelle élevée (1i/2s)
Acquisition courte (90s)
DCE-MRI

Qualitative
Measurements
Quantitative - Physiological
Measurements

Critères dynamiques
Profil « malignité » ….. « bénignité » Kuhl Eur. Radiol.2000;10:46-58
57% des K 34 % des K 9% des K 5% des L.Bénignes 12% des LB 83% des LB
Kuhl Eur. Radiol.2000;10:46-58

Semi-quantitative approach
Peak Height (PH)
Slope
Time to peak (TTP)

Empirical enhancement descriptions
Ct t C0 1 e t e t
Bi-exponential
S(t) = A / (1 + (B/t)C)
Hill function

Ovarian tumors
Benign Borderline Invasive
NS
<0.05
<0.05
NS NS
<0.05
Max Amplitude Half rising time Max slope
Thomassin et al Radiology 2008

Quantification process
acquisition
I t
I
calibration
+
c
= t
c
t
adjustment

Arterial input
function
106 patients
• True individual AIF
• Mean AIF
• Synthetic AIF

Large variety of models …..
Perfusion models - First pass models Axel
Maximal gradient Miles
Gamma variate
Ostergaard-Sorensen
Permeability models Tofts and Kermode / Kety / Larsson/ Knopp
Patlak Shames-Brash
Extended Kety
Comprehensive models St Lawrence-T Lee
Brix
Cuenod and de Bazelaire
• • •

FTB
Artery (AIF) Tissue
Plasma
artery
red cells
interstitium
vpc
qpc
vi
qi
Plasma
capillary
red cells
tissue cells
PS
vRC
0
vCell
0
1-Hct
qpa
FTp
FTB
FTp
VT =1
qT
Hct
0

long acquisition time
high temporal resolution
PS
Ve
VB
FT

Intermediate acquisition time
Back flow from interstitum not
detectable
PS
Ve
VB
FT

Short acquisition time (1st pass)
Leak into the interstitium is not detectable
PS
Ve
VB
FT

Ultra-short acquisition time Venous out-flow is neglected
PS
Ve
VB
FT

1 image/ 10 sec 1 image / 1 min
Sampling rate

1 image/ 10 sec 1 image / 1 min
Peak is missed
Slope is wrong
Steady state good

Unified Theory of Microvascular imaging
Acquisition
Sampling
rate
Short
60s
Intermediate
1-5min
Long
8-12 min
high
1-3 s
FT VB
-- --
First pass
FT VB
PS --
FT VB
PS Ve
Comp. Model
intermediate
-- VB
KPS --
Patlak
-- VB
Ktrans Ve
Extend. Kety
low
30-60s

DCE-MRI
Problèmes spécifiques

Sequence Optimisation
Without superior
saturation band
Without inferior saturation
band

Sequence optimisation
flip angle : dynamique range and linearity
-500
0
500
1000
1500
2000
2500
-10 0 10 20 30 40 50 60 70
90°
60°
30° 10°
SI[a
.u]
Gado[mM]
3500
3000
2500
2000
1500
1000
500
0
Flip angle
EA
rt m
ax (
%)
10 20 30 40 50 60 70 80 90
Peak Height in vivo SI vs [Gd] in vitro

Tumor Heterogeneity and volume acquisition
25.33 ml/min 21.87 ml/min
14.25 ml/min 12.31 ml/min
Hakimé et al. Radiology.2007; 243: 712-719. CT Perfusion for Determination of Pharmacologically Mediated Blood Flow Changes.

Time
z
More slices or larger coverage

FTB
Artery (AIF) Tissue
Plasma
artery
red cells
interstitium vi
qi
Plasma
capillary
red cells
tissue cells
PS FTp
FTB
FTp
AIF Delay
FTB
Artery (AIF) Tissue
Plasma
artery
red cells
interstitium vi
qi
Plasma
capillary
red cells
tissue cells
D
PS FTp
FTB
FTp
ROI

Fonctional maps
Perfusion
Fractional
blood volume
Permeability x
surface

Heterogeneity : histogram

DCE-MRI
Applications

Evaluation de tt
antiangiogéniques
Traitées (n=13) Placebos (n=17)
0
5
10
15
20
0 50 100 150 200 250 300
Delt
a 1
/T1 (
sec-1
)
t (sec)

Permeability
Blood Volume
Blood Flow
TREATED UNTREATED

Blood volume variations
Untreated
Untreated
treated
median

Untreated treated

• Padhani et al Prediction of Clinicopathologic Response of Breast Cancer to Primary Chemotherapy at CE MRI Radiology 2006:361-374
Responding to mitoxantrone and methotrexate Non Responding
C1 C1
C2 C2
BL BL

Copyright ©2006 American Association for Cancer Research
Muruganandham, M. et al. Mol Cancer Ther 2006;5:1950-1957
• human lung tumor xenografts
• in nude mice
• RO0281501: inhibitor of
tyrosine kinase receptors (VEGF,
FGF PDGF)
vehicle
RO0281501

différentes méthodologies...
Nécessité d’établir des standardisations de mesure et
d’évaluation dans les études multicentriques(Padhani et al. 2005)
Quel paramètre et quand ?
Pas de consensus …

Choix de la cible fonctionnelle
>1, 5 cm
pas trop grosse / pas trop nécrosée
La moins mobile possible
(pelvis, cou, extremités),
rétropéritoine, péritoine, paroi thoracique
poumon
pas dans le foie (circulation bi-modale)
Pas dans l’os

Limites
• Mouvements (recalage, sortie de coupe)
• Représentativité de la Cible fonctionnelle ?

ASL
Arterial Spin Labeling

Irradiation de marquage
Plan de coupe
Spin Labeling

Spin labeling (traceur endogène)
Saturation
Artère afférente
Tissu
Délai
Coupe

Spin labeling (traceur endogène)
S0
S
Sans marquage Avec marquage
-
Perte de signal Flux sanguin

- Image de marquage Image de contrôle
Soustraction Intensité de signal # Perfusion
Spin Labeling Artériel

Spin Labeling Contrôle de l’efficacité d’un traitement antiangiogénique sur des métastase pulmonaires d’un cancer du rein
Echec thérapeutique Succès thérapeutique
Bazelaire C et al. Acad Radiol, 2005. 12(3): p. 347-57

VSI
vessel size imaging
I. Troprès et al. (2001) Magn Reson Med 45:397-408.
I. Troprès et al. (2003) Magn Reson Med

VSI Acquisition simultanées d’images pondérées en T2 et en T2*
• Contrast agent: Sinerem®
– Dextran coated iron particles ( = 20 nm)
– Intravascular long blood half-life
5 gradient echo images
1 spin echo image
before after IV injection
R2*
R2

Principe
R2* = ( B0) 0 4
3 BV
R2 = 0.694 (2 B0) 2/3 D1/3
0 VSI-2/3
0 • VSI = [ R
-2/3 f (R) dR]
-3/2
VSI = 0.42 ( )1/2( )3/2 D
B0 R2
R2*
VSI
R2

Gliome C6
before injection BV map VSI map
(n = 7) BV (%) VSI (µm)
Cortex 4.3 ± 0.3 4.5 ± 0.8
Striatum 2.5 ± 0.5 4.8 ± 0.7
Tumor border 4.0 ± 0.3 7.5 ± 0.6
Non-necrotic tumor 2.0 ± 0.7 20 ± 6.3

BOLD et Oxygénation

BOLD : Blood Oxygen Level Dependency
• La déoxyhémoglobine paramagnétique augmente la relaxivité transversale R2* de l’eau.
• BOLD est sensible à la pO2 dans les vx et dans les tissus contiguës.
• Le contraste en imagerie pondérée en susceptibilité est dépendant de :
– La perfusion tissulaire
– Le niveau d’oxygénation des globules rouges
– Des composantes tissulaires statiques: myoglobine, fibrose, ligaments (exemple adénome de la prostate, ligament suspenseur des seins…)

Quantification BOLD (exemple prostate)
• Sequence EG TR 100ms, TE variable
• Ln(STE)=Ln(S0) - R2*xTE
• Effets d’entrée de flux minimisés.

FLAIR (TR=7s, TI=2s, TE=80ms,
256 x 256 in plane resolution FOV
240 mm)
For the BOLD study multiple repeat echo-planar images
(TR=4s, TE=45ms, 900, 3.75 x
3.75 x 10 mm resolution)
Green through red = signal enhancement
purple through blue = signal loss.
Karen L Fink+, Zerrin Yetkin*, Roddy
McColl* and Ralph P. Mason*Departments
of +Neurology and *Radiology, University
of Texas Southwestern Medical Center,
Dallas,

IRM de diffusion
DWI

Mol Cancer Ther 2003;2:581-7
DWI et
efficacité
thérapeutique

Astrocytome traité par radiothérapie

Oligodendrogliome traité par radiothérapie

Imagerie de ciblage
de motifs membranaires

Ciblage de l’angiogénèse
(Integrins) Carcinome V2 (Lapin)
Ciblage Endothélial
Double marquage :
• Avidine couplée au
Liposome
• Couplage Avidine -
Ac Biotinylé
Sipkins et al. Nat Med 1998

Application :Ciblage de l’angiogénèse Carcinome V2 (Lapin)
Sipkins et al. Nat Med 1998
24 heures après
injection de
Liposome-Gd :
Rehaussement
Tumoral
« Spécifique »
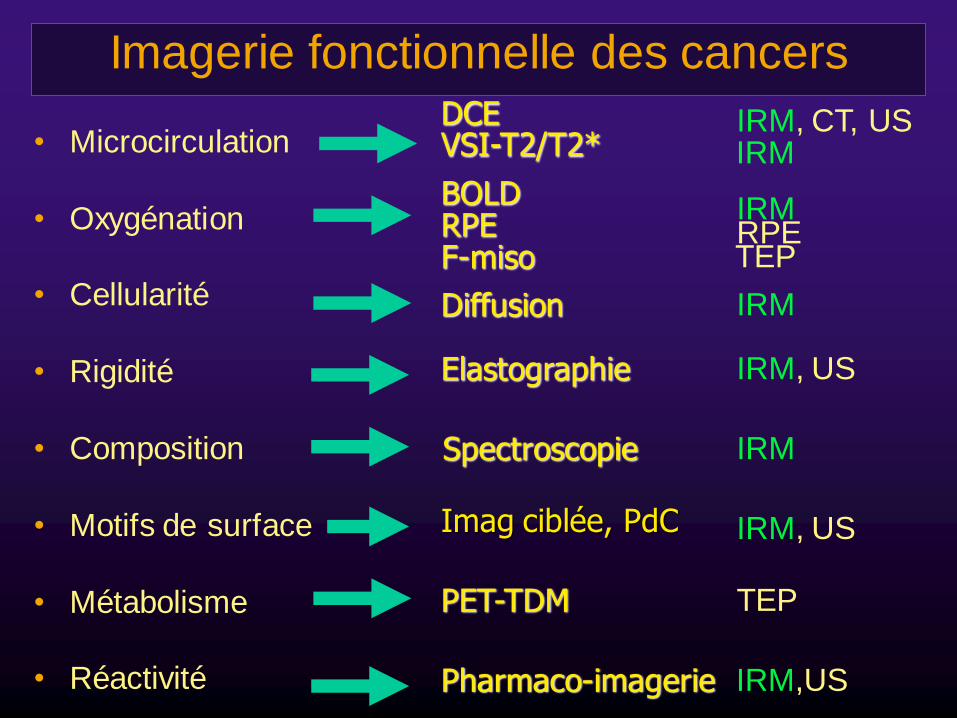
Imagerie fonctionnelle des cancers
• Microcirculation
• Oxygénation
• Cellularité
• Rigidité
• Composition
• Motifs de surface
• Métabolisme
• Réactivité
Diffusion
PET-TDM
Spectroscopie
DCE IRM, CT, US VSI-T2/T2* IRM
BOLD RPE F-miso
IRM RPE TEP
IRM
Elastographie IRM, US
IRM
Imag ciblée, PdC IRM, US
TEP
Pharmaco-imagerie IRM,US

Imagerie de la réponse au traitement
• sélection des patients
• fenêtre idéale d’administration
• ajustement de la dose
• ajustement au cours du temps
INDIVIDUALISATION DE LA PRISE EN CHARGE

Non-antigenic
Non-proliferative
Growth Factor
Independent
Autocrine
Growth-loop
Metastatic
Tumor “stem-cell”
TUMOR HETEROGENEITY
Non Invasive Tool

Non-antigenic
Non-proliferative
Growth Factor
Independent
Autocrine
Growth-loop
Metastatic
Imagerie Pixel/Pixel et Hétérogénéité
« Histologie virtuelle in vivo»