De-industrialization, Re-industrialization and the ...€¦ · De-industrialization,...
16
De-industrialization, Re-industrialization and the Resurgence of State Capitalism: The Case of Indonesia Kyunghoon KIM, Andy SUMNER Department of International Development King’s College London Transforming economies – for better jobs WIDER Development Conference in partnership with UNESCAP, 11-13 September 2019, Bangkok, Thailand
Transcript of De-industrialization, Re-industrialization and the ...€¦ · De-industrialization,...

De-industrialization,
Re-industrialization
and the
Resurgence of State Capitalism:
The Case of IndonesiaKyunghoon KIM, Andy SUMNER
Department of International DevelopmentKing’s College London
Transforming economies – for better jobsWIDER Development Conference in partnership with UNESCAP, 11-13 September 2019, Bangkok, Thailand

Key questions and research outline
• How significant is the ‘industrial upgrading’ challenge?• The key driver of ‘manufacturing gap’: Advanced countries ‘extending the ladder’
• What policy tools do developing countries have?• Focus on state-owned entities as policy tools
• Aim: To demonstrate association between weak growth-enhancing structural transformation & resurgence of state capitalism
• Case study: Indonesia’s SOE strategy under Jokowi (2014-2019)
Goals Key challenges Leading state-owned entities
Value adding & Technological upgrading
Knowledge externalitiesState enterprises
in strategic industries
Development financing Capital market imperfections State financial institutions
Infrastructure provision Investment environmentState infrastructure companies,
science institutions
Investment coordination Coordination failureState holding companies, state financial institutions

Manufacturing premier league
Source
UNIDO Statistics Data Portal
Note
1
20
1990 2016
Competitive industrial performance index: rank
China
Czechia
MexicoDenmark
Finland
Norway
Korea
U.K. CIP index is composed of(i) manufacturing value added per capita(ii) manufacturing exports per capita(iii) share of manufacturing value added in total GDP(iv) share of manufactured exports in total exports(v) share of medium- and high-tech manufacturing value added in total manufacturing value added(vi) share of medium- and high-tech manufactured exports in total manufactured exports(vii) share in world manufacturing value added (viii) share in world manufactured exports

Manufacturing premier league: Same old same old
Source
UNIDO Statistics Data Portal
Note
1
20
1990 2016
Competitive industrial performance index: rankGermanyJapan
U.S.KoreaSwitzerlandIrelandBelgiumItalyNetherlandsFranceSingaporeTaiwanAustriaSwedenU.K.
Canada.Spain
CIP index is composed of(i) manufacturing value added per capita(ii) manufacturing exports per capita(iii) share of manufacturing value added in total GDP(iv) share of manufactured exports in total exports(v) share of medium- and high-tech manufacturing value added in total manufacturing value added(vi) share of medium- and high-tech manufactured exports in total manufactured exports(vii) share in world manufacturing value added (viii) share in world manufactured exports

Most developing countries are stuck
Legend
Developing countries
Name
Advanced countries
45-degree line
Line of best fit
20 largest middle-income countries
Source
UNIDO Statistics Data Portal
Note
Russia
Brazil
MalaysiaMexico
China
Thailand
RomaniaTurkey
South AfricaPhilippines
Indonesia
Colombia
India
Peru
Egypt
Pakistan
Iran
Vietnam
Bangladesh
Nigeria
1
150
11501990 competitive industrial performance index: rank
20
16
co
mp
etitive
ind
ustr
ial p
erf
orm
an
ce in
de
x: ra
nk
CIP index is composed of(i) manufacturing value added per capita(ii) manufacturing exports per capita(iii) share of manufacturing value added in total GDP(iv) share of manufactured exports in total exports(v) share of medium- and high-tech manufacturing value added in total manufacturing value added(vi) share of medium- and high-tech manufactured exports in total manufactured exports(vii) share in world manufacturing value added (viii) share in world manufactured exports

Revival of interest in industrial policies
• 1990s: Shrinking policy space (“kicking away the ladder”)• WTO-GATT, TRIMS, GATS, TRIPS
• 2000s: Leeway and loopholes but lack of enthusiasm• “The rhetoric of latecomer countries had become largely liberal and even the most obvious deviants from liberalism
had no explicit alternative vision to guide their policymaking, so strong was the global influence of North Atlantic behavioural norms” (Amsden & Hikino 2000, 165)
• “Policy space is an empty concept in the absence of a co-ordinated plan to use it” (DiCaprio 2010, 408)
• 2010s: Post-crisis stimulus; End of commodities boom; Fear of premature de-industrialization• Strong emphasis on jobs• How to do industrial policies well: Policy sequence/combination; Institutional/public-private coordination

State-owned entities as policy tools
Inefficiency & corruption
Ownership &
governance structure
Internationalisation
Cross-bordermeasures
Investment in Fundamentals: Infrastructure,
education & institutions
Subsidies&
financing
Developmental role of
state-owned entities
Industrial policy literatureState capitalism literature
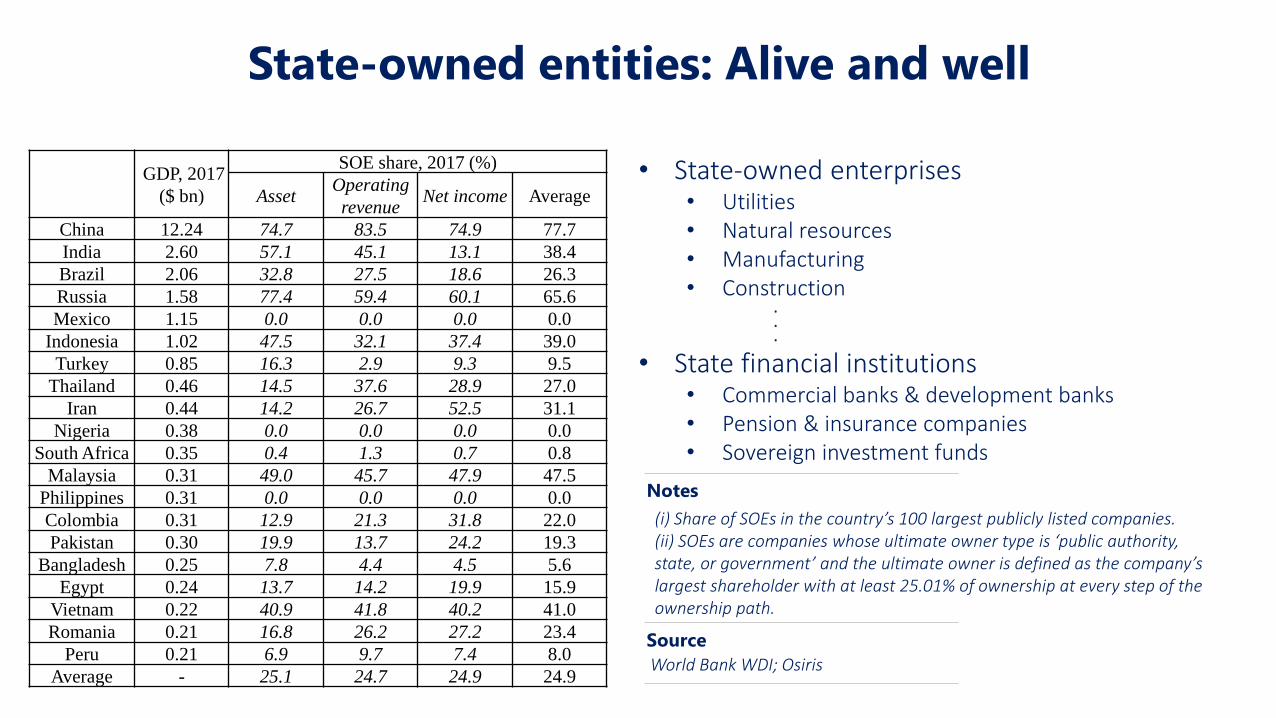
State-owned entities: Alive and well
GDP, 2017
($ bn)
SOE share, 2017 (%)
AssetOperating
revenueNet income Average
China 12.24 74.7 83.5 74.9 77.7
India 2.60 57.1 45.1 13.1 38.4
Brazil 2.06 32.8 27.5 18.6 26.3
Russia 1.58 77.4 59.4 60.1 65.6
Mexico 1.15 0.0 0.0 0.0 0.0
Indonesia 1.02 47.5 32.1 37.4 39.0
Turkey 0.85 16.3 2.9 9.3 9.5
Thailand 0.46 14.5 37.6 28.9 27.0
Iran 0.44 14.2 26.7 52.5 31.1
Nigeria 0.38 0.0 0.0 0.0 0.0
South Africa 0.35 0.4 1.3 0.7 0.8
Malaysia 0.31 49.0 45.7 47.9 47.5
Philippines 0.31 0.0 0.0 0.0 0.0
Colombia 0.31 12.9 21.3 31.8 22.0
Pakistan 0.30 19.9 13.7 24.2 19.3
Bangladesh 0.25 7.8 4.4 4.5 5.6
Egypt 0.24 13.7 14.2 19.9 15.9
Vietnam 0.22 40.9 41.8 40.2 41.0
Romania 0.21 16.8 26.2 27.2 23.4
Peru 0.21 6.9 9.7 7.4 8.0
Average - 25.1 24.7 24.9 24.9
Source
World Bank WDI; Osiris
(i) Share of SOEs in the country’s 100 largest publicly listed companies.(ii) SOEs are companies whose ultimate owner type is ‘public authority, state, or government’ and the ultimate owner is defined as the company’s largest shareholder with at least 25.01% of ownership at every step of the ownership path.
Notes
• State-owned enterprises • Utilities• Natural resources• Manufacturing• Construction
.
.
.
• State financial institutions• Commercial banks & development banks• Pension & insurance companies• Sovereign investment funds

What roles can state-owned entities play in stimulating industrialization?
China
IndiaBrazil
Russia
Mexico
Indonesia
Turkey Thailand
Iran
Nigeria
South Africa
Malaysia
Philippines
Colombia
Pakistan
Bangladesh
Egypt
Vietnam
Romania
Peru
0
0.5
1
1.5
2
2.5
3
3.5
4
4.5
0 20 40 60 80
2016
CIP
in
de
x r
ela
tive
to
Ge
rma
ny (
Ln
of %
)
SOE share, 2017 (%)
Large state
capitalist sector
Small state
capitalist sector
Leading
industrialiser
Lagging
industrialiser
Source
Osiris and UNIDO Statistics Data Portal

Indonesia’s structural change: At a crossroads
Kim, K., Sumner, A., & Yusuf, A. (2019). Is structural transformation-led economic growth immiserizing or inclusive? The case of Indonesia. In P. Shaffer, R. Kanbur & R. Sandbrook (Eds.), Immiserizing growth: When growth fails the poor (pp. 226–249). Oxford: Oxford University Press.
Source
(%)
Decomposition of labour productivity growth Manufacturing employment share

Indonesia’s state-owned entities: Overview
Name Industry
PLN Electric utilities
Pertamina Oil & gas
Taspen Insurance
Pupuk Indonesia Fertiliser manufacturing
Perkebuna Nusantara Plantation
Pelindo Port management
Angkasa Pura Airport management
KAI Railway management
Inalum Metals & mining
Dirgantara Indonesia Airplane manufacturing
PAL Indonesia Shipbuilding
INKA Train manufacturing
.
.
.Total: 85 in 2016
.
.
.
Fully state-owned enterprises Majority (51%<) state-owned enterprises
Development financiersName Industry
Sarana Multi Infrastruktur Infrastructure financing
Indonesia Eximbank Export financing
Sarana Multigriya Financial Mortgage financing
Penjaminan Infrastruktur Indonesia Infrastructure guarantee
Geo Dipa Energy Geothermal power financingTotal: 33 in 2016
Kim, K. (2019). Using partially state-owned enterprises for development in Indonesia. Asia Pacific Business Review, Advanced online publication.
Source

Strengthening state capitalism in Indonesia
State capital injection into state-owned entities
Other support tools• Providing tax incentives for fixed asset revaluation• Lowering dividend ratios• Directing state financial institutions’ loans• Establishing holding companies• Encouraging inter-SOE cooperation• Allocating government projects• Creating demand through procurement
Kim, K. (2019). The state as a patient capitalist: Growth and transformation of Indonesia’s development financiers. The Pacific Review, Advanced online publication.Kim, K. (Forthcoming). The state’s return in the Indonesian economy: Deregulation, democratisation, and development space. Journal of Contemporary Asia.
Source
Performance of state-owned enterprises
30
35
40
45
50
55
0
1
2
3
4
5
6
7
8
9
2010 2014 2018
Amount (Left)
% of GDP (Right)
('000 trillion rupiah) (%)
Asset
1
1.5
2
2.5
3
3.5
0
0.1
0.2
0.3
0.4
0.5
0.6
2010 2014 2018
Amount (Left)
% of GDP (Right)
('000 trillion rupiah) (%)
Capital expenditure

Indonesia’s SOE strategy (2015-2019)
to stimulate re-industrialization
State budget & state-directed commercial/development bank loans
Domesticbusinesses,consumers(taxpayers)
Global market
Resource-based manufacturing SOEs
- Oil/alumina/ferronickel processing etc.
Capital-intensive manufacturing SOEs- Cement, steel etc.
Technology-intensive manufacturing SOEs
- Airplanes, trains etc.
Transport infrastructure / construction SOEs- 782km of new toll roads constructed (2015–2018)
- 27 new ports constructed (2015–2018)
- LRT systems in operation (2018)/under construction; high-speed railway under construction- Electrification ratio: 86.2% (2015) → 97.2% (2018)
Financing
Products
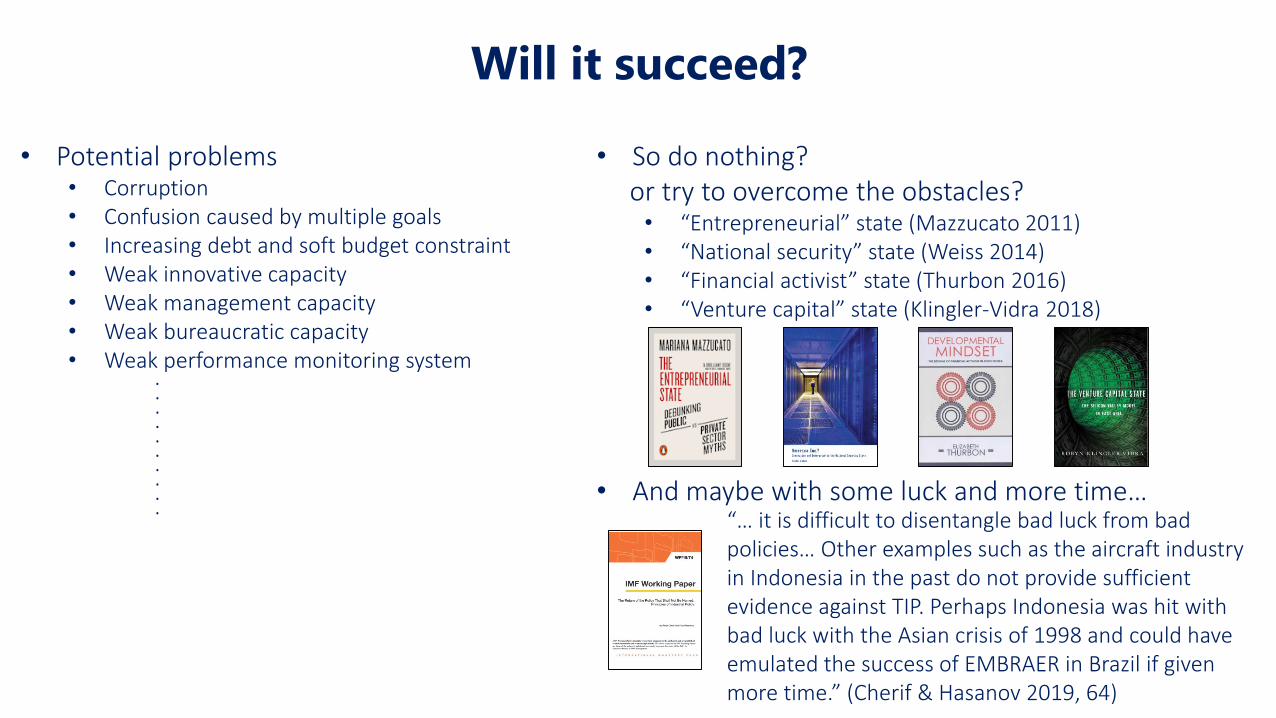
Will it succeed?
• Potential problems• Corruption• Confusion caused by multiple goals• Increasing debt and soft budget constraint• Weak innovative capacity• Weak management capacity• Weak bureaucratic capacity• Weak performance monitoring system
.
.
.
.
.
.
.
.
.
.
• So do nothing? or try to overcome the obstacles?• “Entrepreneurial” state (Mazzucato 2011)• “National security” state (Weiss 2014)• “Financial activist” state (Thurbon 2016)• “Venture capital” state (Klingler-Vidra 2018)
“… it is difficult to disentangle bad luck from bad policies… Other examples such as the aircraft industry in Indonesia in the past do not provide sufficient evidence against TIP. Perhaps Indonesia was hit with bad luck with the Asian crisis of 1998 and could have emulated the success of EMBRAER in Brazil if given more time.” (Cherif & Hasanov 2019, 64)
• And maybe with some luck and more time…

Developmental role of
state-owned entities:
Areas of further research
Reciprocal control mechanism:Incentives and monitoring
Political drivers/difficulties:State capitalism under democracy
Relationship with the private sector:Crowding out or crowding in?
Global norms and views of international financial institutions