D.B.S. Satellite Services (1998) Ltd
96
Valuation of operations as of Dec. 31, 2018 The Hebrew version was submitted by the Company to the relevant authorities pursuant to Israeli law, and represents the binding version and the only one having legal effect. This translation was prepared for convenience purposes only. March 2019 D.B.S. Satellite Services (1998) Ltd. 14 Kremenetski St., Tel Aviv, 6789912 | Phone: 03-5617801 | Fax: 03-5617765
Transcript of D.B.S. Satellite Services (1998) Ltd

Valuation of operations as of Dec. 31, 2018
The Hebrew version was submitted by the Company to the relevant authorities pursuant to Israeli law, and
represents the binding version and the only one having legal effect. This translation was prepared for
convenience purposes only.
March 2019
D.B.S. Satellite Services (1998) Ltd.
14 Kremenetski St., Tel Aviv, 6789912 | Phone: 03-5617801 | Fax: 03-5617765
2
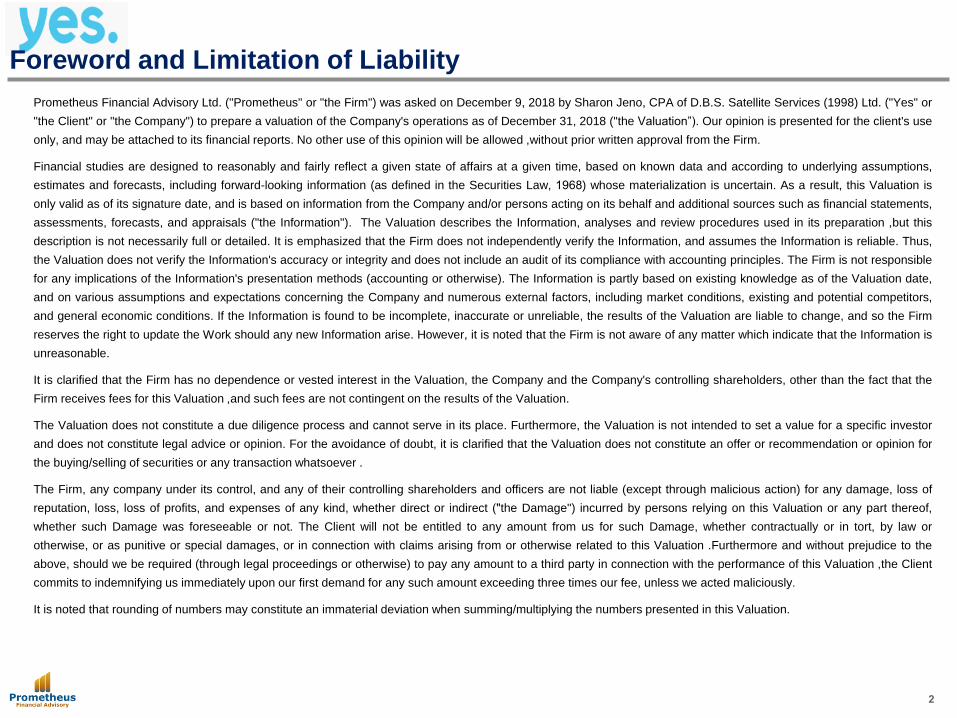
Foreword and Limitation of Liability
Prometheus Financial Advisory Ltd. ("Prometheus" or "the Firm") was asked on December 9, 2018 by Sharon Jeno, CPA of D.B.S. Satellite Services (1998) Ltd. ("Yes" or
"the Client" or "the Company") to prepare a valuation of the Company's operations as of December 31, 2018 ("the Valuation”). Our opinion is presented for the client's use
only, and may be attached to its financial reports. No other use of this opinion will be allowed , without prior written approval from the Firm.
Financial studies are designed to reasonably and fairly reflect a given state of affairs at a given time, based on known data and according to underlying assumptions,
estimates and forecasts, including forward-looking information (as defined in the Securities Law, 1968) whose materialization is uncertain. As a result, this Valuation is
only valid as of its signature date, and is based on information from the Company and/or persons acting on its behalf and additional sources such as financial statements,
assessments, forecasts, and appraisals ("the Information"). The Valuation describes the Information, analyses and review procedures used in its preparation , but this
description is not necessarily full or detailed. It is emphasized that the Firm does not independently verify the Information, and assumes the Information is reliable. Thus,
the Valuation does not verify the Information's accuracy or integrity and does not include an audit of its compliance with accounting principles. The Firm is not responsible
for any implications of the Information's presentation methods (accounting or otherwise). The Information is partly based on existing knowledge as of the Valuation date,
and on various assumptions and expectations concerning the Company and numerous external factors, including market conditions, existing and potential competitors,
and general economic conditions. If the Information is found to be incomplete, inaccurate or unreliable, the results of the Valuation are liable to change, and so the Firm
reserves the right to update the Work should any new Information arise. However, it is noted that the Firm is not aware of any matter which indicate that the Information is
unreasonable.
It is clarified that the Firm has no dependence or vested interest in the Valuation, the Company and the Company's controlling shareholders, other than the fact that the
Firm receives fees for this Valuation , and such fees are not contingent on the results of the Valuation.
The Valuation does not constitute a due diligence process and cannot serve in its place. Furthermore, the Valuation is not intended to set a value for a specific investor
and does not constitute legal advice or opinion. For the avoidance of doubt, it is clarified that the Valuation does not constitute an offer or recommendation or opinion for
the buying/selling of securities or any transaction whatsoever .
The Firm, any company under its control, and any of their controlling shareholders and officers are not liable (except through malicious action) for any damage, loss of
reputation, loss, loss of profits, and expenses of any kind, whether direct or indirect ("the Damage") incurred by persons relying on this Valuation or any part thereof,
whether such Damage was foreseeable or not. The Client will not be entitled to any amount from us for such Damage, whether contractually or in tort, by law or
otherwise, or as punitive or special damages, or in connection with claims arising from or otherwise related to this Valuation . Furthermore and without prejudice to the
above, should we be required (through legal proceedings or otherwise) to pay any amount to a third party in connection with the performance of this Valuation , the Client
commits to indemnifying us immediately upon our first demand for any such amount exceeding three times our fee, unless we acted maliciously.
It is noted that rounding of numbers may constitute an immaterial deviation when summing/multiplying the numbers presented in this Valuation.

3
Previous Valuations and Information Sources
Key Sources of Information Used in the Valuation:
• Yes's audited financial statements for 2015-2017 and the draft financial statements as of December 31, 2018
• Long-term forecast prepared by the Company's management
• Company valuation as of December 31, 2015
• Company valuation as of December 31, 2016
• Company valuation as of June 30, 2017, September 30, 2017, and December 31, 2017
• Valuation of Bezeq's holdings in Yes as of March 23, 2015
• Purchase Price Allocation (PPA) for Yes as of March 23, 2015
• Other financial data and various verbal clarifications received on demand
• Background data and market data, from public sources on the internet, news print, or other public sources
• Israel Central Bureau of Statistics and Bank of Israel data
• The Capital IQ system
• Discussions and meetings with Company staff

4
Prometheus Financial Advisory
Prometheus is a firm providing financial advisory services and expert opinions, led by Yuval Zilberstein, CPA, who serves as CEO; and
Eyal Szewach, who serves as executive partner. The Firm consults clients on M&A transactions, and on significant projects across a
diverse range of industries.
The study was conducted by a team headed by Eyal Szewach, founding partner in the Firm, who holds a bachelor's degree in electronic
engineering from the Technion, and an MBA from Tel Aviv University. Mr. Szewach is an expert with over 10 years' experience in valuation,
financial statement analysis, preparing expert opinions, and performing various financial advisory services for companies and businesses.
Sincerely,
Prometheus Financial Advisory
Ltd.
March 27, 2019
The Assessing Company

5
Table of Contents
Chapter Page
Valuation of Operations - Dec. 31, 2018
Executive Summary 6
Chapter 1 – Description of the Company's Business 12
Chapter 2 - Television Services Market 15
Chapter 3 - Financial Statement Analysis 22
Chapter 4 - Valuation 27
Appendices
Appendix A - WACC 48
Appendix B - Fair Value of STBs 49
Appendix C – Book Value 51

6
Executive Summary

7
Executive Summary
Company Overview
General
DBS Satellite Services (1998) Ltd. ("Yes" or "Multi-Channel
Television Operations") was incorporated in Israel in 1998. Yes
holds a Ministry of Communications license for satellite-based
television broadcasts .
As of the end of the second quarter of 2018*, Yes's market share
went down to 35%, from 37% at the end of 2017. This decrease
was mainly due to entry of new competitors - Cellcom, Partner,
Netflix, and others.
HOT is the company with the largest share of the multi-channel
television market - 47% as of the second quarter of 2018. Together
with Cellcom's 12% share, they are Yes's main competitors in this
market.
Yes's revenues are derived from the following sub-segments:
Multi-channel television - Yes offers a broad range of 150
different channels including 30 high-definition (HD) channels, radio
channels, and interactive services.
.* Data refer to Q2/2018, as this was HOT's last report. Subsequently, HOT"s statements
were published as part of Altice's reports which are unusable for our purposes .
Advanced services - Yes offers various advanced satellite set-
top-boxes (STBs), which allow pre-recording content and high-
resolution broadcasts
Furthermore, Yes offers a multi-room service, which allows content
recorded on a recording STB to be viewed on non-recording STB
over the home network. Yes's customers also have free access to
the yesGo application, and to Primetime and Start Over services .
VOD - Yes offers video on demand content through internet-
connected STBs.
Sting TV - OTT television services offering a selection of plans
and VOD services, connected through a streamer. Sting TV
competes at a lower price point and is the Company's response to
other streaming services.
.

8
Executive Summary
Results of Valuation
Valuation under the DCF model
As of December 31, 2018, the DCF model yields a negative
enterprise value for the Company, of NIS (871) million , compared to
a book value of NIS 886 million .
A key assumption underlying the forecast is that future technology
will be interactive and bi-directional, and that satellite products
cannot compete with IP products over time due to the growing gap in
customer experience. As a result, the long-term forecast reflects a
gradual migration (from satellite broadcasting to internet-based
broadcasting). Thus, we assumed a gradual replacement of satellite
STBs with IP STBs, upgrades to broadcasting infrastructure, building
customer service support infrastructure, and adjustment of content
contracts to OTT broadcasting. These conditions, coupled by
expectations for continued competition throughout the forecast period
and a relatively inflexible cost structure have led us to project .
significant operating losses and negative cash flows in the coming
years, before and so long as the Company completes the shift in
its technological and business model
After migrating from satellite to IP-based transmission, Yes's
satelliite segment costs will be replaced with transmission costs
inside the Group. Thus, cash flows will increase at the Group level,
as compared to continued reliance on satellite infrastructure.
Therefore, in terms of its consolidated financial statements, Bezeq
views Yes as having value beyond it's stand-alone share value.
In light of the negative enterprise value, accounting standards
mandate that Yes be valued using the net asset value method.
Results of valuation NIS millions
Portion of EV attributed to Modeled Years (741)
Portion of EV attributed to the representative year (130)
Total EV (871)

9
Executive Summary
Results of Valuation
Valuation results under NAV requirements
Under this approach , the net disposal value of the Company's
assets were valued as follows:
Thus, Yes's equity, as derived from the fair value of balance
sheet items revalued according to IAS 36 and IFRS 15, is
negative 229 million NIS.
* Outside the scope of IAS 36; presented for the sake of convenience to clarify the overall
picture.
** The asset's presentation method was provided by the Company.
Details / NIS millions
Balance sheet
value as of Dec.
31, 2018
Write-
off
Disposal
value NAV
Cash and cash equivalents 80 - 80 -
Trade receivables 132 - 132 132
Other receivables 8 - 8 8
Broadcasting rights 463 )403( 60 60
Property, plant and equipment 672 )559( 113 113
Intangible assets 107 )106( 1 1
Subscriber acquisition 29 )29*( - -
Real estate asset usage rights 84 - 84 84
Vehicle lease usage rights 31 )3**( 28 28
Total assets 1,606 (1,100) 506 425
Bank credit )14( - )14( -
Current maturities on debentures )8( - )8( -
Trade payables )440( - )440( )440(
Other payables )64( - )64( )64(
Provisions )19( - )19( )19(
Bank loans )7( - )7( -
Other liabilities )10( - )10( )10(
Employee benefits )4( - )4( -
Real estate leasing liabilities )86( - )86( )86(
Vehicle leasing liabilities )35( - )35( )35(
Total liabilities (687) - (687) (654)
Equity 919 (181) (229)
Excess of cost - goodwill for Yes
recognized in Bezeq's books 33 )33( - -
Excess of cost - customers 266 )266( - -
Excess of cost - brand 238 )238( - -
Excess of cost - tax reserve (net of
excess of cost on tax reserve for
debentures)
)116( 116 - -
Total 1,340 (1,521) (181) (229)
10
Executive Summary
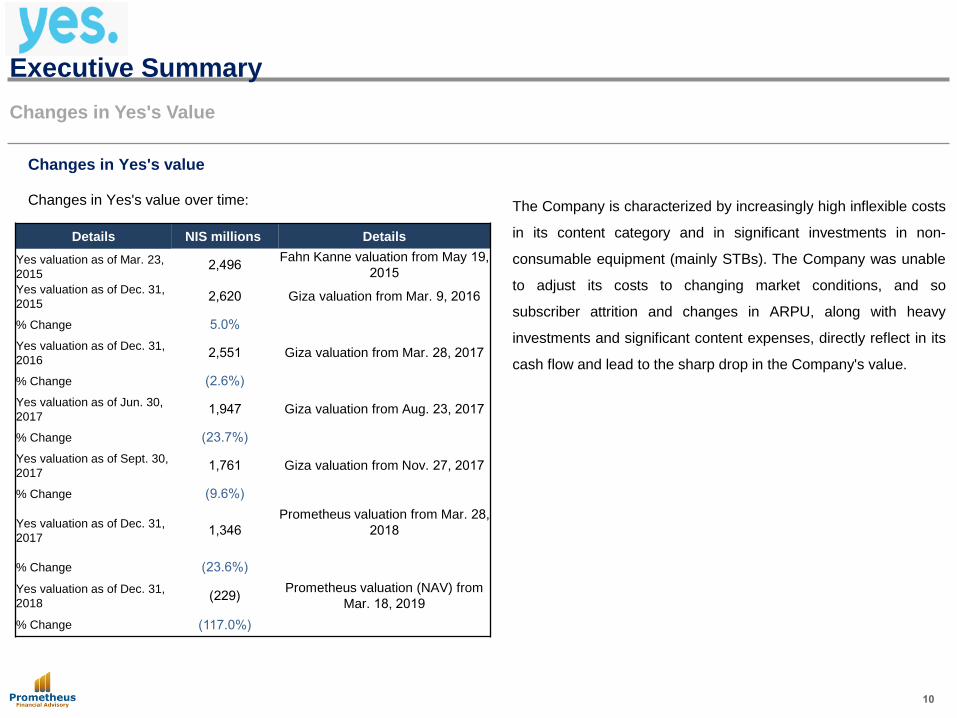
Changes in Yes's Value
Changes in Yes's value
Changes in Yes's value over time:
The Company is characterized by increasingly high inflexible costs
in its content category and in significant investments in non-
consumable equipment (mainly STBs). The Company was unable
to adjust its costs to changing market conditions, and so
subscriber attrition and changes in ARPU, along with heavy
investments and significant content expenses, directly reflect in its
cash flow and lead to the sharp drop in the Company's value.
Details NIS millions Details
Yes valuation as of Mar. 23,
2015 2,496
Fahn Kanne valuation from May 19,
2015
Yes valuation as of Dec. 31,
2015 2,620 Giza valuation from Mar. 9, 2016
% Change 5.0%
Yes valuation as of Dec. 31,
2016 2,551 Giza valuation from Mar. 28, 2017
% Change )2.6%(
Yes valuation as of Jun. 30,
2017 1,947 Giza valuation from Aug. 23, 2017
% Change )23.7%(
Yes valuation as of Sept. 30,
2017 1,761 Giza valuation from Nov. 27, 2017
% Change )9.6%(
Yes valuation as of Dec. 31,
2017 1,346
Prometheus valuation from Mar. 28,
2018
% Change )23.6%(
Yes valuation as of Dec. 31,
2018 )229(
Prometheus valuation (NAV) from
Mar. 18, 2019
% Change )117.0%(

11
Executive Summary
Yes‘s Operations – 2017 Forecast for 2022 vs . Current Forecast for 2022
Details / NIS millions
2022
forecast
(Dec. 31,
2017*)
2022 forecast
(current
forecast)
Difference
Total revenues 1,457 1,297 (160)
Total operating expenses 1,309 1,464 155
%of revenues 89.8% 112.8%
Other income (expenses), net 0 0 0
Operating profit 148 (167) (315)
%of revenues 10.2% )12.8%(
Depreciation and amortization 236 303 67
EBITDA 384 136 (248)
%of revenues 26.5% 10.6%
CAPEX 177 231 54
%of revenues 12.2% 17.8%
EBITDA - CAPEX 207 (95) (302)
%of revenues 14.3% )7.2%(
The table presents Yes's management's forecast for 2022 (including
Sting operations), used in the valuation as of Dec. 31, 2017, compared
with the current valuation used in the financial statements as of Dec. 31,
2018.
The change in the forecast is mainly due to a shift in the
Company's view concerning the relevant technology in the future
and consumer preferences, continuing through the plan to
transition to OTT broadcasting. As a result, the forecast assumes a
plan for gradual migration to IP, which should be completed at the
end of 2025. Implementing this plan requires replacement of most
Company STBs, and maintaining current expenses during the
transition period for both operations (satellite and IP).
Analysis of the differences between the forecasts:
Revenues: Despite the forecast growth in revenues from Sting, the
Company's revenues went down in the updated forecast. The
difference totals NIS 160 million (a change of 11%), and is due to
increased competition leading to a higher attrition rate of premium
customers compared to previous estimates, along with lower ARPU.
* Based on Yes's management's forecast used in the
valuation as of Dec. 31, 2017

12
Executive Summary
Yes‘s Operations – 2017 Forecast for 2022 vs . Current Forecast for 2022
Operating expenses : Operating expenses are NIS 155 million higher in the
current forecast over the previous forecast (difference of 11.9%), mainly due
to higher content costs following price hikes in the content market. OPEX
also grew due to sports rights which are now estimated at a higher point
than in the previous forecast due to continued price increases on rights
(derived from the RGE agreement - additional cost for the Champions
League, payment for each Sting customer) - an additional NIS 50 million in
cost in 2021. The upward adjustment was also due to other operating
expenses due to the simultaneous operation of two broadcasting methods
(satellite and IP).
EBITDA: Changes in revenues and expenses drove down the Company's
EBITDA (a difference of NIS 248 million).
CAPEX: The gradual migration to IP-based broadcasting means that, in
2022, the Company is investing simultaneously in two operating platforms
(satellite and IP), increasing CAPEX over the previous forecast.
Operating cash flow: Operating cash flow (before changes in operating
working capital and tax expenses), as reflected in EBITDA minus CAPEX,
decreased and the Company adjusted its results downward by NIS 302
million over the previous forecast (difference of 220%).
Details / NIS millions
2022
forecast
(Dec. 31,
2017*)
2022 forecast
(current
forecast)
Difference
Total revenues 1,457 1,297 (160)
Total operating expenses 1,309 1,464 155
%of revenues 89.8% 112.8%
Other income (expenses), net 0 0 0
Operating profit 148 (167) (315)
%of revenues 10.2% )12.8%(
Depreciation and amortization 236 303 67
EBITDA 384 136 (248)
%of revenues 26.5% 10.6%
CAPEX 177 231 54
%of revenues 12.2% 17.8%
EBITDA - CAPEX 207 (95) (302)
%of revenues 14.3% )7.2%(
* Based on Yes's management's forecast used in the
valuation as of Dec. 31, 2017

13
Chapter 1 – Description of the Company's Business

14
Chapter 1 – Description of the Company's Business
Description of the Company's Business
General
DBS Satellite Services (1998) Ltd. ("Yes" or "Multi-Channel
Television Operations") was incorporated in Israel in 1998. Yes
holds a Ministry of Communications license for satellite-based
television broadcasts .
Until March 25, 2015, Bezeq held 49.78% of Yes's issued capital,
and warrants to an additional 8.6%. Yes's remaining share capital
was held by Eurocom D.B.S. Ltd. On March 25, 2015, Bezeq
exercised its warrants, without payment, and on June 24, 2015, it
bought all of Eurocom D.B.S.'s holdings in Yes along with the
shareholder loans which Eurocom Communications Ltd. (the
controlling shareholder in Bezeq) had extended to Yes.
As of the end of the second quarter of 2018, Yes's market share
went down to 35%, from 37% at the end of 2017. This decrease
was mainly due to entry of new competitors - Cellcom, Partner,
Netflix, and others.
HOT is the company with the largest share of the multi-channel
television market - 47% as of the second quarter of 2018.
Together with Cellcom's 12% share, they are Yes's main
competitors in this market.
Yes's revenues are derived from the following sub-segments:
Multi-channel television - Yes offers a broad range of 150
channels, such as: sports, nature, science and history,
movies, series, kids and teens, music, recreation and lifestyle,
foreign language channels, etc. Yes also offers some 30 high-
definition (HD) channels, radio channels, and interactive
services. Some of these channels are included in basic and
entry-level bundles, and some are purchased by customers
specifically in addition to the basic and entry-level bundles. In
January 2018, Yes launched a new service - Yes Ultimate - a
bundle comprising most content channels, premium channels,
an enhanced STB, VOD, and additional services, for NIS 199
a month, including VAT. It is noted that Yes's current plans
charge additional fees above the basic plan price for
additional STBs.

15
Chapter 1 – Description of the Company's Business
Description of the Company's Business
Advanced services - Yes offers various PVR satellite STBs,
which allow pre-recording of content. Yes also offers HD
Zapper boxes (yesHD), which support HD broadcasting;
HDPVR boxes, which support both recording and HD
broadcasting; and 4K boxes (yes Ultra), which support 4K
broadcasting and recording. Furthermore, Yes offers a
MultiRoom service, which allows content recorded on a
recording STB to be viewed on non-recording STBs over the
home network. Some customers also receive free use of the
yesGo app, which delivers a range of television channels for
viewing on smartphones, tablets, and various compeuters.
Finally, Yes offers Primetime and Start Over services.
VOD - Yes offers video on demand content through internet-
connected STBs.
Sting TV - OTT television services offering a selection of plans
and VOD services, connected through a streamer. Sting TV
competes at a lower price point and is the Company's
response to other streaming services.
Yes - Key Performance Highlights (KPIs)
Figure 1: Yes - KPIs
1. The number of Yes multi-channel television subscribers is
shrinking, due to new competitors and substitute services
such as Cellcom TV, Partner TV, traditional competition from
HOT, competition from streaming services (Netflix and
others) and pirated content.
2. ARPU is also shrinking, due to increasing competition. As a
result, the Company decided to lower its prices (e.g. - the
Company's 'Ultimate' initiative which included price cuts).
yes KPI's Note 2016 2017 2018
Subscribers
(thousands) 1 614 587 574
%Change )3.3%( )4.4%( )2.3%(
ARPU 2 233 228 211
%Change 0.3% )2.2%( )7.5%(

16
Chapter 2 - Television Services Market

17
Chapter 2 - Television Services Market
The Television Services Market in Israel
Television services market - general
The television market has seen significant disruption in recent
years. The two, established, market players are Yes (which
provides satellite-based television services), and HOT (which
provides cable-based television services).
In addition to these companies, the Second Authority for Television
and Radio operates a DTT network (Idan+), offering a basic
channel bundle for free, other than the cost of buying the STB for
the service .
The increase in the bandwidths of communication infrastructures in
Israel, alongside technological improvements enabling the
transmission of video content over the internet and cellular
networks and improved compression capabilities enable wider use
of these infrastructures for the transmission of video content.
These technological changes have allowed other telecom
companies - Cellcom and Partner - to enter this market and offer
television services without setting up infrastructure such as Yes
and HOT needed to do. In addition to Israeli companies, global
companies offer VOD services through internet streaming
services, such as Netflix and Amazon Prime. These companies
also constitute an ever-increasing competitive force. Furthermore,
an effective and enforceable solution has yet to be found for
widespread use of pirated content.
Competition and recent developments
Competition in the television market focuses on content, pricing,
service quality, and add-on service offerings such as HD, VOD and
advanced STBs. Competition is driven by demand for advanced
and personalized television services.
HOT and OTT providers
The two main market players are Yes and HOT. In recent years,
HOT's market share has gone down, despite their bundle offering.
Furthermore, Yes's market share, which saw an upward trend until
2015, has eroded in recent years, mainly due to the introduction of
Cellcom TV. In June 2017, Partner also began to offer IPTV
services, uner the Partner TV brand .

18
Chapter 2 - Television Services Market
The Television Services Market in Israel
Figure 2: Television service subscribers15
As the above chart demonstrates, competition and changes in the
television market have reduced the number of both HOT and Yes
subscribers, from Yes's 587,000 and HOT's 789,000 in 2017, to
Yes's 582,000 and HOT's 777,000 in Q2/2018. Prices for Cellcom
and Partner's content bundles are significantly lower than Yes and
HOT's, including due their lower investment in infrastructure (OTT
operating model) and content. Furtherore, Cellcom and Partner
can offer full telecom service offerings (quatro), which Yes and
HOT cannot offer for regulatory reasons. Yes is also at a
disadvantage against HOT and the other competitors as it cannot
offer locked triple bundles, due to regulatory restrictions.
Sting: Sting TV is Yes's OTT television service, which was
launched in November 2017. The service includes a range of
bundle options and VOD services, and is based on a streamer
box. Sting TV competes at a lower price point and is the
Company's response to other OTT and streaming services.
Streaming services
Netflix: At the start of 2016, Netflix (the leading video content
provider in the US) began allowing Israeli customers to
subscribe to its services, causing a change in customer
preferences.
Netflix is a VOD platform which allows access to content from
computers, mobile phones, smart TVs, and tablets, without an
STB .
Netflix is improving its ability to provide content to Israeli
customers, and is a growing threat to traditional content
providers. However, it currently mostly serves as a
complementary, and not a substitute, product.
15. From Bezeq, Cellcom, Partner, and HOT's financial statements.
891 896 875 853 824 811 789 777
586 578 601 632 635 614
587 582
63 111 170 195
43 83
0%
20%
40%
60%
80%
100%
2011 2012 2013 2014 2015 2016 2017 2018-Q2
HOT yes Cellcom Partner

19
Chapter 2 - Television Services Market
The Television Services Market in Israel
NEXT TV: HOT's streaming service, launched in August 2017 in response to
increasing competition and as a supplementary offering to customers seeking
basic low-cost services.
Other streaming providers: In Israel and abroad, and especially in the US,
other providers such as Amazon Prime offer streaming services, and
constitute a potential threat to the local market.
Regulation
Multi-channel television broadcasts by satellite and cable are subject to the
Communications Law and the corresponding rules and regulations, in addition to
the provisions of the broadcasting licenses and the Satellite and Cable
Broadcasting Commission's decisions. As such, the market is subject to several
regulatory restrictions, including:
No advertising: In Israel, advertising is banned on cable and satellite
channels, in contrast to global market practice.
Investment in original content: According to the Commission's decision of
November 2015, the minimum amount for investment in original Israeli content
will increase in 2017 from 8% of annual revenue from subscription fees, to
9%. Bezeq clarified that, at this time, the Commission has decided not to
implement the change in 2017 and 2018. It is noted that, in June 2016, the
Filber Committee recommended that, in the coming years, Yes and HOT's
requirement to invest in original content should decrease to 6.5%.
Canceling early termination penalties for broadcast service contracts: License-
holders are prohibited from signing consumers on long-term contracts whose
violation incurs penalty payments.
Tariff regulation: Companies must report to the Commission on changes in
Commission-approved prices, and the Commission chairman may prohibit
such change under the terms specified in the license.
Key data on the US Pay TV market1
Figure 3: Change in subscribers to the 12 leading companies in the US
Figure 4: ARPU for the leading companies in the US (USD)2
1. Source: Leichtman Research Group
2. Source: The companies' annual reports
Q3 2018
Multi-channel television subscribers
in the US 90,324,721
Change from same quarter in 2017 )974,291 (
ARPU, USD YoY change 2016 2017
DISH )2.52%( 88.66 86.43
AT&T 1.88% 119.00 121.24
Cablevision 2.97% 106.63 109.79
Charter (Residential) 3.32% 81.13 83.82
Comcast 3.71% 82.21 85.26
Average 2.00% 95.91 97.82

20
Chapter 2 - Television Services Market
Television Services Market in Israel - Netflix
Netflix's entry to the market
Figure 5: Paid netflix subscribers (thousands)3
• Netflix started offering streaming services in the US in 2007. As of the
end of 2018, the company recruited 139 million users worldwide, of
which 58 million in the US alone - accounting for 64.5% of the paid
market in the US.
• Netflix offers OTT VOD services. The company buys or produces
original content at a total cost of USD 13 billion, as of 2018.
3. Source: Netflix's financial statements
Netflix's new market penetration rate
Figure 6: 10 countries in which Netflix holds the largest market share4
Netflix's market share ranges from 34% to 65%.
Figure 7: Average annual market share growth by country5
Netflix's average annual penetration rate ranges from 6% to 14%. Notably, Netflix
first entered Australia in 2015, and in 2018 it already holds 43% of the market.
4.Source: Estimates 2018 eMarketer
5.Source: Netflix's financial statements
65%
62%
56%
55%
52%
44%
43%
40%
36%
34%
0% 10% 20% 30% 40% 50% 60% 70%
ב"ארה
נורווגיה
קנדה
דנמרק
שוודיה
הולנד
אוסטרליה
פינלנד
גרמניה
אנגליה
Netflix's market share by country
80,773
58,486
0
10,000
20,000
30,000
40,000
50,000
60,000
70,000
80,000
90,000
2010 2011 2012 2013 2014 2015 2016 2017 2018
Global users US users
65% 62%
56% 55%
52% 44%
43% 40%
36% 34%
0% 10% 20% 30% 40% 50% 60% 70%
USNorwayCanada
DenmarkSwedenHolland
AustraliaFinland
GermanyEngland
Market share
6% 6% 7% 7% 7% 9% 9% 9%
12% 14%
0%
5%
10%
15%
% A
nnual
penetr
ation

21
Chapter 2 - Television Services Market
Television Services Market in Israel - Netflix
Netflix's impact on the Israeli market
Netflix first launched in Israel in 2017, and in its first year already
gained 7% of the market. In 2018, it increased its market share by
11%.
6. Yes and HOT's financial statements
Netflix's impact on US broadcasters
Figure 8: US broadcast market share7
Between 2015 and 2017, Netflix caused a 12% decrease in the
traditional TV companies' market share, while its own market share
grew 11%.
7. Source: PwC – Video Consumer Motivations 2018
79%
67% 65%
76%
0%
10%
20%
30%
40%
50%
60%
70%
80%
90%
2015 2016 2017 2018
Mark
et share
Traditional pay-TV Netflix

22
Chapter 2 - Television Services Market
Television Services Market in Israel - Netflix
Netflix's operating expenses
Figure 9: Netflix's expenses on technology (USD millions)8
Netflix's expenditure on technology has grown in recent years. For
example, in 2017-2018 technology expenses grew by USD 933
million, or 65% YoY (15% of its revenues in 2018, as compared to
13% of its revenues in 2017).
8. Source: Netflix's financial statements
Figure 10: Netflix's expenses on content (USD millions)9
Between 2012 and 2018, Netflix's content expenses grew from
USD 1,368 million to USD 13,043 million - or 850% in 6 years. On
average, Netflix spends 86% of its revenue on content.
These expenses match Netflix's philosophy that its competitive
advantages depend on its ability to provide a user experience
which differentiates it from the competition. This is evident in the
growth in its content and technology expenditure.
9. Source: Netflix's financial statements
0
500
1000
1500
2000
2500
2012 2013 2014 2015 2016 2017 2018
0
2000
4000
6000
8000
10000
12000
14000
2012 2013 2014 2015 2016 2017 2018

23
Chapter 3 - Financial Statement Analysis

24
Chapter 3 - Financial Statement Analysis
Balance Sheet - Multi-Channel Television Operations )Yes)
Assets - Key Items
Current assets: In 2018, the change in the Company's cash
balances was mainly due to changes in Bezeq's investments in the
Company's equity .
Non-current assets:
Broadcasting rights: Yes holds two kinds of broadcasting rights:
1. Broadcasting rights bought from content providers (movies
and series).
2. Broadcasting rights for original content in which the Company
invests directly.
This asset routinely serves the Company's operations, and so is
part of the segment's operating working capital.
Property, plant and equipment: Yes's PP&E consists of
broadcasting and receiving equipment, office equipment and
furniture, improvements to rented properties, and the bulk of its
PP&E is attributable to discounted installation costs and satellite
decoders (STBs). Yes's remaining PP&E balance grew in 2018,
mainly due to a greater investment in STBs and streamers.
Usage rights in leased assets: This item grew following the first-
time application of IFRS 16.
Yes's audited data for Dec. 31, 2015-2017, from its draft financial
statements as of Dec. 31, 2018:
* 2018 data are based on the draft financial statements before write-downs.
NIS millions December
31, 2015
December
31, 2016
December
31, 2017
December
31, 2018
Audited Audited Audited Draft*
Assets
Current assets
Cash and cash
equivalents 95 142 112 80
Deposits 50 - - -
Trade receivables 159 155 142 132
Other receivables 15 143 6 8
Inventory - - 9 -
319 440 269 220
Non-current assets
Broadcasting rights 445 421 448 463
Property, plant and
equipment 770 707 644 672
Intangible assets 133 127 141 136
Deferred taxes - 331 - -
Usage rights in
leased assets - - - 115
1,348 1,586 1,233 1,386
Total assets 1,667 2,026 1,502 1,606

25
* 2018 data are based on the draft financial statements before
write-downs.
Chapter 3 - Financial Statement Analysis
Balance Sheet - Multi-Channel Television Operations )Yes)
Liabilities and Equity – Analysis of Key Items
Trade payables: The decrease in trade payables in 2018 was
mainly due to increased payments to suppliers (including original
content providers and the sports channel).
Debentures: In 2017, most debentures (96%) were held by
Bezeq, while in 2018 Bezeq converted its debenture holdings
(96%) to equity.
Loans from shareholders: The balance of Bezeq's loans to
Yes was converted to equity.
NIS millions December
31, 2015
December
31, 2016
December
31, 2017
December
31, 2018
Audited Audited Audited Draft*
Liabilities + equity
Current liabilities
Credit 15 15 14 14
Current maturities on
debentures 382 383 216 8
Trade payables 399 463 479 440
Other payables 73 83 86 64
Interest on debentures and
loans 22 - 4 -
Provisions 12 6 5 19
Liabilities for leases - - - 30
903 950 804 575
Non-current liabilities
Bank loans 49 34 20 7
Debentures 828 435 218 -
Loans from shareholders 4,890 - 95 -
Other long-term liabilities 11 12 14 10
Employee benefits 4 3 3 4
Liabilities for leases - - - 91
5,782 484 350 112
Equity )5,018( 592 348 919
Total liabilities + equity 1,667 2,026 1,502 1,606

26
Chapter 3 - Financial Statement Analysis
Income Statement - Multi-Channel Television Operations (Yes)
NIS millions 2015 2016 2017 2018
Audited Audited Audited Draft*
Revenues 1,774 1,745 1,650 1,473
YoY change 2.9% (1.6%) (5.5%) (10.7%)
Operating general and
salary expenses 1,201 1,196 1,202 1,219
%of revenues 67.7% 67.9% 72.8% 82.8%
Depreciation and
amortization 322 296 285 293
%of revenues 18.2% 17.0% 17.3% 19.9%
Total operating expenses 1,523 1,492 1,487 1,512
Other income (expenses),
net - 11 - )17(
Operating profit 250 264 163 (56)
%of revenues 14.1% 15.1% 9.9% (3.8%)
Depreciation and
amortization 322 296 285 293
Adjusted EBITDA 572 560 448 237
%of revenues 32.3% 32.1% 27.2% 16.1%
CAPEX 265 208 233 297
%of revenues 14.9% 11.9% 14.1% 20.2%
EBITDA - CAPEX 308 352 215 (60)
Analysis of key items
Revenues
Revenues were down in 2018 (by 10.7%) due to lower plan prices
(launch of Ultimate), and a decrease in the subscriber base.
Expenses
Content expenses continued rising in 2018 following the increase in
contract prices (mainly sports).
Salary expenses were down in 2018 due to the Company's
streamlining efforts, which will continue in the coming years.
* 2018 data are based on the draft financial statements before write-downs and
adjustment of lease expenses under IFRS 16.

27
Chapter 3 - Financial Statement Analysis
Income Statement - Multi-Channel Television Operations )Yes)
Analysis of key items (contd.)
CAPEX, EBITDA, and operating cash flows
EBITDA was down in both absolute value and as a percentage of
revenues, from NIS 448 million in 2017 (27.2% of revenues), to
NIS 237 million (16.1% of revenues) in 2018. EBITDA was down
mainly due to lower revenues which was almost fully translated
to profits due to the inflexible expense and investment structure.
However, there was a NIS 65 million increase in CAPEX, mostly
due to acceleration of STB purchases following a change in the
satellite STB supplier, and the purchase of streamers for
streaming services. Operating cash flows before taxes and
changes in operating working capital, as reflected in EBITDA
minus CAPEX, was down by NIS 276 million YoY, totaling NIS
(60) million (13% of revenues) in 2018, compared to NIS 216
million in 2017.

28
Chapter 4 - Valuation

29
Chapter 4 - Valuation
Valuation Method - Multi-Channel Television Operations (Yes)
General
The OTT revolution lowered market entry barriers, and led Cellcom
and Partner to enter the market with low-cost content offerings.
Furthermore, the entry of content giant Netflix into the market, which
broke the traditional value chain, significantly increased competition
(as detailed in Chapter 2, pages 16-18). These changes reduced Yes's
subscriber base. In order to stop this hemorrhaging, Yes decided to
significantly cut its prices without being able to significantly cut its
costs. Since the Company is operationally leveraged, any decrease in
revenues fully translates into its profits. Due to the smaller customer
base and lower price points, the Company's revenues shrank, while
content costs grew, which led Yes to incur operating losses and
negative cash flows .
Technological infrastructure upgrade
The Company's management believes that, over time, the existing
technological infrastructure will not be able to provide an adequate
solution to customer needs compared to market alternatives. Due to
the need to upgrade its infrastructure, the Company believes that IP
technology would be able to maximize customer needs and the
Company's operating metrics. The migration between
infrastructures will be gradual, between 2019-2025, and will add
significant transmission costs in the short and medium terms. After
migrating from satellite to IP-based transmission, Yes's satelliite
segment costs will be replaced with transmission costs inside the
Bezeq Group. Thus, consolidated cash flows will increase as
compared to continued reliance on satellite infrastructure.
Key Assumption
In light of structural market changes, increasing competition, and
major changes in its technological model, the Company is
expected to incur operating losses and negative cash flows until
completing its migration to IP. In 2026, upon completing its
migration to the new network, the Company expects a minor
negative cash flow, near the break-even point. In light of this
forecast, the valuation covers the period of 2019-2026, with the
representative year being after completing the tech migration and
cessation of space segment payments .

30
Chapter 4 - Valuation
Multi-Channel Television Operations (Yes) - Key Assumptions
Revenues
• Subscribers: We assumed that the Company's overall
subscriber base would grow from 574,000 as of the end of
2018, to 667,000 by the end of 2026. However, a significant
change will occur in the breakdown of customers between
satellite/premium customers and Sting customers. Sting
customers will account for an ever-growing portion of the
Company's subscriber base, from a negligible percentage as of
the end of 2018, to the largest segment by the end of 2026. It is
noted that these forecasts account for the tendency of most
consumers to use Netflix as a supplementary, and not a
substitute, service to traditional pay-TV services. This
assumption must be periodically reviewed according as
consumer preferences develop.
• ARPU: Competition in the television market has led the
Company to implement two key initiatives, each of which
lowered ARPU in 2018:
a. Introducing Yes Ultimate for satellite subscribers - offering
customers services which were previously subject to additional
payment, such as premium channels and VOD services.
b. Sting TV - Yes launched its OTT service to offer an alternative
to competition in the lower cost points, which mostly comprises
other OTT players.
According to Yes management's forecast, which was reviewed and
found reasonable, working assumptions for ARPU are as follows:
a. Premium ARPU - Market competition will continue to erode
ARPU over time.
b. Low-cost ARPU - ARPU will gradually grow until 2024. It is
noted that this assumption was found reasonable in light of our
assessments that present prices in the low-cost market are not
sustainable over time, and the Company's corresponding focus
on broader content bundles offering additional content and
enhanced sales. Moreover, sports channels in the bundle make
the offering more attractive to customers.
In summary, Company revenues will gradually shrink from NIS
1,473 million in 2018 to NIS 1,270 million in 2026, with
satellite/premium revenues continuing to erode with growth in low-
cost service revenues partially making up the difference.

31
Chapter 4 - Valuation
Multi-Channel Television Operations (Yes) - Key Assumptions
Year 2018A 2019E 2020E 2021E 2022E 2023E 2024E 2025E 2026E
Subscribers
)thousands)
Subscribers, end of
period 574 587 592 602 617 637 652 667 667
%Change (2.3%) 2.2% 0.9% 1.7% 2.5% 3.2% 2.4% 2.3% 0.0%
APRU (NIS/month)
Weighted ARPU 211 197 190 183 177 171 166 161 159
%Change (7.5%) (6.6%) (3.5%) (3.5%) (3.2%) (3.4%) (3.2%) (3.1%) (1.3%)
Revenues (NIS
millions)
Revenues 1,473 1,375 1,344 1,313 1,297 1,289 1,283 1,272 1,270
%Change )10.7%( )6.7%( )2.3%( )2.3%( )1.2%( )0.6%( )0.5%( )0.9%( )0.2%(
KPIs and revenues

32
Chapter 4 - Valuation
Multi-Channel Television Operations (Yes) - Key Assumptions
Operating expenses
The Company's forecast for its operating cash flow expenditure in 2018-2026 is as follows:
* Operating expenses, including lease payments
The downward trend in expenses is mostly due to reduced salary costs in the short and medium terms from downsizing efforts under the
Company's streamlining plan which are under negotiation with the workers' union, and which in light of the Company's position we assumed
would be implemented in full. Expenses will also decrease due to lower content costs after 2021. It is noted that the increase in other
operating expenses is due to increased network traffic costs as part of the transition to IP. The downward trend in expenses matches the
change in Yes's satellite/premium and Sting customer base in the coming years .
Year 2018A 2019E 2020E 2021E 2022E 2023E 2024E 2025E 2026E
Cash flow expenditure* 1,236 1,248 1,236 1,213 1,160 1,145 1,164 1,181 1,113

33
Chapter 4 - Valuation
Multi-Channel Television Operations (Yes) - Key Assumptions
NIS millions 2018A 2019E 2020E 2021E 2022E 2023E 2024E 2025E 2026E
Adjusted
EBITDA 237 128 107 100 137 144 119 91 157
%of revenues 16.1% 9.3% 8.0% 7.6% 10.6% 11.2% 9.3% 7.1% 12.4%
EBITDA
The adjusted EBITDA forecast (including lease payments), as
derived from the above revenue and expense assumptions, is as
follows:
EBITDA will decrease in the next three years, reaching NIS 100
million in 2021 (7.6% of revenues). From 2022, we assume a
recovery, with EBITDA totaling NIS 137 million (10.6% of
revenues) in 2022. Afterward, in 2024-2025, we assumed another
decresae in EBITDA due to the accelerated migration to IP, and a
recovery in 2026 once space segment payments have stopped.
Tax expenses
We assumed a 23% corporate tax rate, according to the current
statutory rate in Israel. Since the Company will run at a loss in the
coming years, it is not expected to pay taxes over the forecast
period. Since no profit is expected in the foreseeable future, no tax
shield will be created from losses.
34
Chapter 4 - Valuation
Multi-Channel Television Operations (Yes) - Key Assumptions
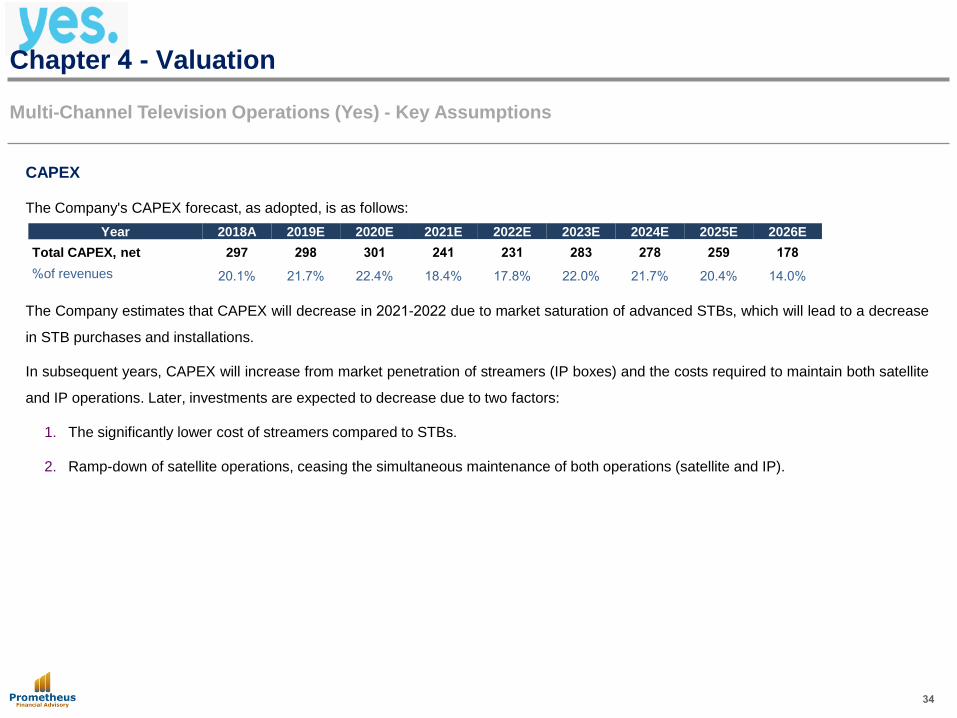
CAPEX
The Company's CAPEX forecast, as adopted, is as follows:
The Company estimates that CAPEX will decrease in 2021-2022 due to market saturation of advanced STBs, which will lead to a decrease
in STB purchases and installations.
In subsequent years, CAPEX will increase from market penetration of streamers (IP boxes) and the costs required to maintain both satellite
and IP operations. Later, investments are expected to decrease due to two factors:
1. The significantly lower cost of streamers compared to STBs.
2. Ramp-down of satellite operations, ceasing the simultaneous maintenance of both operations (satellite and IP).
Year 2018A 2019E 2020E 2021E 2022E 2023E 2024E 2025E 2026E
Total CAPEX, net 297 298 301 241 231 283 278 259 178
%of revenues 20.1% 21.7% 22.4% 18.4% 17.8% 22.0% 21.7% 20.4% 14.0%

35
Chapter 4 - Valuation
Multi-Channel Television Operations (Yes) - Key Assumptions
Operating working capital
Assumptions concerning changes in operating working capital match Company projections .
Discounting rate and permanent growth
Under the CAPM model, the discounting rate applicable to Yes's operations is 8.35% (for details, see Appendix A). Since we believe the
risk in these operations will not decrease compared to 2017, we used an 8.5% discounting rate, similar to the rate used in the previous
valuation of the Multi-Channel Television segment .
We assumed a permanent growth rate of 0%.*
* Since the Company's cash flow is negative, we assumed that a company with a negative cash flow will not increase its negative cash flow.

36
Chapter 4 - Valuation
Multi-Channel Television Operations (Yes) - Projected Cash Flows
NIS millions 2015A 2016A 2017A 2018A 2019E 2020E 2021E 2022E 2023E 2024E 2025E 2026E TY
Total revenues 1,774 1,746 1,650 1,473 1,375 1,344 1,313 1,297 1,289 1,283 1,272 1,270 1,270
%change from previous period )1.6%( )5.5%( )10.7%( )6.6%( )2.3%( )2.3%( )1.2%( )0.6%( )0.5%( )0.9%( )0.2%( 0.0%
Total operating expenses (less
depreciation and amortization) (1,201) (1,186) (1,201) (1,236) (1,248) (1,236) (1,213) (1,160) (1,145) (1,164) (1,181) (1,113)
%of revenues 67.7% 67.7% 72.8% 83.9% 90.7% 92.0% 92.4% 89.4% 88.8% 90.7% 92.9% 87.6%
Adjusted EBITDA 572 560 448 237 128 107 100 137 144 119 91 157 157
%of revenues 32% 32% 27% 16.1% 9.3% 8.0% 7.6% 10.6% 11.2% 9.3% 7.1% 12.4% 12.4%
Total depreciation and amortization )322( )296( )286( )293( )297( )319( )314( )303( )305( )307( )296( )225( )178(
Adjusted operating profit 250 263 163 (56) (169) (212) (215) (166) (161) (188) (205) (68) (20)
%of revenues 14.1% 15.1% 9.9% )3.8%( )12.3%( )15.8%( )16.4%( )12.8%( )12.5%( )14.6%( )16.2%( )5.4%( )1.6%(
Tax income (expenses) - - - - - - - - - - - - -
Tax rate 0.0% 0.0% 0.0% 0.0% 0.0% 0.0% 0.0% 0.0% 0.0%
CAPEX )298( )301( )241( )231( )283( )278( )259( )178( )178(
%of revenues )21.7%( )22.4%( )18.4%( )17.8%( )22.0%( )21.7%( )20.4%( )14.0%( )14.0%(
Positive (negative) cash flow from
working capital changes )2( )3( )2( 1 1 0 1 0
Positive (negative) cash flow from
broadcasting right changes )23( 27 24 33 31 20 13 9
Total positive (negative) cash flow from
working capital and broadcasting right
changes
)25( 24 22 35 32 21 14 9
Cash flow (196) (170) (120) (59) (108) (138) (155) (11) (20)
Discounting period 0.50 1.50 2.50 3.50 4.50 5.50 6.50 7.50 7.50
Discounted cash flow (188) (150) (98) (44) (75) (88) (91) (6) (131)

37
Chapter 4 - Valuation
Multi-Channel Television Operations (Yes) - Results of Valuation
Summary of valuation
In summary, the enterprise value of multi-channel television
operations under the above assumptions as of December 31,
2018 is NIS )871( million, while the book value as of December
31, 2018 totaled NIS 886 million. It is noted that we reviewed
the Company's enterprise value under a scenario where it
does not change its technological model, and the resulting
value was even more negative.
Results of valuation NIS millions
Portion of EV attributed to Model Years (741)
Portion of EV attributed to the representative year (131)
Total EV (871)
38
Chapter 4 - Valuation
Multi-Channel Television Operations (Yes) - Fair Value
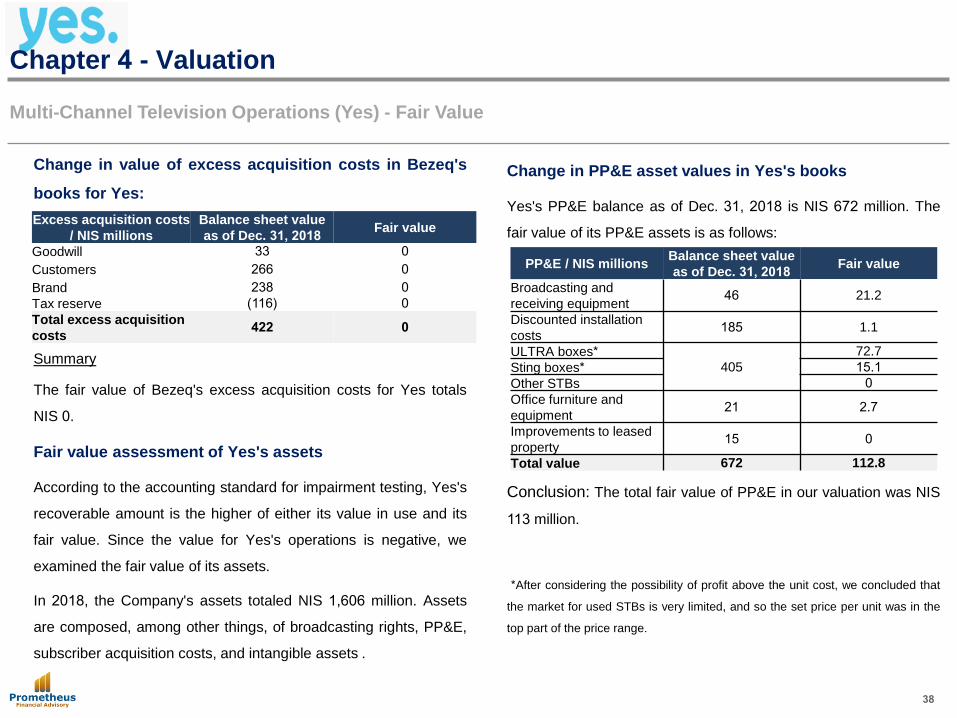
Change in value of excess acquisition costs in Bezeq's
books for Yes:
Summary
The fair value of Bezeq's excess acquisition costs for Yes totals
NIS 0.
Fair value assessment of Yes's assets
According to the accounting standard for impairment testing, Yes's
recoverable amount is the higher of either its value in use and its
fair value. Since the value for Yes's operations is negative, we
examined the fair value of its assets.
In 2018, the Company's assets totaled NIS 1,606 million. Assets
are composed, among other things, of broadcasting rights, PP&E,
subscriber acquisition costs, and intangible assets .
Change in PP&E asset values in Yes's books
Yes's PP&E balance as of Dec. 31, 2018 is NIS 672 million. The
fair value of its PP&E assets is as follows:
Conclusion: The total fair value of PP&E in our valuation was NIS
113 million.
* After considering the possibility of profit above the unit cost, we concluded that
the market for used STBs is very limited, and so the set price per unit was in the
top part of the price range.
PP&E / NIS millions Balance sheet value
as of Dec. 31, 2018 Fair value
Broadcasting and
receiving equipment 46 21.2
Discounted installation
costs 185 1.1
ULTRA boxes* 405
72.7
Sting boxes* 15.1
Other STBs 0
Office furniture and
equipment 21 2.7
Improvements to leased
property 15 0
Total value 672 112.8
Excess acquisition costs
/ NIS millions
Balance sheet value
as of Dec. 31, 2018 Fair value
Goodwill 33 0
Customers 266 0
Brand 238 0
Tax reserve )116( 0
Total excess acquisition
costs 422 0

39
Chapter 4 - Valuation
Multi-Channel Television Operations (Yes) - Results of Valuation
The STB item in Yes's PP&E is composed, in technological rising
order, of SD boxes, MAX boxes, HD boxes, Total boxes, Quatro
boxes, and Ultra boxes. Company management stated that these
STBs have been customized to Yes's technology. Therefore, in
considering the fair value of Yes's STBs, we found that since these
are used STBs, and due to high adaptation costs, collection costs,
and the technological obsolescence of most of these STBs, the
boxes do not have any disposal value except for the Ultra boxes
which were introduced at the end of 2017, and the Sting boxes
which can be used by all operators and by individuals. For details,
see Appendix B .
We examined additional PP&E items and found that they have
value as used products, as shown in the table .
Summary
The fair value of Yes's PP&E as shown in the above table totals
NIS 113 million.
Change in intangible asset values in Yes's books
As of Dec. 31, 2018, Yes' intangible assets totaled NIS 107 million,
composed mainly of licenses and software some of which were
uniquely adapted for Yes, for use in its routine operations. As
such, these assets do not have any fair value as used a used
product. Intangible asset balances include upgrades to the
Company's storage and back-up system, which we found to be of
value.
Summary
The fair value of Yes's intangible assets totals NIS 1 million.

40
Chapter 4 - Valuation
Multi-Channel Television Operations (Yes) - Results of Valuation
Broadcasting rights
Yes's broadcast rights totaled NIS 463 million as of December 31,
2018. This asset comprises broadcast right costs net of utilized
rights. Some rights cannot be sold in the secondary market due to
contractual provisions arising from the structure of the agreement
dictated by regulatory restrictions (due to the requirement for
exclusive procurement, procurement agreements do not allow the
sale of rights on the secondary market). However, the Company's
management stated that its rights in original content which Yes
produces may be sold at a fair value of NIS 60 million. The details
of broadcasting right calculations are as follows :
Movies and series procurement
The Company's management clarified that value cannot be
attributed to movies and series since broadcasting rights are non-
transferable (except options to assign rights in the case of a
merger with Bezeq), and so we assess Yes's fair value for its
rights in movies and series to be NIS 0.
Original content which has aired
We examined the probability for sale and the recovery rate expected
from the sale* of original content which have already aired according to
the year in which they were created. The fair value for Yes's rights in
original content which has aired is NIS 27 million.
Original content which has not aired
We examined the probability for sale and the recovery rate expected
from the sale* of original content which has not yet aired according to its
production stage (writing, filming, ready-to-air). The fair value for Yes's
rights in original content which has not aired is NIS 33 million.
* The probability rate for recovering the full investment through the net sale .

41
Chapter 4 - Valuation
Multi-Channel Television Operations (Yes) - Results of Valuation
Broadcasting rights
Conclusion: Between 2016-2018, broadcasting rights net of
utilized rights ranged from NIS 420 million to NIS 460 million. In
this period, revenues from content sales accounted for 0.5% to 3%
of broadcasting rights net of utilized rights. The fair value of
broadcasting rights was estimated at NIS 60 million, accounting
for 13% of the rights as of December 31, 2018. Thus, the fair
value of broadcasting rights as of the valuation date was also
reasonable compared to actual sales in previous years. This is
true, as the valuation deals with the disposal of these assets
without any plans to continue their development. Thus, we believe
that consideration for these assets at a rate of 13% of their
carrying amount (equivalent to 4 years of their historical inflows) is
reasonable.

42
Chapter 4 - Valuation
Multi-Channel Television Operations (Yes) - Results of Valuation
Changes to the Value of Real Estate Rights in Yes's Books
We examined the Company's rights to real estate assets in the long
term, and as of December 31, 2018 they totaled NIS 84 million, as
compared to liabilities of NIS 85 million. Since Yes's commercial terms
are at market prices and it can sub-let them, assets and liabilities at fair
value are negligible and were not included.
Summary
The fair value for Yes's rights and obligations in real estate remains at
their carrying amounts.
Changes to the Value of Vehicle Leases in Yes's Books
Since the balance is outside the scope of IFRS 16, the asset's method
of presentation was specified by the Company.
43
Chapter 4 - Valuation
Multi-Channel Television Operations (Yes) - Results of Valuation
Changes to the Value of Real Estate Rights in Yes's Books
We examined the Company's rights to real estate assets in the long
term, and as of December 31, 2018 they totaled NIS 84 million, as
compared to liabilities of NIS 85 million. Since Yes's commercial terms
are at market prices and it can sub-let them, assets and liabilities at fair
value are negligible and were not included.
Summary
The fair value for Yes's rights and obligations in real estate remains at
their carrying amounts.
Changes to the Value of Vehicle Leases in Yes's Books
Since the balance is outside the scope of IFRS 16, the asset's method
of presentation was specified by the Company.

44
Chapter 4 - Valuation
Multi-Channel Television Operations (Yes) - Results of Valuation
Customers
Customers recognized in Bezeq's books represent the excess of cost from
Bezeq's acquisition of Yes's shares in March 2015 (i.e. - the amortization balance
of customers which existed at the time).
For Yes itself, under a going concern assumption (DCF), these customers do not
have any positive value, as the Company expects to continue running a loss
across the forecast period and in the representative year.
Furthermore, upon inquiries with the Company's management, we found that
customers cannot be transferred to a new operator as that would change the
terms of the customers' contracts (the customer does not have to agree to switch
to the company that bought the customers balance, should such a buyer be
found, including since television products are not uniform and customer
preferences may differ). Furthermore, Yes's customers have satellite STBs, and
there are no other satellite-based broadcasters in Israel. Thus, transferring
customers to other operators would also require technician visits and the
installation of replacement STBs.
We also checked whether any value can be attributed to the list of Company
customers. The Company's legal counsel stated that the list of customers cannot
be sold for legal reasons. In light of the above, and since the Company operates
at a loss, we do not attribute value to the Company's customers.
Yes's Brand
We estimate that Yes's cash flows would be even more negative if it didn't have a
brand which, according to information from the Company's management, is valued as a
well-established and well-loved brand. Thus, assuming Yes's continued operation
under the present format (going concern), the brand has significant value included in
the DCF calculation (as he value would have been lower without the brand). This brand
value is due to investment in advertising (NIS 50 million / year) and content, and so the
maximum brand value depends on the going concern assumption. However, GAAP
require that we asses the maximum recoverable value for Yes as a whole and not the
maximum value for the brand. Under these principles, the maximum value for Yes is
obtained assuming that operations are discontinued and assets are sold. Under this
assumption, there is no more investment in content and advertising, and the brand
clearly does not have any value for Yes itself. Therefore, we checked the possibility
that another market player would buy the brand.
Our examination found that telecom market players can be divided into two groups:
telecom operators offering paid TV services (HOT, Cellcom, Partner), and telecom
operators which do not offer paid TV services (Golan, XPhone, Rami Levy) Companies
in the first group have their own brands, and so it is unlikely that the Yes brand has any
value for them. For the other companies - there are no indications that they plan to
enter the broadcasting market or that they can invest hundreds of millions of shekels a
year in content (investments required even before any subscribers are recruited).
Therefore, they, too, are unlikely to attribute any material value to the brand.

45
Chapter 4 - Valuation
Multi-Channel Television Operations (Yes) - Results of Valuation
Summary of Valuation under NAV requirements
Under this approach , we assessed the net disposal value of the
Company's assets, according at their previously-presented fair value.
Thus, Yes's equity, as derived from the fair value of balance sheet
items revalued according to IAS 36 and IFRS 15, is negative 229
million NIS.
Details / NIS millions
Balance sheet
value as of Dec.
31, 2018
Write-off Disposal
value NAV
Cash and cash equivalents 80 - 80 -
Trade receivables 132 - 132 132
Other receivables 8 - 8 8
Broadcasting rights 463 )403( 60 60
Property, plant and equipment 672 )559( 113 113
Intangible assets 107 )106( 1 1
Subscriber acquisition 29 )29*( - -
Real estate asset usage rights 84 - 84 84
Vehicle lease usage rights 31 )3**( 28 28
Total assets 1,606 (1,100) 506 425
Bank credit )14( - )14( -
Current maturities on debentures )8( - )8( -
Trade payables )440( - )440( )440(
Other payables )64( - )64( )64(
Provisions )19( - )19( )19(
Bank loans )7( - )7( -
Other liabilities )10( - )10( )10(
Employee benefits )4( - )4( -
Real estate leasing liabilities )86( - )86( )86(
Vehicle leasing liabilities )35( - )35( )35(
Total liabilities (687) - (687) (654)
Equity 919 (181) (229)
Excess of cost - goodwill for Yes
recognized in Bezeq's books 33 )33( - -
Excess of cost - customers 266 )266( - -
Excess of cost - brand 238 )238( - -
Excess of cost - tax reserve (net
of excess of cost on tax reserve
for debentures(
)116( 116 - -
Total book value as of Dec. 31,
2018 1,340 (1,521) (181) (229)
*Outside the scope of IAS 36; presented for the sake of convenience to clarify the
overall picture.
**The asset's presentation method was provided by the Company.

46
Chapter 4 - Valuation
Multi-Channel Television Operations (Yes) - Results of Valuation
Summary of Valuation under NAV requirements
Under this approach , we assessed the net disposal value of the Company's
assets, according at their previously-presented fair value.
Thus, Yes's equity, as derived from the fair value of balance sheet items
revalued according to IAS 36 and IFRS 15, is negative 229 million NIS.
Changes in Yes's value
Changes in Yes's value over time:
Details NIS millions Details
Yes valuation as of
Mar. 23, 2015 2,496
Fahn Kanne valuation from May
19, 2015
Yes valuation as of
Dec. 31, 2015 2,620
Giza valuation from Mar. 9,
2016
% Change 5.0%
Yes valuation as of
Dec. 31, 2016 2,551
Giza valuation from Mar. 28,
2017
% Change )2.6%(
Yes valuation as of
Jun. 30, 2017 1,947
Giza valuation from Aug. 23,
2017
% Change )23.7%(
Yes valuation as of
Sept. 30, 2017 1,761
Giza valuation from Nov. 27,
2017
% Change )9.6%(
Yes valuation as of
Dec. 31, 2017 1,346
Prometheus valuation from Mar.
28, 2018
% Change )23.6%(
Yes valuation as of
Dec. 31, 2018 )229(
Prometheus valuation (NAV)
from Mar. 18, 2019
% Change )117.0%(
Details / NIS millions
Balance sheet
value as of Dec.
31, 2018
Write-
off
Disposal
value NAV
Cash and cash equivalents 80 - 80 -
Trade receivables 132 - 132 132
Other receivables 8 - 8 8
Broadcasting rights 463 )403( 60 60
Property, plant and
equipment 672 )559( 113 113
Intangible assets 107 )106( 1 1
Subscriber acquisition 29 )29*( - -
Real estate asset usage
rights 84 - 84 84
Vehicle lease usage rights 31 )3**( 28 28
Total assets 1,606 (1,101) 506 425
Bank credit )14( - )14( -
Current maturities on
debentures )8( - )8( -
Trade payables )440( - )440( )440(
Other payables )64( - )64( )64(
Provisions )19( - )19( )19(
Bank loans )7( - )7( -
Other liabilities )10( - )10( )10(
Employee benefits )4( - )4( -
Real estate leasing liabilities )86( - )86( )86(
Vehicle leasing liabilities )35( - )35( )35(
Total liabilities (687) - (687) (654)
Equity 919 (181) (229)
*Outside the scope of IAS 36; presented for the sake of convenience to clarify the
overall picture.
**The asset's presentation method was provided by the Company.

47
Appendices

48
Appendix A
WACC - Multi-Channel Television Operations (Yes)
Calculating the discounting rate for Yes' operations
The above table presents the discounting rate calculated for Yes's
operations as of December 31, 2018.
Since we believe the risk in these operations will not decrease compared to
2017, use used an 8.5% discounting rate, similar to the rate used in the
previous valuation of the Multi-Channel Television segment.
Additional information on comparative
companies:
* Data for SKY are as of September 30, 2018
Symbol Parameter Value Comments
D/V Debt to asset value ratio 0.53 Based on the median of comparative companies (see table)
E/V Equity to asset value ratio 0.47 (D/V) = 1 - (E/V)
D/E Debt to equity ratio 1.13 (D/E) = (D/V) / (E/V)
βUL Unleveraged beta for
comparative companies 0.64
In order to estimate the beta for these operations, we reviewed a
group of similar companies. There were no publicly traded
companies whose operations are identical to the operations
under assessment, and so we chose companies that are partially
similar to said operations yet differ from each other, or order to
create a mix which would optimally reflect the Company's profile.
Beta is calculated on a weekly basis over a 5-year period.
Tax Long term tax rate for the
operations 23.0% Long term tax rate for the operations under assessment.
βL Leveraged beta for the
operations 1.20 βL= βUL*{1+)1-Tax)*(D/E)}
Rf Risk-free interest rate 3.2% Nominal yield to long-term maturity on NIS-based government
bonds, for a 15-year period, as of December 31, 2018.
MRP Market risk premium 5.9% The risk premium in the Israeli market, based on Damodaran
data as of 2018.
SRP Specific risk premium 3.5% Premium according to Duff and Phelps data for 2018, for mid-
sized enterprises.
Re Cost of equity 13.69% RE = Rf + βL * MRP + SRP
Rd Cost of Company debt 4.6% Long-term cost of debt for the operations, based on the yield to
maturity as of the valuation date of Bezeq's debentures in trading
WACC Weighted average cost of capital 8.35% WACC = Re *(E/V) + Rd*(D/V)*(1-TAX)
Company Unleveraged
beta D/V
SKY PLC* 0.64 0.18
DISH NETWORK 0.65 0.53
LIBERTY GLOBAL 0.34 0.65
Median 0.64 0.53
49
Appendix B
Fair Value of STBs
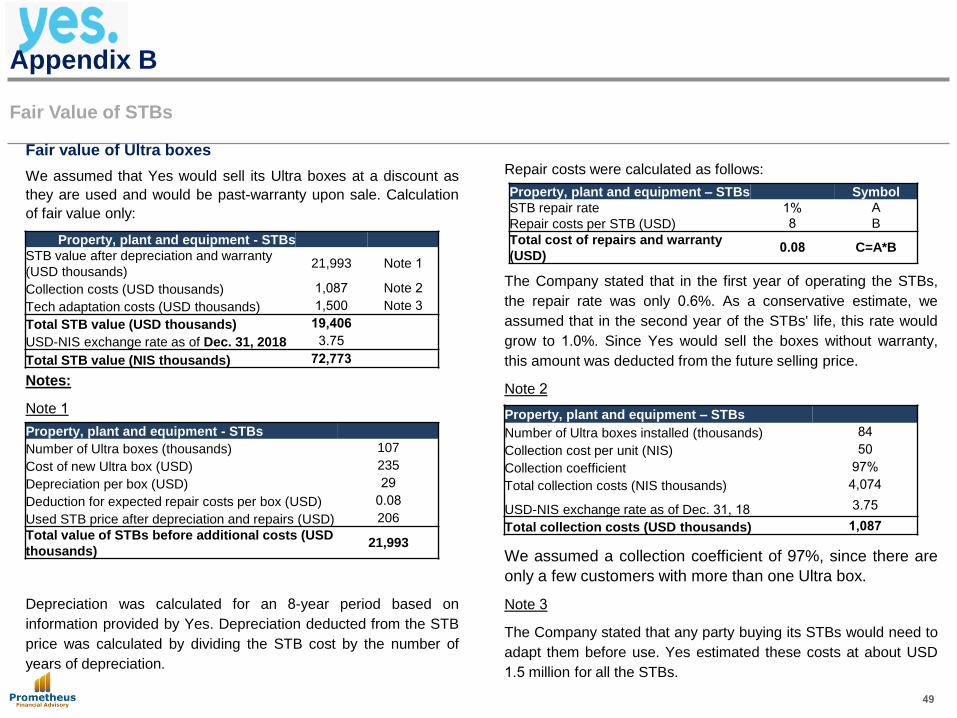
Fair value of Ultra boxes
We assumed that Yes would sell its Ultra boxes at a discount as
they are used and would be past-warranty upon sale. Calculation
of fair value only:
Notes:
Note 1
Depreciation was calculated for an 8-year period based on
information provided by Yes. Depreciation deducted from the STB
price was calculated by dividing the STB cost by the number of
years of depreciation.
Repair costs were calculated as follows:
The Company stated that in the first year of operating the STBs,
the repair rate was only 0.6%. As a conservative estimate, we
assumed that in the second year of the STBs' life, this rate would
grow to 1.0%. Since Yes would sell the boxes without warranty,
this amount was deducted from the future selling price.
Note 2
We assumed a collection coefficient of 97%, since there are
only a few customers with more than one Ultra box.
Note 3
The Company stated that any party buying its STBs would need to
adapt them before use. Yes estimated these costs at about USD
1.5 million for all the STBs.
Property, plant and equipment – STBs Symbol
STB repair rate 1% A
Repair costs per STB (USD) 8 B
Total cost of repairs and warranty
)USD) 0.08 C=A*B
Property, plant and equipment - STBs
STB value after depreciation and warranty
(USD thousands) 21,993 Note 1
Collection costs (USD thousands) 1,087 Note 2
Tech adaptation costs (USD thousands) 1,500 Note 3
Total STB value (USD thousands) 19,406
USD-NIS exchange rate as of Dec. 31, 2018 3.75
Total STB value (NIS thousands) 72,773
Property, plant and equipment - STBs
Number of Ultra boxes (thousands) 107
Cost of new Ultra box (USD) 235
Depreciation per box (USD) 29
Deduction for expected repair costs per box (USD) 0.08
Used STB price after depreciation and repairs (USD) 206
Total value of STBs before additional costs (USD
thousands) 21,993
Property, plant and equipment – STBs
Number of Ultra boxes installed (thousands) 84
Collection cost per unit (NIS) 50
Collection coefficient 97%
Total collection costs (NIS thousands) 4,074
USD-NIS exchange rate as of Dec. 31, 18 3.75
Total collection costs (USD thousands) 1,087

50
Appendix B
Fair Value of STBs
Fair value of Sting boxes
We assumed that Yes would sell its Sting boxes at a discount as
they are used and do not support Netflix. Calculation of fair value
only:
Notes:
Note 1
The boxes' selling price, as provided by the Company's
management.
Note 2
Assuming a 72% collection rate, at an average of 1.4 boxes per
customer, as specified by the Company's management.
Property, plant and equipment - Sting
boxes
Value of STBs before additional costs
(USD thousands) 4,200 Note 1
Collection costs (USD thousands) 182 Note 2
Total STB value (USD thousands) 4,018
USD-NIS exchange rate as of Dec. 31,
2018 3.75
Total STB value (NIS thousands) 15,058
Property, plant and equipment – STBs
Number of Sting boxes (thousands) 84
Cost of new Sting box (USD) 91
Selling price (USD) 50
Total value of STBs before additional costs (USD
thousands) 4,200
Property, plant and equipment – STBs
Number of Sting boxes installed (thousands) 19
Collection cost per unit (NIS) 50
Collection coefficient 72%
Total collection costs (NIS thousands) 684
USD-NIS exchange rate as of Dec. 31, 18 3.75
Total collection costs (USD thousands) 182

51
Appendix C
Book Value - Multi-Channel Television Operations
Book Value - Multi-Channel Television Operations
Details on the book value of multi-channel television operations (Yes), as of December 31, 2018, as provided by Bezeq:
Item Value (NIS
millions)
Trade receivables 132
Other receivables 5
Short term investments 3
Broadcasting rights 463
Property, plant and equipment, net 672
Intangible assets 107
Subscriber acquisition 29
Lease right asset 115
Total 1,526
Trade payables )440(
Other payables, including derivatives )33(
Deferred income, short-term )18(
Short-term provisions )18(
Liabilities for termination of employment, net )10(
Current maturities on leases )30(
Long term leasing liabilities )91(
Total (640)
Total carrying amount according to the
Company's balance sheet 886
Excess of cost - goodwill for Yes recognized in
Bezeq's books 33
Excess of cost - customers 266
Excess of cost - brand 238
Excess of cost - tax reserve (net of excess of cost on
tax reserve for debentures) )116(
Total book value as of Dec. 31, 2018 1,308
Impairment Test of Goodwill attributable to the Cellular Telephony Segment as at
December 31, 2018
March 2019
Bezeq The Israel Telecommunication Corporation Limited
14 Kreminitzky St., Tel Aviv 6789912 I Tel.: 03-5617801 I Fax: 03-5617765
The Hebrew version was submitted by the Company to the relevant authorities pursuant to Israeli law, and represents the binding version and the only one having legal effect. This translation was
prepared for convenience purposes only
March 2019

2
Introduction and Limit of Liability
On December 11, 2018, Prometheus Financial Advisory Ltd (“Prometheus” or the “Firm”) was requested by Danny Oz of Bezeq The Israel
Telecommunication Corp. Ltd. (“Bezeq” or the “Customer” or the “Company) to conduct an impairment test of the goodwill attributable to the domestic
operator (“Domestic Carrier Segment”), mobile radio-telephone (“Cellular Telephony” or “Cellular Telephony Segment”) and the multichannel television
(“YES”) segments, for the Company’s financial statements as at December 31, 2018 (the “Valuation”). The opinion is intended for the Customer’s use
only and presentation in the financial report. This opinion may not be used for any other purpose without the Firm’s prior written consent.
Financial studies are intended to reasonably and fairly reflect a given situation at a specific time, based on known data and reference to underlying
assumptions, assessments and projections, including forward-looking information (as defined in the Securities Law, 1968), the materialization of which is
uncertain. Accordingly, this Valuation is valid at the date of signature only, and is based on information from the Company and/or anyone on its behalf and
other sources, and may also include financial statements, estimations, projections and assessments (the “Information”). The Valuation describes the
Information highlights, the analyses and the test procedures performed, but the description is not necessarily full or detailed. It should be emphasized that
the Firm does not conduct any test of the Information and assumes that it is reliable. Therefore, the Valuation does not constitute verification of the
correctness, completeness and accuracy of the Information and does not include an audit regarding its compliance with the accounting principles. The
Firm is not responsible for the implications of the method of presentation (accounting or other) of the Information, if any. The Information is based partially
on knowledge at the time of the Valuation and various assumptions and expectations regarding both the Company and many external factors, including
the market condition, existing and potential competitors and the condition of the entire market. If the information is incomplete, inaccurate or unreliable,
the results of the Work may change, therefore, the Firm reserves the right to update the Valuation if new information is received. However, it should be
noted that nothing has been received by the Firm that could indicate that the information is unreasonable.
It is hereby declared that the Firm is not dependent on and does not have a personal interest in the Valuation, the Company and the controlling
shareholders of the Company, other than the fact that the Firm receives fees for this Valuation, and that the fees are not contingent to the results of the
Valuation.
The Valuation does not constitute or replace a due diligence. Moreover, the Valuation is not intended to establish a value for a specific investor and does
not constitute any legal advice or opinion. For avoidance of doubt, it is clarified that this Work does not constitute an offer, recommendation or opinion
regarding the feasibility of the purchase/sale of securities or execution of any kind of transaction.
Neither the Firm, nor any company which it controls, any controlling shareholder, or any officer in any of them are responsible (unless they acted
maliciously) for any damage (“Damage”) incurred by relying on all or part of this Valuation, whether foreseen or not. The Customer will not be entitled to
receive any amount from us for Damage, whether under contract or tort, by law or otherwise, or as punitive or special compensation, or in respect of
claims arising or related in another manner to this Valuation. Moreover, and without derogating from the generality of the foregoing, if we are required (in
legal or other proceedings) to pay any sum to a third party with respect to performance of this Valuation, the Customer undertakes to compensate us
immediately upon our first demand for any such amount that exceeds three times our fees, unless we acted maliciously.
It should be noted that due to rounding of figures, there may be a non-material deviation when adding up/multiplying the figures presented in this Valuation.

3
Previous Valuations, Information Sources
Previous financial valuations conducted:
The Firm conducted impairment testing of the goodwill of Bezeq’s cellular segment as at December 31, 2018. Following is a comparison
of the valuation of the segment and its key parameters (this Work) as at December 31, 2018, June 30, 2018 and December 31, 2017:
Details of work Value of operations
(NIS millions)
No. of subscribers in
the benchmark year
ARPU in the
benchmark year
Discount rate
(post-tax)
Permanent
growth
Impairment test of the cellular segment
as at December 31, 2017 5,403 2,918 70 9.97% 2.5%
Impairment test of cellular segment as
at June 30, 2018 3,907 3,062 61 9.97% 2.5%
Impairment test of cellular segment as
at December 31, 2018 2,914 2,642 69 10.3% 2.5%

4
Previous Works, Information Sources
The main information sources used to prepare the Valuation are as follows:
•Audited financial statements of Bezeq and the operating segments for 2014-2017 and draft financial statement as of December 31,
2018
•A multiannual projection prepared by the management
•Impairment test of the goodwill of the domestic carrier, cellular telephony and multichannel television segments as of December 31,
2016
•Impairment test of the multichannel television segment as of June 30, 2017 and September 30, 2017
•Valuation of Bezeq’s holdings in YES as of March 23, 2015
•Purchase price allocation (PPA) to YES as of March 23, 2015
•Additional financial data and various clarifications forwarded to us at our request.
•Background and market material out of open information published in websites, press articles or other public sources.
•A report regarding the global wireless communications market: BAML Q3 2018 Global Wireless Matrix
•Data of the Central Bureau of Statistics and the Bank of Israel
•Capital IQ system
•Discussions and meetings with the management of the Company and the subsidiaries

5
Prometheus Financial Advisory Ltd.
Prometheus is a firm involved in
economic and financial consulting
and provision of expert opinions, led
by the Yuval Zilberstein CPA, who
serves as CEO, and Eyal Szewach,
who serves as managing partner.
The Firm advises its customers on
mergers and acquisitions (M&A) as
well as significant economic projects
in various market sectors.
The work was conducted by a team
headed by Eyal Szewach, founding
partner of the Firm and holder of a
B.Sc in Electronic Engineering from
The Technion and an MBA of
Business Administration from Tel-
Aviv University. Mr. Szewach is an
expert with over 10 years
experience in conducting valuations,
financial statement analysis,
preparation of expert opinions and
various types of economic
consulting for companies and
businesses.
Sincerely,
Prometheus Financial Advisory Ltd.
March 26, 2019
Information about the Assessor

6
Contents
Chapter Page
Impairment Test - Bezeq - December 31, 2018
Executive Summary 7
Chapter A – Description of Bezeq’s Business 10
Chapter B – Communications Market 19
Chapter C – Analysis of Financial Statements 29
Chapter D – Valuation 34
Appendices
Appendix A – WACC 44
Appendix B – Carrying Amount 45

Executive Summary

8
Executive Summary
Brief Description of the Company
General
Bezeq The Israel Telecommunication Corp. Ltd. is a public
company whose shares are traded on the TASE. The company is
a key provider of telecommunications services, including domestic
fixed-line communications services, mobile radio-telephone
(cellular telephony) services, international communications
services, multichannel satellite television services, internet access
and infrastructure services, maintenance and development of
communication infrastructures, provision of communication
services to other communications providers, and other services
related to its area of operation. The Company has a substantial
market share in all of its operating segments, whereas in the fixed-
line communications segment, it was declared a monopoly.
The Company owns subsidiaries through which it performs its
business: Pelephone Communications Ltd (“Pelephone”), D. B. S.
Satellite Services (1998) Ltd. ("DBS” and/or “YES”), Bezeq
International Ltd. (“Bezeq International”) and Walla!
Communications Ltd. (“Walla").
The Company’s operations are divided into four business
segments:
Domestic fixed-line communications - This segment includes
mainly the activities performed by the Company as a domestic
carrier, including telephony services, Internet access
infrastructure services, transmission and data-communication
services, and wholesale service using the Company’s physical
infrastructure.
Pelephone - Mobile radio-telephone (cellular telephony) -
Marketing terminal equipment, installation, operation and
maintenance of cellular communication equipments and
systems.
Bezeq International - International telecommunications, Internet
and NEP services, telecommunications activities, and internet
access services (ISP)
DBS - Multichannel television (YES) - Multichannel digital satellite
television broadcasting services to subscribers.

9
Executive Summary
Methodology and Results
Valuation Methodology
The valuation of the cellular operations was conducted using the
discounted cash flow method (DCF).
The projected cash flows of operations is based, inter alia, on the
results in 2015-2018, the draft financial report for 2018 and the
projection of the managements of the segments for 2019-2023.
Prometheus estimated, to the best of its ability, the probability of
realization of different parameters, based on information presented
to us and independent analysis.
Principal Assumptions
Cellular segment: Continuation of the ARPU erosion in 2019, a certain
stabilization in 2020 and a moderate increase in the subsequent years
were assumed. A permanent growth rate of 2.5% and a nominal post-tax
discount rate of 10% were used.
Valuation Results
Cellular segment: The value of operations in the cellular segment
as at December 31, 2018 is NIS 2,914 million. According to
information given to us by Bezeq, the carrying amount of this
segment in its books was NIS 2,149 million, therefore, there is no
need for an impairment.
Sensitivity analysis with respect to the discount rate and
permanent growth
Following is an analysis of the changes in value of operations in
the cellular segment with respect to changes in the discount rate
and permanent growth:
Discount rate
2,901 8.3% 9.3% 10.3% 11.3% 12.3%
Permanent
growth
1.5% 3,511 3,004 2,613 2,304 2,054
2.0% 3,768 3,191 2,754 2,414 2,141
2.5% 4,069 3,405 2,914 2,536 2,237
3.0% 4,427 3,654 3,095 2,673 2,343
3.5% 4,861 3,945 3,303 2,827 2,461

Chapter A - Description of Bezeq's Business

11
Chapter A – Description of Bezeq’s Business
Bezeq
General
Bezeq is a public company whose shares are traded on the Tel Aviv Stock
Exchange. The Company is a key supplier of communications services,
including domestic fixed-line communications services, mobile radio-
telephone services (cellular telephony), international communications
services, multichannel satellite television services, internet access and
infrastructure services, maintenance and development of
communication infrastructures, provision of communication services to
other communications providers, and other services related to its area
of operation. The Company has a substantial market share in all of its
operating segments, whereas in the fixed-line communications
segment, it was declared a monopoly.
Bezeq wholly owns:
Bezeq International Ltd. (“Bezeq International”)
Pelephone Communications Ltd. (“Pelephone”)
DBS Satellite Services (1998) Ltd. (“YES”)
Walla! Communications Ltd. (“Walla”)
Bezeq Online Ltd. (“Bezeq Online”)
Exhibit 1: Bezeq Group’s holding structure
Exhibit 2: Bezeq’s ownership structure

12
Chapter A - Description of Bezeq’s Business
Bezeq
Exhibit 3: Development of Bezeq’s market value in 2018
(NIS millions)
Bezeq’s market value fell by 49% in 2018, mainly due to
intensification of competition in the television segment and further
loss of subscribers, the investigations in its regard, and instability
in the Company’s management headquarters, which will be
described below.

13
Chapter A – Description of Bezeq’s Business
Cellular Telephony operations (Pelephone)
Pelephone
Pelephone Communications Ltd was incorporated in Israel in 1985.
Pelephone engages in the provision of cellular communication
services and the sale and repair of terminal equipment.
Pelephone operates under an operating license from the Ministry of
Communications - a general cellular telephony license. The license is
valid until 2022 with an extension option, subject to the provisions of
the license, for a further six-year term, and for a further one or more
six-year renewal terms.
Pelephone is one of the six mobile network operators (MNOs) on the
market that own independent networks and one of the three largest
well-established cellular companies in Israel. The other operators,
namely Partner, Cellcom, HOT Mobile, Golan Telecom and Xfone,
are its main rivals. As at the end of the first quarter of 2018,
Pelephone held a 24% market share.
Pelephone generates its revenue in the following areas:
Basic telephone services (voice) - A bundle of services, including
voice, call completion and related services such as call waiting,
follow-me, voicemail, conference calls, etc.
Web navigation and data communication services - Web
navigations services by 3G and 4G cellular phone.
Content services - Pelephone offers its customers content services,
such as data storage backup services (Pelephone Cloud), antivirus
services, cyber protection services, viewing services of different
television channels (Super TV) and a music library (Musix) that
enables listening to a variety of music on mobile devices and PCs.
Roaming services - Pelephone allows its customers to roam with
their personal phones to countries worldwide and provides them with
roaming coverage in over 220 countries. In addition, it provides
incoming roaming services to the customers of foreign operators
staying in Israel.
Sale of terminal equipment - Pelephone offers different types of
mobile phones, hands-free devices and related accessories that
support its range of services. It also provides its customers with
terminal equipment, such as tablets, laptops, modems, speakers,
headphones and other related electronic products.
Maintenance and repair services - Pelephone offers a repair and
extended warranty service for a monthly fee which entitles the
customer to repair and warranty services for their cellular phone, or
for a one-time fee at the time of the repair.

14
Chapter A – Description of Bezeq’s Business
Cellular Telephony operations (Pelephone)
Pelephone (contd.)
Following are main operating data about Pelephone’s operations
(KPIs):
Exhibit 5: Pelephone – KPIs
1. Unlike the trends among the well-established operators,
Pelephone recruited 124,000 subscribers in 2017, mainly due
to the wide deployment of sales points as part of its
management’s strategy to focus on growth in the subscriber
listing. In 2018, Pelephone revised the definition of an active
subscriber, as a result of which 426,000 prepaid subscribers
were written off the subscriber listing.
2. Recently, the ARPU is declining due to increased competition
following the entry of new competitors into the market
(operators that own infrastructure and virtual operators), and
started marketing various cellular communication bundles at
low prices as part of market penetration measures. As a
result of the subscriber definition change made by the
Company, there was a certain increase in its ARPU.
Pelephone’s KPIs Note 2016 2017 Q4 2018
No. of subscribers (thousands) 1 2,402 2,525 2,205
% change (9.4%) 5.2% (12.7%)
ARPU (NIS per month) 2 63 61 66
% change (1.7%) (4.4%) 8.2%

15
Chapter A – Description of Bezeq’s Business
Debt rating
Reports by rating agencies regarding Bezeq’s rating
On April 30, 2018, Midroog affirmed the current Aa2.il rating for
the Company’s debentures (Series 6, 7, 9 and 10) with a stable
outlook.
On April 26, 2018, S&P Maalot affirmed the Company’s ilAA
rating and downgraded the rating outlook to negative due
expected further intensification of competition and in view of the
instability of the Company management. On November 18, 2018,
Maalot and Midroog affirmed the foregoing ratings, respectively,
for the issuance of new Series 9 debentures in the amount of NIS
55 million.
16
Chapter A – Description of Bezeq’s Business
Events beyond the regular course of business
Review of the events not in the ordinary course of business of
Bezeq. The information is based on the Company’s reports.
Investigations in terms of Bezeq Group and its
controlling shareholders
On June 20, 2017, the Israel Securities Authority launched a public
investigation. The investigation deals with suspicions of crimes under
the Securities Law and Penal Code in respect of transactions relating to
the controlling shareholder, relates to the purchase of YES shares by
Bezeq from Eurocom DBS, a company that was controlled by the
controlling shareholder, Shaul Elovitch. The investigation was later
expanded to include transactions to provide satellite communications
services between DBS and Spacecom Communications Ltd.
(“Spacecom”), a company that was controlled by Mr. Elovitch, and with
respect to dealings between the Ministry of Communications and Bezeq.
Senior officers in Bezeq Group were questioned as part of the
investigation. At a meeting of the Company’s Board of Directors held on
November 15, 2017, the Board accepted Mr. Elovitch’s proposal
whereby until further notice he does not wish to resume the position of
Chairman of the Board of Directors of Bezeq and Mr. David Granot will
continue to serve as Acting Chairman of the Board of Directors. It is
noted that as at the valuation date, Mr. Granot still serves as Chairman
of the Board of Directors of Bezeq Group.
On November 6, 2017, the Securities Authority issued a press release
regarding conclusion of the investigation and transfer of the
investigation file to the Tel Aviv District Attorney’s Office (Taxation
and Economics). According to the notice, the ISA has concluded that
there is prima facie evidence on offenses of:
1. The entitlement of the Company’s controlling shareholder to payment
of NIS 170 million as part of the transaction for the purchase of YES
shares from the controlling shareholder, by Bezeq, payment that was
contingent upon YES meetings certain targets.
2. Leaking material from the independent committee of the Company’s
Board of Directors that was required to examine interested party
transactions (the transaction for the acquisition of YES shares by the
Company and the transaction between DBS and Spacecom Ltd. for
the purchase of satellite segments) to the Company’s controlling
shareholder and his associates.
3. Promotion of the Company’s interests in the Ministry of
Communications, in violation of the Penal Code and Securities Law.
The notice also relates to transfer of the investigation file to the
District Attorney’s Office and that the District Attorney’s Office is
authorized to decide on the continued handling of the case.
On February 28, 2018, Bezeq’s Board of Directors announced its
resolution to appoint the head of the Company’s Business Division,
Kobi Paz, Acting CEO of Bezeq.

17
Chapter A – Description of Bezeq’s Business
Events beyond the regular course of business
Debt settlement in Eurocom Group and replacement of
control in Bezeq
On April 22, 2018, a liquidation order was issued for Eurocom
Communications (which entered into force on May 3, 2018), where in as
part of the liquidation decision the Court clarified that its ruling does not
derogate from the control permit regarding the Company. Subsequently,
on October 24, 2018, the Company received notice from Internet Gold-
Golden Lines Ltd. (“Internet Gold”), which is controlled by Eurocom
Communications and controls B Communications, the controlling
shareholder in the Company, that the special managers of Eurocom
Communications who were appointed in Eurocom’s liquidation process,
were confirmed as the holders of the control permit (effective from May
3, 2018), pursuant to Section 4D of the Communications Law and
Section 3 of the Communications Order.
On January 16, 2019, Internet Gold declared insolvency and cessation
of payments to debenture holders. On February 4, 2019, Internet Gold
and the representative of the Company’s debenture holders announced
the Company’s intention to look for a buyer for B Communications
shares. Moreover, the Ministry of Communications allowed Internet
Gold to reduce its rate of holdings in B Communications to 35% (from
50%) without derogating from its definition as an Israeli company.

18
Chapter A – Description of Bezeq’s Business
Events beyond the regular course of business
After Eurocom DBS failed to respond to the demand, on January 31, 2018,
Bezeq motioned the Tel Aviv District Court for a liquidation order for
Eurocom DBS on grounds that Eurocom DBS is insolvent.
On February 23, 2018, Eurocom Group filed motioned the court for
approval of an arrangement with its creditors. The motion to approve the
arrangement was filed after the meeting of Eurocom creditors approved
the arrangement. As part of the arrangement, Messrs. Naty Saidoff and
Tamir Cohen (who submitted the proposal) would invest significant
equity in return for the option of controlling Eurocom, through the entity
Shayma Investments S.A., a company controlled by them. In addition to
their above proposal, others (including Discount Investments) also made
proposals to Eurocom’s creditors. The other proposals were not
accepted or were shelved. Conclusion of the arrangement depends on
the following terms:
1. Obtaining the approval of the court for the arrangement, including
possible adjustments to the arrangement that might be necessary
according to its decision.
2. Receiving a pre-ruling from the tax authorities regarding different
aspects of the arrangement.
3. Terms relating to impairment events or material changes.
4. Obtaining any regulatory approval required by law (including a permit to
control Bezeq by the investors, which is required for exercising the
options, etc.).
Accordingly, at the option exercise date (subject to approval of the
arrangement and fulfillment of the foregoing conditions), Eurocom’s
holding structure did not change. According to the proposed
arrangement, even if the arrangement is approved, the preconditions
are met and the option is exercised, Eurocom will continue to control
Bezeq. However, the arrangement permits reviewing the option of a
direct purchase of the Group’s assets by the investors, subject to all
the tests and approvals required by law.
On February 25, 2018, B Communications Ltd., the indirect controlling
shareholder of the Company, sent a letter to Bezeq to convene an
urgent Board meeting to discuss the composition of the Company’s
Board of Directors and raise a proposal to appoint three new
directors to the Company’s Board (Shlomo Rodav, Doron Turgeman
and Tamir Cohen), in parallel and subject to the directors Shaul, Or
and Orna Elovitch ceasing their tenure on the Company’s Board.
In conclusion, the investigations in respect of the Company and the
managerial instability impact Bezeq’s operations in several channels:
Negative pressure on Bezeq’s share.
Management of the Company.
Decreased chance for significant regulatory relief in the upcoming
years.

Chapter B - Communications Market

20
Chapter B - Communications Market
Communications market in Israel
General
The communications market is divided into six main sub-markets:
1. Cellular telephony
2. Fixed-line telephony (including interconnection through the internet -
VOB/VOIP)
3. Multichannel television (satellite/cable/IPTV)
4. Internet service provider (ISP)
5. International services (ILD)
6. Broadband infrastructures (ADSL/cable/fiber)
The global communications market in general and Israeli market in
particular, is characterized by rapid development and frequent
changes in terms of technology and regulation. Whereas in the past
competition in the communications market focused on the independent
communications providers in each operating segment separately, in
recent years, there is a trend of merging of communications groups
that operate in several segments simultaneously, utilizing business
synergies, subject to regulatory restrictions in the industry.
The recent regulatory changes enabled the entry of additional and
relatively small participants, such as virtual operators and companies
that own independent infrastructure (partial) in the cellular segment.
Moreover, technological and strategic changes in the television
segment enabled the entry of IPTV operators and streaming
services. To date, the four major communications groups,
Bezeq, HOT, Cellcom and Partner, operate in all market
segments:
In 2017, the communications market revenue amounted to NIS 19.2
billion1, a decrease of 5.5% compared to 2016, mainly due to
increased competition and reduced prices in all segments.
1. According to Ministry of Communications data.
Bezeq Cellcom Partner Altice
Fixed-line
telephony Yes Yes Yes Yes
Internet
services
Yes (Bezeq +
Bezeq
International)
Yes Yes Yes
Television Yes (through
YES) Yes Yes Yes
ILD Yes Yes
(Netvision) Yes Yes
Mobile Yes
(Pelephone) Yes Yes
Yes (HOT
Mobile)

21
Chapter B - Communications Market
Communications market in Israel
Exhibit 7: Breakdown of Revenue in the Communications Sector - 2017 2
Main Communications Companies
Bezeq
Bezeq is active in all market segments. It was declared a monopoly by the
Antitrust Commissioner, inter alia, in the telephony infrastructure and
high-speed Internet segments.
Bezeq is the sole communications group that holds a significant market
share in one of the sub-markets and it is therefore obligated to have full
structural separation between all of the different services that it
provides.
2. Source: Public information published by the Ministry of Communications
HOT
As with Bezeq, HOT is also active in all segments of the market and the
structural separation obligation applies to it in the cellular and ISP
segments. Unlike Bezeq, the obligation to unbundle the service bundles
offered by HOT applies only between the cellular or ISP services and the
other services. Therefore, it can offer a triple bundle that includes
telephony, internet infrastructure and television services.
Cellcom
Cellcom is a communications service provider that offers its customers
mainly cellular services, fixed-line telephony, international telephone, ISP
and related services, and since December 2014, television services over
the Internet as well. As at the valuation date, among Cellcom’s offers is a
Quarttro bundle that includes television, fixed-line telephony, cellular and
internet.
Partner
Partner offers cellular services, fixed-line telephony, international
telephone, ISP and related services. In June 2017, Partner started
offering OTT television services under the Partner TV brand, thereby
becoming the fourth communications group to operate in all market
segments.

22
Chapter B - Communications Market
Communications market in Israel – Cellular
Cellular Market - General
Cellular communications operates through two main elements - mobile
phones and fixed broadcasting facilities. The mobile phone transmits
radio waves to the antenna installations of the broadcasting facilities,
which receive the radio waves from them. The cellular technologies
used to date in Israel until now are known as GSM/CDMA (2G), UMTS
(3G) and LTE (4G). There is currently a trend of lateral adoption of 4G
technology, due to the increasing demand for data traffic by the
consumers.
Until 2012, four independent operators (MNOs) operated in the cellular
market: Pelephone, Cellcom, Partner and Mirs (now HOT Mobile). As
opposed to the first three operators, until 2012 Mirs operated on the
Integrated Digital Enhanced Network (IDEN), which was used mainly
by public entities such as the IDF and companies that demonstrated a
need for such service. As part of the regulatory measures taken by the
Ministry of Communications to intensify competition in the cellular
communications market, in 2012 new operators entered the market:
1. Operators that own infrastructure: Golan Telecom and HOT Mobile
(which was acquired by HOT Group for integration in the traditional
cellular market).
2. Virtual operators: Operators such as Rami Levy Communications,
Telser, U-Phone, Home Cellular, etc. To date, many of the virtual
operators were acquired by the MNOs.
Entry of new operators led to an increase in churn rate at the well-
established companies and an ongoing price war, which together resulted
in erosion of profits of the well-established cellular companies.
There are currently six operators in Israel that hold a full license granting
them the right to operate cellular antennas: Pelephone, Cellcom, Partner,
HOT Mobile, Golan Telecom and Marathon 018.
Exhibit 13: Revenue in the cellular market 2008-2017 (in NIS
millions)7
The revenue in the celluar market has declined from a peak level of NIS
17 billion in 2010 to NIS 8.2 billion in 2017, despite the increase in
number of subscribers.
7. Source: Public reports of the Ministry of Communications regarding revenue in the
cellular market.

23
Chapter B - Communications Market
Communications market in Israel – Cellular
Business Environment and Competition
In 2011, the Ministry of Communications held a frequencies tender
aimed at adding two new operators to the industry. In April 2011,
HOT Mobile and Golan Telecom were announced the winners of
the tender. After winning the tender, the new operators signed
domestic roaming agreements with the well-established operators
as an interim solution until completion of deployment of their
independent network. As part of the market penetration measures,
the new operators offers bundles that include web navigation, calls
and SMS at a fixed monthly price (unlimited bundles). Opening the
market to competition led to decreased prices and increased
customer portability, resulting in ongoing impairment of the results
of the well-established operators.
Other than the new cellular operators, virtual operators were
added to the market, whose impact is less.
Subscribers and ARPU
Exhibit 14: Subscriber listings - Operators that own infrastructure8
As shown in the above chart, the number of subscribers of the well-
established operators is continuously decreasing over the years,
whereas the new operators, HOT Mobile and Golan Telecom,
demonstrate a year to year increase, emphasizing the intensifying
competition in the cellular market in Israel and the challenges faced
by the well-established operators. Unlike the other well-established
operators, Pelephone succeeded in producing a positive net
recruitment in 2016 and 2017.
8. Source: The Company's financial statements.

24
Chapter B - Communications Market
Communications market in Israel – Cellular
Exhibit 15: ARPU of the operators that own infrastructure
(excluding Golan Telecom)9
The above chart shows that the average monthly revenue per user
(ARPU) in constantly decreasing. E.g., the ARPU of the well-
established operators has eroded by 50%, from a level of NIS 106-
NIS 111 in 2011 to NIS 60-53 in 2018. In the last two years, the
erosion rate abated at all operators.
9. Source: The Company's financial statements.
Exhibit 16: Churn rates10
The churn rate of the MNOs rose with opening of the market to
competition and facilitation of consumer portability. On the other
hand, Pelephone succeeded in maintaining a lower churn rate than
the other operators.
10. Source: The Company's financial statements.

25
Chapter B - Communications Market
Communications market in Israel – Cellular
Recent developments
Network sharing
In view of the competition in the cellular market and the ARPU erosion,
certain entities in the market signed network sharing agreements -
joint cellular network maintenance and development, in order to save
costs. Following is a review of the existing agreements at the date of
the valuation.
HOT Mobile – Partner: In November 2013, Partner and HOT Mobile
announced signing of an agreement to establish a partnership to
maintain, develop and operate a single advanced cellular network for
both companies, each of which will hold half of the rights thereof.
According to the report, each of the parties will continue to hold and
operate their core network separately and provide cellular
communications services to their customers only. In April 2015, both
companies announced that the Ministry of Communications officially
approved the agreement.
Golan Telecom – Cellcom: On January 3, 2017, collaboration between
Cellcom and Golan Telecom was reported, with the aim of joint
development of networks and technologies. The agreement received
regulatory approval in March 2017.
Xfone - Cellcom: In March 20, 2017, the Ministry of Communications
approved an agreement between Cellcom and 018 Xfone Ltd.
(“Xfone”) for sharing of Cellcom’s 4G network and provision of hosting
services on the 2G and 3G networks.
Migration of Cellcom, Golan Telecom and Xfone to a shared network:
In March 19, 2018, the Ministry of Communications approved an
agreement between Cellcom, Golan telecom and Xfone to establish an
infrastructure operation company owned equally by these companies.
The company is responsible for operating a 3G network, and operation
and deployment of a 4G network for the operators.
Golan Telecom - Electra Transaction
• On January 3, 2017, Electra Consumer Products Ltd. (“Electra”)
reported the acquisition of 100% of Golan Telecom in return for NIS
350 million. On April 5, 2017, following approval of the transaction
by the Antitrust Commission and the Ministry of Communications,
the transaction was concluded.
Elimination of purchase tax on cellular phones
In April 2017, the Finance Minister announced an economic plan that
includes, inter alia, the elimination of import duties and purchase
taxes. As part of this plan, the Finance Ministry decided to abolish
purchase tax on imported cellular devices, which had been 15% of the
value of the device. Pursuant to this move, there are two opposing
effects on the performance of the cellular companies that sell terminal
equipment, namely a decrease in revenue from terminal devices due
to reduced prices and an increase in profits due to growth in demand.

26
Chapter B - Communications Market
Communications market in Israel – Cellular
Entry of Xfone into the market
Exhibit 18: Subscriber portability from entry of Xfone until January 2019 (in thousands)11
On April 10, 2018, Xfone launched the activity of its We4G cellular brand by marketing a lifelong
40GB deal at NIS 29. The competitive pricing led to erosion of the subscriber listing of the well-
established operators, mainly Partner and HOT Mobile.
11. Data from the subscriber portability system, according to Globes.

27
Chapter B - Communications Market
Communications market in Israel – Cellular
Exhibit 17: EBITDA rates from services in select countries in
Q3, 201812
Exhibits 17-18 shows that the EBITDA rate from cellular services is higher
in most developed countries than in Israel, due to the fierce
competition in this market in recent years. The total EBITDA rate of
the well-established operators dropped between 2011-2015 and is
rising moderately in recent years. Notably, this increase is mostly due
to early adoption of the IFRS15. Without this effect, the EBITDA rate
of the well-established operators would probably not have changed
materially in recent years.
12. Source: Merrill Lynch Global Wireless Matrix Q3 2018
13. Source: Financial statements of Bezeq, Cellcom and Partner.
Exhibit 18: Average EBITDA rate of the well-established
operators in Israel13

28
Chapter B - Communications Market
Communications market in Israel – Cellular
Exhibit 19: HHI in Select Countries, in Q3 201814
The Herfindahl-Hirschman Index is a market concentration
measure and the accepted indicator of the market
concentration in a sector. As shown in the above flow chart,
the market concentration in Israel is relatively low according to
this index, although there are more competitive countries.
14. Source: Merrill Lynch Global Wireless Matrix Q3 2018
Cellular Market – Conclusion
The cellular segment is highly competitive in recent years. This
competition leads to a decline in revenue as well as higher churn
and portability rates than usual before the reform in this market.
In the last two years, a moderation in the ARPU erosion rate is
evident, mainly due to a decrease in consumer sensitivity to price,
and the acquistion of Golan Telecom by Electra.
In our estimation and that of entities in this market, the current
ARPR levels are not economically feasible and it is reasonable to
assume that in the coming years there will be multiple moderate
increases or minimal sharp increases in the monthly ARPU.

Chapter C - Analysis of Financial Statements

30
Chapter C - Analysis of Financial Statements
Balance Sheet - Cellular Operations
Analysis of Main Items
Assets
Current assets: The assets of the operations continued to decrease in
2018, mainly due to a decline in revenue expressed in a reduction in
trade receivables and trade payables
Property, plant and equipment: An ongoing decline in property, plant and
equipment as a result of high depreciation expenses from current
investments.
Long-term interested party loan: A loan given to Bezeq.
Right of use of leased assets: An increase in the item resulting from
application of IFRS 16 for the first time.
Liabilities
Financial liabilities: As at December 31, 2018, Pelephone’s operations
do not have financial liabilities, other than employee retirement benefits.
Statements of Financial Position of Pelephone for December 31, 2015-
2017 (audited data) and December 31, 2018 (draft financial
statements):
NIS million December
31, 2015
December
31, 2016
December
31, 2017
December
31, 2018
Assets Audited Audited Audited Draft
Current assets 1,420 1,275 1,128 913
Non-current assets 1,854 2,019 2,143 3,211
Total assets 3,274 3,294 3,271 4,124
Liabilities + capital
Current liabilities 448 465 442 619
Non-current liabilities 70 104 94 806
Equity 2,756 2,725 2,735 2,699
Liabilities + capital 3,274 3,294 3,271 4,124

31
Chapter C - Analysis of Financial Statements
Profit and loss - Cellular operations
Analysis of Main Items
Revenue
Revenue from cellular services: Pelephone’s revenue from cellular
services continued to decrease in 2018, although moderately due to
growth of the subscriber listing that was offset by continued erosion
of the ARPU. The revenue from services in 2018 was NIS 1,755
million, a downturn of 1.5% compared to revenue in 2017 of NIS
1,782 million.
Revenues from sales of terminal equipment: The revenue from the
sale of terminal equipment fell in 2018 by 9.9%, mainly due to a
decrease in sales and launching of relatively weak devices.
In conclusion, the revenue of the cellular operations in 2018 was NIS
2,443 million, a decline of 4.0% compared to NIS 2,545 million in
2017.
Pelephone’s Statements of Income for 2015-2017 (audited data)
and 2018 (draft financial statements):
* In the Company’s signed financial statements as at December 31, 2018, the operating
profit was NIS (2) million. The difference is due to the fact that the above report includes
payments for leases.
NIS million 2015 2016 2017 2018
Audited Audited Audited Draft
Revenues from services 1,999 1,819 1,782 1,755
Change vs the parallel period (9.0%) (2.0%) (1.5%)
Revenues from sales of terminal equipment 891 812 763 688
Change vs the parallel period (8.9%) (5.9%) (9.9%)
Total Revenues 2,890 2,630 2,546 2,443
Change vs the parallel period (9.0%) (3.2%) (4.0%)
Payroll 381 378 384 379
% of revenue 13.2% 14.4% 15.1% 15.5%
General and operating expenses (including
payments for leases) 1,933 1,840 1,707 1,669
% of revenue 66.8% 69.9% 67.0% 68.3%
Amortization and depreciation 418 380 383 402
% of revenue 14.5% 14.5% 15.1% 16.3%
Total operating expenses 2,733 2,598 2,474 2,450
% of revenue 94.5% 98.8% 97.5% 100.3%
Operating profit 157 32 72 (7)*
% of revenue 5.4% 1.2% 2.8% (0.3%)
Adjusted EBITDA 576 412 455 395
% of revenue 19.9% 15.7% 17.9% 16.2%
CAPEX 426 241 308 306
% of revenue 14.7% 9.2% 12.1% 12.5%
Adjusted EBITDA minus CAPEX 150 171 146 89
% of revenue 5.2% 6.5% 5.8% 3.6%

32
Chapter C - Analysis of Financial Statements
Profit and loss - Cellular operations
Expenses, EBITDA, CAPEX, and operating cash flows
Pelephone’s expenses decreased by NIS 30 million (1%) in 2018
compared to 2017, but their percentage out of the total revenue rose.
The EBITDA rate eroded in 2018 by 1.7% compared to the EDIBTA rate
in 2018, and Pelephone recognized an adjusted operating profit of
NIS 7 million.
In terms of operating cash flows (before working capital changes and
tax expenses), erosion was measured, as expressed in the adjusted
EBITDA minus CAPEX, when the rate declined by 2.2% in 2018
compared to 2017, mainly due to the above revenue decrease.
In conclusion, in 2018 erosion of Pelephone’s profits was
measured to the point of an operating loss, mainly in view of the
imbalance in the market.

33
Chapter C - Analysis of Financial Statements
June 2018 projection compared to actual results - Cellular operations
Projection compared to performance
- 2018 (NIS millions) Projection* Actual Difference
Revenues from services 1,760 1,755 (5)
Sale of terminal equipment 753 688 (65)
Total revenue 2,513 2,443 (70)
Total operating expenses 2,504 2,450 (54)
% of revenue 99.64% 100.3%
Operating profit 9 (7) (16)
% of revenue
Amortization and depreciation
0.36%
401
(0.3%)
402
1
Adjusted EBITDA 410 395 (15)
% of revenue 16.32% 16.16%
Investments (CAPEX)
% of revenue
312
12.42%
306
12.53% (6)
EBITDA - CAPEX 98 88 (10)
% of revenue 3.90% 3.62%
The Company’s projection for the cellular operations prepared in mid-
2018 is presented on the left against the actual expenses, which are
based on known data of the first three quarters of 2018 and the draft
financial statements for the fourth quarter 2018.
Revenue: The revenue of the operations was NIS 70 million lower than
the Company’s projection for 2018, mainly due to a negative
deviation in the revenue from terminal equipment sales.
Expenses, EBITDA, CAPEX, and operating cash flows:
Expenses of the operations were NIS 54 million lower than the
Company’s budget, mainly due to a decrease in the cost of sale of
terminal equipment in line with a decline in revenue. The adjusted
EBITDA in 2018 was NIS 15 million lower than expected that year. In
terms of operating cash flows (before changes in working capital and
tax expenses), as expressed in EBITDA less CAPEX, a difference of
NIS 10 million was measured compared to the Company’s projection.
In conclusion, there was no material difference between the June
2018 projection and the actual results.
* According to the projection of Pelephone’s management that
was used for the valuation as at June 30, 2018.

Chapter D - Valuation

35
Chapter D - Valuation
Valuation Methodology
Subscriber listing base
The revenue from Pelephone’s prepaid subscribers is not material
compared to its total revenue. Pelephone’s management decided to
revise the definition of an active subscriber so as not to include IoT
subscribers, and to add separate reference to prepaid subscribers,
according to which a prepaid subscriber will be included in the active
subscriber listing as from the date at which loading is executed, and will
be derecognized from the active subscriber listing if no outgoing use is
made for six months.
The change entered into force at the beginning of the third quarter of 2018
and as a result, 426,000 prepaid subscribers are were derecognized from
Pelephone’s active subscriber listings. Such subscriber derecognation led
to an increase in ARPU of NIS 11.
This derecognition did not affect Pelephone’s revenue and cash flows or
the assumptions and results of this valuation.
Revenue
Revenues from services
Subscribers
Recently, the well-established cellular operators are characterized by a
loss of subscribers compared to Pelephone, that demonstrated a growth
in subscriber listings in the last two years, mainly due to successful
implementation of its growth strategy that included, among other things,
wide deployment of sales points.
In 2019, we adopted the Company’s projection regarding a positive
cumulative recruitment of 127,000 subscribers. In 2020-2023, a positive
cumulative recruitment of 310,000 subscribers, mostly postpaid, was
assumed. Notably, the subscriber listing growth in 2020-2023 is based on
the Company’s projection in view of the accuracy of its projections in the
previous year and an update of the projections in view of the market
condition. In conclusion, the total subscriber listing will grow from
2,205,000 subscribers at the end of 2018 to 2,642,000 at the end of 2023.
ARPU
It was assumed that the current level of prices is not sustainable in the
long term. The number of operators in the Israeli cellular market is
relatively high for the size of the area and quantity of users in Israel. It is
reasonable that in the long term, prices will increase to an economically
feasible and sustainable level. Continuation of the ARPU erosion in 2019,
a certain stabilization in 2020 and a moderate increase in the subsequent
years were assumed.
As a result of these assumptions, the total revenue from services will
grow from NIS 1,755 million in 2018 to NIS 2,153 million in 2023, a
compound annual growth rate (CAGR) of 4.2%.

36
Chapter D - Valuation
Cellular segment - Key assumptions - KPIs in the Cellular services
Projected KPIs
Note:
The weighted ARPU includes revenue for terminal equipment services, according to Pelephone’s measurement method.
Revenues from sales of terminal equipment:
It was assumed that in 2019, the total revenue from the equipment sales will be NIS 6 million lower than in 2018 and amount to NIS 682 million (price
and quantity effect). From 2019 onwards, a further erosion at a fixed rate of 1.2% annually until 2023 was assumed. Notable, these assumptions are
based on the projection of Pelephone’s management.
Revenue - conclusion
When combining the above assumptions, Pelephone’s total revenue will grow from NIS 2,443 million in 2017 to NIS 2,802 million in 2023.
Year Q4A 2018 2019E 2020E 2021E 2022E 2023E
Subscribers (thousands)
Subscribers, end of period 2,205 2,332 2,427 2,502 2,572 2,642
% change 0.9% 5.8% 4.1% 3.1% 2.8% 2.7%
ARPU (NIS)
Weighted ARPU 66 64 64 66 68 69
% change (2.8%) (3.5%) 0.4% 2.6% 2.3% 1.8%
Year 2018A 2019E 2020E 2021E 2022E 2023E
Revenue from the sale of
terminal equipment 688 682 675 666 658 650
Revenues from services 1,755 1,752 1,838 1,954 2,058 2,152
Total revenue (NIS million) 2,443 2,434 2,513 2,620 2,716 2,802
% change (4.0%) (0.3%) 3.2% 4.3% 3.7% 3.2%

37
Chapter D - Valuation
Cellular segment - Key assumptions
Operating expenses (NIS millions)
Projected operating expenses of the cellular operations in 2019-2023:
* Including other income (expenses), net
The decrease in expenses is due mainly as a result of the restructuring plan. The projected expenses assumed by us are different to the Company’s
projection in terms of implementation of the restructuring plan; whereas we assumed that the Company will implement the plan partially, the Company
believes that it will be exercised in full.
Year (NIS millions) 2018A 2019E 2020E 2021E 2022E 2023E
Payroll expenses: 379 372 361 343 344 350
% of Revenues 15.8% 15.3% 14.4% 13.1% 12.7% 12.5%
General and operating expenses* 1,410 1,450 1,453 1,456 1,423 1,427
% of Revenues 57.34% 59.6% 57.8% 55.6% 52.4% 50.9%
Payments for leases 259 254 255 255 255 255
% of Revenues 10.6% 10.4% 10.1% 9.7% 9.4% 9.1%
Total operating expenses (adjusted) 2,048 2,076 2,069 2,054 2,022 2,032
% of Revenues 83.8% 85.3% 82.4% 78.4% 74.5% 72.5%

38
Chapter D - Valuation
Cellular segment - Key assumptions
EBITDA (adjusted)
When combining the above assumptions regarding the operating revenue and expenses, it was assumed that the adjusted EBITDA will grow from NIS
395 million in 2018 (16.2% of the revenue) to NIS 771 million in 2023 (27.5% of the revenue).
Tax expenses
A corporate tax rate of 23% was assumed based on the current statutory tax rate in Israel.
CAPEX
The projected CAPEX is in line with Pelephone’s projection. In the terminal year, we estimated an investment level of 14% of the turnover, and likewise
for the CAPEX level in 2022.
Working capital
The changes in working capital of the operations are based on the average working capital as a percentage of the revenue in the last three years.
NIS million 2015A 2016A 2017A 2018A 2019E 2020E 2021E 2022E 2023E
Adjusted EBITDA 576 412 455 395 358 443 566 694 771
% of revenue 19.9% 15.7% 17.9% 16.2% 14.7% 17.6% 21.6% 25.5% 27.5%

39
Chapter D - Valuation
Cellular segment - Key assumptions
Discount rate
The discount rate used in this valuation is 10.3% (equivalent to 12.2%
before tax), according to the CAPM model (for further information, see
Appendix A).
Permanent growth
Since prices hikes are expected in this market in the long term, a natural
increase in the number of subscribers and development of new revenue
channels, such as the Internet of Things (IoT), it was assumed that the
permanent growth will be 2.5%, the same as that used in the valuation of
operations as at December 31, 2017 and June 30, 2018.

40
Chapter D - Valuation
Cellular segment - Projected cash flows
NIS million 2018A 2019E 2020E 2021E 2022E 2023E TY
Revenues from services 1,755 1,752 1,838 1,954 2,058 2,153
Sale of terminal equipment 688 682 675 666 658 650
Total revenue 2,443 2,434 2,513 2,620 2,716 2,802 2,872
% change compared to parallel period (4.0%) (0.4%) 3.2% 4.3% 3.7% 3.2% 2.5%
Payroll expenses (379) (372) (361) (343) (344) (350)
% of revenue 15.5% 15.3% 14.4% 13.1% 12.7% 12.5%
General and operating expenses* (1,410) (1,450) (1,453) (1,456) (1,423) (1,427)
% of revenue 57.3% 59.6% 57.8% 55.6% 52.4% 50.9% Payments for leases (259) (254) (255) (255) (255) (255)
% of revenue 10.6% 10.4% 10.1% 9.7% 9.4% 9.1%
Total operating expenses (net of amortization
and depreciation) (2,048) (2,076) (2,069) (2,054) (2,022) (2,032)
% of revenue 83.8% 85.3% 82.4% 78.4% 74.5% 72.5%
Adjusted EBITDA 395 358 443 566 694 771 790
% of revenue 16.2% 14.7% 17.6% 21.6% 25.5% 27.5% 27.5%
Total amortization and depreciation (402) (384) (384) (378) (384) (411) (411)
Adjusted operating profit (7) (26) 60 188 309 360 379
% of revenue (0.3%) (1.1%) 2.4% 7.2% 11.4% 12.8% 13.2%
Tax revenues (expenses) - (8) (43) (71) (83) (87)
Tax rate 0% 13% 23% 23% 23% 23%
CAPEX (306) (374) (371) (388) (407) (401) (411)
% of revenue (12.5%) (15.3%) (14.8%) (14.8%) (15.0%) (14.3%) (14.3%)
Positive (negative) cash flows from changes in
working capital (3) 1 1 1 1 1
Cash flows (18) 65 136 217 288 293
Discount period 0.50 1.50 2.50 3.50 4.50 4.50
Discounted cash flows (17) 56 107 154 186 2,428
* Including other finance income (expenses), net

41
Chapter D - Valuation
Cellular segment - Valuation results
Valuation Summary
In conclusion, the value of operations in the cellular segment, based
on the above assumptions, as at December 31, 2018, is NIS 2,914
million. According to information given to us by Bezeq, the carrying
amount of this segment in its books was NIS 2,149 million, therefore,
there is no need for impairment.
Development of the value of Pelephone (compared to our
previous valuations)
Sensitivity Analysis
The valuation conducted by Prometheus is based on partial
implementation of a stand-alone restructuring plan. However, the
Company’s management expects that it will be possible to implement the
restructuring plan in full and even more, utilizing the synergies between
Pelephone, YES and Bezeq International.
A review of the effect of the restructuring plan on the value of
operations shows that even in a scenario in which the Company
does not perform any restructuring measures, the value of
operations as at December 31, 2018 is higher than the carrying
amount in Bezeq’s books.
Valuation Results NIS million
Value of operations from the model years 486
Value of operations from the benchmark year 2,428
Total value of operations 2,914
Description NIS millions
Pelephone valuation as at December 31, 2017 5,403
% change (15.9%)
Pelephone valuation as at June 30, 2018 3,907
% change (27.7%)
Pelephone valuation as at December 31, 2018 2,914
% change (25.4%)

42
Chapter D - Valuation
Cellular segment - Valuation results
Sensitivity Analysis
Sensitivity analysis of the value of operations in the cellular segment for
changes in the discount rate and permanent growth:
Conclusion
An increase (decrease) of 1% in the discount rate leads to an increase
(decrease) in the value of Pelephone’s operation in the range of between
NIS 299 million and NIS 664 million. An increase (decrease) of 0.5% in
the discount rate leads to an increase (decrease) in the value of
Pelephone’s operation in the range of between NIS 141 million and NIS
208 million.
Sensitivity Analysis
Sensitivity analysis of the value of operations in the cellular segment for
changes in the ARPU of the Company’s subscribers:
Conclusion
An increase (decrease) of NIS 1 in the ARPU leads to an increase
(decrease) in the value of Pelephone’s operations of NIS 295 million.
Discount rate
2,901 8.3% 9.3% 10.3% 11.3% 12.3%
Permanent
growth
1.5% 3,511 3,004 2,613 2,304 2,054
2.0% 3,768 3,191 2,754 2,414 2,141
2.5% 4,069 3,405 2,914 2,536 2,237
3.0% 4,427 3,654 3,095 2,673 2,343
3.5% 4,861 3,945 3,303 2,827 2,461
Change in ARPU in NIS
(2) (1) 0 1 2
Value of
operations 2,323 2,619 2,914 3,209 3,503

Appendices

44
Appendix A
WACC - Cellular segment
Additional information about the
benchmark companies
Company Unlevered Beta D/V
Partner 0.82 0.24
Cellcom 0.63 0.48
Telenor 0.78 0.18
O2 0.73 0.15
US Cellular Corp. 0.80 0.17
Orange Belgium 0.62 0.23
Median 0.76 0.21
Calculation of Discount Rate - Cellular Operations
The above table sets out the calculation of a discount rate of operations as at
December 31, 2018 of 10.3%.
Marking Parameter Value Remarks
D/V Debt to asset value ratio 0.21 Based on the median of the comparison companies (see the
table on the left)
E/V Equity to balance sheet ratio 0.79 (D/V) = 1 - (E/V)
D/E Debt to equity ratio 0.25 (E/V) (D/V)/ = (D/V)
βUL Unlevered Beta of benchmark
companies 0.76
To assess the beta of the operations, we chose a group of
similar companies. According to our test, there are no traded
companies with the identical operations to those assessed.
Therefore, we chose companies with some of the same
characteristics as those of the operations, but which are different
from each other, to create a mix that better expresses its
characteristics. The beta is calculated on a weekly basis for a
period of five years.
Tax Long-term tax rate of operations 23.0% Long-term tax rate of assessed operations
βL Unlevered Beta of operations 0.91 βL= βUL*{1+(1-Tax)*(D/E)}
Rf Risk-free interest 3.2% Multi-annual nominal yield to maturity of NIS government bonds
for a period of 15 years as at December 31, 2018
MRP Market premium 5.9% Risk premium in the Israeli market based on Damodaran data
updated to 2018
SRP Specific Risk Premium 3.5% Premium for increase based on Duff and Phelps data for 2018
for medium-sized companies
Re Cost of Equity 11.99% RE = Rf + βL * MRP + SRP
Rd Cost of Debt of the Company 4.6% Price of long-term debt of operations - based on yield to maturity
at the valuation date of debentures with an AA rating
WACC Weighted Average Cost of
Capital 10.27% WACC = Re *(E/V) + Rd*(D/V)*(1-TAX)

45
Appendix B
Carrying amount - Cellular segment
Carrying amount - Cellular segment
Breakdown of carrying amount of the cellular segment (Pelephone) as at December 31, 2018, as given to us by Bezeq:
Pelephone’s net operating assets do not include trade receivables for the sale of terminal equipment in installments (financial instrument).
Section Value (NIS millions)
Operating assets, net * 2,421
Operating liabilities (1,299)
Excess cost-goodwill for Pelephone recorded in Bezeq’s books 1,027
Total carrying amount of Pelephone in Bezeq’s books 2,149


![Clara Y. Yatini National Institute of Aeronautics and ...aoswa.nict.go.jp/wsreport2012/pdf/[O-07]presentation.pdf · Gambar 3-7 : Kejadian anomali beberapa satelit tahun 1998 satellite](https://static.fdocuments.in/doc/165x107/5d414f5988c9936e348b496c/clara-y-yatini-national-institute-of-aeronautics-and-aoswanictgojpwsreport2012pdfo-07.jpg)