DBS Group Holdings 3Q 2002 Financial Results · PDF fileDBS Group Holdings 3Q 2002 Financial...
26
DBS Group Holdings 3Q 2002 Financial Results Presentation to Media and Analysts This presentation is available at www.dbs.com Disclaimer: The material that follows is a presentation of general background information about the Bank’s activities current at the date of the presentation. It is information given in summary form and does not purport to be complete. It is not intended to be relied upon as advice to investors or potential investors and does not take into account the investment objectives, financial situation or needs of any particular investor. These factors should be considered, with or without professional advice, when deciding if an investment is appropriate. DBS accepts no liability whatsoever with respect to the use of this document or its contents. October 28, 2002
-
Upload
duongnguyet -
Category
Documents
-
view
221 -
download
1
Transcript of DBS Group Holdings 3Q 2002 Financial Results · PDF fileDBS Group Holdings 3Q 2002 Financial...

DBS Group Holdings3Q 2002 Financial ResultsPresentation to Media and Analysts
This presentation is available at www.dbs.comDisclaimer: The material that follows is a presentation of general background information about the Bank’s activities current at the date of the presentation. It is information given in summary form and does not purport to be complete. It is not intended to be relied upon as advice to investors or potential investors and does not take into account the investment objectives, financial situation or needs of any particular investor. These factors should be considered, with or without professional advice, when deciding if an investment is appropriate. DBS accepts no liability whatsoever with respect to the use of this document or its contents.
October 28, 2002

2
Net interest income 2,003 1,550 29.3Fee income 607 419 44.8
Non-interest income 1,014 1,016 (0.2)Operating income 3,018 2,566 17.6
Staff costs 685 634 8.1Other operating expenses 693 579 19.6
Operating expenses 1,378 1,213 13.6Operating profit 1,640 1,353 21.1Goodwill 206 64 223.3Provisions 353 292 21.0Net profit 735 830 (11.5)Cash net profit (a) 940 894 5.2
(S$ million)9M 2002 9M 2001 %
change
Nine months operating profit up 21% year on year
(a) Net profit before goodwill amortization

3
Operating profit down 2.3% quarter on quarter
3Q 2002 2Q 2002 % change 3Q 2001 %
change
(a) Net profit before goodwill amortization
Net interest income 671 663 1.1 588 14.0Fee income 201 213 (5.9) 168 19.5
Non-interest income 313 348 (10.1) 450 (30.5)Operating income 983 1,011 (2.7) 1,038 (5.3)
Staff costs 219 230 (4.5) 244 (10.2)Other operating expenses 233 238 (2.2) 220 5.9
Operating expenses 452 467 (3.3) 464 (2.6)Operating profit 531 544 (2.3) 574 (7.5)Goodwill 69 69 0.6 64 8.7Provisions 150 107 40.1 246 (38.8)Net profit 199 258 (22.8) 201 (0.9)Cash net profit (a) 268 327 (17.9) 265 1.4
(S$ million)

4
3Q 2002 3Q 2001Comparison of vs.
Cash ROA (c) 0.71% 0.34%
Net interest margin 2.00% 1.77%
Cash ROE (c) 7.62% 4.63%
Non-interest inc. / operating inc. 31.8% 31.4%
(a) Excludes extraordinary gains (b) Excludes goodwill amortization(c) Earnings per share before goodwill amortization, annualized
NPLs 5.7% 6.0%
Loan-to-deposit 63.2% 64.2%
Cash EPS ($) (c) 0.72 0.42
Cost-to-income (b) 46.0% 44.7%
Financial ratios (YoY)
(a)

5
670 671707
588
472489
663
2.00%1.85% 1.69% 1.77%2.11% 2.02% 1.96%
1Q 2001 2Q 2001 3Q 2001 4Q 2001 1Q 2002 2Q 2002 3Q 2002
Net interest incomeNet interest margin (gross basis)
Interest margins remain firm(S$ million)

6
Fee income now 20% of revenues
Trade finance 28 26 6.2 29 (3.2)Deposit-related 28 28 (0.7) 29 (3.2)Credit card 24 25 (3.3) 29 (16.4)Loan-related 41 34 21.1 35 16.4Investment banking 19 20 (6.7) 15 23.6Stockbroking 24 36 (34.0) 7 227.8Fund management 5 11 (57.0) 5 (7.1)Wealth management 25 24 6.7 13 95.3Others 7 9 (22.8) 5 27.5Total 201 213 (5.9) 168 19.5Fee-to-income ratio (%) 20 21 16
(S$ million) 3Q 2002 2Q 2002 % change 3Q 2001 %
change

7
Net gain on foreign exchangesecurities and derivatives 57 79 (27.0) 116 (50.6)
Singapore government securities 39 21 86.8 13 205.7
Equities (14) nm nm 15 (191.6)
Disposal of investment securities 7 6 14.8 119 (94.5)
Disposal of fixed assets 1 5 (86.3) (2) nm
Others 5 5 0.4 7 (27.5)
Total 95 115 (17.5) 267 (64.6)
Other income
3Q 2002 2Q 2002 % change 3Q 2001 %
change
nm: not meaningful or insignificant
(S$ million)

8
Emphasis on non-interest income produces stronger returns (a)
(%) Non-interest income to Operating income
32
2429 30 33 31
1998 1999 2000 2001 3Q 2001 3Q 2002
(a) Excludes extraordinary items

9
Wealth management continues to grow
Sales volume
(a) Unit trusts include Horizon, Ei8ht, Up! and other DBSAM programmes while treasury investment products include Growth, Surf, equity-linked deposits and structured notes
Unit trusts / Treasury investment products (a)
Insurance / asset plan
256 359 436 502
951766 709
12814
11664 48
141
107
0
200
400
600
800
1000
1200
1Q 2001 2Q 2001 3Q 2001 4Q 2001 1Q 2002 2Q 2002 3Q 2002
484
643
1,0581,922
372 423
894
723
2,675
(S$ million)

10
(a) Includes brokerage expenses(b) Dao Heng Bank Group (“DHG”), DBS Vickers (“DBSV”)
3Q 2002 2Q 2002 % change 3Q 2001 %
change Group operating expenses
Disciplined in managing operating costs downwards
Staff costs 156 171 (8.8) 181 (13.9)Occupancy expenses 38 38 0.9 42 (8.4)Technology-related expenses 47 45 4.5 31 53.6Non-interest expenses (a) 26 14 89.3 11 139.0Other operating expenses 49 67 (26.3) 76 (35.5)
DBSH (excl DHG and DBSV) (b) 317 335 (5.4) 341 (7.0)
DHG 92 90 2.0 100 (8.0)
DBSV / DBS Securities Group 43 42 1.5 23 88.2
Total 452 467 (3.3) 464 (2.6)
(S$ million)

11
Core expenses(a) down 13.4% since 1Q 2001
(a) DBSH Group, excludes impact of acquisitions
317335312333341366 346
1Q 2001 2Q 2001 3Q 2001 4Q 2001 1Q 2002 2Q 2002 3Q 2002
(S$ million)% change since 1Q 2001: -13.4%
12
Jun 2002
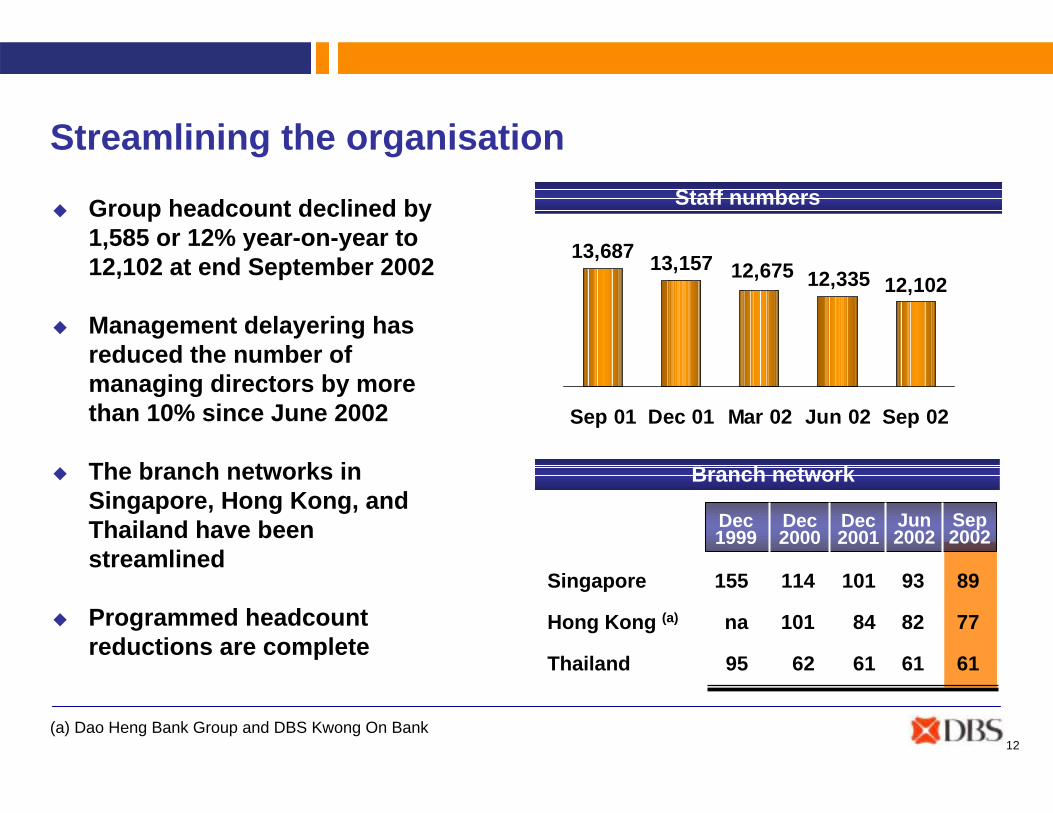
Streamlining the organisation
Group headcount declined by 1,585 or 12% year-on-year to 12,102 at end September 2002
Management delayering has reduced the number of managing directors by more than 10% since June 2002
The branch networks in Singapore, Hong Kong, and Thailand have been streamlined
Programmed headcount reductions are complete
Staff numbers
12,10212,33512,67513,687 13,157
Sep 01 Dec 01 Mar 02 Jun 02 Sep 02
Singapore 155 114 101 93 89
Hong Kong (a) na 101 84 82 77
Thailand 95 62 61 61 61
Dec 1999
Dec 2000
Dec 2001
Sep 2002
Branch network
(a) Dao Heng Bank Group and DBS Kwong On Bank
Jun 2002

13
Net interest income 157 154 1.8 150 4.9
Non-interest income 60 49 21.8 69 (12.7)
Operating income 217 204 6.6 219 (0.7)
Operating expenses 92 90 2.0 100 (8.0)
Operating profit 125 113 10.3 118 5.6
Provisions 22 74 (70.6) 24 (7.6)
Net profit before tax 102 40 152.7 98 3.3
Net profit after tax 88 26 245.2 84 5.5
Dao Heng Bank operating profits up (S$ million) (a)
(a) Based on Singapore GAAP
3Q 2002 2Q 2002 % change 3Q 2001 %
change

14
DBS Thai Danu Bank operating profits up
Net interest income 25 24 3.8 22 15.5
Fee income 5 6 (8.7) 4 28.7
Non-interest income 12 8 43.0 7 64.2
Operating income 37 33 13.9 29 27.7
Operating expenses 24 23 3.9 21 12.3
Operating profit 14 10 36.8 8 68.1
Non-operating expenses 2 2 - 2 10.4
Provisions 8 5 66.7 5 81.8
Net profit after tax 3 3 12.4 2 95.1
(S$ million) (a)
(a) Assume exchange rate of 1 baht to S$0.041. Based on Thai GAAP
3Q 2002 2Q 2002 % change 3Q 2001 %
change

15
2,705 2,4251,735 1,610 1,486 1,528 1,478 1,518 1,449
1,1521,239
1,365
768
2,874
3,207
1,2381,143 1,101 995 972 933
815 777 744
649
770 642 518624 552563605
267698738
667 624 589 632
366
1,004556580699
5.7%5.9%5.9%5.7%6.0%6.2%7.6%
13.0%11.8%
2.7%
Dec 97 Dec 98 Dec 99 Dec 00 Jun 01 Sep 01 Dec 01 Mar 02 Jun 02 Sep 02
NPL rate continues to improve Dao Heng BankDBS Thai Danu BankRegional 5 countriesOthersSingaporeNBk NPLs / NBk loans (%)
1,112
4,503
7,086
8,149
4,5774,411 4,512 4,360 4,155
Includes Dao Heng
4,834
(S$ million)

16
2,576997942921546 906844
488 426415
621
358 435 520
4,952
2,7323,0033,0943,0863,5543,508
5.7%5.9%5.9%5.7%6.2%
13.0%
7.6%
0
2500
5000
7500
Dec 99 Dec 00 Jun 01 Dec 01 Mar 02 Jun 02 Sep 02
Percentage of doubtful and loss NPLs stable
LossDoubtful
(S$ million) Substandard
8,149
4,411 4,512
(61%)
(8%)
(32%)
(80%)
(12%)
(8%)
(68%)
(12%)
(20%)
(69%)
(11%)
(20%)
4,503
(66%)
(10%)
(24%)
4,360
NBk NPLs / NBk Loans (%)
(69%)
(9%)
(22%)
4,155
Includes Dao Heng
(74%)
(17%)
(9%)
4,834

17
8.6% 9.0%10.3% 10.8%11.2%
3.00%
6.00%
9.00%
12.00%
DBS Hong Kong credit cards
3M 2002
(a) Source: Hong Kong Monetary Authority
6M 2002 9M 2002
DBS HK delinquency rates
30 days past due 2.3% 2.6%
90 days past due 1.0% 1.2%
2Q02 3Q02
?Total Singapore and Hong Kong card receivables as % of DBS’
loan book: 2.7%
Hong Kong charge-off rates DBSIndustry (a)

18
Non-loan provision charges up
9M 2002 3Q 2002
Loans 275 191 112 74 119
Equities 43 139 47 (8) 116
Properties 81 19 nm 76 4
Specific Provision 399 349 159 141 239
General Provision (46) (57) (9) (34) 7
Total 353 292 150 107 246
2Q 2002 3Q 20019M 2001(S$ million)
nm: not meaningful or insignificant

19
(S$ million)
Total provision coverage remains healthy
1,115
1,191
1,012
1,5212,032
1,6021,6661,6581,4641,237
3,095
1,0311,048
1,0551,0611,179
Dec 98 Dec 99 Dec 00 Jun 01 Dec 01 Mar 02 Jun 02 Sep 02
General Provisions (GP)Specific Provisions (SP)
2,2862,719 2,633
4,286
3,1472,533
Includes Dao Heng
2,7212,643
SP+GP / Unsec NPLs 102.7 118.4 129.9 146.5 142.5 132.0 129.2 124.8
SP+GP / NPLs 44.4 52.6 51.8 54.7 60.3 60.4 60.4 61.0
Coverage ratios (%)

20
15.7 14.412.2 12.6 13.7
10.2
4.55.2 4.9
5.3
5.5
3.5
4
8
12
16
20
24
Dec 99 Dec 00 Dec 01 Jun 02 Sep 02
Achieved target cushion for Proforma Tier 1
Capital adequacy ratio
17.418.919.2
17.6
Tier 1 capital ratio (%)Tier 2 capital ratio (%)
Sep 02Pro forma for
Dao Heng2nd tranche
19.0
15.7

21
Focus on the three growth areas where DBS has an established presence
Yangtze DeltaPopulation : 138mAs % of total : 11
GDP (US$ bn) : 232As % of total : 215 year GDP % growth : 10.2GDP per capita (US$) : 2,407
MacauHong Kong
Pearl River DeltaPopulation : 86mAs % of total : 7
GDP (US$ bn) : 117As % of total : 115 year GDP % growth : 10.1GDP per capita (US$) : 1,557
ShanghaiYangtze Delta
Region
Pearl River Delta Region Shenzhen
Population : 24mAs % of total : 2
GDP (US$ bn) : 50As % of total : 55 year GDP % growth : 10.1GDP per capita (US$) : 2,444
Beijing-Tianjin Corridor
TaipeiDBS Branch
DHB Representative OfficeDBS Asia Capital Representative Office
DHB Branch
TianjinBeijing
Beijing-TianjinCorridor
Fuzhou

22
DBS business activities in China today
Foreign currency business with foreign invested enterprises & foreigners
RMB business with foreign invested enterprises & foreigners
DHB Shenzhen(May 1993)
DBS Shanghai(June 1995)
DBS Beijing (March 1998)
Branch’s scope of business
Foreign currency business with Chinese enterprises & individuals
Application submitted
DBS has all the permitted branch and foreign exchange licenses available to foreign banks
Shanghai, Zhejiang, Jiangsu, Shenzhen, Dalian, Tianjin
DBS Asia Capital SH(January 2000)
DHB Tianjin(July 1997)
DHB Fuzhou(March 1994)
Representative office

23
DBS will extend its presence in line with WTO liberalisation timetable
Dec 2001 Dec 2002 Dec 2003 Dec 2004 Dec 2005 Dec 2006
ForeignersShanghaiShenzhenDalianTianjin
GuangzhouQingdaoNanjingWuhan
Chinese enterprises
RMB business allowed commencing 2004Same cities as the timetable for foreigners (as above)
Chinese individuals
Add 4 cities Add 4 cities Add 4 cities
Renminbi business
Foreign currency businessNo restrictions
All restrictions removed
All restrictions removed
All restrictions removed
WTO liberalization timetable

24
Extend existing advisory, capital markets, securities underwriting, private equity, foreign exchange, syndication and lending business
DBS’ China business strategy
Investment Banking, Treasury
& Markets
Enterprise Banking
Consumer Banking
Capture product opportunities in line with WTO timelineCapture new business from foreign direct investments and target PRC SMEs
Expand consumer business in line with WTO timeline

25
DBS’ value proposition in ChinaWell capitalized Pan-Asian financial services franchise with dominant market position and retail distribution in Singapore and Hong Kong
Solid platform for expansion into South China (Pearl River Delta region) through Dao Heng Bank
Up-to-date, scalable IT and straight-through-processing operations platform
Established capabilities in corporate banking, syndicated finance in Greater China
Distinct Treasury & Markets, capital markets and securities distribution capabilities
Strong corporate governance, risk management, credit management and compliance culture

DBS Group Holdings3Q 2002 Financial ResultsPresentation to Media and Analysts
This presentation is available at www.dbs.comDisclaimer: The material that follows is a presentation of general background information about the Bank’s activities current at the date of the presentation. It is information given in summary form and does not purport to be complete. It is not intended to be relied upon as advice to investors or potential investors and does not take into account the investment objectives, financial situation or needs of any particular investor. These factors should be considered, with or without professional advice, when deciding if an investment is appropriate. DBS accepts no liability whatsoever with respect to the use of this document or its contents.
October 28, 2002