DBS BANK (HONG KONG) LIMITED · PDF file3 COMPOSITION OF CAPITAL ... 11.1 Overdue loans and...
45
星展銀行(香港)有限公司 DBS BANK (HONG KONG) LIMITED (Incorporated in Hong Kong with limited liability) REGULATORY DISCLOSURE STATEMENTS For the six months ended 30 June 2017
Transcript of DBS BANK (HONG KONG) LIMITED · PDF file3 COMPOSITION OF CAPITAL ... 11.1 Overdue loans and...

星 展 銀 行( 香 港 )有 限 公 司
DBS BANK (HONG KONG) LIMITED(Incorporated in Hong Kong with limited liability)
REGULATORY DISCLOSURE STATEMENTS
For the six months ended 30 June 2017

DBS BANK (HONG KONG) LIMITED AND ITS SUBSIDIARIES
REGULATORY DISCLOSURES
CONTENTS
Pages
1 INTRODUCTION ...................................................................................................................... 1
2 CAPITAL ADEQUACY .............................................................................................................. 12.1 Capital Adequacy Ratios2.2 Capital Conservation Buffer Ratio2.3 Countercyclical Capital Buffer Ratio2.4 Geographical Distribution of RWA related to Credit Exposures used in the
Countercyclical Capital Buffer Ratio
3 COMPOSITION OF CAPITAL ................................................................................................... 33.1 Financial Statements and Regulatory Scope of Consolidation3.2 Capital Adequacy and Reconciliation of Regulatory Capital to the Balance Sheet3.3 Main Features of Capital Instruments
4 LEVERAGE RATIO ................................................................................................................... 134.1 Leverage Ratio4.2 Components of Leverage Ratio
5 OVERVIEW OF RISK-WEIGHTED ASSETS ............................................................................. 15
6 CREDIT RISK ........................................................................................................................... 166.1 Credit Quality of Assets6.2 Changes in Stock of Defaulted Loans and Debt Securities6.3 Overview of Recognized Credit Risk Mitigation6.4 Credit Risk Exposures and Effects of Recognized Credit Risk Mitigation –
STC approach6.5 Credit Risk Exposures by Asset Classes and by Risk Weights – STC approach6.6 Credit Risk Exposures by Portfolio and PD ranges – for IRB approach6.6.1 Foundation IRB Approach6.6.2 Retail IRB Approach6.7 Effects on RWA of Recognized Credit Derivative Contracts used as Recognized
Credit Risk Mitigation – for IRB approach 6.8 RWA flow Statements of Credit Risk Exposures under IRB Approach6.9 Specialized Lending Under Supervisory Slotting Criteria Approach –
for IRB approach
7 COUNTERPARTY CREDIT RISK (“CCR”) ............................................................................... 247.1 Analysis of Counterparty Default Risk Exposures (Other than those to CCPs)
by Approaches7.2 CVA Capital Charge7.3 Counterparty Default Risk Exposures (Other than those to CCPs) by Assets
Classes and by Risk Weights – for STC approach7.4 Counterparty Default Risk Exposures (Other than those to CCPs) by portfolio
and PD range – for IRB approach7.4.1 Foundation IRB Approach7.5 Composition of Collateral for Counterparty Default Risk Exposures (including
those for Contracts of Transactions Cleared through CCPs)
DBS BANK (HONG KONG) LIMITED AND ITS SUBSIDIARIES
REGULATORY DISCLOSURES
Pages
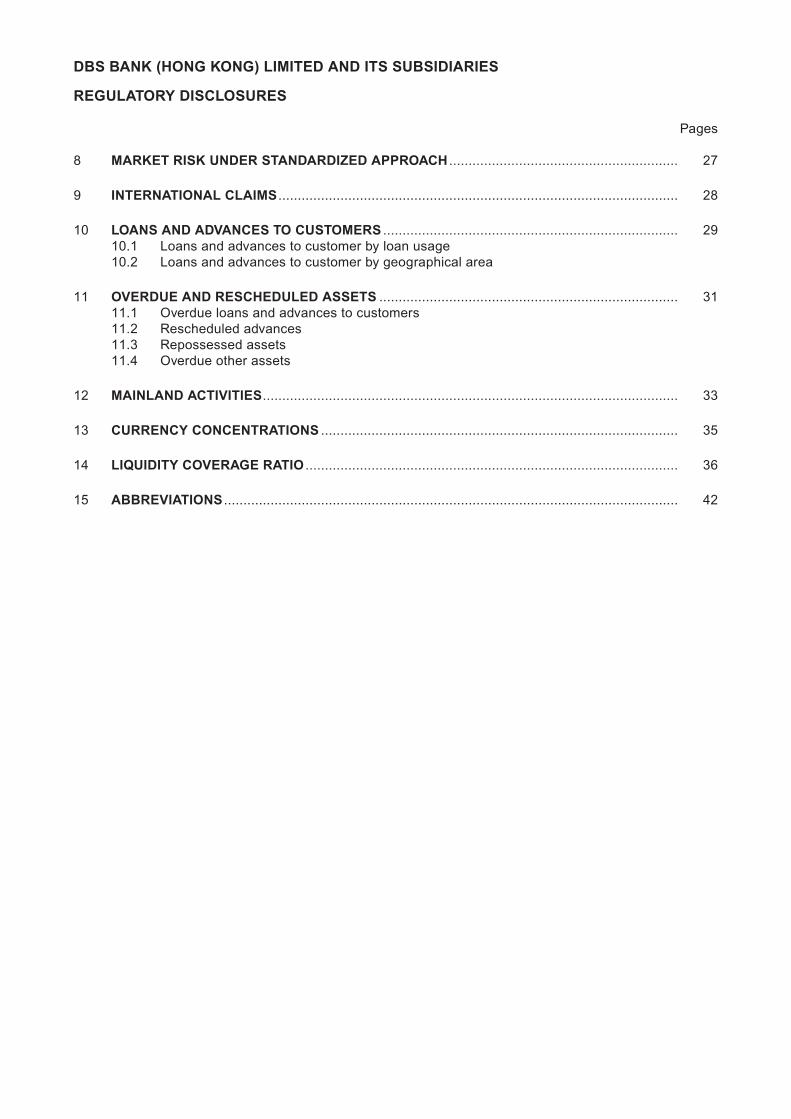
8 MARKET RISK UNDER STANDARDIZED APPROACH ........................................................... 27
9 INTERNATIONAL CLAIMS ....................................................................................................... 28
10 LOANS AND ADVANCES TO CUSTOMERS ............................................................................ 2910.1 Loans and advances to customer by loan usage10.2 Loans and advances to customer by geographical area
11 OVERDUE AND RESCHEDULED ASSETS ............................................................................. 3111.1 Overdue loans and advances to customers11.2 Rescheduled advances11.3 Repossessed assets11.4 Overdue other assets
12 MAINLAND ACTIVITIES ........................................................................................................... 33
13 CURRENCY CONCENTRATIONS ............................................................................................ 35
14 LIQUIDITY COVERAGE RATIO ................................................................................................ 36
15 ABBREVIATIONS ..................................................................................................................... 42

DBS BANK (HONG KONG) LIMITED AND ITS SUBSIDIARIES
REGULATORY DISCLOSURES
– 1 –
1 INTRODUCTION
The information contained in this document is for DBS Bank (Hong Kong) Limited (“the Bank”) and its subsidiaries (together “the Group”) and is prepared in accordance with the Banking (Disclosure) Rules and disclosure templates issued by the Hong Kong Monetary Authority (“HKMA”).
Basis of preparationFor regulatory reporting purposes, the Bank is required to compute its capital adequacy ratios and leverage ratio on a combined basis that includes the Bank and its overseas branch. The other financial information contained in this document is prepared based on consolidation basis that also includes its subsidiaries.
For the purposes of calculating the risk-weighted assets (“RWA”), the Bank uses the Internal Ratings-Based (“IRB”) approach for the calculation of the RWA for the majority of its credit risk exposures and the Standardized approach for those exempted from the IRB approach. The Bank uses the Standardized approaches for the calculation of RWA for market risk and operational risk.
The numbers in this document are expressed in millions of Hong Kong dollars, unless otherwise stated.
2 CAPITAL ADEQUACY 2.1 Capital Adequacy Ratios
The capital adequacy ratios were compiled in accordance with the Banking (Capital) Rules issued by the HKMA.
In HK$ million
As at30 June
2017
As at31 March
2017
As at31 December
2016
CapitalCommon Equity Tier 1 33,395 32,830 31,871Tier 1 34,717 34,142 33,094Total 39,104 38,487 37,353
Total RWA 198,197 198,787 204,232
Capital Adequacy RatiosCommon Equity Tier 1 16.8% 16.5% 15.6%Tier 1 17.5% 17.2% 16.2%Total 19.7% 19.4% 18.3%
2.2 Capital Conservation Buffer Ratio
The capital conservation buffer ratio for calculating the Banks buffer level is 1.25% for 2017 (0.625% for 2016) in accordance with section 3M of the Banking (Capital) Rules.
2.3 Countercyclical Capital Buffer Ratio
The countercyclical capital buffer ratio was compiled in accordance with section 3O of the Banking (Capital) Rules.
As at30 June
2017
As at31 December
2016
Countercyclical capital buffer ratio 1.2% 0.6%

DBS BANK (HONG KONG) LIMITED AND ITS SUBSIDIARIES
REGULATORY DISCLOSURES
– 2 –
2 CAPITAL ADEQUACY (continued)
2.4 Geographical Distribution of RWA related to Credit Exposures used in the Countercyclical Capital Buffer Ratio
The table below sets out the geographical breakdown of the RWA of private sector credit exposures relevant for the computation of the countercyclical capital buffer.
Geographical breakdown of risk-weighted amounts in relation to private sector credit exposures
As at 30 June 2017
Jurisdiction
Applicable JCCyB ratio in
effect %
Total RWA used incomputation of
CCyB ratioHK$’M
CCyB ratio
%
CCyB amountHK$’M
1 Hong Kong 1.25% 127,131
2 Mainland China 0% 6,921
3 Australia 0% 8
4 Bangladesh 0% 5
5 Brazil 0% 48
6 Cambodia 0% 43
7 Canada 0% 1
8 Chinese Taipei 0% 526
9 Czech Republic 0% 9
10 Germany 0% 121
11 India 0% 23
12 Japan 0% 5
13 Macau 0% 1,389
14 Malaysia 0% 14
15 Papua New Guinea 0% 6
16 Paraguay 0% 1
17 Philippines 0% 86
18 Russia 0% 13
19 Singapore 0% 1,578
20 South Africa 0% 62
21 Spain 0% 45
22 United States 0% 75
Total 138,110 1.2% 1,589

DBS BANK (HONG KONG) LIMITED AND ITS SUBSIDIARIES
REGULATORY DISCLOSURES
– 3 –
3 COMPOSITION OF CAPITAL
3.1 Financial Statements and Regulatory Scope of Consolidation
For regulatory reporting purposes, the Bank is required to compute its capital adequacy ratios and leverage ratio on a combined basis that includes the Bank and its overseas branch, while the preparation of its financial statements are based on consolidation basis that also includes its subsidiaries.
The following entities are within the Groups accounting scope of consolidation but are excluded from its regulatory scope of consolidation.
Name of entity Principal activities Total Assets In
HK$ million Total Equity In
HK$ million
Dao Heng Finance Limited Inactive 59 59
Hang Lung Bank (Nominee) Limited Provision of nominee services – –
DBS Kwong On (Nominees) Limited Provision of nominee services – –
Overseas Trust Bank Nominees Limited Provision of nominee services – –
Ting Hong Nominees Limited Provision of nominee, trustee and agency services – –
DBS Trustee (Hong Kong) Limited Inactive 5 5
DBS Trustee H.K. (New Zealand) Limited Provision of trustee and trust administration services 1 1
DBS COMPASS Limited Inactive 8 8

DBS BANK (HONG KONG) LIMITED AND ITS SUBSIDIARIES
REGULATORY DISCLOSURES
– 4 –
3 COMPOSITION OF CAPITAL (continued)
3.2 Capital Adequacy and Reconciliation of Regulatory Capital to the Balance Sheet
Table 1 : Reconciliation of Regulatory Scope Consolidated Balance Sheet to Capital Components
In HK$ million
Balance sheet as per
published financial
statements
Under regulatory
scope of consolidation
Cross reference to
Table 2
As at 30 June 2017
As at 30 June 2017
AssetsCash and balances with central banks 1,135 1,135Government securities and treasury bills 33,274 33,274Due from banks 156,307 156,307Derivatives 1,051 1,051Bank and corporate securities 11,215 11,215Loans and advances to customers 142,593 142,593
of which: Collective impairment allowances eligible for inclusion in Tier 2 capital
(155) (1)
Excess of total expected loss amount over total eligible provision under the IRB approach
782 (2)
Other assets 4,809 4,809of which: Deferred tax assets 40 (3)
Subsidiaries 56Properties and other fixed assets 2,126 2,126Goodwill and intangible 172 –
Total assets 352,682 352,566
LiabilitiesDue to banks 11,426 11,426Deposits and balances from customers 271,665 271,682Derivatives 826 826Certificates of deposit issued 2,325 2,325Other liabilities 25,549 25,549Amount due to subsidiaries – 67Subordinated liability 4,215 4,215 (4)
Total liabilities 316,006 316,090
EquityOrdinary shares 7,595 (5)Preference shares 1,400 (6)
Share capital 8,995 8,995Retained earnings 25,220 (7)Other reserves 2,261 (8)
Reserves 27,681 27,481of which: Retained earnings earmarked as regulatory reserve 995 (9) which includes regulatory reserve eligible for inclusion
in Tier 286 (10)
of which: Fair value gains on revaluation of land and buildings 20 (11)
Total equity 36,676 36,476
Total liabilities and equity 352,682 352,566
DBS BANK (HONG KONG) LIMITED AND ITS SUBSIDIARIES
REGULATORY DISCLOSURES
– 5 –
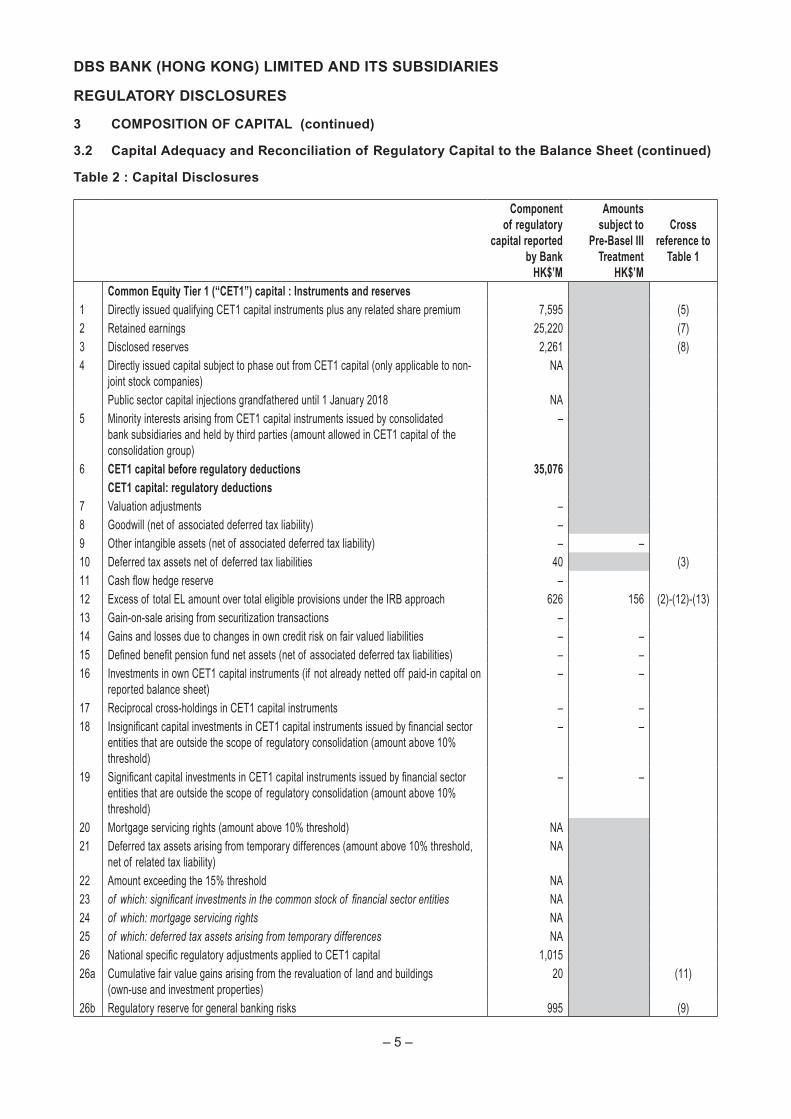
3 COMPOSITION OF CAPITAL (continued)
3.2 Capital Adequacy and Reconciliation of Regulatory Capital to the Balance Sheet (continued)
Table 2 : Capital Disclosures
Component of regulatory
capital reported by Bank
HK$’M
Amounts subject to
Pre-Basel III Treatment
HK$’M
Cross reference to
Table 1
Common Equity Tier 1 (“CET1”) capital : Instruments and reserves1 Directly issued qualifying CET1 capital instruments plus any related share premium 7,595 (5)2 Retained earnings 25,220 (7)3 Disclosed reserves 2,261 (8)4 Directly issued capital subject to phase out from CET1 capital (only applicable to non-
joint stock companies)NA
Public sector capital injections grandfathered until 1 January 2018 NA5 Minority interests arising from CET1 capital instruments issued by consolidated
bank subsidiaries and held by third parties (amount allowed in CET1 capital of the consolidation group)
–
6 CET1 capital before regulatory deductions 35,076CET1 capital: regulatory deductions
7 Valuation adjustments –8 Goodwill (net of associated deferred tax liability) –9 Other intangible assets (net of associated deferred tax liability) – –10 Deferred tax assets net of deferred tax liabilities 40 (3)11 Cash flow hedge reserve –12 Excess of total EL amount over total eligible provisions under the IRB approach 626 156 (2)-(12)-(13)13 Gain-on-sale arising from securitization transactions –14 Gains and losses due to changes in own credit risk on fair valued liabilities – –15 Defined benefit pension fund net assets (net of associated deferred tax liabilities) – –16 Investments in own CET1 capital instruments (if not already netted off paid-in capital on
reported balance sheet)– –
17 Reciprocal cross-holdings in CET1 capital instruments – –18 Insignificant capital investments in CET1 capital instruments issued by financial sector
entities that are outside the scope of regulatory consolidation (amount above 10% threshold)
– –
19 Significant capital investments in CET1 capital instruments issued by financial sector entities that are outside the scope of regulatory consolidation (amount above 10% threshold)
– –
20 Mortgage servicing rights (amount above 10% threshold) NA21 Deferred tax assets arising from temporary differences (amount above 10% threshold,
net of related tax liability)NA
22 Amount exceeding the 15% threshold NA23 of which: significant investments in the common stock of financial sector entities NA24 of which: mortgage servicing rights NA25 of which: deferred tax assets arising from temporary differences NA26 National specific regulatory adjustments applied to CET1 capital 1,01526a Cumulative fair value gains arising from the revaluation of land and buildings
(own-use and investment properties)20 (11)
26b Regulatory reserve for general banking risks 995 (9)

DBS BANK (HONG KONG) LIMITED AND ITS SUBSIDIARIES
REGULATORY DISCLOSURES
– 6 –
3 COMPOSITION OF CAPITAL (continued)
3.2 Capital Adequacy and Reconciliation of Regulatory Capital to the Balance Sheet (continued)
Table 2 : Capital Disclosures (continued)
Component of regulatory
capital reported by Bank
HK$’M
Amounts subject to
Pre-Basel III Treatment
HK$’M
Cross reference to
Table 1
27 Regulatory deductions applied to CET1 capital due to insufficient AT1 capital and Tier 2 capital to cover deductions
–
28 Total regulatory deductions to CET1 capital 1,68129 CET1 capital 33,395
Additional Tier 1 ("AT1") capital: instruments30 Qualifying AT1 capital instruments plus any related share premium 1,40031 of which: classified as equity under applicable accounting standards 1,400 (6)32 of which: classified as liabilities under applicable accounting standards –33 Capital instruments subject to phase out arrangements from AT1 capital –34 AT1 capital instruments issued by consolidated bank subsidiaries and held by third
parties (amount allowed in AT1 capital of the consolidation group)–
35 of which: AT1 capital instruments issued by subsidiaries subject to phase out arrangements
–
36 AT1 capital before regulatory deductions 1,400AT1 capital: regulatory deductions
37 Investments in own AT1 capital instruments – –38 Reciprocal cross-holdings in AT1 capital instruments – –39 Insignificant capital investments in AT1 capital instruments issued by financial sector
entities that are outside the scope of regulatory consolidation (amount above 10% threshold)
– –
40 Significant capital investments in AT1 capital instruments issued by financial sector entities that are outside the scope of regulatory consolidation
– –
41 National specific regulatory adjustments applied to AT1 capital 7841a Portion of deductions applied 50:50 to core capital and supplementary capital based
on pre-Basel III treatment which, during transitional period, remain subject to deduction from Tier 1 capital
78
i of which: Excess of total EL amount over total eligible provisions under the IRB approach
78 (12)
42 Regulatory deductions applied to AT1 capital due to insufficient Tier 2 capital to cover deductions
–
43 Total regulatory deductions to AT1 capital 7844 AT1 capital 1,32245 Tier 1 capital (Tier 1 = CET1 + AT1) 34,717
Tier 2 capital: instruments and provisions46 Qualifying Tier 2 capital instruments plus any related share premium 4,215 (4)47 Capital instruments subject to phase out arrangements from Tier 2 capital –48 Tier 2 capital instruments issued by consolidated bank subsidiaries and held by third
parties (amount allowed in Tier 2 capital of the consolidation group)–
49 of which: capital instruments issued by subsidiaries subject to phase out arrangements –50 Collective impairment allowances and regulatory reserve for general banking risks
eligible for inclusion in Tier 2 capital241 (10)-(1)

DBS BANK (HONG KONG) LIMITED AND ITS SUBSIDIARIES
REGULATORY DISCLOSURES
– 7 –
3 COMPOSITION OF CAPITAL (continued)
3.2 Capital Adequacy and Reconciliation of Regulatory Capital to the Balance Sheet (continued)
Table 2 : Capital Disclosures (continued)
Component of regulatory
capital reported by Bank
HK$’M
Amounts subject to
Pre-Basel III Treatment
HK$’M
Cross reference to
Table 1
51 Tier 2 capital before regulatory deductions 4,456Tier 2 capital: regulatory deductions
52 Investments in own Tier 2 capital instruments – –53 Reciprocal cross-holdings in Tier 2 capital instruments – –54 Insignificant capital investments in Tier 2 capital instruments issued by financial sector
entities that are outside the scope of regulatory consolidation (amount above 10% threshold)
– –
55 Significant capital investments in Tier 2 capital instruments issued by financial sector entities that are outside the scope of regulatory consolidation
– –
56 National specific regulatory adjustments applied to Tier 2 capital 6956a Add back of cumulative fair value gains arising from the revaluation of land and
buildings (own-use and investment properties) eligible for inclusion in Tier 2 capital(9) (11)*45%
56b Portion of deductions applied 50:50 to core capital and supplementary capital based on pre-Basel III treatment which, during transitional period, remain subject to deduction from Tier 2 capital
78
i of which: Excess of total EL amount over total eligible provisions under the IRB approach
78 (13)
57 Total regulatory deductions to Tier 2 capital 6958 Tier 2 capital 4,38759 Total capital (Total capital = Tier 1 + Tier 2) 39,10459a Deduction items under Basel III which during transitional period remain subject to
risk-weighting, based on pre-Basel III treatment–
i of which: Mortgage servicing rights –ii of which: Defined benefit pension fund net assets –iii of which: Investments in own CET1 capital instruments, AT1 capital instruments and
Tier 2 capital instruments –
iv of which: Capital investment in a connected company which is a commercial entity –v of which: Insignificant capital investments in CET1 capital instruments, AT1 capital
instruments and Tier 2 capital instruments issued by financial sector entities that are outside the scope of regulatory consolidation
–
vi of which: Significant capital investments in CET1 capital instruments, AT1 capital instruments and Tier 2 capital instruments issued by financial sector entities that are outside the scope of regulatory consolidation
–
60 Total risk weighted assets 198,197Capital ratios (as a percentage of risk weighted assets)
61 CET1 capital ratio 16.8%62 Tier 1 capital ratio 17.5%63 Total capital ratio 19.7%64 Institution specific buffer requirement (minimum CET1 capital requirement as specified
in s.3A, or s.3B, as the case requires, of the BCR plus capital conservation buffer plus countercyclical buffer requirements plus G-SIB or D-SIB requirements)
6.9%

DBS BANK (HONG KONG) LIMITED AND ITS SUBSIDIARIES
REGULATORY DISCLOSURES
– 8 –
3 COMPOSITION OF CAPITAL (continued)
3.2 Capital Adequacy and Reconciliation of Regulatory Capital to the Balance Sheet (continued)
Table 2 : Capital Disclosures (continued)
Component of regulatory
capital reported by Bank
HK$’M
Amounts subject to
Pre-Basel III Treatment
HK$’M
Cross reference to
Table 1
65 of which: capital conservation buffer requirement 1.3%66 of which: bank specific countercyclical buffer requirement 1.2%67 of which: G-SIB or D-SIB buffer requirement 0.0%68 CET1 capital surplus over the minimum CET1 requirement and any CET1 capital
used to meet the Tier 1 and Total capital requirement under s.3A, or s.3B, as the case requires, of the BCR
11.5%
National minima (if different from Basel 3 minimum)69 National CET1 minimum ratio NA70 National Tier 1 minimum ratio NA71 National Total capital minimum ratio NA
Amounts below the thresholds for deduction (before risk weighting)72 Insignificant capital investments in CET1 capital instruments, AT1 capital instruments
and Tier 2 capital instruments issued by financial sector entities that are outside the scope of regulatory consolidation
1,540
73 Significant capital investments in CET1 capital instruments issued by financial sector entities that are outside the scope of regulatory consolidation
45
74 Mortgage servicing rights (net of related tax liability) NA75 Deferred tax assets arising from temporary differences (net of related tax liability) NA
Applicable caps on the inclusion of provisions in Tier 2 capital76 Provisions eligible for inclusion in Tier 2 in respect of exposures subject to the basic
approach and the standardized (credit risk) approach (prior to application of cap)293
77 Cap on inclusion of provisions in Tier 2 under the basic approach and the standardized (credit risk) approach
241
78 Provisions eligible for inclusion in Tier 2 in respect of exposures subject to the IRB approach (prior to application of cap)
–
79 Cap for inclusion of provisions in Tier 2 under the IRB approach 978Capital instruments subject to phase-out arrangements
80 Current cap on CET1 capital instruments subject to phase out arrangements NA81 Amount excluded from CET1 due to cap (excess over cap after redemptions and
maturities)NA
82 Current cap on AT1 capital instruments subject to phase out arrangements –83 Amount excluded from AT1 capital due to cap (excess over cap after redemptions
and maturities)–
84 Current cap on Tier 2 capital instruments subject to phase out arrangements –85 Amount excluded from Tier 2 capital due to cap (excess over cap after redemptions
and maturities)–
NA: not applicable

DBS BANK (HONG KONG) LIMITED AND ITS SUBSIDIARIES
REGULATORY DISCLOSURES
– 9 –
3 COMPOSITION OF CAPITAL (continued)
3.2 Capital Adequacy and Reconciliation of Regulatory Capital to the Balance Sheet (continued)
Note to the template
Row No.
Description Hong Kong basis Basel III basis
10
Deferred tax assets net of deferred tax liabilities HK$40m nil
Explanation
As set out in paragraphs 69 and 87 of the Basel III text issued by the Basel Committee (December 2010), deferred tax assets (“DTAs”) that rely on future profitability of the bank to be realised are to be deducted, whereas DTAs which relate to temporary differences may be given limited recognition of CET1 capital (and hence be excluded from deduction from CET1 capital up to the specified threshold). In Hong Kong, an AI is required to deduct all DTAs in full, irrespective of their origin, from CET1 capital. Therefore, the amount to be deducted as reported in row 10 may be greater than that required under Basel III.
The amount reported under the column “Basel III basis” in this box represents the amount reported in row 10 (i.e. the amount reported under the “Hong Kong basis”) adjusted by reducing the amount of DTAs to be deducted which relate to temporary differences to the extent not in excess of the 10% threshold set for DTAs arising from temporary differences and the aggregate 15% threshold set for Mortgage Servicing Rights (“MSRs”), DTAs arising from temporary differences and significant investments in CET1 capital instruments issued by financial sector entities (excluding those that are loans, facilities and other credit exposures to connected companies) under Basel III.

DBS BANK (HONG KONG) LIMITED AND ITS SUBSIDIARIES
REGULATORY DISCLOSURES
– 10 –
3 COMPOSITION OF CAPITAL (continued)
3.3 Main Features of Capital Instruments
CET 1 Capital Ordinary Shares
Additional Tier 1 Capital Preference Shares
Tier 2 Capital Subordinated Loan
1 Issuer DBS Bank (Hong Kong) Limited
DBS Bank (Hong Kong) Limited
DBS Bank (Hong Kong) Limited
2 Unique identifier (eg CUSIP, ISIN or Bloomberg identifier for private placement)
NA NA NA
3 Governing law(s) of the instrument Hong Kong law Hong Kong Law Hong Kong law
Regulatory treatment
4 Transitional Basel III rules Common Equity Tier 1 Additional Tier 1 Tier 2
5 Post-transitional Basel III rules Common Equity Tier 1 Additional Tier 1 Tier 2
6 Eligible at solo/ group/ group & solo Solo Solo Solo
7 Instrument type Ordinary Shares Preference Shares Subordinated loan
8 Amount recognised in regulatory capital (currency in mil, as of most recent reporting date)
HK$7,595 million HK$1,400 million HK$4,215 million
9 Par value of instrument NA HK$1,400 million US$540 million
10 Accounting classification Shareholders equity Shareholders equity Liability – amortised cost
11 Original date of issuance Since incorporation 13 October 2016 12 December 2012
12 Perpetual or dated Perpetual Perpetual Dated
13 Original maturity date No maturity No maturity 12 December 2022
14 Issuer call subject to prior supervisory approval
No Yes Yes
15 Optional call date, contingent call dates and redemption amount
NA First optional call date: 13 October 2021
Contingent call dates: Change of Qualification Event, or Tax event
Redemption amount: Liquidation Preference together with, subject to certain limitations and qualifications, accrued but unpaid Dividends
First optional call date: 13 December 2017
Contingent call dates: Change of Qualification Event
Redemption amount: Principal amount together with accrued and unpaid interest
16 Subsequent call dates, if applicable NA Optional call dates – any date after 13 October 2021
Optional call dates – any Interest Payment Date after 13 December 2017
Coupons / dividends
17 Fixed or floating dividend/coupon Discretionary dividend amount
Fixed Floating
18 Coupon rate and any related index The Ordinary Shares receive distributable profits that have been declared as dividend
3.9% per annum USD 3-month LIBOR plus 2.5% per annum

DBS BANK (HONG KONG) LIMITED AND ITS SUBSIDIARIES
REGULATORY DISCLOSURES
– 11 –
3 COMPOSITION OF CAPITAL (continued)
3.3 Main Features of Capital Instruments (continued)
CET 1 Capital Ordinary Shares
Additional Tier 1 Capital Preference Shares
Tier 2 Capital Subordinated Loan
19 Existence of a dividend stopper NA No No
20 Fully discretionary, partially discretionary or mandatory
Fully discretionary Fully discretionary Mandatory
21 Existence of step up or other incentive to redeem
No No No
22 Cumulative or non-cumulative Non-cumulative Non-cumulative Non-cumulative
23 Convertible or non-convertible Non-convertible Convertible Convertible
24 If convertible, conversion trigger(s) NA The Preference shares would be converted into ordinary shares of the Bank upon the occurrence of the trigger event.
Trigger event is the earlier of:
(i) The HKMA notifying the Bank in writing that it is of the opinion that a conversion is necessary, without which the Bank would become non-viable, or
(ii) The HKMA notifying the Bank in writing that a decision has been made by the government body, a government officer or other relevant regulatory body with the authority to make such a decision, that a public sector injection of capital or equivalent support is necessary, without which the Bank would become non-viable.
The Subordinated Loan would be converted into ordinary shares of the Bank upon the occurrence of the trigger event.
Trigger event is the earlier of :
(i) The HKMA notifying the Bank in writing that it is of the opinion that a conversion is necessary, without which the Bank would become non-viable, or
(ii) The HKMA notifying the Bank in writing that a decision has been made by the government body, a government officer or other relevant regulatory body with the authority to make such a decision, that a public sector injection of capital or equivalent support is necessary, without which the Bank would become non-viable.
25 If convertible, fully or partially NA Fully or partially Fully
26 If convertible, conversion rate NA Conversion price is the net tangible assets per ordinary share at the latest month end prior to conversion, floored at HK$1 per ordinary share
Conversion price is the net tangible assets per ordinary share at the latest month end prior to conversion, floored at HK$1 per ordinary share
27 If convertible, mandatory or optional conversion
NA Mandatory Mandatory
28 If convertible, specify instrument type convertible into
NA Common Equity Tier 1 Common Equity Tier 1

DBS BANK (HONG KONG) LIMITED AND ITS SUBSIDIARIES
REGULATORY DISCLOSURES
– 12 –
3 COMPOSITION OF CAPITAL (continued)
3.3 Main Features of Capital Instruments (continued)
CET 1 Capital Ordinary Shares
Additional Tier 1 Capital Preference Shares
Tier 2 Capital Subordinated Loan
29 If convertible, specify issuer of instrument it converts into
NA DBS Bank (Hong Kong) Limited
DBS Bank (Hong Kong) Limited
30 Write-down feature No No No
31 If write-down, write-down trigger(s) NA NA NA
32 If write-down, full or partial NA NA NA
33 If write-down, permanent or temporary
NA NA NA
34 If temporary write-down, description of write-up mechanism
NA NA NA
35 Position in subordination hierarchy in liquidation (specify instrument type immediately senior to instrument)
Immediately subordinated to Additional Tier 1 capital instruments
Immediately subordinated to Tier 2 capital instruments
Immediately subordinated to senior creditors
36 Non-compliant transitioned features No No No
37 If yes, specify non-compliant features
NA NA NA
Terms and conditions – Ordinary Shares
Terms and conditions – Preference Shares
Terms and conditions – Subordinated Loan
https://www.dbs.com/iwov-resources/pdf/hongkong/tnc-ordinary-shares.pdf
https://www.dbs.com/iwov-resources/pdf/hongkong/tnc-preference-shares.pdf
https://www.dbs.com/iwov-resources/pdf/hongkong/tnc-subordinated-loan.pdf
DBS BANK (HONG KONG) LIMITED AND ITS SUBSIDIARIES
REGULATORY DISCLOSURES
– 13 –
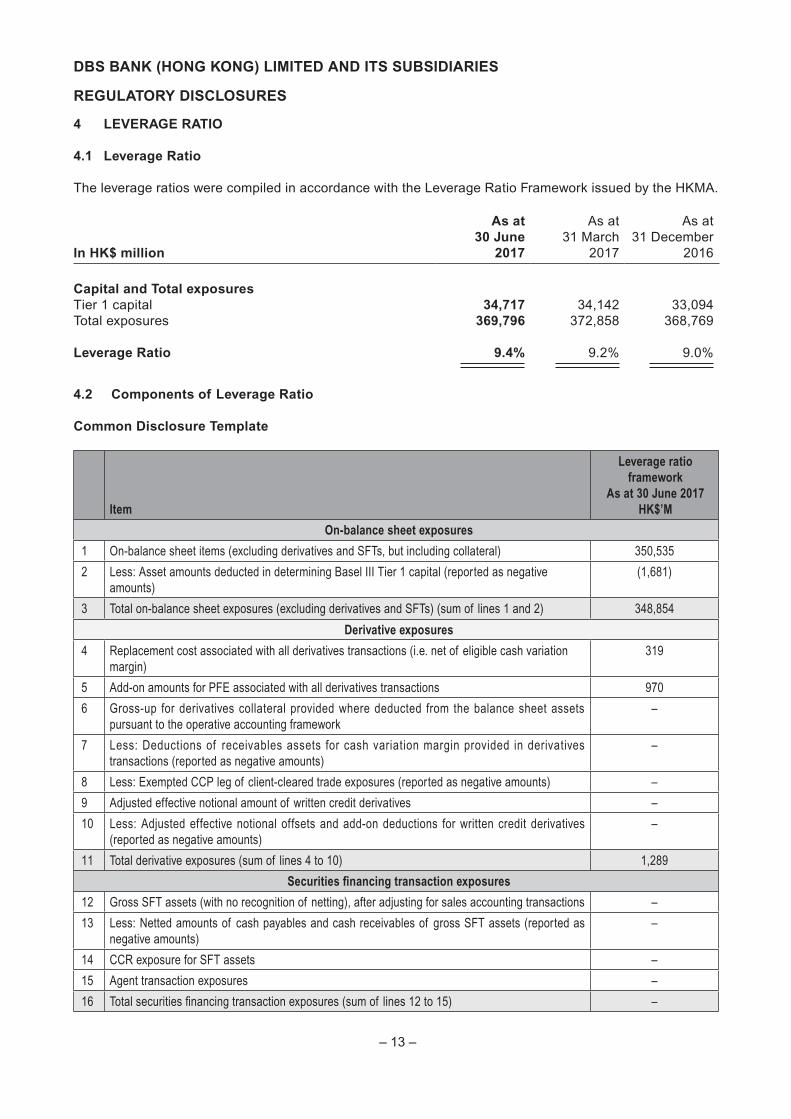
4 LEVERAGE RATIO
4.1 Leverage Ratio
The leverage ratios were compiled in accordance with the Leverage Ratio Framework issued by the HKMA.
In HK$ million
As at30 June
2017
As at31 March
2017
As at31 December
2016
Capital and Total exposuresTier 1 capital 34,717 34,142 33,094Total exposures 369,796 372,858 368,769
Leverage Ratio 9.4% 9.2% 9.0%
4.2 Components of Leverage Ratio
Common Disclosure Template
Item
Leverage ratio framework
As at 30 June 2017HK$’M
On-balance sheet exposures
1 On-balance sheet items (excluding derivatives and SFTs, but including collateral) 350,535
2 Less: Asset amounts deducted in determining Basel III Tier 1 capital (reported as negative amounts)
(1,681)
3 Total on-balance sheet exposures (excluding derivatives and SFTs) (sum of lines 1 and 2) 348,854
Derivative exposures
4 Replacement cost associated with all derivatives transactions (i.e. net of eligible cash variation margin)
319
5 Add-on amounts for PFE associated with all derivatives transactions 970
6 Gross-up for derivatives collateral provided where deducted from the balance sheet assets pursuant to the operative accounting framework
–
7 Less: Deductions of receivables assets for cash variation margin provided in derivatives transactions (reported as negative amounts)
–
8 Less: Exempted CCP leg of client-cleared trade exposures (reported as negative amounts) –
9 Adjusted effective notional amount of written credit derivatives –
10 Less: Adjusted effective notional offsets and add-on deductions for written credit derivatives (reported as negative amounts)
–
11 Total derivative exposures (sum of lines 4 to 10) 1,289
Securities financing transaction exposures
12 Gross SFT assets (with no recognition of netting), after adjusting for sales accounting transactions –
13 Less: Netted amounts of cash payables and cash receivables of gross SFT assets (reported as negative amounts)
–
14 CCR exposure for SFT assets –
15 Agent transaction exposures –
16 Total securities financing transaction exposures (sum of lines 12 to 15) –
DBS BANK (HONG KONG) LIMITED AND ITS SUBSIDIARIES
REGULATORY DISCLOSURES
– 14 –
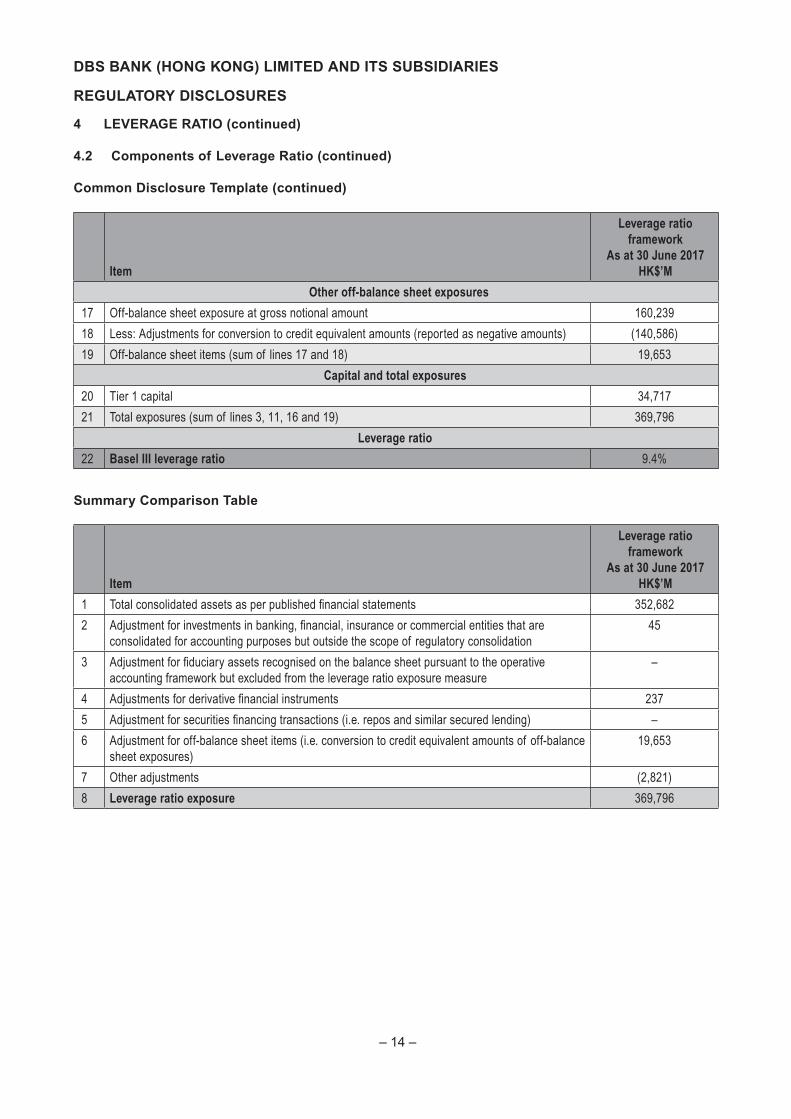
Item
Leverage ratio framework
As at 30 June 2017HK$’M
Other off-balance sheet exposures
17 Off-balance sheet exposure at gross notional amount 160,239
18 Less: Adjustments for conversion to credit equivalent amounts (reported as negative amounts) (140,586)
19 Off-balance sheet items (sum of lines 17 and 18) 19,653
Capital and total exposures
20 Tier 1 capital 34,717
21 Total exposures (sum of lines 3, 11, 16 and 19) 369,796
Leverage ratio
22 Basel III leverage ratio 9.4%
Summary Comparison Table
Item
Leverage ratio framework
As at 30 June 2017HK$’M
1 Total consolidated assets as per published financial statements 352,682
2 Adjustment for investments in banking, financial, insurance or commercial entities that are consolidated for accounting purposes but outside the scope of regulatory consolidation
45
3 Adjustment for fiduciary assets recognised on the balance sheet pursuant to the operative accounting framework but excluded from the leverage ratio exposure measure
–
4 Adjustments for derivative financial instruments 237
5 Adjustment for securities financing transactions (i.e. repos and similar secured lending) –
6 Adjustment for off-balance sheet items (i.e. conversion to credit equivalent amounts of off-balance sheet exposures)
19,653
7 Other adjustments (2,821)
8 Leverage ratio exposure 369,796
4 LEVERAGE RATIO (continued)
4.2 Components of Leverage Ratio (continued)
Common Disclosure Template (continued)

DBS BANK (HONG KONG) LIMITED AND ITS SUBSIDIARIES
REGULATORY DISCLOSURES
– 15 –
5 OVERVIEW OF RISK-WEIGHTED ASSETS
The following table sets out the RWA by risk types and the corresponding minimum capital requirements (i.e. 8% of RWA), as required by the HKMA.
RWA In HK$ million
Minimum capital requirements In HK$ million
As at 30 June
2017
As at 31 March
2017
As at 30 June
2017
1 Credit risk for non-securitization exposures 181,587 181,594 14,527
2 Of which STC approach 19,011 18,039 1,521
3 Of which IRB approach 162,576 163,555 13,006
4 Counterparty credit risk 907 1,165 73
5a Of which CEM 579 793 46
16 Market risk 819 1,342 65
17 Of which STM approach 819 1,342 65
19 Operational risk 14,833 14,625 1,187
21 Of which STO approach 14,833 14,625 1,187
23 Amounts below the thresholds for deduction (subject to 250% RW) 114 114 9
24a Deduction to RWA 63 53 5
24b Of which portion of regulatory reserve for general banking risks and collective provisions which is not included in Tier 2 Capital 52 42 4
24c Of which portion of cumulative fair value gains arising from the revaluation of land and buildings which is not included in Tier 2 Capital 11 11 1
25 Total 198,197 198,787 15,856

DBS BANK (HONG KONG) LIMITED AND ITS SUBSIDIARIES
REGULATORY DISCLOSURES
– 16 –
6 CREDIT RISK
6.1 Credit Quality of Assets
As at 30 June 2017 Gross carrying amounts of
HK$ millionDefaulted
exposuresNon-defaulted
exposuresAllowances/
Impairments Net values
Loans 3,659 298,274 (1,939) 299,994Debt securities – 26,646 – 26,646Off-balance sheet exposures – 14,050 – 14,050
Total 3,659 338,970 (1,939) 340,690
A default is considered to have occurred with regard to a particular borrower when either or both of the following events have taken place:
a) Subjective default: Borrower is considered to be unlikely to pay its credit obligations in full, without DBS taking action such as realising security (if held).
b) Technical default: Borrower is more than 90 days past due on any credit obligation to DBS.
Loans included balances with banks, loans and advances to customers, balances with central banks, and related accrued interest receivables.
Debt securities included non-trading government securities and treasury bills, banks and corporate securities, and related accrued interest receivables.
Off-balance sheet exposures included direct credit substitutes, transaction-related contingencies, trade-related contingencies and irrecoverable loans commitment.

DBS BANK (HONG KONG) LIMITED AND ITS SUBSIDIARIES
REGULATORY DISCLOSURES
– 17 –
6 CREDIT RISK (continued)
6.2 Changes in Stock of Defaulted Loans and Debt Securities
HK$ million
As at 30 June
2017
As at 1 January 2017 4,048Loans and debt securities that have defaulted since the last reporting period 517Returned to non-defaulted status (5)Amounts written off (228)Other changes (note) (673)
As at 30 June 2017 3,659
Note: Other changes mainly related to settlement and repayments from customers.
6.3 Overview of Recognized Credit Risk Mitigation
As at 30 June 2017
HK$ million
Exposures unsecured:
carrying amount
Exposures to be secured
Exposures secured by recognized collateral
Exposures secured by recognized guarantees
Exposures secured
by recognized credit derivative
contracts
1 Loans 228,410 71,584 64,123 7,461 –
2 Debt securities 26,646 – – – –
3 Total 255,056 71,584 64,123 7,461 –
4 Of which defaulted 850 1,481 970 511 –
DBS BANK (HONG KONG) LIMITED AND ITS SUBSIDIARIES
REGULATORY DISCLOSURES
– 18 –
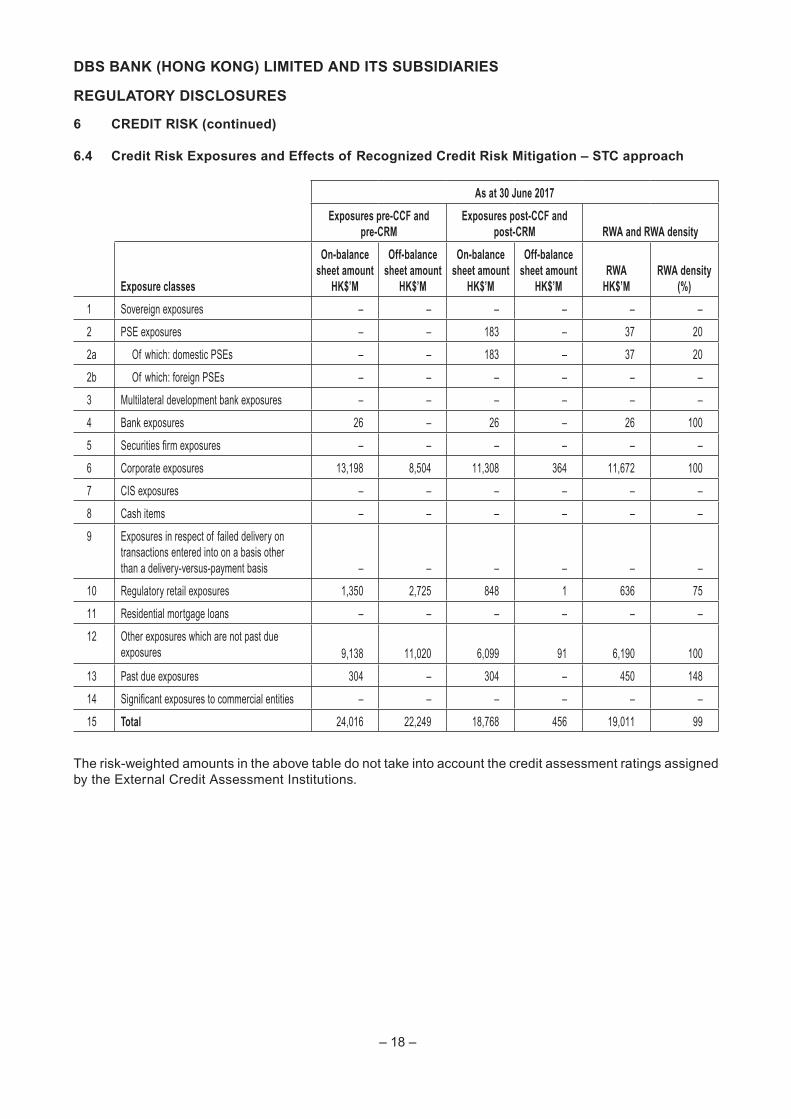
6 CREDIT RISK (continued)
6.4 Credit Risk Exposures and Effects of Recognized Credit Risk Mitigation – STC approach
As at 30 June 2017
Exposures pre-CCF and pre-CRM
Exposures post-CCF and post-CRM RWA and RWA density
Exposure classes
On-balance sheet amount
HK$’M
Off-balance sheet amount
HK$’M
On-balance sheet amount
HK$’M
Off-balance sheet amount
HK$’MRWA
HK$’MRWA density
(%)
1 Sovereign exposures – – – – – –
2 PSE exposures – – 183 – 37 20
2a Of which: domestic PSEs – – 183 – 37 20
2b Of which: foreign PSEs – – – – – –
3 Multilateral development bank exposures – – – – – –
4 Bank exposures 26 – 26 – 26 100
5 Securities firm exposures – – – – – –
6 Corporate exposures 13,198 8,504 11,308 364 11,672 100
7 CIS exposures – – – – – –
8 Cash items – – – – – –
9 Exposures in respect of failed delivery on transactions entered into on a basis other than a delivery-versus-payment basis – – – – – –
10 Regulatory retail exposures 1,350 2,725 848 1 636 75
11 Residential mortgage loans – – – – – –
12 Other exposures which are not past due exposures 9,138 11,020 6,099 91 6,190 100
13 Past due exposures 304 – 304 – 450 148
14 Significant exposures to commercial entities – – – – – –
15 Total 24,016 22,249 18,768 456 19,011 99
The risk-weighted amounts in the above table do not take into account the credit assessment ratings assigned by the External Credit Assessment Institutions.

DBS BANK (HONG KONG) LIMITED AND ITS SUBSIDIARIES
REGULATORY DISCLOSURES
– 19 –
6 CREDIT RISK (continued)
6.5 Credit Risk Exposures by Asset Classes and by Risk Weights – STC approach
As at 30 June 2017
Risk Weight
Exposure class0%
HK$’M10%
HK$’M20%
HK$’M35%
HK$’M50%
HK$’M75%
HK$’M100%
HK$’M150%
HK$’M250%
HK$’MOthersHK$’M
Total credit risk exposures
amount (post CCF and post CRM)
HK$’M
1 Sovereign exposures – – – – – – – – – – –
2 PSE exposures – – 183 – – – – – – – 183
2a Of which: domestic PSEs – – 183 – – – – – – – 183
2b Of which: foreign PSEs – – – – – – – – – – –
3 Multilateral development bank exposures – – – – – – – – – – –
4 Bank exposures – – – – – – 26 – – – 26
5 Securities firm exposures – – – – – – – – – – –
6 Corporate exposures – – – – – – 11,672 – – – 11,672
7 CIS exposures – – – – – – – – – – –
8 Cash items – – – – – – – – – – –
9 Exposures in respect of failed delivery on transactions entered into on a basis other than a delivery-versus-payment basis – – – – – – – – – – –
10 Regulatory retail exposures – – – – – 849 – – – – 849
11 Residential mortgage loans – – – – – – – – – – –
12 Other exposures which are not past due exposures – – – – – – 6,190 – – – 6,190
13 Past due exposures – – 2 – – – 6 296 – – 304
14 Significant exposures to commercial entities – – – – – – – – – – –
15 Total – – 185 – – 849 17,894 296 – – 19,224

DBS BANK (HONG KONG) LIMITED AND ITS SUBSIDIARIES
REGULATORY DISCLOSURES
– 20 –
6 CREDIT RISK (continued)
6.6 Credit Risk Exposures by Portfolio and PD ranges – for IRB approach
6.6.1 Foundation IRB Approach
As at 30 June 2017a b c d e f g h i j k l
PD scale (%)
Originalon-balance
sheet gross
exposureHK$’M
Off-balancesheet
exposures pre-CCF HK$’M
Average CCF (%)
EAD post CRM and post-CCF
HK$’M
Average PD (%)
Number of obligors
Average LGD (%)
Averagematurity (Years)
RWAHK$’M
RWA density
(%)EL
HK$’MProvisions
HK$’M
Sovereign exposures0.00 to <0.15 18,504 – – 20,414 0.01 14 45 2.5 2,462 12 620.15 to <0.25 – – – – – – – – – – –0.25 to <0.50 – – – – – – – – – – –0.50 to <0.75 – – – – – – – – – – –0.75 to <2.50 – – – – – – – – – – –2.50 to <10.00 – – – – – – – – – – –10.00 to <100.00 – – – – – – – – – – –100.00 (Default) – – – – – – – – – – –Sub-total 18,504 – – 20,414 0.01 14 45 2.5 2,462 12 62 24Bank exposures0.00 to <0.15 167,620 4,345 39 169,584 0.03 56 45 2.5 34,817 21 250.15 to <0.25 1,082 – – 1,082 0.22 17 45 2.5 666 61 10.25 to <0.50 1,384 353 1 1,416 0.33 21 44 2.5 1,031 73 20.50 to <0.75 195 270 – 195 0.56 6 45 2.5 180 92 10.75 to <2.50 526 276 – 526 1.75 23 45 2.5 694 132 42.50 to <10.00 10 75 – 10 2.60 6 29 2.5 8 81 –10.00 to <100.00 3 – – 3 12.15 1 45 2.5 7 207 –100.00 (Default) – – – – – – – – – – –Sub-total 170,820 5,319 32 172,816 0.04 130 45 2.5 37,403 22 33 358Corporate exposures – small-and-medium sized corporates0.00 to <0.15 – – – – – – – – – – –0.15 to <0.25 – – – – – – – – – – –0.25 to <0.50 – – – – – – – – – – –0.50 to <0.75 – 15 – – – 6 – – – – –0.75 to <2.50 97 93 – 85 1.69 31 37 2.5 60 70 –2.50 to <10.00 158 64 1 124 4.69 47 36 2.5 109 88 210.00 to <100.00 15 – – 15 12.15 4 37 2.5 19 131 1100.00 (Default) – – – – – – – – – – –Sub-total 270 172 1 224 4.03 88 36 2.5 188 84 3 2Corporate exposures – other0.00 to <0.15 722 2,766 27 1,455 0.05 10 45 2.5 273 19 –0.15 to <0.25 1,284 5,612 10 1,833 0.22 18 39 2.5 743 41 20.25 to <0.50 3,498 4,521 1 3,594 0.32 100 44 2.5 1,965 55 50.50 to <0.75 1,786 7,424 5 2,787 0.56 349 40 2.5 1,833 66 60.75 to <2.50 23,965 26,809 4 26,412 1.77 2,429 38 2.5 24,341 92 2772.50 to <10.00 28,337 14,805 3 25,706 4.84 2,564 37 2.5 30,670 119 48810.00 to <100.00 3,511 538 4 2,856 12.68 255 37 2.5 4,715 165 182100.00 (Default) 3,539 2 25 3,030 100.00 282 42 2.5 6,260 207 1,083Sub-total 66,642 62,477 5 67,673 7.59 6,007 38 2.5 70,800 105 2,043 2,012Total (all portfolios) 256,236 67,968 7 261,127 2.00 6,239 43 2.5 110,853 42 2,141 2,396

DBS BANK (HONG KONG) LIMITED AND ITS SUBSIDIARIES
REGULATORY DISCLOSURES
– 21 –
6 CREDIT RISK (continued)
6.6 Credit Risk Exposures by Portfolio and PD ranges – for IRB approach (continued)
6.6.2 Retail IRB Approach
As at 30 June 2017a b c d e f g h i j k l
PD scale (%)
Originalon-balance
sheet gross
exposureHK$’M
Off-balancesheet
exposures pre-CCF HK$’M
Average CCF (%)
EAD post CRM and post-CCF
HK$’M
Average PD (%)
Number of obligors
Average LGD (%)
Averagematurity (Years)
RWAHK$’M
RWA density
(%)EL
HK$’MProvisions
HK$’M
Residential mortgages exposures0.00 to <0.15 3,390 – – 3,390 0.12 674 13 556 16 10.15 to <0.25 16,169 – – 16,169 0.22 9,137 13 2,425 15 50.25 to <0.50 – – – – – – – – – –0.50 to <0.75 3,495 – – 3,495 0.63 1,056 13 524 15 30.75 to <2.50 15 – – 15 1.80 5 32 9 58 –2.50 to <10.00 384 – – 384 9.84 205 13 231 60 510.00 to <100.00 5 – – 5 33.97 7 13 4 77 –100.00 (Default) 12 – – 12 100.00 12 32 48 395 –Sub-total 23,470 – – 23,470 0.48 11,096 13 3,797 16 14 36Qualifying revolving retail exposures0.00 to <0.15 1,479 35,341 69 25,876 0.14 305,320 99 2,036 8 360.15 to <0.25 2,268 11,931 67 10,260 0.21 139,078 96 1,084 11 210.25 to <0.50 244 646 75 728 0.50 3,894 133 216 30 50.50 to <0.75 – – – – – – – – – –0.75 to <2.50 3,716 18,242 69 16,381 1.66 204,046 98 8,919 54 2642.50 to <10.00 591 669 94 1,219 4.62 12,646 104 1,424 117 5710.00 to <100.00 1,335 290 63 1,517 15.03 15,740 97 3,313 218 220100.00 (Default) 50 – – 50 100.00 1,804 107 355 704 26Sub-total 9,683 67,119 69 56,031 1.19 682,528 98 17,347 31 629 193Small business retail exposures0.00 to <0.15 – – – – – – – – – –0.15 to <0.25 – – – – – – – – – –0.25 to <0.50 6 – – 6 0.29 6 6 1 9 –0.50 to <0.75 – – – – – – – – – –0.75 to <2.50 – – – – – – – – – –2.50 to <10.00 – – – – – – – – – –10.00 to <100.00 – – – – – – – – – –100.00 (Default) – – – – – – – – – –Sub-total 6 – – 6 0.29 6 6 1 9 – –Other retail exposures to individuals0.00 to <0.15 – – – – – – – – – –0.15 to <0.25 – – – – – – – – – –0.25 to <0.50 4,588 – – 4,588 0.29 1,132 6 407 9 10.50 to <0.75 – – – – – – – – – –0.75 to <2.50 677 – – 677 1.46 5,108 72 615 91 82.50 to <10.00 1,248 – – 1,248 4.76 8,089 102 1,883 151 6010.00 to <100.00 2,903 – – 2,903 20.65 11,447 108 6,883 237 644100.00 (Default) 50 – – 50 100.00 303 108 386 766 24Sub-total 9,466 – – 9,466 7.74 26,079 56 10,174 107 737 122Total (all portfolios) 42,625 67,119 69 88,973 1.70 719,709 71 31,319 35 1,380 351

DBS BANK (HONG KONG) LIMITED AND ITS SUBSIDIARIES
REGULATORY DISCLOSURES
– 22 –
6 CREDIT RISK (continued)
6.7 Effects on RWA of Recognized Credit Derivative Contracts used as Recognized Credit Risk Mitigation – for IRB approach
As at 30 June 2017, the Bank does not have any exposures having credit derivatives as credit risk mitigation.
As at 30 June 2017
Pre-credit derivatives RWA
HK$’MActual RWA
HK$’M
1 Corporate – Specialized lending under supervisory slotting criteria approach (project finance) (“PF”) – –
2 Corporate – Specialized lending under supervisory slotting criteria approach (object finance) (“OF”) – –
3 Corporate – Specialized lending under supervisory slotting criteria approach (commodities finance) (“CF”) – –
4 Corporate – Specialized lending under supervisory slotting criteria approach (income-producing real estate) (“IPRE”) 7,327 7,327
5 Corporate – Specialized lending (high-volatility commercial real estate) (“HVCRE”) – –
6 Corporate – Small-and-medium sized corporates 188 188
7 Corporate – Other corporates 70,800 70,800
8 Sovereigns 2,271 2,271
9 Sovereign foreign public sector entities 53 53
10 Multilateral development banks 138 138
11 Bank exposures – Banks 36,860 36,860
12 Bank exposures – Securities firms 527 527
13 Bank exposures – Public sector entities (excluding sovereign foreign public sector entities) 16 16
14 Retail – Small business retail exposures 1 1
15 Retail – Residential mortgages to individuals 3,454 3,454
16 Retail – Residential mortgages to property-holding shell companies 343 343
17 Retail – Qualifying revolving retail exposures (QRRE) 17,347 17,347
18 Retail – Other retail exposures to individuals 10,174 10,174
19 Equity – Equity exposures under market-based approach (simple risk-weight method) – –
20 Equity – Equity exposures under market-based approach (internal models method) – –
21 Equity – Equity exposures under PD/LGD approach (publicly traded equity exposures held for long-term investment) – –
22 Equity – Equity exposures under PD/LGD approach (privately owned equity exposures held for long-term investment) – –
23 Equity – Equity exposures under PD/LGD approach (other publicly traded equity exposures) – –
24 Equity – Equity exposures under PD/LGD approach (other equity exposures) – –
25 Equity – Equity exposures associated with equity investments in funds (CIS exposures) – –
26 Other – Cash items – –
27 Other – Other items 3,875 3,875
28 Total (under the IRB calculation approaches) 153,374 153,374

DBS BANK (HONG KONG) LIMITED AND ITS SUBSIDIARIES
REGULATORY DISCLOSURES
– 23 –
6 CREDIT RISK (continued)
6.8 RWA Flow Statements of Credit Risk Exposures under IRB Approach
The following table sets out the key drivers of RWA movements over the quarter.
RWAHK$’M
As at 31 March 2017 163,555
Asset size (2,095)
Asset quality 974
Foreign exchange movements 142
As at 30 June 2017 162,576
RWA for credit exposures under IRB approach decreased mainly due to a decline in asset size, which was in turn driven by decline in balances with banks and debt securities.
6.9 Specialized Lending Under Supervisory Slotting Criteria Approach – for IRB approach
Specialized lending under supervisory slotting criteria approach – other than HVCRE
As at 30 June 2017
On-balance sheet exposure
amountHK$’M
Off-balance sheet exposure
amountHK$’M
SRW%
EAD amount
RWAHK$’M
Expected loss amountHK$’M
Supervisory Rating Grade
Remaining Maturity
PFHK$’M
OFHK$’M
CFHK$’M
IPREHK$’M
TotalHK$’M
Strong^ Less than 2.5 years 8 – 50 – – – 8 8 4 –
Strong Equal to or more than 2.5 years 258 560 70 – – – 670 670 469 3
Good^ Less than 2.5 years 2,243 829 70 – – – 2,865 2,865 2,005 12
Good Equal to or more than 2.5 years 3,372 1,180 90 – – – 3,908 3,908 3,517 31
Satisfactory 939 335 115 – – – 939 939 1,080 26
Weak 100 – 250 – – – 101 101 252 8
Default – – 0 – – – – – – –
Total 6,920 2,904 – – – 8,491 8,491 7,327 80
^ Use of preferential risk-weights.

DBS BANK (HONG KONG) LIMITED AND ITS SUBSIDIARIES
REGULATORY DISCLOSURES
– 24 –
7 COUNTERPARTY CREDIT RISK (“CCR”)
7.1 Analysis of Counterparty Default Risk Exposures (Other than those to CCPs) by Approaches
As at 30 June 2017
Replacement cost (RC)
HK$’MPFE
HK$’M
EffectiveEPE
HK$’M
Alpha (α) used for
computingdefault riskexposure
HK$’M
Default risk exposure after CRM
HK$’MRWA
HK$’M
1 CEM (for derivative contracts) 319 970 N/A 1,289 579
2 IMM (CCR) approach – – – –
3 Simple Approach (for SFTs) – –
4 Comprehensive Approach (for SFTs) – –
5 VaR (for SFTs) – –
6 Total 579
The current exposure method is used for calculating default risk exposures of derivative contracts.
7.2 CVA Capital Charge
As at 30 June 2017
EAD post CRMHK$’M
RWAHK$’M
Netting sets for which CVA capital charge is calculated by the advanced CVA method – –
1 (i) VaR (after application of multiplication factor if applicable) –
2 (ii) Stressed VaR (after application of multiplication factor if applicable) –
3 Netting sets for which CVA capital charge is calculated by the standardized CVA method 1,199 328
4 Total 1,199 328

DBS BANK (HONG KONG) LIMITED AND ITS SUBSIDIARIES
REGULATORY DISCLOSURES
– 25 –
7 COUNTERPARTY CREDIT RISK (“CCR”) (continued)
7.3 Counterparty Default Risk Exposures (Other than those to CCPs) by Asset Classes and by Risk Weights – for STC approach
As at 30 June 2017
Risk Weight
Exposure class0%
HK$’M10%
HK$’M20%
HK$’M35%
HK$’M50%
HK$’M75%
HK$’M100%
HK$’M150%
HK$’M250%
HK$’MOthersHK$’M
Total default risk exposure
after CRMHK$’M
1 Sovereign exposures – – – – – – – – – – –
2 PSE exposures – – – – – – – – – – –
2a Of which: domestic PSEs – – – – – – – – – – –
2b Of which: foreign PSEs – – – – – – – – – – –
3 Multilateral development bank exposures – – – – – – – – – – –
4 Bank exposures – – – – – – – – – – –
5 Securities firm exposures – – – – – – – – – – –
6 Corporate exposures – – – – – – – – – – –
7 CIS exposures – – – – – – – – – – –
8 Regulatory retail exposures – – – – – – – – – – –
9 Residential mortgage loans – – – – – – – – – – –
10 Other exposures which are not past due exposures – – – – – – 162 – – – 162
11 Significant exposures to commercial entities – – – – – – – – – – –
12 Total – – – – – – 162 – – – 162

DBS BANK (HONG KONG) LIMITED AND ITS SUBSIDIARIES
REGULATORY DISCLOSURES
– 26 –
7 COUNTERPARTY CREDIT RISK (“CCR”) (continued)
7.4 Counterparty Default Risk Exposures (Other than those to CCPs) by portfolio and PD range – for IRB approach
7.4.1 Foundation IRB Approach
The following table sets out the parameters used to calculate the Banks CCR capital requirements for IRB approach models. The Bank adopts IRB approach for all of its IRB exposures which are subject to CCR capital requirements.
As at 30 June 2017
a b c d e f g
PD scale (%)
EAD post- CRM
HK$’M
Average PD (%)
Number of obligors
Average LGD (%)
Averagematurity (Years)
RWAHK$’M
RWA density
(%)
Bank0.00 to <0.15 611 0.03 10 45 2.5 123 200.15 to <0.25 40 0.22 1 45 2.5 24 620.25 to <0.50 2 0.28 1 45 2.5 1 700.50 to <0.75 – – – – – – –0.75 to <2.50 – – – – – – –2.50 to <10.00 – – – – – – –10.00 to <100.00 – – – – – – –100.00 (Default) – – – – – – –Sub-total 653 0.04 12 45 2.5 148 23Corporate exposures – small-and-medium sized corporates0.00 to <0.15 – – – – – – –0.15 to <0.25 – – – – – – –0.25 to <0.50 – – – – – – –0.50 to <0.75 – – – – – – –0.75 to <2.50 – 1.29 1 45 2.5 – 812.50 to <10.00 – 6.52 3 38 2.5 – 10310.00 to <100.00 – – – – – – –100.00 (Default) – – – – – – –Sub-total – 3.53 4 42 2.5 – 90Corporate exposures – other0.00 to <0.15 – – – – – – –0.15 to <0.25 144 0.22 2 40 2.5 61 420.25 to <0.50 136 0.33 5 41 2.5 69 510.50 to <0.75 12 0.56 6 44 2.5 9 720.75 to <2.50 98 2.05 45 10 2.5 22 232.50 to <10.00 43 4.17 76 34 2.5 46 10510.00 to <100.00 2 12.15 8 38 2.5 3 176100.00 (Default) – – – – – – –Sub-total 435 1.11 142 33 2.5 210 48Total (all portfolios) 1,088 0.47 158 40 2.5 358 33

DBS BANK (HONG KONG) LIMITED AND ITS SUBSIDIARIES
REGULATORY DISCLOSURES
– 27 –
7 COUNTERPARTY CREDIT RISK (“CCR”) (continued)
7.5 Composition of Collateral for Counterparty Default Risk Exposures (including those for Contracts or Transactions Cleared through CCPs)
As at 30 June 2017
Derivative contracts SFTs
Fair value of recognized collateral received Fair value of posted collateral
Fair value of recognized collateral received HK$’M
Fair value of posted
collateral HK$’M
SegregatedHK$’M
UnsegregatedHK$’M
SegregatedHK$’M
UnsegregatedHK$’M
Cash – other currencies – 108 – 587 – –
There is no outstanding securities financing transaction which creates exposures to counterparty credit risk as at 30 June 2017.
8 MARKET RISK UNDER STANDARDIZED APPROACH
In HK$ millionAs at 30 June 2017
RWA(1)
Outright product exposures
1 Interest rate exposures (general and specific risk) 678
2 Equity exposures (general and specific risk) –
3 Foreign exchange (including gold) exposures 139
4 Commodity exposures –
Option exposures
5 Simplified approach –
6 Delta-plus approach 2
7 Other approach –
8 Securitization exposures –
9 Total 819
(1) The RWA is derived by multiplying the capital requirements by 12.5

DBS BANK (HONG KONG) LIMITED AND ITS SUBSIDIARIES
REGULATORY DISCLOSURES
– 28 –
9 INTERNATIONAL CLAIMS
Analysis of the Bank’s international claims by location and by type of counterparty is as follows:
Non-bank private sector
HK$ million BanksOfficial sector
Non-bank financial
institutionsNon-financial
private sector Total
As at 30 June 2017
Developed countries 13,807 6,676 5 2,251 22,739
Offshore centres, of which 145,683 25 225 28,986 174,919
– Singapore 145,471 4 – 1,189 146,664
– Hong Kong 196 21 225 24,452 24,894
– Others 16 – – 3,345 3,361
Developing Europe – – – 165 165
Developing Latin America and Caribbean 15 – – 453 468
Developing Africa and Middle East 31 – – 366 397
Developing Asia-Pacific 10,147 567 16 7,725 18,455
International organisations – 1,839 – – 1,839
169,683 9,107 246 39,946 218,982
As at 31 December 2016
Developed countries 11,412 4,850 60 2,492 18,814
Offshore centres, of which 148,578 27 230 30,829 179,664
– Singapore 148,379 7 7 2,330 150,723
– Hong Kong 183 20 223 25,091 25,517
– Others 16 – – 3,408 3,424
Developing Europe – – – 190 190
Developing Latin America and Caribbean 24 – – 484 508
Developing Africa and Middle East 7 – – 398 405
Developing Asia-Pacific 9,159 382 71 8,234 17,846
International organisations – 1,546 – – 1,546
169,180 6,805 361 42,627 218,973
The above analysis is disclosed on a net basis after taking into account the effect of any recognised risk transfer.

DBS BANK (HONG KONG) LIMITED AND ITS SUBSIDIARIES
REGULATORY DISCLOSURES
– 29 –
10 LOANS AND ADVANCES TO CUSTOMERS
The Group employs a range of policies and practices to mitigate credit risk, one of which is the taking of collateral. The collateral includes cash, marketable securities, properties, trade receivables, inventory, equipment and other physical and financial collateral.
10.1 Loans and advances to customers by loan usage
The analysis of the Bank’s gross advances to customers by loan usage and the corresponding balances covered by collateral are as follows:
As at 30 June 2017 As at 31 December 2016
HK$ millionOutstanding
balance
Balancecovered by
collateralOutstanding
balance
Balancecovered by
collateral
Gross loans and advances for use in Hong Kong Industrial, commercial and financial
– Property development 3,802 3,557 3,296 3,221– Property investment 20,311 19,953 21,827 21,001– Financial concerns 4,208 3,954 3,524 3,248– Stockbrokers 1,009 39 661 64– Wholesale and retail trade 13,312 10,444 15,179 11,533– Manufacturing 11,037 7,815 11,083 7,684– Transport and transport
equipment 10,436 9,761 10,598 9,850– Recreational activities 208 184 178 156– Information technology 676 134 538 146– Others 5,082 3,778 4,972 3,477
Individuals– Loans for the purchase of flats
in the Home Ownership Scheme, Private Sector Participation Scheme and Tenants Purchase Scheme or their respective successor schemes 191 191 220 220
– Loans for the purchase of other residential properties 21,141 21,141 21,828 21,828
– Credit card advances 7,926 – 8,516 –– Others 13,559 7,239 12,898 5,925
112,898 88,190 115,318 88,353Trade finance (including trade bills) 25,019 10,296 26,425 11,765Gross loans and advances for use outside Hong Kong 6,615 1,910 6,012 1,477
144,532 100,396 147,755 101,595
DBS BANK (HONG KONG) LIMITED AND ITS SUBSIDIARIES
REGULATORY DISCLOSURES
– 30 –
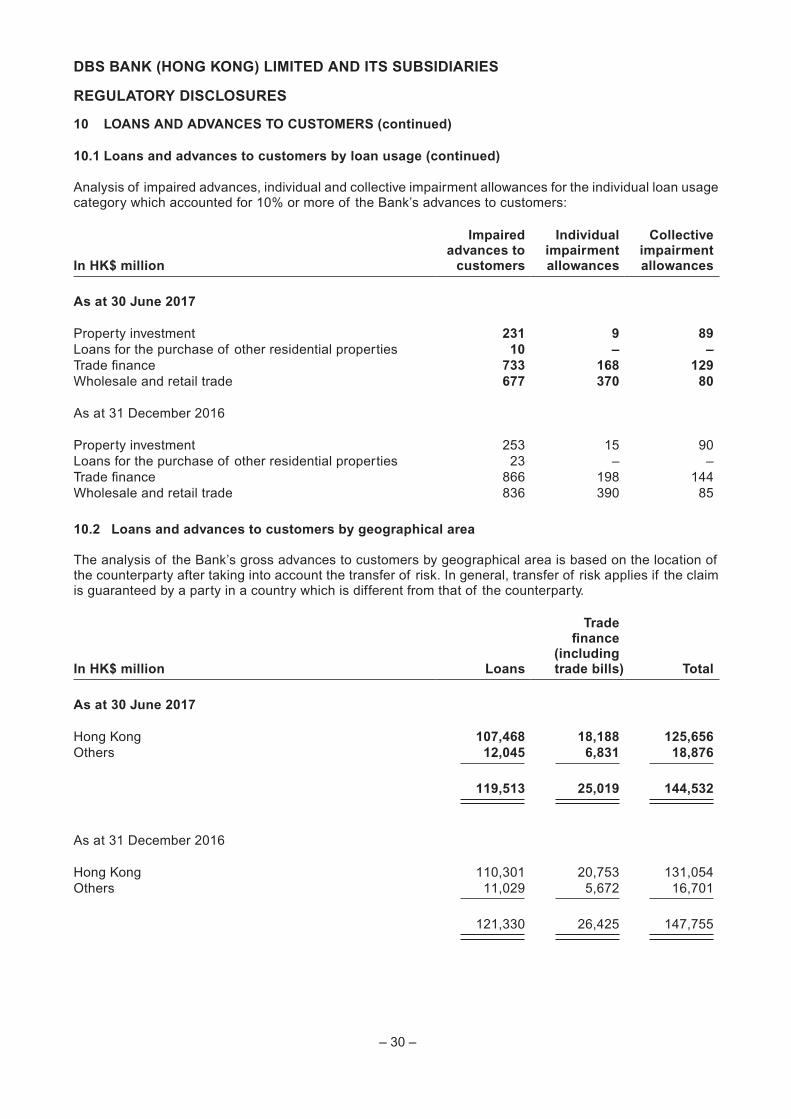
10 LOANS AND ADVANCES TO CUSTOMERS (continued)
10.1 Loans and advances to customers by loan usage (continued)
Analysis of impaired advances, individual and collective impairment allowances for the individual loan usage category which accounted for 10% or more of the Bank’s advances to customers:
In HK$ million
Impaired advances to
customers
Individual impairment allowances
Collective impairment allowances
As at 30 June 2017
Property investment 231 9 89Loans for the purchase of other residential properties 10 – –Trade finance 733 168 129Wholesale and retail trade 677 370 80
As at 31 December 2016
Property investment 253 15 90Loans for the purchase of other residential properties 23 – –Trade finance 866 198 144Wholesale and retail trade 836 390 85
10.2 Loans and advances to customers by geographical area
The analysis of the Bank’s gross advances to customers by geographical area is based on the location of the counterparty after taking into account the transfer of risk. In general, transfer of risk applies if the claim is guaranteed by a party in a country which is different from that of the counterparty.
In HK$ million Loans
Tradefinance
(including trade bills) Total
As at 30 June 2017
Hong Kong 107,468 18,188 125,656Others 12,045 6,831 18,876
119,513 25,019 144,532
As at 31 December 2016
Hong Kong 110,301 20,753 131,054Others 11,029 5,672 16,701
121,330 26,425 147,755
DBS BANK (HONG KONG) LIMITED AND ITS SUBSIDIARIES
REGULATORY DISCLOSURES
– 31 –
10 LOANS AND ADVANCES TO CUSTOMERS (continued)
10.2 Loans and advances to customers by geographical area (continued)
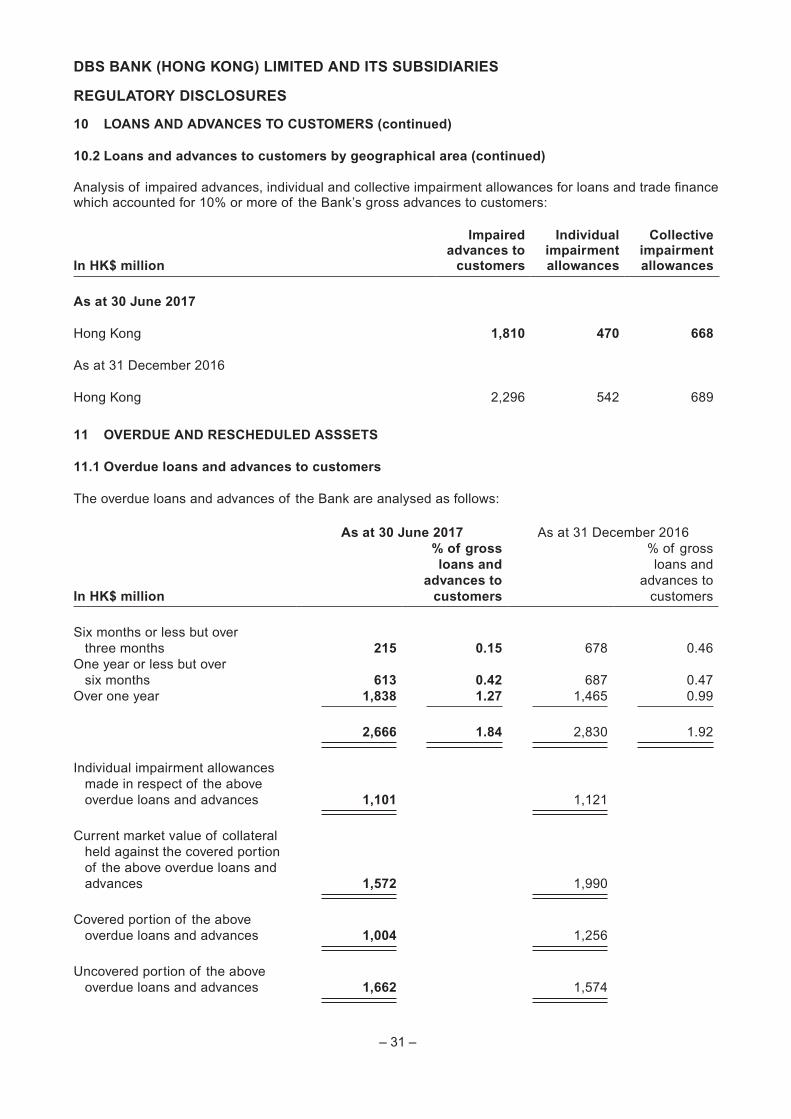
Analysis of impaired advances, individual and collective impairment allowances for loans and trade finance which accounted for 10% or more of the Bank’s gross advances to customers:
In HK$ million
Impaired advances to
customers
Individual impairment allowances
Collective impairment allowances
As at 30 June 2017
Hong Kong 1,810 470 668
As at 31 December 2016
Hong Kong 2,296 542 689
11 OVERDUE AND RESCHEDULED ASSSETS
11.1 Overdue loans and advances to customers
The overdue loans and advances of the Bank are analysed as follows:
As at 30 June 2017 As at 31 December 2016
In HK$ million
% of gross loans and
advances to customers
% of gross loans and
advances to customers
Six months or less but over three months 215 0.15 678 0.46
One year or less but over six months 613 0.42 687 0.47
Over one year 1,838 1.27 1,465 0.99
2,666 1.84 2,830 1.92
Individual impairment allowances made in respect of the above overdue loans and advances 1,101 1,121
Current market value of collateral held against the covered portion of the above overdue loans and advances 1,572 1,990
Covered portion of the above overdue loans and advances 1,004 1,256
Uncovered portion of the above overdue loans and advances 1,662 1,574
DBS BANK (HONG KONG) LIMITED AND ITS SUBSIDIARIES
REGULATORY DISCLOSURES
– 32 –
11 OVERDUE AND RESCHEDULED ASSSETS (continued)
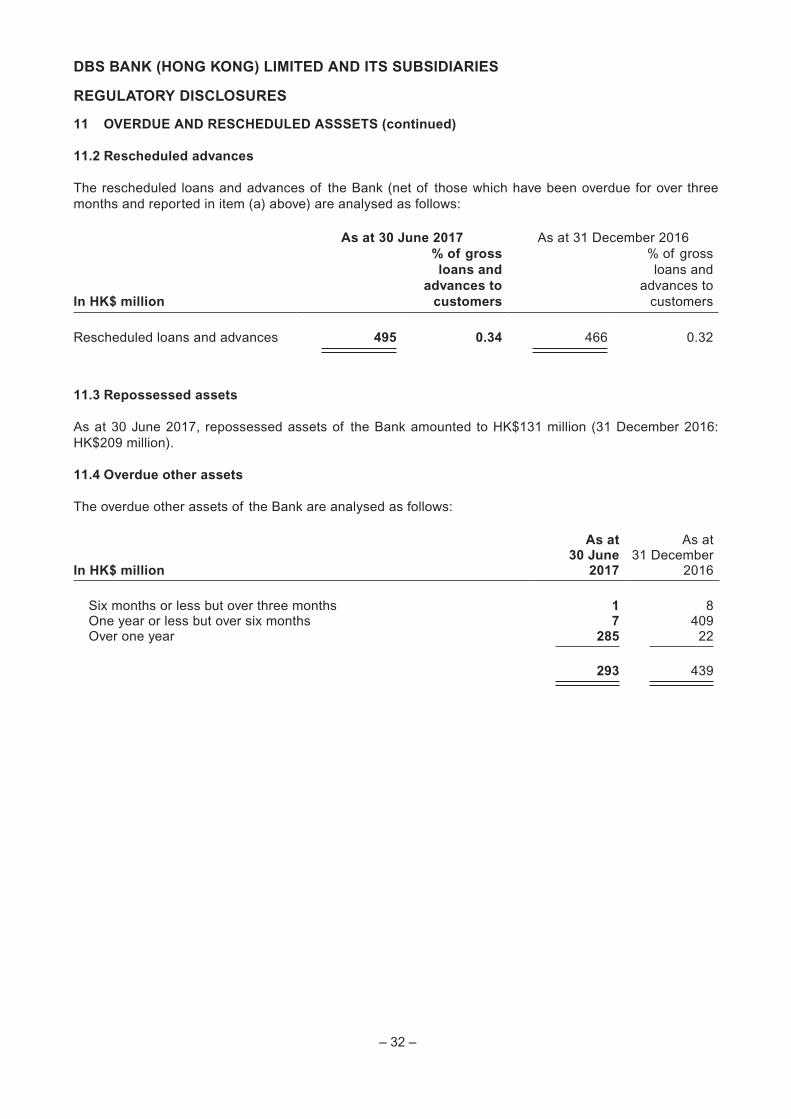
11.2 Rescheduled advances
The rescheduled loans and advances of the Bank (net of those which have been overdue for over three months and reported in item (a) above) are analysed as follows:
As at 30 June 2017 As at 31 December 2016
In HK$ million
% of gross loans and
advances to customers
% of gross loans and
advances to customers
Rescheduled loans and advances 495 0.34 466 0.32
11.3 Repossessed assets
As at 30 June 2017, repossessed assets of the Bank amounted to HK$131 million (31 December 2016: HK$209 million).
11.4 Overdue other assets
The overdue other assets of the Bank are analysed as follows:
In HK$ million
As at30 June
2017
As at31 December
2016
Six months or less but over three months 1 8One year or less but over six months 7 409Over one year 285 22
293 439

DBS BANK (HONG KONG) LIMITED AND ITS SUBSIDIARIES
REGULATORY DISCLOSURES
– 33 –
12 MAINLAND ACTIVITIES
The table below summarises the non-bank Mainland China exposure of the Bank (excluding its Macau Branch), categorised by types of counterparties:
As at 30 June 2017
In HK$ millionTypes of Counterparties
On-balance sheet
exposure
Off-balance sheet
exposure Total
(a) Central government, central government-owned entities and their subsidiaries and joint ventures (“JVs”) 724 444 1,168
(b) Local governments, local government-owned entities and their subsidiaries and JVs 471 17 488
(c) PRC nationals residing in Mainland China or other entities incorporated in Mainland China and their subsidiaries and JVs 3,789 1,249 5,038
(d) Other entities of central government not reported in part (a) above – 1 1
(e) Other entities of local governments not reported in part (b) above 70 73 143
(f) PRC nationals residing outside Mainland China or entities incorporated outside Mainland China where the credit is granted for use in Mainland China 5,312 1,933 7,245
(g) Other counterparties where the exposures are considered by the reporting institution to be non-bank Mainland China exposures 4,535 1,551 6,086
Total 14,901 5,268 20,169
Total assets after provision 349,992
On-balance sheet exposures as percentage of total assets 4.26%

DBS BANK (HONG KONG) LIMITED AND ITS SUBSIDIARIES
REGULATORY DISCLOSURES
– 34 –
12 MAINLAND ACTIVITIES (continued)
As at 31 December 2016
In HK$ millionTypes of Counterparties
On-balance sheet
exposure
Off-balance sheet
exposure Total
(a) Central government, central government-owned entities and their subsidiaries and joint ventures (“JVs”) 2,159 389 2,548
(b) Local governments, local government-owned entities and their subsidiaries and JVs 497 25 522
(c) PRC nationals residing in Mainland China or other entities incorporated in Mainland China and their subsidiaries and JVs 3,950 1,326 5,276
(d) Other entities of central government not reported in part (a) above – 1 1
(e) Other entities of local governments not reported in part (b) above 62 58 120
(f) PRC nationals residing outside Mainland China or entities incorporated outside Mainland China where the credit is granted for use in Mainland China 4,219 1,325 5,544
(g) Other counterparties where the exposures are considered by the reporting institution to be non-bank Mainland China exposures 4,919 2,174 7,093
Total 15,806 5,298 21,104
Total assets after provision 346,046
On-balance sheet exposures as percentage of total assets 4.57%

DBS BANK (HONG KONG) LIMITED AND ITS SUBSIDIARIES
REGULATORY DISCLOSURES
– 35 –
13 CURRENCY CONCENTRATIONS
The table below summarises the Group’s assets and liabilities at carrying amounts, categorised by currency:
In HK$ million USD CNY CAD AUD Others Total
As at 30 June 2017
Hong Kong dollar equivalents
Spot assets 131,631 9,199 481 4,263 9,482 155,056Spot liabilities (101,318) (8,340) (1,854) (7,805) (11,427) (130,744)Forward purchases 45,606 17,345 1,660 4,820 5,272 74,703Forward sales (75,388) (18,296) (221) (1,221) (3,324) (98,450)Net options position – – – 1 – 1
Net long / (short) non-structural position 531 (92) 66 58 3 566
Net structural position – 29 – – (52) (23)
As at 31 December 2016
Hong Kong dollar equivalents
Spot assets 136,421 4,152 410 4,307 8,276 153,566Spot liabilities (103,596) (8,185) (1,905) (8,242) (11,398) (133,326)Forward purchases 55,722 27,609 1,571 4,609 5,863 95,374Forward sales (86,379) (23,572) (82) (635) (2,754) (113,422)Net options position (1) 2 – (1) – –
Net long / (short) non-structural position 2,167 6 (6) 38 (13) 2,192
Net structural position – 28 – – (28) –
Structural foreign exchange positions arising from capital investments outside Hong Kong, mainly in Chinese Renminbi and Macau Pataca.
The net options position is calculated based on the delta-weighted position as set out in the prudential return “Foreign Currency Position” issued by the HKMA.

DBS BANK (HONG KONG) LIMITED AND ITS SUBSIDIARIES
REGULATORY DISCLOSURES
– 36 –
14 LIQUIDITY COVERAGE RATIO
The Bank complies with the minimum requirement of Liquidity Coverage Ratio (“LCR”) on a daily basis, in accordance with the Banking (Liquidity) Rules issued by the HKMA. In 2017, the Bank is required to maintain an LCR of not less than 80%, increasing annually in steps of 10% to not less than 100% by January 2019.
For the quarters ended30 June 2017 31 March 2017
Average LCR for the period 135.8% 133.2%
For the quarters ended30 June 2016 31 March 2016
Average LCR for the period 131.1% 136.9%
Liquidity disclosures as required by section 30 and 30A of the Banking (Disclosure) Rules are available in the section of Regulatory Disclosures of our website www.dbs.com.hk.
DBS BANK (HONG KONG) LIMITED AND ITS SUBSIDIARIES
REGULATORY DISCLOSURES
– 37 –
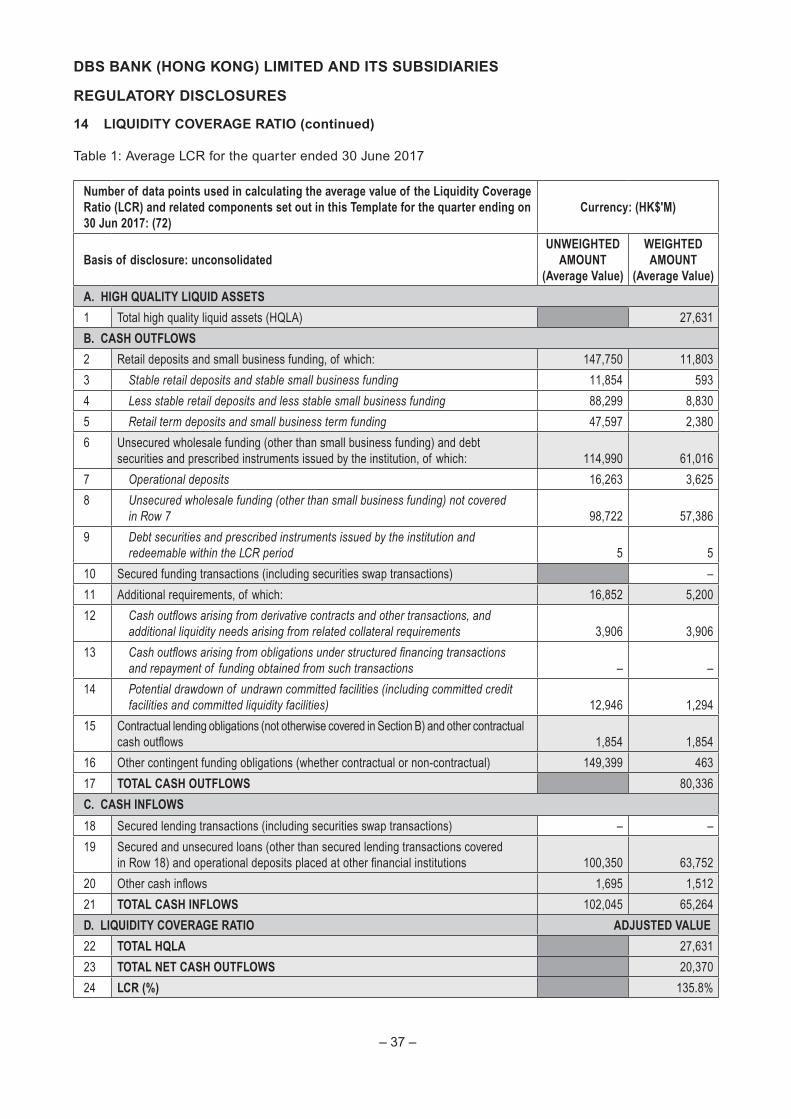
14 LIQUIDITY COVERAGE RATIO (continued)
Table 1: Average LCR for the quarter ended 30 June 2017
Number of data points used in calculating the average value of the Liquidity Coverage Ratio (LCR) and related components set out in this Template for the quarter ending on 30 Jun 2017: (72)
Currency: (HK$'M)
Basis of disclosure: unconsolidatedUNWEIGHTED
AMOUNT(Average Value)
WEIGHTED AMOUNT
(Average Value)
A. HIGH QUALITY LIQUID ASSETS
1 Total high quality liquid assets (HQLA) 27,631
B. CASH OUTFLOWS
2 Retail deposits and small business funding, of which: 147,750 11,803
3 Stable retail deposits and stable small business funding 11,854 593
4 Less stable retail deposits and less stable small business funding 88,299 8,830
5 Retail term deposits and small business term funding 47,597 2,380
6 Unsecured wholesale funding (other than small business funding) and debt securities and prescribed instruments issued by the institution, of which: 114,990 61,016
7 Operational deposits 16,263 3,625
8 Unsecured wholesale funding (other than small business funding) not covered in Row 7 98,722 57,386
9 Debt securities and prescribed instruments issued by the institution and redeemable within the LCR period 5 5
10 Secured funding transactions (including securities swap transactions) –
11 Additional requirements, of which: 16,852 5,200
12 Cash outflows arising from derivative contracts and other transactions, and additional liquidity needs arising from related collateral requirements 3,906 3,906
13 Cash outflows arising from obligations under structured financing transactions and repayment of funding obtained from such transactions – –
14 Potential drawdown of undrawn committed facilities (including committed credit facilities and committed liquidity facilities) 12,946 1,294
15 Contractual lending obligations (not otherwise covered in Section B) and other contractual cash outflows 1,854 1,854
16 Other contingent funding obligations (whether contractual or non-contractual) 149,399 463
17 TOTAL CASH OUTFLOWS 80,336
C. CASH INFLOWS
18 Secured lending transactions (including securities swap transactions) – –
19 Secured and unsecured loans (other than secured lending transactions covered in Row 18) and operational deposits placed at other financial institutions 100,350 63,752
20 Other cash inflows 1,695 1,512
21 TOTAL CASH INFLOWS 102,045 65,264
D. LIQUIDITY COVERAGE RATIO ADJUSTED VALUE
22 TOTAL HQLA 27,631
23 TOTAL NET CASH OUTFLOWS 20,370
24 LCR (%) 135.8%

DBS BANK (HONG KONG) LIMITED AND ITS SUBSIDIARIES
REGULATORY DISCLOSURES
– 38 –
14 LIQUIDITY COVERAGE RATIO (continued)
Table 2: Average LCR for the quarter ended 31 March 2017
Number of data points used in calculating the average value of the Liquidity Coverage Ratio (LCR) and related components set out in this Template for the quarter ending on 31 Mar 2017: (74)
Currency: (HK$’M)
Basis of disclosure: unconsolidatedUNWEIGHTED
AMOUNT(Average Value)
WEIGHTED AMOUNT
(Average Value)
A. HIGH QUALITY LIQUID ASSETS
1 Total high quality liquid assets (HQLA) 26,714
B. CASH OUTFLOWS
2 Retail deposits and small business funding, of which: 145,328 11,626
3 Stable retail deposits and stable small business funding 11,279 564
4 Less stable retail deposits and less stable small business funding 87,197 8,719
5 Retail term deposits and small business term funding 46,852 2,343
6 Unsecured wholesale funding (other than small business funding) and debt securities and prescribed instruments issued by the institution, of which: 112,747 60,635
7 Operational deposits 13,969 3,039
8 Unsecured wholesale funding (other than small business funding) not covered in Row 7 98,723 57,541
9 Debt securities and prescribed instruments issued by the institution and redeemable within the LCR period 55 55
10 Secured funding transactions (including securities swap transactions) –
11 Additional requirements, of which: 16,393 4,785
12 Cash outflows arising from derivative contracts and other transactions, and additional liquidity needs arising from related collateral requirements 3,496 3,496
13 Cash outflows arising from obligations under structured financing transactions and repayment of funding obtained from such transactions – –
14 Potential drawdown of undrawn committed facilities (including committed credit facilities and committed liquidity facilities) 12,897 1,289
15 Contractual lending obligations (not otherwise covered in Section B) and other contractual cash outflows 2,211 2,211
16 Other contingent funding obligations (whether contractual or non-contractual) 166,019 412
17 TOTAL CASH OUTFLOWS 79,669
C. CASH INFLOWS
18 Secured lending transactions (including securities swap transactions) – –
19 Secured and unsecured loans (other than secured lending transactions covered in Row 18) and operational deposits placed at other financial institutions 98,041 61,918
20 Other cash inflows 2,563 2,393
21 TOTAL CASH INFLOWS 100,604 64,311
D. LIQUIDITY COVERAGE RATIO ADJUSTED VALUE
22 TOTAL HQLA 26,714
23 TOTAL NET CASH OUTFLOWS 20,072
24 LCR (%) 133.2%

DBS BANK (HONG KONG) LIMITED AND ITS SUBSIDIARIES
REGULATORY DISCLOSURES
– 39 –
14 LIQUIDITY COVERAGE RATIO (continued)
Table 3: Average LCR for the quarter ended 30 June 2016
Number of data points used in calculating the average value of the Liquidity Coverage Ratio (LCR) and related components set out in this Template for the quarter ending on 30 Jun 2016: (74)
Currency: (HK$’M)
Basis of disclosure: unconsolidatedUNWEIGHTED
AMOUNT(Average Value)
WEIGHTED AMOUNT
(Average Value)
A. HIGH QUALITY LIQUID ASSETS
1 Total high quality liquid assets (HQLA) 23,063
B. CASH OUTFLOWS
2 Retail deposits and small business funding, of which: 134,232 10,594
3 Stable retail deposits and stable small business funding 10,721 536
4 Less stable retail deposits and less stable small business funding 77,648 7,765
5 Retail term deposits and small business term funding 45,863 2,293
6 Unsecured wholesale funding (other than small business funding) and debt securities and prescribed instruments issued by the institution, of which: 97,413 49,889
7 Operational deposits 13,030 2,824
8 Unsecured wholesale funding (other than small business funding) not covered in Row 7 84,147 46,829
9 Debt securities and prescribed instruments issued by the institution and redeemable within the LCR period 236 236
10 Secured funding transactions (including securities swap transactions) 1
11 Additional requirements, of which: 15,911 5,669
12 Cash outflows arising from derivative contracts and other transactions, and additional liquidity needs arising from related collateral requirements 4,531 4,531
13 Cash outflows arising from obligations under structured financing transactions and repayment of funding obtained from such transactions – –
14 Potential drawdown of undrawn committed facilities (including committed credit facilities and committed liquidity facilities) 11,380 1,138
15 Contractual lending obligations (not otherwise covered in Section B) and other contractual cash outflows 2,199 2,199
16 Other contingent funding obligations (whether contractual or non-contractual) 145,708 436
17 TOTAL CASH OUTFLOWS 68,788
C. CASH INFLOWS
18 Secured lending transactions (including securities swap transactions) – –
19 Secured and unsecured loans (other than secured lending transactions covered in Row 18) and operational deposits placed at other financial institutions 84,329 50,144
20 Other cash inflows 4,640 4,471
21 TOTAL CASH INFLOWS 88,969 54,615
D. LIQUIDITY COVERAGE RATIO ADJUSTED VALUE
22 TOTAL HQLA 23,063
23 TOTAL NET CASH OUTFLOWS 17,646
24 LCR (%) 131.1%

DBS BANK (HONG KONG) LIMITED AND ITS SUBSIDIARIES
REGULATORY DISCLOSURES
– 40 –
14 LIQUIDITY COVERAGE RATIO (continued)
Table 4: Average LCR for the quarter ended 31 March 2016
Number of data points used in calculating the average value of the Liquidity Coverage Ratio (LCR) and related components set out in this Template for the quarter ending on 31 Mar 2016: (72)
Currency: (HK$’M)
Basis of disclosure: unconsolidatedUNWEIGHTED
AMOUNT(Average Value)
WEIGHTED AMOUNT
(Average Value)
A. HIGH QUALITY LIQUID ASSETS
1 Total high quality liquid assets (HQLA) 24,061
B. CASH OUTFLOWS
2 Retail deposits and small business funding, of which: 130,969 10,354
3 Stable retail deposits and stable small business funding 10,550 528
4 Less stable retail deposits and less stable small business funding 76,108 7,610
5 Retail term deposits and small business term funding 44,311 2,216
6 Unsecured wholesale funding (other than small business funding) and debt securities and prescribed instruments issued by the institution, of which: 100,179 50,078
7 Operational deposits 13,865 3,028
8 Unsecured wholesale funding (other than small business funding) not covered in Row 7 86,224 46,960
9 Debt securities and prescribed instruments issued by the institution and redeemable within the LCR period 90 90
10 Secured funding transactions (including securities swap transactions) –
11 Additional requirements, of which: 16,943 6,845
12 Cash outflows arising from derivative contracts and other transactions, and additional liquidity needs arising from related collateral requirements 5,723 5,723
13 Cash outflows arising from obligations under structured financing transactions and repayment of funding obtained from such transactions – –
14 Potential drawdown of undrawn committed facilities (including committed credit facilities and committed liquidity facilities) 11,220 1,122
15 Contractual lending obligations (not otherwise covered in Section B) and other contractual cash outflows 1,492 1,492
16 Other contingent funding obligations (whether contractual or non-contractual) 147,264 407
17 TOTAL CASH OUTFLOWS 69,176
C. CASH INFLOWS
18 Secured lending transactions (including securities swap transactions) – –
19 Secured and unsecured loans (other than secured lending transactions covered in Row 18) and operational deposits placed at other financial institutions 89,778 54,486
20 Other cash inflows 3,209 3,077
21 TOTAL CASH INFLOWS 92,987 57,563
D. LIQUIDITY COVERAGE RATIO ADJUSTED VALUE
22 TOTAL HQLA 24,061
23 TOTAL NET CASH OUTFLOWS 17,612
24 LCR (%) 136.9%

DBS BANK (HONG KONG) LIMITED AND ITS SUBSIDIARIES
REGULATORY DISCLOSURES
– 41 –
14 LIQUIDITY COVERAGE RATIO (continued)
The Bank has maintained a healthy liquidity position. The LCR remained stable and well above the regulatory requirement in the first half of 2017. Surplus funds from loans and deposits are deployed to money market lending and HQLA. The impact to LCR from increased inflow from money market lending and increased HQLA is partially offset by higher outflow due to deposit growth; leading to a slight increase in average LCR.
(i) Composition of High Quality Liquid Assets (“HQLA”)
The Bank holds a pool of high quality unencumbered liquid assets that is readily available to meet cash flow obligations under stress scenarios, as defined in the LCR rules. These liquid assets consist predominantly of Level 1 HQLA, including mainly Hong Kong exchange fund bills and notes, as well as other government debt securities. This is supplemented by bonds issued by public sector entities in Hong Kong and highly rated corporate issuers, as well as covered bonds issued by reputable financial institutions.
(ii) Concentration of funding sources
The Bank strives to develop a diversified funding base with access to funding sources across retail and wholesale channels. Customer deposits form a sound funding base and serve as the main source of funding for the Bank. It is complemented by a well-diversified book of wholesale funding, including but not limited to interbank money market borrowing and the issuance of certificates of deposit. For more information on the Bank’s funding strategy, please refer to Note 38 in the annual report for the year ended 31 December 2016.
(iii) Derivatives Exposures
The Bank actively manages its over-the-counter (“OTC”) and exchange-traded derivative contracts, which comprise mainly of currency, interest rate and bond futures, foreign exchange forwards, interest rate and cross currency swaps, and foreign exchange options. Collateral may be required to be posted to counterparties and/or the exchanges, depending on the daily mark-to-market of these derivative positions. The Bank’s largest counterparty for OTC derivatives is the Bank’s parent company.
(iv) Currency mismatch
Customer deposit in Hong Kong, largely denominated in HKD, is a major funding source for the Bank. The Bank swaps surplus HKD funding into United States Dollars (“USD”) and other foreign currencies to meet customer demand for loans.
The Bank covers its HKD mismatch by supplementing its holdings in high quality USD denominated HQLA. This is in line with the LCR alternative liquidity approach option elected by the HKMA. The Bank has continued to maintain its ratio of HKD Level 1 HQLA to HKD net cash outflows within 30 days well above the HKMA minimum requirement of 20%.
(v) Centralisation of liquidity management
The Bank seeks to manage its liquidity in a prudent manner to ensure that its liquidity obligations would always be honored under normal and adverse circumstances. The Bank centrally manages its liquidity position and provides funding support to its overseas branch for the lending growth.
Approach to liquidity risk management
The Bank’s approach to liquidity risk management is based on the building blocks of governance by risk committees’ oversight, policies that define overarching principles and specific risk methodologies, and standards that establish the detailed requirements. Processes and systems are in place to measure, limit and control exposures based on the risk methodologies defined. For more information on the Bank’s approach to liquidity risk management, please refer to Note 38 in the annual report for the year ended 31 December 2016.
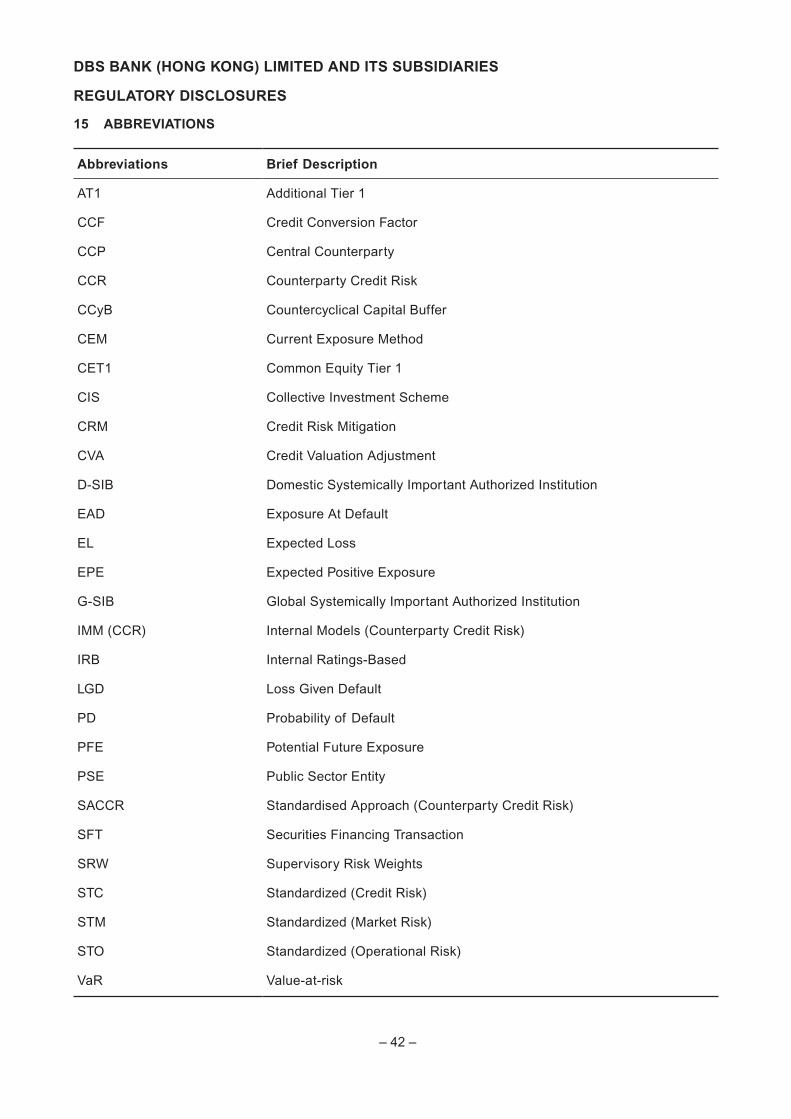
DBS BANK (HONG KONG) LIMITED AND ITS SUBSIDIARIES
REGULATORY DISCLOSURES
– 42 –
15 ABBREVIATIONS
Abbreviations Brief Description
AT1 Additional Tier 1
CCF Credit Conversion Factor
CCP Central Counterparty
CCR Counterparty Credit Risk
CCyB Countercyclical Capital Buffer
CEM Current Exposure Method
CET1 Common Equity Tier 1
CIS Collective Investment Scheme
CRM Credit Risk Mitigation
CVA Credit Valuation Adjustment
D-SIB Domestic Systemically Important Authorized Institution
EAD Exposure At Default
EL Expected Loss
EPE Expected Positive Exposure
G-SIB Global Systemically Important Authorized Institution
IMM (CCR) Internal Models (Counterparty Credit Risk)
IRB Internal Ratings-Based
LGD Loss Given Default
PD Probability of Default
PFE Potential Future Exposure
PSE Public Sector Entity
SACCR Standardised Approach (Counterparty Credit Risk)
SFT Securities Financing Transaction
SRW Supervisory Risk Weights
STC Standardized (Credit Risk)
STM Standardized (Market Risk)
STO Standardized (Operational Risk)
VaR Value-at-risk