DBCP TD No. 37 · Web viewIntergovernmental Oceanographic World Commission of UNESCO...
63
Intergovernmental Oceanographic World Commission of UNESCO Meteorological Organization DATA BUOY COOPERATION PANEL GUIDE TO BUOY DATA QUALITY CONTROL TESTS TO PERFORM IN REAL TIME BY A GTS DATA PROCESSING CENTRE
Transcript of DBCP TD No. 37 · Web viewIntergovernmental Oceanographic World Commission of UNESCO...
Intergovernmental Oceanographic World Commission of UNESCO Meteorological Organization
D A T A B U O Y C O O P E R A T I O N P A N E L
DBCP Technical Document No. 37
GUIDE TO BUOY DATA QUALITY CONTROL TESTS TO PERFORM IN REAL TIME BY A GTS DATA
PROCESSING CENTRE

Intergovernmental Oceanographic World Commission of UNESCO Meteorological Organization
D A T A B U O Y C O - O P E R A T I O N P A N E L
GUIDE TO BUOY DATA QUALITY CONTROL TESTS TO PERFORM IN REAL TIME BY A GTS DATA
PROCESSING CENTRE
DBCP Technical Document No. 37
Version 1
2011
~ ii ~
C O N T E N T S
1. PREFACE..................................................................................................................................4
2. BACKGROUND AND AUDIENCE FOR THIS DOCUMENT.................................................4
3. VERSION TRACKING..............................................................................................................4
4. INTRODUCTION.......................................................................................................................5
4.1. OVERVIEW OF THE GLOBAL TELECOMMUNICATIONS SYSTEM...............................................................54.2. WMO IDENTIFIER NUMBERS.......................................................................................................64.3. PLATFORMS TYPES AND GTS MESSAGE TYPES..................................................................................74.4. VARIABLES MEASURED BY SENSORS AND METADATA INCLUDED IN MESSAGES..........................................9
5. DATA PROCESSING.....................................................................................................................18
6. REAL TIME QUALITY CONTROL CHECKS.......................................................................19
6.1. TESTS MADE FOR THE WHOLE OBSERVATION..................................................................................196.2. TESTS MADE FOR EACH INDIVIDUAL SENSOR...................................................................................22
7. ON-LINE ACCESS TO DATA................................................................................................25
7.1. SATELLITE TELECOMMUNICATIONS SERVICE PROVIDER......................................................................257.2. OVER THE GLOBAL TELECOMMUNICATION SYSTEM (GTS)................................................................257.3. DATA ARCHIVAL CENTRES........................................................................................................25
8. DELAYED MODE QUALITY CONTROL GUIDELINES......................................................25
8.1. DBCP QC GUIDELINES............................................................................................................ 258.2. DBCP QC GUIDELINES DISTRIBUTION LIST (MAILING LIST).................................................................27
ANNEX I: USEFUL WEBLINKS, AND REFERENCES..........................................................................28
ANNEX II: CONTACTS....................................................................................................................30
CHAIR:.............................................................................................................................................. 30TECHNICAL COORDINATOR:.................................................................................................................... 30SECRETARIAT MEMBERS:....................................................................................................................... 30
ANNEX III: ACRONYMS..................................................................................................................31
ANNEX IV: DBCP QUALITY CONTROL GUIDELINES FOR GTS BUOY DATA.............................................36
I) HISTORY................................................................................................................................... 36BUOY MONITORING STATISTICS............................................................................................................... 36II) PARTICIPANTS............................................................................................................................ 36III) MORE INFORMATION................................................................................................................... 36IV) QUALITY CONTROL GUIDELINES FOR GTS BUOY DATA..........................................................................38OPERATING QC GUIDELINES FOR BUOY DATA..............................................................................................41Standardized Format for Information Deposited on the email distribution list.................................41
FIGURES AND TABLESTable 1: Observational Requirements (Climate)..........................................................12Table 2: Observational Requirements (Global NWP)..................................................13Table 3: Recommended gross error checks for typical marine variables......................18Figure i. Schematic of the process of implementing the DBCP QC guidelines.............32Table 4. List of Monitoring tools from various Quality Control Centres for buoy data 41
~ iii ~

~ iv ~
1. PREFACE
Thousands of ocean observing platforms worldwide are equipped with satellite transmitters, sending regular information via the various systems available to help scientists to understand the ocean environment, its impacts on the globe and predict climate change. On top of these data collection and location services, data is processed in real-time or near-real-time for dissemination to national meteorological services through the Global Telecommunications System (GTS) of WMO in order for those data to be assimilated by numerical weather prediction models, and used for operational applications. The different programs contributing to the IOC-WMO-UNEP-ICSU Global Ocean Observing System (GOOS) have developed routines and tests to check the quality of data transmitting via satellite or any other means, before it is shared for use by the community. This document provides information about those tests recommended by the Data Buoy Cooperation Panel for buoy data and the mechanisms it has put in place to estimate the quality of the observations through automated quality control tests, and to ensure that the quantity of poor quality buoy data distributed on GTS by data processing centres is minimal.
2. BACKGROUND AND AUDIENCE FOR THIS DOCUMENT
This report aims to summarise the Quality Control processes which need to be considered and followed by centres which plan to distribute drifting and moored buoy measurements, in real time, on the Global Telecommunications System (GTS) of WMO. It is assumed that the reader already has an extensive knowledge of the satellite systems being used to communicate between the platform and the ground station and their own data processing system. It is also assumed that the Global Telecommunications System (GTS) of WMO is understood.
This document, which draws on content from DBCP Technical Document No.2, DBCP Technical Document No. 3, and the Argos User’s Manual (http://www.cls.fr & http://www.argos-system.org/manual/), was compiled in August 2009 by the Technical Coordinator of the DBCP, Ms Hester Viola, and reviewed by DBCP experts at the 25 th Session of the DBCP. Since then some content was updated and some information added to ensure that the document applies equally to any satellite telecommunications system. It was then reviewed by the DBCP Task Team on Data Management and other experts.
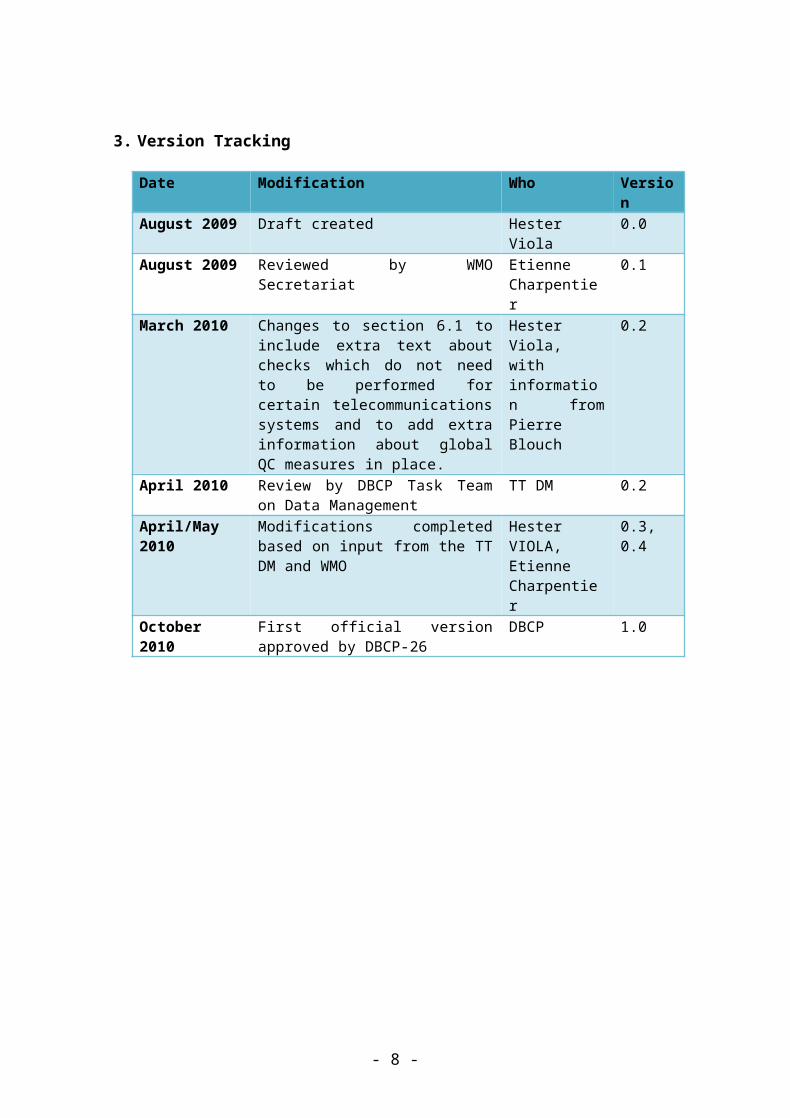
3. Version Tracking
Date Modification Who VersionAugust 2009 Draft created Hester Viola 0.0August 2009 Reviewed by WMO Secretariat Etienne
Charpentier0.1
March 2010 Changes to section 6.1 to include extra text about checks which do not need to be performed for certain telecommunications systems and to add extra information about global QC measures in place.
Hester Viola, with information from Pierre Blouch
0.2
April 2010 Review by DBCP Task Team on Data Management
TT DM 0.2
April/May 2010 Modifications completed based on input from the TT DM and WMO
Hester VIOLA, Etienne Charpentier
0.3, 0.4
- 5 -
October 2010 First official version approved by DBCP-26
DBCP 1.0
- 6 -
4. INTRODUCTION
This document aims to explain the elements to be considered by a data processing centre wishing to distribute marine or ocean data from drifting and moored buoys, in real-time, on the Global Telecommunications System (GTS) of the World Meteorological Organization (WMO). There is a requirement for real-time quality control checks on all data before it is distributed onto the GTS. The various real-time quality control tests which should be implemented are explained.This document should be useful for data processing centres which have direct access to data coming from a satellite telecommunications system being used by data buoys. Setting up these tests for individual buoys usually relies upon direct contact with the platform operators. The data processing centre will need to have established a link to a GTS uplink node (which is usually the National Meteorological or Hydrological Service).
4.1.Overview of the Global Telecommunications System
The Global Telecommunication System (GTS), is a network run by the World Meteorological Organization (WMO), to facilitate real-time data exchange between national meteorological, hydrological and oceanographic centres.
National meteorological services rely on real-time data to initialize numerical weather prediction (NWP) models run to provide the basis for operational weather forecasts. The data are also essential for verifying the performance of NWP systems and monitoring changing weather conditions. The land station network is dense and the data of good quality, but there are not enough data from the oceans, particularly in data-sparse areas not covered by Voluntary Observing Ships (VOS) reporting weather data.
It is coordinated by the World Meteorological Organization (WMO) and is part of the WMO Information System (WIS). The data are formatted using WMO GTS code formats such as FM-18 BUOY or FM-94 BUFR. GTS bulletins containing messages coded according to WMO regulations are then produced and sent in real time via the GTS to operational meteorological and oceanographic centres.
Variables measured at the same time for the same platform are grouped and encoded into single GTS reports (i.e. observations or groups of observations). GTS reports encoded using the same WMO code format are grouped into what are known as bulletins. Such bulletins are transmitted directly from the processing centre to a GTS uplink node for dissemination over the GTS. The following GTS code formats can be used for GTS distribution of ocean data:
FM 18-XII BUOY Report of a buoy observation,FM 12-XII Ext. SYNOP Report of surface observation from a land station,FM 13-XII Ext. SHIP Report of surface observation from a sea station, or moored
buoy,FM 63-XI Ext. BATHY Report of a bathythermal observation,FM 64-XI Ext. TESAC Sub-surface temperature, salinity and current report from a
sea station,FM 65–XI Ext. WAVEOB Report of spectral wave information from a sea station or
from a remote platform (aircraft or satellite)FM 94-XIII Ext.BUFR Binary universal form for the representation of
meteorological data. It can be used to encode data from any type of observing platform, including buoys.
- 7 -
BUFR encoding and decoding needs to be supported by any data processing centre wanting to send data to the GTS. This data format will be standard after 2012 for the GTS and the WIS and the alphanumeric codes (BUOY, SYNOP, SHIP, BATHY and TESAC) will be phased out and may not be used any longer.
BUFR messages are based on appropriate templates dedicated to specific observational platforms as developed by the user community. The JCOMM Task Team on Table Driven Code Forms oversees the development of community templates.
BUFR is basically a self defining binary code for exchanging meteorological data. A BUFR "message" is a contiguous binary stream composed of 6 sections. Section 0 contains the coded characters "BUFR" and Section 5 the coded characters "7777" indicating the beginning and the end of a BUFR message. Section 1, Identification Section, contains information about the contents of the data, such as type of data, time of data and whether or not the optional Section 2 is included in the message. Section 3 contains the description of the data that is represented in Section 4. Standard BUFR descriptors defined in BUFR tables B, C and D are used for that purpose. The marine meteorological and oceanographic community has developed standard templates to report ocean platform data (and metadata) in BUFR. Bulletins will be identified by BUFR specific headers. Examples are given in section 4.3.1 below. Refer to the WMO Manual on Codes, Volume 1, International Codes, WMO No 306, Part B - Binary codes - for details (see Annex I for references)
BUFR encoding and/or decoding software can be obtained free of charge from a number of sources (see Annex I).
More information about templates for buoys and other JCOMM platforms is available on the JCOMM website: http://www.jcomm.info.
4.2.WMO Identifier numbers
Individual drifting buoys and other platforms are identified by various identifiers (e.g. Argos ID for a PTT or PMT, Iridium Modem number IMEI etc). In addition, when data from these platforms are intended for transmission through the GTS, another identifier called "WMO international buoy identifier number" - A1bwnbnbnb is used as an identifier for the platform in the data system. Buoys normally use 5-digit identifiers with nbnbnb in the range 000 to 499 being used for moored buoys, and nbnbnb in the range 500 to 999 for drifting buoys. Five-digit numbers can be used for the reporting in BUOY and BUFR formats. However, seven-digit numbers in the form A1bwnbnbnbnbnb can also be allocated to buoys (nbnbnbnbnb mod 1000 in the range 000 to 499 for moored buoys; and nbnbnbnbnb mod 1000 in the range 500 to 999 for drifting buoys) but those can only be used for the reporting of the data in BUFR.
For the allocation of these identifiers Platform Operators must have the number of their platform (or modem) and request the WMO number from the National Focal Point for Buoy Programmes (see list of such contact points from the web link below). Please contact the Technical Coordinator of the Data Buoy Cooperation Panel for details or assistance (contacts in Annex II).
The platform operator should be able to suspend or cancel the GTS dissemination at any time.
For more information see : http://www.jcommops.org/wmo_numbers.html
- 8 -
4.3.Platforms types and GTS message types
Until 1 November 1991, the WMO code format used for GTS distribution of drifting buoy data was FM 14-VII DRIBU. It was then replaced by FM 18-IX Ext. DRIFTER until 2 November 1994. Since then, the formal WMO code used for drifting buoys has been FM 18 BUOY (current version is FM 18-XII BUOY). The WMO is encouraging the migration of all data on the GTS to FM-94 BUFR - Binary Universal Form for the Representation of Meteorological Data by 2012.GTS reports are embedded within GTS bulletins identified by GTS bulletin headers to make sure they reach the right operational centres.
For example, GTS bulletin headers have the following general form:
T1T2A1A2ii CCCC YYGGgg [BBB]
Where:
T1T2 Data Type Designator,A1A2 Geographical Designator,ii Level or Deployment area,CCCC GTS Originating Centre,YYGGgg Time of bulletin: Day in the month (YY), Hour (GG) and Minutes
(gg),BBB For additions, corrections, amendments of a bulletin issued
previously with the same header.
Refer to the WMO Publication No. 386, Manual on the Global Telecommunication System (GTS), Part II, and Attachments II-4 and II-5 for details regarding the exact formatting of GTS bulletins, and GTS bulletin headers. The Manual can be downloaded from the WMO web site (see Annex I).
4.3.1. Drifting Buoys (including ice buoys)
Experimental transmission of data in BUFR started by data processing centres during 2003 and was validated for operational use by July 2003. It is expected that all buoys which are now reporting on the GTS in FM 18-X BUOY format will report in both formats, i.e. BUOY and BUFR. Buoy data will continue to be distributed in BUOY format until 2012 after which time GTS data processing centres will only send BUFR messages.
GTS bulletin headers used for distribution of drifter data in BUOY format normally use the following GTS bulletin headers:
T1T2 = “SS”A1A2 = “VX”ii = value to be discussed with the Technical Coordinator of the DBCP. Current list of GTS bulletin headers can be found at : http://www.jcommops.org/dbcp/1gbh.html
GTS bulletin headers used for the distribution of drifter data in BUFR format normally have the following form:
- 9 -
T1T2 = IOA1A2 = ZXii = value to be discussed with the Technical Coordinator of the DBCP. Current list of GTS bulletin headers can be found at : http://www.jcommops.org/dbcp/1gbh.html
e.g.• "IOZXii LFPW" for the bulletins issued from the Meteo France, Toulouse, France• "IOZXii KARS" for the bulletins issued from the US Argos Processing Center, CLS
America, Largo, USA
Values for ii will remain the same as for the BUFR bulletin headers used for GTS distribution of the data in BUOY format. So for example data normally distributed in BUOY code under "SSVX02 KARS" will also be distributed in BUFR under "IOZX02 KARS".
4.3.2. Moored buoys
The WMO code used for GTS distribution of moored buoy data is FM 18-X BUOY or FM 13-X SHIP. This data must be sent in BUFR format from 2012 onwards using a template designed for buoys. It may be necessary to send several different BUFR messages to encompass all of the measurements taken.
Offshore platforms and mobile exploration platforms should use a BUFR template designed to suit those platforms rather than the Buoy or Voluntary Observing Ship template.
Refer to the WMO Publication No. 386 for details regarding the exact formatting of GTS bulletins, and GTS bulletin headers (see Annex I to locate the Publication on the WMO website). Normally, A1A2 will depend upon geogaphical area where the buoy is deployed.
- 10 -
4.4.Variables measured by Sensors and Metadata included in messages
The variables measured by the data buoys generally include one or more of the following elements:
- Atmospheric pressure- Atmospheric pressure tendency - Wind speed, Wind direction - Air temperature- Sea-surface temperature, Sub-surface temperatures- Sea surface salinity, Sub-surface salinities- Rainfall- Wave period and height- Wave energy spectra- Relative Humidity. (Moorings only)- Down-welling Radiation. (Moorings only)- Currents from buoys
Since the location of the drifting buoy is also measured or calculated, sea surface currents can be derived, provided that the drifting buoy has a suitable drogue.
measured with Doppler Current meter or Acoustic Doppler Current Profiler for moorings
- Other Biogeochemical or optical elements (CO2, O2, Fluorescence, sediments etc)
Environmental observations required in support of meteorological and oceanographic services and research are discussed in relevant WMO and IOC publications (see Annex I). In these publications the relative priority of the importance of individual parameters depends to some extent on the uses of the data.
Atmospheric pressure measurements are of prime importance for NWP as atmospheric pressure cannot be measured from satellites.
Wind speed and direction are also of utmost importance for weather forecasting and analysis.
Sea-Surface Temperature (SST) is also of importance for NWP, air-sea interaction studies, climate change monitoring, and critical for fisheries and other areas. SST data from drifting buoys are used as ground truth measurements for satellite derived data.
Air temperature is also important for air/sea interaction and climate programmes. Current drift and sub-surface temperatures are very important for improving
understanding of oceanographic conditions across the globe. Observations of waves are important for all types of marine users.
- 11 -
Platform sensor data are decoded, processed in geophysical units, quality controlled, encoded into WMO code formats and disseminated on the GTS in real time.
Before sending data onto the GTS any data processing centre must automatically identify data from failed sensors, and other bad data, by:
1. comparing data with limits that the platform operator has supplied,2. checking for gross errors (e.g. data outside plausible range),3. compressing identical platform messages or sensor data from the same satellite
pass (where necessary and appropriate)4. using checksums or some equivalent process to check message integrity from
platform to satellite and then from satellite to ground station (where necessary and appropriate).
It is important that any GTS data processing centre allow the platform operator to stop transmission on the GTS via a simple mechanism, either for all observations from a platform or for individual variables. This should also be easily configurable for a group of platforms. It is also important that the operator can provide revised calibration values at any time due to changes in the instrumentation (for instance on a mooring), biases or variability over time.
The spatial and temporal resolution of observations required for climate is coarser than for weather forecasting, but the need for quality control and platform metadata is greater. The GTS processing centre must be able to support the inclusion of appropriate metadata about the platform in the GTS message. This is especially important where BUFR messages are being generated as the amount of metadata required for the Buoy BUFR template is far greater than in the traditional BUOY buoy code.
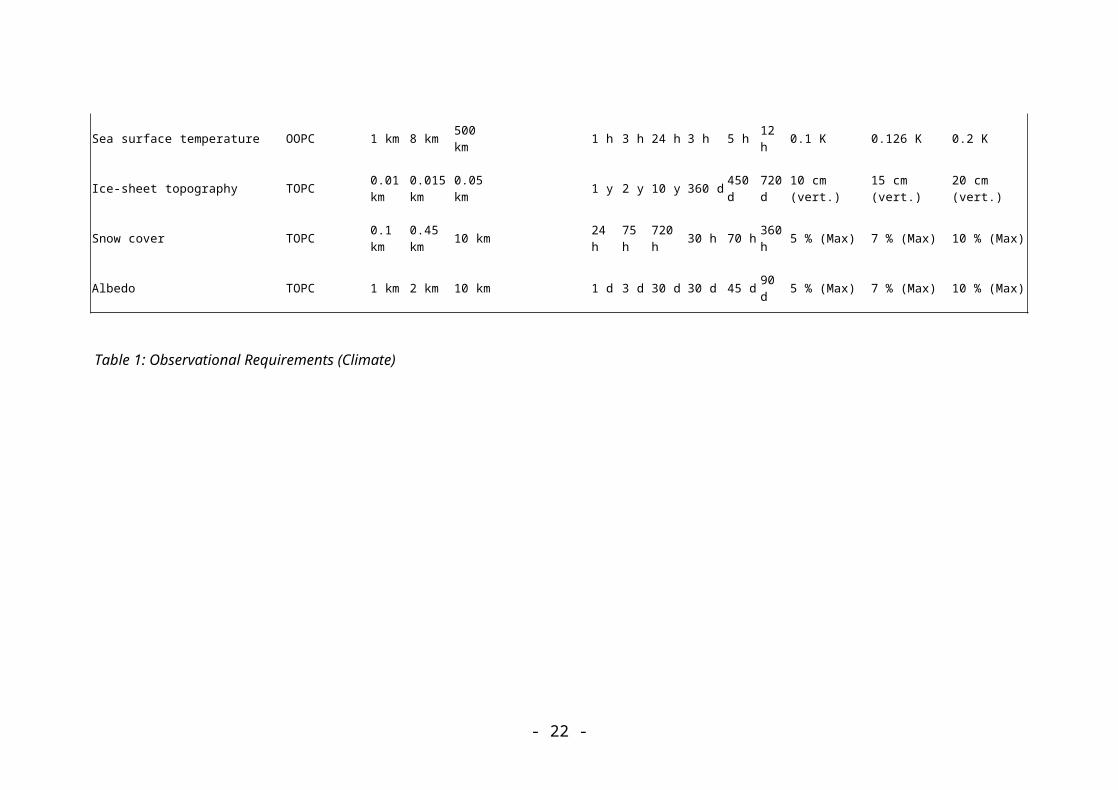
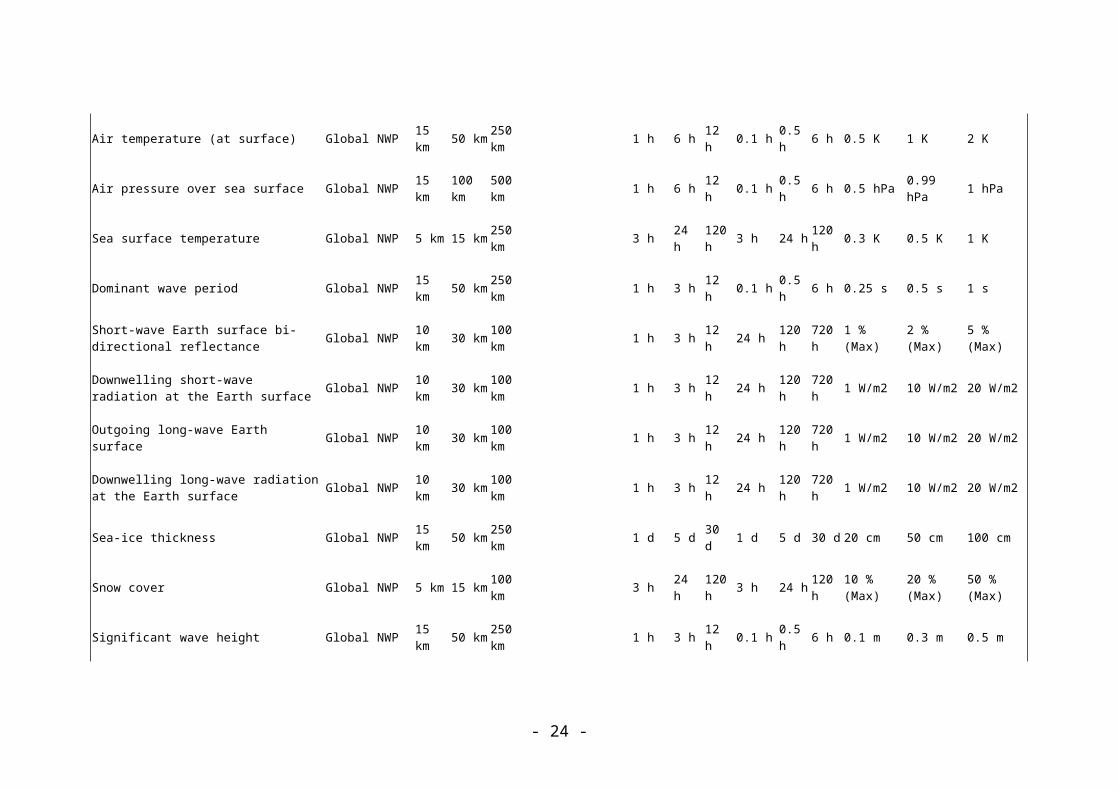
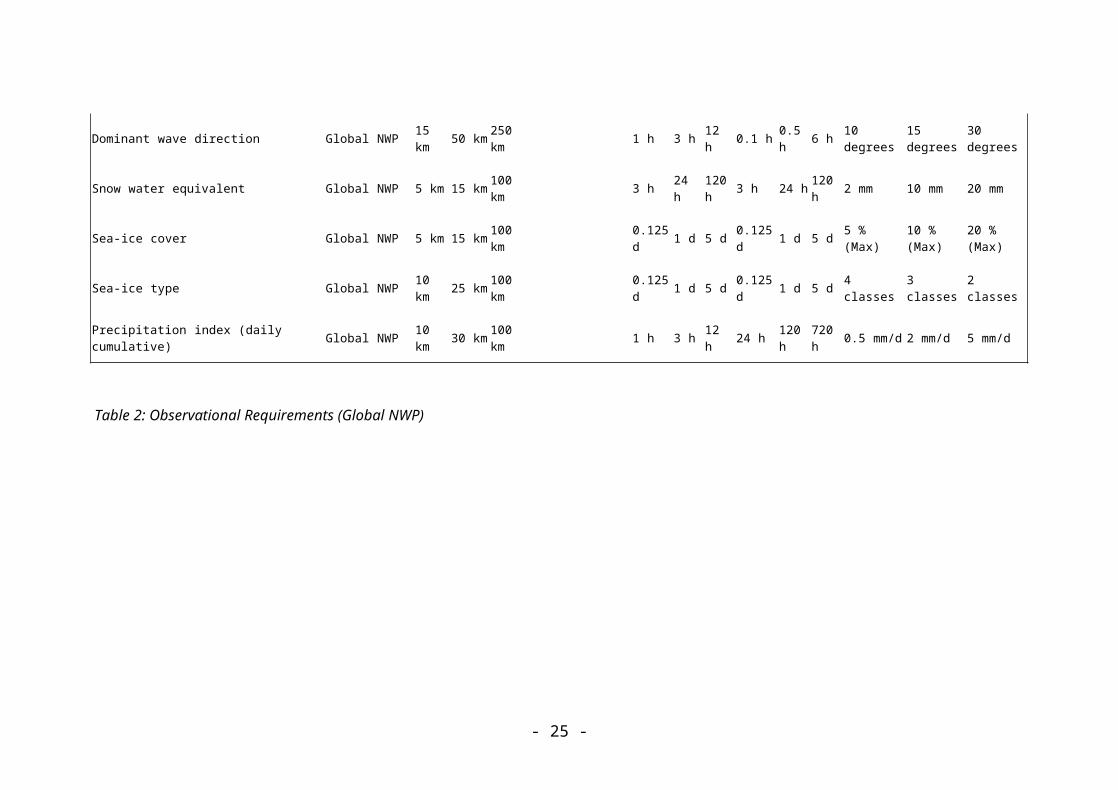
The requirements for monitoring change in climate have been specified by the Ocean Observations Panel for Climate (of GOOS/GCOS/WCRP), within the context of the Climate Module of the WMO-IOC-UNEP-ICSU Global Ocean Observing System (GOOS). GOOS is also the Ocean Module of the WMO-IOC-UNEP-ICSU Global Climate Observing System (GCOS). The desirable observational network for climate monitoring purposes was initially specified in 1995, and has recently been reviewed and refined in the 2010 update of the GCOS Implementation Plan. This and the observational requirements for the Global Climate Observing System atmospheric (AOPC) and ocean (OOPC) components on one hand, and for Global Numerical Weather Prediction on the other hand are listed in Tables 1 and 2 respectively (see below). In these tables, each requirement is expressed in terms of horizontal resolution, vertical resolution, observing cycle, delay of availability and accuracy with each parameter described in terms of goal, breakthrough (B/T) and threshold (T/H)1.
1 The “threshold” is the absolute minimum requirement, i.e. the requirement level below which data have no significant impact on the application; the “goal” is the ideal requirement above which data do not bring any additional value to the application; the “breakthrough” level is an intermediate value between “threshold” and “goal“ which, if achieved, would result in a significant improvement for the targeted application. The breakthrough level is expected to be more appropriate than the “goal” from a cost-benefit point of view.
- 12 -
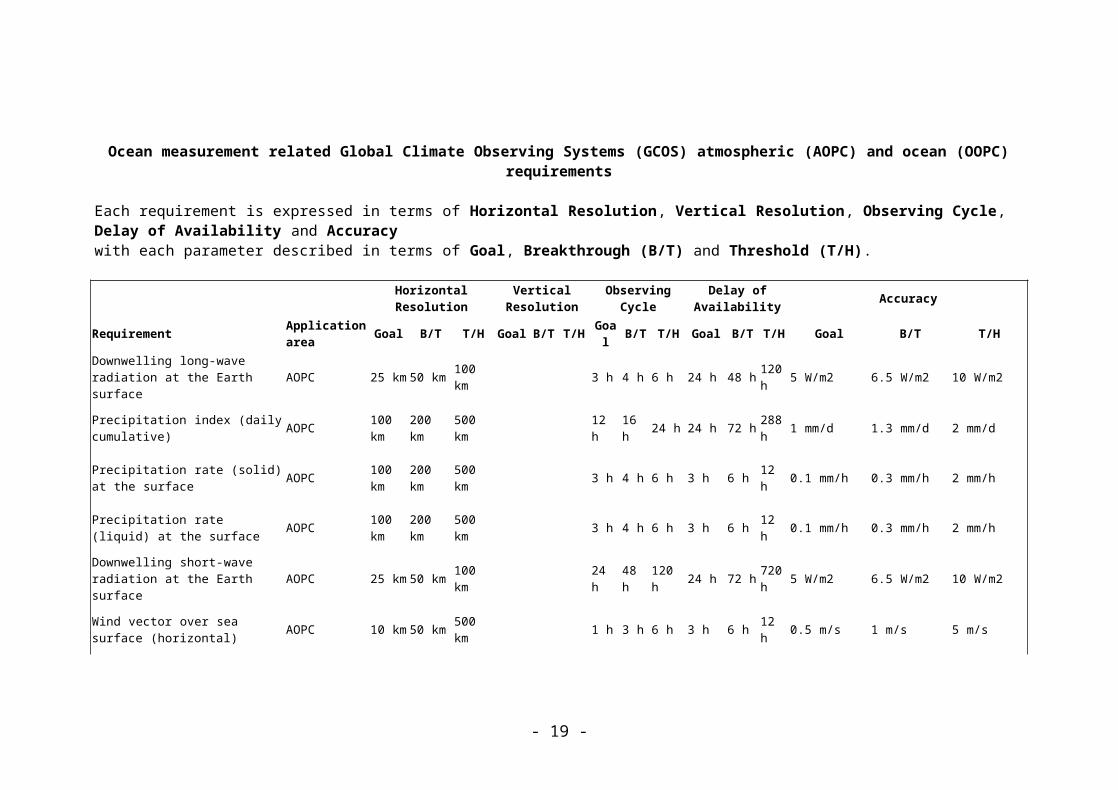
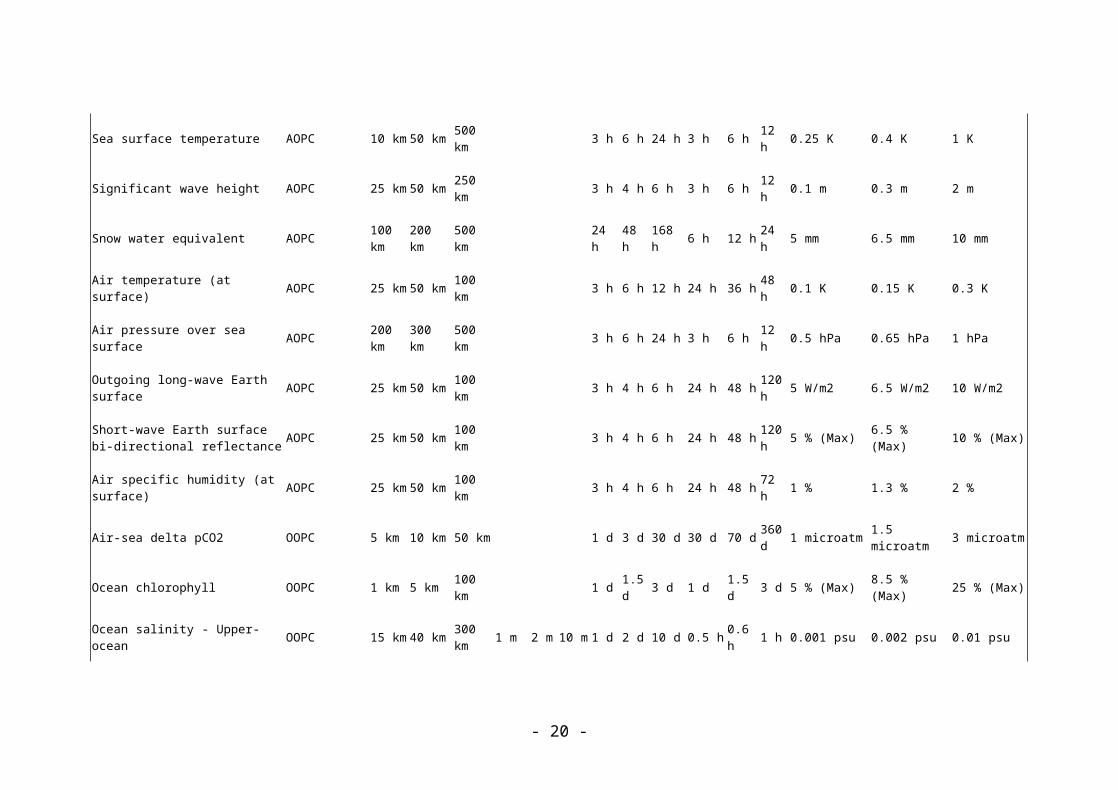
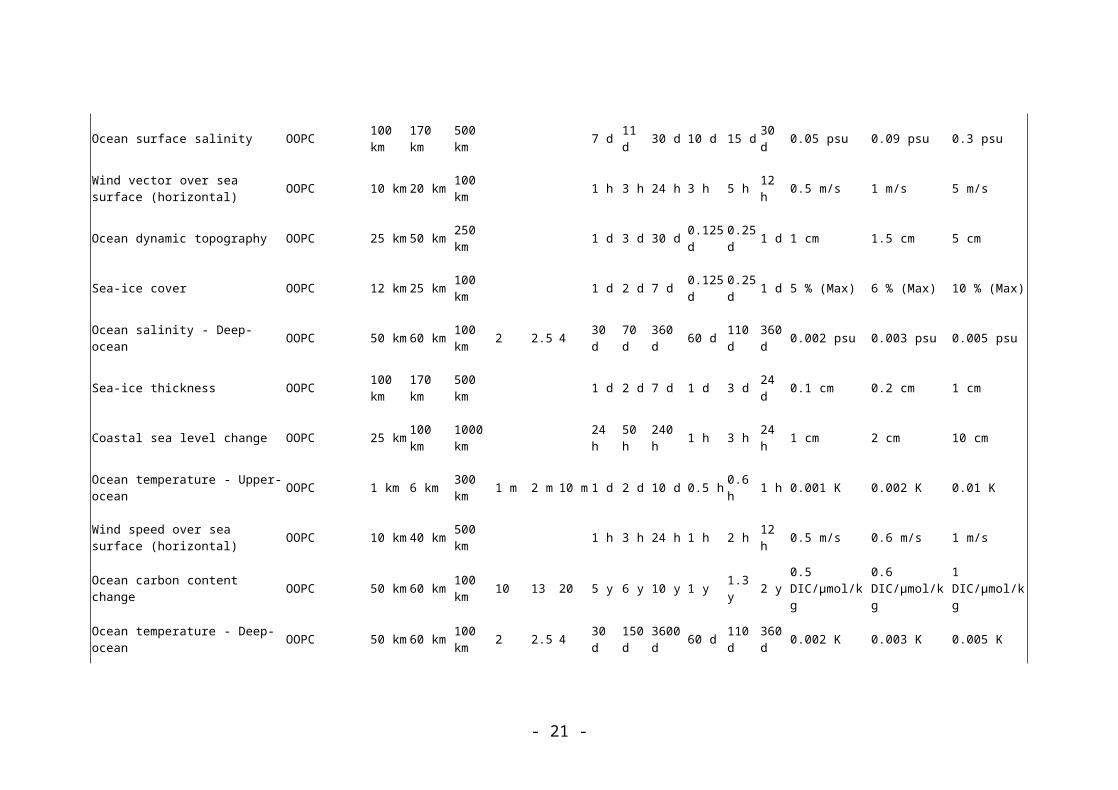
Ocean measurement related Global Climate Observing Systems (GCOS) atmospheric (AOPC) and ocean (OOPC) requirements
Each requirement is expressed in terms of Horizontal Resolution, Vertical Resolution, Observing Cycle, Delay of Availability and Accuracywith each parameter described in terms of Goal, Breakthrough (B/T) and Threshold (T/H).
Horizontal Resolution
Vertical Resolution
Observing Cycle
Delay of Availability Accuracy
Requirement Application area Goal B/T T/H Goal B/T T/H Goal B/T T/H Goal B/T T/H Goal B/T T/H
Downwelling long-wave radiation at the Earth surface AOPC 25 km 50 km 100
km 3 h 4 h 6 h 24 h 48 h 120 h 5 W/m2 6.5 W/m2 10 W/m2
Precipitation index (daily cumulative) AOPC 100
km 200 km 500 km 12 h 16 h 24 h 24 h 72 h 288
h 1 mm/d 1.3 mm/d 2 mm/d
Precipitation rate (solid) at the surface AOPC 100
km 200 km 500 km 3 h 4 h 6 h 3 h 6 h 12 h 0.1 mm/h 0.3 mm/h 2 mm/h
Precipitation rate (liquid) at the surface AOPC 100
km 200 km 500 km 3 h 4 h 6 h 3 h 6 h 12 h 0.1 mm/h 0.3 mm/h 2 mm/h
Downwelling short-wave radiation at the Earth surface AOPC 25 km 50 km 100
km 24 h 48 h 120 h 24 h 72 h 720 h 5 W/m2 6.5 W/m2 10 W/m2
Wind vector over sea surface (horizontal) AOPC 10 km 50 km 500
km 1 h 3 h 6 h 3 h 6 h 12 h 0.5 m/s 1 m/s 5 m/s
Sea surface temperature AOPC 10 km 50 km 500 km 3 h 6 h 24 h 3 h 6 h 12 h 0.25 K 0.4 K 1 K
- 13 -
Significant wave height AOPC 25 km 50 km 250 km 3 h 4 h 6 h 3 h 6 h 12 h 0.1 m 0.3 m 2 m
Snow water equivalent AOPC 100 km 200 km 500
km 24 h 48 h 168 h 6 h 12 h 24 h 5 mm 6.5 mm 10 mm
Air temperature (at surface) AOPC 25 km 50 km 100 km 3 h 6 h 12 h 24 h 36 h 48 h 0.1 K 0.15 K 0.3 K
Air pressure over sea surface AOPC 200 km 300 km 500
km 3 h 6 h 24 h 3 h 6 h 12 h 0.5 hPa 0.65 hPa 1 hPa
Outgoing long-wave Earth surface AOPC 25 km 50 km 100 km 3 h 4 h 6 h 24 h 48 h 120
h 5 W/m2 6.5 W/m2 10 W/m2
Short-wave Earth surface bi-directional reflectance AOPC 25 km 50 km 100
km 3 h 4 h 6 h 24 h 48 h 120 h 5 % (Max) 6.5 % (Max) 10 % (Max)
Air specific humidity (at surface) AOPC 25 km 50 km 100 km 3 h 4 h 6 h 24 h 48 h 72 h 1 % 1.3 % 2 %
Air-sea delta pCO2 OOPC 5 km 10 km 50 km 1 d 3 d 30 d 30 d 70 d 360 d 1 microatm 1.5 microatm 3 microatm
Ocean chlorophyll OOPC 1 km 5 km 100 km 1 d 1.5 d 3 d 1 d 1.5 d 3 d 5 % (Max) 8.5 % (Max) 25 % (Max)
Ocean salinity - Upper-ocean OOPC 15 km 40 km 300 km 1 m 2 m 10 m 1 d 2 d 10 d 0.5 h 0.6 h 1 h 0.001 psu 0.002 psu 0.01 psu
Ocean surface salinity OOPC 100 km 170 km 500
km 7 d 11 d 30 d 10 d 15 d 30 d 0.05 psu 0.09 psu 0.3 psu
- 14 -
Wind vector over sea surface (horizontal) OOPC 10 km 20 km 100
km 1 h 3 h 24 h 3 h 5 h 12 h 0.5 m/s 1 m/s 5 m/s
Ocean dynamic topography OOPC 25 km 50 km 250 km 1 d 3 d 30 d 0.125
d0.25 d 1 d 1 cm 1.5 cm 5 cm
Sea-ice cover OOPC 12 km 25 km 100 km 1 d 2 d 7 d 0.125
d0.25 d 1 d 5 % (Max) 6 % (Max) 10 % (Max)
Ocean salinity - Deep-ocean OOPC 50 km 60 km 100 km 2 2.5 4 30 d 70 d 360 d 60 d 110 d 360
d 0.002 psu 0.003 psu 0.005 psu
Sea-ice thickness OOPC 100 km 170 km 500
km 1 d 2 d 7 d 1 d 3 d 24 d 0.1 cm 0.2 cm 1 cm
Coastal sea level change OOPC 25 km 100 km 1000 km 24 h 50 h 240 h 1 h 3 h 24 h 1 cm 2 cm 10 cm
Ocean temperature - Upper-ocean OOPC 1 km 6 km 300 km 1 m 2 m 10 m 1 d 2 d 10 d 0.5 h 0.6 h 1 h 0.001 K 0.002 K 0.01 K
Wind speed over sea surface (horizontal) OOPC 10 km 40 km 500
km 1 h 3 h 24 h 1 h 2 h 12 h 0.5 m/s 0.6 m/s 1 m/s
Ocean carbon content change OOPC 50 km 60 km 100 km 10 13 20 5 y 6 y 10 y 1 y 1.3 y 2 y 0.5
DIC/µmol/kg0.6 DIC/µmol/kg
1 DIC/µmol/kg
Ocean temperature - Deep-ocean OOPC 50 km 60 km 100 km 2 2.5 4 30 d 150
d3600 d 60 d 110 d 360
d 0.002 K 0.003 K 0.005 K
Sea surface temperature OOPC 1 km 8 km 500 km 1 h 3 h 24 h 3 h 5 h 12 h 0.1 K 0.126 K 0.2 K
- 15 -
Ice-sheet topography TOPC 0.01 km
0.015 km
0.05 km 1 y 2 y 10 y 360 d 450 d 720
d 10 cm (vert.) 15 cm (vert.) 20 cm (vert.)
Snow cover TOPC 0.1 km 0.45 km 10 km 24 h 75 h 720 h 30 h 70 h 360
h 5 % (Max) 7 % (Max) 10 % (Max)
Albedo TOPC 1 km 2 km 10 km 1 d 3 d 30 d 30 d 45 d 90 d 5 % (Max) 7 % (Max) 10 % (Max)
Table 1: Observational Requirements (Climate)
- 16 -
Ocean measurement related global Numerical Weather Prediction (NWP) requirements
Each requirement is expressed in terms of Horizontal Resolution, Vertical Resolution, Observing Cycle, Delay of Availability and Accuracywith each parameter described in terms of Goal, Breakthrough (B/T) and Threshold (T/H).
Horizontal Resolution
Vertical Resolution Observing Cycle Delay of
Availability Accuracy
Requirement Application area Goal B/T T/H Goal B/T T/H Goal B/T T/H Goal B/T T/H Goal B/T T/H
Precipitation rate (solid) at the surface Global NWP 5 km 15 km 50 km 1 h 3 h 12 h 0.1 h 0.5 h 6 h 0.1 mm/h 0.5 mm/h 1 mm/h
Long-wave Earth surface emissivity Global NWP 5 km 15 km 50 km 24 h 120 h
720 h 24 h 120 h 720 h 0.5 %
(Max) 1 % (Max) 3 % (Max)
Sea-ice surface temperature Global NWP 5 km 15 km 250 km 1 h 3 h 12 h 0.1 h 0.5 h 6 h 0.5 K 1 K 4 K
Air specific humidity (at surface) Global NWP 15 km 50 km 250 km 1 h 3 h 12 h 0.1 h 0.5 h 6 h 2 % 5 % 10 %
Wind vector over sea surface (horizontal) Global NWP 15 km 100 km
250 km 1 h 6 h 12 h 0.1 h 0.5 h 6 h 0.5 m/s 2 m/s 3 m/s
Precipitation rate (liquid) at the surface Global NWP 5 km 15 km 50 km 1 h 3 h 12 h 0.1 h 0.5 h 6 h 0.1 mm/h 0.5 mm/h 1 mm/h
Wind speed over sea surface (horizontal) Global NWP 15 km 100 km
250 km 1 h 6 h 12 h 0.1 h 0.5 h 6 h 0.5 m/s 1.5 m/s 2 m/s
Air temperature (at surface) Global NWP 15 km 50 km 250 km 1 h 6 h 12 h 0.1 h 0.5 h 6 h 0.5 K 1 K 2 K
- 17 -
Air pressure over sea surface Global NWP 15 km 100 km
500 km 1 h 6 h 12 h 0.1 h 0.5 h 6 h 0.5 hPa 0.99 hPa 1 hPa
Sea surface temperature Global NWP 5 km 15 km 250 km 3 h 24 h 120
h 3 h 24 h 120 h 0.3 K 0.5 K 1 K
Dominant wave period Global NWP 15 km 50 km 250 km 1 h 3 h 12 h 0.1 h 0.5 h 6 h 0.25 s 0.5 s 1 s
Short-wave Earth surface bi-directional reflectance Global NWP 10 km 30 km 100
km 1 h 3 h 12 h 24 h 120 h 720 h 1 % (Max) 2 % (Max) 5 % (Max)
Downwelling short-wave radiation at the Earth surface Global NWP 10 km 30 km 100
km 1 h 3 h 12 h 24 h 120 h 720 h 1 W/m2 10 W/m2 20 W/m2
Outgoing long-wave Earth surface Global NWP 10 km 30 km 100 km 1 h 3 h 12 h 24 h 120 h 720 h 1 W/m2 10 W/m2 20 W/m2
Downwelling long-wave radiation at the Earth surface Global NWP 10 km 30 km 100
km 1 h 3 h 12 h 24 h 120 h 720 h 1 W/m2 10 W/m2 20 W/m2
Sea-ice thickness Global NWP 15 km 50 km 250 km 1 d 5 d 30 d 1 d 5 d 30 d 20 cm 50 cm 100 cm
Snow cover Global NWP 5 km 15 km 100 km 3 h 24 h 120
h 3 h 24 h 120 h 10 % (Max)
20 % (Max)
50 % (Max)
Significant wave height Global NWP 15 km 50 km 250 km 1 h 3 h 12 h 0.1 h 0.5 h 6 h 0.1 m 0.3 m 0.5 m
Dominant wave direction Global NWP 15 km 50 km 250 km 1 h 3 h 12 h 0.1 h 0.5 h 6 h 10 degrees 15
degrees30 degrees
- 18 -
Snow water equivalent Global NWP 5 km 15 km 100 km 3 h 24 h 120
h 3 h 24 h 120 h 2 mm 10 mm 20 mm
Sea-ice cover Global NWP 5 km 15 km 100 km
0.125 d 1 d 5 d 0.125 d 1 d 5 d 5 % (Max) 10 %
(Max)20 % (Max)
Sea-ice type Global NWP 10 km 25 km 100 km
0.125 d 1 d 5 d 0.125 d 1 d 5 d 4 classes 3 classes 2 classes
Precipitation index (daily cumulative) Global NWP 10 km 30 km 100 km 1 h 3 h 12 h 24 h 120 h 720 h 0.5 mm/d 2 mm/d 5 mm/d
Table 2: Observational Requirements (Global NWP)
- 19 -
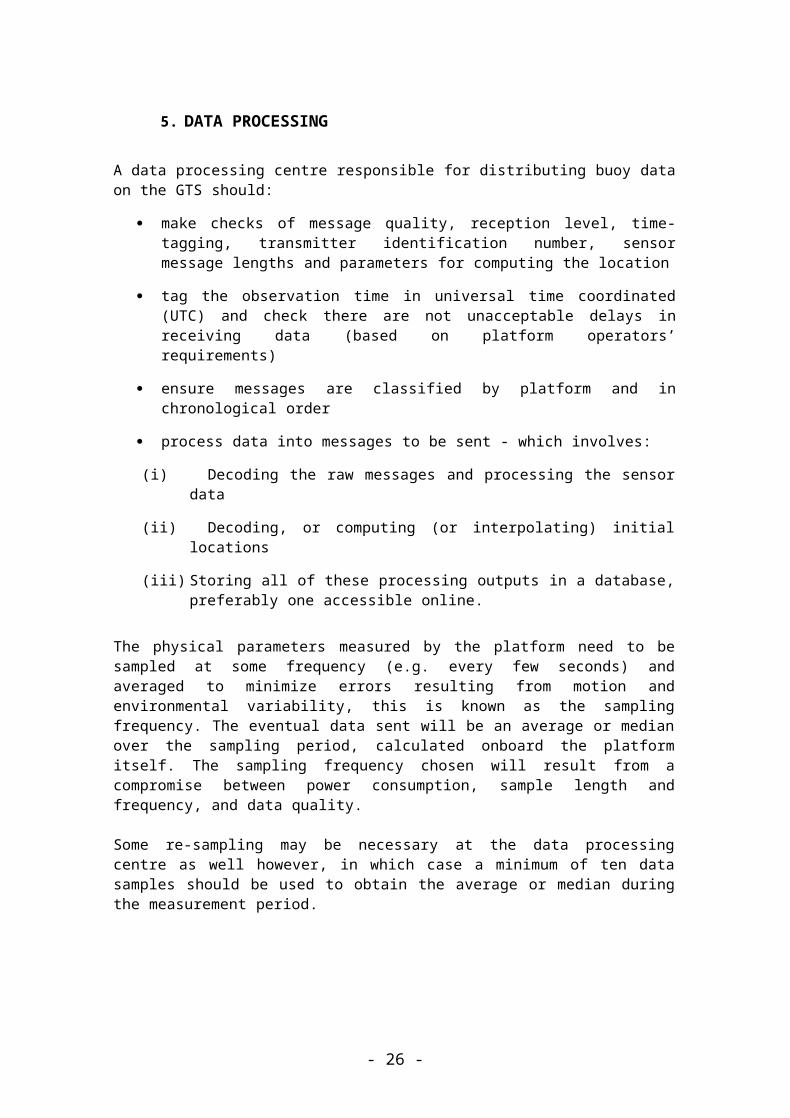
5. DATA PROCESSING
A data processing centre responsible for distributing buoy data on the GTS should:
make checks of message quality, reception level, time-tagging, transmitter identification number, sensor message lengths and parameters for computing the location
tag the observation time in universal time coordinated (UTC) and check there are not unacceptable delays in receiving data (based on platform operators’ requirements)
ensure messages are classified by platform and in chronological order
process data into messages to be sent - which involves:
(i) Decoding the raw messages and processing the sensor data
(ii) Decoding, or computing (or interpolating) initial locations
(iii) Storing all of these processing outputs in a database, preferably one accessible online.
The physical parameters measured by the platform need to be sampled at some frequency (e.g. every few seconds) and averaged to minimize errors resulting from motion and environmental variability, this is known as the sampling frequency. The eventual data sent will be an average or median over the sampling period, calculated onboard the platform itself. The sampling frequency chosen will result from a compromise between power consumption, sample length and frequency, and data quality.
Some re-sampling may be necessary at the data processing centre as well however, in which case a minimum of ten data samples should be used to obtain the average or median during the measurement period.
- 20 -
6. Real Time Quality Control Checks
Automatic Quality Control checks should be made to prevent bad or highly suspicious data going onto the GTS. Different tests may apply to different platforms or sensors, depending on platform operator requirements and the nature of the data collected.
The full suite of tests that should be available at a data processing centre disseminating data on the GTS, are as follows:
6.1.Tests made for the whole observation
These tests are defined at the platform level.
6.1.1. Managing duplicate times of observation
To avoid producing duplicates, or quasi duplicates (very close observation times) two possible solutions are available:
Customisable rounding times should be defined for every observation from all sensors. Setting a “duplicate tolerance”, in the order of seconds. If two observations from one
platform are within the indicated value for "duplicate tolerance", then only the first processed observation is distributed on GTS. By default, the duplicate tolerance should be set to zero which means that all observations are accepted. This field is defined at the platform level.
6.1.2. Location
GTS distribution of the buoy location is required. There should be checks in place to isolate incorrect or empty locations so that they are not issued as final observation locations. Locations such as (0,0) should be suppressed as well as (±180, ±90) or (0, ±90) or (±180, 0) and the previous good location used instead - provided it’s not too old (i.e. for oceanographic purposes error should not exceed 500m taking the estimated maximum speed of the buoy into account). This applies to all telecommunications systems, and even when a buoy has a GPS onboard.
In addition, the following procedures are applied:(a) Only the location with the highest probability of being correct is transmitted (i.e. the
best location class);(b) When location processing is not performed during a satellite pass, the last known
location is provided;(c) For drifting buoys, data with a location more than 48 hours old are not transmitted via
the GTS.(d) For moored buoys, data with a location more than the age of the buoy since its
deployment (or re-deployment) are not transmitted via the GTS.(e) For buoys using Iridium, with a GPS on-board, it is feasible to use an Iridium position
if the GPS fails, but the Iridium location quality is not good enough for oceanographic purposes and must be flagged as such.
Location quality class or index must be checked against acceptable limits provided by the platform operator. For oceanographic purposes, the location error should never exceed 500m in any direction; and 10km for meteorological purposes. The DBCP recommends encoding the location quality class as part of the GTS report.
6.1.3. Multiplexing error (sending one observation in several messages)
- 21 -
This test rejects data when the defined format has not been recognized. This would occur if the case where one complete observation is sent through the satellite data telecommunications system over several messages using different formats (due to limited capacity of the telecommunications system). In most cases this test is not required where Iridium telecommunications or Argos 3 is in use, as the length of the message is large enough to avoid this problem.
6.1.4. Land/Sea test
Checks whether the buoy is at sea using (at least) a 1°x1° resolution file. If the platform appears to be on land then the observation is rejected. Another method for drifting buoys, is to test if a buoy is beached, by calculating its velocity since the previous message and where it is not moving, reject the data.
6.1.5. Temperature and/or Salinity profile Spike test
This test was initially introduced for the Argo programme. The test should fail if a data point (Depth, Temp. and/or Sal.) value departs too much from nearby points after the profile was ordered by decreasing depth (i.e. towards surface). The test is only applied to WATER TEMPERATURE (PROBE) and WATER SALINITY types of sensors. In case the temperature sensor values or salinity sensor values alone fail the test, then values from that sensor should not be used in real-time. If they both fail the test then the whole data point (Depth, Temp., Sal.) is rejected. The first and the last data point from the profile do not go through this test. See the Argo quality control manual for further details.
6.1.6. Temperature and/or Salinity profile Gradient test
This test was initially introduced for the Argo programme. The result is considered bad in the case that the temperature or salinity gradient is too high once the profile is ordered by decreasing values of depth (i.e. towards sea surface). This test is made only for WATER TEMPERATURE (PROBE) and WATER SALINITY types of sensor. For a Temperature/Salinity profile, in case the temperature values are rejected then the whole data point (Depth, Temp., Sal.) is rejected. The first and the last data point from the profile will not go through this test. See the Argo quality control manual for details (references in Annex I).
6.1.7. Temperature and/or Salinity profile Stuck value test
This test was initially introduced for the Argo programme. This test should fail in the case where all values for the same type of sensor are identical along the profile. This test is only applied to WATER TEMPERATURE (PROBE) and WATER SALINITY types of sensor. In case the temperature sensor values are rejected then whole data point (Depth, Temp., Sal.) is rejected. See the Argo quality control manual for details (references in Annex I).
6.1.8. Temperature and/or Salinity profile Density test
This test was initially introduced for the Argo programme. This test should fail in the case where water density decreases with increasing depth. In order to compute test result, potential temperature and density anomaly must be computed first for all profile data points after the points have been sorted out by decreasing depth (i.e. towards sea surface). Test is only applied to WATER TEMPERATURE (PROBE) and WATER SALINITY types of sensor.
- 22 -

All profile data points (Depth, Temp., Sal.) are rejected if this test fails. The first and last data points do not go through this test. See the Argo quality control manual for details (references in Annex I).
6.1.9. Computation of salinity based upon conductivity, temperature, and depth
This test applies to buoys measuring surface salinity and/or salinity at depth (e.g. the TAO/TRITON, PIRATA and RAMA moored buoy arrays).Where salinity is computed based upon water conductivity (C), temperature (T), and depth (D) values the computation should follow platform operator specifications. Alternatively, to compute salinity prior to GTS encoding and distribution the following documents give advice:
EOS-80 “Practical Salinity Scale 1978 and International Equation of State of Seawater 1980” and uses computed values of C, T, and D,.
In June 2009 experts attending the 25th Assembly of UNESCO's Intergovernmental Oceanographic Commission (IOC) in Paris recommended through Resolution 7 to adopt the International Thermodynamic Equation of Seawater (TEOS-10) formulation that has been developed and recommended by the IAPSO/SCOR WG-127 to replace the existing EOS-80, as presented in the TEOS-10 Manual (see Annex I for references).
- 23 -
6.2.Tests made for each individual sensor
These tests are defined at the sensor level. These checks are optional, depending on the operator’s requirement, but should be available at all data processing centres.
6.2.1. Gross Error Check
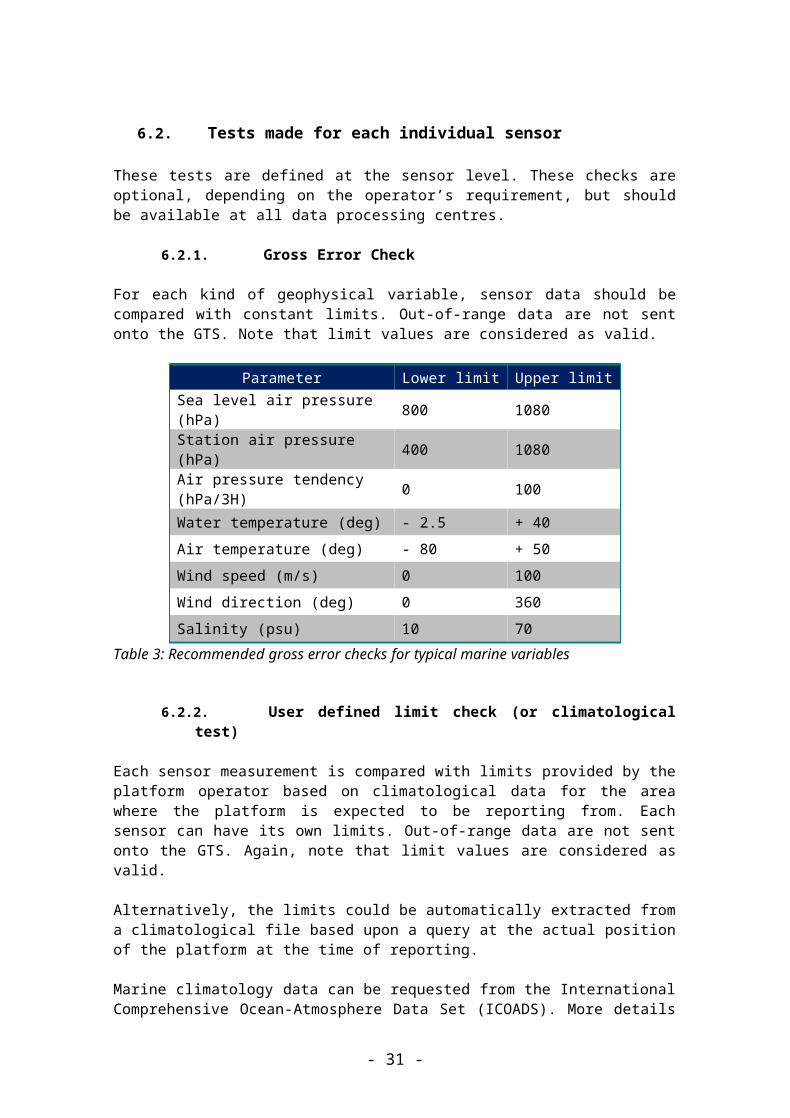
For each kind of geophysical variable, sensor data should be compared with constant limits. Out-of-range data are not sent onto the GTS. Note that limit values are considered as valid.
Parameter Lower limit Upper limit
Sea level air pressure (hPa) 800 1080
Station air pressure (hPa) 400 1080
Air pressure tendency (hPa/3H) 0 100
Water temperature (deg) - 2.5 + 40
Air temperature (deg) - 80 + 50
Wind speed (m/s) 0 100
Wind direction (deg) 0 360
Salinity (psu) 10 70
Table 3: Recommended gross error checks for typical marine variables
6.2.2. User defined limit check (or climatological test)
Each sensor measurement is compared with limits provided by the platform operator based on climatological data for the area where the platform is expected to be reporting from. Each sensor can have its own limits. Out-of-range data are not sent onto the GTS. Again, note that limit values are considered as valid.
Alternatively, the limits could be automatically extracted from a climatological file based upon a query at the actual position of the platform at the time of reporting.
Marine climatology data can be requested from the International Comprehensive Ocean-Atmosphere Data Set (ICOADS). More details on ICOADS and how to access the data on its web site are available at: http://icoads.noaa.gov/products.html.
NOTE: Wind speed values which exceed 99 units (knots or m/s, as requested) and can be expressed in BUOY code (e.g. 99 knots) will be transmitted as 99.
6.2.3. Checksums, CRCs
Checksum, or Cyclic Redundancy Checks (CRC, e.g. Hamming code) permit the validation of the transmission link between the platform, the satellite and the ground station. A bad checksum or CRC usually indicates that one or more bits in a string of contiguous bits from the data in the message were corrupted. This test relies on the platform software computing the sum (or CRC) using some of the contiguous binary words in the message and encoding it into the message. Ideally, when the
- 24 -
processing centre receives and processes the messages, it should recalculate the same sum (or CRC) and compare it with the sum (or CRC) in the platform message. If the sums (or CRCs) then do not match, the part of the message in which the sum (or CRC) was computed would be rejected: as there were apparently one or more bit errors during transmission. The system would not then send the data onto the GTS.
This test is not necessary when Iridium telecommunications are in use as the system automatically checks that the data received is exactly as transmitted by the station.
Note: If the checksum is unavailable or if the platform’s message format does not provide one, the GTS processing centre should be using compression index test as detailed below if appropriate.
6.2.4. Compression Index
When transmission of identical raw messages is repeated for a satellite data transmission (e.g. as is the case when using Argos-2), this duplication can be utilised to detect messages or part of messages that are free of bit errors. If messages are not repeated then checksums or CRCs should be used.
If a checksum (or CRC) is available and indicates that there are probably no bit errors then the compression index test can be ignored. This test is therefore not necessary when Iridium telecommunications are in use.
6.2.4.1. Compression by message (CIM)
The Compression Index by Message (CIM) is defined as the number of identical messages received from the platform during a given time slot; typically a satellite pass over the platform. Only raw messages with CIM ≥ 2 are kept for further decoding and data processing.For the transmission period considered (typically a satellite pass over a platform), the operator should be able to choose between the following options:
(i) Keep only the raw message with the highest compression index for further decoding and data processing. CIS as described below is forced to the value of CIM.
or(ii) Keep all the messages so that full sensor compression (CIS) can be
applied (see below).
6.2.4.2. Compression by sensor (CIS)
Similarly, the Compression Index by Sensor (CIS) is defined as the number of identical binary words (a binary word representing a sensor value measured at the same time, and at the same depth, and always coded in the same position in the raw message) from a set of raw messages received from the platform during a given time slot; typically a satellite pass over the platform.The sensor measurements with the highest CIS are stored and sent onto the GTS. Only raw messages with CIS ≥ 2 are distributed on GTS.
It is important to note that, at present as an example, the Argos software requires verification in the form of at least two identical sensor values (not necessarily consecutive; in addition, whole Argos messages don't have to be identical) from a platform during a satellite pass before those observations will be put on the GTS (unless other techniques such as checksums are used). This is conveniently achieved by averaging the sensor data for a few minutes prior to transmission.
- 25 -
6.2.5. Level rejected by QC
If a level is associated with a sensor (i.e. a depth or a height), and that level is also encoded in the raw satellite message, the level will first be treated as a normal sensor measurement and quality control checks applied. If the level fails quality control checks, then all the sensor measurements making reference to this level should also be rejected (e.g. a water temperature measurement would be rejected if its corresponding depth – also coded in the raw satellite message – has failed the QC tests).
6.2.6. All bits identical test
If appropriate, a data stream from a platform should be automatically removed from GTS distribution if all the bits in the sensor word are ones or zeros. This needs to be a setting for each platform (this is generally not applied to Wind Speed, Wind Direction or Air Pressure Tendency) and should be performed no matter which telecommunications system is in use. This assumes that the platform operator agrees to data being automatically withheld from the GTS.
6.2.7. Sensor blockage test
If the reported sensor data have the same value consecutively, a certain number of times during a user-definable period or number of identical values, then data should be automatically removed from GTS distribution. This test is usually applied to all Air Pressure sensors.
6.2.8. Bad associated compensating sensor
If a compensating sensor is associated to a sensor (e.g. air pressure sensor compensated using a temperature sensor), and that compensating sensor is also encoded in the raw satellite message, the compensating sensor will first be treated as a normal sensor and appropriate quality control checks applied. If the compensating sensor fails quality control checks then all the sensors making reference to this compensating sensor should also be rejected (e.g. air pressure will be rejected if its compensating temperature sensor – also coded in the raw satellite message – has failed the QC tests).
- 26 -
7. ON-LINE ACCESS TO DATA
There are various ways to view data coming from a buoy platform at various stages in the data stream.
7.1.Satellite Telecommunications Service provider
It is expected that all data processing centres would provide a way for platform operators to view their own data (and perhaps copies of other operators’ data) online.
7.2.Over the Global Telecommunication System (GTS)
Real time access to GTS buoy data requires the data user to be connected in some way (generally via a National Meteorological or Hydrological Service) to a GTS downlink node.Data processing centres should encourage buoy operators to share all data on the GTS or at least Sea Surface Temperature and Air Pressure measurements. For more information about the benefits of sharing data see the reference in Annex 1.
7.3. Data Archival Centres
Alternatively data can be accessed via global data archives and data centres, for example:
- Integrated Science Data Management (ISDM), Canada:http://www.meds-sdmm.dfo-mpo.gc.ca
- US Natioanl Oceanographic Data Center http://www.nodc.noaa.gov
- International Oceanographic Data and Information Exchange (IODE) Ocean Data Portal (ODP): http://www.oceandataportal.org/
- CORIOLIS France http://www.coriolis.eu.org
- Global Temperature-Salinity Profile Program http://www.nodc.noaa.gov/GTSPP/gtspp-home.htm l
- The Global Drifter Programme (GDP) Data Assembly Centre operated by the NOAA Atlantic Oceanographic and Meteorological Laboratory (AOML): http://www.aoml.noaa.gov/phod/dac/dacdata.html
- Tropical Moored Buoy array data: http://www.pmel.noaa.gov/tao/
- NOAA National Oceanographic Data Centre, USA: http:// www.nodc.noaa.gov
8. DELAYED MODE QUALITY CONTROL GUIDELINES
8.1. DBCP QC Guidelines
The primary responsibility for data quality control lies with the owner of the platform from which the observation originates. In many cases this will be a national meteorological service, an oceanographic institute or a principle investigator for a particular research project (In this
- 27 -
last case often acting on behalf of the legal owner). It is especially important that data entered on the GTS in real-time are automatically quality controlled by, or on behalf of, the originator of the observation, as detailed in the paragraphs above. To detect errors which may escape national quality control systems and errors introduced subsequently, national meteorological services should ensure that Regional Meteorological Centres (RMCs) and World Meteorological Centres (WMCs) also carry out appropriate quality control of observational data they receive.
Delayed Mode Quality Control Guidelines were implemented by the DBCP in January 1992 (see Annex IV for details).
Quality control procedures, jointly developed and implemented by the DBCP, GTS Data Processing centres and the buoy operators, currently ensure that surface observations are validated in real-time before insertion on to the GTS (as in this document) and the poor quality data is removed from the GTS as soon as it is identified. Sub-surface and Moored Buoy (e.g. from the Tropical Moored Buoy array) data are further controlled by NOAA / NDBC. Several other bodies (ECMWF, national weather and oceanographic agencies – especially the UK Met Office, Meteo-France, Australian Burean of Meteorology, New Zealand Metservice, ISDM, etc.) contribute to regular and ad-hoc assessment of data quality.
There is a web tool used to log Quality Control issues or questions at: http://wo.jcommops.org/cgi-bin/WebObjects/QCRelay
A login and password is available from JCOMMOPS (support jcommops.org)
Principal Meteorological or Oceanographic Centres (PMOC) responsible for Quality Control of GTS buoy data (i.e. mainly meteorological centres assimilating the data in NWP models) detect any buoys reporting erroneous or biased data onto the GTS (e.g. by making statistical comparisons with the model analysis and/or first guess background field). Hence, PMOCs are in a position to regularly propose changes to the functional status of data buoys (e.g. withholding data from a particular buoy or sensor from GTS distribution, or recalibrating a biased sensor) via an online or email-based system. These proposed changes are sent to cooperating individuals and relevant services in charge of the buoy operations and data distribution, which will then decide how to resolve the issues. The QC Guidelines considerably shorten the time needed to fix problems.
The following centres are presently contributing to the DBCP Quality Control Guidelines:- The United Kingdom Met Office,- Météo France and E-SURFMAR participants- The Australian Bureau of Meteorology (BOM),- The European Centre for Medium-Range Weather Forecasts (ECMWF),- The Meteorological Service of New Zealand, Ltd. (MSNZ),- The USA, NOAA
National Data Buoy Centre (NDBC), and the National Centre for Environmental Prediction (NCEP)
- GHRSST Scientific Steering Team members.
A well-defined (see Annex IV) feedback mechanism ensures that any interventions arising from this off-line quality control (e.g., modifications to individual sensor transfer functions) are implemented into the real-time data processing chain in a coordinated and auditable fashion. Some history of the mechanism is given in Annex IV.
- 28 -
This process relies upon a close relationship between the data processing centre and the buoy platform operator or principal investigator, and responsive technical support staff within the data processing centre.
The Panel will encourage the users of other satellite communications channels and observing systems to benefit from its experience in this regard, with a view to avoiding the many quality pitfalls that beset the acceptance of early drifting buoy data by the operational community.
8.2. DBCP QC Guidelines distribution list (mailing list)
Quality Control feedback for buoys is sent to the address below.
dbcp-qc jcommops.orgTo register on this email address please contact JCOMMOPS, support jcommops.org.
Once registered on the mailing list, you will automatically receive any message posted by members of the mailing list.
To provide quality control feedback it is possible to post messages onto the mailing list, simply be sending an email to the list address. (Not e that the address was updated in February 2009)
- 29 -
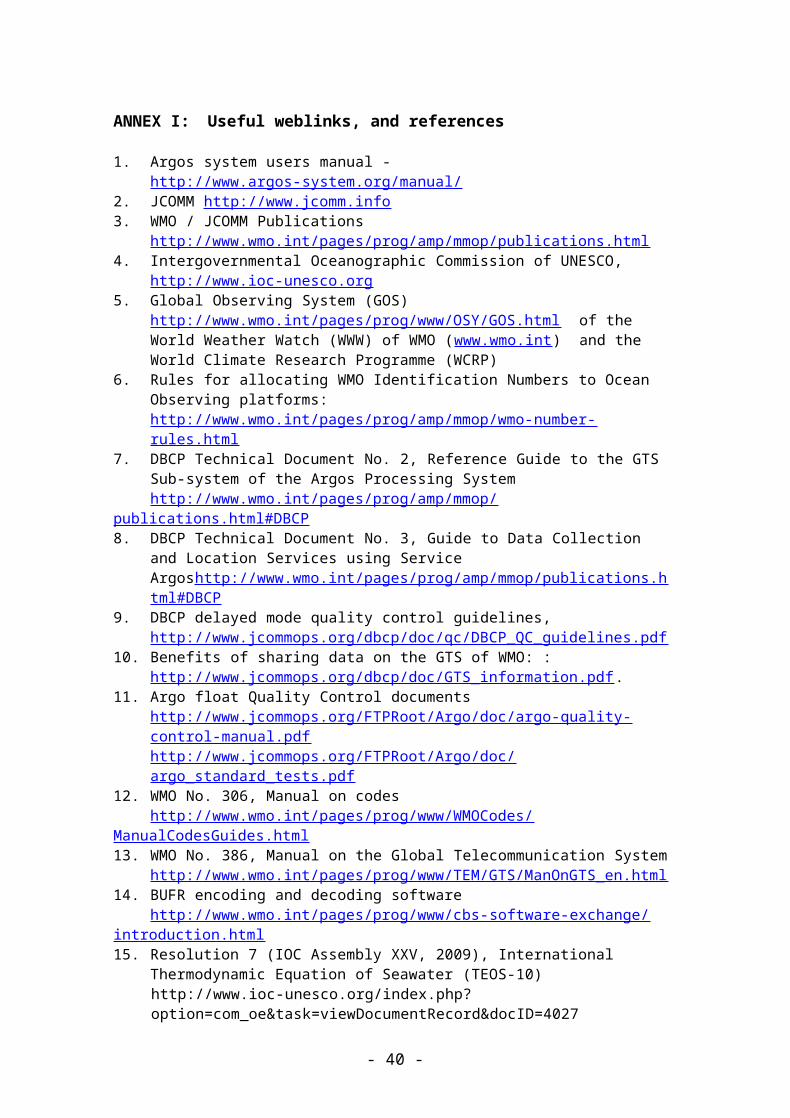
ANNEX I: Useful weblinks, and references
1. Argos system users manual - http://www.argos-system.org/manual/ 2. JCOMM http://www.jcomm.info 3. WMO / JCOMM Publications
http://www.wmo.int/pages/prog/amp/mmop/publications.html 4. Intergovernmental Oceanographic Commission of UNESCO, http://www.ioc-unesco.org 5. Global Observing System (GOS) http://www.wmo.int/pages/prog/www/OSY/GOS.html
of the World Weather Watch (WWW) of WMO (www.wmo.int) and the World Climate Research Programme (WCRP)
6. Rules for allocating WMO Identification Numbers to Ocean Observing platforms: http://www.wmo.int/pages/prog/amp/mmop/wmo-number-rules.html
7. DBCP Technical Document No. 2, Reference Guide to the GTS Sub-system of the Argos Processing Systemhttp://www.wmo.int/pages/prog/amp/mmop/publications.html#DBCP
8. DBCP Technical Document No. 3, Guide to Data Collection and Location Services using Service Argoshttp://www.wmo.int/pages/prog/amp/mmop/publications.html#DBCP
9. DBCP delayed mode quality control guidelines, http://www.jcommops.org/dbcp/doc/qc/DBCP_QC_guidelines.pdf
10. Benefits of sharing data on the GTS of WMO: : http://www.jcommops.org/dbcp/doc/GTS_information.pdf.
11. Argo float Quality Control documentshttp://www.jcommops.org/FTPRoot/Argo/doc/argo-quality-control-manual.pdfhttp://www.jcommops.org/FTPRoot/Argo/doc/argo_standard_tests.pdf
12. WMO No. 306, Manual on codeshttp://www.wmo.int/pages/prog/www/WMOCodes/ManualCodesGuides.html
13. WMO No. 386, Manual on the Global Telecommunication Systemhttp://www.wmo.int/pages/prog/www/TEM/GTS/ManOnGTS_en.html
14. BUFR encoding and decoding softwarehttp://www.wmo.int/pages/prog/www/cbs-software-exchange/introduction.html
15. Resolution 7 (IOC Assembly XXV, 2009), International Thermodynamic Equation of Seawater (TEOS-10)http://www.ioc-unesco.org/index.php?option=com_oe&task=viewDocumentRecord&docID=4027Calculation of the thermodynamic properties of sea water, McDougall et al, 8 Feb 2009:http://www.ioc-unesco.org/index.php?option=com_oe&task=viewDocumentRecord&docID=3938
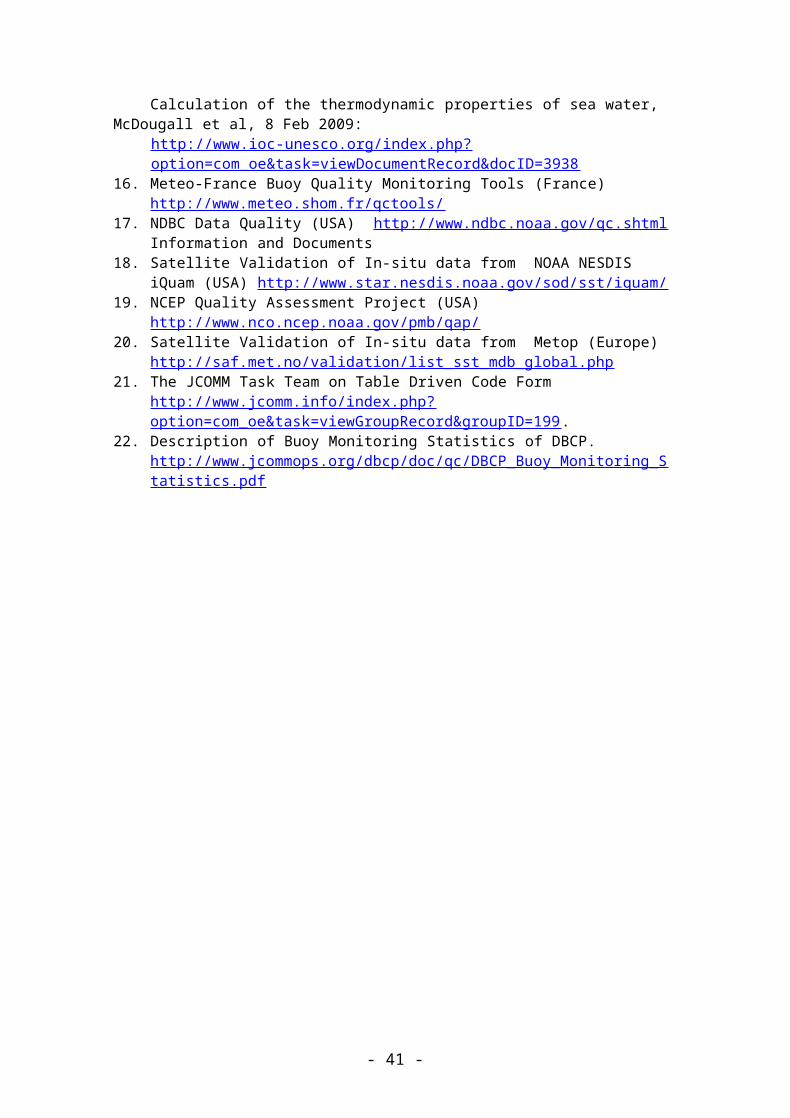
16. Meteo-France Buoy Quality Monitoring Tools (France) http://www.meteo.shom.fr/qctools/
17. NDBC Data Quality (USA) http://www.ndbc.noaa.gov/qc.shtml Information and Documents
18. Satellite Validation of In-situ data from NOAA NESDIS iQuam (USA) http://www.star.nesdis.noaa.gov/sod/sst/iquam/
19. NCEP Quality Assessment Project (USA) http://www.nco.ncep.noaa.gov/pmb/qap/20. Satellite Validation of In-situ data from Metop (Europe)
http://saf.met.no/validation/list_sst_mdb_global.php21. The JCOMM Task Team on Table Driven Code Form
http://www.jcomm.info/index.php?option=com_oe&task=viewGroupRecord&groupID=199.
22. Description of Buoy Monitoring Statistics of DBCP. http://www.jcommops.org/dbcp/doc/qc/DBCP_Buoy_Monitoring_Statistics.pdf
- 30 -
- 31 -
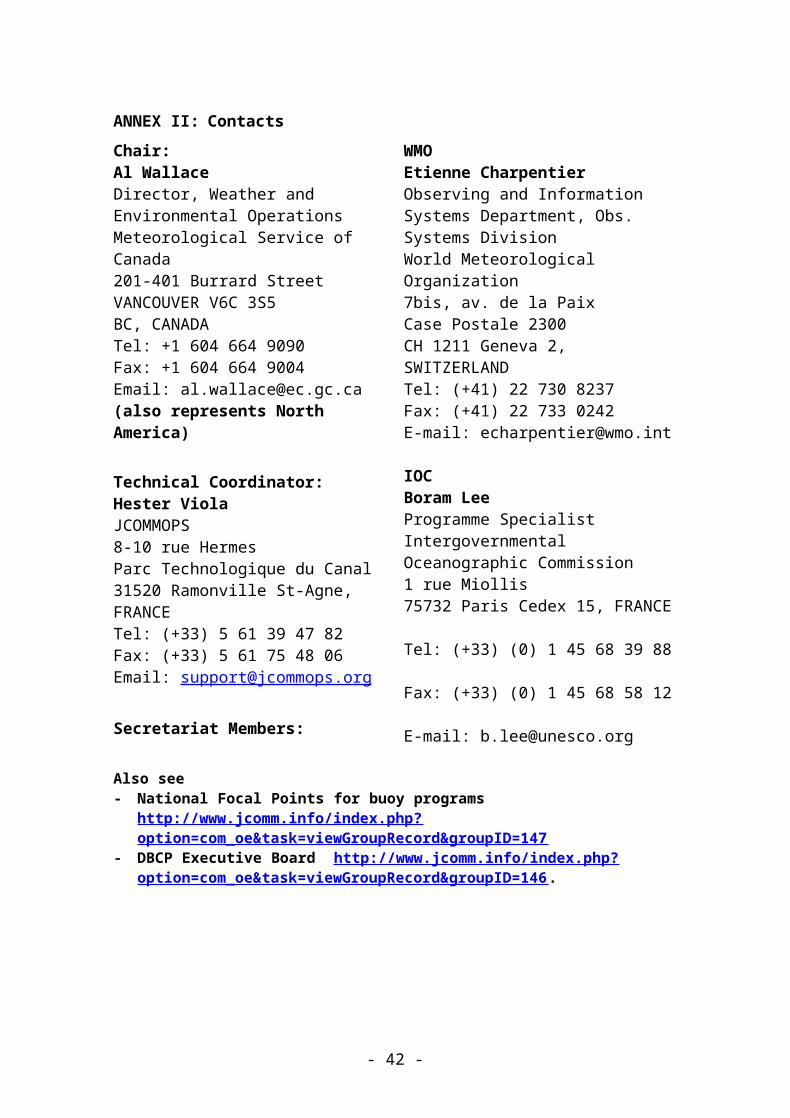
ANNEX II: Contacts Chair: Al Wallace Director, Weather and Environmental Operations Meteorological Service of Canada201-401 Burrard StreetVANCOUVER V6C 3S5BC, CANADATel: +1 604 664 9090Fax: +1 604 664 9004Email: [email protected] (also represents North America)
Technical Coordinator: Hester ViolaJCOMMOPS8-10 rue HermesParc Technologique du Canal31520 Ramonville St-Agne, FRANCETel: (+33) 5 61 39 47 82Fax: (+33) 5 61 75 48 06Email: [email protected]
Secretariat Members: WMOEtienne CharpentierObserving and Information Systems Department, Obs. Systems DivisionWorld Meteorological Organization7bis, av. de la PaixCase Postale 2300CH 1211 Geneva 2, SWITZERLANDTel: (+41) 22 730 8237Fax: (+41) 22 733 0242E-mail: [email protected]
IOCBoram LeeProgramme SpecialistIntergovernmental Oceanographic Commission1 rue Miollis75732 Paris Cedex 15, FRANCE Tel: (+33) (0) 1 45 68 39 88 Fax: (+33) (0) 1 45 68 58 12 E-mail: [email protected]
Also see - National Focal Points for buoy programs http://www.jcomm.info/index.php?
option=com_oe&task=viewGroupRecord&groupID=147- DBCP Executive Board http://www.jcomm.info/index.php?
option=com_oe&task=viewGroupRecord&groupID=146.
- 32 -
ANNEX III: Acronyms
ACRONYM LIST ABE-LOS IOC Advisory Body on the Law of the Sea ADOS Autonomous Drifting Ocean Station ADS Automatic Distribution System (Argos) AG DBCP Action Groups AIC Argo Information Centre ALD Appointment of Limited Duration AMDAR Aircraft Meteorological Data Relay (WWW) ANIMATE Atlantic Network of Interdisciplinary Moorings and Time-series for Europe AOML NOAA Atlantic Oceanographic and Meteorological Laboratory (USA) Argo Argo Profiling Float Pilot Project AST Argo Steering Team ATF Acoustic Tank Facility BOM Bureau of Meteorology (Australia) BPPT Agency for the Assessment and Application of Technology (Indonesia) BUFR Binary Universal Form for Representation of meteorological data CB Capacity Building CBS Commission for Basic Systems (WMO) CIS Central Irminger Sea CLIMOD E CLIVAR Mode Water Dynamics Experiment CLIVAR Climate Variability and Predictability (WCRP) CLS Collecte Localisation Satellites (France) CNES Centre national d'études spatiales (France) CORC Consortium on the Oceans Role in Climate DAMOCLES Developing Arctic Modelling and Observing Capabilities for Long-term Environmental Studies (European joint project) DAR Data Discovery, Access and Retrieval service (WMO WIS) DART Deep-ocean Assessment and Reporting of Tsunami (buoy) DBCP Data Buoy Co-operation Panel (WMO-IOC) DB-TAG E-SURFMAR Data Buoy Technical Advisory Group DCPC Data Collection and Production Centres (WMO WIS) DCS Data Collection System DMCG Data Management Coordination Group (JCOMM) DPM Natural Disaster Prevention and Mitigation Programme (WMO) E2EDM End-to-End Data Management (JCOMM Pilot Project) EB DBCP Executive Board EBD Equivalent Buoy Density ECMWF European Centre for Medium-Range Weather Forecasts EEZ Exclusive Economic Zone EMC NOAA’s Environmental Modelling Centre (USA) ER Expected Result E-SURFMAR Surface Marine programme of the Network of European Meteorological Services, EUMETNET ET/AWS CBS/IOS Expert Team on Requirements for Data from Automatic Weather Stations (WMO) ET/DRC CBS Expert Team on Data Representation and Codes (WMO) ET/EGOS CBS/IOS Expert Team on the Evolution of the Global Observing System (WMO) ETDMP Expert Team on Data Management Practices (JCOMM) ETMC Expert Team on Marine Climatology (JCOMM)
- 33 -
ETSI Expert Team on Sea Ice (JCOMM) ETWS Expert Team on Wind Waves and Storm Surge (JCOMM) EUCOS EUMETNET Composite Observing System EUMETNET Network of European Meteorological Services EUMETSAT European Organization for the Exploitation of Meteorological Satellites EuroSITES European integrated network of open ocean multidisciplinary observatories GCOS Global Climate Observing System GDAC Global Data Access Centre GDP Global Drifter Programme GEO Group on Earth Observations GEOSS Global Earth Observation System of Systems GHRSST GODAE High Resolution SST Pilot Project GIS Geographical Information System GISC Global Information System Centres (WMO WIS) GLOSS Global Sea-level Observing System (JCOMM) GLOSS-GE GLOSS Group of Experts GMDSS Global Maritime Distress and Safety System (IMO) GODAE Global Ocean Data Assimilation Experiment (GOOS) GOOS Global Ocean Observing System GOSUD Global Ocean Surface Underway Data GPS Global Positioning System GSSC GOOS Scientific Steering Committee GTOS Global Terrestrial Observing System (WMO, UNESCO, FAO, UNEP, ICSU) GTS Global Telecommunication System (WWW) GTSPP Global Temperature-Salinity Pilot Project / Profile Programme HOT Hawaii Ocean Timeseries HWRF Hurricane Weather Research and Forecast model system (USA) IABP International Arctic Buoy Programme IATTC Inter-American Tropical Tuna Commission (IATTC) IBPIO International Buoy Programme for the Indian Ocean ICCAT International Commission for the Conservation of Atlantic Tuna ICG/IOTWS Intergovernmental Coordination Group for the Indian Ocean Tsunami Warning and Mitigation System (IOC) ICG/PTWS Intergovernmental Coordination Group for the Pacific Ocean Tsunami Warning and Mitigation System (IOC) ICSU International Council for Science ICTT-QMF Inter Commission Task Team on Quality Management Framework IFREMER French Research Institute for Exploitation of the Sea IGDDS Integrated Global Data Dissemination Service (satellite) I-GOOS The intergovernmental IOC-WMO-UNEP Committee for GOOS IHO International Hydrographic Organization IJPS Initial Joint Polar-Orbiting Operational Satellite System (NOAA, EUMETSAT) IMB Ice Mass Balance IMEI Iridium Unique Modem identification numberIMO International Maritime Organization INPE Instituto Nacional de Pesquisas Espaciais (Brazil) IOC Intergovernmental Oceanographic Commission (of UNESCO) IOCCP International Ocean Carbon Coordination Project IODE International Oceanographic Data and Information Exchange (IOC) IOOS Integrated Ocean Observing System (USA) IOTC Indian Ocean Tuna Commission IPAB WCRP-SCAR International Programme for Antarctic Buoys IPY International Polar Year (2007-2008) IRD Institut de recherche pour le développement (France)
- 34 -

ISABP International South Atlantic Buoy Programme ISDM Integrated Science Data Management (formerly MEDS) ISO International Organization for Standardization IT Information Technology ITP International Tsunameter Partnership JCOMM Joint WMO-IOC Technical Commission for Oceanography and Marine Meteorology JCOMMOPS JCOMM in situ Observing Platform Support Centre JCOPE Japanese Coastal Ocean Predictability Experiment JTA Joint Tariff Agreement (Argos) KEO Kuroshio extension region KMA Korea Meteorological Administration KML Keyhole Mark-up Language (GoogleEarth file format) LUT Local User Terminal (Argos) MAN JCOMM Management Committee MCSS Marine Climatological Summaries Scheme MEDS Marine Environmental Data Service (Canada, now ISDM) MERSEA Marine Environment and Security for the European Area META-T Pilot Project for the Collection of Real-time Metadata regarding Sea Surface Temperature and Water Temperature Profile data (JCOMM) METOP Meteorological Operational satellites of the EUMETSAT Polar System (EPS) MFS Mediterranean ocean Forecasting System MOU Memorandum of Understanding MSS Maritime Safety Services NAVOCEANO Naval Oceanographic Office (USA) NC National Centres (WMO WIS) NCDC NOAA’s National Climate Data Centre (USA) NCEP NOAA National Centre for Environmental Prediction (USA) NDBC NOAA National Data Buoy Centre (USA) NESDIS NOAA National Environmental Satellite Data and Information Service (USA) NFRDI National Fisheries Research and Development Institute NIOT National Institute of Ocean Technology (India) NMDIS National Marine Data and Information Service (China) NMHS National Meteorological and Hydrological Service NOAA National Oceanic and Atmospheric Administration (USA) NOCS National Oceanography Centre Southampton (UK) NORI National Oceanographic Research Institute (Rep. Korea) NPDBAP North Pacific Data Buoy Advisory Panel NPOESS National Polar-orbiting Operational Environmental Satellite System (USA) NSF National Science Foundation (USA) NWP Numerical Weather Prediction OceanSITES OCEAN Sustained Interdisciplinary Timeseries Environment observation System OCG Observations Coordination Group (JCOMM) OCO NOAA Office of Climate Observation (USA) ODAS Ocean Data Acquisition Systems ODINAFRICA Ocean Data and Information Network for Africa (IODE) OGP Oil and Gas Producers OOPC Ocean Observations Panel for Climate (GCOS-GOOS-WCRP) OPA Observations Programme Area (JCOMM) OPSC Observing Programme Support Centre OPSCOMM Argos Operations Committee ORION US/NSF Ocean Research Interactive Observatory Networks project OSMC NOAA Observing System Monitoring Centre (USA) PA Programme Area (JCOMM) PANGEA Partnerships for New GEOSS Applications
- 35 -
PAPA Programme for a Baltic network to assess and upgrade an operational observing and forecasting System in the region (EU project) PDE Puertos Del Estado (Spain) PGC Principal GTS Co-ordinator (DBCP) PICES North Pacific Marine Science Organization PICO Panel for Integrated Coastal Observations PIRATA Pilot Research Moored Array in the Tropical Atlantic PMEL NOAA Pacific Marine Environmental Laboratory (USA) PMO Port Meteorological Officer PMOC Principal Meteorological or Oceanographic Centres responsible for quality control of buoy data (DBCP) PMT Platform Messaging Transceivers POGO Partnership for Observation of the Global Oceans POPS Polar Ocean Profiling System PTT Platform Transmitter Terminal (Argos) QA Quality Assurance QC Quality Control QMF WMO Quality Management Framework RMS Root Mean Square RNODC Responsible Oceanographic Data Centre (IODE) RNODC/DB RNODC for Drifting Buoys ROOS Regional Ocean Observing Systems RRR Rolling Review of Requirements SAMS Scottish Association for Marine Science SAT Site Acceptance Test SAWS South African Weather Service SBD Short Burst Data SCD Satélite de Coleta de Dados (Data Collection Satellite, Brazil) SCG Services Coordination Group (JCOMM) SCOR Scientific Committee on Oceanic Research (ICSU) SEACORM South East Asia Centre for Ocean Research and Monitoring (Republic of Indonesia) SeaDataNET Pan-European infrastructure for Ocean & Marine Data Management SHOM Service Hydrographique et Océanographique de la Marine (France) SIMORC System of Industry Metocean data for the Offshore and Research Communities SIO Scripps Institution of Oceanography (University of California, USA) SOBP Southern Ocean Buoy Programme SOC Specialized Oceanographic Centre (JCOMM) SOOP Ship-of-Opportunity Programme SOOPIP SOOP Implementation Panel (JCOMM) SOT Ship Observations Team (JCOMM) SPA JCOMM Services Programme Area SST Sea Surface Temperature STIP Stored Tiros Information Processing SVP Surface Velocity Programme (of TOGA and WOCE, replaced by GDP) drifter SVP-B SVP Abarometer at a drifter SVP-BS SVP drifter with salinity SVP-BTC SVP drifter with temperatures in depth SVP-BW SVP Abarometer and wind at a drifter TAO Tropical Atmosphere Ocean Array TC Technical Coordinator TIP Tiros Information Processing TIP Tropical Moored Buoys Implementation Panel
- 36 -
TOWS-WG Working Group on Tsunamis and Other Hazards related to Sea Level Warning and Mitigation Systems TRITON Triangle Trans-Ocean buoy network TSG ThermoSalinoGraph TT/CB DBCP Task Team on Capacity Building TT/DM DBCP Task Team on Data Management TT/MB DBCP Task Team on Moored Buoys TT/ IBPDTD DBCP Task Team on Instrument Best Practices and Drifter Technology DevelopmentsUNESCO United Nations Educational, Scientific and Cultural Organization UNOLS University National Oceanographic Laboratory System (USA) URL Uniform Resource Locator VOS Voluntary Observing Ship (JCOMM) WCRP World Climate Research Programme WIS WMO Information System WMO World Meteorological Organization (UN) WMS Open Geospatial Consortium Web Map Services WWW World Weather Watch (WMO) XBT Expendable BathyThermograph
- 37 -
ANNEX IV: DBCP Quality Control Guidelines for GTS Buoy Data
i) History
At its seventh session (Toulouse, October 1991), in order to rationalise and speed up status change process of buoys reporting bad data onto the GTS, the Data Buoy Co-operation Panel decided to implement on a trial basis Quality Control Guidelines for buoy data. The guidelines worked effectively on 20 January 1992. It formally endorsed these at its following session (Paris, October 1992).At the tenth session of CBS (Geneva, November 1992), the Guidelines were formally incorporated as part of the World Weather Watch (WWW).
The scheme is based on an Email List (i.e. mailing list) used by all actors involved in the process. Particularly, when felt necessary, and according to quality control procedures they undertake on their own, Principal Meteorological or Oceanographic Centres (PMOC) responsible for Buoy data Quality Control can make status change proposals by the mean of an Internet mailing list (dbcp-qc jcommops.org). The meteorological centres are indeed in the best position to undertake Quality Control procedures. The JCOMMOPS database contact details are used to forward the proposals to buoy operators. In addition, monthly buoy monitoring statistics produced by PMOCs and WMO/Argos list of identification numbers as well as the list of Principal GTS Co-ordinators are available via the mailing list.
Buoy Monitoring StatisticsThe following document outlines the operation of the Buoy Monitoring program of DBCP. http://www.jcommops.org/dbcp/doc/qc/DBCP_Buoy_Monitoring_Statistics.pdf
ii) Participants
The following PMOCs are presently participating actively in the Guidelines:
The Australian Bureau Of Meteorology (ABOM),
Environment Canada (AES),
The European Centre for Medium-Range Weather Forecasts (ECMWF),
Meteo France (CMM, Centre de Meteorologie Marine),
The Meteorological Service of New Zealand, Ldt. (MSNZ),
The National Data Buoy Centre (NDBC of NOAA, USA),
The National Centre for Environmental Protection (NCEP of NOAA, USA),
The United Kingdom Met Office (UKMO).
iii) More Information Full description of the Guidelines is given below. QC message syntax is given in the Appendix. Information regarding the mailing list and how to register or to obtain details regarding
the DBCP QC Guidelines, you can contact the Technical Co-ordinator of the DBCP
- 38 -
A schematic of the guidelines :
Figure i. Schematic of the process of implementing the DBCP QC guidelines.
- 39 -
iv) Quality Control Guidelines for GTS buoy data
These are principles adopted during previous DBCP sessions:
(i) Meteorological Centres are in the best position to undertake data Quality Control (DBCP VI).
(ii) Principal Investigators and Meteorological Centres share the responsibility of data Quality Control (DBCP VI).
(iii) JCOMMOPS is in the best position to maintain the link between GTS users and Principal Investigators (DBCP V, VI).
(iv) The GTS processing centre is responsible for ensuring that gross errors are automatically eliminated from reports distributed on GTS (DBCP-VI).
In order to realise these principles, the following operating procedures or actions are proposed:
a. PGCsEach Principal Investigator (PI) of a buoy programme reporting data on GTS, designates a person responsible for making changes on to the GTS status for a buoy. This person is named the Programme GTS Co-ordinator (PGC).
The Technical Coordinator of the DBCP is in charge of maintaining the list of PGCs.
b. PMOCsThe DBCP requests one or more Agencies or Institutions to volunteer for acting as Principal Meteorological or Oceanographic Centre responsible for deferred time GTS buoy data Quality Control (PMOC). PMOCs work on an operational basis, for given physical variables, either regionally or globally. The following centres are presently acting as PMOCs:
The Australian Bureau Of Meteorology (BOM, Melbourne, Australia);
Environment Canada (AES, Edmonton, Canada);
The European Centre for Medium Range Weather Forecasts (ECMWF, Reading, United Kingdom);
The Icelandic Meteorological Office (IMO, Reykjavik, Iceland);
The Japan Meteorological Agency (JMA, Tokyo, Japan);
Meteo-France (the Centre de Meteorologie Marine, Brest, France);
The Meteorological Service of New Zealand, Ltd. (NZMS, Wellington, New Zealand);
The National Data Buoy Centre (NOAA/NDBC, Stennis Space Centre, Mississippi, USA);
The National Centre for Environmental Prediction (NOAA/NCEP, Camp Spring, Maryland, USA);
The Pacific Marine Environmental Laboratory (NOAA/PMEL, Seattle, Washington, USA);
The United Kingdom Met Office (UKMO, Exeter, UK).
The South African Weather Bureau (SAWB, Pretoria, South Africa).
- 40 -
National Focal Points for Drifting Buoy Programmes are requested to designate National PMOCs, and possibly to act themselves as PMOCs.
c. Automatic distribution list (mailing list).
It is proposed that the mechanism for exchanging QC information among the Guidelines Participants shall be an email distribution list. PMOCs send the proposed messages to a unique email address which is dbcp-qc jcommops.org.
The messages are then automatically forwarded to all the individual addresses from a maintained distribution list. Adding, reading, modifying, or deleting a name form the list can be done via email messages according to an agreed format.
ECMWF, NOAA/NCEP/NCO, METEO FRANCE, and UKMO buoy monitoring statistics are delivered onto the email Distribution List.
Any suggestion for modification (i.e. recalibrate or remove sensor from GTS) or any problem noticed (e.g. bad location) on a drifting buoy reporting data on GTS should be placed on the Distribution List. Meteorological Centres are encouraged to make such suggestions.
Any feed back available on a recalibration actually implemented shall be placed on the distribution list.
d. Operating Procedures for dealing with Potential Problems on GTS (Drifting and Moored Buoy data)
PMOCs noticing potential problems on GTS can suggest an action via the email Distribution List. A standardised, telegraphic format is proposed (see below): one message per platform or per sensor, showing the WMO number and the proposed change, directly in the "subject" line, with additional comments appearing in the text itself, using a free format if felt necessary by the PMOC (see example in below).
PMOCs noticing bad location or bad sensor data episodically appearing on GTS message can copy the message on the INTERNET Distribution List, indicating from which source the message was transmitted. Although it is recommended that LUT operators access to the Email List as well, if not possible, the Technical Co-ordinator of the DBCP or the responsible PGC or a designated PMOC (see paragraph 4.7.2) would keep them informed by telefax or another mean.
The JCOMMOPS database is used to forward the PMOC message to the buoy operator. It is recommended that the PGC waits for a few days before taking any action unless he/she is confident enough in the quality status of the data. Other meteorological centres may therefore have an opportunity to also comment on a particular problem. Other data users who are on the Email List are encouraged to check the received messages regularly.
Then, if the PGC accepts the modification, he requests the adequate Argos centre (i.e. CLS or CLS America) to make the change. In order to keep the GTS user community informed, Service Argos announces the change as soon as possible by means of the Email List (a standardised message is proposed in below) and also effects the change as prescribed. It is recommended that the PGC also requests appropriate LUTs to implement the same changes.
If the PGC is not willing to go ahead with a proposed change they will contact the Argos representative or GTS manager at their centre and make the change, they may then send an email to the distribution list to inform
- 41 -
PMOCs of the change. Local User Terminals are urged to adopt these Quality Control Operating Guidelines. It is desirable that LUTs not willing to participate should distribute drifting buoy data on GTS only to local users (i.e. no global GTS distribution).
o LUT operators participating and registered on the Email List are encouraged to inform the participants back by the mean of the Distribution List each time a change is implemented, using the same format as Argos (see paragraph 4.4).
e. DBCP, WMO and IOC Secretariats
They will promote these Quality Control operating guidelines and encourage participation in this scheme.
- 42 -

Operating QC Guidelines for buoy data
Standardized Format for Information Deposited on the email distribution list
Notations:(i) UPPERCASE in bold are constant field values and will appear "as shown" in the
subject line; e.g. ASK will appear as the 3 characters 'ASK' in the subject line.
(ii) Lowercases are used to designate variable data fields; If the name of the field is on 5 characters, then the field value must be coded using 5 characters (completed with spaces if necessary); e.g. ttt can be coded as 'AP ' to indicate Air Pressure or as 'SST' to indicate Sea Surface Temperature.
(iii) The line 12345678901234567890123456789012 is just here to indicate the number of characters used (32 maxi) and their position; It has no other specific meaning.
I) Proposals for status change (by Meteo Centres, i.e. PMOCs):
When detecting bad data circulating on GTS, Meteorological Centres can propose changes on buoy status (remove or recalibrate sensor) via the INTERNET Distribution List. Proposals are done using a standardised telegraphic format in the subject line. Comments can be added in the body text. Format:
12345678901234567890123456 hASK ttt wmo## ppp ovalue
Meaning: It is proposed to remove or recalibrate one or more sensors for one given buoy.
h : One figure, 1 to 9, to indicate the number of the request for the same buoy, for example, the first proposal would be coded 1ASK..., and if another Meteo Centre feels necessary to comment on the same proposal, it can suggest another action and name it 2ASK, etc...
ttt : Type of proposal:
RMV : for removing sensor data from GTS REC : for recalibrating a sensor CHK : for checking data carefully; in that case, it is recommended to add in the body text of the message: (1) Example(s) of the suspicious or erroneous GTS message(s), (2) the GTS bulletin header that was used (i.e. originating centre for the bulletin), (3) a description of the problem and (4) if possible, proposed action to solve it. COM : for commenting on a particular problem. Explanation is given in the body text of the message.
wmo## : WMO number of the buoy (A1bwnbnbnb) or LIST if more than one buoy are concerned.
- 43 -
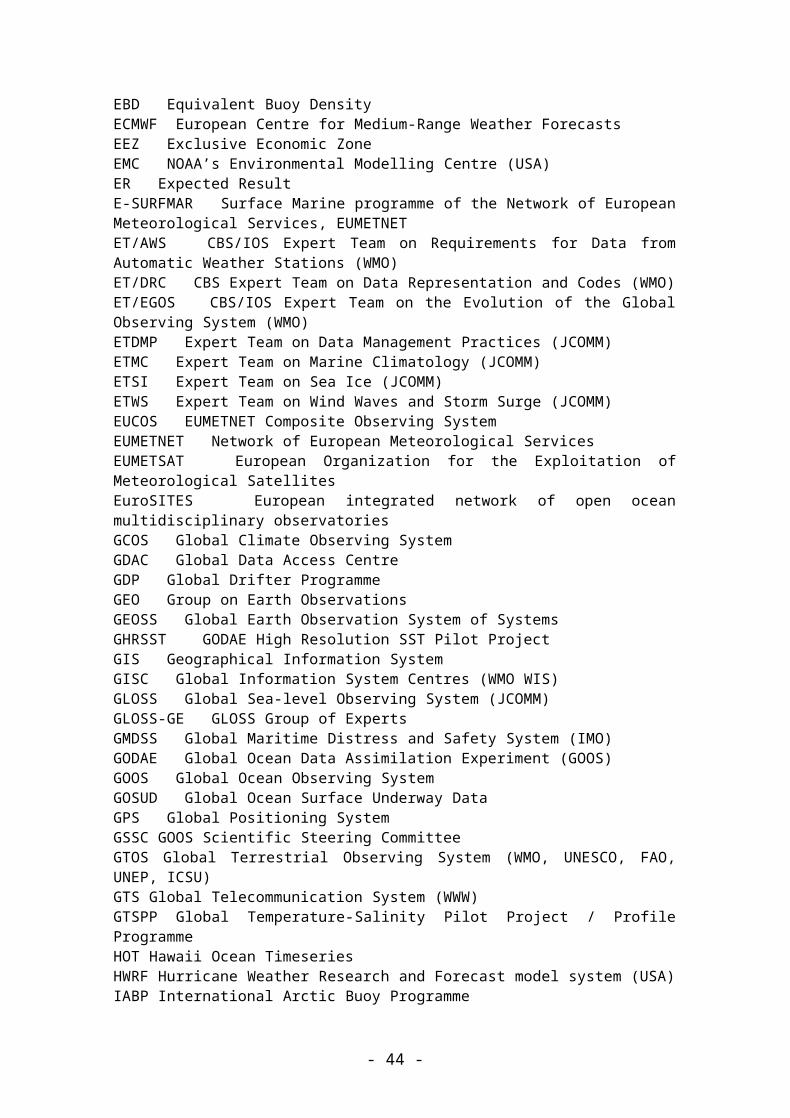
It is preferable to make status change proposals for different buoys on distinct messages. However, in case the LIST option is used, proposals can be detailed in the body text of the message: it is recommended to state the proposal for each buoy by starting with a line encoded according to the standard format followed by the comments on a few lines included inside brackets; then the next proposal can be listed etc.. General comments can be included in free format after the last proposal.
Example for the body text in case more than one proposal are included (subject line could be 1ASK CHK LIST AP):
1ASK CHK 61412 AP (this buoy has been transmitting erroneous data in the last 2 week)
1ASK CHK 54814 AP (this buoy shows strong departure of Air Pressure from the first guess field) ... Mr. W. Xyz., National Meteorological Service.
ppp : Physical variable (sensor) to consider:
AP : Air Pressure (coded as 'AP ') AT : Air Temperature (coded as 'AT ') SST : Sea Surface Temperature WD : Wind Direction (codes as 'WD ') WS : Wind Speed (coded as 'WS ') APT : Air Pressure Tendency POS : Position of the buoy TZ : Subsurface temperatures (coded as 'TZ '): The depths of the probes and proposed actions should be placed in the body text, not in the subject line (not enough room) ALL : All buoy sensors (e.g. remove all buoy data from GTS) Blank: (coded as 3 space characters, i.e. ' ') Informations are detailed in the body text.
o : Operator to use for proposed recalibration (mandatory and used only when ttt='REC'):
+ : Add the following value to the calibration function - : Subtract the following value from the calibration function * : Multiply the calibration function by the following value (e.g. rate for recalibrating wind speed sensor)
value: Value to use for proposed recalibration (mandatory and used only when ttt='REC'); the value is coded on 5 characters and completed with space characters if necessary. It is provided using the following physical units:
Air Pressure : Hecto Pascal Temperatures : Celsius degrees Wind speed : m/s
- 44 -
Wind Direction : Degrees Air Pressure Tendency : Hecto Pascal Positions : Degree + Hundredth Rate : No unit
Examples:
From Date Subject
FLETCHER METDP1.MET.CO.NZ 10-Oct-1998 1ASK REC 17804 AP +2.2ARADFORD EMAIL.METO.GOVT.UK 11-Oct-1998 1ASK RMV 62501 ALLBLOUCH IFREMER.FR 11-Oct-1998 2ASK REC 17804 AP +2.4MBURDETTE NDBC.NOAA.GOV 11-Oct-1998 1ASK CHK 44532 POSGXB ORVILLE.HO.BOM.GOV.AU 12-Oct-1998 1ASK REC 44704 WS *1.5
Message1: NZMS proposes to recalibrate Air Pressure sensor of buoy 17804 by adding 2.2 hPa.
Message2: UKMO proposes to remove buoy 62501 from GTS distribution. Explanations are given in the body text.
Message3: Meteo France comments (2ASK) on NZMS proposal for recalibrating air pressure sensor of buoy 17804. Meteo France suggests to add +2.4 hPa instead of +2.2 hPa. Argumentation is provided in the body text.
Message4: NDBC suggests to check positions of buoy 44532. Details are given in the body text, including copy of one suspicious GTS message, the GTS bulletin header, and a description of the error.
Message5: BOM proposes to recalibrate Wind speed sensor of buoy 44704, by multiplying data by 1.5.
II) GTS processing centre’s answer for changes actually implemented
When a change is implemented on GTS platforms, a message is normallyforwarded to the INTERNET Distribution List, by Argos or the considered LUT,no later than 24 hours after the change was implemented. All the informationis encoded in the subject line, the body text is empty. The format of the subject line is as follow:
Format:
123456789012345678901234567890123456cccc ttt wmo## ppp ovalue yymmddhhmm
Meaning: Argos (i.e. the French Global Processing Centre of Toulouse (FRGPC) or the
- 45 -
US Argos Global Processing Centre of Landover (USGPC)) or othe processing centres inform the Email List each time a change is actually implemented on a buoy status.
cccc : Originating Centre:e.g. LFVW = FRGPC, Toulouse KARS = USGPC, Landover ENMI = Oslo LUT BGSF = Sondre Stromfjord LUT CWEG = Edmonton LUT
ttt, wmo##, ppp, ovalue: Same as for paragraph 1. In addition, for recalibrations, when the transfer function has been completely modified, ovalue can be coded as a question mark followed by 5 space characters, i.e. '? ' , to indicate that the change is not as simple as a +X, -X or *X transformation.
yymmddhhmm: UTC time the change was implemented: Format=Year (2 digits), Month (2 digits), Day of the month (2 digits), Hour (2 digits), and Minutes (2 digits).
Example:
From Date SubjectGTS GTSVAX.ARGOSINC.COM 14-Oct-1998 KARS REC 17804 AP +2.3 9810141216GTS GTSVAX.ARGOSINC.COM 14-Oct-1998 KARS REC 33809 AP ? 9810141306
Message6: Buoy 17804 Air Pressure sensor was recalibrated by adding +2.3 hPa. the change was implemented at 12h16 UTC the 14 October 1998. As you may notice, two proposal had been made for this buoy: NZMS proposed +2.2 hPa and Meteo France proposed 2.4 hPa. The Technical Co-ordinator of the DBCP contacted both agencies and it was then decided to apply a 2.3 hPa correction.
Message7: Buoy 33809 Air Pressure sensor was recalibrated. The change was implemented at 13h06UTC the 14 October 1998. The question mark '? ' indicates that the transfer function was completely modified.
III) PGC response if the proposal was denied
Format:
12345678901234567890123456DENI ttt wmo## ppp ovalue
Meaning: The proposal was denied by the Principal GTS Co-ordinator (PGC) of the drifting buoy programme. No action was taken. Complementary informationcan be included in the body text.
- 46 -
ttt, wmo##, ppp, ovalue: same meaning as in paragraph 1. ovalue is mandatory and used only when ttt='REC'.
Example :
From Date SubjectBLOUCH IFREMER.FR 15-Oct-1998 DENI RMV 62501 ALL
Message8: In the body text: Data were sent on GTS before deployment by mistake. The buoy is now deployed and data look good. There is therefore no need for removing data from GTS distribution.
IV) Buoy monthly monitoring statistics
See further details on the implementation of the Monthly Monitoring Statistics in http://www.jcommops.org/dbcp/doc/qc/DBCP_Buoy_Monitoring_Statistics.pdf, which outlines the operation of the Buoy Monitoring program of DBCP.
Format:
12345678901234567890123456789STAT centre ppp year mm dd
Meaning: The monitoring statistics are available in the body text. Format is freefor the moments but it is recommended that each centre uses the same format
centre: Name of the centre producing the statistics, e.g.
ECMWF = European Centre for Medium Range Weather ForecastsNCO = NOAA NCEP Central OperationsCMM = Meteo France, Centre de Meteorologie MarineUKMO = United Kingdom Met Office
ppp: Type of physical variable concerned or ALL if many variables are included. Same as for paragraph 1 (i.e. AP, AT, WD, WS, SST ...)
year: Year concerned (e.g. 1998)
mm: Month concerned (e.g. 08 for August)
dd: Last day of the 1-month period concerned. It is optional and used only if the 1-month period does not end on the last day of the month. For example dd=15 if the 1-month period concerned is 16 July to 15 August.
Example :
From Date Subject
- 47 -
BLOUCH IFREMER.FR 02-Oct-1998 STAT CMM ALL 1998 09
Message9: The September 1998 monitoring statistics for many geo-physical variable and produced by the Centre de Meteorologie Marine of Meteo France are available in the body text.
IV) Monitoring Sites used to assess buoy data quality
Provider ProductMeteo-France Buoy Quality Monitoring Tools (France) http://www.meteo.shom.fr/qctools/
Including a Black list of Air Pressure buoys : http://www.meteo.shom.fr/qctools/sblackap.htm
NDBC Data Quality (USA) http://www.ndbc.noaa.gov/qc.shtml Information and Documents
NCEP Quality Assessment Project (USA) http://www.nco.ncep.noaa.gov/pmb/qap/
Biannual report on the quality of Marine Data (UK)
http://research.metoffice.gov.uk/research/nwp/observations/monitoring/marine/Biannual/index.html
Satellite Validation of In-situ data
- from Metop (Europe) http://saf.met.no/validation/list_sst_mdb_global.php
- from NOAA NESDIS iQuam (USA) http://www.star.nesdis.noaa.gov/sod/sst/iquam/
Table 4. List of Monitoring tools from various Quality Control Centres for buoy data
- 48 -