
DBCP monthly report (February 2016)
13
Transcript of DBCP monthly report (February 2016)
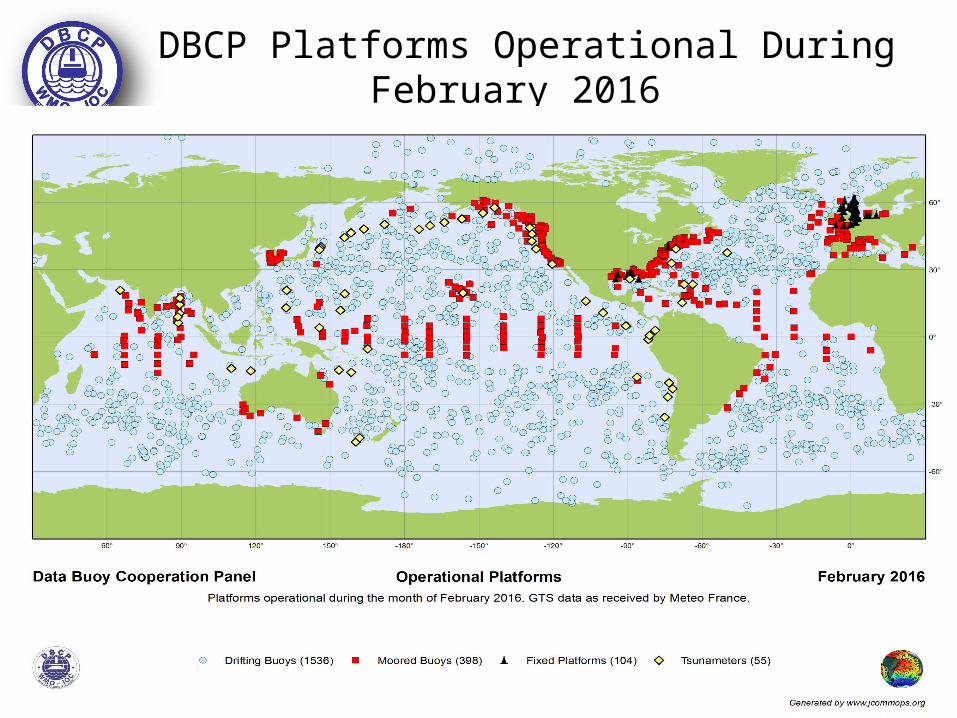
DBCP Platforms Operational During February 2016
2
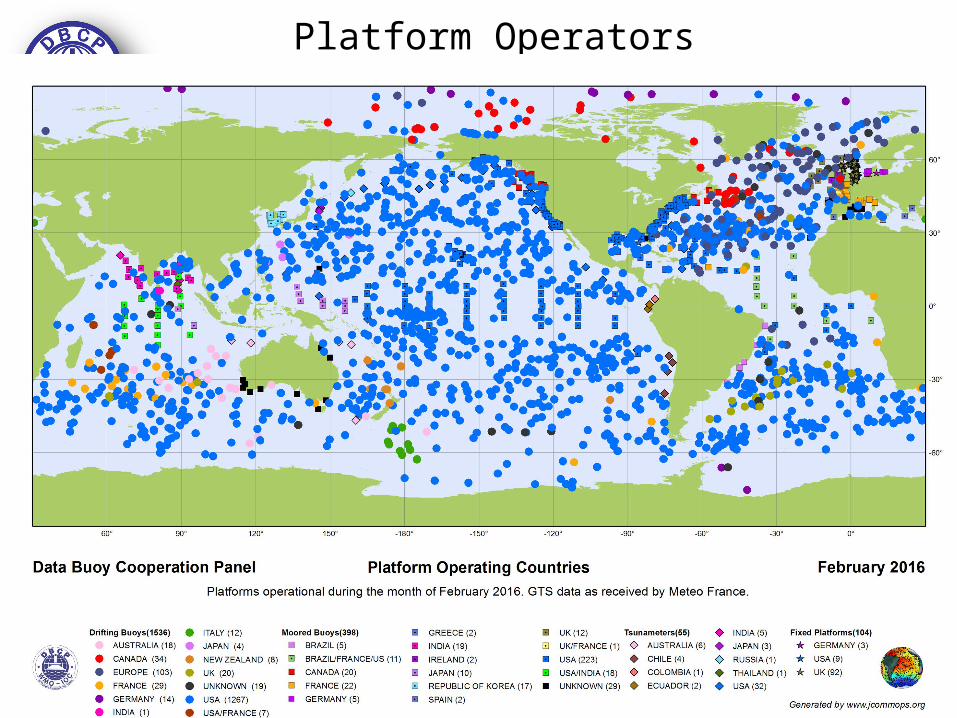
Platform Operators
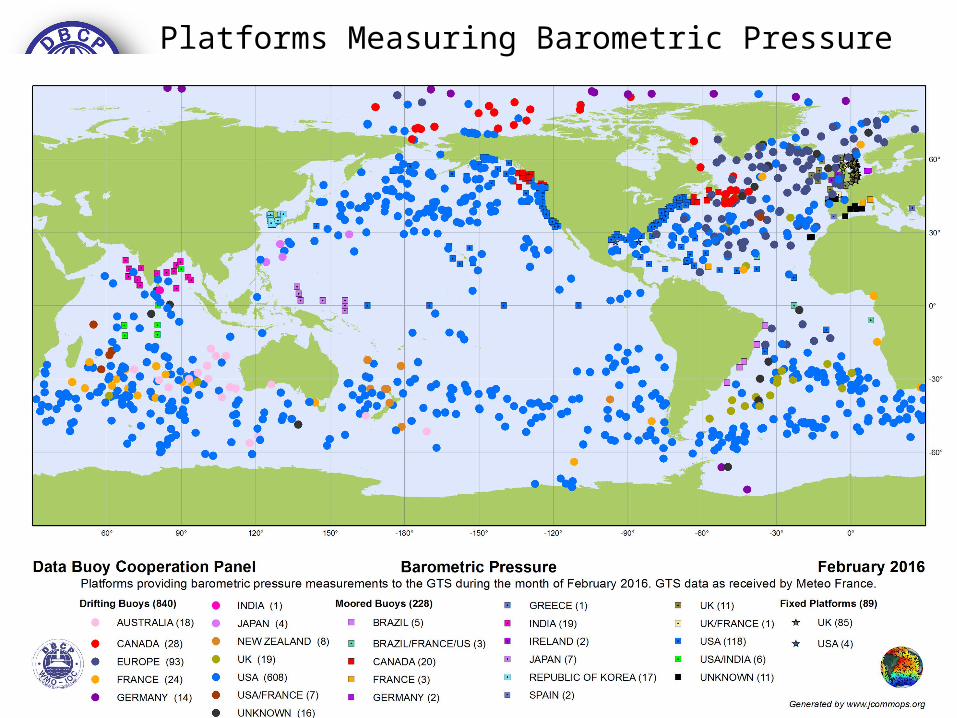
Platforms Measuring Barometric Pressure
06/20
01
11/20
01
04/20
02
09/20
02
02/20
03
07/20
03
12/20
03
05/20
04
10/20
04
03/20
05
08/20
05
01/20
06
06/20
06
11/20
06
04/20
07
09/20
07
02/20
08
07/20
08
12/20
08
05/20
09
10/20
09
03/20
10
08/20
10
01/20
11
06/20
11
11/20
11
04/20
12
09/20
12
02/20
13
07/20
13
12/20
13
05/20
14
10/20
14
03/20
15
08/20
15
01/20
160
500
1000
1500
2000
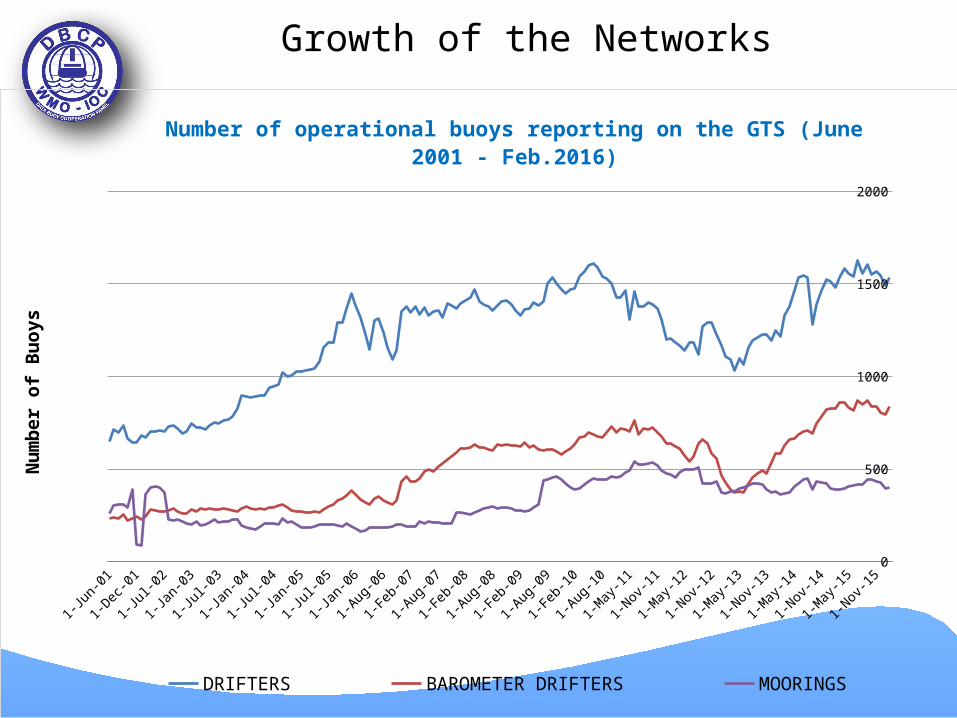
Number of operational buoys reporting on the GTS (June 2001 - Feb.2016)
DRIFTERS BAROMETER DRIFTERS MOORINGS
Num
ber o
f Buo
ysGrowth of the Networks
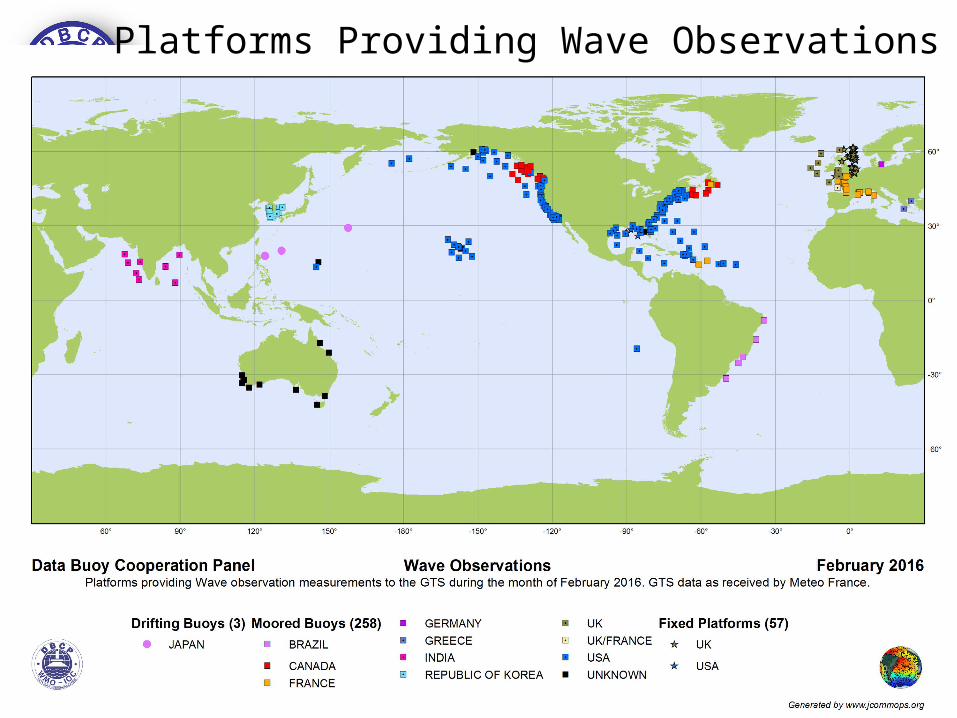
Platforms Providing Wave Observations
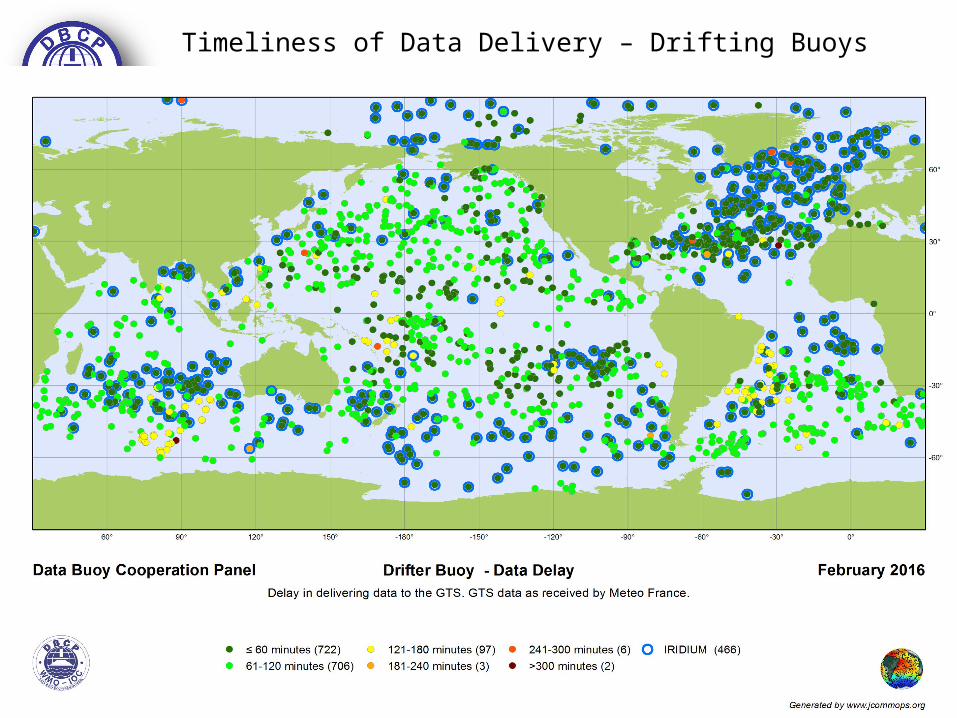
Timeliness of Data Delivery – Drifting Buoys
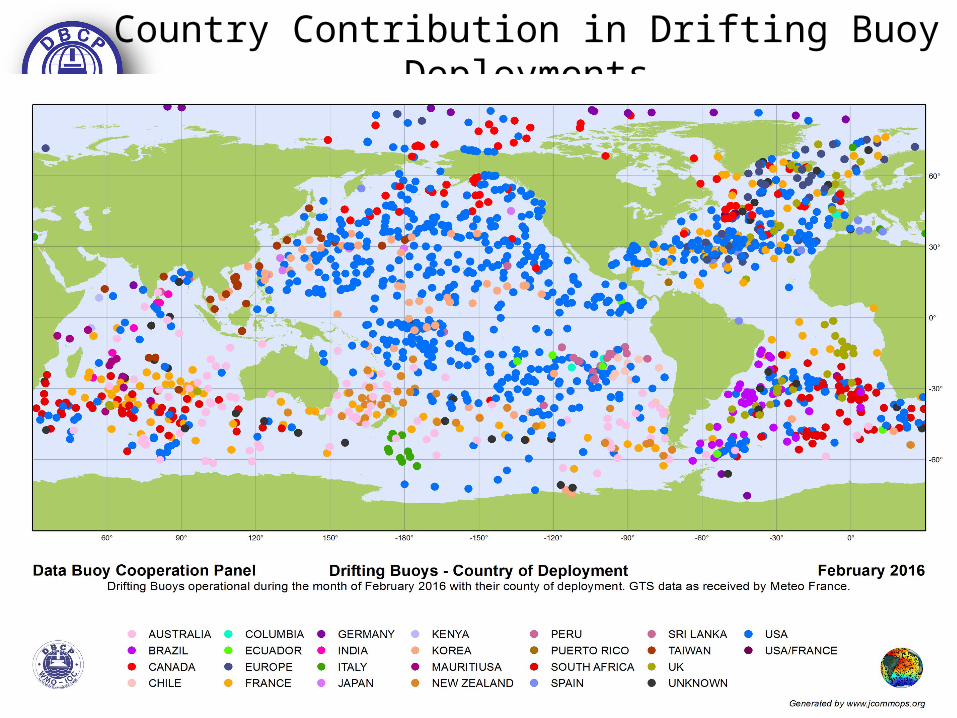
Country Contribution in Drifting Buoy Deployments
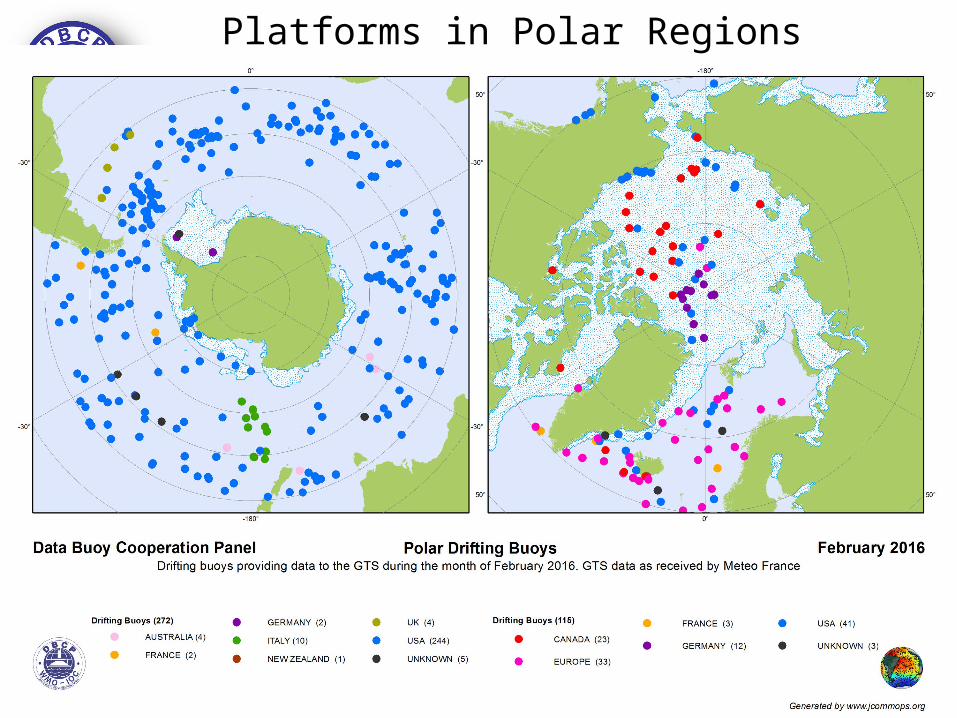
Platforms in Polar Regions
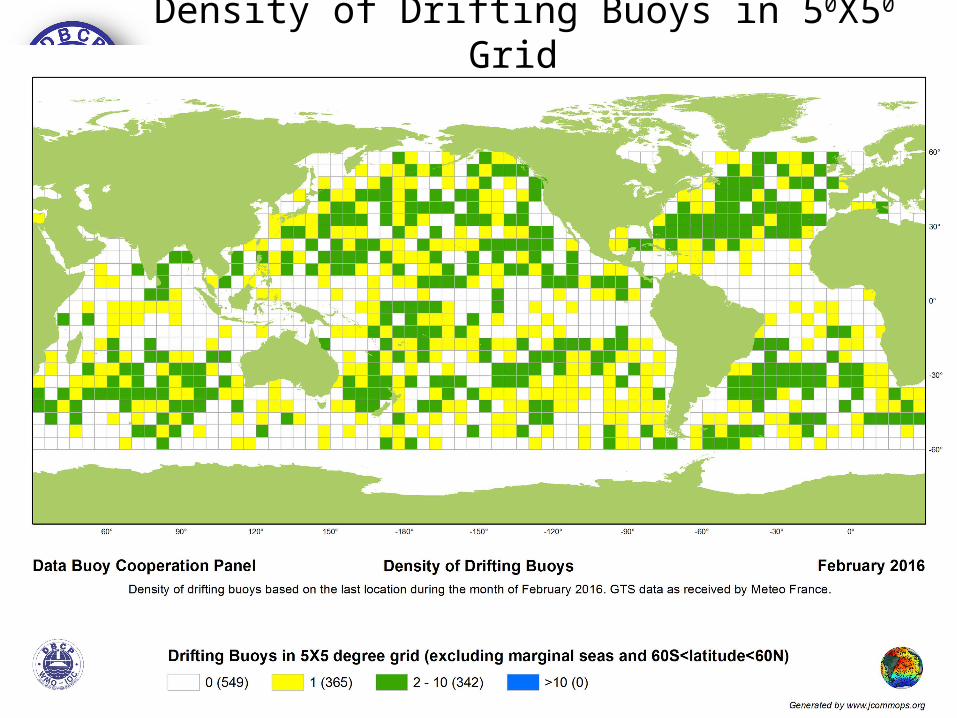
Density of Drifting Buoys in 50X50 Grid
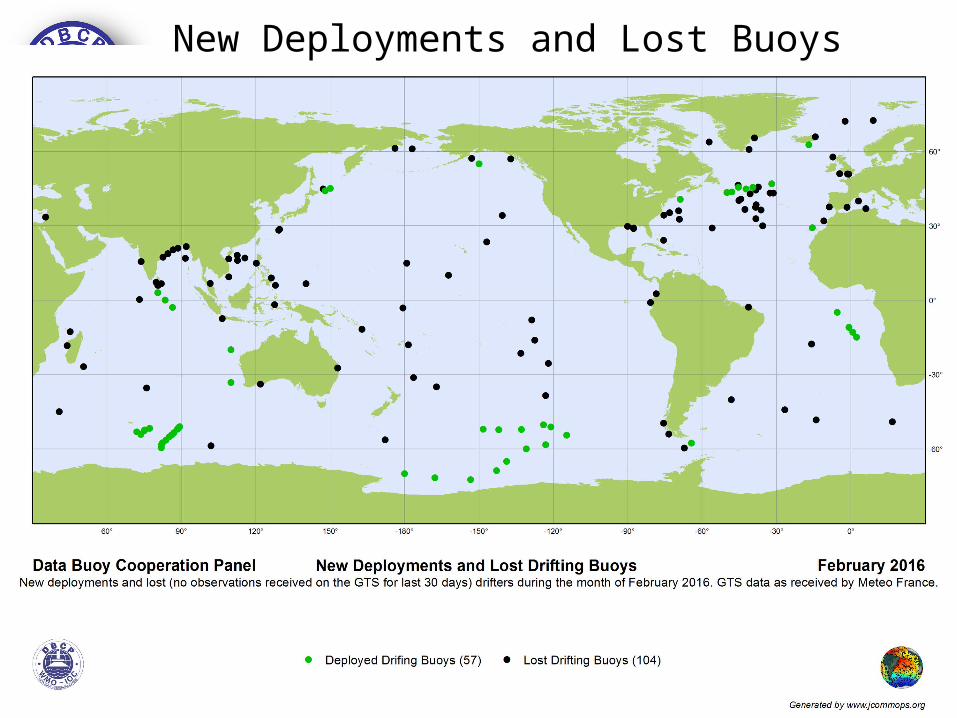
New Deployments and Lost Buoys
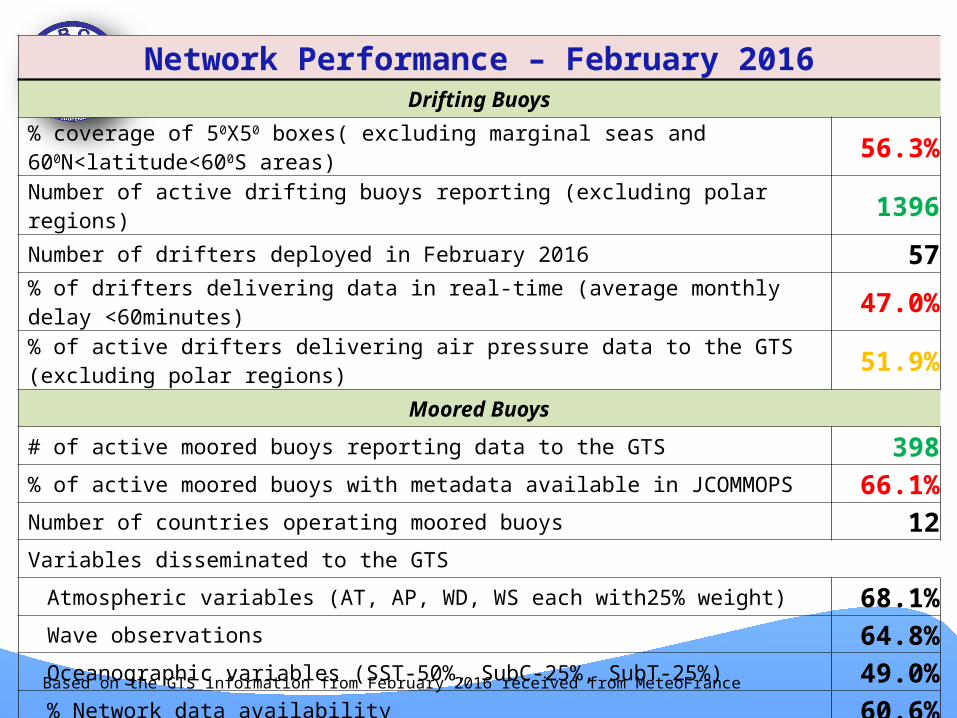
Network Performance – February 2016Drifting Buoys
% coverage of 50X50 boxes( excluding marginal seas and 600N<latitude<600S areas) 56.3%
Number of active drifting buoys reporting (excluding polar regions) 1396Number of drifters deployed in February 2016 57% of drifters delivering data in real-time (average monthly delay <60minutes) 47.0%% of active drifters delivering air pressure data to the GTS (excluding polar regions) 51.9%
Moored Buoys
# of active moored buoys reporting data to the GTS 398% of active moored buoys with metadata available in JCOMMOPS 66.1%Number of countries operating moored buoys 12Variables disseminated to the GTS
Atmospheric variables (AT, AP, WD, WS each with25% weight) 68.1%Wave observations 64.8%Oceanographic variables (SST-50%, SubC-25%, SubT-25%) 49.0%% Network data availability 60.6%
Based on the GTS information from February 2016 received from MeteoFrance
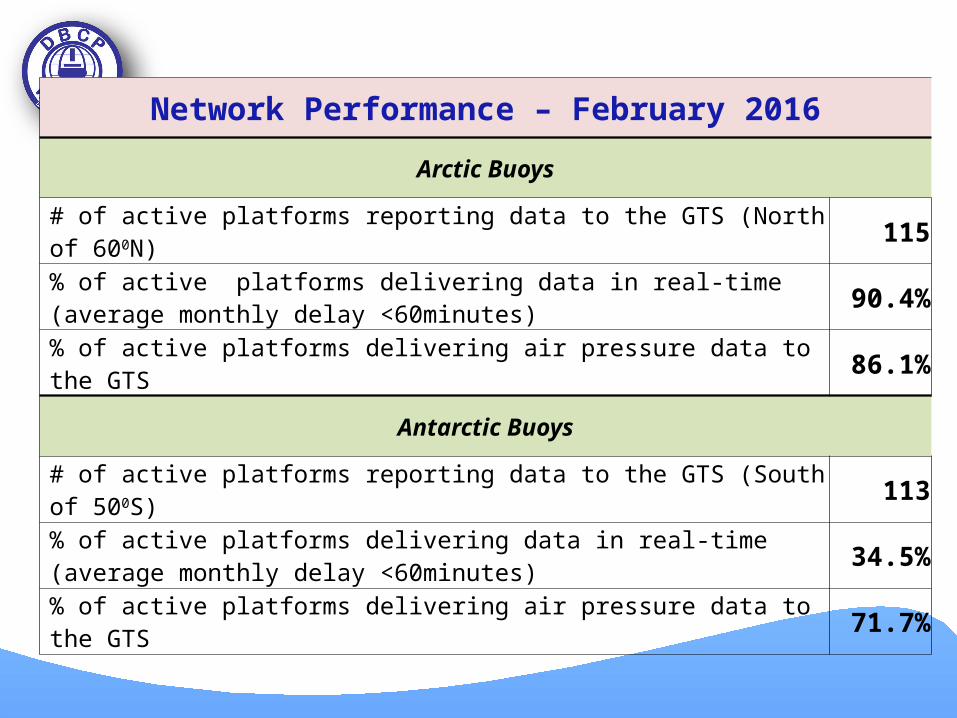
Network Performance – February 2016
Arctic Buoys
# of active platforms reporting data to the GTS (North of 600N) 115
% of active platforms delivering data in real-time (average monthly delay <60minutes) 90.4%
% of active platforms delivering air pressure data to the GTS 86.1%
Antarctic Buoys
# of active platforms reporting data to the GTS (South of 500S) 113
% of active platforms delivering data in real-time (average monthly delay <60minutes) 34.5%
% of active platforms delivering air pressure data to the GTS 71.7%