DB2 for z/OS Best Practices Locks and Latches John J. Campbell ...
35
DB2 for z/OS Best Practices Locks and Latches John J. Campbell Distinguished Engineer DB2 for z/OS Development [email protected] © 2011 IBM Corporation Transcript of webcast Slide 1 (00:00) Hello! My name is John Campbell, Distinguished Engineer in IBM DB2 for z/OS development. This is another web lecture in the DB2 series on best practices, and this lecture in par- ticular is about locks and latches. Slide 2 (00:41) What I’d now like to do is turn onto the second slide here, which is a basically a disclaimer and trademarks about things that are referenced in this presentation. Now, let us turn onto slide 3. Slide 3 (00:29) The first area I’d like to talk about is IRLM, which is the local lock manager used by DB2 for z/OS.
Transcript of DB2 for z/OS Best Practices Locks and Latches John J. Campbell ...

DB2 for z/OS Best Practices Locks and Latches John J. Campbell Distinguished Engineer DB2 for z/OS Development [email protected] © 2011 IBM Corporation Transcript of webcast Slide 1 (00:00) Hello! My name is John Campbell, Distinguished Engineer in IBM DB2 for z/OS development. This is another web lecture in the DB2 series on best practices, and this lecture in par-ticular is about locks and latches. Slide 2 (00:41) What I’d now like to do is turn onto the second slide here, which is a basically a disclaimer and trademarks about things that are referenced in this presentation. Now, let us turn onto slide 3. Slide 3 (00:29) The first area I’d like to talk about is IRLM, which is the local lock manager used by DB2 for z/OS.
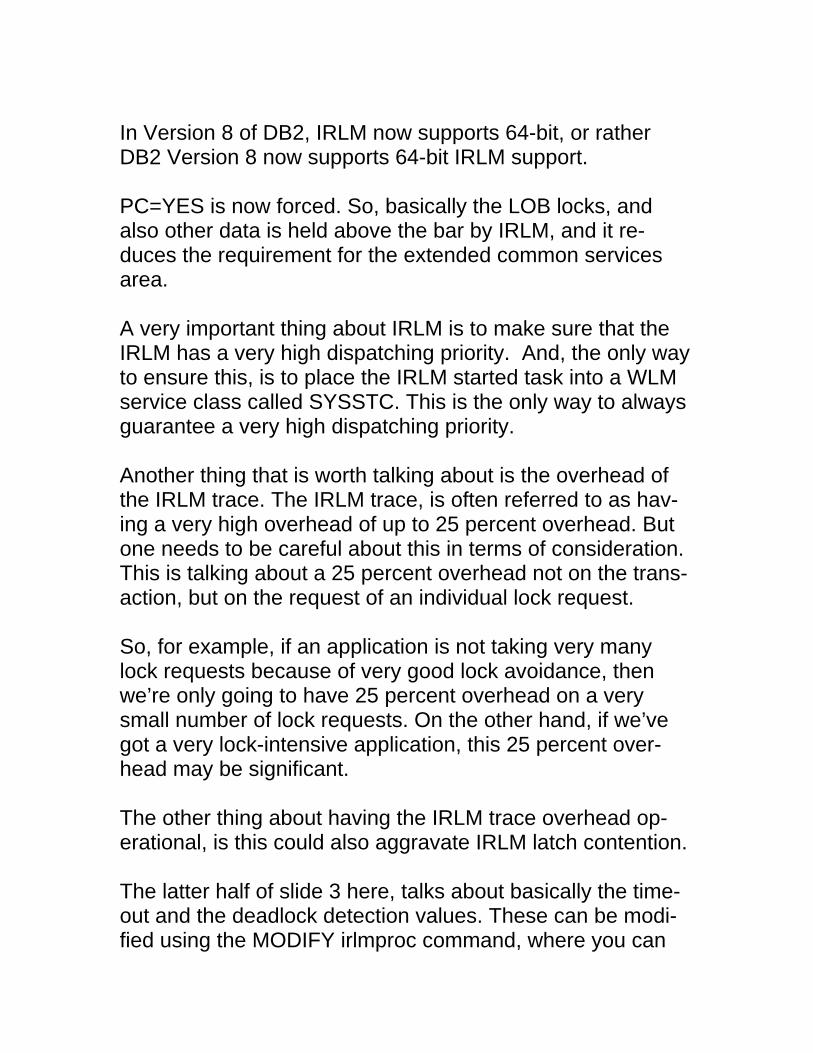
In Version 8 of DB2, IRLM now supports 64-bit, or rather DB2 Version 8 now supports 64-bit IRLM support. PC=YES is now forced. So, basically the LOB locks, and also other data is held above the bar by IRLM, and it re-duces the requirement for the extended common services area. A very important thing about IRLM is to make sure that the IRLM has a very high dispatching priority. And, the only way to ensure this, is to place the IRLM started task into a WLM service class called SYSSTC. This is the only way to always guarantee a very high dispatching priority. Another thing that is worth talking about is the overhead of the IRLM trace. The IRLM trace, is often referred to as hav-ing a very high overhead of up to 25 percent overhead. But one needs to be careful about this in terms of consideration. This is talking about a 25 percent overhead not on the trans-action, but on the request of an individual lock request. So, for example, if an application is not taking very many lock requests because of very good lock avoidance, then we’re only going to have 25 percent overhead on a very small number of lock requests. On the other hand, if we’ve got a very lock-intensive application, this 25 percent over-head may be significant. The other thing about having the IRLM trace overhead op-erational, is this could also aggravate IRLM latch contention. The latter half of slide 3 here, talks about basically the time-out and the deadlock detection values. These can be modi-fied using the MODIFY irlmproc command, where you can

set the deadlock and all the timeout value to dynamically change the values. What the picture shows in the bottom of slide 3 is that first of all you have the actual range allowed, the defaults, and the recommendations. Then we have a column for IRLM time-out, and then another column for deadlock. So for example, when we look at timeout here the range value varies be-tween 1 second and 3600 seconds, and the deadlock varies from 0.1 of a second to 5 seconds. The second row here, in this table, shows the default values. And what you can see over time, is that these default values have come down. So, today the default value for the timeout period is 60 seconds, and the in case of the deadlock value is now down to 1 second. Some common recommendations based on real-world best practices are to reduce these defaults. So, for example, in a high-volume OLTP where performance and availability is very important, it’s a common recommendation to have the default value much lower, like 30 seconds, and in the case of deadlocks, to actually detect and break those deadlocks as fast as possible. So in many cases the recommendations running on fast processors like a z10 or z196, is to reduce the value for the deadlock detection cycle time down to 0.5 of a second. So, this consideration here about reducing the deadlock cy-cle time is about prioritizing availability over performance. Once you’ve got a deadlock, it’s not going to get any better, so the idea is to detect and break it as soon as possible. Now the only danger with this recommend of running with a 1 second deadlock detection cycle time, or bringing this
down to half a second is that in some environments, there may be very high lock intensity, and the danger of having a very frequent deadlock detection cycle time is that this may aggravate lock latch contention, specifically IRLM latch con-tention. A real-world case for this, for example, is for SAP installa-tions. The recommendation for SAP installation, is still to keep the deadlock detection cycle time at 5 seconds. And the reason for that is because SAP applications, or certain types of processing can generate a humongous amount of lock requests per unit of time. So, for most installations, the default of 5 seconds is the rec-ommendation. But if there is heavy deadlock detection prob-lems in this SAP environment, you may want to consider re-ducing this down to maybe 3 or 4 seconds. Now, let’s turn on to slide 4. Slide 4 (04:59) So, now on slide 4 here, I want to talk about lock avoidance. Lock avoidance is a set of techniques and algorithms inside DB2, to avoid when if possible taking locks for read-only re-quests. This doesn’t in any way imply a dirty read. What it means is that basically for read-only requests, DB2, if it can guarantee that the pages are logically and physically consis-tent, can avoid taking a lock. And notice that I word that I used there was “potential.” Just because a SQL request, and the lock request associated with the SQL request, are eligible for lock avoidance, it does not mean that lock avoidance is actually achieved.
Let me give you an example of one of the transactions in the IRWW workload used by IBM DB2 performance team to evaluate transaction performance. One of the transactions called stock inquiry if the was no lock avoidance whatsoever would take 183 lock requests per transaction. However, when the transaction is bound correctly with CURRENT-DATA(NO) and becomes eligible for lock avoidance, the number of lock requests is typically in the area of 3, 4, or 5 lock requests. It comes down from 183 to 3, 4, or 5. Notice, it does not come down to zero. So it’s very important to under-stand the distinction here between first of all being eligible for lock avoidance, and then how effective that lock avoid-ance actually is. So basically, on slide 4 here, I’m discussing the combination of techniques here to basically prevent the retrieval of un-committed data, and to avoid taking locks. And taking these locks will be much more expensive in a data sharing environment where those lock requests have to be propagated beyond the local IRLM into the coupling facil-ity. So, the first technique here is page latching. And in data sharing, this also means also taking page P-locks. This is controlled by DB2 to ensure the physical consistency of an individual index or data page. Now, the second technique is called the commit log se-quence number (CLSN). And this is done at the page level. Now there’s two parts of this technique. First of all in the in-dividual page, and on that page, DB2 tracks the time of the last update to the page. And let us refer to this as “A.”
At the same time in the DB2 system, DB2 tracks the time of the oldest uncommitted activity on every page set partition, and this is called “B.” Now, when it comes to B here, the time of the oldest uncommitted activity, there’s a distinction here first of all between non data sharing and data sharing, and inside data sharing between whether the data is non-GBP-dependent and whether it is GBP-dependent. So, in a non data sharing environment, and even in data sharing when non GBP-dependent, then basically DB2 tracks this commit LSN value at the individual data set. So we have fine granularity. But when the object is GBP-dependent in data sharing, DB2 uses a global commit LSN value, which is in fact the lowest commit LSN value across all members, across all page sets. So, to sum this up here, we have fine granularity at the data set level in non data sharing, and when we’re non GBP-dependent. But when we’re data sharing and group buffer pool dependent, we have a global value. And therefore, we just have one global value for the whole of the group. And what DB2 does using technique 2 based on the commit log sequence number, if A (the value in the page) is less than B (the commit LSN value at a global level, at the data set level) then DB2 can guarantee that the page is logically consistent, and the updates on that page have been commit-ted. If that is successful where A is less than B, then basi-cally the lock avoidance check is successful. Now what happens if that lock avoidance check in step 2 fails? Then what we do, is we use was called the “PUNC bits” and “PUNC” stands for “possible uncommitted bits.” Now, let’s discuss technique 3 on slide 5.

Slide 5 (09:22) So, what happens here, is that on each row in the data page or index page, a PUNC bit is set when the data is updated. Now, basically, if the PUNC bit is not on, then the row or key is guaranteed to be committed. I repeat that: if the PUNC bit is not on, then the row or key is guaranteed to be committed. And therefore the lock avoidance check is successful. However, if the PUNC bit is on, we cannot guarantee that. And therefore the lock avoidance check fails. Now, how are these PUNC bits ever reset? These PUNC bits are periodically reset if we get a successful commit LSN check using technique 2, and more than 25 percent of the rows have the PUNC bit on. So, that’s one reason for reset-ting the PUNC bits. And the other two reasons are a query which is running under ISOLATION repeatable read doing a scan, or a REORG of the table space or the index space. So, to recap here across slides 4 and 5, there are three techniques: first of all, page latching; secondly, commit LSN checking; and if the commit LSN check fails, we then exam-ine the PUNC bits. So, basically if we fail the commit LSN check, and we fail the PUNC bit check, then basically we have to take the lock, and lock avoidance fails. Now, let’s turn on to slide 6. Slide 6 (10:49)
What are of the benefits of lock avoidance? The first benefit of course is increasing concurrency. And the second benefit, and particularly important in data sharing is a decrease in the number of lock and unlock activity requests. And if we can reduce the number of lock and unlock activity requests, then we can reduce CPU consumption, and also data sharing overhead. So, the value of lock avoidance is much more important in a data sharing environment where your object is group buffer pool dependent. Now the key to the door to get good lock avoidance, and to make sure the SQL is eligible for lock avoidance is to BIND your applications that are using cursor stability ISOLATION, to bind them with CURRENTDATA(NO). Now over the releases DB2 has tried to improve the lock avoidance, to give you as much lock avoidance as possible. Now there were some specific improvements in version 8. The first improvement in version 8 was related to non-cursor or singleton select. In version 7, when you bound the appli-cations ISO(CS), CURRENTDATA(YES), then whenever we found a qualified row, we would take the lock. However, even in version 7, with CURRENTDATA(YES), by the time the actual result row had been returned back to the application, then the row lock or the page lock had been re-moved. So, one of the major changes that we made in version 8, is that regardless of whether you bind the cursor stability appli-

cation with CURRENTDATA(YES) or CURRENTDATA(NO), the SQL will now become eligible for lock avoidance. The second enhancement in version 8 was to do with what was called overflow rows, or relocated rows. This is a situa-tion where you have a fixed-length compressed row, or true varying length row that becomes updated, and the updated row cannot fit back into the original page. So, what happens is that DB2 replaces the original row with a pointer to the overflow, and basically, the real row, the up-dated row is now put into a different page. So the overflow pointer points to the page containing the new version of the row. Prior to version 8, there was absolutely no lock avoid-ance on the pointer row, and also on the overflow row. In version 8, we now only look at essential to lock on the pointer row only, so we become eligible for lock avoidance on the overflow row. Now let’s turn on to slide 7. Slide 7 (13:24) So, how you can tell whether you’re doing good or bad on lock avoidance. So one pragmatic way of deciding this, is to look in the locking activities section of your DB2 statistics trace. And what it shows you is broken down at a per commit level. You can find out how many lock requests you are doing per commit, and how many unlock requests you are doing per commit. And, as you can see in this sample here, we’re taking 964 locks per commit. And the basic rule of thumb is that if lock
avoidance is working effectively, the number of unlock re-quests per commit should be no greater than 5. So clearly in this example here, lock avoidance is seriously broken. In other words, it’s very effective. So what can you try to do to improve situations? The first thing to do is to check that your applications are bound with ISOLATION cursor stability and with CUR-RENTDATA(NO), so the SQL becomes eligible for lock avoidance. Other reasons for poor lock avoidance are first of all, that you may end up with a large number of relocated rows after the update of a fixed-length compressed or a true varying-length row. Or you may end up accumulating a large number of pseudo-deleted index entries in unique indexes. Both of these conditions of relocated rows and pseudo-deleted index entries can be cleaned up by running REORG either at the index or at the table space level. Now let’s turn to slide 8. Slide 8 (15:00) One of the most common culprits for having poor lock avoid-ance is having long-running URs. All it takes is one long-running UR in a data sharing group and the lock avoidance effectiveness for group buffer pool dependent objects, can become very poor. So, it’s always been very important to track or monitor for long-running URs, and to get the rogue applications fixed up.

So, one of the recommendations here is using system pa-rameter settings in DB2 the ZPARM to aggressively monitor long-running URs. Slide 8 (15:35) Here on this chart 8, I provide some first-cut rules of thumb. So first of all there is a ZPARM called URCHKTH. And basi-cally, this tracks URs running for a long time without commit-ting. So the recommendation is to set URCHKTH to a value of 5 or less. So, if this value is set to 5 what it means is, if we have a UR that has run for 5 system checkpoints without committing, then DB2 will generate DSNR035I message. So, you are taking system check points every 5 minutes, and URCHKTH is set to 5, that means a long-running UR after it has been running for more than 25 minutes will start gener-ating this DSNR035I message. So, setting URCHKTH to 5 is a very conservative setting, and in most cases, you’ll want to tune this down. The second ZPARM that is relevant in this situation, is a ZPARM called URLGWTH, UR log write threshold. And ba-sically, this tracks for URs that are performing massive up-date activity without committing. So, the conservative rec-ommendation is to set this ZPARM to 10, which means 10-thousand lock records. What this will mean, is that you have a mass update that is not committing, not taking intermediate commit points, this DSNJ031I message will pop out after more than 10-thousand log records have been created.

So, it’s one thing to set the ZPARMs here, and to generate these messages when these long-running URs are identi-fied. The most important thing is to get these rogue applica-tions fixed-up. So, the strong recommendation here is to have a process with management ownership here to get these rogue appli-cations fixed up: first of all identified, then fixed up, and to get commitment to get these application to take intermediate commit points. So basically, this can be taking frequent checkpoints based on elapsed time, or based on the CPU time as an indirect way to measure the number of SQL statements. Now, let’s turn to slide 9. Slide 9 (17:54) Now, another common question that comes up is should I use LOCKSIZE PAGE or LOCKSIZE ROW? Well, general recommendation is to use LOCKSIZE PAGE as an application design default, and then to consider using row-level locking carefully. If you’re in a situation of an appli-cation where there is a high instance of deadlock or timeout, you may want to consider using LOCKSIZE ROW. LOCK-SIZE ROW may help many situations where you have high incidence of deadlocks or timeouts. But actually, it’s not a silver bullet here. There are situations that by using LOCKSIZE ROW you ac-tually may open up new deadlock scenarios. So, as I said, the recommendation is to use LOCKSIZE PAGE as an ap-

plication design default, and then consider using LOCKSIZE ROW carefully. Now, if you compare the cost of one row lock versus one page lock, there is actually no difference whatsoever. The difference is how many of them do you take? And this is where there can be particular differences. Par-ticularly if you are performing sequential update: sequential insert, update and delete, where there are many rows per page. So, like I said, if you’re comparing random access one row lock versus one page lock there actually is no difference in cost. And in fact, if you have 100 percent perfect lock avoidance, then no row lock is equivalent to no page lock. But the key difference is in the area of sequential scanning and processing. If there is only one row per page because you set MAXROWS=1, or you specified uncommitted read, then again there is no difference. There’s negligible difference if you specify CURRENT-DATA(NO) and running with ISOLATION(CS), provided that lock avoidance is effective. But there’s a bigger difference if you run with ISOLATION repeatable read or read stability, or you have lots of sequen-tial inserts and deletes. And the worst case, where you get the biggest difference, is where you’re running with ISOLATION(CS), CURRENT-DATA(YES), and many rows per page. You also need to bear in mind, that when you’re in data sharing, and the object is group buffer pool dependent, that

when you use LOCKSIZE ROW, there will be additional data page P-locks being taken. Now, let’s turn to slide 10. Slide 10 (20:20) Now, I’m deviating here because most of these talks in the web lecture series are about statistics trace. But here’s an example from the accounting trace. And the objective here is basically to find a way of filtering out rogue applications that may be taking many, many locks. So, in the accounting trace you can identify the maximum number of page or row locks held, and this is a useful indica-tor of commit frequency. This applies to page and row locks only. And what you can see in this excerpt from the locking sec-tion of the accounting report is the average number of max locks, and the total number of locks. So, we need to differen-tiate carefully between here, between what’s the difference here between average and total. If transaction A takes 10 locks maximum, and transaction B takes 20 locks, then the average will show up as 15, but the total will show up as the worst case, which is 20. In general, you want to try and keep the number of locks per commit, to keep the max locks, below 100. Now, let’s turn to slide 11.

Slide 11 (21:30) On slide 11, I have some special case DB2 system parame-ter ZPARMs. These are not to be universally used by all ap-plications. And whether or not you are able to use the ZPARM settings depends on the application locking seman-tics. So, it very much depends on the application. So, these are not normally used as one-size-fits-all defaults. They are usually only selectively applied. And in fact, when I look at these three ZPARMs here, one of the few areas these are actually used, selectively, is with SAP. So the first system parameter is called RRULOCK. By de-fault, when RRULOCK is set to NO, then what will happen is that DB2, when using ISOLATION repeatable read, will take an S-lock on the SELECT or UPDATE. And then, when the first controlled update comes along we’ll then take an X-lock. And this can lead to lots of DEADLOCKS. So, the advantage to setting RRULOCKs equal to YES, is that DB2 will take a U-lock on the cursor control fetch, and then when the update where current of cursor comes along, we will actually take an X-lock. So, this actually reduces the possibility of deadlock. The next ZPARM is called “XLK update delete lock” (XLKUPDLT). This means that we have a searched non-cursor controlled update and delete. Rather than taking an S-lock on the read, you actually take the X-lock up front. And this is good if most objects are actually going to be changed. Now while this has been successful, it can be a very blunt instrument. So, in Version 8 we introduced an APAR PQ98172, that introduced a new option called TARGET to
give you finer granularity. Now the X-lock is only acquired for the specific table that is the target of the update or delete. The last ZPARM is called “SKIP uncommitted read” (SKIPUNCI). This means that when you run under ISOLA-TION cursor stability or read stability, and you’re using row-level locking, then basically, if the query collides with an un-committed insert, rather than waiting for the uncommitted in-sert to commit or roll back, then the query user will just skip around the uncommitted insert, and not show that row in the result set. So, this feature only applies to row-level locking. Now, let’s turn on to slide 12. Slide 12 (24:02) The next major topic that I’d like to talk about here, is about SQL DDL and DML concurrency. And one of the common questions that I get is related to database locking. DBD lock-ing. And by DBD here, I mean “database.” So, in an individ-ual database we have one DBD, and that DBD may cover many table spaces, many indexes, many objects. I am going to simplify quite a complex subject here, but basi-cally, we take an X-mode lock on the database descriptor for DDL like CREATE, DROP, and ALTER TABLESPACE, and also some utilities. And those X-mode locks will prevent par-allel SQL DDL against the same database. On the other hand, you take an S-mode lock on the data-base descriptor during BIND, most DB2 utilities, and also when we’re using dynamic SQL without the dynamic state-

ment caching support turned on. So, the hanging question here is how I can improve DDL concurrency? Well, two techniques to improve concurrency are, first of all reduce the number of objects within the database. So a smaller database with fewer objects means smaller data-base descriptors. This will also help reduce the database descriptor pool size, and also the logging volume. So, let’s take an example here. If you create an index, and that index is associated with a database descriptor that has a thousand pages, that CREATE INDEX DDL statement in isolation will result in 2000 pages locked: both the complete before image 1000 pages, and the complete after image, which will be another 1000 pages. So, you can imaging now that if you have very large database descriptors, maybe 10,000 pages, in that case we will be locking 20,000 pages. So, if you have a single DDL statement against a large data-base descriptor and you go DDL commit, DDL commit, DDL commit, each of those commit scopes will be locking the complete before and after image, of a very large database descriptor. So one of the tuning recommendations, apart from having smaller databases with fewer objects per database, is to group all the SQL DDL statements for a particular database into the same commit scope. So, do DDL, DDL, DDL, and then do one commit. And that way, you avoid having to re-peatedly lock the complete before and after image of the da-tabase descriptor. Another thing basically is to avoid mixing DML and DDL statements in the same commit scope. And clearly what you also want to do if you are doing things in-teractively with SPUFI, you’ll want to avoid having a delayed commit hanging there and keeping the DBD locks in place.

Now, let’s turn to slide 13. Slide 13 (27:00) Other ways of improving DDL and DML concurrency, is that if you’re using dynamic SQL is to always turn on the ZPARM CACHEDYN=YES. CACHEDYN=YES turns on the global dynamic statement caching. But even if the dynamic state-ment caching is not effective, by having CACHEDYN set to YES, this will avoid taking S-mode DBD locks. So, this can be an effective tuning technique, but also bear in mind that if a lot of your SQL is running with RE-OPT(VARS), or if you have DDL being performed in the same unit of work as the DML, then it will not be effective. Another technique to avoid contention on the catalog, and di-rectory, and database descriptor, particularly for example customers using QMF, is to assign a unique auth ID and a private database to each user. So, each QMF user would have its own private table space, and its own private data-base. And therefore as a result each catalog page only con-taining value for a DBID or AUTHID. Also be careful about applications or query users querying the DB2 catalog and running this under ISOLATION repeat-able read, or using an SQL LOCK TABLE statement, be-cause this can lock up a large section of your catalog. Now, let’s turn to slide 14. Slide 14 (28:21)

Next major topic I want to talk about here is IRLM latch con-tention. Now, in this chart here, it shows in the top right hand corner, a section; and in fact, it’s the locking activities section of the DB2 statistics report. And the figures that are high-lighted in red here are some important statistics. First of all it tells you the total number of IRLM latch suspensions, and below that it talks about the total number of IRLM, or should I say “lock” requests: locks, unlocks, queries, and changes. And the rule of thumb is quite simple. You want to keep the amount of IRLM latch contention to be less than 1-5 percent of the total number of IRLM lock requests. Now, what this means here. What it means is that if the IRLM latch contention is les that 1 percent, this is a green condition and there is no problem whatsoever. If it’s more than 5 percent, this is serious or red zone condition that re-quires attention. And between 1 and 5 percent, this is an amber condition, which is a boundary condition that should be followed up on. So, below the rule of thumb on this chart here, it tells you how to do the calculation. So the IRLM latch contention is equal to the suspensions as identified above in the figure. The total number of IRLM requests is equal to lock plus unlock plus query and change requests. And basically if A divided B multiplied by 100 is less than 1 percent then every-thing is good. Whereas if it’s greater 5 percent, that’s a seri-ous condition that requires investigation. Well, let’s assume that the IRLM latch contention is bad. What can be possible causes of it?
One is to check that the IRLM lock trace is not permanently on. Another one is to make absolutely sure the IRLM is not running with a low dispatching priority. The only right answer here is to have the IRLM running under the WLM service class of SYSSTC. Also check the IRLM query requests like DISPLAY DATA-BASE LOCKS, or MODIFY irlmproc STATUS are not run-ning very frequently. And also check that you don’t have a very low deadlock detection cycle time like 1 second, or half a second, or tenth of a second, and at the same time having very high locking rates. If you have very high locking rates, you need to look at im-proving lock avoidance, and if you can’t reduce the very high locking rate, then you may well have to increase the IRLM deadlock detection cycle time. Now let’s turn to slide 15. Slide 15 (31:02) Now we’re going to switch gears into data sharing. One of the most important things to track for in data sharing is the amount of global lock contention. This is potentially the biggest constraint on the scalability and performance of a data sharing system. And again the rules of thumb are ex-pressed pretty simply, as basically: first of all you look at global lock contention. We want the total IRLM global lock contention to be less than 3 to 5 percent of XES IRLM requests. So, anything
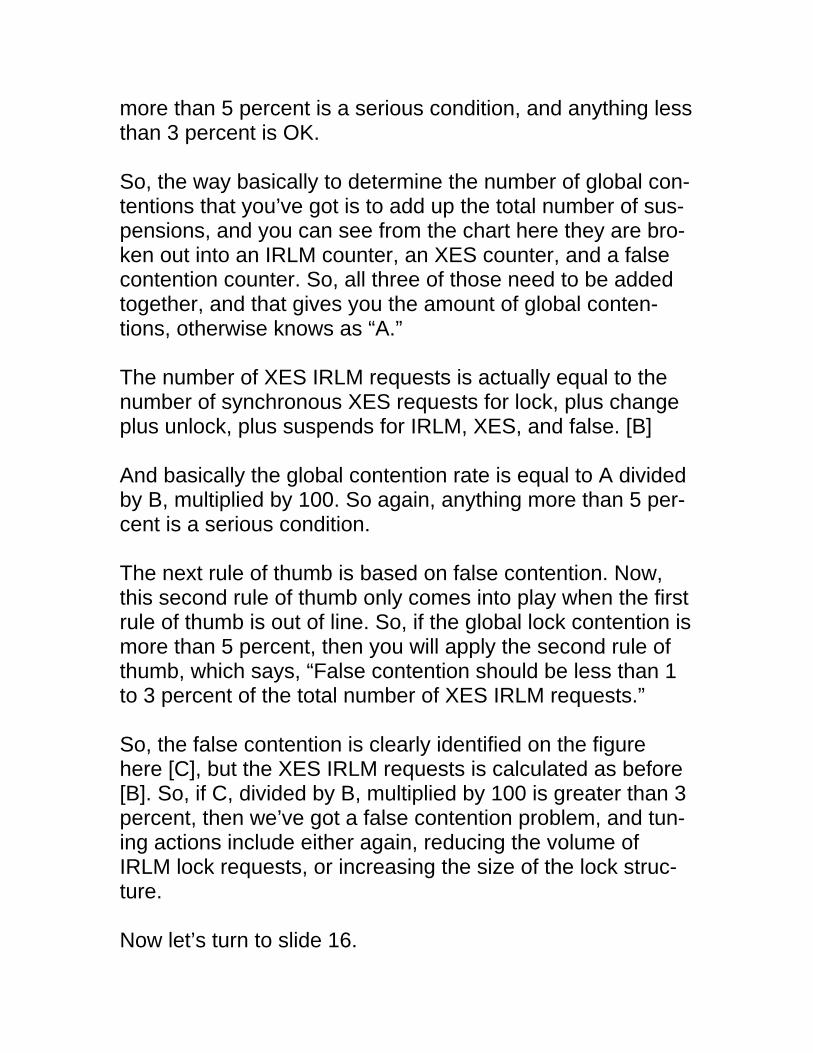
more than 5 percent is a serious condition, and anything less than 3 percent is OK. So, the way basically to determine the number of global con-tentions that you’ve got is to add up the total number of sus-pensions, and you can see from the chart here they are bro-ken out into an IRLM counter, an XES counter, and a false contention counter. So, all three of those need to be added together, and that gives you the amount of global conten-tions, otherwise knows as “A.” The number of XES IRLM requests is actually equal to the number of synchronous XES requests for lock, plus change plus unlock, plus suspends for IRLM, XES, and false. [B] And basically the global contention rate is equal to A divided by B, multiplied by 100. So again, anything more than 5 per-cent is a serious condition. The next rule of thumb is based on false contention. Now, this second rule of thumb only comes into play when the first rule of thumb is out of line. So, if the global lock contention is more than 5 percent, then you will apply the second rule of thumb, which says, “False contention should be less than 1 to 3 percent of the total number of XES IRLM requests.” So, the false contention is clearly identified on the figure here [C], but the XES IRLM requests is calculated as before [B]. So, if C, divided by B, multiplied by 100 is greater than 3 percent, then we’ve got a false contention problem, and tun-ing actions include either again, reducing the volume of IRLM lock requests, or increasing the size of the lock struc-ture. Now let’s turn to slide 16.

Slide 16 (33:19) On slide 16 are some notes here to help you. First of all when I talk about IRLM contention here, I’m talking about IRLM resource contention. This is true application lock con-tention. I’m going to talk about XES contention. This is contention at the XES, or at the system lock manager level. Remember, in data sharing there are two levels of lock manger. You’ve got the local IRLM lock manager, and then you’ve got the global-lock manager running inside XES. Now, the thing XES, is he only understands two lock modes: X and S. So, with that situation we have member 1 asking for IRLM lock mode IX and member 2 in IS, and they will get mapped to X and S respectively and have contention. So, this is often the cause of excessive global lock contention. So in DB2 Version 8, we made a major change with the in-troduction in new-function mode, giving you the ability of a thing called “Locking Protocol 2.” And this is a case of rob-bing Peter to pay Paul. So the idea of locking protocol 2 was to reduce the most common cause of XES global lock contention, which was re-lated to parent locks. But then is a penalty to be paid in cer-tain cases, and those penalties are listed on this chart. So, application which start a database or table space in read only mode, or use SQL LOCK TABLE, or use LOCKSIZE TABLESPACE, or table space scan with repeatable read,
they may end up taking more locks than they did before. But, generally speaking, locking protocol 2 has had a big impact in reducing XES global lock contention. And the last topic is false contention here when we have multiple different resources landing on the same lock table hash anchor point (LTE), and we go through the overhead of global lock management involving message passing to only find it’s a false contention, a false lead basically. Now, let’s turn to slide 17. Slide 17 (35:24) I now want to drill down a bit further on data sharing locking. And now, I’m going to focus on P-lock contention negotia-tion. Normal L-locks, transaction locks, for inter-transaction concurrency control, are not negotiable. But P-locks are special types of locks, which are aimed at ensuring physical concurrency, and the P stands for “physical.” These are reported separately. So, on slide 17 we have a section called the data sharing locking section of the DB2 statistics report, and it breaks out the negotiations at the page-set partition level, at the page level, and also for other P-locks. And the rule of thumb offered here is that total P-lock negotiation should be less than 3-5 percent of the total number of XES IRLM requests. So, below the rule of thumb there, this tells you how to calcu-late the various numbers. So P-lock negotiation is the sum of the three counters for P-lock negotiation at the page set par-tition, the page, and other (otherwise known as “A”).

And the XES IRLM requests [B] is the sum of lock, change, and unlock requests for SYNC XES, plus the number of sus-pends for IRLM, XES, and false. And again, if A over B, mul-tiplied by 100 is greater than 5 percent, then we’ve got a se-rious condition. Now, let’s turn to slide 18. Slide 18 (36:52) So, OK, if you have an excessive page P-lock negotiation going on, what could be the possible causes of it? Well, it’s most likely to be on space map pages in the data, on data pages when using row-level locking, or on index leaf pages. So, how can you identify what is the major culprit or contributor? So here’s a section, yet again, on slide 18 from the group buffer pool section of DB2 statistics report. And what you can see here, is that the suspensions and negotiations at the individual group buffer pool level are broken out by space map, data page, and index leaf pages. And what you can see in this example here is that most of the negotiations here are to do with index leaf pages. This is almost certainly due to index leaf page splits because the leaf pages become full and have to be split. A common question is what comes under P-lock negotiation. And what comes under that category are index tree P-locks, cast-out P-locks, and skeleton cursor table, and package ta-ble P-locks. And basically these are described in various

places in the documentation, and also in the instrumentation records. Now let’s turn on to slide 19. Slide 19 (38:09) So, what happens is you end up with excessive global lock contention on the space map pages or on data pages when using row-level locking. Well, there’s a reason behind why the space maps become hot, because the space map page could be servicing many, many data pages. In fact if you look at the partitioned table space, a regular space map page could be servicing up to 10,000 data pages. So, one thing that you can consider doing is setting TRACKMOD equal to NO. TRACKMOD equal to NO, the de-fault being YES, what TRACKMOD NO will do is turn off the tracking of modified pages in the space map page. The ad-vantage is that it will reduce the number of updates to the space map page and help reduce contention. The down side is that because we are no longer tracking this information, is for anybody using incremental image copy. The incremental image copy will now have to run for longer, because it will have to use a table space scan or partition scan to identify the changed pages, as opposed to using the space map to identify those changed pages. So, if for example, you’re not using any incremental image copy, it makes perfect sense to set TRACKMOD equal to NO. Equally, you may be making some very little use of in-cremental image copy, in which case, you can still set TRACKMOD equal to NO.

So, incremental image copy will still run, it just means it may run slower, because it has to do a table space scan. Now the other option, and a most important option, is ME-MEMBER CLUSTER. This option prior to Version 10 was only available for a partitioned table space, and it’s now available in Version 10 for the first time in the universal table space. And this is in the case when you have very hot space map pages, or you have space map page P-lock contention on the data pages when using row-level locking. The usual problem here is either by design in that you are appending new rows at the end of the page set partition, or because the distributed free space has been used up, and we’re now in-serting the new rows at the end of the page set partition. So what does MEMBER CLUSTER do? It does two things. First of all, it increases the number of space map pages. Rather than having one space map page per 10,000 pages, we now get one space map page per 199 data pages, so a significant increase in the number of space map pages. And the second thing that MEMBER CLUSTER does is it creates a loose affinity between data sharing member, and a space map page, and the associated number data pages. So, one of the tradeoffs of using member cluster is that you also loose clustering of the data rows. Now, something I said earlier in this presentation, in this web lecture, was about using LOCKSIZE PAGE as a design de-fault and using LOCKSIZE ROW sparingly. I can tell you that some customers don’t listen to that recommendation, and it’s

quite a common occurrence that people use LOCKSIZE ROW and will be inserting the rows at the end of the table space by design with APPEND, or because distributed free space is exhausted, and will end up with excessive page P-lock on the space map page, and on the data pages. Then one way of dealing with this is using MEMBER CLUS-TER when using LOCKSIZE ROW. So, generally speaking, if an object is going to be group buffer pool dependent, I wouldn’t use LOCKSIZE ROW, unless I also had MEMBER CLUSTER specified. But it’s like peas and carrots go well together. Once you use MEMBER CLUSTER with LOCKSIZE ROW, LOCKSIZE ROW can then deliver lots more value. Not just in terms of reducing the page P-lock and page latch contention. It can also result in better space use by reducing the working set of pages in the buffer pool. Now let’s turn to slide 20. Slide 20 (42:05) But now we have a few “buts” OK? The first one is a very special case. Do not use LOCKSIZE ROW without MEMBER CLUSTER when inserting at the end. Now I say it’s a special case, but it occurs too often. And as I’ve already discussed on slide 19, this can result in excessive page P-lock contention. The other one is, do not use LOCKSIZE ROW with or with-out MEMBER CLUSTER if you have a mixed insert/update workload. Because, basically then, although MEMBER

CLUSTER helps with the insert case, it doesn’t help with the update and delete cases. So a better choice in these cir-cumstances is to consider using MAXROWS 1 with LOCK-SIZE PAGE to simulate row-level locking. This may only be a practical proposition however on small to medium-sized tables. Let’s turn to slide 21. Slide 21 (42:59) Another thing to look at here is the number of claim re-quests, again looking at the accounting information. The number of claim requests can provide a very rough es-timate of the number of table space and partition locks being acquired when effective thread reuse with RE-LEASE(COMMIT) is required, or even without thread reuse. So, basically, 50 percent is a recommended rule of thumb here on the number of claim requests, to give you that rough estimate on the number of objects being touched. So this assumes basically a claim request is once per index and once per table space partition. So, when you’re looking for a good candidate, for example in Version 10 or even prior to Version 10, for thread reuse and RELEASE(DEALLOCATE), a good recommendation here is to use the claim count, and a high-end claim count, to iden-tify good candidates for using RELEASE(DEALLOCATE). Now let’s turn to slide 22.

Slide 22 (43:50) Next major topic here, is to look at DB2 internal latch conten-tion. DB2 uses an internal mechanism called latch manage-ment and contention to serialize certain activities within DB2. It’s a type of a lock, but it’s a memory-based locking mecha-nism, used by DB2 to serialize activity. Now these are reported in the statistics trace. An example is shown on chart 22 here. And we have this array or matrix here of 32 latch-counters. Now what I want to say here is there are many more than 32 different types of latches inside DB2. So we actually have a hierarchy of latches, we just happen to be reporting externally in a matrix of 32. And the rule of thumb here, is a total of internal latch conten-tions on individual counters needs to be less than 1,000 to 10,000 per second. So, basically, anything more than 10,000 per second is a serious red-zone condition that requires at-tention. And you’ll almost certainly have to open a PMR with DB2 level-2 in order to get guidance on how to tune the problem. Anything less that 1,000 a second is not even worth bothering about. So an example here, you can see on the example I’ve got here, that almost all the counters bare one are all below 1,000 a second, and not particularly to worry about. The one that is greater than 1000 a second, a boundary condition, is latch class 24. So, what’s bad about latch contention?

First of all, let me tell you what happens prior to Version 10. Prior to Version 10, the way that DB2 latch contention man-agement works is that when you have multiple requestors contending for the latch, all the waiters are suspended. And then when the latch holder gives up the resource, all the waiters are thrown up into the air, and it’s a first-come first-served model, and then all the latch waiters are suspended again. So, if you have very high levels of latch contention, then the waiters are continually woken up to contend for the latch, and then suspended again. And if you’ve got account-ing trace class 3 turned on, which is most typically the case, this will also aggravate the cost. So, the key thing is to get to the root cause of the problem because it’s not a general recommendation to run with class 3 disabled. So, some of these latch contention counters are my friends, so to speak because of their common occurrence. For ex-ample, latch class 6 is related to index leaf page split activity when your objects are group buffer pool dependent in data sharing. Latch class 14 is actually the buffer manager LRU latch. Latch class 19 is the log output buffer latch. And my good friend latch class 24 is either related to prefetch or re-lated to the EDM LRU main latch. So, now let’s turn to slide 23. Slide 23 (46:47) Now, let’s just say a little bit more about these latches.

Latch class 6 is related to index tree P-lock contention when you have index page splits, or structure modifications, when the index is group buffer pool dependent. An index split is particularly painful in performance for data sharing. It results in two forced physical log writes. Now, one thing that can help here is to actually place your log on faster devices or channel technology to reduce the time. But one key thing you can do to reduce the amount of activity is to go off to re-ducing the number of index leaf page splits. So, things that you can do, for example, is consider increas-ing the amount of distributed free space, so that when LOAD or REORG is run, it will leave more distributed free space. Another approach is to minimize the key size, especially if you’ve got a multi-column index and some of the columns are used to improve performance. So, if you can reduce the number of columns there, and trade a little bit of perform-ance to reduce index leaf page splits, that’s an option. If you have indexes that contain large VARCHAR columns, then you may want to consider switching to non-padded in-dexes. Version 9 has a pretty good solution here, with using large index page size. In Version 9 you can use a large in-dex page size with or without index compression. And whether your inserts into the index or random or sequential, this can have a big impact on reducing the number of leaf page splits. But correspondingly, if you go for a large index page size, you have to consider increasing the size of your index buffer pool. Another feature in Version 9 that happens automatically is the asymmetric leaf page split. This will help if you have in-dex hot spots where you have a cluster of new index entries
or rids where the keys are going in ascending or descending order. Now the number of index leaf page splits is recorded in SYS-INDEXPART, and also in RTS using the field names de-scribed in this chart. You can also identify this in IFCID 57 OK? Now, let’s turn to slide 24. Slide 24 (48:58) Latch class 14, is the buffer pool latch. This can occur if you have many table spaces and indexes all assigned to one big buffer pool. So, one thing that you can do to help here is to actually run multiple buffer pools and to split the table space and indexes across separate buffer pools. So, another approach if you have many objects assigned to a buffer pool is to try making that buffer pool larger as well. If you do have high latch class 14 contention, at least use a buffer pool with at least 3,000 pages. Another approach to dilute the impact on the LRU latch is basically to change the steal algorithm. Now this should only be applied very carefully. It should only be used when the particular, you know, index or tables spaces in a given buffer pool cache very well. The default is to use a steal algorithm of LRU, in which case DB2 buffer manager has to maintain the LRU chains. But what you could do is to switch to FIFO provided the index and table space objects cache very well in the buffer pool.
And basically, FIFO has the ability here to reduce the CPU time for LRU chain management, and also reduce the CPU time for the latch class 14 contention. Now, let’s turn to slide 25. Slide 25 (50:16) Latch class 19 is related log output buffer. And basically there is only one latch for the whole buffer, and basically every time an agent or resource manager in DB2 wants to generate a log record, he has to acquire this latch as he moves the strings or bytes related to the log record into the buffer. So, what can you do to help? Well, you could consider replacing INSERT, UPDATE, and DELETE with LOAD, RESUME, and REPLACE with LOG NO. If a mass delete is occurring, which is an SQL DELETE without a WHERE clause, you could consider using a seg-mented or a universal table space. Other possible rogue conditions could be that the log output buffer is actually paging, because the amount of real storage has been overcommitted. So, what you could consider doing here, is basically allocating more real storage, or reducing the size of buffer pools to avoid the paging. Another rogue condition is the log output buffer may be un-available. In other words, the log output buffer is full of log records, and they need to be written out, before we can start

writing more log records. So, the things that you can do here is to actually move the log data sets to faster devices, or faster channels, or to make the log output buffer larger. Now, let’s turn to slide 26. Slide 26 (51:34) Latch class 24 is one of the most common forms of latch contention, but it is at least two types of latch contention be-ing mapped onto that one counter. And it’s very important to know which one it is. So, for example, the most common cause happens to be EDM LRU latch contention. Now, the other type is called pre-fetch scheduling, where DB2 is trying to avoid concurrent prefetches to the same section of a page set partition. And the only way to have a solid answer to know which type of latch contention it is, is to run IFCID 57 and to look at the latch type. So hex 18 is the LRU latch, and hex 38 is the pre-fetch scheduling. So if it is the EDM LRU latch, then make sure you use the EDMBFIT parameter value of NO. This parameter stands for EDMBFIT, and this parameter is definitely being phased out in DB2. I often refer to this EDMBFIT as “EDM worst fit,” and the only right answer here is really to set the value to NO. Another thing you can do for high-volume transaction is con-sider using the thread reuse with selective use of RE-LEASE(DEALLOCATE) to avoid going through commit processing for frequently executed packages.

Now on the other hand, if the problem is prefetch scheduling, then you might want to see if you’re doing wasteful prefetch scheduling. So for example, sometimes customers have buffer pools which are assigned to data-in-memory objects, that have a very good buffer pool hit ratio. If that’s the case, then you want to disable dynamic prefetch by setting the buffer pool parameter VPSEQT to 0. So why is this effective? Because, if you have a data set that caches very well, and there aren’t prefetches being trig-gered, then all the prefetch engine is doing is scheduling the engine looking around in the buffer pool to find out all the pages that are in the buffer pool, and there’s no work to do. So, therefore, it is really wasteful scheduling of the prefetch engine. Now this completes this web lecture on locks and latches. And I hope that you’ll tune in for other lectures in this series. Thanks you very much! End (53:43)