DB12-1397R Activation of PPARα ameliorates hepatic insulin ... · Building 202, Level 4, PO Box...
38
DB12-1397R Activation of PPARα ameliorates hepatic insulin resistance and steatosis in high fructose-fed mice despite increased ER stress Running Title: PPARα activation eliminates hepatic insulin resistance against increased ER stress Stanley MH Chan 1* , Ruo-Qiong Sun 1* , Xiao-Yi Zeng 1 , Zi-Heng Choong 1 , Hao Wang 1 , Matthew J. Watt 2 and Ji-Ming Ye 1 † 1. Molecular Pharmacology for Diabetes Group, Health Innovations Research Institute and School of Health Sciences, RMIT University, Melbourne, VIC, Australia; 2. Biology of Lipid Metabolism laboratory, Department of Physiology, Monash University, Melbourne, VIC, Australia; * These authors contributed equally to the work and shall be regarded as first co-authors † Corresponding author: Professor Ji-Ming Ye, PhD, MD Molecular Pharmacology for Diabetes Group Health Innovations Research Institute and School of Health Sciences RMIT University Building 202, Level 4, PO Box 71, Melbourne, VIC 3083, Australia Tel: + 61-3-9925 7419 Fax: + 61-3-9925 7178 Email: [email protected] Page 1 of 38 Diabetes Diabetes Publish Ahead of Print, published online January 24, 2013
Transcript of DB12-1397R Activation of PPARα ameliorates hepatic insulin ... · Building 202, Level 4, PO Box...
DB12-1397R
Activation of PPARα ameliorates hepatic insulin resistance and steatosis in high
fructose-fed mice despite increased ER stress
Running Title: PPARα activation eliminates hepatic insulin resistance against increased ER
stress
Stanley MH Chan1*
, Ruo-Qiong Sun1*
, Xiao-Yi Zeng1, Zi-Heng Choong
1, Hao Wang
1, Matthew J.
Watt2 and Ji-Ming Ye
1†
1. Molecular Pharmacology for Diabetes Group, Health Innovations Research Institute and School
of Health Sciences, RMIT University, Melbourne, VIC, Australia;
2. Biology of Lipid Metabolism laboratory, Department of Physiology, Monash University,
Melbourne, VIC, Australia;
* These authors contributed equally to the work and shall be regarded as first co-authors
† Corresponding author:
Professor Ji-Ming Ye, PhD, MD
Molecular Pharmacology for Diabetes Group
Health Innovations Research Institute and School of Health Sciences
RMIT University
Building 202, Level 4, PO Box 71, Melbourne, VIC 3083, Australia
Tel: + 61-3-9925 7419 Fax: + 61-3-9925 7178
Email: [email protected]
Page 1 of 38 Diabetes
Diabetes Publish Ahead of Print, published online January 24, 2013

ABSTRACT
Endoplasmic reticulum (ER) stress is suggested to cause hepatic insulin resistance by increasing de
novo lipogenesis (DNL) and/or directly interfering with insulin signaling via activation of the JNK
and IKK pathway. The present study interrogated these two proposed mechanisms in a mouse
model of hepatic insulin resistance induced by a high fructose (HFru) diet with the treatment of
fenofibrate (FB, 100 mg/kg/day), a PPARα agonist known to reduce lipid accumulation while
maintaining elevated DNL in the liver. FB administration completely corrected HFru-induced
glucose intolerance, hepatic steatosis and the impaired hepatic insulin signaling (pAkt and
pGSK3β). Intriguingly, both IRE1/XBP1 and PERK/eIF2α arms of the UPR signaling were
activated. While retaining the elevated DNL (indicated by the upregulation of SREBP1c, ACC,
FAS and SCD1 and 3H2O incorporation into lipids), FB treatment markedly increased FA oxidation
(indicated by induction of ACOX1, pACC, β-HAD activity and 14
C-palmitate oxidation) and
eliminated the accumulation of diacylglycerols (DAGs) which is known to impact on insulin
signaling. Despite the marked activation of UPR signaling, neither JNK nor IKK appeared to be
activated. These findings suggest that lipid accumulation (mainly DAGs), rather than the activation
of JNK or IKK is pivotal for ER stress to cause hepatic insulin resistance. Therefore, by reducing
the accumulation of deleterious lipids, activation of PPARα is able to ameliorate hepatic insulin
resistance against increased ER stress.
(Word count 222)
Key words: PPARα activation, ER stress, lipid synthesis, fatty acid oxidation, JNK/IKK, hepatic
insulin signaling
Page 2 of 38Diabetes

INTRODUCTION
Liver is one of the most metabolically active and insulin responsive organs regulating glucose
homeostasis, lipid metabolism and protein synthesis (1). Under normal conditions, insulin
suppresses hepatic glucose production from glycogenolysis and gluconeogenesis while promotes
glucose storage in the form of glycogen to help control postprandial glucose level. However, the
ability of insulin to shut down glucose production from the liver is diminished under the state of
hepatic insulin resistance which in turn leads to the manifestation of hyperglycaemia (2). Although
the pathogenesis of hepatic insulin resistance is likely to be multi-factorial, increased endoplasmic
reticulum (ER) stress and an accumulation of lipids within the liver have been demonstrated to be
important mechanisms (3; 4).
Lipid accumulation in the liver or hepatic steatosis can lead to insulin resistance by interfering with
the insulin signal transduction through lipid metabolites such as diacylglycerols (DAGs) and
ceramide (4). Hepatic steatosis can result from increased FA influx, elevated de novo lipogenesis
(DNL) and/or reduced fatty acid (FA) oxidation (1; 4). In humans, elevated DNL from the increased
consumption of sucrose is the predominant mechanism for the development of hepatic steatosis
with fructose (breakdown product of sucrose) being the major culprit (5; 6).
Recent studies in animal models (7; 8) have identified a possible role of ER stress in the
development of hepatic insulin resistance during elevated DNL. When ER stress occurs, the ER
mounts the unfolded protein response (UPR) which involves the activation of three major branches
of signal transducers: inositol-requiring protein 1 (IRE1), protein kinase RNA-like ER kinase
(PERK) and activating transcription factor 6 (ATF6) (9). Activation of these canonical mechanisms
is crucial for cellular adaption and resolution of ER stress. However, chronic activation of UPR
signaling has been demonstrated to activate c-jun N-terminal kinase (JNK) and IκB kinase (IKK).
Page 3 of 38 Diabetes

The IRE1 branch of the UPR can activate JNK (10) and IKK (11) by forming a complex with the
tumor-necrosis factor-α-receptor-associated factor 2 (TRAF2). Meanwhile, the PERK/eIF2a branch
has also been reported to be capable of activating JNK (12). As activated JNK (8; 13) and/or IKK
(14) can directly serine/threonine phosphorylate insulin-receptor-substrate (IRS) leading to the
inhibition of insulin signaling transduction, it has been suggested that JNK and IKK are the key
molecules linking activated UPR and hepatic insulin resistance (15).
More recently, we have found that elevated DNL and insulin resistance in the liver of high fructose
(HFru) fed mice is coupled with activation of the IRE1 and PERK branches of the UPR (16).
However, it is unclear whether hepatic insulin resistance results from lipid accumulation or
activated JNK/IKK pathways during increased ER stress. Interestingly, hepatic DNL is increased by
the activation of PPARα (17; 18) which has also been shown to reverse hepatic steatosis (19; 20).
Because ER stress is tightly associated with DNL, we hypothesized treatment of HFru-fed mice
with a PPARα agonist would activate both the IRE1 and PERK branches while
preventing hepatic steatosis. Under these conditions, we would then be able to interrogate the
implication of these two mechanisms (lipid accumulation or activated JNK/IKK) in hepatic insulin
resistance in the face of increased ER stress. Our results showed that accumulation of lipids namely
DAGs, rather than the activation of JNK or IKK, is the key factor of hepatic insulin resistance
during increased ER stress. Activation of PPARα with FB is able to eliminate hepatic insulin
resistance during HFru feeding by reducing DAG levels despite the presence of ER stress evidenced
by the dual activation of the IRE1/XBP1 and PERK/eIF2α pathways.
Page 4 of 38Diabetes

MATERIAL AND METHODS
Animals
Male C57BL/6J mice (14 weeks) from the Animal Resources Centre (Perth, Australia) were kept at
22±1°C on a 12-h light/dark cycle. After 1 week of acclimatization, mice were fed ad libitum for up
to 15 days with either a chow (CH), fructose-rich (HFru) diet. CH diet consisted of 70% calories
from starch, ~10% calories from fat, and ~20% calories from protein (Specialty Feeds, Glen
Forrest, Western Australia), HFru diet (35% fructose, 35% starch, ~10% fat and ~17% protein). The
detailed recipe for the HFru diet is described in our previous studies (16; 21). FB (Sigma-Aldrich,
Australia) was supplemented to the animal by mixing into the diets at a concentration of
100mg/kg/day. All experiments were approved by the Animal Ethics Committees of the RMIT
University (#1012).
Body weight and food intake were measured daily. The whole body metabolic rate was measured at
22ºC using an indirect calorimeter (Comprehensive Laboratory Animal Monitoring System,
Columbus Instruments, OH, USA) as described previously (22) between 5-8 days after the
administration of FB. Mice were fasted for 5-7 hours before being killed, tissues of interest were
collected and freeze-clamped immediately. Epididymal fat mass was weighed using an analytical
balance. Liver triglycerides were extracted by the method of Folch and determined by a
Peridochrom Triglyceride GPO-PAP kit (Roche Diagnostics, Australia) as previously described
(16). In separate experiments, glucose tolerance tests (GTT; 2.5g glucose/kg BW, ip) were
performed on the 5-7 hours fasted mice using a glucometer (AccuCheck Proforma Nano; Roche,
Victoria, Australia) and blood samples were collected at 0, 30 and 60 min for plasma insulin
measurement. For the assessment of insulin signaling in the liver, the mice were injected with
insulin (2U/kg BW, ip) 20 min before tissue collection.
Page 5 of 38 Diabetes

Measurement of hepatic FA oxidation de novo lipogenesis (DNL)
FA oxidation was measured in liver homogenates using methods described previously (23). Briefly,
the liver homogenate (50 µl) was incubated at 30°C for 90 min in a reaction mixture (pH 7.4)
containing (in mM) 0.2 [14C]-palmitate (0.5 µCi), 2 L-carnitine and 0.05 Coenzyme A ±0.02
etomoxir, a specific inhibitor of FAs oxidation in mitochondria (24). The reaction was stopped by
ice-cold 1 M perchloric acid. CO2 produced from the reaction was captured in 1 M NaOH. 14C
counts in the acid-soluble fraction were combined with the CO2 values to give the total palmitate
oxidation rate. Hepatic DNL was determined by measuring the incorporation of [3H]-H2O into
triglyceride in the liver as described previously (16; 25).
Citrate synthase and β3 – hydroxyacyl– CoA dehydrogenase (β-HAD) activity
Approximately 20 mg of frozen liver tissue was homogenized in 175 mM KCl and 1.98 mM EDTA
containing buffer (pH 7.4) with a glass homogenizer before being subjected to three freeze-thaw
cycles. Citrate synthase and β-HAD activities were determined as described previously (16; 21),
using a Flexstation 3 plate reader (Molecular Devices, Sunnyvale, CA).
Western blotting
Liver and red quadriceps muscle samples were homogenized in ice-cold lysis buffer at pH 7.5
containing (in mM): 50 Tris, 150 NaCl, 1% Triton X-100, 10 NaP, 100 NaF, 2 Na3VO4, 1 EDTA,
1 EGTA and 10% glycerol supplemented with protease inhibitor cocktail and phosphates inhibitor
cocktail (Sigma Aldrich Pty Ltd, Australia) and DL-dithiothreitol. Protein samples were then
denatured in SDS sample buffer (125 mM Tris-HCl, pH 6.8, 50% glycerol, 2% SDS, 5% β-
mercaptoethanol and 0.01% bromophenol blue). The insulin signal transduction was assessed by
total- and phospho (Ser473)- Akt, total- and phospho (Ser219)- glycogen synthase kinase 3β (GSK-
3β) (Cell Signaling, USA). Key lipogenic enzymes were by Western blotting using specific
antibodies including sterol regulatory element-binding protein (SREBP-1c, Santa Cruz, USA),
Page 6 of 38Diabetes

phospho and total acetyl-CoA carboxylase (ACC, Cell Signalling, USA), fatty acid synthase (FAS,
Cell Signalling, USA), stearoyl-CoA desaturase 1 (SCD-1, Cell signaling, USA). Oxidative
capacity: acyl-coenzyme A oxidase 1 (ACOX1, Santa Cruz). ER stress: phospho (Thr980)- protein
kinase RNA-like endoplasmic reticulum kinase (p-PERK, Cell signaling, USA), total- and phospho
(Ser51)- eukaryotic translation initiation factor 2α (eIF2α, Cell signaling, USA), growth arrest and
DNA damage-inducible protein 34 (GADD34, Cell signaling, USA), C/EBP homologous protein
(CHOP, Santa Cruz, USA), and phospho (Ser724)- inositol-requiring kinase 1 (IRE1, Abcam,
USA), X-box binding protein 1 (XBP1, Santa Cruz, USA), Activating transcription factor 6 α
(ATF6α, Santa Cruz, USA). Serine/theronine kinases: phospho- (Ser176/177) IκB kinase α/β
(IKKα/IKKβ, Cell Signalling, USA), IκB alpha (IκBα), phospho- (Thr183/Tyr185) c-jun N-
terminal kinase (JNK, Cell Signalling, USA). Immunolabeled bands were quantified by
densitometry and representative blots are shown.
Analyses of hepatic lipids
Diacylglycerol (DAG) and ceramide were extracted and quantified according to the methods of
Preiss et al. (26). Lipids were extracted from liver homogenates using chloroform: methanol:
PBS+0.2% SDS (1:2:0.8). Diacylglycerol kinase and 32
P-labelled ATP (0.55 GBq/mmol cold ATP)
were added to the lysates preincubated with cardiolipin/octylglucoside, and the reaction was
stopped after 2.5 h by the addition of chloroform: methanol (2:1). Samples were spotted onto thin-
layer chromatography plates and developed. 32
P-labelled phosphatidic acid and ceramide-1-
phosphate were identified by autoradiography, dried, scraped from the thin-layer chromatography
plate and counted in a liquid scintillation analyser (LS6500, Beckman Coulter Inc, USA).
Statistical analyses
Page 7 of 38 Diabetes

Data are presented as means ± SE. One-way analysis of variance was used for comparison of the
relevant groups. When significant differences were found, the Turkey-Kramer multiple
comparisons test was applied. Differences at p<0.05 were considered to be statistically significant.
RESULTS
FB treatment normalises HFru feeding induced adiposity and improved glucose intolerance.
HFru-feeding resulted in significant increases in calorie intake (~38%), the whole body oxygen
consumption (VO2, ~ 8%) and the respiratory exchange ratio (RER), body weight gain (1.2 g) and
adiposity (67% in epididymal fat mass, p<0.05) compared to untreated CH-fed animal (CH-Veh)
(Table 1). In CH-fed mice, FB treatment had no significant effects on body weight gain, adiposity,
caloric intake or RER except for a 14% increase in VO2 (p<0.05 vs CH-Veh). In HFru-FB-fed mice,
FB significantly (p<0.05 for all) increased VO2 (8%), reduced the RER and completely diminished
HFru-induced body weight gain and adiposity. FB lowered blood glucose and insulin levels in the
HFru-fed mice (both p<0.01 HFru-FB), hence an improved HOMA-IR index. The untreated HFru-
fed mice displayed glucose intolerance (Figure 1A) compared to CH-Veh (Figure 1A and B). FB
treatment completely normalized the glucose tolerance seen in the HFru-fed mice to the levels of
the CH-fed mice and reduced the requirement for plasma insulin level (Figure 1C).
FB treatment restored hepatic insulin signal transduction in HFru-fed mice.
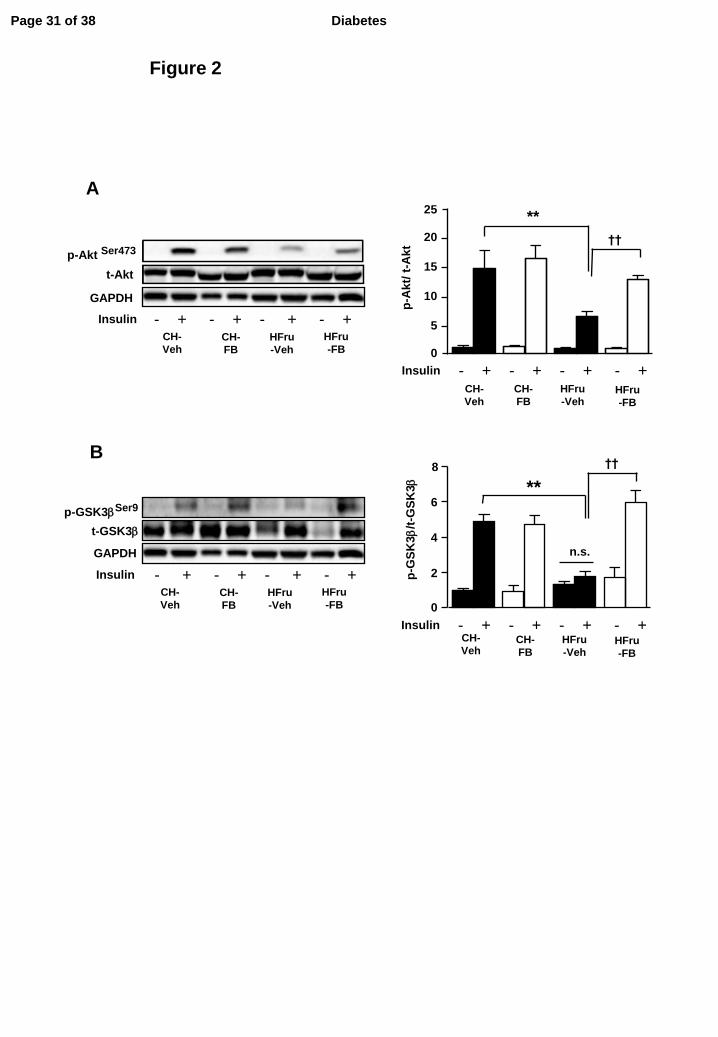
In skeletal muscle, the insulin stimulated phosphorylation of Akt (all p<0.001 vs corresponding
basal) was unaltered by diet or FB treatment (Figure S1). In contrast, HFru feeding blunted the
insulin-stimulated phosphorylation of Akt (by 53%, p<0.01 vs CH) and its downstream target
GSK3β (by 60%, p<0.001 vs CH) in the liver which were fully restored by the treatment of FB
(Figure 2A and Figure 2B). This indicated HFru feeding resulted in impairment of hepatic insulin
Page 8 of 38Diabetes

signaling and that treatment of FB was effective in restoring hepatic insulin sensitivity.
FB treatment normalised hepatic lipid accumulation.
Lipid accumulation in the liver (ie. hepatic steatosis) is believed to be closely linked to insulin
resistance (1), we hence examined the effects of FB treatment on hepatic lipid content. As expected,
the HFru feeding induced a marked increase in hepatic triglycerides (TG) levels (2.7-fold, p<0.01
vs CH) which was ameliorated by the treatment of FB (Figure 3A), while the fasting plasma TG
levels were unaffected between the HFru-Veh and HFru-FB group (Table 1). In agreement with an
increased TG level, hepatic DAG content of the HFru-fed mice was also elevated by 53% (p<0.05
vs CH) which was normalised by the treatment of FB (Figure 3B). The total content of ceramide
was attenuated by 57% (p<0.001 vs CH) by HFru-feeding, but was restored (ns. vs CH and CH-FB)
by the treatment of FB (Figure 3C). These data suggested the implication of DAG in the apparent
hepatic insulin resistance resulting from HFru feeding.
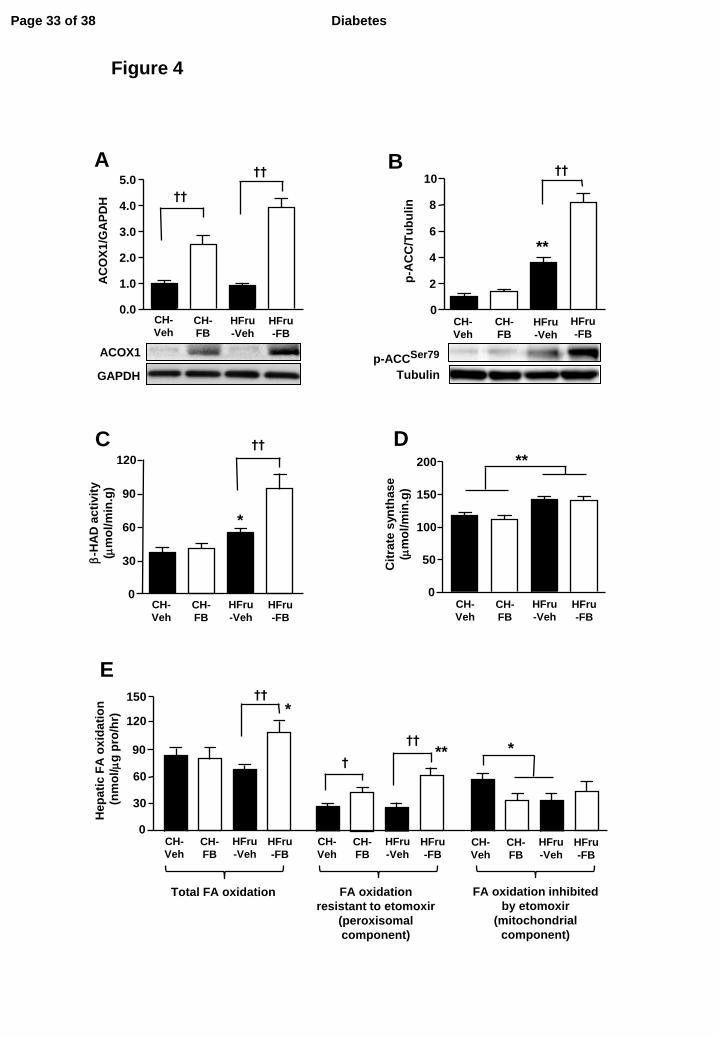
FB treatment increases hepatic fat oxidation under HFru-feeding
As enhanced FA oxidation is one of the key events resulting from the activation of PPARα by FB in
the liver (27-29), we measured molecular markers of oxidative capacity in the livers of mice. The
expression of peroxisomal acyl-Coenzyme A oxidase-1 (ACOX1), a direct downstream effector of
PPARα activation, which catalyses the first step of peroxisomal β-oxidation of FAs (30), was
markedly up-regulated in response to the treatment of FB (Figure 4A). Moreover, the
phosphorylation of ACC which regulates the mitochondrial β-oxidation of FAs was markedly
elevated (8-fold, p<0.001 vs CH-Veh and HFru-Veh) in response to FB treatment in the liver of the
HFru-fed mice (Figure 4B). In line with an increased oxidative capacity, the activity of β-HAD,
which catalyses the third step of mitochondrial β-oxidation, was augmented by 2.4-fold (p<0.01 vs
CH-Veh and HFru-Veh) with FB treatment in the HFru-fed mice (Figure 4C). The activity of citrate
Page 9 of 38 Diabetes

synthase was significantly enhanced (by 19%, p<0.01 vs CH) under HFru feeding independent of
PPARα activation (Figure 4D), indicating PPARα activation specifically enhances the oxidative
capacity of the liver without affecting mitochondrial content under HFru feeding. Hepatic FA
oxidation was increased (~60%) by the treatment of FB in the HFru-fed mice and this was due to an
increase in the component resistant to the inhibition by etomoxir (Figure 4E).
FB treatment triggered the activation of UPR pathways in the liver
Having established that treatment of FB was effective in eliminating hepatic lipid accumulation and
restoring insulin signaling, we next sought to examine its effects on the three major UPR pathways.
The phosphorylation of IRE1 (Figure 5A), spliced form of XBP1 (sXBP1; Figure 5B),
phosphorylation of PERK and eIF2α (Figure 5C and D), as well as the expression CHOP (Figure
5E) were markedly enhanced by PPARα activation regardless of the feeding conditions. In addition,
the expression of GADD34, a well-characterized phosphatase of eIF2α (9) was concomitantly
down-regulated in response to PPARα activation (Figure 5F). As expected, HFru feeding
significantly increased the phosphorylated form of IRE1 (Figure 5A, p<0.05 vs CH) and eIF2α
(Figure 5D, p<0.01 vs CH). No changes were detected in the maturation of activating transcription
factor 6 (ATF6) as a result of HFru-feeding or FB treatment (Figure S2).
FB -induced UPR signaling was accompanied by an enhanced DNL
As both activation of PPARα (28) and UPR signaling (7) can promote DNL in the liver via the
action of sterol regulatory element-binding protein-1c (SREBP1c) (31), we hence examined the
expression of SREBP1c and key enzymes involve in this process. Our western blotting analysis
revealed up-regulations of the mature form of SREBP1c (mSREBP1c, 3-fold, p<0.05 vs CH-Veh),
ACC (3.5-fold, p<0.01 vs CH-Veh), FAS (2.5-fold, p<0.001 vs CH) and SCD1 (14.5-fold, p<0.01
vs CH-Veh) in the liver of the HFru-fed mice (Figure 6A-D). PPARα activation in the CH-fed mice
stimulated the expression of mSREBP1c, ACC, FAS and SCD1 to levels comparable to that of the
Page 10 of 38Diabetes

HFru-fed mice. PPARα activation in conjunction with HFru-feeding elicited a further increase in
the expression of mSREBP1c (6-fold) and SCD1 (38-fold, both p<0.001 vs HFru-Veh), but not
ACC (2.8-fold, p<0.01 vs CH) nor FAS (2.9-fold, p<0.001 vs CH, both not different vs HFru-Veh).
In keeping with the up-regulated lipogenic enzymes, hepatic DNL was significantly increased (~38
%) by PPARα activation in CH-fed mice and this increase was maintained in FB treated HFru-fed
mice (Figure 6E). These data suggested the FB-induced UPR signaling may enhance the lipogenic
capacity of liver independent of the effects of dietary fructose.
The downstream effects of the FB -induced UPR signaling
Production of deleterious lipids (lipotoxicity) via DNL and activation of serine/threonine kinases
are key consequences of UPR signaling which interferes with insulin signal transduction at various
points (15). As shown in Figure 3B, treatment of FB was able to correct the elevated DAG content
induced by HFru-feeding. Meanwhile, activation of JNK and IKK are well-demonstrated
consequences of UPR signaling resulting in the impairment of insulin signal transduction (3). HFru
feeding did not result in a significant induction of JNK (Figure 7A) or IKK (Figure 7B), and the
expression of IκBα (Figure 7C), the downstream target of IKK (32), remained unaffected which is
consistent with our previous observation (16). Despite the significant induction of the two specific
arms of UPR pathways, the phosphorylation status of these kinases remained unaffected in response
to FB treatment (Figure 7A to C). These data suggested PPARα activation is effective in eliminating
lipotoxicity and that the FB-induced UPR signaling did not result in the activation of these stress
kinases.
Page 11 of 38 Diabetes

DISCUSSION
The present study has established a hepatic ER stress model independent of lipid accumulation in
the liver with the use of PPARα activator fennofibrate (FB) in HFru-fed mice. This model enabled
us to examine the effects of ER stress on hepatic insulin sensitivity devoid of the influence of
hepatic steatosis. Our data showed that PPARα activation completely eliminate HFru-induced
hepatic steatosis and insulin resistance without altering JNK and IKK in the face of marked dual
activation of the IRE1/XBP1 and PERK/eIF2α branches of the UPR pathways. These findings
indicate that hepatic steatosis, but not JNK, is required for ER stress to cause insulin resistance. To
the best of our knowledge, this is the first report to demonstrate that PPARα activation induces UPR
signaling while ameliorating hepatic insulin resistance.
PPARα is a key transcriptional regulator for lipid metabolism and it can be endogenously activated
by FAs, as well as pharmacologically by agonists like FB (17). FB is a specific agonist of PPARα
commonly used to treat dyslipidaemia and hypercholesterolemia in humans (33). These beneficial
effects are attributed to the PPARα-driven peroxisomal and mitochondrial β-oxidation and
microsomal ω-oxidation of FA with the liver being a major site of action (34). Our data showed that
FB treatment was effective in activating PPARα in vivo as evidenced by the increased expression of
ACOX1 (also known as palmitoyl-CoA oxidase) (35) which is a direct target of PPARα. The
concomitant increase in VO2 and the induction of the phosphorylated form of ACC and β-HAD
activity along with the augmented FA oxidation in the liver are indicative of an enhanced oxidative
capacity and energy expenditure which are consistent with the reported effects of PPARα activation
(34; 36). In line with the upregulation of ACOX1 expression, FB-induced increase in hepatic FA
oxidation can be attributed to the enhanced peroxisomal oxidation that is not inhabitable by
etomoxir which blocks the entry of long-chain FAs into mitochondria for oxidation. It has been
reported that peroxisomal oxidation break down (very) long-chain FAs into medium and short chain
FAs further oxidation in mitochondria (36). Unlike long chain FAs, the short- and medium-chain
Page 12 of 38Diabetes

FAs do not rely on CPT1 to enter the mitochondria (36) which may explain, at least in part, the
increased oxygen consumption as observed at the whole body level. It is likely that the reduced
body weight and adiposity observed only in FB treated HFru-fed mice is due to the enhanced
peroxisomal oxidation which was not evident in treated CH-fed mice.
The restored HOMA-IR resulting from the lowered fasting blood glucose and insulin levels,
together with the restored hepatic insulin signal transduction in the HFru-fed mice by FB are
suggestive of improved insulin sensitivity in these mice. This interpretation is also supported by the
striking reduction in insulin secretion in FB treated chow fed mice while maintaining unaltered
glucose clearance. The insulin-sensitising effect of FB observed in the present study is consistent
with our previous report of the insulin sensitizing effect of PPARα activation in high fat fed insulin
resistant rats as determined by the hyperinsulinemic-euglycemic clamp (37).
The ER plays a pivotal role in protein processing to maintain cellular homeostasis under
physiological conditions through the three canonical branches of UPR signaling pathways:
PERK/elF2α, IRE1/XBP1 and ATF6. The initialling proteins PERK, IRE and ATF6 all have sensors
facing the ER lumen and they can be activated under ER stress such as the accumulation of
misfolded proteins (9; 15). Activated IRE1/XBP1 pathway has been suggested to promote DNL in
the liver leading to the production of lipids (4; 7). In addition, both IRE1 (10) and PERK (38) have
been suggested to activate JNK and IKK. These mechanisms, acting in concert or alone, are
sufficient to impair insulin signaling in the liver. However, it has been difficult to separate the effect
of activated UPR pathways on hepatic insulin signaling in vivo from the influence of lipid
accumulation. Moreover, FB is a lipid-lowering drug commonly used in humans and fructose
consumption is closely related to the epidemic of obesity and fatty liver (6; 39). Thus, the approach
of administration of FB to insulin resistant mice induced by HFru feeding would not only allow us
to dissect such integral relationship, but also provide new insight into the mechanism relevant to
Page 13 of 38 Diabetes

conditions in humans.
Both DAG and ceramide are key lipid intermediates linking hepatic steatosis to insulin resistance
(4). Our results showed that liver DAG content was higher in HFru-fed mice (as a result of
increased DNL) and this is consistent with a previous report in HFru-fed mice (46). DAG can
activate protein kinases C ε (PKCε) which in turn phosphorylates the insulin receptor substrate 1
(IRS1) at serine 307 to disrupt tyrosine phosphorylation of IRS1 (40). This could blunt IRS-
mediated phosphorylation of its downstream signaling target such as Akt (41). While maintaining
elevated DNL (as indicated by mSREBP1c, ACC, FAS, SCD1, and the incorporation of [3H]-H2O
into triglyceride) induced by HFru diet, FB was able to outpace DNL by a much greater effect to
accelerate FA oxidation (as indicated by the 14-16% increase in VO2, 3.9-fold, 8-fold and 2.1-fold
increases in ACOX1, pACC and β-HAD, respectively), hence eliminating the accumulation of TG
and DAG. This may offer an explanation towards the improved insulin signaling by FB. In HFru-
fed rat, hepatic ceramide has been reported to be increased (45) and this lipid metabolite can
suppress the phosphorylation of Akt via protein phosphatase 2A (42; 43). In the present study
ceramide is unlikely to be a contributor for the blunted insulin signaling because its level in HFru-
FB mice was similar to the level in chow-fed mice. However, the precise role of ceramide requires
further investigation as the cellular location may be a key determinant of its effect on insulin
sensitivity (44).
The other key mechanism for ER stress induced insulin resistance is the activation of JNK and
associated stress kinases. Sustained ER stress has been shown to cause hepatic insulin resistance via
the induction of JNK and IKK (8; 13) and all three canonical arms of the UPR pathways are capable
of activating JNK and IKK signaling under conditions of severe ER stress (3). Consistent with our
previous finding (16) HFru feeding was accompanied by the presence of ER stress. Despite further
activation of the IRE1/XBP1 and PERK/eIF2α signaling by the activation of PPARα with FB, the
Page 14 of 38Diabetes

unaltered phosphorylation of JNK and IKK or IκBα content argues against their role in the
improved insulin signaling properties in the liver. In addition, cellular ceramide is also known to be
implicated in the up-regulation of IKK and JNK (42). The fact that neither ceramide nor these
stress-related kinases were up-regulated by FB is also consistent with our interpretation of the
reduction in DAGs as a more likely mechanism for the alleviation of hepatic insulin resistance by
the activation of PPARα. Of interest, Jurczak et al. (46) has recently demonstrated alleviation of
hepatic DAG accumulation in mice with conditional knockout of XBP1. The absence of XBP1 can
reverse fructose-induced insulin resistance despite the presence of ER stress and JNK activation
which supports the notion of DAGs being the major culprit for hepatic insulin resistance induced by
HFru feeding.
It has been suggested that mild ER stress may enhance hepatic insulin signaling and protect against
lipotoxicity via the induction of an adaptive UPR (47). Mice carrying liver specific deletion of IRE1
displayed overt steatosis when challenged with ER stress inducers (48), while genetic ablation of
either ER stress-sensing or ER quality control molecules also resulted in the development of hepatic
steatosis (49). Furthermore, IRE1 has been reported capable of repressing the expression of key
metabolic transcriptional regulators, including CCAAT/enhancer-binding protein (C/EBP) β,
C/EBPδ, PPARγ, and enzymes involved in triglyceride biosynthesis (49), which suggests that UPR
might be an important mechanism for mitigating steatosis. Our results in the present study highlight
the need for further investigation to examine whether specific UPR signaling may in fact contribute
to the PPARα-mediated effects on insulin sensitivity.
Although attenuated body weight gain in the HFru-fed mice induced by FB may cloud our
interpretation at the first glance, the pivotal role of lipids (but not the activated UPR per se) in ER
stress associated insulin resistance is also demonstrated in CH-FB fed mice without body weight
change (compared to CH-fed mice). Despite similar dual activation of both IRE1/XBP1 and
Page 15 of 38 Diabetes

PERK/eIF2α pathways in the FB-treated CH-fed mice, insulin-mediated phosphorylation of Akt and
GSK3β remained intact in the absence of lipid accumulation. This interpretation is consistent with a
previous study showing reduced liver lipids as the underlying mechanism of improved hepatic
insulin sensitivity during body weight loss in patients with type 2 diabetes (50).
In summary, our data together indicated that lipid (particularly DAG) accumulation, but not the
activation of JNK or IKK, is required for ER stress to cause hepatic insulin resistance and glucose
intolerance during HFru consumption. Increased peroxisomal oxidation of FAs and energy
expenditure are likely to underpin the observed reduction in hepatosteatosis and insulin resistance in
FB-treated HFru-fed mice despite marked increases in UPR signalling and de novo lipogenesis.
Therefore, activation of PPARα with FB ameliorates HFru-induced hepatic insulin resistance by
eliminating lipid deposition by blocking its link with ER (Figure 8). Our findings also suggest a
need for further investigation as to whether activation of specific UPR pathways may in fact
contribute to the therapeutic effects of fibrate drugs which are commonly used in humans.
(Word count 4473)
Page 16 of 38Diabetes

GUARANTOR’S STATEMENT
Dr. Ji-Ming Ye is the guarantor of this work and, as such, had full access to all the data in the study
and takes responsibility for the integrity of the data and accuracy of the data analysis.
AUTHOR CONTRIBUTION STATEMENT
J.M.Y. and S.M.H.C. conceived and designed the study. S.M.H.C., R.Q.S., Z.H.C. H.W., X.Y.Z.
and M.J.W. contributed to the research data. J.M.Y. and M.J.W. provided reagents, materials and
analysis tools. S.M.H.C., J.M.Y., R.Q.S. and M.J.W. wrote the manuscript.
ACKNOWLEDGEMENTS
This study was supported by the National Health and Medical Research Council of Australia
Program Grant (535921 allocation to J.M.Y.) and Australian Research Council (DP 11010378 to
J.M.Y.). M.J.W. is a Senior Research Fellow of National Health and Medical Research Council.
The authors would like to thank Dr Juan Carlos Molero for his comments and Ms. Xiu Zhou and
Ms. Songpei Li (RMIT University) for their technical assistance.
CONFLICT OF INTEREST
The authors declare no conflict of interests in this study.
Page 17 of 38 Diabetes

REFERENCES
1. Samuel VT, Shulman GI: Mechanisms for insulin resistance: common threads and missing links.
Cell 2012;148:852-871
2. Rizza RA: Pathogenesis of fasting and postprandial hyperglycemia in type 2 diabetes:
implications for therapy. Diabetes 2010;59:2697-2707
3. Hotamisligil GS: Endoplasmic reticulum stress and the inflammatory basis of metabolic disease.
Cell 2010;140:900-917
4. Samuel VT, Petersen KF, Shulman GI: Lipid-induced insulin resistance: unravelling the
mechanism. Lancet 2010;375:2267-2277
5. Stanhope KL, Schwarz JM, Keim NL, Griffen SC, Bremer AA, Graham JL, Hatcher B, Cox CL,
Dyachenko A, Zhang W, McGahan JP, Seibert A, Krauss RM, Chiu S, Schaefer EJ, Ai M,
Otokozawa S, Nakajima K, Nakano T, Beysen C, Hellerstein MK, Berglund L, Havel PJ:
Consuming fructose-sweetened, not glucose-sweetened, beverages increases visceral adiposity and
lipids and decreases insulin sensitivity in overweight/obese humans. J Clin Invest 2009;119:1322-
1334
6. Maersk M, Belza A, Stodkilde-Jorgensen H, Ringgaard S, Chabanova E, Thomsen H, Pedersen
SB, Astrup A, Richelsen B: Sucrose-sweetened beverages increase fat storage in the liver, muscle,
and visceral fat depot: a 6-mo randomized intervention study. Am J Clin Nutr 2012;95:283-289
7. Lee AH, Scapa EF, Cohen DE, Glimcher LH: Regulation of hepatic lipogenesis by the
transcription factor XBP1. Science 2008;320:1492-1496
8. Ozcan U, Yilmaz E, Ozcan L, Furuhashi M, Vaillancourt E, Smith RO, Gorgun CZ, Hotamisligil
GS: Chemical chaperones reduce ER stress and restore glucose homeostasis in a mouse model of
type 2 diabetes. Science 2006;313:1137-1140
Page 18 of 38Diabetes

9. Ron D, Walter P: Signal integration in the endoplasmic reticulum unfolded protein response. Nat
Rev Mol Cell Biol 2007;8:519-529
10. Urano F, Wang X, Bertolotti A, Zhang Y, Chung P, Harding HP, Ron D: Coupling of stress in
the ER to activation of JNK protein kinases by transmembrane protein kinase IRE1. Science
2000;287:664-666
11. Hu P, Han Z, Couvillon AD, Kaufman RJ, Exton JH: Autocrine tumor necrosis factor alpha
links endoplasmic reticulum stress to the membrane death receptor pathway through IRE1alpha-
mediated NF-kappaB activation and down-regulation of TRAF2 expression. Mol Cell Biol
2006;26:3071-3084
12. Liang SH, Zhang W, McGrath BC, Zhang P, Cavener DR: PERK (eIF2alpha kinase) is required
to activate the stress-activated MAPKs and induce the expression of immediate-early genes upon
disruption of ER calcium homoeostasis. Biochem J 2006;393:201-209
13. Ozcan U, Cao Q, Yilmaz E, Lee AH, Iwakoshi NN, Ozdelen E, Tuncman G, Gorgun C,
Glimcher LH, Hotamisligil GS: Endoplasmic reticulum stress links obesity, insulin action, and type
2 diabetes. Science 2004;306:457-461
14. Gao Z, Hwang D, Bataille F, Lefevre M, York D, Quon MJ, Ye J: Serine phosphorylation of
insulin receptor substrate 1 by inhibitor kappa B kinase complex. J Biol Chem 2002;277:48115-
48121
15. Fu S, Watkins SM, Hotamisligil GS: The role of endoplasmic reticulum in hepatic lipid
homeostasis and stress signaling. Cell Metab 2012;15:623-634
16. Ren LP, Chan SM, Zeng XY, Laybutt DR, Iseli TJ, Sun RQ, Kraegen EW, Cooney GJ, Turner
N, Ye JM: Differing endoplasmic reticulum stress response to excess lipogenesis versus lipid
oversupply in relation to hepatic steatosis and insulin resistance. PLoS One 2012;7:e30816
Page 19 of 38 Diabetes
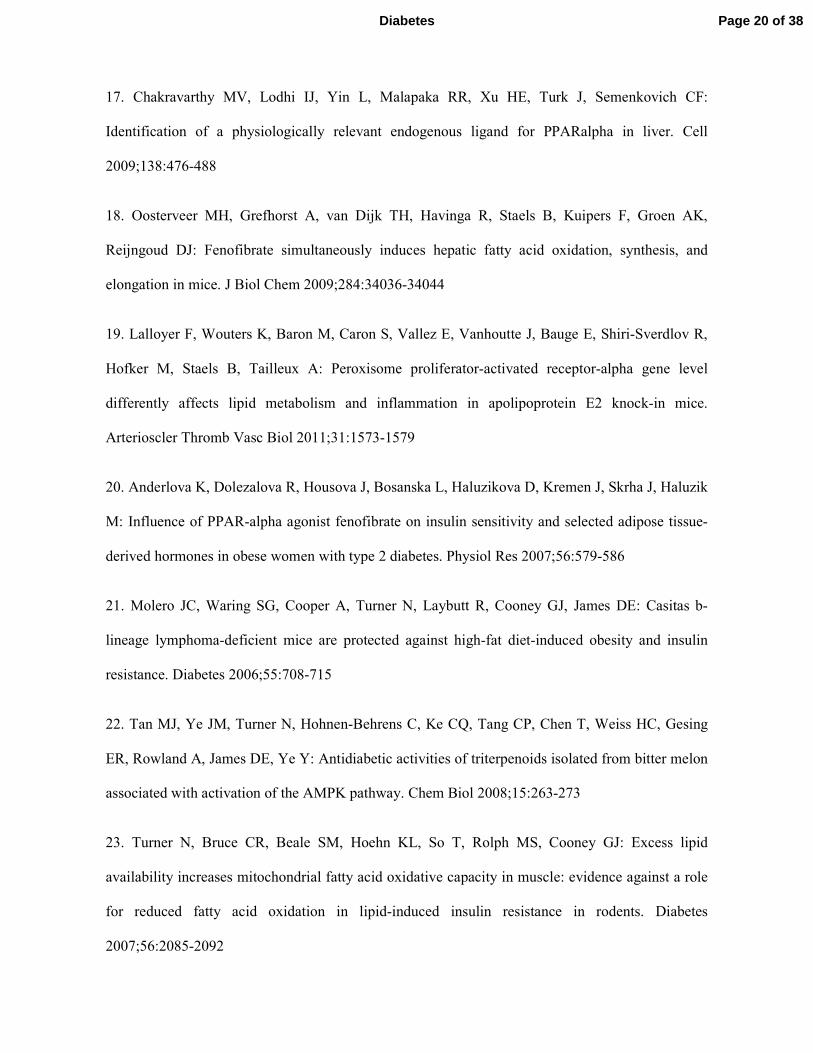
17. Chakravarthy MV, Lodhi IJ, Yin L, Malapaka RR, Xu HE, Turk J, Semenkovich CF:
Identification of a physiologically relevant endogenous ligand for PPARalpha in liver. Cell
2009;138:476-488
18. Oosterveer MH, Grefhorst A, van Dijk TH, Havinga R, Staels B, Kuipers F, Groen AK,
Reijngoud DJ: Fenofibrate simultaneously induces hepatic fatty acid oxidation, synthesis, and
elongation in mice. J Biol Chem 2009;284:34036-34044
19. Lalloyer F, Wouters K, Baron M, Caron S, Vallez E, Vanhoutte J, Bauge E, Shiri-Sverdlov R,
Hofker M, Staels B, Tailleux A: Peroxisome proliferator-activated receptor-alpha gene level
differently affects lipid metabolism and inflammation in apolipoprotein E2 knock-in mice.
Arterioscler Thromb Vasc Biol 2011;31:1573-1579
20. Anderlova K, Dolezalova R, Housova J, Bosanska L, Haluzikova D, Kremen J, Skrha J, Haluzik
M: Influence of PPAR-alpha agonist fenofibrate on insulin sensitivity and selected adipose tissue-
derived hormones in obese women with type 2 diabetes. Physiol Res 2007;56:579-586
21. Molero JC, Waring SG, Cooper A, Turner N, Laybutt R, Cooney GJ, James DE: Casitas b-
lineage lymphoma-deficient mice are protected against high-fat diet-induced obesity and insulin
resistance. Diabetes 2006;55:708-715
22. Tan MJ, Ye JM, Turner N, Hohnen-Behrens C, Ke CQ, Tang CP, Chen T, Weiss HC, Gesing
ER, Rowland A, James DE, Ye Y: Antidiabetic activities of triterpenoids isolated from bitter melon
associated with activation of the AMPK pathway. Chem Biol 2008;15:263-273
23. Turner N, Bruce CR, Beale SM, Hoehn KL, So T, Rolph MS, Cooney GJ: Excess lipid
availability increases mitochondrial fatty acid oxidative capacity in muscle: evidence against a role
for reduced fatty acid oxidation in lipid-induced insulin resistance in rodents. Diabetes
2007;56:2085-2092
Page 20 of 38Diabetes

24. Weis BC, Cowan AT, Brown N, Foster DW, McGarry JD: Use of a selective inhibitor of liver
carnitine palmitoyltransferase I (CPT I) allows quantification of its contribution to total CPT I
activity in rat heart. Evidence that the dominant cardiac CPT I isoform is identical to the skeletal
muscle enzyme. J Biol Chem 1994;269:26443-26448
25. Dietschy JM, Spady DK: Measurement of rates of cholesterol synthesis using tritiated water. J
Lipid Res 1984;25:1469-1476
26. Preiss J, Loomis CR, Bishop WR, Stein R, Niedel JE, Bell RM: Quantitative measurement of
sn-1,2-diacylglycerols present in platelets, hepatocytes, and ras- and sis-transformed normal rat
kidney cells. J Biol Chem 1986;261:8597-8600
27. Kersten S, Seydoux J, Peters JM, Gonzalez FJ, Desvergne B, Wahli W: Peroxisome
proliferator-activated receptor alpha mediates the adaptive response to fasting. J Clin Invest
1999;103:1489-1498
28. Leone TC, Weinheimer CJ, Kelly DP: A critical role for the peroxisome proliferator-activated
receptor alpha (PPARalpha) in the cellular fasting response: the PPARalpha-null mouse as a model
of fatty acid oxidation disorders. Proc Natl Acad Sci U S A 1999;96:7473-7478
29. Inagaki T, Dutchak P, Zhao G, Ding X, Gautron L, Parameswara V, Li Y, Goetz R,
Mohammadi M, Esser V, Elmquist JK, Gerard RD, Burgess SC, Hammer RE, Mangelsdorf DJ,
Kliewer SA: Endocrine regulation of the fasting response by PPARalpha-mediated induction of
fibroblast growth factor 21. Cell Metab 2007;5:415-425
30. Dreyer C, Krey G, Keller H, Givel F, Helftenbein G, Wahli W: Control of the peroxisomal beta-
oxidation pathway by a novel family of nuclear hormone receptors. Cell 1992;68:879-887
31. Kammoun HL, Chabanon H, Hainault I, Luquet S, Magnan C, Koike T, Ferre P, Foufelle F:
GRP78 expression inhibits insulin and ER stress-induced SREBP-1c activation and reduces hepatic
Page 21 of 38 Diabetes
steatosis in mice. J Clin Invest 2009;119:1201-1215
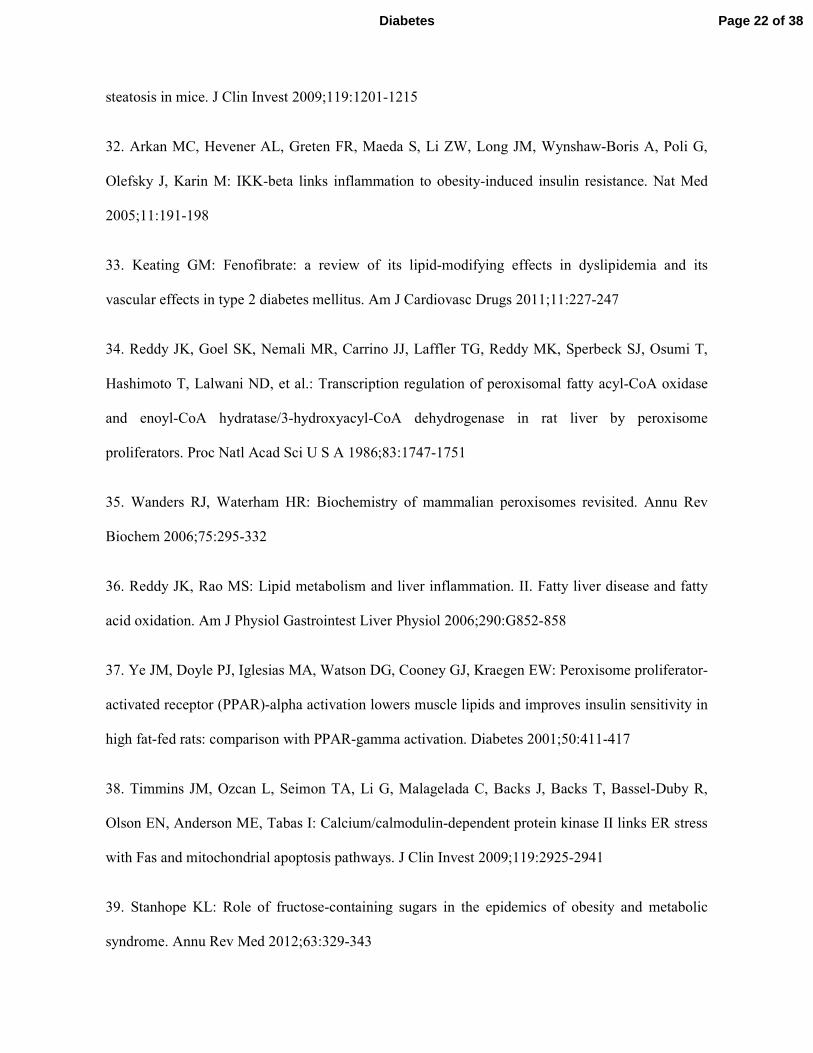
32. Arkan MC, Hevener AL, Greten FR, Maeda S, Li ZW, Long JM, Wynshaw-Boris A, Poli G,
Olefsky J, Karin M: IKK-beta links inflammation to obesity-induced insulin resistance. Nat Med
2005;11:191-198
33. Keating GM: Fenofibrate: a review of its lipid-modifying effects in dyslipidemia and its
vascular effects in type 2 diabetes mellitus. Am J Cardiovasc Drugs 2011;11:227-247
34. Reddy JK, Goel SK, Nemali MR, Carrino JJ, Laffler TG, Reddy MK, Sperbeck SJ, Osumi T,
Hashimoto T, Lalwani ND, et al.: Transcription regulation of peroxisomal fatty acyl-CoA oxidase
and enoyl-CoA hydratase/3-hydroxyacyl-CoA dehydrogenase in rat liver by peroxisome
proliferators. Proc Natl Acad Sci U S A 1986;83:1747-1751
35. Wanders RJ, Waterham HR: Biochemistry of mammalian peroxisomes revisited. Annu Rev
Biochem 2006;75:295-332
36. Reddy JK, Rao MS: Lipid metabolism and liver inflammation. II. Fatty liver disease and fatty
acid oxidation. Am J Physiol Gastrointest Liver Physiol 2006;290:G852-858
37. Ye JM, Doyle PJ, Iglesias MA, Watson DG, Cooney GJ, Kraegen EW: Peroxisome proliferator-
activated receptor (PPAR)-alpha activation lowers muscle lipids and improves insulin sensitivity in
high fat-fed rats: comparison with PPAR-gamma activation. Diabetes 2001;50:411-417
38. Timmins JM, Ozcan L, Seimon TA, Li G, Malagelada C, Backs J, Backs T, Bassel-Duby R,
Olson EN, Anderson ME, Tabas I: Calcium/calmodulin-dependent protein kinase II links ER stress
with Fas and mitochondrial apoptosis pathways. J Clin Invest 2009;119:2925-2941
39. Stanhope KL: Role of fructose-containing sugars in the epidemics of obesity and metabolic
syndrome. Annu Rev Med 2012;63:329-343
Page 22 of 38Diabetes
40. Yu C, Chen Y, Cline GW, Zhang D, Zong H, Wang Y, Bergeron R, Kim JK, Cushman SW,
Cooney GJ, Atcheson B, White MF, Kraegen EW, Shulman GI: Mechanism by which fatty acids
inhibit insulin activation of insulin receptor substrate-1 (IRS-1)-associated phosphatidylinositol 3-
kinase activity in muscle. J Biol Chem 2002;277:50230-50236
41. Neschen S, Morino K, Hammond LE, Zhang D, Liu ZX, Romanelli AJ, Cline GW, Pongratz
RL, Zhang XM, Choi CS, Coleman RA, Shulman GI: Prevention of hepatic steatosis and hepatic
insulin resistance in mitochondrial acyl-CoA:glycerol-sn-3-phosphate acyltransferase 1 knockout
mice. Cell Metab 2005;2:55-65
42. Chavez JA, Summers SA: A ceramide-centric view of insulin resistance. Cell Metab
2012;15:585-594
43. Schmitz-Peiffer C, Craig DL, Biden TJ: Ceramide generation is sufficient to account for the
inhibition of the insulin-stimulated PKB pathway in C2C12 skeletal muscle cells pretreated with
palmitate. J Biol Chem 1999;274:24202-24210
44. Bruce CR, Hoy AJ, Turner N, Watt MJ, Allen TL, Carpenter K, Cooney GJ, Febbraio MA,
Kraegen EW: Overexpression of carnitine palmitoyltransferase-1 in skeletal muscle is sufficient to
enhance fatty acid oxidation and improve high-fat diet-induced insulin resistance. Diabetes
2009;58:550-558
45. Vila L, Roglans N, Alegret M, Sanchez RM, Vazquez-Carrera M, Laguna JC: Suppressor of
cytokine signaling-3 (SOCS-3) and a deficit of serine/threonine (Ser/Thr) phosphoproteins involved
in leptin transduction mediate the effect of fructose on rat liver lipid metabolism. Hepatology
2008;48:1506-1516
46. Jurczak MJ, Lee AH, Jornayvaz FR, Lee HY, Birkenfeld AL, Guigni BA, Kahn M, Samuel VT,
Glimcher LH, Shulman GI: Dissociation of inositol-requiring enzyme (IRE1alpha)-mediated c-Jun
Page 23 of 38 Diabetes

N-terminal kinase activation from hepatic insulin resistance in conditional X-box-binding protein-1
(XBP1) knock-out mice. J Biol Chem 2012;287:2558-2567
47. Achard CS, Laybutt DR: Lipid-induced endoplasmic reticulum stress in liver cells results in two
distinct outcomes: adaptation with enhanced insulin signaling or insulin resistance. Endocrinology
2012;153:2164-2177
48. Zhang K, Wang S, Malhotra J, Hassler JR, Back SH, Wang G, Chang L, Xu W, Miao H,
Leonardi R, Chen YE, Jackowski S, Kaufman RJ: The unfolded protein response transducer
IRE1alpha prevents ER stress-induced hepatic steatosis. EMBO J 2011;30:1357-1375
49. Rutkowski DT, Wu J, Back SH, Callaghan MU, Ferris SP, Iqbal J, Clark R, Miao H, Hassler
JR, Fornek J, Katze MG, Hussain MM, Song B, Swathirajan J, Wang J, Yau GD, Kaufman RJ:
UPR pathways combine to prevent hepatic steatosis caused by ER stress-mediated suppression of
transcriptional master regulators. Dev Cell 2008;15:829-840
50. Petersen KF, Dufour S, Befroy D, Lehrke M, Hendler RE, Shulman GI: Reversal of
nonalcoholic hepatic steatosis, hepatic insulin resistance, and hyperglycemia by moderate weight
reduction in patients with type 2 diabetes. Diabetes 2005;54:603-608
Page 24 of 38Diabetes
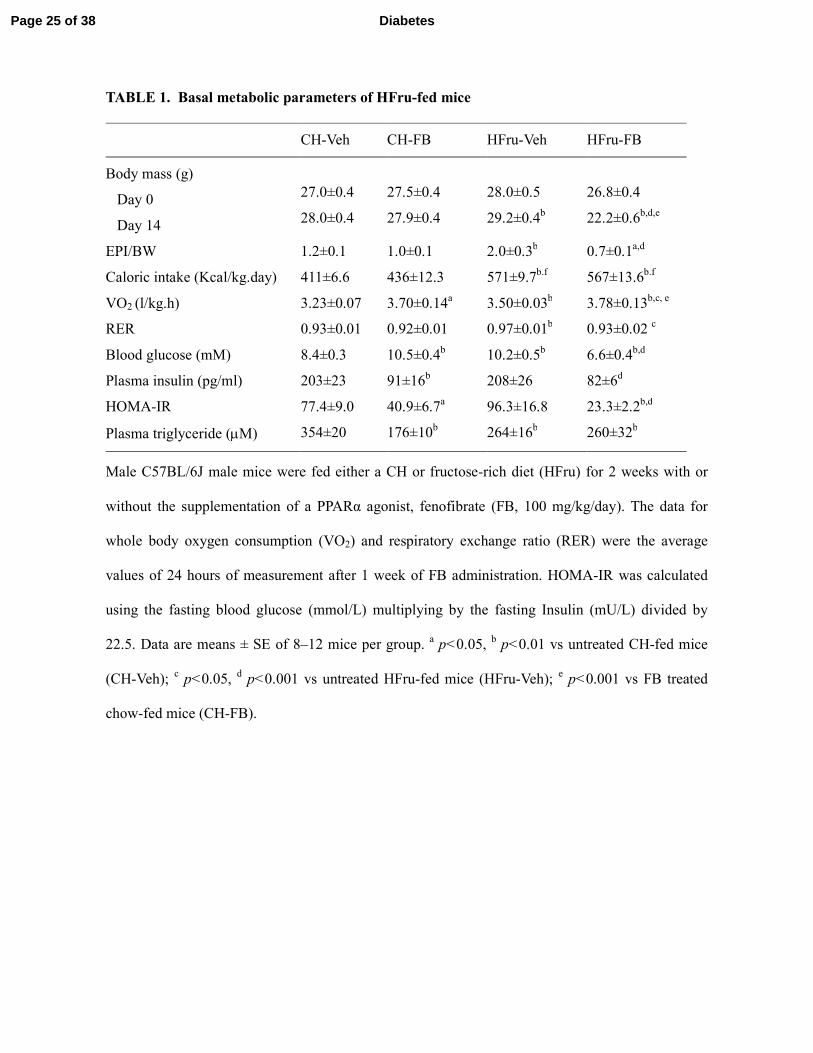
TABLE 1. Basal metabolic parameters of HFru-fed mice
CH-Veh CH-FB HFru-Veh HFru-FB
Body mass (g)
Day 0
Day 14
27.0±0.4
28.0±0.4
27.5±0.4
27.9±0.4
28.0±0.5
29.2±0.4b
26.8±0.4
22.2±0.6b,d,e
EPI/BW 1.2±0.1 1.0±0.1 2.0±0.3b
0.7±0.1a,d
Caloric intake (Kcal/kg.day) 411±6.6 436±12.3 571±9.7b.f
567±13.6b.f
VO2 (l/kg.h) 3.23±0.07 3.70±0.14a 3.50±0.03
b 3.78±0.13
b,c, e
RER 0.93±0.01 0.92±0.01 0.97±0.01b 0.93±0.02
c
Blood glucose (mM) 8.4±0.3 10.5±0.4b
10.2±0.5b
6.6±0.4b,d
Plasma insulin (pg/ml) 203±23 91±16b
208±26 82±6d
HOMA-IR 77.4±9.0 40.9±6.7a
96.3±16.8 23.3±2.2b,d
Plasma triglyceride (µM) 354±20 176±10b
264±16b
260±32b
Male C57BL/6J male mice were fed either a CH or fructose-rich diet (HFru) for 2 weeks with or
without the supplementation of a PPARα agonist, fenofibrate (FB, 100 mg/kg/day). The data for
whole body oxygen consumption (VO2) and respiratory exchange ratio (RER) were the average
values of 24 hours of measurement after 1 week of FB administration. HOMA-IR was calculated
using the fasting blood glucose (mmol/L) multiplying by the fasting Insulin (mU/L) divided by
22.5. Data are means ± SE of 8–12 mice per group. a p<0.05,
b p<0.01 vs untreated CH-fed mice
(CH-Veh); c p<0.05,
d p<0.001 vs untreated HFru-fed mice (HFru-Veh);
e p<0.001 vs FB treated
chow-fed mice (CH-FB).
Page 25 of 38 Diabetes

FIGURE LEGENDS
Figure 1. Effects of FB treatment on glucose tolerance.
Male C57BL/6J mice were fed a high fructose (HFru) diet with or without the supplementation of
fenofibrate (FB, 100 mg/kg/day) as compared to a standard laboratory chow diet (CH). The
experiments were performed after two weeks of chow (CH, ●), chow with FB (CH-FB, ○), high
fructose (HFru, ■) or high fructose with FB (HFru-FB, □) feeding. (A) Glucose tolerance test
(GTT) was performed with an injection of glucose (2.5 g/kg, ip) after 5-7 hours of fasting. (B)
iAUC, incremental area under the curve for blood glucose level. (C) Plasma insulin level between
30-60 min of GTT. Data are means ± SE, 8-12 mice per group. * p < 0.05; †† p < 0.01 of the
compared groups.
Figure 2. Effects of FB treatment on hepatic insulin signal transduction.
After two weeks of feeding, animals were fasted for 5-7 hours before tissue collection. Liver
homogenate were prepared for immunoblotting (detail methods can be found in the supplementary
information): (A) representative blots of phosphorylated- and total-Akt (Ser473) with densitometry
in the liver, (B) representative blots of phosphorylated- and total- GSK3β (Ser219) with
densitometry in the liver in response to a bolus of insulin stimulation (2U/kg, ip). Each lane
represents a single mouse. Data are mean ± SE of 8 mice per group. All insulin stimulated groups
reached statistical significance of p < 0.01 compared to their corresponding basal groups unless
otherwise indicated. ** p < 0.01; †† p < 0.001 of the compared groups.
Figure 3. Effects of FB treatment on hepatic lipid content.
After two weeks of feeding, animals were fasted for 5-7 hours before tissue collection. Liver
homogenate were extracted for the assessment of total TG (A), DAG (B) and ceramide (C) content.
Data are mean ± SE of 8 mice per group. ** p < 0.01; †† p < 0.001 of the compared groups.
Page 26 of 38Diabetes

Figure 4. Effects of FB treatment on key enzymes of FA oxidation
After two weeks of feeding, animals were fasted for 5-7 hours before tissue collection and liver
homogenates were immunoblotted for key enzymes related to oxidative capacity: representative
blots of ACOX1 (A), phosphorylated-ACC (Ser79) (B), the specific activities of β-HAD (C), and
citrate synthase (D). Each lane represents a single mouse. Data are mean ± SE of 10 mice per group.
(E) Hepatic fatty acid (FA) oxidation was measured in separate liver homogenates using 14C-
palmitate as a substrate in the presence or absence of 0.02 mM etomoxir (detail methods can be
found in the supplementary information). Data are mean ± SE of 6-8 mice per group. * p < 0.05; **
p < 0.01 vs CH; † p < 0.05, †† p < 0.001 of the compared groups.
Figure 5. Effects of FB treatment on hepatic UPR signaling.
After two weeks of feeding, animals were fasted for 5-7 hours before tissue collection and liver
homogenates were immunoblotted for markers of ER stress: representative blots of phosphorylated-
IRE1 (Ser724) (A), spliced form of XBP1 (B), phosphorylated-PERK (Thr980) (C),
phosphorylated-eIF2α (Ser51) (D), CHOP (E), and GADD34 (F) with densitometry. Each lane
represents a single mouse. Data are mean ± SE from 8 to 10 mice per group. * p < 0.01 vs CH, †† p
< 0.01 of the compared groups.
Figure 6. Effects of FB treatment on hepatic DNL.
After two weeks of feeding, animals were fasted for 5-7 hours before tissue collection and liver
homogenates were immunoblotted for key enzymes related to lipogenic capacity: representative
blots of the matured form of SREBP1c (mSREBP1c) (A), tACC (B), FAS (C) and SCD1 (D) with
densitometry. Data are mean ± SE of 10 mice per group. (E) Hepatic DNL was measured by the
incorporation of [3H]-H2O into hepatic triglyceride (detail methods can be found in the
supplementary information). Data are mean ± SE of 6 to 8 mice per group. * p < 0.05 vs CH; ** p
Page 27 of 38 Diabetes

< 0.01; †† p < 0.001 of the compared groups.
Figure 7. Effects of FB treatment on JNK and IKK activation.
After two weeks of feeding, animals were fasted for 5-7 hours before tissue collection and liver
homogenates were immunoblotted for evidence of JNK and IKK activation: representative blots of
phosphorylated-JNK (A), phosphorylated-IKK (B), IκBα (C). Data are mean ± SE of 8 mice per
group. n.s. denotes no statistical differences.
Figure 8. Illustration of PPARα–mediated effects on ER stress, lipid metabolism and insulin
sensitivity in the liver.
High fructose feeding accentuates the accumulation of triglyceride (TG) and diacylglyerol (DAG)
in the liver via the induction of de novo lipogenesis. The accumulation of these lipid metabolites
attenuates normal insulin signal transduction leading to hepatic insulin resistance, resulting in the
reduction of glucose tolerance. PPARα activation by FB may also directly stimulate lipogenesis
which may involve the signaling of specific arms of the unfolded protein response (UPR) pathways.
However, the predominant effect of potentiated oxidative capacity (primarily peroxisomal
oxidation) driven by PPARα is capable of eliminating lipid accumulation, thus overcoming
fructose-induced hepatic insulin resistance (IR) and glucose intolerance.
Figure S1. Densitometry of insulin-stimulated Akt phosphorylation in muscle.
After two weeks of feeding, animals were fasted for 5-7 hours before tissue collection and red
quadriceps muscle homogenates were immunoblotted for phosphorylated-Akt (Ser473) in response
to a bolus of insulin stimulation (2U/kg, ip). Data are mean ± SE from 8 to 10 mice per group. All
insulin stimulated samples reached statistical significance of p < 0.01 compared to that of the non-
stimulated. No significant difference was observed among the stimulated groups.
Page 28 of 38Diabetes
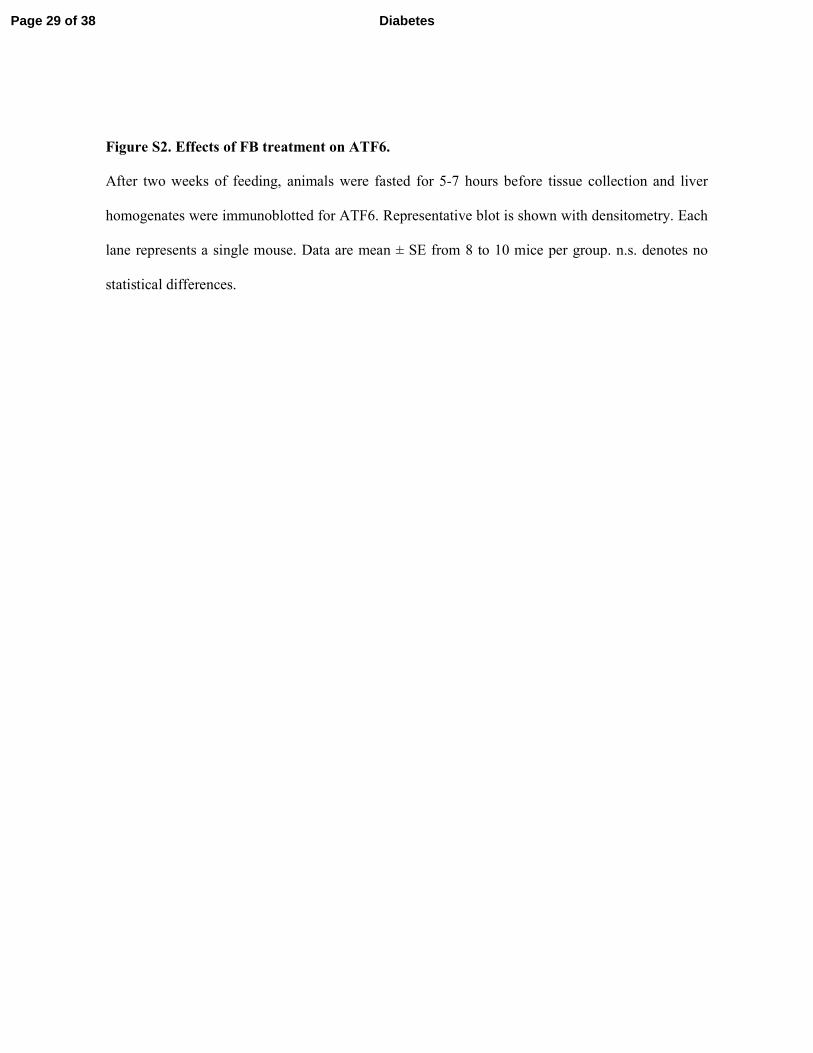
Figure S2. Effects of FB treatment on ATF6.
After two weeks of feeding, animals were fasted for 5-7 hours before tissue collection and liver
homogenates were immunoblotted for ATF6. Representative blot is shown with densitometry. Each
lane represents a single mouse. Data are mean ± SE from 8 to 10 mice per group. n.s. denotes no
statistical differences.
Page 29 of 38 Diabetes

Figure 1
A B
C CH-Veh
CH-FB
HFru-Veh
HFru-FB
0 30 60 90 120
0
4
8
12
16
20
24
28
32
Time (min)
Blo
od
glu
co
se
(m
M) *
*
* †† ††
††
†† ††
0
500
1000
1500
2000
iAU
C o
f b
loo
d g
luc
os
e
(mM
x 1
20
min
)
CH-
Veh
CH-
FB
HFru-
Veh
HFru-
FB
††
0
50
100
150
200
250
Pla
sm
a in
su
lin
(p
g/m
l)
*
††
CH-
Veh
CH-
FB
HFru-
Veh
HFru-
FB
††
Page 30 of 38Diabetes
For Peer Review O
nly
Figure 2
p-A
kt/
t-A
kt
0
5
10
15
20
25 **
††
Insulin - + - + - + - +
A
B
CH-
Veh
CH-
FB
HFru
-Veh HFru
-FB
p-Akt Ser473
t-Akt
Insulin - + - + - + - + CH-
Veh CH-
FB
HFru
-Veh
HFru
-FB
GAPDH
p-G
SK
3
/t-G
SK
3
0
2
4
6
8
**
††
Insulin - + - + - + - + CH-
Veh CH-
FB
HFru
-Veh HFru
-FB
n.s.
HFru
-Veh
p-GSK3Ser9
t-GSK3
GAPDH
Insulin - + - + - + - + CH-
Veh CH-
FB
HFru
-FB
Page 31 of 38 Diabetes

For Peer Review O
nly
Figure 3
A
CH-
Veh CH-
FB
HFru
-Veh
HFru
-FB
††
0
5
10
15
20
25 **
Liv
er
trig
lyc
eri
de
(m
ole
/g)
C
B
0
5
10
15
20
25
Liv
er
dia
cylg
lyc
ero
l
(nm
ole
/g)
** †
0
2
4
6
8
10 **
††
CH-
Veh CH-
FB
HFru
-Veh
HFru
-FB
Liv
er
ce
ram
ide
(nm
ole
/g)
CH-
Veh
CH-
FB
HFru
-Veh HFru
-FB
Page 32 of 38Diabetes
For Peer Review O
nly
Figure 4
GAPDH
ACOX1
A
D
AC
OX
1/G
AP
DH
C
CH-
Veh
-H
AD
ac
tivit
y
(m
ol/
min
.g)
CH-
FB
HFru
-Veh
HFru
-FB
CH-
Veh CH-
FB
HFru
-Veh
HFru
-FB
0.0
1.0
2.0
3.0
4.0
5.0
††
††
Tubulin
B
p-A
CC
/Tu
bu
lin
0
2
4
6
8
10
CH-
Veh
CH-
FB HFru
-Veh
HFru
-FB
††
**
Cit
rate
syn
tha
se
(m
ol/
min
.g)
0
50
100
150
200 **
p-ACCSer79
*
0
30
60
90
120
††
CH-
Veh
CH-
FB
HFru
-Veh
HFru
-FB
Hep
ati
c F
A o
xid
ati
on
(nm
ol/
g p
ro/h
r)
0
30
60
120
150
90
CH-
Veh
CH-
FB
HFru
-Veh
HFru
-FB
* ††
†
** ††
*
E
CH-
Veh
CH-
FB
HFru
-Veh
HFru
-FB CH-
Veh
CH-
FB
HFru
-Veh
HFru
-FB
Total FA oxidation FA oxidation
resistant to etomoxir
(peroxisomal
component)
FA oxidation inhibited
by etomoxir
(mitochondrial
component)
Page 33 of 38 Diabetes

For Peer Review O
nly
Figure 5
A
C D
B
E F
CHOP
GAPDH
CH
OP
/GA
PD
H
0.0
5.0
10.0
15.0 ††
††
GA
DD
34
/GA
PD
H
GADD34
GAPDH
0.0
0.5
1.0
1.5
0
2
4
6
10
sX
BP
1/u
XB
P1
sXBP1
uXBP1
p-P
ER
K/G
AP
DH
p-PERKThr980 GAPDH
0.0
2.0
4.0
6.0
CH-
Veh
CH-
FB
HFru
-Veh
HFru
-FB
††
††
8
††
††
CH-
Veh
CH-
FB
HFru
-Veh
HFru
-FB
††
††
CH-
Veh
CH-
FB
HFru
-Veh
HFru
-FB
CH-
Veh
CH-
FB
HFru
-Veh
HFru
-FB
A
p-I
RE
1/G
AP
DH
p-IRE1Ser724 GAPDH
CH-
Veh
CH-
FB
HFru
-Veh
HFru
-FB
††
††
0.0
2.0
4.0
6.0
8.0
*
D
p-eIF2αSer51
t-eIF2α
p-e
IF2α
/t-e
IF2α
††
††
CH-
Veh
CH-
FB
HFru
-Veh
HFru
-FB
0.0
2.0
4.0
6.0
8.0
**
Page 34 of 38Diabetes

For Peer Review O
nly
Figure 6
A
C D
B
mS
RE
BP
1c/T
ub
ulin
mSREBP1c
Tubulin t-
AC
C/T
ub
ulin
Tubulin
t-ACC
FAS
GAPDH
FA
S/G
AP
DH
SC
D1
/GA
PD
H
SCD1
GAPDH
0.0
2.0
4.0
6.0
8.0
10.0
CH-
Veh
CH-
FB
HFru
-Veh
HFru
-FB
CH-
Veh
CH-
FB
HFru
-Veh
HFru
-FB
0.0
1.0
2.0
3.0
4.0
CH-
Veh
CH-
FB
HFru
-Veh
HFru
-FB
0
10
20
30
40
50
**
††
††
**
††
††
0.0
1.0
2.0
3.0
4.0
5.0
CH-
Veh
CH-
FB
HFru
-Veh
HFru
-FB
**
**
0
10
20
30
40
50
Lip
og
en
es
is r
ate
(g
/g.h
r)
CH-
Veh
CH-
FB
HFru-
Veh
HFru-
FB
* *
E
p=0.1
Page 35 of 38 Diabetes

For Peer Review O
nly
Figure 7
p-JNKThr183/Tyr185
t-JNK
A B
C
p-IKKα/βSer176/Ser177
Tubulin
0.0
0.5
1.0
1.5
2.0
CH-
Veh
CH-
FB
HFru
-Veh
HFru
-FB
n.s.
0.0
0.5
1.0
1.5
p-J
NK
/t-J
NK
CH-
Veh
CH-
FB
HFru
-Veh
HFru
-FB
n.s.
p-I
KK
/Tu
bu
lin
IkBα
Tubulin
n.s.
IkBα
/Tu
bu
lin
CH-
Veh
CH-
FB
HFru
-Veh
HFru
-FB
0.0
0.5
1.0
1.5
Page 36 of 38Diabetes

For Peer Review O
nly
Figure 8
High fructose diet
ER stress/UPR Lipogenesis
Steatosis
(TGs, DAGs)
Insulin signaling
Hepatic IR
Glucose tolerance
PPARα
FA oxidation
& Energy
consumption
Fenofibrate
Fructose
Page 37 of 38 Diabetes

For Peer Review O
nly
Figure S1
Figure S2
CH-
Veh
mA
TF
6/G
AP
DH
mATF6
GAPDH
CH-
FB HFru
-Veh
HFru
-FB
0.0
0.5
1.0
1.5
2.0 n.s.
p-Akt Ser473 t-Akt
GAPDH
Insulin - + - + - + - + CH-
Veh
CH-
FB
HFru
-Veh
HFru
-FB
Insulin - + - + - + - + CH-
Veh
CH-
FB
HFru
-Veh HFru
-FB
0
10
20
30
p-A
kt/
GA
PD
H
n.s.
Page 38 of 38Diabetes