Db Revolution Report Final
41
WHITE PAPER THE DATABASE REVOLUTION A Perspective On Database: Where We Came From And Where We’re Going Mark Madsen Robin Bloor, Ph.D.
description
DB Revolution
Transcript of Db Revolution Report Final

WHITE PAPER
THE DATABASE REVOLUTION
A Perspective On Database: Where We Came From And Where We’re Going
Mark MadsenRobin Bloor, Ph.D.

Contents
....................................................Introducing the Database Revolution! 3
.....................................................................A Summary of Findings! 3
..................................................................................A Quick Look Back! 4
.................................................................................The Sea Change! 4
.....................The Scale-Out Architecture and the New Generation! 5
...............The Relational Database and the Non-Relational Database ! 7.......................................................The Relational Database (RDBMS)! 7
...............................................................The Non-Relational Database! 7
....................................OldSQL, NewSQL and the Problem of NoSQL! 8
..........................................The Influence of MapReduce and Hadoop! 10
.........HBase, Hive, Pig and Other Hadoop Database Developments! 11
..................................Key Value Stores and Distributed Hash Tables! 12
...............................................................................Horses for Courses! 13
........................................................Structured and Unstructured Data! 15..............................................Unstructured Data as Un-Modeled Data! 16
...............................................................................Database Workloads! 17
..................................................................Workload Characteristics! 18.......................................................................................Read-Write Mix! 18
..........................................................................................Data Latency! 18
...........................................................................................Consistency! 18
............................................................................................Updatability! 19
..............................................................................................Data Types! 19
......................................................................................Response Time! 19
..........................................................................................Predictability! 20
............................................................................................In Summary! 20
............................................The Axes of Scale for Data Processing! 21
THE DATABASE REVOLUTION
1

...........................................................................................Data Volume! 21
...........................................................................................Concurrency! 21
...........................................................................................Computation! 22
............................................................................................In Summary! 23
....................Database Technologies for Managing the Workloads! 23.................................................................Performance and Scalability! 23
..............................................Hardware Architectures and Databases! 24
.........Shared-Nothing Models May be Better for Cloud Deployment! 25
..........................................................................................Conclusion! 26..........................................................................Data Flow Architecture! 28
..................................................Appendix – How to Select a Database! 29
.........................................................................The Feasibility Stage! 29
...................................................................The Limits of a Database! 30
............................................Selecting Potential Database Products! 31..............................................1. Corporate Standards and Guidelines! 32
................................................................................................2. Budget! 32
...................................3a. Workload Data Volume and Data Structure! 32
...................................................................3b. Applications and Users! 32
.......................................................3c. Workloads and Service Levels! 32
........................................................3d. The Overall Data Architecture! 33
....................................................................................4. The Short-List! 33
..............................................................................5. Product Research! 34
............................................................6. Selecting a Favored Product! 35
.........................................................................................7. Negotiation! 36
................................................................................8. Proof of Concept! 36
..............................................................................9. Product Selection! 36
.........How Projects Go Wrong and Why Database Selections Fail! 36
..........................................................................About Our Sponsors! 38
THE DATABASE REVOLUTION
2

Introducing the Database RevolutionThis paper covers three database topics in significant depth:
• How to understand the new generation of databases that have recently emerged in the marketplace. We cover both those sometimes described as NoSQL databases and also column-store databases that are like the traditional relational databases to which we have become accustomed. Our intention is to explain the overall market shift and expansion, and in consequence what the database market looks like today.
• Guidance on how to view database workloads and technologies, and how they line up. We attempt to provide rules of thumb that may help the reader determine what class of technology is likely to fit with which workloads.
• Guidelines on how to select database technology. This is provided primarily because we expect that many of the readers of this paper will be involved in selecting database products and hence may find such guidelines useful.
A Summary of FindingsThis paper is the result of a research program driven by Mark Madsen and Robin Bloor,
involving interviews with vendors, interviews with customers, four webcasts, two of which took the format of round tables with other respected database technology analysts, and a survey of database users.
We reached several key conclusions, listed here in summary:• The database market has changed, primarily because of advances in hardware
technology which have made it possible to scale to much higher data volumes and workloads than was previously possible.
• As a consequence, a new generation of databases has emerged, most of which are more scalable than before. There is a business need to take advantage of this improved capability; proved, if by nothing else, by the popularity and adoption of many of the new generation of products.
• These new products include some databases that implement the relational model of data (we're terming these products "NewSQL" databases) and some that choose not to do so (NoSQL databases). Having said that, we do not believe the term NoSQL is informative since it covers too wide a range of capability to be useful.
• We currently see the new generation of databases as being specialized to specific workloads rather than being general purpose or universal products as the relational databases were in their day.
• We do not believe at this point in time that the older universal database products (grouped under the term "OldSQL") have become outmoded. They are good at what they do, but they lack scalability for some specialized or very large workloads.
THE DATABASE REVOLUTION
3

A Quick Look Back Databases began with mainframe products in the 1970s and have continued to evolve ever
since. The most important development in this slow evolution was the appearance of the Relational Database Management System (RDBMS) and its associated query language, the Structured Query Language (SQL). Technologically, this did not solve all the problems of databases. Indeed there have always been alternative niche databases (object databases, graph databases, document databases and so on) which earned their living specifically by addressing needs which the RDBMS could not address well or at all.
The RDBMS proved effective at handling both online transaction processing (OLTP) workloads and business intelligence (BI) workloads, and as such became the dominant kind of database product. The RDBMS quickly developed a rich ecosystem of software products that depended upon its SQL interface and fulfilled many business needs. It seemed that by the year 2000 the RDBMS would reign supreme.
However, hardware was evolving. Databases had been built primarily to access data held on spinning disks. They utilized memory to cache data and they made effective use of the CPU power available. With the passage of time all these resources increased their speed, but they did not accelerate at the same rate. The biggest disparity was that disk read speeds did not accelerate as quickly as memory access and CPU speed.
Some databases were built to run in parallel for speed. The typical installation was initially a large symmetric multiprocessing (SMP) server. Later these were clustered with interconnects between two or more servers. This cluster appeared as a single logical database server. Within that architecture, databases were built to achieve maximum parallelism and thus deliver high performance and failover capability.
The Sea ChangeThe hardware layer had evolved significantly by the 2000 to 2005 time frame, with the
consequence that traditional RDBMS products were less aligned with hardware capabilities than they had been. In particular, CPUs added multiple cores and they had grown to include large on-board caches where data could reside and be processed without the need to go to main memory.
Memory capacity had become much greater and thus in many situations it was possible to retain whole tables in memory. The physical data structures used to store data on disk were no longer optimal. Network speeds had accelerated to such a level that it was feasible to assemble much larger clusters of servers – grids of servers could be used to distribute workloads. Finally, the use of random reads from disk could be a suboptimal approach to retrieving data for non-OLTP workloads. In accessing a large volume of data it was usually much faster to read the disk serially.
This significant change in the hardware layer created the opportunity to build new products that were better engineered to exploit the emerging hardware environment. This is what happened with the advent of column-store databases, the pioneer being Sybase, now an SAP Company, with their Sybase IQ database. Other companies pursued similar architectural ideas, perhaps sensing the direction that hardware evolution would ultimately follow.
THE DATABASE REVOLUTION
4

These column-store products were different from traditional RDBMS products. Few tried to cater to OLTP workloads, focusing specifically on query workloads that accessed large volumes of data or large analytical queries. The need for such products became increasingly obvious as database and data warehouse volumes expanded and businesses started to capture, store and process data from entirely new sources. The old RDBMS databases began to show their age.
The Scale-Out Architecture and the New GenerationAside from column store databases, a new generation of products emerged in the 2004 to
2011 time frame. These were labeled NoSQL products and could not be regarded as an
evolution of RDBMS. Nearly all were built with a scale-out architecture for high concurrency and were intended to manage data volumes up to the petabyte range.
Figure 1 depicts a typical scale-out database architecture. Data may be compressed when it is ingested, then distributed across multiple nodes. The full database is spread across multiple computers – with a constraint in many NoSQL databases that the data for a transaction or query be limited to a single node.
The idea of a multi-node database with transactions or queries isolated to individual nodes was an offshoot of the transactional workloads of large web sites. Early on, the back-end database infrastructure of these nodes involved manual partitioning of data in identical
THE DATABASE REVOLUTION
5
Figure 1: Scale-Out Architecture
Server 1
Data is compressed andpartitioned on disk by
row or column, and by range
Query
Sub Query 1
Sub Query 2
The query is decomposed into a sub-query for each node
CommonMemory
The database scales up and out by adding more serversDatabase
Table
Cache
CPU CPU
Server 2
CPU CPU
Server 1
CPU CPU
CommonMemory
Cache
CommonMemory
Cache
DataDataDataDataDataDataDataData
DataDataDataData

schemas across nodes. A local database ran on each node and held a portion of the total data, a technique referred to as "sharding" – for breaking the database up into shards. This technique evolved into single databases that subsumed data partitioning, query redirection and other features, eliminating manual work and better supporting the developers' needs.
In relational scale-out databases and some NoSQL databases, queries are broken into subqueries which apply to specific nodes in a server cluster. The subquery results are aggregated to get a final answer. All resources are exploited to run in a parallel manner. To improve performance or cater for larger data volumes, you add nodes to the cluster.
Most NoSQL databases have this kind of architecture for scaling out and thus can be distributed across many server nodes. How they handle data distribution, data compression and node failure varies from product to product, but the general architecture is similar. They are usually built in a shared-nothing manner so that no node has to know much about what’s happening on other nodes. We will discuss scalability in all its aspects in greater depth later in this report.
THE DATABASE REVOLUTION
6
The Relational Database and the Non-Relational Database In general, it helps to think in terms of there being two specific kinds of database: the
relational database and the “non-relational” database. We define these in rough terms below.
The Relational Database (RDBMS)From our perspective, a relational database is a database that stores data in tables and can
use SQL-based commands to access the data. Traditionally data models have been designed by analyzing the structure of the data that is to be stored and modeling it as a third-normal form (3NF) structure. In practice, the model is a set of tables and relationships between them which are expressed in terms of keys. A row of any table will consist of a set of items of structured data and the database as a whole will contain only structured data. The logical model of the data held in the database is based on tables and relationships.
For example, a table called Staff, may have rows consisting of columns Staff_ID, First_Name, Initial, Last_Name, Address_Line_1, Address_Line_2, City, State, Zip_Code, Home_Tel_No, Cell_Tel_No. This is defined in the database schema and the data types of each item (integer, char, varchar, etc.) are defined for the columns.
The column names are the references that a program or database user employs to access the data using SQL. What we have described is structured data. It is called that because the data held in the database is tabular, known in advance and recorded in a schema.
The Non-Relational DatabaseA non-relational database is, by our definition, one which caters to a wider variety of data
structures than just tables. It does not necessarily have a schema of the form just described and it does not necessarily support SQL access (although it may, to some degree.)
What we have defined here is an “everything else bucket” that includes all databases that are not purely relational. Thus it includes older mainframe databases as well as object and object-relational databases, document and XML databases, graph databases and the databases that have in recent times chosen to identify themselves as NoSQL.
Because an RDBMS is confined to representing data as related tables made up of columns, it does not easily accommodate data with a nested or hierarchical structure such as a bill of materials or a complex document. The RDBMS can represent data in the form of a network or graph, but it has problems accommodating queries over network structures.
Where an RDBMS is used successfully to store such data, it is either because the database product has been extended beyond the relational model (and hence has a hybrid relational structure) or because an awkward compromise has been found to shoehorn such data into two-dimensional structures. Non-relational databases are often built specifically to target such inconvenient data, e.g., Neo4j with its Cypher declarative graph query language. Some databases even offer a viable SQL interface as one method of accessing data. For example, Caché (from InterSystems) is an object database, but it supports a SQL interface and hence can be used as an RDBMS if desired. Many of the new databases that have emerged in recent years are non-relational as described here, but some qualify as RDBMSs, albeit with extended capabilities not normally associated with an RDBMS.
THE DATABASE REVOLUTION
7

OldSQL, NewSQL and the Problem of NoSQLThe sheer number of new database products that have emerged in the last decade suggests
that the database market is undergoing a renaissance, just as it did 20 years earlier with the advent of a variety of new RDBMS products.
The relational database era was driven by the idea of database standardization around a generally applicable model of data and a single method for accessing it. This new renaissance is not based around these ideas at all. In our view it is driven by two factors:
• The evolution of computer hardware in combination with its decline in cost (per unit of work) that supports more cost-effective scale-out architectures.
• The business opportunity presented by new high-volume applications.Because the driver to this database renaissance is different, we are currently uncertain where
it will lead. We do not expect it to lead to a few dominant and fairly similar products. Much of what is currently driving database innovation is the need for workload-specific solutions or, as we like to characterize it, "horses for courses."
We have entered an era where many of the new database products are distinctly different. Some are targeted at processing problems for which the older universal databases are inappropriate, while others are designed for extreme scalability beyond the capabilities of the traditional RDBMS. For those who are seeking to select a database for a specific task, we believe that there are two primary considerations:
1. What is the structure of the data that the database will hold?2. What are the workloads that the database will be required to process?
We have already identified that traditional universal relational databases – we will refer to these as OldSQL databases – have proven to be excellent workhorses for most transactional data and also for querying and analyzing broad collections of corporate data. These databases are characterized by the use of SQL as the primary means of data access, although they may have other data access features.
There are also relatively new species of relational databases that operate differently or extend the relational model. A key element of many of these databases is new architectures to extend performance or scalability, most commonly scale-out. They include such products as Infobright, SAP Sybase IQ, Greenplum, ParAccel, SAND Technologies, Teradata, Vertica, Vectorwise and others. We categorize these as NewSQL databases, since they employ SQL as their primary means of access and are primarily relational in nature.
There are also new species of database that specifically chose not to use SQL or to provide a SQL interface but support other non-SQL modes of data access as the primary interface. These are commonly categorized as NoSQL databases for their definition of "not only SQL" or "no SQL at all." Nevertheless, when we examine the new collection of databases that happily claim to be NoSQL, we discover that they are quite diverse. What they have in common is:
1. Most have been built to scale out using similar techniques to the NewSQL databases. 2. They do not rigidly adhere to SQL. The attitude to SQL varies between vendors. Some
offer a broader set of data access capabilities than is offered by SQL, while some implement only a subset of SQL.
THE DATABASE REVOLUTION
8

Because of the second of these two points, we find the term NoSQL to be woefully misleading. In Figure 2, we roughly illustrate the area of applicability of OldSQL, NewSQL and NoSQL.
The vertical axis of the graph indicates complexity of data structure, with the simplest at the top. Thus a single table is less complex than the star schema and snowflake schema structures that one often sees in data warehouses. These are simpler than a third normal form (TNF) relational schema. Nested data, graph data and other forms of complex data structures represent increasing complexity of data structures.
It is easy to place OldSQL and NewSQL databases on this graph. Both can usually cater for all of the data structures down to the online analytical processing (OLAP) level. The distinction between the two categories of product is simply in their ability to scale up to very high volumes of data. The OldSQL databases, built for single server or clustered environments, have a limit to their scalability. Most NewSQL databases, designed for query over high data volumes, provide little or no support for OLTP, but their scale-out architectures offer good support for data volumes up to the petabyte level.
As soon as we take a close look at the NoSQL category, we realize that it is not a meaningful category at all. It includes products like Hypertable, which is NoSQL by virtue of the fact that it does not support the JOIN operation. Such databases are built to support extremely large sparse tables and the JOIN is superfluous to the intended workloads. They can be placed in the top area of the graph in Figure 2. By contrast, a product such as MarkLogic is intended to support large volumes of very complex data structures (defined using XML) and covers most of the NoSQL area defined on the graph.
In our view the NoSQL label, since it can mean “not only SQL” as well as “no SQL at all” is not an informative description of a database. It serves more to confuse. Some NoSQL databases offer a SQL interface but they are not engineered for fast performance via that interface in the same way that OldSQL and NewSQL products are.
The main consequence of not supporting SQL at all is that a whole collection of development and BI tools, most of which require SQL to communicate, may not be able to access the database. If you have no intention of using the database with tools of that kind then it will not matter, especially if it is possible to export data from the NoSQL database to a SQL-capable database for the sake of such tools.
THE DATABASE REVOLUTION
9
Figure 2: NoSQL Confusion
nosql
Data Volume
Single Table
Star Schema
Snow Flake
TNF Schema
Nested Data
Graph Data
Complex Data
newsqloldsql
No JOINnosql
The Influence of MapReduce and HadoopUntil recently there was no widely used framework for programming in parallel. Parallel
programming was thus a fairly arcane skill acquired by programmers in specialist areas such as writing operating systems and building scientific applications. Scale-out hardware models for parallelism began in earnest with search engine technology. The Web spans billions of web pages and the number increases daily, yet when searching for a word or phrase – you receive an answer in a fraction of a second. This is achieved using parallel computing.
Google does not publish the fine details of the software and hardware it deploys to achieve such fast searches, but reports suggest that each search query is spread out across thousands of CPUs, each of which has a large amount of memory. A highly compressed map of the whole web is held in memory and the search query accesses that map. The software framework Google used to address this application is called MapReduce. While there are quite a few products – not just databases, but data streaming products, message bus software and more – that were built for parallel operation, there are few software development environments that directly enable parallel application development.
This partly explains the current popularity of Hadoop, an open source project that started out as an implementation of the MapReduce framework, complete with hooks to allow the addition of Java code in order to add functionality to its basic parallel mode of operation. It embodies the Hadoop Distributed File System (HDFS), which allows very large data files to be distributed across all the nodes of a very large grid of servers in a way that supports recovery from the failure of any node.
The MapReduce mode of operation is to partition the workload across all the servers in a grid and to apply first a mapping step (Map) and then a reduction step (Reduce).
• Map: The map step partitions the workload across all the nodes for execution. This step may cycle as each node can spawn a further division of work and share it with other nodes. In any event, an answer set is arrived at on each node.
• Reduce: The reduce step combines the answers from all the nodes. This activity may also be distributed across the grid, if needed, with data being passed as well. Eventually an answer is arrived at.
The Map stage is a filter/workload partition stage. It simply distributes selection criteria across every node. Each node selects data from HDFS files at its node, based on key values. HDFS stores data as a key with attached other data that is undefined (in the sense of being in a schema). Hence it is a primitive key value store, with the records consisting of a head (the key) and a tail (all other data).
The Map phase reads data serially from the file and retains only keys that fit the map. Java hooks are provided for any further processing at this stage. The map phase then sends results to other nodes for reduction, so that records which fit the same criteria end up on the same node for reduction. In effect, results are mapped to and sent to an appropriate node for reduction.
The Reduce phase processes this data. Usually it will be aggregating or averaging or counting or some combination of such operations. Java hooks are provided for adding sophistication to such processing. Then there is a result of some kind on each reduce node. Further reduction passes may then be carried out to arrive at a final result. This may involve
THE DATABASE REVOLUTION
10

further data passing in the form of mapping and reducing, making up the full Hadoop job. In essence, this is simply a “parallelization by workload partitioning” scheme with the added nuance of being fault tolerant.
In essence, Hadoop implements parallelism that works well on large volumes of data distributed across many servers. The processing is kept local to each node (in the Map step) and only sent across the network for arriving at an answer (in the Reduce step). It is easy to see how you can implement a SQL-like query using this, since the Map step would do the SELECT and PROJECT operations, getting the appropriate data to each node, then the reduce step would compile the answer – possibly implementing a JOIN or carrying out a SORT.
HDFS keeps three copies of all data by default, and this enables Hadoop to recover from the failure of any of its nodes, as Hadoop also takes snapshots on each node to enable recovery from any node failure. Hadoop is thus “fault tolerant” and the fault tolerance is hardware independent, so it can be deployed on inexpensive commodity hardware. Fault tolerance is important for a system that can be using hundreds of nodes at once, because the probability of any node failing is multiplied by the number of nodes.
Hadoop can be fast. For example, in one benchmark, it sorted a terabyte of data (in 100 byte records) in 62 seconds using a 1,460 node configuration. This is not as fast as a purpose-built database might achieve, but Hadoop has the overhead of its fault-tolerant architecture. It scales well – having been proven on as many as 5,000 nodes – and in some situations it will outperform traditional massively parallel databases by a wide margin.
HBase, Hive, Pig and Other Hadoop Database DevelopmentsClearly, native Hadoop is not a database by any stretch of the imagination. However, once it
became popular, it was inevitable that Hadoop would soon evolve to adopt some of the characteristics of a database. HBase, another open source project, stepped in to partially fill the gap. It implements a column-oriented data store modeled on Google's Bigtable on top of Hadoop and HDFS, and it also provides indexing for HDFS. With HBase it is possible to have multiple large tables or even just one large table distributed beneath Hadoop.
Hive, initially a sub-project of Hadoop, evolved to provide a formal query capability. In effect, Hive turns Hadoop into a data warehouse-like system, allowing data summarization, ad hoc queries and the analysis of data stored by Hadoop. Hive holds metadata describing the contents of files and allows queries in HiveQL, a SQL-like language. It also allows MapReduce programmers to get around the limitations of HiveQL by plugging in MapReduce routines.
Pig, originally developed at Yahoo Research, is a high-level language for building MapReduce programs for Hadoop, thus simplifying the use of MapReduce. It is a data flow language that provides high-level commands.
If Hadoop (plus HBase plus Hive plus Pig) was a very versatile highly performant database, there would be little or no market for the new generation databases. Few companies would pay the license fees for Teradata, Sybase IQ, Infobright, et al, if this combination of software products could replace them. But Hadoop isn’t sophisticated enough for this. For example, it only runs one task at a time, offering no concurrency. Nevertheless, the Hadoop ecosystem is clearly increasing in capability, both by virtue of continuing open source efforts, and also
THE DATABASE REVOLUTION
11

because database vendors now recognize the importance of integrating with Hadoop, and/or complementing what it offers.
There are some clear areas where Hadoop, in its current form, scores well. An obvious one is as an extract, transform, load (ETL) staging system when an organization has a flood of data and only a small proportion can be put to use. The data can be stored in Hadoop and jobs run to extract useful data to put into a database for deeper analysis.
Hadoop was built as a parallel processing environment for large data volumes, not as a database. For that reason, it can be very useful if you need to manipulate data in sophisticated ways. For example, it has been used both to render 3D video and for scientific programming. It is a massively parallel platform which can be used in many ways.
Database capabilities have been added, but even with these it is still best to not think of it as a database product. The open source nature of Hadoop allowed developers to try it, and this drove early popularity. Because it became popular, many vendors began to exploit its capabilities, adding to it or linking it to their databases. Hadoop has generated its own software ecosystem.
By leveraging Hadoop’s useful capabilities, Aster Data developed a proprietary MapReduce environment to extend their relational database which, since acquisition by Teradata, now complements Teradata’s database. In their model, a SQL statement can call a MapReduce routine to carry out processing and return the results within the context of a SQL statement. This allows existing SQL-compatible tools to make use of MapReduce, something that would otherwise require a custom front end.
Many database companies are using Hadoop in different ways. Examples include RainStor, which uses its compression technology as a Hadoop accelerator; Cassandra, which focuses on high volume real-time transaction processing but has integrated Hadoop for batch-oriented analytics; and MongoDB, which has a two-way connector that allows for the flow of data between the itself and Hadoop. MongoDB could be characterized as a highly scalable document store for web data and is seeing much use by developers for building small custom applications. This is a constantly changing picture, and we have little doubt that Hadoop will increase in usefulness.
Key Value Stores and Distributed Hash TablesTwo repeating themes with many of the new generation databases merit some explanation.
They are key value stores and distributed hash tables.• Key value store: A key value store is a file that stores records by key. The record
consists of a key and other attached information: a key value pair. The structure of the attached data is not explicitly defined by a schema – in effect it is a blob of data. The HDFS within Hadoop is a key value store. The primary benefit of such a file is that it is relatively easy to scale in a shared-nothing fashion: it delivers good performance for keyed reads, and developers have more flexibility when storing complex data structures.
• Distributed hash tables: A distributed hash table (DHT) is one means of implementing a scale-out key value store. Keys are hashed according to their value, so the location of the node on which any given key value pair resides is determined by the hashing process which distributes the records evenly. The hashing process is itself
THE DATABASE REVOLUTION
12
usually distributed among participating nodes for the sake of failover. Depending on the finer details of the implementation, the outcome is highly scalable since the work of retrieving data can by spread across all participating nodes.
Hadoop’s HDFS is a key value store and many of the new generation of database products began as developments of key value stores, but with added features that were specific to data management. New generation databases that make use of these techniques include Berkeley DB, MongoDB, Riak, Cassandra and many others.
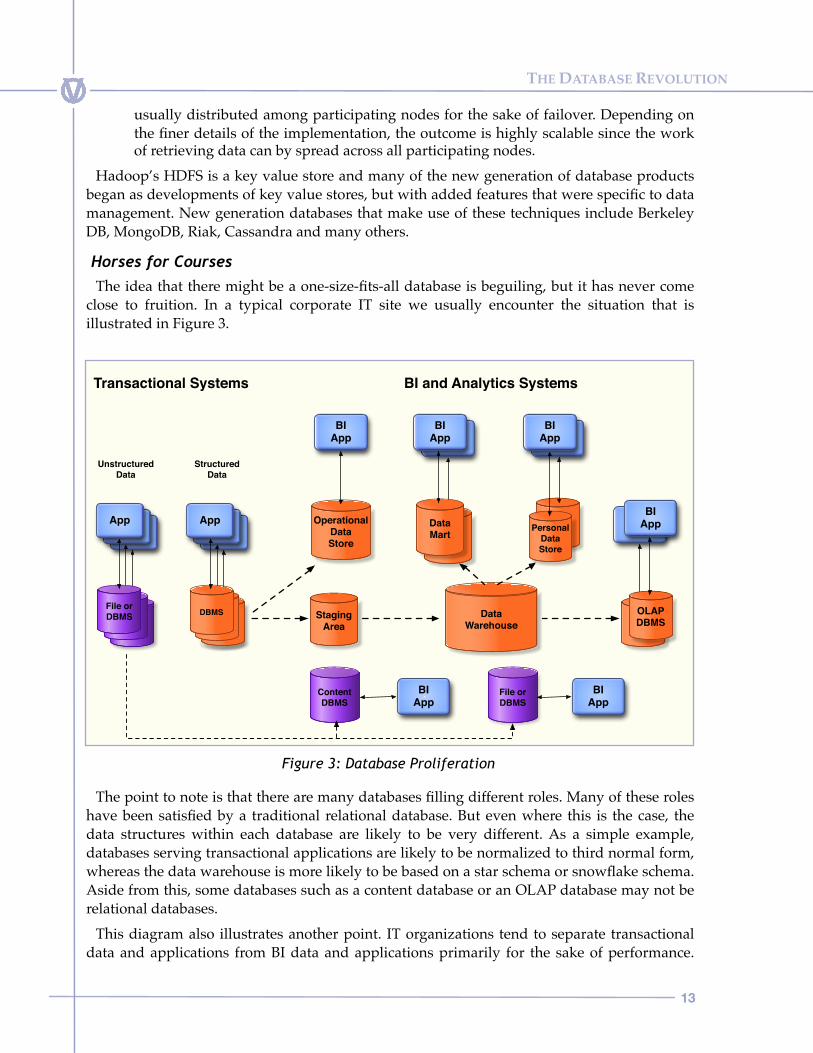
Horses for CoursesThe idea that there might be a one-size-fits-all database is beguiling, but it has never come
close to fruition. In a typical corporate IT site we usually encounter the situation that is illustrated in Figure 3.
The point to note is that there are many databases filling different roles. Many of these roles have been satisfied by a traditional relational database. But even where this is the case, the data structures within each database are likely to be very different. As a simple example, databases serving transactional applications are likely to be normalized to third normal form, whereas the data warehouse is more likely to be based on a star schema or snowflake schema. Aside from this, some databases such as a content database or an OLAP database may not be relational databases.
This diagram also illustrates another point. IT organizations tend to separate transactional data and applications from BI data and applications primarily for the sake of performance.
THE DATABASE REVOLUTION
13
Figure 3: Database Proliferation
DataWarehouse
BIApp
ContentDBMS
File or DBMS
Transactional Systems BI and Analytics Systems
Unstructured Data
Structured Data
DBMSDBMS
AppAppApp
File orDBMS
File orDBMS
File orDBMS
AppAppApp
DBMS
OperationalDataStore
OLAPDBMS
Staging Area
BIApp
BIApp
BIApp
BIApp
OLAPDBMS
DataStoreData
MartPersonal
DataStore
DataMart
BIAppBI
App BIAppBI
App

The staging area may exist for the purpose of allowing data cleansing, but it may also exist because it is better not to mix the data ingest activity of the data warehouse with other workloads it performs. That depends upon the database product in use.
The operational data store is most likely needed because of a prolonged latency between data being captured in transactional systems and becoming available for query within the data warehouse. The data marts, personal data stores and OLAP databases exist because the data warehouse does not have the capacity to handle such workloads. The file or content data stores are there to emphasize that some BI workloads cannot be satisfied by a traditional relational database. It is also worth pointing out that the diagram in Figure 3 does not include ETL processes or any of the processes and data stores associated with master data management and data governance.
This illustration could be viewed as outdated since it does not include any “Big Data” databases or data flows, and these are becoming a common phenomenon. Neither does it include any real-time event data. Reality can be far more complicated than this, not just in terms of the number of different databases a company has (there are organizations with thousands of database instances) but also in the roles that databases serve.
The relatively new databases, whether NewSQL or NoSQL, are largely aimed at catering for Big Data, some targeting structured data and some targeting unstructured data. We currently believe it is best to think in terms of “horses for courses” – the metaphor comes from horse racing where some horses only run well on courses for which they’re suited. In the same manner, it is generally sensible to select a database product according to the role it is intended to play and the data over which it will preside.
In time we may see the current diversification of database technology reverse and lead to another period of standardization, but we cannot know for sure that this will happen. Hardware evolution has not stopped and database evolution is currently following the hardware lead, leveraging both the changes in technology and the advent of cloud computing.
Cloud computing is significant not only because it enables much faster and less expensive availability of resources, but also because it enables businesses to rent whole grids of computers and hence enables elastically configured Big Data applications. This is only now beginning to be a trend, given that many organizations are still nervous about the security of the cloud and the fact that management of cloud resources is largely out of their direct control. However, those issues will likely be resolved in time.
THE DATABASE REVOLUTION
14

Structured and Unstructured DataThe words “structured” and “unstructured” are commonly used to describe data. Since all
processable data actually has a structure, these two words often cause confusion. We define them as follows:
• Structured data: Structured data is data for which an explicit structure has been declared in a database schema. In other words, the metadata for every element and its storage is accessible; its structure has been formally declared for use by multiple programs.
• Unstructured data: Unstructured data constitutes all digital data that falls outside the definition of structured data. Its structure is not explicitly declared in a schema. In some cases, as with natural language, the structure may need to be discovered.
Soon after XML (the eXtensible Mark-up Language) was invented, designers realized that data could exploit XML to carry metadata with it. The data would then be self-describing. This gave rise to another form of structured data aside from that described explicitly in a database schema. There are databases such as MarkLogic which use an XML-based schema to define the structure of the data they contain. We can refer to such structured data as XML-defined data.
There is an important distinction between data defined by SQL’s data definition statements and data defined by XML. The SQL schema defines the data for use within the associated database, whereas XML defines data at any level of granularity from a single item through to a complex structure such as a web page. XML is far more versatile in that respect and it is relatively simple to use it to define data that is exported from a database.
Further, XML may be used define many things about the data to which it applies, such as page mark-up for display of data in a browser. Consequently it became a dominant standard for use in information interchange, and because XML is an extensible language it has been extended for use in many different contexts.
Soon after the advent of XML, a query language, XQuery was developed for querying XML-defined data. This is a new query language developed in the XML Query Working Group (part of the World Wide Web Consortium) and it specifically uses XML as the basis for its data model and type system. So XQuery is based on XML just as SQL is based on the relational model of data. However, XQuery has no concept of relational data. Because of that an extension of SQL, SQL/XML was developed, designed for SQL programmers and intended to allow them to query XML data stored within a relational database. SQL/XML is included in the ANSI/ISO SQL 2003 specification.
At this point in time, the use of XML is not as widespread as the use of SQL. However, many of the more developer-oriented databases use JSON (the JavaScript Object Notation) rather than XML for data manipulation and interchange. There is an important issue here. SQL schemas prove to be very useful at the logical level to provide a basis for set-oriented data manipulation, but do not define data at the physical level particularly well. The physical definition of data is specific to the database product. XML is broader in some ways as a logical definition of data, but is cumbersome at the physical data storage level. JSON, which is object oriented, is less cumbersome than XML at the physical level, but lacks logical information
THE DATABASE REVOLUTION
15
about data relationships. Better would be a data definition standard that encompassed all three, but we are not aware of the existence of any such standard.
Unstructured Data as Un-Modeled DataIf we include XML-defined data in the family of structured data, that still leaves us with a
vast amount of data for which no structure has been explicitly declared. This can, in our view, be best designated as “un-modeled data.” If a program of any kind created a file of digital data then, at the very least, it knew enough about the structure of that data to enable it to read that file at a later date – it just failed to embed any knowledge of that structure with the data. This practice means that it is not possible for the data to be reused easily by other programs. This is one of the challenges with application-controlled data storage that led to the development of early pre-relational databases with explicit schemas.
We classify such data as un-modeled because no design effort has been expended on modeling the data for use by other programs. It may be possible to access the data because we know something about the structure of the data even though it has not been modeled. For example, we may know that some of it is text, so we can search for specific words, and we may even be able to carry out sophisticated searches of this un-modeled data.
It may even be the case that some data held in a typical RDBMS is un-modeled in this way. For example, a specific item in a row may be known (by data type) to be text, but nothing of the inner structure of the text is known. The text itself is not explicitly modeled. Maybe it is just a string of written text or maybe it is a character stream that defined a web page complete with HTML tags. The database schema does not indicate which. Most RDBMSs allow the definition of a BLOB (large binary object) and nothing is explicitly defined about the data within the BLOB.
Even if a program knows about the structure of the data it stores, it may not know everything about it. Take, as an example, this document in its digital form. The desktop publishing software knows quite a lot about the structure of the data for the sake of marking it up effectively, but it knows nothing about some of the structure. It may have no idea whether the sentences make any sense or whether they are grammatical. Those elements of structure come from the writer and pass directly to the reader without software ever seeing it. The same is true of photographs, vector graphics, video and so on.
It is estimated that about 80% of all digital data is “unstructured” in this way.
THE DATABASE REVOLUTION
16

Database WorkloadsThe most important criterion in selecting a database is whether it will be able to handle the
intended workload. This is not a simple criterion because workloads have multiple dimensions and there are different architectural approaches to managing these workloads.
Aside from streaming data (which we ignore in this report for reasons of space), workloads can be classified into three primary groups:
• Online transaction processing (OLTP): Transaction processing is a mixed read-write workload which can be lightly to very write-intensive. OLTP requires low latency response, accesses small amounts of data at one time and has predictable access patterns with few, if any, complex joins between different sets of data.
• Business intelligence (BI): Originally this was viewed as a combination of batch and on-demand reporting, later expanding to include ad hoc query, dashboards and visualization tools. BI workloads are read-intensive, with writes usually done during off-hours or in ways that don't compete with queries. While quick response times are desired, they are not typically in the sub-second range that OLTP requires. Data access patterns tend to be unpredictable; they often involve reading a lot of data at one time, and can have many complex joins.
• Analytics: Analytic workloads involve more extensive calculation over data than BI. They are both compute-intensive and read-intensive, similar in many ways to BI except that access patterns are more predictable. They generally access entire datasets at one time, sometimes with complex joins prior to doing computations. Most analytic workloads are done in a batch mode, with the output used downstream via BI or other applications.
Relational databases have been the platform of choice for all three workloads over the past two decades. As workloads grew larger and more varied, the databases kept pace, adding new features and improving performance. This development led to the database market of fairly recent years, with a small number of large database vendors offering general-purpose RDBMS products designed to support everything from transaction processing to batch analytics.
Over the last decade, companies pushed workloads past the capabilities of almost all of these universal databases. Workload scale is larger and the required scope broader, making it difficult for the traditional RDBMS to support both the past use cases and new use cases that exist today.
Consequently, software vendors have developed new database products to support workload-specific needs. By limiting the scope to a single workload, these vendors narrow the set of requirements that must be met and expand their technology and design choices. Some choices are poor for one workload but good for another.
These choices were not adopted by the older RDBMSs even though they would be optimal for a specific workload. Instead, a tradeoff was made for breadth of scope against capability for a given workload. Such tradeoffs manifest themselves in the RDBMS as poor performance at extreme scale for a single workload or at moderate scale when more than one simultaneous workload is involved.
THE DATABASE REVOLUTION
17

Workload CharacteristicsThe challenge for any product is that different workloads have different characteristics,
leading to conflicts when trying to support a mixed workload. Supporting a single workload, assuming the database is powerful enough and appropriate for the workload, is pain free, but there is usually a mix. The following seven characteristics are key to defining workloads.
Read-Write MixAll workloads are a mix of reads and writes. OLTP is a write-intensive workload, but
writing data on most OLTP systems makes up only 20% to 30% of the total. BI and analytics are thought of as read-only, but the data must be loaded at some point before it can be used. The difference is that most BI systems write data in bulk at one time and read data afterwards. OLTP reads and writes are happening at the same time. The intensity of reading and writing and the mix of the two are important aspects of a workload. Business intelligence-specific databases designed to handle read-intensive work are often designed to load data in bulk, avoiding writes while querying. If the writes are done continuously throughout the day rather than in batch, poor query performance can result.
Conventional workloads are changing. Operational BI and dashboards often require up-to- date information. Analytic processing is done in real time as part of the work in OLTP systems. The workload for an operational BI application can look very similar to an OLTP application.
Many of today's analytic workloads are based on log or interaction data. This high volume data flows continuously, so it must be written constantly. Continuous loading is the extreme end of the spectrum for write intensity. Likewise, large-scale analytics, particularly when building models, will read entire datasets one or more times, making them among the most read-intensive workloads.
Data LatencyData latency is the time between its creation and availability for a query. Applications can
have different tolerances for latency. For example, many data warehouses have long latencies, updated once per day. OLTP systems have short latencies, with the data available for query as soon as it has been inserted or updated.
Longer latency requirements mean more options are available in a database. They allow for the possibility of incremental updates or batch processing and the separation of data collection processes from data consumption processes. Short latencies impose more restrictions on a system.
ConsistencyConsistency applies to data that is queried. Immediate consistency means that as soon as
data has been updated, any other query will see the updated value. Eventual consistency means that changes to data will not be uniformly visible to all queries for some period of time. Some queries may see the earlier value while others see the new value. The time until consistency could be a few milliseconds to a few minutes, depending on the database.
Consistency is important to most OLTP systems because inconsistent query results could lead to serious problems. For example, if a bank account is emptied by one withdrawal, it
THE DATABASE REVOLUTION
18

shouldn't be possible to withdraw more funds. With eventual consistency, it might be possible for two simultaneous withdrawals to each take the full balance out of the account.
The reason eventual consistency may be desirable is that it offers better performance and scalability characteristics, particularly for large scale systems running in a distributed hardware environment like the cloud. There are cases where immediate consistency is not critical, for example in many consumer-facing web applications. In these cases, an eventually consistent model can be used, allowing the application to scale far higher than would otherwise be possible.
UpdatabilityData may be changeable or it may be permanent. If an application never updates or deletes
data then it is possible to simplify the database and improve both performance and scalability. If updates and deletes are a normal and constant part of the workload then mechanisms must be present to handle them.
Event streams, such as log data or web tracking activity, are examples of data that by its nature does not have updates. It is created when an event occurs, unlike transaction data in an OLTP system that might be changed over the lifetime of a process. Outside of event streams, the most common scenarios for write-once data are in BI and analytics workloads, where data is usually loaded once and queried thereafter.
A number of BI and analytic databases assume that updates and deletes are rare and use very simple mechanisms to control them. Putting a workload with a constant stream of updates and deletes onto one of these databases will lead to query performance problems because that workload is not part of their primary design. The same applies to some NoSQL stores that have been designed as append-only stores to handle extremely high rates of data loading. They can write large volumes of data quickly, but once written the data can't be changed. Instead it must be copied, modified and written a second time.
Data TypesRelational databases operate on tables of data, but not all data is tabular. Data structures can
be hierarchies, networks, documents or even nested inside one another. If the data is hierarchical then it must be flattened into different tables before it can be stored in a relational database. This isn't difficult, but it creates a challenge when mapping between the database and a program that needs to retrieve the data.
Different types of databases, like object and document databases, are designed to accept these data structures, making it much easier for an application to store, retrieve or analyze this data. There are tradeoffs with these databases because they are mostly non-relational. Being non-relational means that managing unpredictable queries may be difficult or impossible. They simplify the query to a retrieval or write operation based on a single key. The benefits of these databases are performance, extremely low latency, application flexibility and scalability for OLTP workloads.
Response TimeResponse time is the duration of a query or transaction and the time taken to return the
result of the operation. There are three course ranges of response time: machine speed, interactive speed and batch speed. Machine speed is measured in micro to milliseconds while
THE DATABASE REVOLUTION
19
the response time needed for interactive use can vary from 100 milliseconds to a few seconds, depending on the context. For true interactivity, less than 500 milliseconds is an average required response. Beyond a few seconds, a user waits for results, pushing the query into a lower tier of interactive performance. Beyond about 7 seconds, a system is moving into more of a batch interactive to offline batch model.
The challenge with fast response time for queries is the volume of data that must be read, which is itself also a function of the complexity of the query. Many solutions, like OLAP databases, focus on pre-staging data so the query can simply read summarized or pre-calculated results. If a query requires no joins it can be very fast, which is how some NoSQL databases satisfy extremely low latency queries.
Response time on writes is similar, with the added mechanism of eventual consistency. If a database is eventually consistent, it's possible to provide a higher degree of parallelism to partition the workload, offering higher scalability. With proper design, this translates into consistent and low response times.
PredictabilitySome workloads have highly predictable data access patterns. For example, OLTP access
patterns are usually highly repetitive because there are only a few types of transaction, making them easier to design for and tune. Dashboards and batch reporting will issue the same queries day after day. The repetition allows more options to design or tune a database since the workload can be anticipated.
When queries are unpredictable, as with ad hoc query or data exploration workloads, the database must be more flexible. The query optimizer must be better so it can provide reasonable performance given unknown queries. Performance management is much more difficult because there is little that can be done in advance to design or tune for the workload.
The repetition of transactions and queries is one of the key parameters for selecting suitable technologies. The less predictable the data access patterns are, the more likely it is that a relational model, or one that permits arbitrary joins or searches easily, will be required.
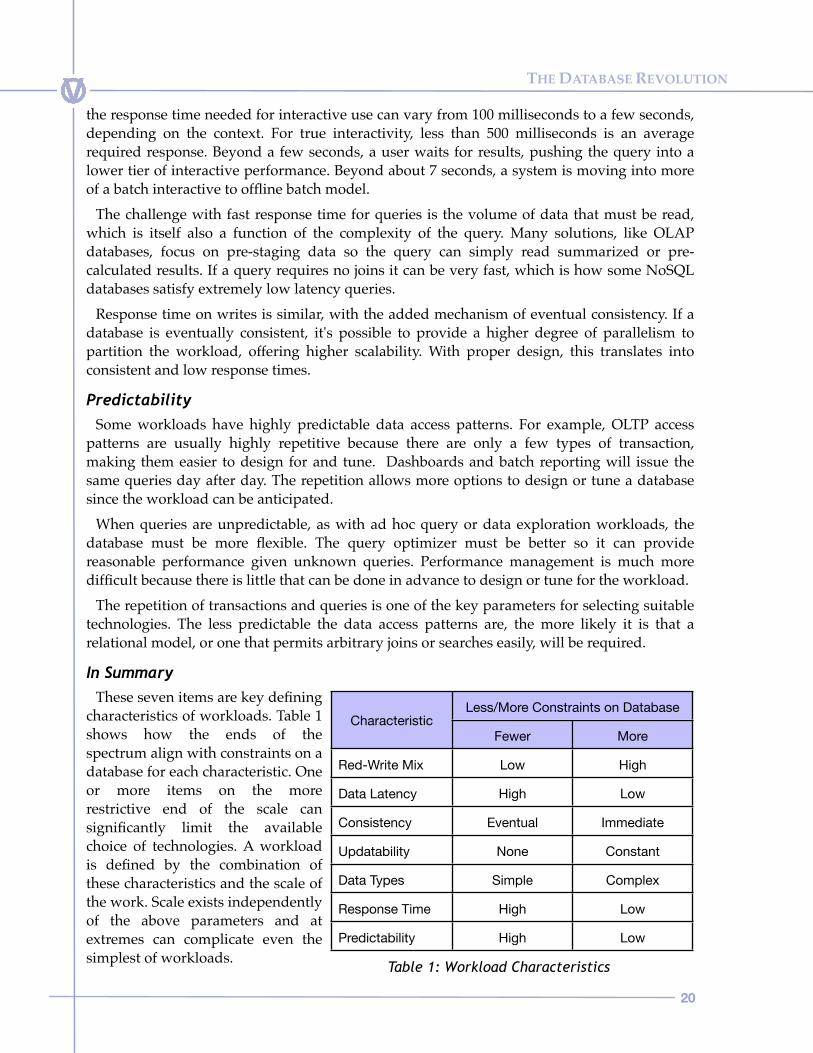
In SummaryThese seven items are key defining
characteristics of workloads. Table 1 shows how the ends of the spectrum align with constraints on a database for each characteristic. One or more items on the more restrictive end of the scale can significantly limit the available choice of technologies. A workload is defined by the combination of these characteristics and the scale of the work. Scale exists independently of the above parameters and at extremes can complicate even the simplest of workloads.
THE DATABASE REVOLUTION
20
CharacteristicLess/More Constraints on DatabaseLess/More Constraints on Database
CharacteristicFewer More
Red-Write Mix Low High
Data Latency High Low
Consistency Eventual Immediate
Updatability None Constant
Data Types Simple Complex
Response Time High Low
Predictability High Low
Table 1: Workload Characteristics

The Axes of Scale for Data ProcessingThe scale of a database workload can be measured along three separate axes: data volume,
concurrency and computation. The combination of these define the scale of a workload and constrain database choices.
Data VolumeData growth has been a consistent source of
performance trouble for databases. Data volume can be looked at in different ways. The simple measurement of size in gigabytes or terabytes of total data hides some of the important aspects.
Data volume has the biggest impact on BI and analytic workloads. By their nature, these read large portions of data at one time and join multiple tables together. Meanwhile, OLTP workloads are less affected by data volume because the transactions and queries are very selective, only writing or retrieving a small number of records at a time.
The structure and complexity of the data can be as important as the raw data volumes. Narrow and deep structures, like simple tables with a small number of columns but many rows, are easier to manage than many tables of varying widths and row counts.
The number of tables and relationships is as important as the amount of data stored. Large numbers of schema objects imply more complex joins and more difficulty distributing the data so that it can be joined efficiently. These drive query complexity which can result in poor optimizations and lots of data movement. This element of data size is often overlooked, but is one that can significantly affect scalability.
The rate of data growth is important as well. A large initial volume with small incremental growth is easier to manage than a quickly growing volume of data. Fast growth implies the need for an easily scalable platform, generally pushing one toward databases that support a scale-out model.
There are few helpful rules of thumb for what size qualifies as small or large. In general, when the total amount of data rises to the five terabyte range, universal databases running on a single server begin to experience performance challenges. At this scale it takes more expertise to tune and manage a system. It's at this boundary that most organizations begin looking to alternatives like purpose-built appliances and parallel shared-nothing databases. The five terabytes is a 2012 figure. As hardware power increases, this boundary figure will also increase. The overall capability of a single server can currently be expected to increase by 20% to 30% per year in respect to data volumes.
ConcurrencyThe important aspect of concurrency is the number of simultaneous queries and
transactions. The number of end users accessing the system is often a proxy for these counts,
THE DATABASE REVOLUTION
21
Table 2: Data Volumes
Scale Axes: Data VolumesScale Axes: Data Volumes
Higher Impact Lower Impact
BI workloads OLTP workloads
Complex data structure
Simple data structure
Many tables or objects
Fewer tables or objects
Fast rate of growth
Slow rate of growth
Above 5 terabytes (2012)
Below 5 terabytes (2012)

but the number of people isn’t solely internal users. It can be external users like partners, suppliers and customers. This expanding user base is raising concurrency to levels that were never imagined for a single database just a decade ago.
User concurrency can be measured in two ways: passive and active. Active users are those executing queries or transactions, while passive concurrency is the total number connected to the database but sitting idle. For most workloads concurrency is in the range of 15% to 25% of the total user count.
This rule of thumb is useful for estimating the concurrent query and transaction workload for a database, although the percentage is changing as tools and technologies change. Web applications often pre-fetch data for possible subsequent actions, unlike many older OLTP applications. Pre-fetching can double the query concurrency of an OLTP workload.
In BI workloads, dashboard and scorecard tools may auto-update periodically, making concurrency much higher. In the past it was also reasonable to assume that one user equated to one report and therefore one query. This assumption is no longer true. A dashboard might issue half a dozen complex queries to populate the information on a single screen.
Concurrency is also driven by systems that need to access data in order to execute models, generate alerts or otherwise monitor data. As machine-to-machine communication increases, there is a marked increase in the number of simultaneous queries and transactions.
There are no firm rules for what constitutes high concurrency. The number varies based on workload since higher workloads have greater impact. A dozen concurrent analytics users can stress a database as much as a few hundred BI users or a few thousand users of a packaged OLTP application.
High concurrency in OLTP is measured in thousands, and extreme in hundreds of thousands to millions of users. Some operational BI or quasi-BI web applications can rise into the same concurrency range, but these are exceptional. Our survey results for this report show concurrent user counts in BI to be less than half of the count for OLTP. The median range for BI falls between 300 to 400 users, but this is reflective of the organization size of respondents more than a fixed rule of thumb.
ComputationThis scale axis is about computational complexity as well as the sheer volume of
computations. Analytic workload performance is heavily influenced by both complexity and data volume.
Running complex models over moderate data sets can be a performance challenge. The problem is that many algorithms are nonlinear in performance. As data volume increases, the amount of work done by the algorithm increases even more. A doubling of data can lead to a
THE DATABASE REVOLUTION
22
Table 3: Concurrency
Scale Axes: ConcurrencyScale Axes: Concurrency
Higher Impact Lower Impact
More distinct users (i.e., connections)
Fewer distinct users (i.e., connections
More active users
Fewer active users
Many tables or objects
Fewer tables or objects
More scheduled activity
Less scheduled activity

quadrupling of computational work. In contrast, OLTP and BI workloads rarely suffer from performance problems due to the amount of computation.
This is changing as analytics are added to OLTP and BI applications. Some architectures segregate the workload, running analytics against one database and the OLTP or BI workload against another. When this approach isn't feasible, the database must be capable of performing two very different tasks at the same time.
In SummaryTaken together, these three axes define
the scale of a workload. Workload scale may grow at different rates along any or all of the axes. The important point to understand when looking at workload scale is that growth along different axes imposes different requirements on a database. These requirements may eliminate technology categories from consideration when designing a system.
Many database vendors today are trying to build universal solutions for data volume scaling across all workloads. Their recognition of the challenges of scaling over multiple workloads can be lacking because they approach the problems with a single technology or workload bias. Even if they fully understand the inherent challenges, it is likely that the database they build will be better oriented to one of these scale or workload dimensions than another.
Analytic problems have requirements that extend beyond the purely relational or programmatic model. The extended needs may be due to ordering in data, time series analysis or types of data used. Thus it is important to have a detailed understanding of the intended workloads for a database in order to have confidence that any given product will scale in the way that your workloads require. Scalability is not a one dimensional thing.
Database Technologies for Managing the Workloads
Performance and ScalabilityDelivering and maintaining good performance isn't a challenge limited to those with
hundreds of terabytes of data or hundreds of thousands of users. Many IT organizations have problems with less than a terabyte of data, which can be considered relatively small these days. If good performance is a challenge with moderate data volumes, why not simply buy more hardware?
Buying more hardware sometimes does solve the problem. However, adding hardware is often a temporary fix because the challenges are due to workloads that the chosen database
THE DATABASE REVOLUTION
23
Figure 4: The Axes of Scale
Concurrency Computation
Data Volumes

was not designed to handle. For that reason, many problems are better solved with different software rather than more hardware; “horses for courses” as we have characterized it.
There are two ways to scale the platform a database runs on. The first is to scale up. Traditional databases are designed to run on a single server with a single operating system. If the server reaches its limit then the solution to grow larger is to buy a larger server with more capacity.
Many vendors support some form of the second option: scaling out. In this model, more servers are added to form either a cluster or a grid, with each node running a local database that supports a portion of the workload.
Most organizations approach the initial growth and capacity needs by scaling up their database environment. The problem with this approach is that larger servers are progressively more expensive whereas the cost is lower for equivalent capacity with several small servers. Eventually scaling up will reach the maximum size of a single server and no more growth will be possible.
Hardware Architectures and DatabasesThere is an option for some databases at the point where a single server can't grow any
more: adding another server running a separate copy of the database software but sharing the same physical storage. This is called a shared-disk database model. It's a half-step toward a scale-out architecture because the computers have their own processors, memory and path to disk but share a single set of storage.
The challenge with scalability in this model is that most databases have limited support for spreading the work of a single query across computers. A shared disk model will help when the scale problem is concurrency, because more nodes expand the ability to handle growth in discrete tasks.
A shared disk model will not help if the database limits a query's resource use to the capacity of a single node, as most shared disk databases do. If the need is to speed up a small number of large queries, a common need with analytics, then a single query must be parallelizable across more than one node.
Another challenge with the shared disk model is the shared storage. When all the nodes in a cluster are accessing data, it is possible for the shared disk to become a bottleneck. This is the same problem as running on a single SMP server. There is limited I/O bandwidth between the cluster and the storage.
The I/O bandwidth limit can be partially resolved by increasing the speed and number of storage connections but these will reach a maximum. At this limit the storage can't deliver data fast enough to meet all the server requests, slowing down queries.
Shared disk clusters (illustrated in Figure 5) improve response time and user concurrency by providing more servers to run queries against the data. They're more appropriate when the
THE DATABASE REVOLUTION
24
Table 4: Scale Up and Scale Out
Scaling a PlatformScaling a Platform
Scale Up Scale Out
Upgrade to more powerful server or cluster
Deploy on a grid or cluster of similar servers
Appropriate for traditional scale up architecture
Appropriate for recent scale-out products
More expensive in hardware
Less expensive in hardware
Eventually hits a limit
Less likely to hit a limit

problem is the number of concurrent queries and not the need to move large amounts of data for a single query, hence they are less likely to be a good fit for scaling analytic workloads.
An alternate solution taken by many of the newer vendors is to provide a database that can run on a distributed grid of computers with no sharing of components, as shown on the right in Figure 5. This architecture is usually called “shared nothing” or massively parallel processing (MPP).
In the shared-nothing model each server contains a portion of the database, and no server contains the entire database. It is designed to process as much data as possible at each node and share data between nodes only when necessary. Although the database runs independently on multiple nodes, it appears as a single entity to any application.
This model resolves the core limitation of I/O bottlenecks facing single and clustered servers. Adding a node to a shared-nothing database increases the processors and memory available and, more importantly, the disk bandwidth as well. A group of small servers can easily outstrip the total I/O throughput of a very large server or shared disk cluster.
Scaling in this way also lowers the overall hardware cost because commodity servers can be used. A collection of small servers with the same total amount of processors, memory and storage is less expensive than a single large server.
Shared-Nothing Models May be Better for Cloud DeploymentThe deployment environment is an important aspect to consider when evaluating database
options. The cloud is like a collection of equally sized nodes that are used as building blocks for capacity. We are careful to use the word “like” because not all cloud services are identical in how they make hardware available to users.
Increasing the resources of a single node in public clouds is limited to the maximum configuration defined by the cloud provider. Typically, the nodes are virtual and smaller than the capacity of a single physical server. All the data may be held on a storage area network (SAN), rather than being spread across local disks, in which case you are running in a shared disk environment rather than a distributed grid, despite how the storage appears to the node. There is also the nuance that if you randomly assemble a grid of computers in the cloud, then
THE DATABASE REVOLUTION
25
Figure 5: Different Hardware Arrangements
Server
Disk
Server Server
Shared Disk
(SAN)
Server
Disk
Server
Disk
Server
Disk
Server
Disk
SingleServer
Shared Disk Resource Server Grid

you have no control over the level of traffic across the network between servers. Other servers could be using that network resource.
It is important to have a level of control over the cloud hardware configuration that is used for a scale-out database designed for query-intensive workloads, so that those resources are both homogenous and unshared. The cloud situation can be equally bad for shared-everything databases because the size of a single virtual node is limited and the physical hardware and network are shared with other virtual nodes. In essence you don’t want what is commonly called a “cloud service” for these workloads, you want a managed environment where you have some say over the hardware deployed. It will probably cost more, although it is still likely to cost less than deploying in your own data center.
This is in contrast to shared-nothing databases designed for OLTP workloads, particularly when using eventual consistency models. Many NoSQL databases fall into this arena. The physical hardware characteristics are less important because the workload is often more easily partitioned and less read-intensive. These databases lend themselves better to scalability in cloud environments.
There is also a question about the role of the cloud deployment. Some sites use the cloud for prototyping and then, when they go to production, bring the database back in house and deploy onto a hardware environment that is fully configurable and manageable.
For prototyping, a shared-nothing scale-out database is likely to be convenient to cloud deployment as long as you do not expect the prototype to provide accurate information about the performance of individual workloads. If your performance targets are not ambitious then a shared-nothing database should also prove more flexible for cloud deployments. The database model more closely matches the architecture of a cloud environment.
A word of warning: Business intelligence and analytic database workloads are at an intersection of requirements that makes them harder to run in the public cloud. BI queries normally retrieve some, but not all, of the data. This selectivity poses challenges for brute force cloud processing models. In scale-out, the cloud allows you to deploy a great deal of hardware flexibly and inexpensively, but ultimately you cannot solve scale problems with hardware alone. The database itself does most of the work.
ConclusionWe’ve spent a good deal of time taking a fresh look at the database market and the key
technologies available. We have a number of conclusions regarding database selection:• Much database innovation has taken place in recent years, prompted both by the
continuing evolution of computer hardware and the emergence of new collections of data that can now be used profitably by businesses. The market has diversified in response to this, in order to fill important but often niche requirements.
• Universal databases based on the relational model still fit the need for most database implementations, but they have reached scalability limits, making them either impractical or too expensive for specialized workloads. New entrants to the market and alternative approaches are often better suited to specific workloads.
Therefore our general advice if you are considering using a new type of database is to make sure you aren't buying for novelty or just to follow the current fad. The IT department has the
THE DATABASE REVOLUTION
26

tools and expertise to build and deploy applications on your existing databases. A new database brings with it new capabilities, but may limit the ability to re-use existing tools and designs, or it may not integrate well into operations and may require new skills from the staff. The basic relational database is still the preferred choice for most applications today.
Database preferences are changing, particularly for new applications that have high scalability requirements for data size or user concurrency. If you find yourself working with a system that has specific needs, let the workload be your primary guide.
When examining the workload, be sure to consider all the components. For example, if you run a consumer-facing web site on the database but also want to analyze data using machine-learning algorithms, you are dealing with two distinct workloads. One requires real-time read-write activity, and the other requires heavy read-intensive and computational activity. These are generally incompatible within the same database without careful design.
The general classes of database technology we labeled as OldSQL, NewSQL and NoSQL are designed for different workloads. We provide the diagrams in Figure 6 as a rough starting point for looking at these technologies. The diagram on the left is based on the read and write intensity of workloads. As workload intensity and scale increases, the performance of OldSQL declines to a point where NewSQL and NoSQL technologies adapted to specific workloads should be considered.
The diagram on the right roughly marks out technologies according to data complexity and workload mix. We emphasize that these illustrations are rough and that they do not include all possible dimensions, but they may be useful help.
Given the relative immaturity of many of the products, a proof of concept (PoC) based on the components of your workload is still the best way to determine whether a product will meet your needs.
THE DATABASE REVOLUTION
27
Figure 6: Rough Guidelines to Different Database Technologies

Data Flow ArchitectureFinally, we believe it worthwhile to draw
attention to the issue of data flow architecture, since it is often the key to a sensible choice of database.
We have been accustomed throughout the “data warehouse era” to build BI systems which were fed by a flow of data from transactional systems possibly through staging areas to a data warehouse. This in turn fed data marts of various types, which then might feed personal databases. While it was often the case that a single relational database would fulfill many of those roles, it was not always the case. The data flow could involve document stores and other specialist databases.
With the advent of Big Data, we are presented with a similar need for a data flow architecture. We roughly illustrate a possible Big Data flow in Figure 7. As the diagram suggests, we might use Hadoop or possibly some NoSQL or NewSQL database to continually gather an ever-growing volume of data. Such data can be characterized as low value – it is not highly cleansed or processed and may be composed of simple event stream data that requires processing to derive value.
We thus characterize the data store here as an ETL data store, whose primary purpose is to support data extracts and transformations intended to feed other data stores. A relatively high latency will usually be adequate for some of this activity. Other uses may require continuous ingest of event streams and real-time monitoring as the data is recorded.
Following this in the data flow, is an analytic data store. Most likely it will serve analytic and BI applications which require a better response time or higher level of concurrency than the ETL data store could provide. We view this data store as containing more valuable data that has been filtered or processed out of the entire collection at the lower layer.
Finally, higher value data extracted from the analytic data store flows to an in-memory data store which feeds applications that demand extremely low latency to satisfy business needs.
It may well be the case that the best solution for such a set of business needs is to use different database products for each role. We are suggesting that data flow architecture should be a primary consideration when selecting database products. Of course, real life situations may well be far more complex than this. If that is the case, then consideration of the data flow architecture becomes even more important.
THE DATABASE REVOLUTION
28
ETLData Store
AnalyticData Store
In Memory Data Store
Very LowLatency
(High Value Data)
LowLatency
(Medium Value Data)
HigherLatency
(Low Value Data)
In-MemoryData Store
AnalyticData Store
ETLData Store
Figure 7: A Simple Data Flow

Appendix – How to Select a DatabaseUnless you are starting with no database infrastructure, which is rare, the need to select a
database is likely to arise from one of two causes:1. A database that is currently deployed is no longer able to deal with the current
workload or the workloads it will need to handle in the future.2. A new area of application has arisen which demands a wholly new data store to serve
that application's specific requirements.The first of these situations is more complex because it is likely to involve greater
dependency on the data ecosystem that surrounds the new database. You may be constrained in what you can achieve by the current data flows to and from the existing database.
In the second situation, it is likely that you will have more leeway in the design and implementation of the data flows, allowing you to better match technology to workload. In what follows, for the sake of simplicity, we will assume the second of these scenarios.
We will also assume here that no existing database product used by your organization is suitable for the applications. There is usually an advantage in staying with an incumbent product, mostly because you will have skills in building, deploying and maintaining systems with such a product, and you may be able to arrange a less costly license with an incumbent vendor – although that isn’t guaranteed.
Note that what follows describes an “enterprise scale” database selection process. If the database selection is less important than that or doesn't establish a new standard for the organization then you might want to cut some of the activities we suggest here.
The Feasibility StageWith any IT project, it is wise to scope the project to determine, in a rough manner, what is
feasible. If something truly isn’t feasible, there’s no point in proceeding. The basic details that need to be gathered include:
1. What are the data management requirements and policies for this project?2. What kind of data will be stored and used, and what are the expected data volumes?3. What are the applications that will use the database?4. What are the expected service levels for the various workloads?5. What is the budget for this project and what does that cover?6. What is the outline project plan? (Timescales, delivery of benefits, when are costs
incurred?)7. Who will make up the project team? (Internal staff, external consultants, vendor
consultants?)8. What is the policy in respect of external support, possibly including vendor
consultancy, for the early stages of the project?9. What are the business benefits? (Which ones can be quantified financially? Which ones
can only be guessed at financially? Are there opportunity costs?)
THE DATABASE REVOLUTION
29

Feasibility studies should always be done for significant projects and should never become a long drawn-out phase of the project. Above all else, the goal of a feasibility study is to prevent a headlong rush into doing something foolish and expensive that has a low chance of success. That is its purpose. All projects that fail are expensive and waste considerable time.
Feasibility studies should involve the project sponsor(s) and the intended users (or if numerous, individuals who can speak for them). Aside from producing a rough outline of what is intended and how it can be achieved, they should involve a cost/benefit study and the establishment of realistic expectations. A feasibility study can usually be completed quickly, because it truly is about whether the project is feasible and, partly, whether it’s a good idea.
The Limits of a DatabaseIf we are selecting one of the newer types of database product it’s likely because there is
something unusual about what we require from the database. Otherwise we would stick with what we already have. In making this choice, context should determine which direction to go.
Here we itemize the dimensions of a database, with the intention that you can use these as criteria (if relevant) when determining a short-list and when selecting an appropriate product:
• High data volume: Large data volumes generate two problems. First there is the physical problem of distributing the data across the available resources so that access times are consistent. Second, there is the simple fact that if a query accesses a large percentage of the data, it will take time to process, even with excellent scale-out. The time taken will increase if there is a large amount of joining and sorting of data involved in the query, or if there is a high level of analytical processing.
• Concurrency: Satisfying a single user is relatively easy. As soon as you have more than one user, the problems escalate. The database must try to distribute its activity among all the data access requests that it is concurrently trying to satisfy, ideally ensuring that the appropriate priority is given to each. Data locking becomes an issue, even if there are only two users. If this is a read-only workload then locking is not a problem, but note that data ingest is data writing, so if data ingest is concurrent with other usage then locking can be an issue. The greater the number of concurrent data accesses the more difficult it will be for the database.
• Scalability and mixed workload: The more homogenous the workloads, the better a database will scale. Mixed workloads consisting of short queries, long queries, complex analytical queries and transactions will impose a scalability limit at some point. Of note is the balance or conflict between throughput and response time. Some application workloads require specific service levels which must be met. Other workloads are more forgiving of specific user latency, but require that throughput goals are met (e.g., the whole workload must be processed before the start of the normal working day, but individual latencies do not matter).
• Data model: The most effective data model to use depends a great deal upon the database product’s capabilities. In the past, “data warehouses” were not frequently normalized to third normal form. Instead, a star or a snowflake data model was implemented. In these models the majority of data resides in a large “fact table” with a few other tables linking to it. Some data, such as log file data can fit into one big table.
THE DATABASE REVOLUTION
30

With fundamentally hierarchical data (for example, documents), it usually makes more sense to store the hierarchy in a single data set since most queries against that data will be accessing ranges within that data set. It is important to understand that if the data model is inappropriate for the database product, there will inevitably be scaling problems. It is also important to understand that specific database products enforce or mitigate in favor of specific types of data model. A design compromise in this area can impact performance.
• Failover: The limit this imposes depends on the true availability requirement for the data. It used to be acceptable with transaction applications for the database to fail and for users to wait while data recovery took place. That could take minutes or longer when recovery was achieved by restoring a reliable backup and applying transaction logs. That recovery technique was superseded to a large degree by faster methods - for example, by having a “hot stand-by” available. In the realm of many servers, the probability that a server will fail increases in proportion to the number of servers. If very high availability is required, the database needs to have a strategy for continuous operation in the event of server failure. This inevitably involves replication of the data in some way and a database architecture that is aware, at more than one node, of all the data accesses that are currently in progress, so it can recover any that are impacted by a node failure.
• Overall data architecture: Every database is part of a data ecosystem with transactional and other data capture systems, ETL, data marts, data cleansing activity, data governance, data security and so on. This ecosystem can, of itself, impose a limit on the scalability of a database by failing to feed it data swiftly enough or failing to distribute the data it provides to users swiftly enough.
• Database entropy: No matter how good the database, in time data growth combined with changing and escalating workload demands can impose a limit on scalability. Entropy may set in faster with some products. It therefore helps to understand what new or changed workloads are likely to cause degradation of any database product. It also helps to know whether this can be addressed by a database rebuild – and whether taking time out for a rebuild is allowable, given the availability service level that the database applications demand.
• Cost: There is a limit to every IT budget. While it might be possible, with infinite dollars, to meet all user performance goals, infinite dollars do not exist. Cost factors are many and various. They include start-up costs, hardware and networking resources, software licenses, software support, database management, DBA time, design costs; and opportunity costs. They also include the incremental costs of scaling as the system grows in size or number of users.
• Implementation time: Finally, there is the time it takes to implement the solution fully. Some database products are faster to deploy than others and time to implementation may be a critical consideration.
Selecting Potential Database ProductsSelecting a new database product to fulfill a major role is a subproject of the larger
application project and should be treated as such. We suggest a logical flow of activities in Table 5, which can be adjusted or extended according to context. The activities are as follows:
THE DATABASE REVOLUTION
31

1. Corporate Standards and GuidelinesThe organization may have specific data governance policies which need to be understood
and adhered to. These may include:• Data security• Data cleansing• Data archiving and lifecycle• Technical preferences (for hardware, OS, use of cloud, etc.)• Product support
These naturally form part of the database selection. There may also be other policies the organization requires you to use for product selection (parameters such as preferred vendors or vendor size). These may eliminate some products from consideration.
2. BudgetClearly a budget can be stated simply as a figure, but there are complexities that need to be
sorted out. For example, does it cover the product purchase or also training and consultancy? Would it be better to have a perpetual license or subscription model that shifts cost from capital to operational budgets? When is the money available? What is the support budget? This can vary based on the context of the project. There is also the chance that the solution may involve more than one product.
3a. Workload Data Volume and Data StructureWe have already discussed workloads in depth in this report, so what we are suggesting in
sections 3a, 3b, 3c and 3d, are focus areas to investigate during product selection. The first of these is the actual data volume and data structure. The expected size of the database must be known. It should be possible to deduce this from the rate of data ingest, allowing for archiving or possible discarding of data. The full data lifecycle needs to be considered. It is necessary to understand the fundamental structure of the data in use to know whether it will fit well with the preferred database. If the data is complex or multi-structured then it may require a specialized database product.
3b. Applications and UsersA rough guideline for the overall workload can be gleaned from listing all the applications
and direct users of the database, and then classifying each of the applicable workloads. It is wise to plan for possible growth of the workload alongside growth of the data. Consider that data analysts may have better service than they previously had, permitting them to do more extensive work. This will increase the overall workload. Basing estimates on a static picture of use can underestimate the system resources required.
3c. Workloads and Service LevelsMost workloads have associated performance and availability service level agreements
(SLAs), although they may not be formally specified. Performance SLAs are usually specified in terms of both response time and throughput. Response times are more applicable to user-driven applications, while throughput requirements are the domain of batch processing and data ingest workloads. Both should be specified; otherwise, it's possible for a vendor to
THE DATABASE REVOLUTION
32
deliver a single-user database with excellent response time, but have severe problems with more than a handful of users. The SLA should be specified in terms of both response time and throughput for each query or transaction workload on the system. For example, specify that 90% of all transactions must provide a response time of less than 0.5 seconds and no transaction may be more than two seconds. Note that average response time and throughput can be a mine field. For example, an average transaction time of 0.6 seconds may contain transactions that take as long as ten seconds, and that may be unacceptable.
Availability is part of the service level, so database vendors should explain how they achieve the desired level of availability. Availability involves more than system failover, which implies the database is unavailable for a short period. Some products can remain partially available to a portion of the users when there is a failure. This is a novel concept for people working with traditional databases, where availability is considered an all-or-nothing proposition.
It is important not to forget about getting data into the system when the workload is primarily queries. A service level should be specified for data ingest, most commonly in terms of throughput such as rows loaded per minute or raw data volume per hour.
3d. The Overall Data ArchitectureIt may be that more than one database product is required for a system. This is often the
case with large scale transactional systems such as public-facing web applications. The data they produce is often analyzed, but query and analysis are largely incompatible with the primary workload. BI and analytic databases evolved for precisely this reason.
This comes under the heading of architecture, or to be precise, data flow architecture. An outline of the data flow architecture should be created prior to selecting products.
With complex applications it is possible that no single database can satisfy all the requirements. In this case the various options for the overall architecture must be considered.
For example, some workloads may require response times that can only be achieved by an in-memory key value store while other portions of the workload may be satisfied using a relational database. With multiple databases there are many more choices for the data flow architecture, and many more product options for the different workload components.
4. The Short-ListThere are a bewildering number of database products, over 200 at last count, and some
vendors have multiple products. You cannot examine them all in detail. To assist in creating a list of potential products you need some “drop dead conditions”– qualifying characteristics that will eliminate most choices. These can often be created from the data already gathered.
In practice, during database selections we have been involved in, we would create a short-list of products in a two-hour interactive session with the selection team. First we would define selection criteria and then consider a fairly long list of products, quickly reducing the list by applying agreed criteria. Often, selecting a short-list would require just a few criteria. Total cost of acquisition (TCA)/Total cost of ownership (TCO) was always one of these. Does it look like the database can do the job, technically? That was also always a factor, but rarely explored in depth. Adequate support was also an important factor for consideration.
THE DATABASE REVOLUTION
33

In Table 5, we provide a basic list of selection criteria that may be relevant. This is not intended to be definitive in any way. If you intend to use it, you may want to add or delete items or qualify each item to your own corporate context.
One point worth emphasizing is not to take too much notice of benchmarks as a guide to performance. Benchmarks can provide useful information on relative performance and cost, but they are run using unrealistic data on highly tuned software, usually running on relatively unrealistic hardware configurations. They may suggest performance capability but do not prove it on your workload.
Once you have a short-list, you embark on the next important step in the acquisition process: detailed product research.
5. Product ResearchThere is no need to contact any potential vendors directly until
you have decided on a short-list of products to investigate. You need to engage with the vendors in order to identify how suitable each candidate product is for your requirements.
The reason for postponing contact with vendors is that vendors have their established sales process. From the moment you engage with them, they will try to influence your decision. This is natural. However, it is important that you are not derailed from your product selection process. Our advice is that you create a detailed step-by-step plan for selection.
This plan will vary based upon your particular organization and the requirements, but should include most of the following:
Writing and issuing a formal request for proposal (RFP) for short-listed vendors. It should at minimum include the following:
• It should state the company’s intention to procure a database product and outline how the selection process will be conducted, including a rough timetable of events.
• It should include a statement of requirements of the intended product. This can often be taken from the feasibility study almost verbatim.
• It should state specific performance and availability requirements at a fairly detailed level so that the vendor is clear about this.
• It should indicate that it is a competitive situation.• It should request relevant customer reference contacts
(preferably several).
THE DATABASE REVOLUTION
34
Table 5: Criteria
Database Selection Criteria
General
Data governance policies
Hardware platform requirements
Vendor support offered
Performance
Data volumes
Concurrency
Scalability
Expected workloads
Data model
Failover capability
Ecosystem
Data architecture of which it will be a part
Database entropy
Time Factors
Implementation time (design)
Implementation time (data load)
Cost
Total cost of acquisition (TCA)
Total cost of ownership (TCO)

• If there is to be a PoC phase to the selection process, it should be stated definitively and with specific intent.
Note that this is “RFP lite.” It should take little time to prepare. It should be useful to the vendors that receive it so that they know what you want and need as accurately as you are able to describe it. If you want to carry out an extensive RFP, you can add a long list of technical questions for the vendor to answer. Our experience is that the larger vendors will have a “canned list” of answers and smaller vendors may be intimidated by the time it will take them to respond, if they suspect that they may not be chosen anyway.
The responses to the RFP should guide the further product research that needs to be done. In our view, the following further activities are worth pursuing.
• A proposal-specific product presentation by the vendor which explains how the vendor’s product would likely satisfy your requirements. This should include a technical explanation of how the product works and responds to the kind of workloads you expect it to handle.
• Study of white papers and product manuals in order to supplement information gleaned during the presentation.
• If possible, download a version of the product (if the vendor has a downloadable version) and have the technically aware people on the selection team gain some experience with it.
• Follow up on customer references by preparing a list of questions about the product. Make sure to ask questions about what the customer experience has been both positive and negative, both in using the product and in dealing with the vendor. Ascertain whether that particular database implementation is sufficiently similar to your intended use to offer any confidence in the product.
• Maintain a list of resolved and unresolved points for each vendor during this process.
6. Selecting a Favored ProductThere are a variety of ways to compare products. Our experience suggests that a table of
product dimensions together with a set of weighting factors is a useful and practical way to go. This need not be a long list. Note for example that “drop dead” requirements cannot be included on the list. If the vendor cannot meet some absolutely necessary criterion, the vendor should not be on the short-list. Having too many product dimensions may make the process confusing, so we have on occasion grouped several related dimensions together as a single major dimension and scored just that dimension.
The different dimensions are weighted according to which are most important. By scoring products accordingly and ending up with a simple score in key areas, you get a perspective of how each product is different. Usually everyone in the selection team goes through this scoring exercise and the results are aggregated. Sometimes this process may result in a revising of the weighting factors, because they give an answer that the whole selection team itself feels. The point is not to find a perfect weighting. The process helps everyone involved in product selection to see the competing products more clearly. In most situations products will have advantages and disadvantages. This process helps to make the choice clearer.
THE DATABASE REVOLUTION
35

7. NegotiationIt is best to conduct negotiations with more than one vendor, if only to get comparative
information about pricing and included services. The goal of negotiation is to arrive at an acceptable price over a known time period. Once the vendor has landed the business, they know very well that it will be difficult for a customer to reverse the decision. As soon as you start with a new product you have time and money invested and it takes a considerable amount of disillusion to change vendors.
You need to give your company the best possible chance of success, and an acceptable deal. This means ensuring that all supplier costs are known ahead of time and that, if there is any doubt about product capability at all, that the vendor contracts to deliver what has been promised. Depending on circumstance this may mean embarking upon a PoC exercise to determine whether the product “performs as advertised.”
8. Proof of Concept The goal of a PoC is to demonstrate that a product will be capable of managing the
workloads with the kind of data your company intends to store and process. The PoC is also a chance to gain hands-on experience with the database. This experience can easily shift purchase decisions. For example, one might discover that development and performance features are great but managing in production will be very difficult. Managing and diagnosing problems is one area that often goes untested.
Consequently, any PoC needs to target the most common tasks as well as the most difficult aspects of the workload. Since the vendor involved will likely need to assist in the exercise, the goal of the activity must be clearly stated in measurable terms so that it is clear whether the product was capable of doing the work.
The PoC should be designed to allow the work done to contribute to the final implementation. Therefore the PoC should mimic the intended live environment to some degree, so that both the data flow architecture and the performance of the database itself are properly tested. Too often, we see databases tested using a configuration or environment very different from what will be deployed in production.
It is also important to ensure that if the selected product fails there is an alternative product to try next as a fallback. In other words, the PoC needs to be a genuine test of capability with stated goals and known consequences if a product fails.
9. Product SelectionIn our view the selection team should write a short report on what was done to ensure that
the selected product met all the requirements. This report should include the outcome of evaluation and PoC testing, if applicable, and the recommended configurations.
How Projects Go Wrong and Why Database Selections Fail We have provided what we believe to be useful information for the database selection
process. Clearly much depends on circumstance, so we have not tried to provide a prescriptive process, just a set of guides. However, it may benefit the reader for us to provide our list of why database selections and projects that depend on database selection and implementation go wrong. This is our list of in order of importance:
THE DATABASE REVOLUTION
36

1. Biggest mistake: No feasibility study. This nearly always leads to bad outcomes. Even if the lightest of feasibility investigations is done, it is better than none. The feasibility study should stop the company from embarking on something that is currently impossible or could only be done if you had the assistance of Google’s best engineers.
2. Next biggest mistake: No organized selection process. An organized selection process should involve a statement of measurable goals, both at a technical and business level. The lack of such a statement means that the expectations of the business and the users have not been set. We can also include here the lack of an important corporate sponsor who cares about the project. Steering committees do not substitute for such a corporate sponsor. In general, steering committees don’t steer and are rarely helpful.
3. Third biggest mistake: No proof of concept. If you have any doubt at all about the capabilities of a database product, then you need technical proof of its capabilities. While conducting a PoC, the contract with the vendor is in abeyance. But with no PoC, you are committed contractually and emotionally, and it really is your fault if the product simply cannot do what it has been bought to do. Incidentally, we have been engaged on occasion for “cover your ass” (CYA) reasons – so that someone charged with product selection could declare that some “database expert” signed off on the database product selection. If we believed that a PoC was needed we would never sign off on the product selection without it.
4. Fourth biggest mistake: Premature project initiation. The urge to start developing stuff as soon as possible is often very strong with large projects. For example, we’ve seen developments begin while the PoC had only just started. In this case, more haste is always less speed. Two practical dynamics usually determine the outcome of an IT project: getting it right at the business level and getting it right technically. If you run off trying to achieve things before either of these is properly bolted down then the project can veer off course very easily.
5. Fifth biggest mistake: Letting the vendor dictate the selection process. This is often the consequence of the second biggest mistake described above. Unsurprisingly, the vendor that dictates the selection process is usually the one that gets selected. Database salespeople naturally attempt to do this, and so they should. Their job is to maximize their chance of success. It is the customer’s fault if it is allowed to happen.
THE DATABASE REVOLUTION
37

About Our Sponsors
DataStax offers products and services based on the popular open-source database, Apache Cassandra™ that solve today's most challenging big data problems. DataStax Enterprise (DSE) combines the performance of Cassandra with analytics powered by Apache Hadoop™ creating a smartly integrated, data-centric platform. With DSE, real-time and analytic workloads never conflict, giving you maximum performance with the added benefit of only managing a single database. The company has over 100 customers, including leaders such as Netflix, Cisco, Rackspace and Constant Contact, and spanning verticals including web, financial services, telecommunications, logistics and government. DataStax is backed by industry leading investors, including Lightspeed Venture Partners and Crosslink Capital and is based in San Mateo, Cailfornia. http://www.datastax.com.
Dataversity provides a centralized location for training, online webinars, certification, news and more for information technology (IT) professionals, executives and business managers worldwide. Members enjoy access to a deeper archive, leaders within the industry, a extensive knowledge base and discounts off many educational resources including webcasts and data management conferences.
Infobright's high-performance database is the preferred choice for applications and data marts that analyze large volumes of "machine-generated data" such as Web data, network logs, telecom records, stock tick data, and sensor data. Easy to implement and with unmatched data compression, operational simplicity and low cost, Infobright is being used by enterprises, SaaS and software companies in online businesses, telecommunications, financial services and other industries to provide rapid access to critical business data. For more information, please visit http://www.infobright.com or join our open source community at http://www.infobright.org.
MarkLogic leads the advancement of Big Data with the 9irst operational database technology for mission-‐critical Big Data Applications. Customers trust MarkLogic to drive revenue and growth through Big Data Applications enabled by MarkLogic products, services, and partners. MarkLogic is a fast growing enterprise software company and ushers in a new era of Big Data by powering more than 500 of the world’s most critical Big Data Applications in the public sector and Global 1000. Organizations around the world get to better decisions faster with MarkLogic. MarkLogic is headquartered in Silicon Valley with 9ield of9ices in Austin, Frankfurt, London, Tokyo, New York, and Washington D.C. For more information, please visit www.marklogic.com.
THE DATABASE REVOLUTION
38

RainStor provides Big Data management software. RainStor’s database enables the world’s largest companies to keep and access limitless amounts of data for as long as they want at the lowest cost. It features the highest level of compression on the market, together with high performance on-demand query and simplified management. RainStor runs natively on a variety of architectures and infrastructure including Hadoop. RainStor’s leading partners, include AdaptiveMobile, Amdocs, Dell, HP, Informatica, Qosmos, and Teradata. RainStor is a privately held company with offices in San Francisco, California, and Gloucester, UK. For more information, visit www.rainstor.com. Join the conversation at www.twitter.com/rainstor.
As market leader in enterprise application software, SAP helps companies of all sizes and industries run better. From back office to boardroom, warehouse to storefront, desktop to mobile device – SAP empowers people and organizations to work together more efficiently. Sybase® IQ with PlexQ™ technology is an analytics grid that extends the power of business analytics beyond a few users to the entire organization with greater ease and efficiency. For more information, please visit: http://www.sybase.com/iq.
Teradata is the world's largest company focused on integrated data warehousing, big data analytics, and business applications. Our powerful solutions portfolio and database are the foundation on which we’ve built our leadership position in business intelligence and are designed to address any business or technology need for companies of all sizes. Only Teradata gives you the ability to integrate your organization’s data, optimize your business processes, and accelerate new insights like never before. The power unleashed from your data brings confidence to your organization and inspires leaders to think boldly and act decisively for the best decisions possible. Learn more at teradata.com.
THE DATABASE REVOLUTION
39

Robin Bloor is co-founder and principal analyst The Bloor Group. He has more than 25 years of experience in the world of data and information management. He is the creator of the Information-Oriented Architecture which is to data what the SOA is to services. He is the author of several books including, “The Electronic B@zaar, From the Silk Road to the eRoad” a book on e-commerce and three IT books in the Dummies series on SOA, Service Management and The Cloud. He is an international speaker on information management topics. As an analyst for Bloor Research and The Bloor Group, Robin has written scores of white papers, research reports and columns on a wide range of topics from database evaluation to networking options and comparisons to the enterprise in transition.
Mark Madsen is president of Third Nature, a technology research and consulting firm focused on business intelligence, data integration and data management. Mark is an award-winning author, architect and CTO whose work has been featured in numerous industry publications. Over the past ten years Mark received awards for his work from the American Productivity & Quality Center, TDWI, and the Smithsonian Institute. He is an international speaker, a contributing editor at Intelligent Enterprise, and manages the open source channel at the Business Intelligence Network. For more information or to contact Mark, visit http://ThirdNature.net.
" " © Copyright 2012 Bloor Group & Third Nature. All Rights Reserved.
THE DATABASE REVOLUTION
40