DB - European Banks - NPL Monitor 23.11.17 copy
70
Deutsche Bank Markets Research Europe Banks Industry European Banks Date 23 November 2017 Industry Update NPL Monitor: 9M-17 edition Launching a European NPL database ________________________________________________________________________________________________________________ Deutsche Bank does and seeks to do business with companies covered in its research reports. Thus, investors should be aware that the firm may have a conflict of interest that could affect the objectivity of this report. Investors should consider this report as only a single factor in making their investment decision. DISCLOSURES AND ANALYST CERTIFICATIONS ARE LOCATED IN APPENDIX 1. MCI (P) 083/04/2017. Paola Sabbione Research Analyst (+39) 02 86379-704 [email protected] Ignacio Ulargui, CFA Research Analyst (+34) 91 335-5698 [email protected] Kinner Lakhani Research Analyst (+44) 20 754-14140 [email protected] David Lock Research Analyst (+44) 20 754-11521 [email protected] Kim Bergoe Research Analyst (+44) 0 207545-5252 [email protected] Benjamin Goy Research Analyst (+49) 69 910-31946 [email protected] Flora Benhakoun Research Analyst (+33) 1 4495-6617 flora-[email protected] Regulators and policy makers have made it clear that the NPL issue has to be addressed more aggressively. We believe the ECB will adopt a case-by-case approach, asking banks to deliver ambitious but realistic targets. This is why we are launching the "NPL monitor": monitoring NPL evolution in terms of NPL ratios, stock trends, and coverage allows understanding if a bank is progressing well or lagging behind. For 9M-17, key conclusions regard Italy: Italian banks reduced net NPL c.30% since 2015 and 13% YtD (excl. M&A); several banks updated NPL strategies, accelerating clean-up plans. We do not expect the ECB to ask for more, but to closely monitor delivery of these goals. A summary of the most recent regulatory events on the NPL front After its NPL guide in Mar-17, on 4-Oct-17, the ECB released an addendum on calendar provisioning for new NPLs and mentioned that a third document will be released by the end of Q1-18, focusing on NPL stock reduction. The EC “blocked” ECB intervention, highlighting that the regulator can only act case- by-case; at the same time, the EC proposed its “action plan” to tackle the NPL issue, which also includes calendar provisioning (applied only on new loans). A European overview of the NPL issue In 9M-17, across Europe, all countries have reduced NPLs on a YoY comparison (Figure 1, Figure 2). However, NPLs are still above 2008’s starting point everywhere except Germany (Figure 3): they are 3.5x higher in Spain, 3x in Italy and c.1.5x in other countries. In general, coverage levels range from 45% to 55% (Figure 4), with Italy at 51% and Spain at c.54% on average. Italy: Regulatory uncertainty, but good progress In Italy, banks have reduced net NPLs by c.30% on average since 2015 (excl. M&A): UCG and MPS’s NPL stocks declined the most, MPS and BBPM have accelerated the most in 2017. Despite this good progress, given high NPL ratios, we expect smaller Italian banks to remain volatile until clarity is provided by the ECB on NPL reduction timing. Details on NPL strategies here. Iberia: NPA reduction driven by NPLs In Iberia, banks have reduced net NPA by c.17% if we exclude the M&A transactions. The bulk of the reduction took place in NPLs, while the reduction in foreclosed assets has been more limited. YtD the banks that have reduced the most are Unicaja, BBVA and BCP. Definition and disclosure: Extensive NPL database in this note This note includes our database of banks’ gross and net NPLs, coverage, collateral, under-performing loans, gross and net customer loans. An Excel version is available (please write to [email protected]). We also present an analysis of the disclosure and classification method across all countries. We call NPLs the sum of all problematic loan categories (past due, UTP, bad loans), and NPA the sum of NPLs and foreclosed assets. Valuation and risk; Top picks: BNP, CABK, CASA, CS, ING, SAN and UCG We value banks using DDM or SoTP. On 2018 forecasts, our coverage universe trades at 11.2x P/E, 4.5% dividend yield and 1.06x P/TBV, for RoTE of 9.6% (page 62 for details). Upside risks: higher rates, better-than-expected credit growth and dilution of regulation. Downside risks: persistently low inflation, weak economic recovery / credit growth, higher LLPs and regulatory risk. Distributed on: 23/11/2017 05:00:00 GMT 0bed7b6cf11c
Transcript of DB - European Banks - NPL Monitor 23.11.17 copy
Deutsche Bank Markets Research
Europe Banks
Industry
European Banks
Date 23 November 2017
Industry Update
NPL Monitor: 9M-17 edition
Launching a European NPL database
________________________________________________________________________________________________________________ Deutsche Bank does and seeks to do business with companies covered in its research reports. Thus, investors should be aware that the firm may have a conflict of interest that could affect the objectivity of this report. Investors should consider this report as only a single factor in making their investment decision. DISCLOSURES AND ANALYST CERTIFICATIONS ARE LOCATED IN APPENDIX 1. MCI (P) 083/04/2017.
Paola Sabbione
Research Analyst
(+39) 02 86379-704 [email protected]
Ignacio Ulargui, CFA
Research Analyst (+34) 91 335-5698 [email protected]
Kinner Lakhani
Research Analyst (+44) 20 754-14140
David Lock
Research Analyst
(+44) 20 754-11521 [email protected]
Kim Bergoe
Research Analyst
(+44) 0 207545-5252 [email protected]
Benjamin Goy
Research Analyst (+49) 69 910-31946 [email protected]
Flora Benhakoun
Research Analyst (+33) 1 4495-6617
Regulators and policy makers have made it clear that the NPL issue has to be addressed more aggressively. We believe the ECB will adopt a case-by-case approach, asking banks to deliver ambitious but realistic targets. This is why we are launching the "NPL monitor": monitoring NPL evolution in terms of NPL ratios, stock trends, and coverage allows understanding if a bank is progressing well or lagging behind. For 9M-17, key conclusions regard Italy: Italian banks reduced net NPL c.30% since 2015 and 13% YtD (excl. M&A); several banks updated NPL strategies, accelerating clean-up plans. We do not expect the ECB to ask for more, but to closely monitor delivery of these goals.
A summary of the most recent regulatory events on the NPL front After its NPL guide in Mar-17, on 4-Oct-17, the ECB released an addendum on calendar provisioning for new NPLs and mentioned that a third document will be released by the end of Q1-18, focusing on NPL stock reduction. The EC “blocked” ECB intervention, highlighting that the regulator can only act case-by-case; at the same time, the EC proposed its “action plan” to tackle the NPL issue, which also includes calendar provisioning (applied only on new loans).
A European overview of the NPL issue In 9M-17, across Europe, all countries have reduced NPLs on a YoY comparison (Figure 1, Figure 2). However, NPLs are still above 2008’s starting point everywhere except Germany (Figure 3): they are 3.5x higher in Spain, 3x in Italy and c.1.5x in other countries. In general, coverage levels range from 45% to 55% (Figure 4), with Italy at 51% and Spain at c.54% on average.
Italy: Regulatory uncertainty, but good progress In Italy, banks have reduced net NPLs by c.30% on average since 2015 (excl. M&A): UCG and MPS’s NPL stocks declined the most, MPS and BBPM have accelerated the most in 2017. Despite this good progress, given high NPL ratios, we expect smaller Italian banks to remain volatile until clarity is provided by the ECB on NPL reduction timing. Details on NPL strategies here.
Iberia: NPA reduction driven by NPLs In Iberia, banks have reduced net NPA by c.17% if we exclude the M&A transactions. The bulk of the reduction took place in NPLs, while the reduction in foreclosed assets has been more limited. YtD the banks that have reduced the most are Unicaja, BBVA and BCP.
Definition and disclosure: Extensive NPL database in this note This note includes our database of banks’ gross and net NPLs, coverage, collateral, under-performing loans, gross and net customer loans. An Excel version is available (please write to [email protected]). We also present an analysis of the disclosure and classification method across all countries. We call NPLs the sum of all problematic loan categories (past due, UTP, bad loans), and NPA the sum of NPLs and foreclosed assets.
Valuation and risk; Top picks: BNP, CABK, CASA, CS, ING, SAN and UCG We value banks using DDM or SoTP. On 2018 forecasts, our coverage universe trades at 11.2x P/E, 4.5% dividend yield and 1.06x P/TBV, for RoTE of 9.6% (page 62 for details). Upside risks: higher rates, better-than-expected credit growth and dilution of regulation. Downside risks: persistently low inflation, weak economic recovery / credit growth, higher LLPs and regulatory risk.
Distributed on: 23/11/2017 05:00:00 GMT
0bed7b6cf11c

23 November 2017
Banks
European Banks
Page 2 Deutsche Bank AG/London
Table Of Contents
Key points ............................................................................ 3 Monitoring NPL strategies .................................................................................. 3
Definitions ........................................................................... 6 NPL definition in this report ................................................................................ 6
Regulation update ............................................................... 7 The EC and ECB have separately started to enact the indications of the ECOFIN Council (Jul-17) on NPLs .................................................................................... 7
Country sections .................................................................. 9 How to read Country sections? .......................................................................... 9 Italy ................................................................................................................... 10 Iberia ................................................................................................................. 12 Ireland ............................................................................................................... 15 Nordics ............................................................................................................. 16 Switzerland ....................................................................................................... 18 United Kingdom ................................................................................................ 19 France ............................................................................................................... 21 Benelux ............................................................................................................. 22 Germany ........................................................................................................... 23 Austria .............................................................................................................. 24
Disclosure by country ........................................................ 25
NPL database .................................................................... 47 NPLs by bank – banks’ disclosure .................................................................... 47
Appendix A ........................................................................ 63
Appendix B ........................................................................ 64 NPL ratio by country from EBA disclosure ....................................................... 64

23 November 2017
Banks
European Banks
Deutsche Bank AG/London Page 3
Key points
Monitoring NPL strategies
� In 9M-17, across Europe, all countries have reduced NPLs on a YoY comparison (Figure 1 and Figure 2). We note Spain and Ireland have accelerated in 9M-17 vs 2016 (without considering M&A for Santander and Caixa); in Italy, the apparent slowdown is due to the UCG’s large NPL disposal in Dec-16.
Figure 1: 9M-17 YoY change - net NPLs by country (*) Figure 2: 9M-17 YoY change - gross NPLs by country (*)
-40%
-30%
-20%
-10%
0%
10%
20%
2016 9M-17
-30%
-25%
-20%
-15%
-10%
-5%
0%
5%
10%
2016 9M-17 Source: Deutsche Bank estimates (average per country of the banks under coverage), company data. (*) H1-17 data for BNP, Barclays, HSBC, Standard Chartered, AIB, BOI and PTSB. NPA for Iberia. Source: Deutsche Bank estimates (average per country of the banks under coverage), company data.
(*) H1-17 data for BNP, Barclays, HSBC, Standard Chartered, AIB, BOI and PTSB. NPA for Iberia.
� However, NPLs are still above 2008’s starting point (Figure 3), in all countries excluding Germany: they are 3.5x higher in Spain, 3x in Italy and c.1.5x in other countries.
Figure 3: Gross NPLs evolution by country (2008 based) (*)
0.0
0.5
1.0
1.5
2.0
2.5
3.0
3.5
4.0
4.5
2008 2009 2010 2011 2012 2013 2014 2015 2016 9M-17
Italian Banks Spanish banks Irish banks Nordics banks UK banks
French banks Benelux banks German banks Austrian banks
Source: Deutsche Bank estimates (average per country of banks under coverage), company data. (*) For Iberia, we consider NPA (i.e. NPL + foreclosed assets). H1-17 data for BNP, Barclays, HSBC, Standard Chartered, Allied Irish Banks, Bank of Ireland and PTSB

23 November 2017
Banks
European Banks
Page 4 Deutsche Bank AG/London
� Figure 4 shows the size of the NPL problem in absolute and relative terms (vs gross loans) across countries. Coverage ranges from 45% to 55% in most countries, with Italy at 51% and Spain at 54% on average.
Figure 4: NPL ratio versus coverage (*)
Source: Deutsche Bank, company data – Important: average per country is the average of the banks under Deutsche Bank coverage. Exchange rates as of 21-Nov-2017. (*) For Iberia, we consider NPA (i.e. NPL + foreclosed assets). H1-17 data for BNP, Barclays, HSBC, Standard Chartered, Allied Irish Banks, Bank of Ireland and PTSB.
� Figure 5 summarizes the NPL trends in 9M-17 for all the banks under coverage, both looking at net and gross NPLs. Key conclusions are:
� In Italy, banks have reduced net NPLs by 29% on average since the end of 2015 and 12% YtD (or 30% / 13% respectively if we exclude UBI’s 3GB acquisition): UCG and MPS’s NPL stocks have declined the most. MPS and BBPM have accelerated the most net NPL reduction in 2017 YtD. In Q3 all banks reduced gross and net NPL QoQ and generally coverage has also gone up (again excluding UBI, due to M&A).
� In Iberia, banks have reduced net NPA c.17% if we exclude the M&A transactions (Santander and CaixaBank’s). The bulk of the reduction took place in NPLs while the reduction in foreclosed assets has been more limited. YtD the banks that have reduced the most are Unicaja, BBVA and BCP.
� In France, trends are less homogenous than in the periphery, with CASA showing some NPL expansion, and BNPP and SocGen showing a gradual decline.
� As far as other countries are concerned, there are only two key observations: 1) In the UK, banks have significantly reduced NPL and strengthened coverage since the end of 2015 and also YtD, 2) Ireland has the highest reduction since the end of 2015 among the banks in our sample; moreover, given in Ireland the NPL peak was in 2012 (see also Figure 3), calculating the drop since 2012 would lead to a figure of more than 60%.

23 November 2017
Banks
European Banks
Deutsche Bank AG/London Page 5
Figure 5: European banks – 9M-17 NPL heat maps
Gross NPLs Net NPLs% Since FY-15 YoY YtD QoQ % Since FY-15 YoY YtD QoQItaly ItalyUnicredit -34% -31% -9% -3% Unicredit -42% -38% -11% -4%Intesa -15% -10% -8% -2% Intesa -18% -13% -9% -3%Banco BPM -13% -14% -12% -1% Banco BPM -21% -18% -14% -2%MPS -4% -1% -2% -1% MPS -37% -33% -25% -3%UBI (*) 4% 6% 12% 16% UBI (*) -13% 1% 5% 9%Credem -2% -7% -1% 0% Credem -1% -6% -3% -1%Iberia IberiaSantander (**) -18% -14% -12% -23% Santander (**) -13% -13% -8% -20%BBVA -20% -15% -13% -8% BBVA -18% -18% -18% -9%Bankia -21% -10% -11% -3% Bankia -14% -3% -13% 7%Bankinter 2% -10% -7% -2% Bankinter -8% -8% -6% -2%CaixaBank (***) -13% -7% -1% -3% CaixaBank (***) -7% -4% -2% -2%Sabadell -22% -12% -9% -3% Sabadell -27% -19% -15% -9%Unicaja Banco -21% n.a. -14% -7% Unicaja Banco -17% n.a. -15% -7%BCP -24% -20% -14% -8% BCP -34% -25% -16% -8%Ireland IrelandAllied Irish Banks (H1-17) -32% n.a. -14% n.a. Allied Irish Banks (H1-17) -28% n.a. -15% n.a.BoI (H1-17) -23% -8% -14% n.a. BoI (H1-17) 4% 27% -12% n.a.Permanent tsb (H1-17) -5% -7% -1% n.a. Permanent tsb (H1-17) -3% -8% -2% n.a.Nordics NordicsNordea -2% 2% 5% -2% Nordea 6% 6% 9% -3%Handels -15% -3% -3% 3% Handels -25% -9% -2% 3%Swed 43% 52% 7% 5% Swed 60% 60% 7% 5%SEB -4% 2% -3% -8% SEB -24% 9% -16% -32%DNB 25% -23% -22% -14% DNB 19% -42% -37% -25%Danske -30% -18% -14% -2% Danske -27% -15% -14% 0%Switzerland SwitzerlandUBS -22% -10% -1% 2% UBS -37% -19% -10% 9%CS 11% -5% -11% -2% CS 15% -11% -17% -4%UK UKLloyds -14% -11% -3% -1% Lloyds -16% -12% -8% -6%Aldermore (H1-17) n.a. n.a. -1% n.a. Aldermore (H1-17) n.a. n.a. 7% n.a.Barclays (H1-17) -15% -7% 4% n.a. Barclays (H1-17) -19% -13% 7% n.a.RBS -26% -29% -13% -3% RBS -9% -21% -18% -11%HSBC (H1-17) -32% -27% -12% n.a. HSBC (H1-17) -40% -34% -18% n.a.Stan (H1-17) -22% -23% 2% n.a. Stan (H1-17) -41% -41% 1% n.a.France FranceBNP (H1-17) -8% -8% -9% n.a. BNP (H1-17) -9% -7% -6% n.a.SocGen -13% -10% -10% -3% SocGen -7% -9% -6% -3%CASA -11% -10% -15% -11% CASA -34% -15% -40% -35%Natixis (H1-17) n.a. n.a. -11% n.a. Natixis (H1-17) n.a. n.a. -15% n.a.Benelux BeneluxKBC -18% -9% -5% -4% KBC -22% -12% -7% -5%ABN AMRO 13% -16% -12% -7% ABN AMRO 67% -11% -6% -7%ING -17% -6% -7% -3% ING -19% -3% -7% -2%Germany GermanyCBK -8% -12% -5% 1% CBK -9% -17% -7% 1%Aareal -7% -8% -7% -6% Aareal -13% -12% -11% -8%PBB -60% -23% -19% -2% PBB -56% -26% -25% -4%Austria AustriaErste -34% -15% -7% -5% Erste -43% -39% -9% -8%RBI -35% -24% -16% -8% RBI -30% -17% 5% -5%
Source: Deutsche Bank, company data. (*) For UBI: net of M&A contribution trends would have been downward. (**) For Santander: Excluding Popular in YtD, YoY and since 2015 trends. (***) For CaixaBank: data includes Banco BPI in Portugal.

23 November 2017
Banks
European Banks
Page 6 Deutsche Bank AG/London
Definitions
NPL definition in this report
We define NPL as the sum of all problematic loan categories i.e. past due by >90 days, unlikely to pay (UTP) and bad loans (defaulted). Note that the EBA papers use the acronym “NPE” (non-performing exposures) whereas we use “NPL” (non-performing loans), but both refer to the same concept.
� Forborne exposures (or restructured loans) represent a sub-set of NPLs; after 12m of payments, they can be moved to performing status, but still keep the forborne tag for another 12m.
� Performing forborne and 30/90 days past due loans are indicators of the IFRS 9 “stage 2” or under-performing loans: For this reason, we report their amount per bank in each country’s section.
NPA = NPL + foreclosed assets We define NPA as the sum of NPLs (as defined above) and foreclosed assets.
The EBA definition The definition of NPL was established by the European Banking Authority (EBA) in the Implementing Technical Standard (ITS) on Supervisory Reporting on forbearance and non-performing exposures under article 99(4) of Regulation (EU) 575/20131, which was adopted by the Commission as an amendment to its Implementing Regulation (EU) No. 680/2014.
� According to this definition, NPL is every exposure that is 90 days past due or unlikely to be paid without collateral realization, even if it is not recognized as defaulted or impaired.
� In addition, any exposure to a debtor has to be considered non-performing when its on-balance sheet 90 days past-due reaches 20% of the outstanding amount of total on-balance sheet exposure to that debtor (‘pulling effect’). This will change by 31 December 2020 (so starting from Q1-21), when the EBA September 2016 amendment2 comes into force.
� The new text suggests stricter parameters to calculate the pulling effect: a) absolute – Euro 100 in a retail loan are past due by more than 90 days (180 days for residential mortgages, SME and commercial RE) or Euro 500 in a corporate loan are past due by more than 90 days (180 days for PA); b) relative – 1% / 2.5% of the loan is past due by more than 90 days (or 180 days in the examples above). If both a) and b) are breached all the exposure is moved to NPL.
� NPLs that are forborne only exit this classification if the debtor has proven its ability to meet the restructured conditions for one year.
1 EBA final draft (revised as of Jul-2014): Definition of NPL and 20% pulling effect https://www.eba.europa.eu/documents/10180/449824/EBA-ITS-2013-03+Final+draft+ITS+on+Forbearance+and+Non-performing+exposures.pdf/a55b9933-be43-4cae-b872-9184c90135b9 2 https://www.eba.europa.eu/documents/10180/1597002/Final+draft+RTS+on+the+materiality+threshold+for+credit+obligations+%28EBA-RTS-2016-06%29.pdf/fe1db887-c6dc-4777-89c1-4f243584cafd
23 November 2017
Banks
European Banks
Deutsche Bank AG/London Page 7
Regulation update
The EC and ECB have separately started to enact the indications of the ECOFIN Council (Jul-17)3 on NPLs
Measures on new NPLs: Where the proposals stand � 4-Oct-17, ECB publishes the NPL guidance addendum: Rules will be
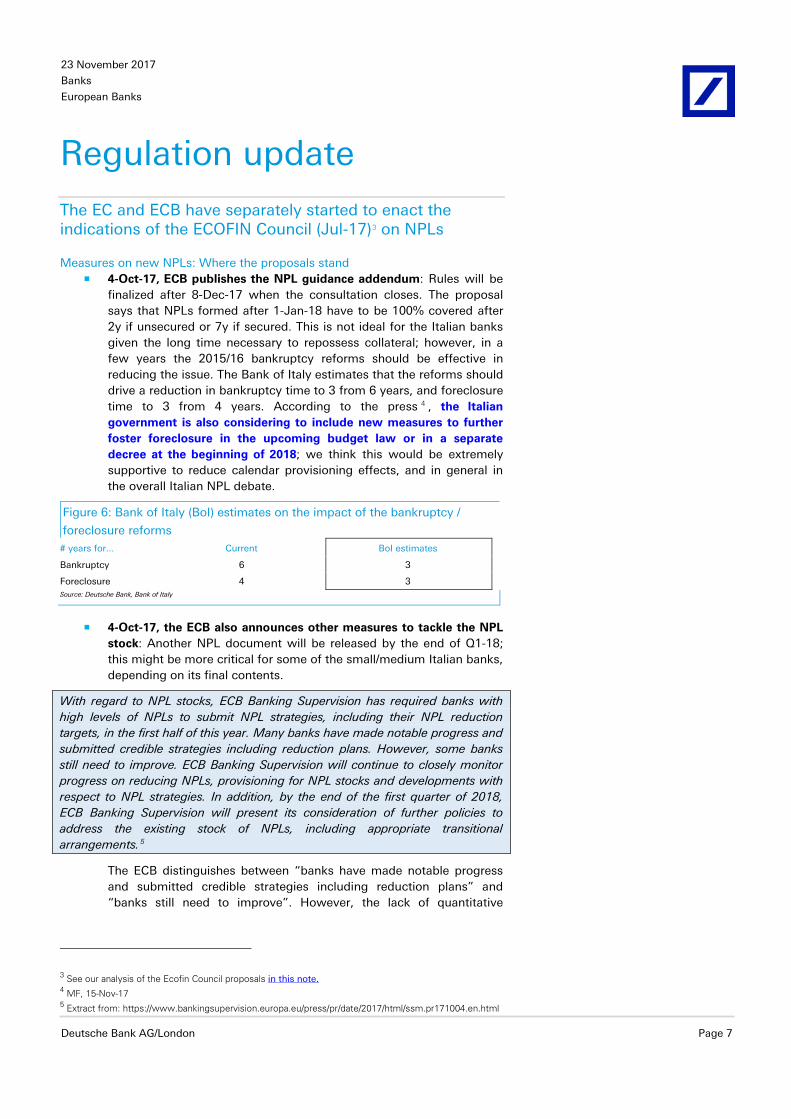
finalized after 8-Dec-17 when the consultation closes. The proposal says that NPLs formed after 1-Jan-18 have to be 100% covered after 2y if unsecured or 7y if secured. This is not ideal for the Italian banks given the long time necessary to repossess collateral; however, in a few years the 2015/16 bankruptcy reforms should be effective in reducing the issue. The Bank of Italy estimates that the reforms should drive a reduction in bankruptcy time to 3 from 6 years, and foreclosure time to 3 from 4 years. According to the press 4 , the Italian government is also considering to include new measures to further foster foreclosure in the upcoming budget law or in a separate decree at the beginning of 2018; we think this would be extremely supportive to reduce calendar provisioning effects, and in general in the overall Italian NPL debate.
Figure 6: Bank of Italy (BoI) estimates on the impact of the bankruptcy /
foreclosure reforms # years for... Current BoI estimates
Bankruptcy 6 3
Foreclosure 4 3 Source: Deutsche Bank, Bank of Italy
� 4-Oct-17, the ECB also announces other measures to tackle the NPL stock: Another NPL document will be released by the end of Q1-18; this might be more critical for some of the small/medium Italian banks, depending on its final contents.
With regard to NPL stocks, ECB Banking Supervision has required banks with high levels of NPLs to submit NPL strategies, including their NPL reduction targets, in the first half of this year. Many banks have made notable progress and submitted credible strategies including reduction plans. However, some banks still need to improve. ECB Banking Supervision will continue to closely monitor progress on reducing NPLs, provisioning for NPL stocks and developments with respect to NPL strategies. In addition, by the end of the first quarter of 2018, ECB Banking Supervision will present its consideration of further policies to address the existing stock of NPLs, including appropriate transitional arrangements.5
The ECB distinguishes between “banks have made notable progress and submitted credible strategies including reduction plans” and “banks still need to improve”. However, the lack of quantitative
3 See our analysis of the Ecofin Council proposals in this note. 4 MF, 15-Nov-17 5 Extract from: https://www.bankingsupervision.europa.eu/press/pr/date/2017/html/ssm.pr171004.en.html

23 November 2017
Banks
European Banks
Page 8 Deutsche Bank AG/London
parameters to define “good progress” for now exposes high-NPL banks to some regulatory uncertainty.
In several conferences and interviews at the beginning of November, Mrs Nouy has only clarified: 1) there will be a case-by-case approach in defining NPL strategies (JST are discussing with each banks, providing feedbacks on their plans in this weeks); 2) banks like UCG and ISP (explicitly named in an interview6) are already fine.
� 11-Oct-17, the EC sends out a comprehensive document, including measures on NPLs to be adopted by spring 2018. These measure are 1) the definition of an asset management company to deal with the NPL issue, 2) new tools to accelerate repossession time for NPLs, 3) amendment of the CRR (capital requirement regulation) with regard to the minimum level of provisions from “future NPLs arising from newly originated loans” – different from the ECB wording of “new NPLs”. This would be a Pillar 1 backstop, i.e. if banks’ provisions are not enough, they have to add another deduction directly from CET1 capital.
� 10-Nov-17, the EC launched a separate consultation on calendar provisioning (ending on 30-Nov-17), as a follow up of the document in the bullet above. The paper suggests calendar provisioning will apply on new loans (granted after the law enters into force), and requires a 100% coverage on unsecured loans after 2y of vintage, and on secured loans after 6-8y of vintage. Overall for the sector, the EC version of the calendar provisioning is more favorable than the ECB version, as postpone its effects.
� In general the EC thinks that the ECB can only act on a case by case base, when a bank needs to accelerate the NPL clean-up. Between the end of October and the beginning of November, the EC has expressed this view in several occasions, and has also provided an official legal opinion on this, confirming its position.
� According to SNL 7 , also the EBA will publish an NPL paper in January. The paper should include measures to support the secondary NPL market. This is positive for banks with still high NPL ratios. Among the measures, the report will add “the standardization of data on NPLs that banks put up for sale, including comprehensive descriptions of collateral and a full history of communication with the borrower, as well as the establishment of electronic selling platforms where pricing can be seen by all participants.”
6 MF, 8-Nov-17 7 21-Nov-17

23 November 2017
Banks
European Banks
Deutsche Bank AG/London Page 9
Country sections
How to read Country sections?
In each country section readers find: � First table: Last available key data on NPLs (or NPA where present) for
all the banks we cover in each country: gross and net stock, provisions and coverage, gross and net NPL ratios.
� First set of charts: Stock evolution (gross, net and coverage). For a more granular overview of each bank’s NPL stock evolution (in table form), please refer to the NPL database at the end of this report.
� Second set of charts: Gross and net NPL growth rate, since 2015, YoY, YtD, and QoQ.
� Second table: Adding to the net NPL stock, also net under-performing loans (i.e. past due 30/90 days and performing forborne) – which can be a proxy of IFRS 9 stage 2.
Readers interested in an excel format of our database, can request it writing an email to [email protected].
23 November 2017
Banks
European Banks
Page 10 Deutsche Bank AG/London
Italy
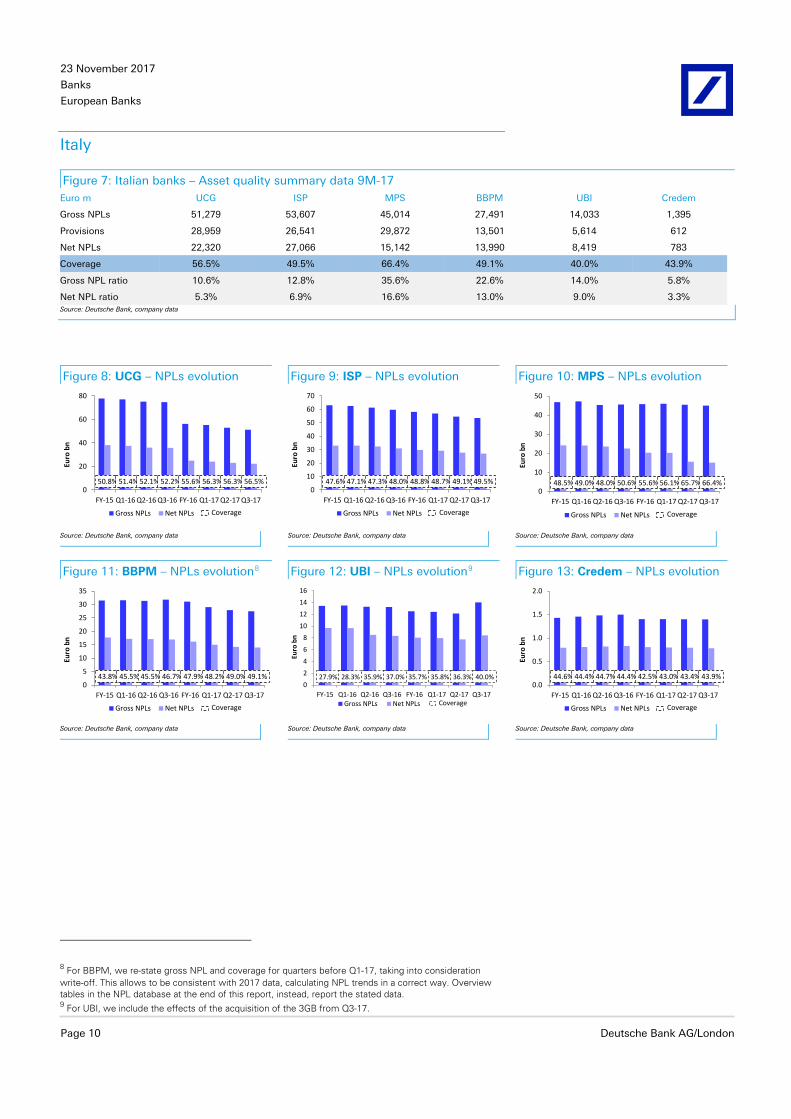
Figure 7: Italian banks – Asset quality summary data 9M-17 Euro m UCG ISP MPS BBPM UBI Credem
Gross NPLs 51,279 53,607 45,014 27,491 14,033 1,395
Provisions 28,959 26,541 29,872 13,501 5,614 612
Net NPLs 22,320 27,066 15,142 13,990 8,419 783
Coverage 56.5% 49.5% 66.4% 49.1% 40.0% 43.9%
Gross NPL ratio 10.6% 12.8% 35.6% 22.6% 14.0% 5.8%
Net NPL ratio 5.3% 6.9% 16.6% 13.0% 9.0% 3.3% Source: Deutsche Bank, company data
Figure 8: UCG – NPLs evolution Figure 9: ISP – NPLs evolution Figure 10: MPS – NPLs evolution
50.8% 51.4% 52.1% 52.2% 55.6% 56.3% 56.3% 56.5%0
20
40
60
80
FY-15 Q1-16 Q2-16 Q3-16 FY-16 Q1-17 Q2-17 Q3-17
Euro
bn
Gross NPLs Net NPLs Coverage
47.6% 47.1% 47.3% 48.0% 48.8% 48.7% 49.1% 49.5%0
10
20
30
40
50
60
70
FY-15 Q1-16 Q2-16 Q3-16 FY-16 Q1-17 Q2-17 Q3-17
Euro
bn
Gross NPLs Net NPLs Coverage
48.5% 49.0% 48.0% 50.6% 55.6% 56.1% 65.7% 66.4%0
10
20
30
40
50
FY-15 Q1-16 Q2-16 Q3-16 FY-16 Q1-17 Q2-17 Q3-17
Euro
bn
Gross NPLs Net NPLs Coverage
Source: Deutsche Bank, company data Source: Deutsche Bank, company data Source: Deutsche Bank, company data
Figure 11: BBPM – NPLs evolution8 Figure 12: UBI – NPLs evolution9 Figure 13: Credem – NPLs evolution
43.8% 45.5% 45.5% 46.7% 47.9% 48.2% 49.0% 49.1%0
5
10
15
20
25
30
35
FY-15 Q1-16 Q2-16 Q3-16 FY-16 Q1-17 Q2-17 Q3-17
Euro
bn
Gross NPLs Net NPLs Coverage
27.9% 28.3% 35.9% 37.0% 35.7% 35.8% 36.3% 40.0%0
2
4
6
8
10
12
14
16
FY-15 Q1-16 Q2-16 Q3-16 FY-16 Q1-17 Q2-17 Q3-17
Euro
bn
Gross NPLs Net NPLs Coverage
44.6% 44.4% 44.7% 44.4% 42.5% 43.0% 43.4% 43.9%0.0
0.5
1.0
1.5
2.0
FY-15 Q1-16 Q2-16 Q3-16 FY-16 Q1-17 Q2-17 Q3-17
Euro
bn
Gross NPLs Net NPLs Coverage
Source: Deutsche Bank, company data Source: Deutsche Bank, company data Source: Deutsche Bank, company data
8 For BBPM, we re-state gross NPL and coverage for quarters before Q1-17, taking into consideration write-off. This allows to be consistent with 2017 data, calculating NPL trends in a correct way. Overview tables in the NPL database at the end of this report, instead, report the stated data. 9 For UBI, we include the effects of the acquisition of the 3GB from Q3-17.

23 November 2017
Banks
European Banks
Deutsche Bank AG/London Page 11
Figure 14: UCG – NPL Q3 trends Figure 15: ISP – NPL Q3 trends Figure 16: MPS – NPL Q3 trends
-50%-40%-30%-20%-10%0%
Since FY-15
YoY
YtD
QoQ
Gross Net
-20%-15%-10%-5%0%
Since FY-15
YoY
YtD
QoQ
Gross Net
-40%-30%-20%-10%0%
Since FY-15
YoY
YtD
QoQ
Gross Net
Source: Deutsche Bank, company data Source: Deutsche Bank, company data Source: Deutsche Bank, company data
Figure 17: BBPM – NPL Q3 trends Figure 18: UBI – NPL Q3 trends10 Figure 19: Credem – NPL Q3 trends
-25%-20%-15%-10%-5%0%
Since FY-15
YoY
YtD
QoQ
Gross Net
-15%-10%-5%0%5%10%15%20%
Since FY-15
YoY
YtD
QoQ
Gross Net
-8%-6%-4%-2%0%
Since FY-15
YoY
YtD
QoQ
Gross Net
Source: Deutsche Bank, company data Source: Deutsche Bank, company data Source: Deutsche Bank, company data
Figure 20: Italian banks – Asset quality and focus on forborne / past due performing 9M-17
Euro m Net NPLs Net forborne + 30/90 past due (2016)
Net forborne + 30/90 past due / loans
Net NPL increase adding 30/90 PS +F
Net NPL ratio New net NPL ratio
Unicredit (*) 22,320 10,593 2.5% 47.5% 5.3% 7.8%
Intesa 27,066 14,846 3.8% 54.9% 6.9% 10.7%
MPS 15,142 4,887 5.4% 32.3% 16.6% 22.0%
Banco BPM 13,990 5,781 5.4% 41.3% 13.0% 18.3%
UBI Banca 8,419 6,413 6.8% 76.2% 9.0% 15.8%
Credem 783 796 3.4% 101.7% 3.3% 6.7%
Average 4.5% 59.0% 9.0% 13.6% Source: Deutsche Bank estimates, company data. (*) Net forborne and past due as of H1-17.
10 For UBI: Net of M&A contribution trends would have been downward.

23 November 2017
Banks
European Banks
Page 12 Deutsche Bank AG/London
Iberia
For Iberia, NPA = NPLs + foreclosed assets
Figure 21: Iberian banks – Asset quality summary data 9M-17 Euro m Santander BBVA Bankia Bankinter Sabadell CaixaBank Unicaja BCP
Gross NPLs 51,257 20,932 10,194 2,151 8,346 15,286 2,833 4,729
Provisions 33,830 15,042 5,480 1,031 4,192 7,630 1,417 2,223
Net NPLs s 17,427 5,890 4,714 1,120 4,154 7,656 1,416 2,506
Coverage 66.0% 71.9% 53.8% 47.9% 50.2% 49.9% 50.0% 47.0%
Gross NPL ratio 6.0% 5.0% 9.4% 4.0% 5.6% 6.8% 9.0% 9.3%
Net NPL ratio 2.1% 1.5% 4.6% 2.1% 3.0% 3.5% 4.7% 5.2%
Gross NPA 60,937 32,869 13,343 2,622 17,109 29,882 4,964 8,079
Provisions on NPA 38,930 22,460 6,547 1,241 8,938 16,103 2,766 3,363
Net NPA 22,007 10,409 6,796 1,381 8,171 13,779 2,198 4,716
NPA coverage 63.9% 68.3% 49.1% 47.3% 52.2% 53.9% 55.7% 41.6%
Gross NPA ratio 7.1% 7.9% 12.3% 4.9% 11.5% 13.3% 15.8% 15.9%
Net NPA ratio 2.7% 2.6% 6.6% 2.6% 6.0% 6.3% 7.3% 9.8% Source: Deutsche Bank, company data
Figure 22: Santan. – NPA evolution11 Figure 23: BBVA – NPA evolution Figure 24: Bankia – NPA evolution
69.3% 69.5% 67.9% 67.8% 68.6% 69.6% 65.0% 63.9%0
10
20
30
40
50
60
70
80
FY-15 Q1-16 Q2-16 Q3-16 FY-16 Q1-17 Q2-17 Q3-17
Euro
bn
Gross NPA Net NPA Coverage
69.1% 67.7% 68.0% 67.1% 66.4% 67.7% 67.8% 68.3%05
1015202530354045
FY-15 Q1-16 Q2-16 Q3-16 FY-16 Q1-17 Q2-17 Q3-17
Euro
bn
Gross NPA Net NPA Coverage
53.2% 53.5% 53.1% 53.0% 47.7% 49.2% 54.1% 49.1%02468
1012141618
FY-15 Q1-16 Q2-16 Q3-16 FY-16 Q1-17 Q2-17 Q3-17
Euro
bn
Gross NPA Net NPA Coverage
Source: Deutsche Bank, company data Source: Deutsche Bank, company data Source: Deutsche Bank, company data
Figure 25: Bankinter – NPA evolution Figure 26: Sabadell – NPA evolution Figure 27: Caixa – NPA evolution12
41.6% 41.6% 48.8% 48.2% 47.9% 48.4% 47.3% 47.3%0.0
0.5
1.0
1.5
2.0
2.5
3.0
3.5
FY-15 Q1-16 Q2-16 Q3-16 FY-16 Q1-17 Q2-17 Q3-17
Euro
bn
Gross NPA Net NPA Coverage
49.0% 48.8% 49.0% 48.3% 49.1% 50.1% 48.8% 52.2%0
5
10
15
20
25
FY-15 Q1-16 Q2-16 Q3-16 FY-16 Q1-17 Q2-17 Q3-17
Euro
bn
Gross NPA Net NPA Coverage
56.6% 56.3% 55.3% 55.3% 53.3% 56.8% 54.0% 53.9%0
5
10
15
20
25
30
35
40
FY-15 Q1-16 Q2-16 Q3-16 FY-16 Q1-17 Q2-17 Q3-17
Euro
bn
Gross NPA Net NPA Coverage
Source: Deutsche Bank, company data Source: Deutsche Bank, company data Source: Deutsche Bank, company data
11 For Santander, we include the effects of the acquisition of Banco Popular from Q2-17. 12 For CaixaBank, we include the effect of the acquisition of BPI in Portugal from Q2-17.

23 November 2017
Banks
European Banks
Deutsche Bank AG/London Page 13
Figure 28: Unicaja – NPA evolution Figure 29: BCP – NPA evolution
57.6% 55.4% 55.8% 55.7% 55.7%0
1
2
3
4
5
6
7
FY-15 FY-16 Q1-17 Q2-17 Q3-17
Euro
bn
Gross NPA Net NPA Coverage
32% 32% 37% 38% 40% 40% 41% 42%0
2
4
6
8
10
12
FY-15 Q1-16 Q2-16 Q3-16 FY-16 Q1-17 Q2-17 Q3-17
Euro
bn
Gross NPLs Net NPLs Coverage
Source: Deutsche Bank, company data Source: Deutsche Bank, company data
Figure 30: Santan. – NPA Q3
trends13
Figure 31: BBVA – NPA Q3 trends Figure 32: Bankia – NPA Q3 trends
-25%-20%-15%-10%-5%0%
Since FY-15
YoY
YtD
QoQ
Gross Net
-25%-20%-15%-10%-5%0%
Since FY-15
YoY
YtD
QoQ
Gross Net
-25%-20%-15%-10%-5%0%5%10%
Since FY-15
YoY
YtD
QoQ
Gross Net
Source: Deutsche Bank, company data Source: Deutsche Bank, company data Source: Deutsche Bank, company data
Figure 33: Bankint. – NPA Q3 trends Figure 34: Sabadell – NPA Q3 trends Figure 35: Caixa – NPA Q3 trends14
-12%-10%-8%-6%-4%-2%0%2%4%
Since FY-15
YoY
YtD
QoQ
Gross Net
-30%-25%-20%-15%-10%-5%0%
Since FY-15
YoY
YtD
QoQ
Gross Net
-14%-12%-10%-8%-6%-4%-2%0%
Since FY-15
YoY
YtD
QoQ
Gross Net
Source: Deutsche Bank, company data Source: Deutsche Bank, company data Source: Deutsche Bank, company data
Figure 36: Unicaja – NPA Q3 trends Figure 37: BCP – NPA Q3 trends
-25%-20%-15%-10%-5%0%
Since FY-15
YtD
QoQ
Gross Net
-40%-30%-20%-10%0%
Since FY-15
YoY
YtD
QoQ
Gross Net
Source: Deutsche Bank, company data Source: Deutsche Bank, company data
13 For Santander: Excluding Popular in YtD, YoY and since 2015 trends. 14 For CaixaBank: data includes Banco BPI in Portugal.

23 November 2017
Banks
European Banks
Page 14 Deutsche Bank AG/London
Figure 38: Iberian banks – Asset quality and focus on forborne / past due performing 9M-17
Euro m Net NPA Net forborne + 30/90 past due (2016)
Net forborne + 30/90 past due / loans
Net NPA increase adding 30/90 PS +F
Net NPA ratio New net NPA ratio
Santander 22,007 29,042 3.5% 132.0% 2.7% 6.2%
BBVA 10,409 11,992 3.0% 115.2% 2.6% 5.6%
Bankia 6,796 4,007 3.9% 59.0% 6.6% 10.4%
Bankinter 1,381 813 1.6% 58.9% 2.6% 4.2%
Sabadell 8,171 4,402 3.2% 53.9% 6.0% 9.2%
CaixaBank 13,779 4,444 2.0% 32.3% 6.3% 8.4%
Unicaja 2,198 1,952 6.5% 88.8% 7.3% 13.8%
BCP 4,716 3,993 8.3% 84.7% 9.8% 18.1%
Average 4.0% 78.1% 5.5% 9.5% Source: Deutsche Bank estimates, company data
23 November 2017
Banks
European Banks
Deutsche Bank AG/London Page 15
Ireland15
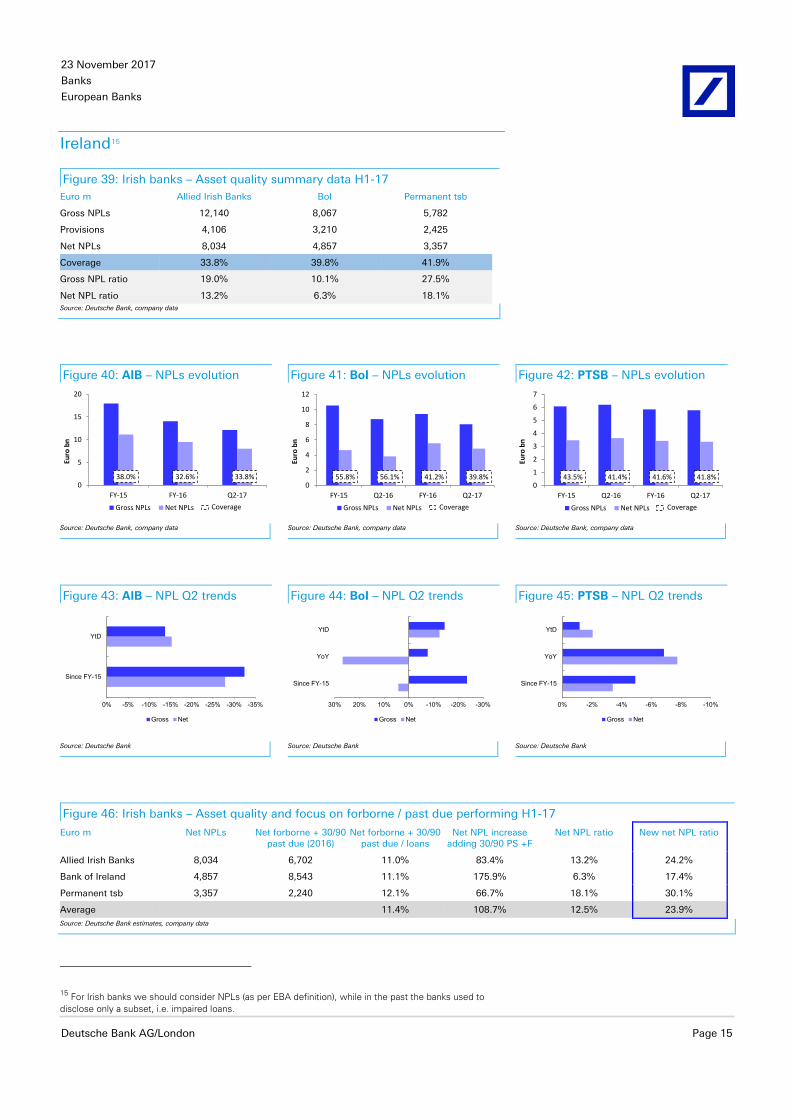
Figure 39: Irish banks – Asset quality summary data H1-17 Euro m Allied Irish Banks BoI Permanent tsb
Gross NPLs 12,140 8,067 5,782
Provisions 4,106 3,210 2,425
Net NPLs 8,034 4,857 3,357
Coverage 33.8% 39.8% 41.9%
Gross NPL ratio 19.0% 10.1% 27.5%
Net NPL ratio 13.2% 6.3% 18.1% Source: Deutsche Bank, company data
Figure 40: AIB – NPLs evolution Figure 41: BoI – NPLs evolution Figure 42: PTSB – NPLs evolution
38.0% 32.6% 33.8%0
5
10
15
20
FY-15 FY-16 Q2-17
Euro
bn
Gross NPLs Net NPLs Coverage
55.8% 56.1% 41.2% 39.8%0
2
4
6
8
10
12
FY-15 Q2-16 FY-16 Q2-17
Euro
bn
Gross NPLs Net NPLs Coverage
43.5% 41.4% 41.6% 41.8%0
1
2
3
4
5
6
7
FY-15 Q2-16 FY-16 Q2-17
Euro
bn
Gross NPLs Net NPLs Coverage
Source: Deutsche Bank, company data Source: Deutsche Bank, company data Source: Deutsche Bank, company data
Figure 43: AIB – NPL Q2 trends Figure 44: BoI – NPL Q2 trends Figure 45: PTSB – NPL Q2 trends
-35%-30%-25%-20%-15%-10%-5%0%
Since FY-15
YtD
Gross Net
-30%-20%-10%0%10%20%30%
Since FY-15
YoY
YtD
Gross Net
-10%-8%-6%-4%-2%0%
Since FY-15
YoY
YtD
Gross Net
Source: Deutsche Bank Source: Deutsche Bank Source: Deutsche Bank
Figure 46: Irish banks – Asset quality and focus on forborne / past due performing H1-17
Euro m Net NPLs Net forborne + 30/90 past due (2016)
Net forborne + 30/90 past due / loans
Net NPL increase adding 30/90 PS +F
Net NPL ratio New net NPL ratio
Allied Irish Banks 8,034 6,702 11.0% 83.4% 13.2% 24.2%
Bank of Ireland 4,857 8,543 11.1% 175.9% 6.3% 17.4%
Permanent tsb 3,357 2,240 12.1% 66.7% 18.1% 30.1%
Average 11.4% 108.7% 12.5% 23.9% Source: Deutsche Bank estimates, company data
15 For Irish banks we should consider NPLs (as per EBA definition), while in the past the banks used to disclose only a subset, i.e. impaired loans.

23 November 2017
Banks
European Banks
Page 16 Deutsche Bank AG/London
Nordics
Figure 47: Nordics banks – Asset quality summary data 9M-17 Currency m Nordea SHB Swed SEB DNB Danske
Euro SEK SEK SEK NOK DKK
Gross NPLs 5,853 7,497 8,655 4,909 25,315 39,542
Provisions 1,884 4,469 2,882 3,582 14,647 17,770
Net NPLs 3,969 3,028 5,773 1,327 10,668 21,772
Coverage 32.2% 59.6% 33.3% 73.0% 57.9% 44.9%
Gross NPL ratio 1.9% 0.4% 0.6% 0.3% 1.6% 3.3%
Net NPL ratio 1.3% 0.1% 0.4% 0.1% 0.7% 1.3% Source: Deutsche Bank, company data
Figure 48: Nordea – NPLs evolution Figure 49: SHB – NPLs evolution Figure 50: Swed – NPLs evolution
37.1% 36.1% 34.7% 34.7% 34.5% 34.7% 31.7% 32.2%0
1
2
3
4
5
6
7
FY-15 Q1-16 Q2-16 Q3-16 FY-16 Q1-17 Q2-17 Q3-17
Euro
bn
Gross NPLs Net NPLs Coverage
54.5% 52.5% 54.4% 56.9% 59.9% 58.3% 59.6% 59.6%0
200
400
600
800
1,000
FY-15 Q1-16 Q2-16 Q3-16 FY-16 Q1-17 Q2-17 Q3-17
Euro
m
Gross NPLs Net NPLs Coverage
40.2% 36.7% 36.8% 36.9% 33.4% 37.9% 33.0% 33.3%0
200
400
600
800
1,000
FY-15 Q1-16 Q2-16 Q3-16 FY-16 Q1-17 Q2-17 Q3-17
Euro
m
Gross NPLs Net NPLs Coverage
Source: Deutsche Bank, company data Source: Deutsche Bank, company data Source: Deutsche Bank, company data
Figure 51: SEB – NPLs evolution Figure 52: DNB – NPLs evolution Figure 53: Danske – NPLs evolution
65.6% 65.0% 68.4% 74.9% 68.7% 72.6% 63.7% 73.0%0
100
200
300
400
500
600
FY-15 Q1-16 Q2-16 Q3-16 FY-16 Q1-17 Q2-17 Q3-17
Euro
m
Gross NPLs Net NPLs Coverage
55.4% 57.9% 42.9% 44.3% 48.1% 51.9% 51.6% 57.9%0.0
0.5
1.0
1.5
2.0
2.5
3.0
3.5
4.0
FY-15 Q1-16 Q2-16 Q3-16 FY-16 Q1-17 Q2-17 Q3-17
Euro
bn
Gross NPLs Net NPLs Coverage
46.6% 48.9% 47.9% 47.1% 45.2% 46.2% 46.1% 44.9%0
1
2
3
4
5
6
7
8
FY-15 Q1-16 Q2-16 Q3-16 FY-16 Q1-17 Q2-17 Q3-17
Euro
bn
Gross NPLs Net NPLs Coverage
Source: Deutsche Bank, company data Source: Deutsche Bank, company data Source: Deutsche Bank, company data
23 November 2017
Banks
European Banks
Deutsche Bank AG/London Page 17
Figure 54: Nordea – NPL Q3 trends Figure 55: HSB – NPL Q3 trends Figure 56: Swed – NPL Q3 trends
-4%-2%0%2%4%6%8%10%
Since FY-15
YoY
YtD
QoQ
Gross Net
-30%-25%-20%-15%-10%-5%0%5%
Since FY-15
YoY
YtD
QoQ
Gross Net
0%10%20%30%40%50%60%70%
Since FY-15
YoY
YtD
QoQ
Gross Net
Source: Deutsche Bank, company data Source: Deutsche Bank, company data Source: Deutsche Bank, company data
Figure 57: SEB – NPL Q3 trends Figure 58: DNB – NPL Q3 trends Figure 59: Danske – NPL Q2 trends
-40%-30%-20%-10%0%10%20%
Since FY-15
YoY
YtD
QoQ
Gross Net
-60%-40%-20%0%20%40%
Since FY-15
YoY
YtD
QoQ
Gross Net
-35%-30%-25%-20%-15%-10%-5%0%
Since FY-15
YoY
YtD
QoQ
Gross Net
Source: Deutsche Bank, company data Source: Deutsche Bank, company data Source: Deutsche Bank, company data
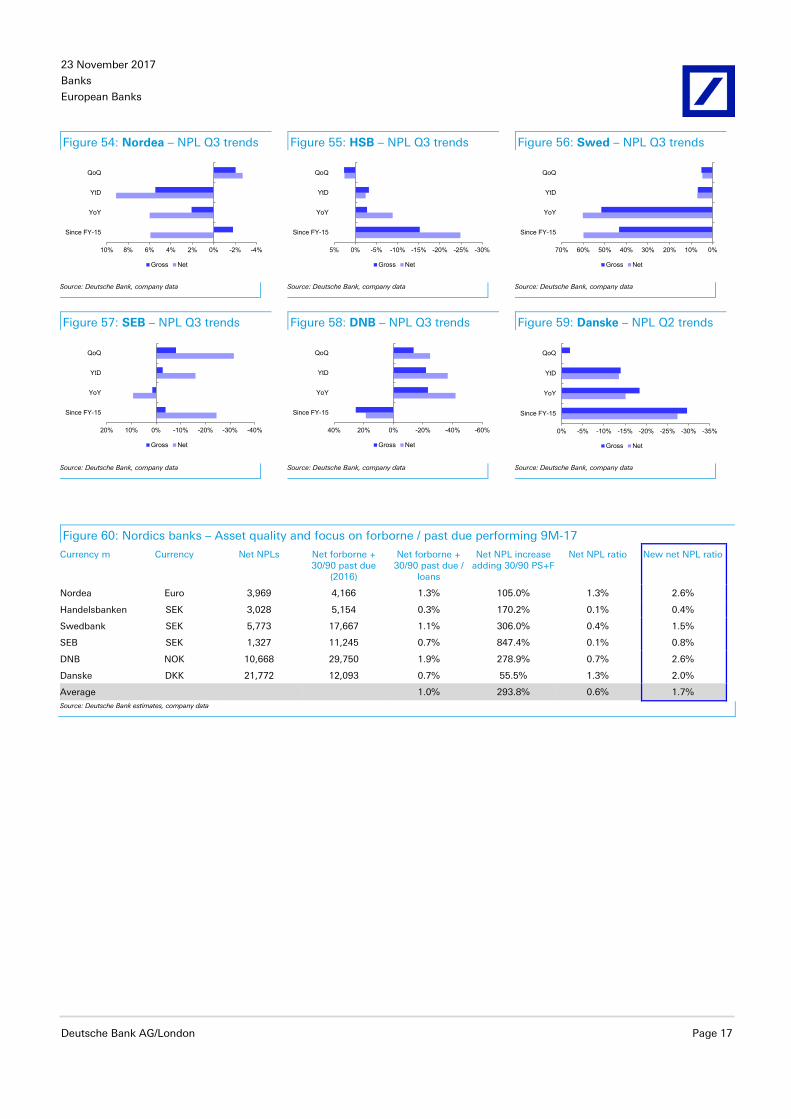
Figure 60: Nordics banks – Asset quality and focus on forborne / past due performing 9M-17
Currency m Currency Net NPLs Net forborne + 30/90 past due
(2016)
Net forborne + 30/90 past due /
loans
Net NPL increase adding 30/90 PS+F
Net NPL ratio New net NPL ratio
Nordea Euro 3,969 4,166 1.3% 105.0% 1.3% 2.6%
Handelsbanken SEK 3,028 5,154 0.3% 170.2% 0.1% 0.4%
Swedbank SEK 5,773 17,667 1.1% 306.0% 0.4% 1.5%
SEB SEK 1,327 11,245 0.7% 847.4% 0.1% 0.8%
DNB NOK 10,668 29,750 1.9% 278.9% 0.7% 2.6%
Danske DKK 21,772 12,093 0.7% 55.5% 1.3% 2.0%
Average 1.0% 293.8% 0.6% 1.7% Source: Deutsche Bank estimates, company data
23 November 2017
Banks
European Banks
Page 18 Deutsche Bank AG/London
Switzerland
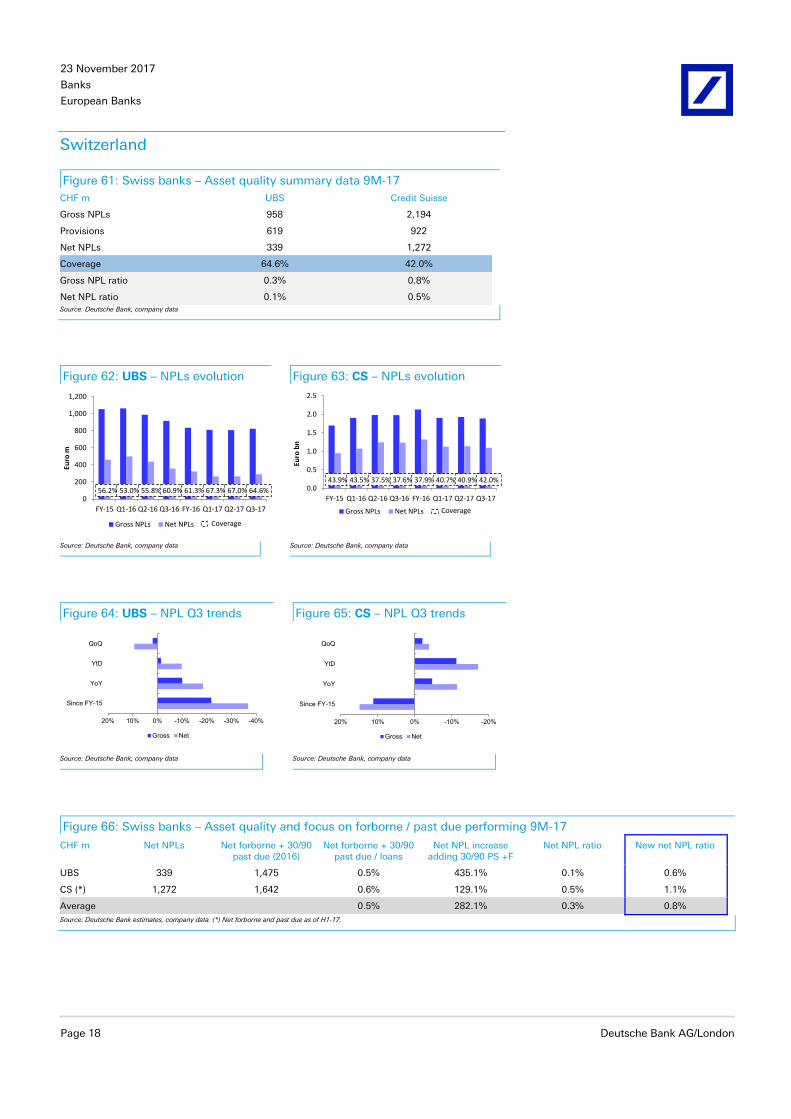
Figure 61: Swiss banks – Asset quality summary data 9M-17 CHF m UBS Credit Suisse
Gross NPLs 958 2,194
Provisions 619 922
Net NPLs 339 1,272
Coverage 64.6% 42.0%
Gross NPL ratio 0.3% 0.8%
Net NPL ratio 0.1% 0.5% Source: Deutsche Bank, company data
Figure 62: UBS – NPLs evolution Figure 63: CS – NPLs evolution
56.2% 53.0% 55.8% 60.9% 61.3% 67.3% 67.0% 64.6%0
200
400
600
800
1,000
1,200
FY-15 Q1-16 Q2-16 Q3-16 FY-16 Q1-17 Q2-17 Q3-17
Euro
m
Gross NPLs Net NPLs Coverage
43.9% 43.5% 37.5% 37.6% 37.9% 40.7% 40.9% 42.0%0.0
0.5
1.0
1.5
2.0
2.5
FY-15 Q1-16 Q2-16 Q3-16 FY-16 Q1-17 Q2-17 Q3-17
Euro
bn
Gross NPLs Net NPLs Coverage
Source: Deutsche Bank, company data Source: Deutsche Bank, company data
Figure 64: UBS – NPL Q3 trends Figure 65: CS – NPL Q3 trends
-40%-30%-20%-10%0%10%20%
Since FY-15
YoY
YtD
QoQ
Gross Net
-20%-10%0%10%20%
Since FY-15
YoY
YtD
QoQ
Gross Net
Source: Deutsche Bank, company data Source: Deutsche Bank, company data
Figure 66: Swiss banks – Asset quality and focus on forborne / past due performing 9M-17
CHF m Net NPLs Net forborne + 30/90 past due (2016)
Net forborne + 30/90 past due / loans
Net NPL increase adding 30/90 PS +F
Net NPL ratio New net NPL ratio
UBS 339 1,475 0.5% 435.1% 0.1% 0.6%
CS (*) 1,272 1,642 0.6% 129.1% 0.5% 1.1%
Average 0.5% 282.1% 0.3% 0.8% Source: Deutsche Bank estimates, company data. (*) Net forborne and past due as of H1-17.

23 November 2017
Banks
European Banks
Deutsche Bank AG/London Page 19
United Kingdom
Figure 67: UK banks – Asset quality summary data 9M-17 Currency m Aldermore (H1-17) Barclays (H1-17) HSBC (H1-17) Lloyds RBS Standard (H1-17)
GBP GBP USD GBP GBP USD
Gross NPLs 35 12,472 16,067 8,200 9,000 9,922
Provisions 12 4,556 7,563 3,657 3,900 5,988
Net NPLs 23 7,916 8,504 4,543 5,100 3,934
Coverage 35.3% 36.5% 47.1% 44.6% 43.3% 60.4%
Gross NPL ratio 0.4% 2.9% 1.7% 1.7% 2.6% 3.6%
Net NPL ratio 0.3% 1.9% 0.9% 1.0% 1.6% 1.5% Source: Deutsche Bank, company data
Figure 68: Barclays – NPLs evolution Figure 69: HSBC – NPLs evolution Figure 70: Lloyds – NPLs evolution
33.6% 32.6% 38.4% 36.5%0
5
10
15
20
FY-15 Q2-16 FY-16 Q2-17
Euro
bn
Gross NPLs Net NPLs Coverage
40.2% 40.8% 43.1% 47.1%0
5
10
15
20
25
FY-15 Q2-16 FY-16 Q2-17
Euro
bn
Gross NPLs Net NPLs Coverage
43.5% 41.4% 41.6% 41.8% 44.6%0
2
4
6
8
10
12
FY-15 Q2-16 FY-16 Q2-17 Q3-17Eu
ro b
nGross NPLs Net NPLs Coverage
Source: Deutsche Bank, company data Source: Deutsche Bank, company data Source: Deutsche Bank, company data
Figure 71: RBS – NPLs evolution Figure 72: Stand. – NPLs evolution
53.9% 56.5% 49.4% 49.0% 39.3% 38.1% 43.3%0
5
10
15
FY-15 Q1-16 Q2-16 Q3-16 FY-16 Q2-17 Q3-17
Euro
bn
Gross NPLs Net NPLs Coverage
48.0% 47.7% 59.6% 60.4%0
2
4
6
8
10
12
FY-15 Q2-16 FY-16 Q2-17
Euro
bn
Gross NPLs Net NPLs Coverage
Source: Deutsche Bank, company data Source: Deutsche Bank, company data
Figure 73: Barclays – NPL Q2 trends Figure 74: HSBC – NPL Q2 trends Figure 75: Lloyds – NPL Q3 trends
-20%-15%-10%-5%0%5%10%
Since FY-15
YoY
YtD
Gross Net
-50%-40%-30%-20%-10%0%
Since FY-15
YoY
YtD
Gross Net
-20%-15%-10%-5%0%
Since FY-15
YtD
QoQ
Gross Net
Source: Deutsche Bank, company data Source: Deutsche Bank, company data Source: Deutsche Bank, company data
23 November 2017
Banks
European Banks
Page 20 Deutsche Bank AG/London
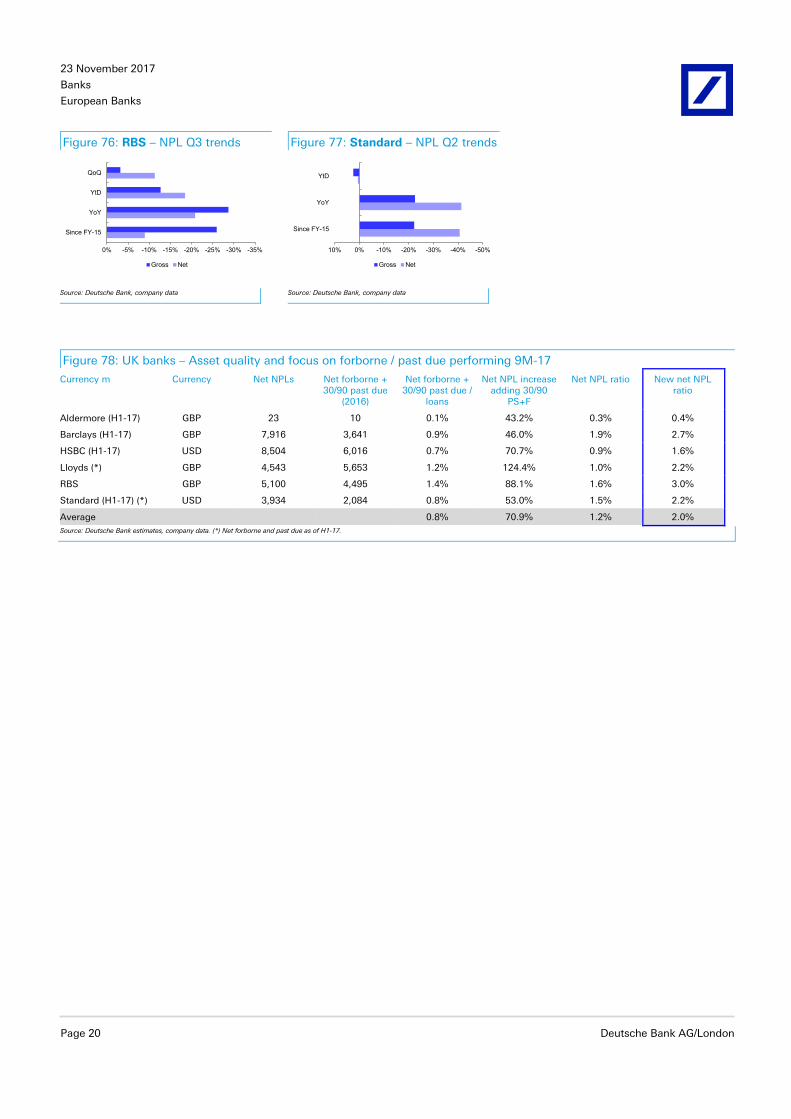
Figure 76: RBS – NPL Q3 trends Figure 77: Standard – NPL Q2 trends
-35%-30%-25%-20%-15%-10%-5%0%
Since FY-15
YoY
YtD
QoQ
Gross Net
-50%-40%-30%-20%-10%0%10%
Since FY-15
YoY
YtD
Gross Net
Source: Deutsche Bank, company data Source: Deutsche Bank, company data
Figure 78: UK banks – Asset quality and focus on forborne / past due performing 9M-17
Currency m Currency Net NPLs Net forborne + 30/90 past due
(2016)
Net forborne + 30/90 past due /
loans
Net NPL increase adding 30/90
PS+F
Net NPL ratio New net NPL ratio
Aldermore (H1-17) GBP 23 10 0.1% 43.2% 0.3% 0.4%
Barclays (H1-17) GBP 7,916 3,641 0.9% 46.0% 1.9% 2.7%
HSBC (H1-17) USD 8,504 6,016 0.7% 70.7% 0.9% 1.6%
Lloyds (*) GBP 4,543 5,653 1.2% 124.4% 1.0% 2.2%
RBS GBP 5,100 4,495 1.4% 88.1% 1.6% 3.0%
Standard (H1-17) (*) USD 3,934 2,084 0.8% 53.0% 1.5% 2.2%
Average 0.8% 70.9% 1.2% 2.0% Source: Deutsche Bank estimates, company data. (*) Net forborne and past due as of H1-17.

23 November 2017
Banks
European Banks
Deutsche Bank AG/London Page 21
France
Figure 79: French banks – Asset quality summary data 9M-17 Euro m BNP (H1-17) SocGen CASA Natixis (H1-17)
Gross NPLs 37,984 21,400 14,296 4,054
Provisions 21,200 11,800 9,921 1,769
Net NPLs 16,784 9,600 4,375 2,285
Coverage 55.8% 55.1% 69.4% 43.6%
Gross NPL ratio 5.1% 5.0% 4.0% 3.1%
Net NPL ratio 2.3% 2.3% 1.3% 1.8% Source: Deutsche Bank, company data
Figure 80: BNP – NPLs evolution Figure 81: SocGen – NPLs evolution Figure 82: CASA – NPLs evolution
55.1% 56.1% 57.3% 55.8%0
10
20
30
40
50
FY-15 Q2-16 FY-16 Q2-17
Euro
bn
Gross NPLs Net NPLs Coverage
58.1% 56.8% 56.4% 55.3% 57.3% 57.9% 55.0% 55.1%0
5
10
15
20
25
30
FY-15 Q1-16 Q2-16 Q3-16 FY-16 Q1-17 Q2-17 Q3-17
Euro
bn
Gross NPLs Net NPLs Coverage
58.7% 56.4% 56.8% 58.2%0
5
10
15
20
FY-15 Q2-16 FY-16 Q2-17
Euro
bn
Gross NPLs Net NPLs Coverage
Source: Deutsche Bank, company data Source: Deutsche Bank, company data Source: Deutsche Bank, company data
Figure 83: BNP – NPL Q2 trends Figure 84: SocGen – NPL Q3 trends Figure 85: CASA – NPL Q3 trends
-10%-8%-6%-4%-2%0%
Since FY-15
YoY
YtD
Gross Net
-14%-12%-10%-8%-6%-4%-2%0%
Since FY-15
YoY
YtD
QoQ
Gross Net
-50%-40%-30%-20%-10%0%
Since FY-15
YoY
YtD
QoQ
Gross Net
Source: Deutsche Bank, company data Source: Deutsche Bank, company data Source: Deutsche Bank, company data
Figure 86: French banks – Asset quality and focus on forborne / past due performing 9M-17
Euro m Net NPLs Net forborne + 30/90 past due (2016)
Net forborne + 30/90 past due / loans
Net NPL increase adding 30/90 PS +F
Net NPL ratio New net NPL ratio
BNP (H1-17) 16,784 9,019 1.3% 53.7% 2.3% 3.6%
SocGen 9,600 2,781 0.7% 29.0% 2.3% 3.0%
CASA 4,375 9,852 2.8% 225.2% 1.3% 4.1%
Natixis (H1-17) 2,285 2,713 2.1% 118.7% 1.8% 3.9%
Average 1.7% 106.7% 1.9% 3.6% Source: Deutsche Bank estimates, company data

23 November 2017
Banks
European Banks
Page 22 Deutsche Bank AG/London
Benelux
Figure 87: Benelux banks – Asset quality summary data 9M-17 Euro m KBC ABN AMRO ING
Gross NPLs 10,060 7,853 12,650
Provisions 4,777 2,721 4,967
Net NPLs 5,283 5,132 7,683
Coverage 47.5% 34.6% 39.3%
Gross NPL ratio 6.0% 2.9% 2.2%
Net NPL ratio 3.3% 1.9% 1.4% Source: Deutsche Bank, company data
Figure 88: KBC – NPLs evolution Figure 89: ABN – NPLs evolution Figure 90: ING – NPLs evolution
44.8% 45.4% 45.5% 45.6% 46.1% 46.6% 47.3% 47.5%0
2
4
6
8
10
12
14
FY-15 Q1-16 Q2-16 Q3-16 FY-16 Q1-17 Q2-17 Q3-17
Euro
bn
Gross NPLs Net NPLs Coverage
55.8% 56.1% 50.8% 38.0% 38.4% 36.7% 34.8% 34.6%0
2
4
6
8
10
FY-15 Q1-16 Q2-16 Q3-16 FY-16 Q1-17 Q2-17 Q3-17
Euro
bn
Gross NPLs Net NPLs Coverage
37.8% 39.8% 40.9% 41.0% 39.0% 39.9% 39.7% 39.3%0
5
10
15
FY-15 Q1-16 Q2-16 Q3-16 FY-16 Q1-17 Q2-17 Q3-17
Euro
bn
Gross NPLs Net NPLs Coverage
Source: Deutsche Bank, company data Source: Deutsche Bank, company data Source: Deutsche Bank, company data
Figure 91: KBC – NPL Q3 trends Figure 92: ABN – NPL Q3 trends Figure 93: ING – NPL Q3 trends
-25%-20%-15%-10%-5%0%
Since FY-15
YoY
YtD
QoQ
Gross Net
-40%-20%0%20%40%60%80%
Since FY-15
YoY
YtD
QoQ
Gross Net
-25%-20%-15%-10%-5%0%
Since FY-15
YoY
YtD
QoQ
Gross Net
Source: Deutsche Bank, company data Source: Deutsche Bank, company data Source: Deutsche Bank, company data
Figure 94: Benelux banks – Asset quality and focus on forborne / past due performing 9M-17
Euro m Net NPLs Net forborne + 30/90 past due (2016)
Net forborne + 30/90 past due / loans
Net NPL increase adding 30/90 PS +F
Net NPL ratio New net NPL ratio
KBC 5,283 1,977 1.2% 37.4% 3.3% 4.5%
ABN AMRO 5,132 5,927 2.2% 115.5% 1.9% 4.1%
ING (*) 7,683 8,337 1.5% 108.5% 1.4% 2.8%
Average 1.6% 87.1% 2.2% 3.8% Source: Deutsche Bank estimates, company data. (*) Net forborne and past due as of H1-17.

23 November 2017
Banks
European Banks
Deutsche Bank AG/London Page 23
Germany
Figure 95: German banks – Asset quality summary data 9M-17 Euro m CBK Aareal PBB
Gross NPLs 6,549 1,272 314
Provisions 3,118 554 121
Net NPLs 3,431 718 193
Coverage 47.6% 43.6% 38.5%
Gross NPL ratio 2.8% 4.4% 0.8%
Net NPL ratio 1.5% 2.5% 0.5% Source: Deutsche Bank, company data
Figure 96: CBK – NPLs evolution Figure 97: Aareal – NPLs evolution Figure 98: PBB – NPLs evolution
47.3% 47.5% 49.0% 44.4% 46.9% 47.7% 47.6% 47.6%0
2
4
6
8
FY-15 Q1-16 Q2-16 Q3-16 FY-16 Q1-17 Q2-17 Q3-17
Euro
bn
Gross NPLs Net NPLs Coverage
39.7% 39.8% 40.7% 41.4% 41.0% 41.5% 42.2% 43.6%0
500
1,000
1,500
FY-15 Q1-16 Q2-16 Q3-16 FY-16 Q1-17 Q2-17 Q3-17
Euro
m
Gross NPLs Net NPLs Coverage
44.0% 44.0% 43.0% 36.0% 33.5% 36.7% 37.3% 38.5%0
200
400
600
800
FY-15 Q1-16 Q2-16 Q3-16 FY-16 Q1-17 Q2-17 Q3-17
Euro
mGross NPLs Net NPLs Coverage
Source: Deutsche Bank, company data Source: Deutsche Bank, company data Source: Deutsche Bank, company data
Figure 99: CBK – NPL Q3 trends Figure 100: Aareal – NPL Q3 trends Figure 101: PBB – NPL Q3 trends
-20%-15%-10%-5%0%5%
Since FY-15
YoY
YtD
QoQ
Gross Net
-14%-12%-10%-8%-6%-4%-2%0%
Since FY-15
YoY
YtD
QoQ
Gross Net
-70%-60%-50%-40%-30%-20%-10%0%
Since FY-15
YoY
YtD
QoQ
Gross Net
Source: Deutsche Bank, company data Source: Deutsche Bank, company data Source: Deutsche Bank, company data
Figure 102: German banks – Asset quality and focus on forborne / past due performing 9M-17
Euro m Net NPLs Net forborne + 30/90 past due (2016)
Net forborne + 30/90 past due / loans
Net NPL increase adding 30/90 PS +F
Net NPL ratio New net NPL ratio
Commerzbank 3,431 5,064 2.2% 147.6% 1.5% 3.7%
Aareal 718 332 1.2% 46.2% 2.5% 3.7%
PBB (*) 193 32 0.1% 16.6% 0.5% 0.6%
Average 1.2% 70.1% 1.5% 2.7% Source: Deutsche Bank estimates, company data. (*) Net forborne and past due as of H1-17.

23 November 2017
Banks
European Banks
Page 24 Deutsche Bank AG/London
Austria
Figure 103: Austrian banks – Asset quality summary data 9M-17 Euro m Erste Raiffeisen
Gross NPLs 6,189 5,443
Provisions 4,302 3,778
Net NPLs 1,887 1,665
Coverage 69.5% 69.4%
Gross NPL ratio 4.3% 6.7%
Net NPL ratio 1.4% 2.2% Source: Deutsche Bank, company data
Figure 104: Erste – NPLs evolution Figure 105: RBI – NPLs evolution
64.5% 59.6% 56.4% 57.8% 69.1% 67.6% 68.5% 69.5%0
2
4
6
8
10
FY-15 Q1-16 Q2-16 Q3-16 FY-16 Q1-17 Q2-17 Q3-17
Euro
bn
Gross NPLs Net NPLs Coverage
69.3% 68.2% 69.8% 70.0% 71.7% 70.5% 66.2%0
2
4
6
8
10
FY-15 Q1-16 Q2-16 Q3-16 FY-16 Q1-17 Q2-17
Euro
bn
Gross NPLs Net NPLs Coverage
Source: Deutsche Bank, company data Source: Deutsche Bank, company data
Figure 106: Erste – NPL Q3 trends Figure 107: RBI – NPL Q3 trends
-50%-40%-30%-20%-10%0%
Since FY-15
YoY
YtD
QoQ
Gross Net
-40%-30%-20%-10%0%10%
Since FY-15
YoY
YtD
QoQ
Gross Net
Source: Deutsche Bank, company data Source: Deutsche Bank, company data
Figure 108: Austrian banks – Asset quality and focus on forborne / past due performing 9M-17
Euro m Net NPLs Net forborne + 30/90 past due (2016)
Net forborne + 30/90 past due / loans
Net NPL increase adding 30/90 PS +F
Net NPL ratio New net NPL ratio
Erste 1,887 2,110 1.5% 111.8% 1.4% 2.9%
Raiffeisen 1,665 779 1.0% 46.8% 2.1% 3.0%
Average 1.2% 79.3% 1.7% 3.0% Source: Deutsche Bank estimates, company data

European Banks
Banks
23 November 2017
Deutsche Bank AG/London Page 25
Disclo
sure b
y cou
ntry
Figu
re 10
9: Italian
ban
ks – disclo
sure o
f no
n-p
erform
ing
and
past-d
ue lo
ans
NP
Ls C
ollateral to
classify as no
n-
perfo
rmin
g
Pro
vision
s C
overag
e P
ast-du
e perfo
rmin
g
Pu
lling
effect
Su
mm
ary Italy
Data alw
ays available
No
(can b
e used
to
calculate th
e amo
un
t of
pro
vision
s to b
oo
k)
Sp
ecific pro
vision
s on
NP
Ls (in
divid
ually an
d co
llectively assessed
), and
gen
eric p
rovisio
ns o
n p
erform
ing
lo
ans (d
isclosu
re on
a q
uarterly b
asis)
Co
verage alw
ays calculated
as cash
specific p
rovisio
ns
on
total N
PLs (in
AR
, and
so
metim
es in q
uarterly
presen
tation
also d
etails on
co
llateral are available)
Data o
n p
ast-du
e bu
t p
erform
ing
available in
AR
o
nly. Fo
r UC
G p
erform
ing
p
ast du
e also in
H1
interim
rep
orts.
Deb
tor ap
pro
ach – p
ullin
g
effect thresh
old
at 5%
(E
BA
’s 20
%)
Source: D
eutsche Bank, com
pany data
Figu
re 11
0: Italian
ban
ks – disclo
sure o
f forb
orn
e loan
s Fo
rbo
rne lo
ans (q
ualitative / q
uan
titative info
) C
lassification
Tim
ing
/ con
ditio
n fo
r the tran
sfer to
perfo
rmin
g
Pro
vision
s R
ecent ch
ang
es in classificatio
n
du
e to E
BA
Su
mm
ary Italy
Disclo
sure availab
le qu
arterly for IS
P, M
PS
and
UB
I, semi-
ann
ually fo
r BB
PM
and
UC
G, an
d in
AR
on
ly for C
redem
(b
oth
for p
erform
ing
and
no
n-p
erform
ing
forb
orn
e loan
s).
Classified
as no
n-p
erform
ing
, if the
restructu
ring
gen
erates a redu
ction
in
NP
V fo
r the b
ank.
At least tw
o years fro
m th
e date o
f restru
cturin
g. T
he b
orro
wer m
ust
have reco
vered th
e con
ditio
n o
f fu
ll solven
cy.
Sp
ecific pro
vision
s if classified
with
in N
PLs.
Gen
erally no
chan
ges as existin
g
rules w
ere stricter. On
ly for so
me
ban
ks the B
ank o
f Italy recent
insp
ection
s lead to
som
e reclassificatio
n o
f perfo
rmin
g
forb
orn
e loan
s into
the n
on
-p
erform
ing
catego
ry. S
ource: Deutsche B
ank, company d
ata
Figu
re 11
1: Italian
ban
ks – disclo
sure o
f collateral
Carryin
g valu
e V
aluatio
n o
f collateral
Frequ
ency o
f up
date in
collateral valu
e D
isclosu
re
Su
mm
ary Italy
Fair value, g
enerally cap
ped
to th
e loan
’s no
min
al valu
e (in m
ost cases: n
ot cap
ped
un
til 20
14
in
clud
ed, cap
ped
from
20
15
on
ward
s)
Differen
t practices. In
gen
eral: Real
estate collateral valu
ed b
y ind
epen
den
t assesso
rs at the lo
an’s in
ceptio
n; th
en
this co
uld
be valu
ed b
y ban
ks’ staff.
1) Y
early value review
for co
llateral eligib
le in p
rovisio
nin
g u
nd
er Basel 2
.
2) N
o reg
ulato
ry requ
iremen
ts on
frequ
ency o
f value review
.
3) M
arket practices m
ay differ sig
nifican
tly betw
een b
anks.
Disclo
sure o
nly availab
le in th
e AR
(an
d in
clud
es a split b
etween
real co
llateral and
oth
er).
Source: D
eutsche Bank, com
pany data

European Banks
Banks
23 November 2017
Page 26 Deutsche Bank AG/London
Figu
re 11
2: S
pan
ish b
anks – d
isclosu
re of n
on
-perfo
rmin
g an
d p
ast-du
e loan
s N
PLs
Co
llateral to classify as n
on
-p
erform
ing
P
rovisio
ns
Co
verage
Past-d
ue p
erform
ing
P
ullin
g effect
Su
mm
ary Sp
ain
Disclo
sure availab
le in th
e AR
and
gen
erally in
presen
tation
s. G
enerally n
ot o
n lo
ans’
classification
(exceptio
ns ap
ply
on
forb
orn
e loan
s)
1) S
pecific (in
divid
ually o
r co
llectively assessed) an
d 2
) g
eneric p
rovisio
ns
Sp
ecific pro
vision
s / gro
ss N
PLs
No
gen
eral rule ap
plies,
no
rmally d
isclosed
in
ann
ual rep
ort
The p
ullin
g effect ap
plies w
hen
a n
on
-perfo
rmin
g o
r do
ub
tful lo
an d
ue
to arrears exceed
20
% o
f the
ou
tstand
ing
expo
sure to
that d
ebto
r. In
corp
orated
in th
e new
Ap
pen
dix
IX fro
m C
ircular 4
/20
04
- #9
3 S
ource: Deutsche B
ank, company d
at. Disclosure refers to the S
panish operations only
Figu
re 11
3: S
pan
ish b
anks – d
isclosu
re of fo
rbo
rne lo
ans
Forb
orn
e loan
s (qu
alitative / qu
antitative in
fo)
Classificatio
n
Timin
g / co
nd
ition
for th
e transfer to
perfo
rmin
g
Pro
vision
s R
ecent ch
ang
es in classificatio
n d
ue to
E
BA
Su
mm
ary Sp
ain
Disclo
sure availab
le in th
e AR
and
semi an
nu
al acco
un
ts.. Forb
orn
e or ren
ego
tiated lo
ans d
isclosu
re in
clud
es NP
Ls and
perfo
rmin
g lo
ans b
y type o
f
deb
tor. 16
1. P
erform
ing
no
t past-d
ue;
2. p
erform
ing
past-d
ue;
3.n
on
-perfo
rmin
g
Reclassificatio
n fro
m D
ou
btfu
l to n
orm
al un
der
surveillan
ce shall req
uires: 1
) on
e year of m
et co
ntractu
al con
ditio
ns fro
m restru
cturin
g; 2
) P
ast-du
e installm
ents’ (p
rincip
al and
interests)
paid
back; 3
) no
un
paid
installm
ent w
ith o
ver 3
0d
ays du
e. To exit fro
m sp
ecial surveillan
ce n
eed an
oth
er year meetin
g co
ntractu
al o
blig
ation
s and
a detailed
review o
f the b
orro
wer
finan
cial status.
Sp
ecific pro
vision
s and
d
ou
btfu
l forb
orn
e. A
pp
end
ix IX – C
ircular 4
/20
04
has
establish
ed n
ew req
uirem
ents in
Q4
-16
.
Source: D
eutsche Bank, com
pany data D
isclosure refers to the Sp
anish operations only
Figu
re 11
4: S
pan
ish b
anks – d
isclosu
re of co
llateral C
arrying
value
Valu
ation
of co
llateral Freq
uen
cy of u
pd
ate in co
llateral value
Disclo
sure
Su
mm
ary Sp
ain
Ap
praisal valu
e for fo
reclosed
assets and
value o
f th
e loan
for N
PLs.
Ind
epen
den
t valuatio
n o
nly. Tw
o
meth
od
olo
gies: i) in
divid
ual ap
praisal o
r ii) co
llective valuatio
n m
etho
do
log
y (on
ly un
der
certain co
nd
ition
s). Th
e app
raisal com
pan
y has
to b
e app
roved
by th
e Ban
k of S
pain
. (A
pp
end
ix IX #
74
)
An
nu
ally for all th
e NP
Ls. If the lo
ans is b
elow
E
uro
25
0k it is valid
an u
pd
ate every 3 years. Th
e u
pd
ates have to
be an
nu
ally. If it is no
t NP
L has
to b
e do
ne in
the 6
mo
nth
s prio
r to th
e loan
and
u
pd
ated w
hen
there is evid
ence o
f material
declin
e in h
ou
se prices (A
pp
end
ix IX ·6
8-8
2)
Limited
and
no
n-stan
dard
ized d
isclosu
re in th
e AR
.
Source: D
eutsche Bank, com
pany data. D
isclosure refers to the Sp
anish operations only
16 Loans are recognized as forborne if borrowers have financial difficulties; the restructuring is not due to com
mercial reasons.

European Banks
Banks
23 November 2017
Deutsche Bank AG/London Page 27
Figu
re 11
5: P
ortu
gu
ese ban
ks – disclo
sure o
f no
n-p
erform
ing
and
past-d
ue lo
ans
NP
Ls C
ollateral to
classify as no
n-
perfo
rmin
g
Pro
vision
s C
overag
e P
ast-du
e perfo
rmin
g
Pu
lling
effect
Su
mm
ary Po
rtug
al
Data alw
ays available
No
dis
Sp
ecific pro
vision
s on
NP
Ls (in
divid
ually an
d co
llectively assessed
), and
gen
eric pro
vision
s o
n p
erform
ing
loan
s (disclo
sure o
n
a qu
arterly basis)
Co
verage alw
ays calculated
as cash
specific p
rovisio
ns o
n to
tal N
PLs (in
AR
, and
in q
uarterly
presen
tation
also d
etails on
co
llateral are available)
Data o
n p
ast-du
e bu
t perfo
rmin
g
available in
AR
and
semi an
nu
al acco
un
ts
Deb
tor ap
pro
ach – in
clud
ed in
the
NP
E d
efinitio
n (E
BA
’s 20
%)
BC
P
Data alw
ays available
No
disclo
sure
Sp
ecific pro
vision
s on
NP
Ls (in
divid
ually an
d co
llectively assessed
), and
gen
eric pro
vision
s o
n p
erform
ing
loan
s (disclo
sure o
n
a qu
arterly basis)
Co
verage alw
ays calculated
as cash
specific p
rovisio
ns o
n to
tal N
PLs (in
AR
, and
in q
uarterly
presen
tation
also d
etails on
co
llateral are available)
Data o
n p
ast-du
e bu
t perfo
rmin
g
available in
AR
and
semi-an
nu
al acco
un
ts. Oth
er NP
E is d
isclosed
in
the q
uarterly p
resentatio
n
Deb
tor ap
pro
ach – in
clud
ed in
the
NP
E d
efinitio
n. Th
e ban
k uses a
mo
re string
ent th
at EB
A’s
defin
ition
as lon
g as o
ne
transactio
n is d
efaulted
the w
ho
le exp
osu
re is NP
E S
ource: Deutsche B
ank, company d
ata
Figu
re 11
6: P
ortu
gu
ese ban
ks – disclo
sure o
f forb
orn
e loan
s Fo
rbo
rne lo
ans (q
ualitative / q
uan
titative info
) C
lassification
Tim
ing
/ con
ditio
n fo
r the tran
sfer to
perfo
rmin
g
Pro
vision
s R
ecent ch
ang
es in classificatio
n
du
e to E
BA
Su
mm
ary Po
rtug
al
Disclo
sure availab
le in th
e AR
(for p
erform
ing
forb
orn
e loan
s). C
lassified as n
on
-perfo
rmin
g, if
the restru
cturin
g g
enerates a
redu
ction
in N
PV
for th
e ban
k
At least tw
o years fro
m th
e date o
f restru
cturin
g. T
he b
orro
wer m
ust
have reco
vered th
e con
ditio
n o
f fu
ll solven
cy.
Sp
ecific pro
vision
s if classified
with
in N
PLs.
BC
P
Disclo
sure availab
le in th
e AR
(for p
erform
ing
forb
orn
e loan
s) C
lassified as n
on
-perfo
rmin
g, if
the restru
cturin
g g
enerates a
redu
ction
in N
PV
for th
e ban
k
At least tw
o years fro
m th
e date o
f restru
cturin
g. T
he b
orro
wer m
ust
have reco
vered th
e con
ditio
n o
f fu
ll solven
cy.
Sp
ecific pro
vision
s if classified
with
in N
PLs.
Source: D
eutsche Bank and
comp
any data Fig
ure 1
17
: Po
rtug
uese b
anks – d
isclosu
re of co
llateral C
arrying
value
Valu
ation
of co
llateral Freq
uen
cy of u
pd
ate in co
llateral value
Disclo
sure
Su
mm
ary Po
rtug
al
Fair value, g
enerally n
ot cap
ped
to th
e loan
’s n
om
inal valu
e D
ifferent p
ractices. In g
eneral: R
eal estate co
llateral valued
by in
dep
end
ent
assessors at th
e loan
’s incep
tion
; then
th
is cou
ld b
e valued
by b
anks’ staff.
1) Y
early value review
for co
llateral eligib
le in p
rovisio
nin
g u
nd
er Basel
2.
2) N
o reg
ulato
ry requ
iremen
ts on
frequ
ency o
f value review
.
3) M
arket practices m
ay differ sig
nifican
tly betw
een b
anks.
No
disclo
sure
BC
P
Fair value, g
enerally n
ot cap
ped
to th
e loan
’s n
om
inal valu
e B
CP
do
es app
raisal usin
g realizatio
n
value w
hich
inclu
des tran
saction
cost. It
assum
es disp
osal in
6 m
on
ths
On
ce a year N
o d
isclosu
re
Source: D
eutsche Bank, com
pany data

European Banks
Banks
23 November 2017
Page 28 Deutsche Bank AG/London
Figu
re 11
8: Irish
ban
ks – disclo
sure o
f no
n-p
erform
ing
and
past-d
ue lo
ans
NP
Ls C
ollateral to
classify as no
n-
perfo
rmin
g
Pro
vision
s C
overag
e P
ast-du
e perfo
rmin
g
Pu
lling
effect
Su
mm
ary Ireland
Disclo
sure alw
ays presen
t in th
e AR
Y
ES
3
catego
ries: 1) sp
ecific (in
divid
ually sig
nifican
t exp
osu
res), 2) sp
ecific (co
llectively assessed), 3
) IBN
R
("incu
rred b
ut n
ot rep
orted
")
Total p
rovisio
ns / g
ross n
on
-p
erform
ing
D
isclosu
re always availab
le (CB
I req
uirem
ent)
EB
A b
asic rule (2
0%
pu
lling
effect)
Ban
k of Irelan
d
Disclo
sure availab
le in th
e AR
Y
ES
1
) Sp
ecific (ind
ividu
al, collective)
and
2) IB
NR
pro
vision
s To
tal pro
vision
s / gro
ss no
n-
perfo
rmin
g
Detailed
by m
aturity: <
30
d, 3
1d
- 6
0d
, 61
d - 9
0d
E
BA
defin
ition
is ado
pted
(so w
e assu
me th
is app
lies also to
the
pu
lling
effect)
Allied
Irish B
ank
Disclo
sure availab
le in th
e AR
Y
ES
1
) Sp
ecific (ind
ividu
al, collective)
and
2) IB
NR
pro
vision
s To
tal pro
vision
s / gro
ss no
n-
perfo
rmin
g
Detailed
by m
aturity: <
30
d, 3
1d
- 6
0d
, 61
d - 9
0d
N
.A. (W
e assum
e EB
A d
efinitio
n
is ado
pted
)
Perm
anen
t TS
B
Disclo
sure availab
le in th
e AR
Y
ES
1
) Sp
ecific (ind
ividu
al, collective)
and
2) IB
NR
pro
vision
s To
tal pro
vision
s / gro
ss no
n-
perfo
rmin
g
Detailed
by m
aturity: <
30
d, 3
1d
- 6
0d
, 61
d - 9
0d
N
.A. (W
e assum
e EB
A d
efinitio
n
is ado
pted
)
Source: D
eutsche Bank, com
pany data
Figu
re 11
9: Irish
ban
ks – disclo
sure o
f forb
orn
e loan
s Fo
rbo
rne lo
ans (q
ualitative / q
uan
titative info
) C
lassification
Tim
ing
/ con
ditio
n fo
r the tran
sfer to
perfo
rmin
g
Pro
vision
s R
ecent ch
ang
es in classificatio
n
du
e to E
BA
Su
mm
ary Ireland
Disclo
sure o
f forb
orn
e loan
s (du
e to b
orro
wer’s fin
ancial
difficu
lties) available in
the A
R
1. P
erform
ing
no
t past-d
ue; 2
. p
erform
ing
past-d
ue; 3
.no
n-
perfo
rmin
g
Cu
ring
sub
ject to: 1
) bo
rrow
er’s so
lvency, 2
) no
arrears. Timin
g: 1
year fro
m th
e first paym
ent p
ast-d
ue b
y less than
30
days
Ind
ividu
ally and
collectively
assessed
New
data o
n N
PL fo
llow
ing
EB
A
defin
ition
(befo
re on
ly imp
aired
loan
s were d
isclosed
, no
w all
NP
Ls). Imp
roved
disclo
sure: 1
) ren
ego
tiated lo
ans (o
/w d
ue to
co
mm
ercial reason
s) 2)
forb
earances (im
pairm
ent trig
ger)
Ban
k of Irelan
d
Disclo
sure o
f forb
orn
e in th
e AR
1
. Perfo
rmin
g n
ot p
ast-du
e; 2.
perfo
rmin
g p
ast-du
e; 3.n
on
-p
erform
ing
12
mo
nth
s pro
batio
n p
eriod
1
) Sp
ecific (ind
ividu
al, collective)
and
2) g
eneric p
rovisio
ns
Disclo
sure ad
justed
to E
BA
/CB
I’s revised
gu
idelin
es
Allied
Irish B
ank
Disclo
sure o
f forb
orn
e in th
e AR
1
. Perfo
rmin
g n
ot p
ast-du
e; 2.
perfo
rmin
g p
ast-du
e; 3.n
on
-p
erform
ing
12
mo
nth
s pro
batio
n p
eriod
1
) Sp
ecific (ind
ividu
al, collective)
and
2) g
eneric p
rovisio
ns
Disclo
sure ad
justed
to E
BA
/CB
I’s revised
gu
idelin
es
Perm
anen
t TS
B
Disclo
sure o
f forb
orn
e in th
e AR
1
. Perfo
rmin
g n
ot p
ast-du
e; 2.
perfo
rmin
g p
ast-du
e; 3.n
on
-p
erform
ing
12
mo
nth
s pro
batio
n p
eriod
1
) Sp
ecific (ind
ividu
al, collective)
and
2) g
eneric p
rovisio
ns
Disclo
sure ad
justed
to E
BA
/CB
I’s revised
gu
idelin
es
S
ource: Deutsche B
ank, company d
ata

European Banks
Banks
23 November 2017
Deutsche Bank AG/London Page 29
Figu
re 12
0: Irish
ban
ks – disclo
sure o
f collateral
Carryin
g valu
e V
aluatio
n o
f collateral
Frequ
ency o
f up
date in
collateral valu
e D
isclosu
re
Su
mm
ary Ireland
Fair value, cap
ped
to th
e loan
no
min
al value
A co
mb
inatio
n o
f pro
fession
al app
raisers, real estate m
arket ind
ices or statistical an
alysis, b
ased o
n in
dep
end
ent assesso
rs or b
anks'
staff
1) C
RE
reviewed
on
ce every three years, 2
) R
esiden
tial real estate on
ce every year Lim
ited an
d n
on
-stand
ardized
disclo
sure
Ban
k of Irelan
d
Fair value. N
ot stated
wh
ether if co
llateral is capp
ed to
the
un
derlyin
g valu
e or n
ot
Assessm
ent b
y intern
al staff and
external
app
raisals (com
mercial p
rop
erties) C
on
sistent w
ith th
e CB
I regu
latory g
uid
ance
AR
– com
plete q
ualitative d
isclosu
re; on
ly valu
e of rep
ossessed
collaterals d
isclosed
Allied
Irish B
ank
Fair value. N
ot stated
wh
ether if co
llateral is capp
ed to
the
un
derlyin
g valu
e or n
ot
Assessm
ent b
y intern
al staff and
external
app
raisals (com
mercial p
rop
erties) C
on
sistent w
ith th
e CB
I regu
latory g
uid
ance
AR
– com
plete q
ualitative d
isclosu
re; on
ly valu
e of rep
ossessed
collaterals d
isclosed
Perm
anen
t TS
B
Fair value. N
ot stated
wh
ether if co
llateral is capp
ed to
the
un
derlyin
g valu
e or n
ot
Assessm
ent b
y intern
al staff and
external
app
raisals (com
mercial p
rop
erties) C
on
sistent w
ith th
e CB
I regu
latory g
uid
ance
AR
– com
plete q
ualitative d
isclosu
re; on
ly valu
e of rep
ossessed
collaterals d
isclosed
Source: D
eutsche Bank, com
pany data

European Banks
Banks
23 November 2017
Page 30 Deutsche Bank AG/London
Figu
re 12
1: N
ord
ic ban
ks – disclo
sure o
f no
n-p
erform
ing
and
past-d
ue lo
ans
NP
Ls C
ollateral to
classify as no
n-
perfo
rmin
g
Pro
vision
s C
overag
e P
ast-du
e perfo
rmin
g
Pu
lling
effect
Su
mm
ary No
rdics
NP
Ls are given
in th
e AR
as tho
se loan
s wh
ose
paym
ents (in
terest or p
rincip
al) are mo
re than
9
0 d
ays past-d
ue (6
0 fo
r som
e ban
ks)
Gen
erally YE
S
Sp
ecific (on
NP
Ls) and
gen
eric D
isclosu
re differ b
y ban
k G
enerally availab
le (thresh
old
varies, d
epen
din
g o
n th
e def.
of N
PLs)
No
com
mo
n ru
le
SE
B
Qu
antitative d
ata in A
R
YE
S
1) C
ollective (sp
ecific and
g
eneric); 2
) ind
ividu
al (sp
ecific); 3) co
llective (g
eneric)
Sp
ecific pro
vision
s / Gro
ss N
PLs
Data availab
le, past-d
ue
thresh
old
at 60
%
Gen
erally transactio
n
app
roach
. Deb
tor ap
pro
ach
may ap
ply to
som
e expo
sures
Han
delsb
anken
Disclo
sure availab
le in th
e AR
A
loan
on
wh
ich th
e ban
k exp
ects full rep
aymen
t is no
t classified
as no
n-p
erform
ing
; excep
tion
s are loan
s past-d
ue
by m
ore th
an 6
0 d
ays
No
gen
eric pro
vision
. Sp
ecific p
rovisio
ns (estim
ates of th
e p
oten
tial ban
k’s loss after
ded
uctin
g co
llaterals)
Total p
rovisio
ns / G
ross N
PLs
Mo
re detailed
than
oth
er N
ord
ic ban
ks; split b
y m
aturity: 5
d - 1
m, 1
m - 2
m,
2m
- 3m
, 3m
- 12
m, >
12
m.
N.A
.
No
rdea
Disclo
sure availab
le in th
e AR
Y
ES
1
) Gen
eric (“collectively
assessed”) an
d 2
) specific
(“ind
ividu
ally assessed”)
pro
vision
s
AR
- 2 co
verage ratio
s: 1)
Sp
ecific pro
vision
s / gro
ss N
PLs; 2
) Total p
rovisio
ns /
gro
ss NP
Ls
Sp
lit by cu
stom
er (ho
useh
old
, co
rpo
rate) and
by m
aturity: 6
d
- 30
d, 3
1d
- 60
d, 6
1d - 9
0d
, >
90
d
Transactio
n ap
pro
ach
Sw
edb
ank
Qu
alitative disclo
sure in
AR
. Y
ES
D
isclosu
re of g
eneric an
d
specific p
rovisio
ns
AR
- 2 co
verage ratio
s: 1)
specific p
rovisio
ns / g
ross n
on
-p
erform
ing
, and
2) To
tal p
rovisio
ns / g
ross n
on
-p
erform
ing
. Presen
tation
- on
ly 2
).
Go
od
disclo
sure. S
plit b
y valu
ation
catego
ry and
by
matu
rity: 5d
- 30
d, 3
1d
- 60
d,
mo
re than
60
d
Gen
erally deb
tor ap
pro
ach
Dan
ske
Qu
alitative disclo
sure in
AR
, bu
t un
clear and
d
ifferent fro
m p
resentatio
ns.
NO
1
) Gen
eric (“collectively
assessed”) an
d 2
) specific
(“ind
ividu
ally assessed”)
pro
vision
s
Sp
ecific pro
vision
s / Gro
ss N
PLs n
et of co
llateral S
plit b
y matu
rity: 5d
- 30
d, 31
d
- 60
d, >
60
d)
Deb
tor ap
pro
ach
DN
B
Qu
alitative disclo
sure in
AR
, bu
t un
clear and
d
ifferent fro
m p
resentatio
ns.
NO
1
) Gen
eric (“collectively
assessed”) an
d 2
) specific
(“ind
ividu
ally assessed”)
pro
vision
s
Sp
ecific pro
vision
s / Gro
ss N
PLs n
et of co
llateral S
plit b
y matu
rity: 5d
- 30
d, 31
d
- 60
d, >
60
d)
Deb
tor ap
pro
ach
Source: D
eutsche Bank, com
pany data

European Banks
Banks
23 November 2017
Deutsche Bank AG/London Page 31
Figu
re 12
2: N
ord
ic ban
ks – disclo
sure o
f forb
orn
e loan
s Fo
rbo
rne lo
ans (q
ualitative / q
uan
titative info
) C
lassification
Tim
ing
/ con
ditio
n fo
r the tran
sfer to
perfo
rmin
g
Pro
vision
s R
ecent ch
ang
es in classificatio
n
du
e to E
BA
Su
mm
ary No
rdics
Qu
alitative disclo
sure, lim
ited q
uan
titative disclo
sure
1. P
erform
ing
no
t past-d
ue, 2
. P
erform
ing
, bu
t past-d
ue, 3
.no
n-
perfo
rmin
g
No
com
mo
n d
efinitio
n.
Valu
e of p
rovisio
ns o
n fo
rbo
rne
loan
s is gen
erally no
t disclo
sed.
No
rdic b
anks m
igh
t be req
uired
to
chan
ge th
eir disclo
sure b
y the
EB
A.
SE
B
Disclo
sure availab
le in th
e AR
O
nly d
isclosu
re of 2
. perfo
rmin
g
past-d
ue >
60
days
N.A
. Few
details, n
o q
uan
titative d
isclosu
re N
o im
pro
vemen
t neith
er is m
entio
ned
a pip
eline o
f measu
res to
com
ply w
ith u
pco
min
g E
BA
reg
ulatio
n
Han
delsb
anken
Neith
er the q
uan
titative no
r the q
ualitative d
isclosu
re availab
le in th
e AR
N
.A.
N.A
. N
.A.
N.A
.
No
rdea
Exten
sive qu
alitative, no
qu
antitative d
isclosu
re N
.A.
After b
eing
recog
nized
as forb
orn
e, a lo
an is reg
arded
as perfo
rmin
g if th
e o
blig
or co
mp
lies with
the n
ew
con
ditio
ns.
N.A
. N
.A.
Sw
edb
ank
Exten
sive qu
alitative, limited
qu
antitative d
isclosu
re O
nly d
isclosu
re of 1
. Perfo
rmin
g
no
t past-d
ue
Cu
ring
up
on
: 1) n
o d
eferred
paym
ents, 2
) orig
inal co
nd
ition
s resto
red, 3
) bo
rrow
er mad
e the last 3
p
aymen
ts/has b
een p
aying
for at
least 6m
N.A
. Im
pro
vemen
ts mad
e from
20
12
, ap
pro
achin
g E
BA
's stand
ards.
Dan
ske
Exten
sive qu
alitative, no
qu
antitative d
isclosu
re N
.A.
N.A
. N
.A.
AR
– Intro
du
ced co
ncep
t of
forb
orn
e loan
.
DN
B
Exten
sive qu
alitative, no
qu
antitative d
isclosu
re N
.A.
N.A
. N
.A.
AR
– Intro
du
ced co
ncep
t of
forb
orn
e loan
.
S
ource: Deutsche B
ank, company d
ata
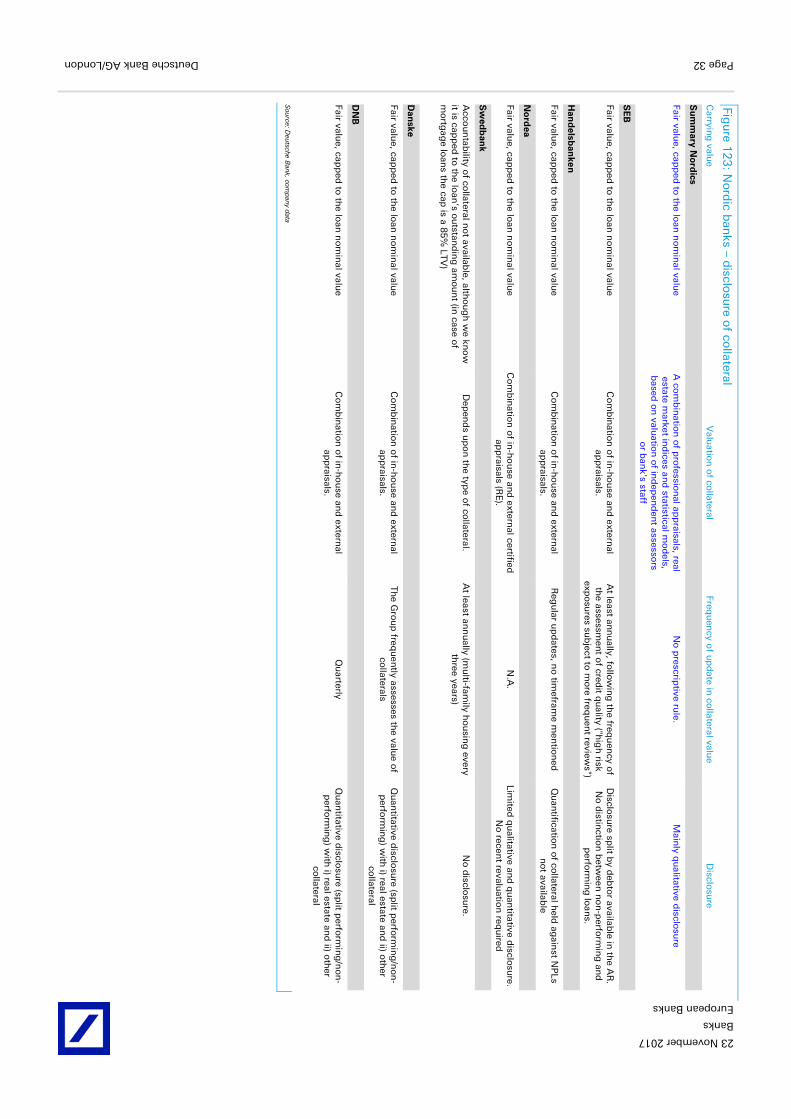
European Banks
Banks
23 November 2017
Page 32 Deutsche Bank AG/London
Figu
re 12
3: N
ord
ic ban
ks – disclo
sure o
f collateral
Carryin
g valu
e V
aluatio
n o
f collateral
Frequ
ency o
f up
date in
collateral valu
e D
isclosu
re
Su
mm
ary No
rdics
Fair value, cap
ped
to th
e loan
no
min
al value
A co
mb
inatio
n o
f pro
fession
al app
raisals, real estate m
arket ind
ices and
statistical mo
dels,
based
on
valuatio
n o
f ind
epen
den
t assessors
or b
ank’s staff
No
prescrip
tive rule.
Main
ly qu
alitative disclo
sure
SE
B
Fair value, cap
ped
to th
e loan
no
min
al value
Co
mb
inatio
n o
f in-h
ou
se and
external
app
raisals. A
t least ann
ually, fo
llow
ing
the freq
uen
cy of
the assessm
ent o
f credit q
uality ("h
igh
risk exp
osu
res sub
ject to m
ore freq
uen
t reviews")
Disclo
sure sp
lit by d
ebto
r available in
the A
R.
No
distin
ction
betw
een n
on
-perfo
rmin
g an
d
perfo
rmin
g lo
ans.
Han
delsb
anken
Fair value, cap
ped
to th
e loan
no
min
al value
Co
mb
inatio
n o
f in-h
ou
se and
external
app
raisals. R
egu
lar up
dates, n
o tim
eframe m
entio
ned
Q
uan
tification
of co
llateral held
again
st NP
Ls n
ot availab
le
No
rdea
Fair value, cap
ped
to th
e loan
no
min
al value
Co
mb
inatio
n o
f in-h
ou
se and
external certified
ap
praisals (R
E).
N.A
. Lim
ited q
ualitative an
d q
uan
titative disclo
sure.
No
recent revalu
ation
requ
ired
Sw
edb
ank
Acco
un
tability o
f collateral n
ot availab
le, altho
ug
h w
e kno
w
it is capp
ed to
the lo
an’s o
utstan
din
g am
ou
nt (in
case of
mo
rtgag
e loan
s the cap
is a 85
% LTV
)
Dep
end
s up
on
the typ
e of co
llateral. A
t least ann
ually (m
ulti-fam
ily ho
usin
g every
three years)
No
disclo
sure.
Dan
ske
Fair value, cap
ped
to th
e loan
no
min
al value
Co
mb
inatio
n o
f in-h
ou
se and
external
app
raisals. Th
e Gro
up
frequ
ently assesses th
e value o
f co
llaterals Q
uan
titative disclo
sure (sp
lit perfo
rmin
g/n
on
-p
erform
ing
) with
i) real estate and
ii) oth
er co
llateral
DN
B
Fair value, cap
ped
to th
e loan
no
min
al value
Co
mb
inatio
n o
f in-h
ou
se and
external
app
raisals. Q
uarterly
Qu
antitative d
isclosu
re (split p
erform
ing
/no
n-
perfo
rmin
g) w
ith i) real estate an
d ii) o
ther
collateral
Source: D
eutsche Bank, com
pany data

European Banks
Banks
23 November 2017
Deutsche Bank AG/London Page 33
Figu
re 12
4: S
wiss b
anks – d
isclosu
re of n
on
-perfo
rmin
g an
d p
ast-du
e loan
s N
PLs
Co
llateral to classify as n
on
-p
erform
ing
P
rovisio
ns
Co
verage
Past-d
ue p
erform
ing
Su
mm
ary Sw
itzerland
Qu
antitative d
ata in A
R, sp
lit amo
ng
: stand
ard,
sub
stand
ard/sp
ecial men
tion
, do
ub
tful
YE
S
Bo
th 1
) specific an
d 2
) gen
eric p
rovisio
ns p
rovid
ed in
the A
R
Total p
rovisio
ns / g
ross p
erform
ing
lo
ans
Alw
ays disclo
sed b
y matu
rity; no
im
pairm
ent th
resho
ld ap
plied
Cred
it Su
isse
Qu
antitative d
ata in A
R
N.A
. (We assu
me Y
ES
, given
g
eneral ru
le) 1
) Sp
ecific and
2) g
eneric
pro
vision
s; Interim
repo
rt and
p
resentatio
n – n
on
e.
Total p
rovisio
ns / g
ross p
erform
ing
cu
stom
er loan
s S
plit b
y matu
rity: up
to 3
0d
, 30
d -
90
d, 9
1d
- 18
0d
, 181
d - 1
y, > 1y
UB
S
Qu
antitative d
ata in A
R
N.A
. (We assu
me Y
ES
, given
g
eneral ru
le) 1
) Sp
ecific, and
2) g
eneric
pro
vision
s To
tal pro
vision
s / gro
ss perfo
rmin
g
loan
s A
R - S
plit b
y matu
rity: 31
d - 6
0d
, 6
0d
- 90
d, 9
1d
- 180
d , >
18
0d
Source: D
eutsche Bank, com
pany data
Figu
re 12
5: S
wiss b
anks – d
isclosu
re of fo
rbo
rne lo
ans
Forb
orn
e loan
s (qu
alitative / qu
antitative d
isclosu
re) C
lassification
Tim
ing
/ con
ditio
n fo
r the tran
sfer to
perfo
rmin
g
Pro
vision
s
Su
mm
ary Sw
itzerland
No
t available
N.A
. N
.A.
N.A
.
Cred
it Su
isse
Limited
qu
alitative and
qu
antitative d
isclosu
re O
nly “Fo
rbo
rne”
N.A
. N
.A.
UB
S
Limited
qu
alitative and
qu
antitative d
isclosu
re Im
paired
/ No
t imp
aired
N.A
. N
.A.
Source: D
eutsche Bank, com
pany data
Figu
re 12
6: S
wiss b
anks – d
isclosu
re of co
llateral C
arrying
value
Valu
ation
of co
llateral Freq
uen
cy of u
pd
ate in co
llateral value
Disclo
sure
Su
mm
ary Sw
itzerland
Fair value, g
enerally cap
ped
to th
e loan
no
min
al value
Co
llaterals’ value assessm
ent is p
erform
ed b
y th
e Ban
k’s ow
n staff o
r external sp
ecialists D
epen
ds o
n b
ank’s p
ractice Q
ualitative an
d q
uan
titative do
cum
entatio
n o
n
collaterals in
AR
on
ly.
Cred
it Su
isse
Fair value. N
ot stated
wh
ether if co
llateral is capp
ed to
the
un
derlyin
g valu
e or n
ot; w
e assum
e YE
S, g
iven g
eneral ru
le. B
oth
1) in
ternal an
d 2
) external exp
erts are in
volved
in th
e revaluatio
n
At least o
nce a year
Disclo
sure o
f collateral in
AR
UB
S
Fair value, cap
ped
to th
e amo
un
t of th
e secured
transactio
n
(overco
llateralization
is no
t perm
itted)
RE
collateral valu
ed b
y intern
al and
external
experts, d
epen
din
g o
n th
e circum
stances.
At least o
nce a year
Disclo
sure o
f collateral in
AR
(no
split R
E an
d
oth
er) S
ource: Deutsche B
ank, company d
ata

European Banks
Banks
23 November 2017
Page 34 Deutsche Bank AG/London
Figu
re 12
7: U
K b
anks – d
isclosu
re of n
on
-perfo
rmin
g an
d p
ast-du
e loan
s N
PLs
Co
llateral to classify as n
on
-p
erform
ing
P
rovisio
ns
Co
verage
Past-d
ue p
erform
ing
P
ullin
g effect
Su
mm
ary UK
Disclo
sure availab
le in A
R
YE
S
1) S
pecific (in
divid
ual an
d
collective), 2
) gen
eric p
rovisio
ns. D
isclosu
re varies b
y ban
k.
Gen
erally: total p
rovisio
ns /
gro
ss no
n-p
erform
ing
G
enerally d
etailed b
y m
aturity – d
ifferent d
etail levels ap
plied
.
Gen
erally transactio
n
app
roach
Stan
dard
Ch
artered
Exten
sive disclo
sure in
AR
– NP
Ls 1) in
clud
e all >9
0 d
ays p
ast-du
e, 2) exclu
de cu
red ren
ego
tiated >
90
days in
arrear (even
if no
n-p
erform
ing
)
YE
S (b
ut lim
ited co
. d
isclosu
re) 1
) Sp
ecific (IIP), 2
) p
ortfo
lio/g
eneric (P
IP)
pro
vision
s
Total p
rovisio
ns / g
ross N
PL
(con
siderin
g co
llateral) D
etailed b
y matu
rity (90
d
ays delin
qu
ency
thresh
old
): <3
0d
, 31
d - 6
0d
, 6
1d
- 90
d, 9
1d
- 150
d
N.A
.
Barclays
Disclo
sure in
AR
and
release. Y
ES
S
pecific p
rovisio
ns
Sp
ecific pro
vision
s / gro
ss n
on
-perfo
rmin
g
AR
- Sp
lit by m
aturity: <
1m
, 1
m - 2
m, 2
m - 3
m, 3
m -
6m
, >6
m
N.A
.
Lloyd
s
Disclo
sure availab
le in A
R an
d p
resentatio
n.
NO
1
) Sp
ecific and
2) g
eneric
pro
vision
s (no
t split)
Total p
rovisio
ns / g
ross N
PL
(con
siderin
g co
llateral) S
plit b
y matu
rity: <3
0d
, 31
d
- 60
d, 6
1d
- 90
d, 9
1d -
18
0d
, >1
81
d
N.A
.
HS
BC
Disclo
sure availab
le in A
R
YE
S (m
ay vary dep
end
ing
o
n lo
ans’ co
nd
ition
s) O
nly sp
ecific pro
vision
s are rep
orted
(split b
etween
co
llective and
ind
ividu
al)
No
t specifically rep
orted
, h
ow
ever all data are
pro
vided
to calcu
late it
AR
- Sp
lit by m
aturity:
<3
0d
, 30
d - 5
9d, 6
0d
- 89
d,
90
d - 1
79
d, >
18
0d
. Inclu
de
forb
orn
e <3
0 d
ays past-d
ue
Deb
tor ap
pro
ach
(wh
olesale p
ortfo
lio). N
o
furth
er disclo
sure.
RB
S
Disclo
sure availab
le in A
R.
YE
S (m
ay vary dep
end
ing
o
n lo
ans’ co
nd
ition
s) B
oth
1) S
pecific (in
divid
ual
and
collective) an
d 2
) g
eneric (o
n laten
t losses)
pro
vision
s are repo
rted
Total p
rovisio
ns / g
ross
no
n-p
erform
ing
A
R - S
plit 1
) betw
een C
ore
and
No
n-C
ore, 2
) by
matu
rity: 1d
- 29
d, 3
0d
- 5
9d
, 60
d - 8
9d
,>9
0d
N.A
.
Source: D
eutsche Bank, com
pany data

European Banks
Banks
23 November 2017
Deutsche Bank AG/London Page 35
Figu
re 12
8: U
K b
anks – d
isclosu
re of fo
rbo
rne lo
ans
Forb
orn
e loan
s (qu
alitative / qu
antitative in
fo)
Classificatio
n
Timin
g / co
nd
ition
for th
e transfer
to p
erform
ing
P
rovisio
ns
Recen
t chan
ges in
classification
d
ue to
EB
A
Su
mm
ary UK
Dep
end
s on
ban
ks' po
licies 1
. Perfo
rmin
g n
ot p
ast-du
e; 2.
perfo
rmin
g p
ast-du
e; 3 n
on
-p
erform
ing
.
No
min
imu
m p
eriod
D
epen
ds o
n b
ank’s in
ternal p
olicy
No
majo
r chan
ges
Stan
dard
Ch
artered
Imp
roved
disclo
sure availab
le in th
e AR
. Detailed
split b
y m
aturity d
ate and
related p
rovisio
ns
1. P
erform
ing
no
t past-d
ue; 2
. p
erform
ing
past-d
ue; 3
.no
n-
perfo
rmin
g
Cu
ring
sub
ject to resp
ect of n
ew
terms fo
r >1
80
days
1) S
pecific an
d 2
) gen
eric p
rovisio
ns o
n fo
rbo
rne
1) In
trod
uctio
n o
f forb
earances at
the G
rou
p level; 2
) con
sistent
imp
rovem
ent in
disclo
sure
Barclays
Disclo
sure availab
le in th
e AR
(detailed
split o
f Retail an
d
Wh
olesale exp
osu
res) 1
. Perfo
rmin
g n
ot p
ast-du
e; 3.n
on
-p
erform
ing
N
.A.
1) S
pecific (in
divid
ually an
d
collectively assessed
) and
2)
gen
eric pro
vision
s
AR
– disclo
sure o
f no
n-p
erform
ing
fo
rbo
rne lo
ans
Lloyd
s
Disclo
sure availab
le in th
e AR
1
. Perfo
rmin
g n
ot p
ast-du
e; 3.n
on
-p
erform
ing
C
urin
g su
bject to
: 1) resp
ect of
new
terms; 2
) 12
mo
nth
s pro
batio
n
perio
d (excep
tion
with
for
perm
anen
t curin
g)
1) S
pecific an
d 2
) gen
eric p
rovisio
ns (sp
lit on
ly in co
mm
ercial p
ortfo
lio)
Review
ed p
rob
ation
perio
d (fu
rther
details in
20
14
)
HS
BC
Disclo
sure availab
le in th
e AR
1
. Perfo
rmin
g n
ot p
ast-du
e; 2.
perfo
rmin
g p
ast-du
e; 3.n
on
-p
erform
ing
Su
fficient evid
ence risk red
uctio
n
and
no
ind
ication
of im
pairm
ent
1) S
pecific an
d 2
) gen
eric p
rovisio
ns (n
o sp
lit) N
o m
ajor ch
ang
es
RB
S
Disclo
sure availab
le in th
e AR
1
. Perfo
rmin
g n
ot p
ast-du
e; 2.
perfo
rmin
g p
ast-du
e; 3.n
on
-p
erform
ing
Assessm
ent b
y relation
ship
m
anag
ers in G
RG
N
.A.
EB
A co
mp
liant d
isclosu
re of
forb
orn
e
Source: D
eutsche Bank, C
omp
any data
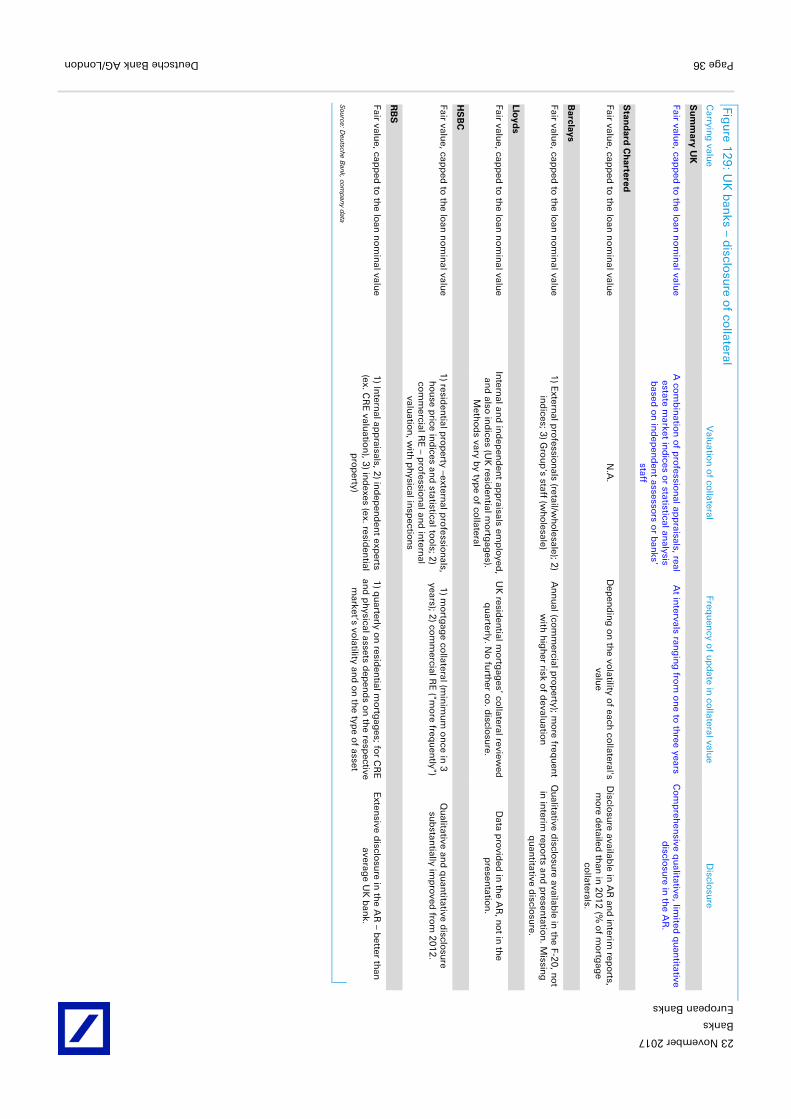
European Banks
Banks
23 November 2017
Page 36 Deutsche Bank AG/London
Figu
re 12
9: U
K b
anks – d
isclosu
re of co
llateral C
arrying
value
Valu
ation
of co
llateral Freq
uen
cy of u
pd
ate in co
llateral value
Disclo
sure
Su
mm
ary UK
Fair value, cap
ped
to th
e loan
no
min
al value
A co
mb
inatio
n o
f pro
fession
al app
raisals, real estate m
arket ind
ices or statistical an
alysis b
ased o
n in
dep
end
ent assesso
rs or b
anks'
staff
At in
tervals rang
ing
from
on
e to th
ree years C
om
preh
ensive q
ualitative, lim
ited q
uan
titative d
isclosu
re in th
e AR
.
Stan
dard
Ch
artered
Fair value, cap
ped
to th
e loan
no
min
al value
N.A
. D
epen
din
g o
n th
e volatility o
f each co
llateral's valu
e D
isclosu
re available in
AR
and
interim
repo
rts, m
ore d
etailed th
an in
20
12
(% o
f mo
rtgag
e co
llaterals.
Barclays
Fair value, cap
ped
to th
e loan
no
min
al value
1) E
xternal p
rofessio
nals (retail/w
ho
lesale); 2)
ind
ices; 3) G
rou
p's staff (w
ho
lesale) A
nn
ual (co
mm
ercial pro
perty); m
ore freq
uen
t w
ith h
igh
er risk of d
evaluatio
n
Qu
alitative disclo
sure availab
le in th
e F-20
, no
t in
interim
repo
rts and
presen
tation
. Missin
g
qu
antitative d
isclosu
re.
Lloyd
s
Fair value, cap
ped
to th
e loan
no
min
al value
Intern
al and
ind
epen
den
t app
raisals emp
loyed
, an
d also
ind
ices (UK
residen
tial mo
rtgag
es). M
etho
ds vary b
y type o
f collateral
UK
residen
tial mo
rtgag
es’ collateral review
ed
qu
arterly. No
furth
er co. d
isclosu
re. D
ata pro
vided
in th
e AR
, no
t in th
e p
resentatio
n.
HS
BC
Fair value, cap
ped
to th
e loan
no
min
al value
1) resid
ential p
rop
erty –external p
rofessio
nals,
ho
use p
rice ind
ices and
statistical too
ls; 2)
com
mercial R
E – p
rofessio
nal an
d in
ternal
valuatio
n, w
ith p
hysical in
spectio
ns
1) m
ortg
age co
llateral (min
imu
m o
nce in
3
years); 2) co
mm
ercial RE
("mo
re frequ
ently")
Qu
alitative and
qu
antitative d
isclosu
re su
bstan
tially imp
roved
from
20
12
.
RB
S
Fair value, cap
ped
to th
e loan
no
min
al value
1) In
ternal ap
praisals, 2
) ind
epen
den
t experts
(ex. CR
E valu
ation
), 3) in
dexes (ex. resid
ential
pro
perty)
1) q
uarterly o
n resid
ential m
ortg
ages; fo
r CR
E
and
ph
ysical assets dep
end
s on
the resp
ective m
arket’s volatility an
d o
n th
e type o
f asset
Exten
sive disclo
sure in
the A
R – b
etter than
averag
e UK
ban
k.
Source: D
eutsche Bank, com
pany data

European Banks
Banks
23 November 2017
Deutsche Bank AG/London Page 37
Figu
re 13
0: Fren
ch b
anks – d
isclosu
re of n
on
-perfo
rmin
g an
d p
ast-du
e loan
s N
PLs
Co
llateral to classify as
no
n-p
erform
ing
P
rovisio
ns
Co
verage
Past-d
ue p
erform
ing
P
ullin
g effect
Su
mm
ary France
Well d
efined
imp
airmen
t trigg
ers (>9
0 d
ays past-d
ue;
ob
jective eviden
ce of im
pairm
ent) b
ut n
o p
rescriptive
classification
catego
ries17
NO
1
) Sp
ecific and
2) g
eneric
pro
vision
s (on
perfo
rmin
g
po
rtfolio
)
Gen
erally 2 co
verage ratio
s: 1)
Total p
rovisio
ns / g
ross n
on
-p
erform
ing
; 2) sp
ecific p
rovisio
ns / g
ross n
on
-p
erform
ing
Detailed
for m
aturities b
elow
th
e imp
airmen
t trigg
er (90
days)
Deb
tor ap
pro
ach
CA
SA
Disclo
sure availab
le in th
e presen
tation
(the A
R refers
to th
e total am
ou
nt o
f L&A
). N
O
1) S
pecific an
d 2
) gen
eric p
rovisio
ns – B
asel 2 an
d IA
S
39
com
plian
t disclo
sure
Presen
tation
– 2 co
verage
ratios: 1
) Total p
rovisio
ns
/gro
ss no
n-p
erform
ing
; 2)
specific p
rovisio
ns / g
ross n
on
-p
erform
ing
Also
“watch
-list loan
s”, detailed
b
y matu
rity: <9
0d
, 91
d - 1
80
d,
18
1d
- 1y, >
1y
N.A
.
BN
P P
aribas
Disclo
sure availab
le in th
e Reg
istration
Do
cum
ent, A
R
and
presen
tation
N
O
1) S
pecific an
d 2
) gen
eric p
rovisio
ns
Total p
rovisio
ns / (d
ou
btfu
l lo
ans n
et of co
llaterals) D
etailed b
y matu
rity: <9
0d
, 90
d
- 18
0d
, 18
0d - 1
y, >1
y. Relative
collateral g
iven in
the A
R
N.A
.
SG
Disclo
sure availab
le disclo
sure in
the R
egistratio
n
Do
cum
ent an
d A
R.
NO
1
) Sp
ecific and
2) g
eneric
pro
vision
s To
tal pro
vision
s / (do
ub
tful
loan
s net o
f gu
arantees an
d
collaterals)
Also
“watch
-list loan
s”, inclu
de
past-d
ues fo
r techn
ical reason
s. A
mo
un
ts detailed
by m
aturity:
<9
0d
, 91
d - 1
80d
, >1
80
d
Deb
tor ap
pro
ach
Natixis
Disclo
sure availab
le disclo
sure in
the R
egistratio
n
Do
cum
ent an
d A
R.
NO
1
) Sp
ecific and
2) g
eneric
pro
vision
s To
tal pro
vision
s / (do
ub
tful
loan
s net o
f gu
arantees an
d
collaterals)
Am
ou
nts d
etailed b
y matu
rity: <
90
d, 9
1d
- 180
d, >
18
0d
D
ebto
r app
roach
Source: D
eutsche Bank, com
pany data
17 Except for N
PLs consisting of “créances douteuses” (claim
s that present a probable, but not certain, risk of default on a loan) and créances irrécupérables” (claims that are definitely lost), based on the definition
of the Autorité de controle prudential of the B
anque de France.

European Banks
Banks
23 November 2017
Page 38 Deutsche Bank AG/London
Figu
re 13
1: Fren
ch b
anks – d
isclosu
re of fo
rbo
rne lo
ans
Forb
orn
e loan
s (qu
alitative / qu
antitative in
fo)
Classificatio
n
Timin
g / co
nd
ition
for th
e transfer
to p
erform
ing
P
rovisio
ns
Recen
t chan
ges in
classification
d
ue to
EB
A
Su
mm
ary France
Qu
alitative disclo
sure availab
le and
imp
roved
from
20
12
. Q
uan
titative disclo
sure still larg
ely un
available.
No
specific ru
le. N
o m
inim
um
perio
d.
Req
uirem
ents: 1
) jud
icial pro
cess p
ossib
ly related to
the co
mp
letion
o
f restructu
ring
; 2) n
ew p
aymen
t sch
edu
le regu
larly met.
No
specific d
isclosu
re req
uirem
ents
Ch
ang
es un
derw
ay to co
mp
ly with
E
BA
’s ITS/2
01
3/0
3
CA
SA
Forb
orn
e du
e to cu
stom
er defau
lt classified as d
efault 18. A
ll fo
rbo
rne p
ast-du
e loan
s are inclu
ded
in th
e no
n-p
erform
ing
p
ortfo
lio (n
ot availab
le)
Perfo
rmin
g n
ot p
ast-du
e N
.A.
Sp
ecific pro
vision
s on
do
ub
tful
forb
orn
e (E
BA
’s ITS 2
01
3-0
3 co
mp
liant)
BN
P
Go
od
disclo
sure availab
le in th
e AR
. Loan
are forb
orn
e and
n
on
-perfo
rmin
g w
hen
the b
ank is su
bject to
a loss d
ue to
th
e restatemen
t of th
e loan
's con
ditio
ns
Perfo
rmin
g n
ot p
ast-du
e, and
no
n-
perfo
rmin
g
N.A
. S
pecific p
rovisio
ns o
n d
ou
btfu
l fo
rbo
rne
Imp
rovem
ent in
20
13
, as q
uan
titative disclo
sure w
as no
t availab
le in 2
012
.
SG
Qu
antitative d
isclosu
re no
t available. Lim
ited q
ualitative
disclo
sure in
the A
R. Fo
rbo
rne are d
ue to
the b
orro
wer's
inso
lvency (o
ccurred
or n
ot) 19
N.A
. Fo
rbo
rne are in
defau
lt un
til the
ban
k is un
certain o
n th
e b
orro
wer’s ab
ility com
ply w
ith th
e n
ew term
s.
N.A
. N
o im
pro
vemen
t from
20
12
.
Natixis
Qu
antitative d
isclosu
re no
t available. Lim
ited q
ualitative
disclo
sure in
the A
R. Fo
rbo
rne are d
ue to
the b
orro
wer's
inso
lvency (o
ccurred
or n
ot) 20
N.A
. Fo
rbo
rne are in
defau
lt un
til the
ban
k is un
certain o
n th
e b
orro
wer’s ab
ility com
ply w
ith th
e n
ew term
s.
N.A
. N
o im
pro
vemen
t from
20
12
.
S
ource: Deutsche B
ank, company d
ata
18 This category excludes loans forborne for comm
ercial reasons (i.e. made for developing or preserving a com
mercial relationship) and loans w
hose conditions changed due to the application of a clause or an option. 19 This category excludes loans forborne for com
mercial reasons (i.e. m
ade for developing or preserving a comm
ercial relationship) and loans whose conditions changed due to the application of a clause or an
option. 20 This category excludes loans forborne for com
mercial reasons (i.e. m
ade for developing or preserving a comm
ercial relationship) and loans whose conditions changed due to the application of a clause or an
option.

European Banks
Banks
23 November 2017
Deutsche Bank AG/London Page 39
Figu
re 13
2: Fren
ch b
anks – d
isclosu
re of co
llateral C
arrying
value
Valu
ation
of co
llateral Freq
uen
cy of u
pd
ate in co
llateral value
Disclo
sure
Su
mm
ary France
Fair value, cap
ped
to th
e loan
no
min
al value.
Ban
ks develo
p th
eir ow
n to
ols to
assess co
llateral value. V
aluatio
n o
f mo
rtgag
e g
uaran
tees may req
uire co
mp
lemen
tary in
dep
end
ent assessm
ent.
Co
llateral value o
n d
ou
btfu
l loan
s reviewed
reg
ularly (sam
e frequ
ency o
f pro
vision
ing
estim
ates – min
imu
m every six m
on
ths, also
q
uarterly/m
on
thly); o
n n
ot im
paired
practice
mig
ht d
iffer (yearly/bian
nu
ally)
Co
mp
rehen
sive qu
alitative disclo
sure; very
limited
qu
antitative d
isclosu
re
CA
SA
No
min
al value o
f loan
s. No
disclo
sure o
n w
heth
er collateral
is capp
ed at th
e loan
no
min
al value o
r no
t; we assu
me Y
ES
, g
iven g
eneral ru
le.
Co
llateral assessmen
t varies by b
usin
ess: 1. R
E
bu
siness (statistical m
od
els/ind
ices) 2. retail
ban
king
(pro
perty m
arket ind
ices) 3. p
roject-
finan
cing
(ind
epen
den
t pro
fession
als)
At least q
uarterly
Limited
qu
alitative, no
qu
antitative d
isclosu
re
BN
P
Differen
t accou
ntab
ility dep
end
ing
on
the lo
an typ
e. C
ollaterals o
n N
PLs are cap
ped
to th
e loan
no
min
al value.
As a g
eneral p
olicy, co
llateral and
gu
arantees
are taken at th
eir econ
om
ic value. T
his valu
e m
ust b
e assessed o
bjectively (m
ust b
e d
ocu
men
ted b
y the B
ank after b
eing
valued
at m
arket value, b
y an exp
ert or at th
e bo
ok
value)
At least an
nu
ally by th
e CIB
divisio
n (n
ot
available fo
r oth
er bu
siness u
nits)
Very d
etailed q
ualitative (elig
ible assets,
accou
ntin
g m
etho
do
log
y), no
qu
antitative
disclo
sure
SG
No
disclo
sure o
n acco
un
tability. C
ollaterals o
n N
PLs are
capp
ed to
the lo
an n
om
inal valu
e. R
egu
lar assessmen
t mad
e by th
e 1) G
rou
p's
staff or b
y 2) extern
al experts. M
on
itorin
g b
y th
e Intern
al Risk D
epartm
ent.
An
nu
ally G
oo
d q
ualitative, n
o q
uan
titative disclo
sure
Natixis
No
disclo
sure o
n acco
un
tability. C
ollaterals o
n N
PLs are
capp
ed to
the lo
an n
om
inal valu
e. R
egu
lar assessmen
t mad
e by th
e 1) G
rou
p's
staff or b
y 2) extern
al experts. M
on
itorin
g b
y th
e Intern
al Risk D
epartm
ent.
Every H
alf Year
Go
od
qu
alitative, no
qu
antitative d
isclosu
re
Source: D
eutsche Bank, com
pany data

European Banks
Banks
23 November 2017
Page 40 Deutsche Bank AG/London
Figu
re 13
3: B
enelu
x ban
ks – disclo
sure o
f no
n-p
erform
ing
and
past-d
ue lo
ans
NP
Ls C
ollateral to
classify as n
on
-perfo
rmin
g
Pro
vision
s C
overag
e P
ast-du
e perfo
rmin
g
Pu
lling
effect
Su
mm
ary Ben
elux
Data availab
le in th
e AR
. No
prescrip
tive classificatio
n categ
ories.
YE
S
Dep
end
s on
ban
k’s practice
Dep
end
s on
ban
k’s practice
Alw
ays available in
the A
R
Transactio
n ap
pro
ach
KB
C
Disclo
sure availab
le in th
e AR
. NP
Ls are tho
se classified
from
PD
class 10
to 1
2, w
hile N
PLs
are on
ly class 11
and
12
.
N.A
. (We assu
me Y
ES
) 1
) Sp
ecific and
2) G
eneric p
rovisio
ns
2 co
verage ratio
s: 1) sp
ecific p
rovisio
ns / g
ross N
PLs; 2
) to
tal pro
vision
s / gro
ss NP
Ls
Detailed
by m
aturity: <
30
d,
30
d - 9
0d
. (>9
0 d
ays past-
du
e are always n
on
-p
erform
ing
)
Deb
tor ap
pro
ach21
ING
Disclo
sure availab
le in th
e AR
. NP
Ls classified
with
risk rating
20
. N
.A. (W
e assum
e YE
S)
3 typ
es of p
rovisio
ns: 1
) Ind
ividu
ally assessed
on
NP
Ls (sign
ificant
expo
sures); 2
) Co
llectively assessed on
N
PLs (o
ther – IN
SFA
); 3) g
eneric (IB
NR
)
Presen
tation
: To
tal p
rovisio
ns / g
ross N
PLs
Detailed
by m
aturity: 1
d -
30
d, 3
1d
- 60
d, 6
1d
- 90
d.
The first 5
-7 d
ays of arrear
con
sidered
op
eration
al for
retail and
SM
E p
ortfo
lios
Deb
tor ap
pro
ach
AB
N A
mro
Disclo
sure availab
le in th
e AR
. NP
Ls classified
with
risk rating
20
. N
.A. (W
e assum
e YE
S)
3 typ
es of p
rovisio
ns: 1
) Ind
ividu
ally assessed
on
NP
Ls; 2) C
ollectively
assessed o
n N
PLs; 3
) gen
eric
Presen
tation
: To
tal p
rovisio
ns / g
ross N
PLs
Detailed
by m
aturity: 1
d -
30
d, 3
1d
- 60
d, 6
1d
- 90
d.
Deb
tor ap
pro
ach
Source: D
eutsche Bank, com
pany data
21 We quote the 2013 A
R (page 199): “G
iven a past-due trigger event on one exposure, the whole outstanding loans to the specific custom
er are considered past-due or non-performing.”

European Banks
Banks
23 November 2017
Deutsche Bank AG/London Page 41
Figu
re 13
4: B
enelu
x ban
ks – disclo
sure o
f forb
orn
e loan
s Fo
rbo
rne lo
ans (q
ualitative / q
uan
titative info
) C
lassification
Tim
ing
/ con
ditio
n fo
r the tran
sfer to
perfo
rmin
g
Pro
vision
s R
ecent ch
ang
es in classificatio
n
du
e to E
BA
Su
mm
ary Ben
elux
Dep
end
s on
ban
k’s intern
al po
licy 1
. Perfo
rmin
g n
ot p
ast-du
e; 2.
perfo
rmin
g p
ast-du
e; 3.n
on
-p
erform
ing
No
min
imu
m p
eriod
D
epen
d o
n b
ank’s in
ternal p
olicy
N.A
.
KB
C
Disclo
sure is availab
le in th
e AR
(PD
class 9 o
r hig
her – o
nly
som
e min
or ren
ego
tiated retail exp
osu
res can b
e classified
in a class lo
wer th
an 9
)
1. P
erform
ing
no
t past-d
ue; 2
.no
n-
perfo
rmin
g
Cu
ring
(partial) su
bject to
: 1) 1
year fro
m ren
ego
tiation
and
2) cred
it
com
mittee ap
pro
val 22
Pro
vision
s record
ed o
n
reneg
otiated
loan
s do
on
ly refer to
PD
classes 10
or h
igh
er, hen
ce to
no
n-p
erform
ing
expo
sures (th
ou
gh
n
ot classified
as no
n-p
erform
ing
)
In co
ntrast to
20
12
, PD
Class 1
0
are past-d
ue b
y less than
90
days
no
n-p
erform
ing
. In 2
01
4 K
BC
will
be fu
lly com
plian
t with
EB
A ru
les o
n N
PLs (P
D-1
0 ratin
g w
ill be
NP
Ls)
ING
Disclo
sure availab
le in th
e F-20
do
cum
ent
1. P
erform
ing
no
t past-d
ue; 2
.no
n-
perfo
rmin
g
Cu
ring
sub
ject to: 1
) 2 years fro
m
reneg
otiatio
n; 2
) all paym
ents
mad
e; 3) n
o >
30
days arrears
N.A
. IN
G ch
ang
ed rep
orted
forb
orn
e rep
ortin
g (w
atch-list clien
ts) and
p
olicies (E
BA
com
plian
t)
AB
N A
mro
Disclo
sure availab
le in th
e F-20
do
cum
ent
1. P
erform
ing
no
t past-d
ue; 2
.no
n-
perfo
rmin
g
Cu
ring
sub
ject to: 1
) 2 years fro
m
reneg
otiatio
n; 2
) all paym
ents
mad
e; 3) n
o >
30
days arrears
N.A
. IN
G ch
ang
ed rep
orted
forb
orn
e rep
ortin
g (w
atch-list clien
ts) and
p
olicies (E
BA
com
plian
t)
S
ource: Deutsche B
ank, company d
ata
22 In case of PD
class 9 exposures, a better classification may be assigned and the renegotiation tag taken off. For renegotiated exposures in P
D class 10 (or higher), the renegotiated tag is kept and they m
ay only be upgraded to class 9.

European Banks
Banks
23 November 2017
Page 42 Deutsche Bank AG/London
Figu
re 13
5: B
enelu
x ban
ks – disclo
sure o
f collateral
Carryin
g valu
e V
aluatio
n o
f collateral
Frequ
ency o
f up
date in
collateral valu
e D
isclosu
re
Su
mm
ary Ben
elux
Fair value, cap
ped
to th
e loan
no
min
al value
A co
mb
inatio
n o
f pro
fession
al app
raisals, real estate m
arket ind
ices or statistical an
alysts b
ased o
n in
dep
end
ent assesso
rs or b
ank’s
staff
No
prescrip
tive rule
Disclo
sure availab
le in th
e AR
KB
C
Fair value, cap
ped
to th
e loan
no
min
al value
N.A
. A
t least ann
ually
Disclo
sure availab
le in th
e AR
(no
t in in
terim
repo
rts and
presen
tation
)
ING
Fair value, cap
ped
to th
e loan
no
min
al value
Bo
th in
ternal staff (in
dices fo
r residen
tial RE
) an
d in
dep
end
ent exp
erts (com
mercial R
E)
value co
llaterals
At least an
nu
ally (dep
end
s on
the typ
e of
collateral)
Exten
sive disclo
sure in
the F-2
0 D
ocu
men
t (sp
lit mo
rtgag
e and
oth
er collaterals)
AB
N A
mro
Fair value, cap
ped
to th
e loan
no
min
al value
Bo
th in
ternal staff (in
dices fo
r residen
tial RE
) an
d in
dep
end
ent exp
erts (com
mercial R
E)
value co
llaterals
At least an
nu
ally E
xtensive d
isclosu
re in th
e F-20
Do
cum
ent
(split m
ortg
age an
d o
ther co
llaterals)
Source: D
eutsche Bank, com
pany data

European Banks
Banks
23 November 2017
Deutsche Bank AG/London Page 43
Figu
re 13
6: G
erman
ban
ks – disclo
sure o
f no
n-p
erform
ing
and
past-d
ue lo
ans
NP
Ls C
ollateral to
classify as no
n-
perfo
rmin
g
Pro
vision
s C
overag
e P
ast-du
e perfo
rmin
g
Pu
lling
effect
Su
mm
ary Germ
any
Qu
antitative d
ata in A
R. N
o p
rescriptive
classification
catego
ries. Y
ES
D
epen
ds o
n b
ank’s p
ractice D
epen
ds o
n b
ank’s p
ractice C
om
plete d
isclosu
re by
matu
rity – no
thresh
old
Im
plem
entatio
n o
f the d
ebto
r ap
pro
ach n
ot req
uired
Co
mm
erzban
k
Qu
antitative d
ata in A
R.
N.A
. (We assu
me Y
ES
, given
g
eneral ru
le) 1
) Sp
ecific pro
vision
s (sum
of
SLLP
s and
PLLS
s); 2) g
eneric
pro
vision
s (GL
LPs)
AR
– 2 co
verage ratio
s: 1.
(specific +
gen
eric pro
vision
s +
collateral) / g
ross n
on
-p
erform
ing
; 2) (sp
ecific p
rovisio
ns +
collateral) / g
ross
no
n-p
erform
ing
AR
- Co
mp
lete set of
info
rmatio
n b
y matu
rity: <
=3
0d
, 31
d – 6
0d
, 61
d – 90
d,
>9
0d
Deb
tor ap
pro
ach o
n all
po
rtfolio
s
Aareal B
ank
Qu
antitative d
ata in A
R.
N.A
. (We assu
me Y
ES
, given
g
eneral ru
le) 1
) Sp
ecific pro
vision
s (sum
of
SLLP
s and
PLLS
s); 2) g
eneric
pro
vision
s (GL
LPs)
AR
– 2 co
verage ratio
s: 1.
(specific +
gen
eric pro
vision
s +
collateral) / g
ross n
on
-p
erform
ing
; 2) (sp
ecific p
rovisio
ns +
collateral) / g
ross
no
n-p
erform
ing
AR
- Co
mp
lete set of
info
rmatio
n b
y matu
rity: <
=3
0d
, 31
d – 6
0d
, 61
d – 90
d,
>9
0d
Deb
tor ap
pro
ach o
n all
po
rtfolio
s
PB
B
Qu
antitative d
ata in A
R.
N.A
. (We assu
me Y
ES
, given
g
eneral ru
le) 1
) Sp
ecific pro
vision
s (sum
of
SLLP
s and
PLLS
s); 2) g
eneric
pro
vision
s (GL
LPs)
AR
– 2 co
verage ratio
s: 1.
(specific +
gen
eric pro
vision
s +
collateral) / g
ross n
on
-p
erform
ing
; 2) (sp
ecific p
rovisio
ns +
collateral) / g
ross
no
n-p
erform
ing
HY
- Co
mp
lete set of
info
rmatio
n b
y matu
rity: <
=3
0d
, 31
d – 6
0d
, 61
d – 90
d,
>9
0d
Deb
tor ap
pro
ach o
n all
po
rtfolio
s
Source: D
eutsche Bank, com
pany data

European Banks
Banks
23 November 2017
Page 44 Deutsche Bank AG/London
Figu
re 13
7: G
erman
ban
ks – disclo
sure o
f forb
orn
e loan
s Fo
rbo
rne lo
ans (q
ualitative / q
uan
titative info
) C
lassification
Tim
ing
/ con
ditio
n fo
r the tran
sfer to
perfo
rmin
g
Pro
vision
s R
ecent ch
ang
es in classificatio
n d
ue
to E
BA
Su
mm
ary Germ
any
Dep
end
s on
ban
k’s intern
al po
licy N
o sp
ecific rule.
No
min
imu
m p
eriod
/ after restru
cturin
g is co
mp
leted, th
e loan
is n
o lo
ng
er con
sidered
no
n-p
erform
ing
Dep
end
on
ban
k’s intern
al po
licy N
o recen
t requ
iremen
ts’ up
date
Co
mm
erzban
k
Qu
antitative d
isclosu
re no
t available. Lim
ited
info
rmatio
n o
n acco
un
tability in
the A
R
No
n-p
erform
ing
(inclu
ded
in N
PLs)
No
specific tim
e ho
rizon
. Cu
ring
su
bject to
the B
ank’s assessm
ent o
f th
e custo
mer’s likelih
oo
d to
com
ply
with
futu
re paym
ents.
Bo
th 1
) specific an
d 2
) gen
eric (i.e. G
LLPs) p
rovisio
ns are rep
orted
N
o recen
t chan
ge h
as been
im
plem
ented
Aareal B
ank
Qu
antitative d
isclosu
re no
t available. Lim
ited
info
rmatio
n o
n acco
un
tability in
the A
R
No
n-p
erform
ing
(inclu
ded
in N
PLs)
No
specific tim
e ho
rizon
. Cu
ring
su
bject to
the B
ank’s assessm
ent o
f th
e custo
mer’s likelih
oo
d to
com
ply
with
futu
re paym
ents.
Bo
th 1
) specific an
d 2
) gen
eric (i.e. G
LLPs) p
rovisio
ns are rep
orted
N
o recen
t chan
ge h
as been
im
plem
ented
PB
B
Qu
antitative d
isclosu
re no
t available. Lim
ited
info
rmatio
n o
n acco
un
tability in
the A
R
No
n-p
erform
ing
(inclu
ded
in N
PLs)
No
specific tim
e ho
rizon
. Cu
ring
su
bject to
the B
ank’s assessm
ent o
f th
e custo
mer’s likelih
oo
d to
com
ply
with
futu
re paym
ents.
Bo
th 1
) specific an
d 2
) gen
eric (i.e. G
LLPs) p
rovisio
ns are rep
orted
N
o recen
t chan
ge h
as been
im
plem
ented
S
ource: Deutsche B
ank, company d
ata

European Banks
Banks
23 November 2017
Deutsche Bank AG/London Page 45
Figu
re 13
8: G
erman
ban
ks – disclo
sure o
f collateral
Carryin
g valu
e V
aluatio
n o
f collateral
Frequ
ency o
f up
date in
collateral valu
e D
isclosu
re
Su
mm
ary Germ
any
Fair value, n
ot cap
ped
to th
e loan
no
min
al value (u
nless fo
r real estate, i.e. resid
ential m
ortg
age co
llateral is always
capp
ed)
No
gen
eral rule. V
aluatio
n p
erform
ed b
y either
1) b
anks’ o
wn
staff or 2
) external exp
erts23
Reg
ulato
ry requ
iremen
ts com
plian
t with
CR
D
(on
e year / three years).
Pillar 3
requ
iremen
ts explicitly ad
dress
qu
alitative and
qu
antitative in
form
ation
on
co
llateral.
Co
mm
erzban
k
Fair value, n
ot cap
ped
to th
e loan
no
min
al value
1) E
xternal co
un
terparties assess larg
e exp
osu
res; 2) sm
aller are assessed in
ternally
At least every q
uarter (N
PLs m
ay be assessed
m
on
thly)..
Qu
antitative d
isclosu
re in A
R, in
terim rep
orts
and
presen
tation
. No
qu
alitative disclo
sure.
Main
ly real estate and
ship
mo
rtgag
es.
Aareal B
ank
Fair value, n
ot cap
ped
to th
e loan
no
min
al value
1) E
xternal co
un
terparties assess larg
e exp
osu
res; 2) sm
aller are assessed in
ternally
N.A
. Q
uan
titative disclo
sure in
AR
, interim
repo
rts an
d p
resentatio
n. N
o q
ualitative d
isclosu
re. M
ainly real estate an
d sh
ip m
ortg
ages.
PB
B
Fair value, n
ot cap
ped
to th
e loan
no
min
al value
1) E
xternal co
un
terparties assess larg
e exp
osu
res; 2) sm
aller are assessed in
ternally
N.A
. Q
uan
titative disclo
sure in
AR
, interim
repo
rts an
d p
resentatio
n. N
o q
ualitative d
isclosu
re. M
ainly real estate an
d sh
ip m
ortg
ages.
Source: D
eutsche Bank, com
pany data
23 For regulatory purposes and real estate collateral there are specific requirements for valuation (B
elWertV).
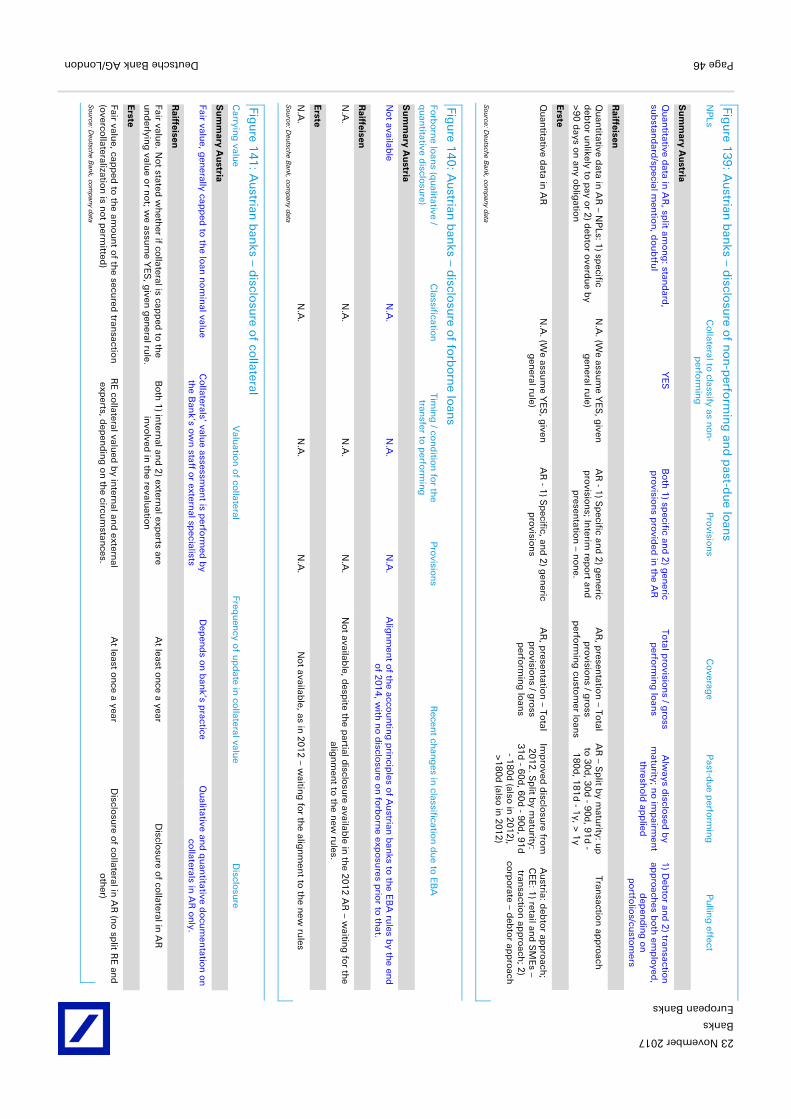
European Banks
Banks
23 November 2017
Page 46 Deutsche Bank AG/London
Figu
re 13
9: A
ustrian
ban
ks – disclo
sure o
f no
n-p
erform
ing
and
past-d
ue lo
ans
NP
Ls C
ollateral to
classify as no
n-
perfo
rmin
g
Pro
vision
s C
overag
e P
ast-du
e perfo
rmin
g
Pu
lling
effect
Su
mm
ary Au
stria
Qu
antitative d
ata in A
R, sp
lit amo
ng
: stand
ard,
sub
stand
ard/sp
ecial men
tion
, do
ub
tful
YE
S
Bo
th 1
) specific an
d 2
) gen
eric p
rovisio
ns p
rovid
ed in
the A
R
Total p
rovisio
ns / g
ross
perfo
rmin
g lo
ans
Alw
ays disclo
sed b
y m
aturity; n
o im
pairm
ent
thresh
old
app
lied
1) D
ebto
r and
2) tran
saction
ap
pro
aches b
oth
emp
loyed
, d
epen
din
g o
n
po
rtfolio
s/custo
mers
Raiffeisen
Qu
antitative d
ata in A
R – N
PLs: 1
) specific
deb
tor u
nlikely to
pay o
r 2) d
ebto
r overd
ue b
y >
90
days o
n an
y ob
ligatio
n
N.A
. (We assu
me Y
ES
, given
g
eneral ru
le) A
R - 1
) Sp
ecific and
2) g
eneric
pro
vision
s; Interim
repo
rt and
p
resentatio
n – n
on
e.
AR
, presen
tation
– Total
pro
vision
s / gro
ss p
erform
ing
custo
mer lo
ans
AR
– Sp
lit by m
aturity: u
p
to 3
0d
, 30
d - 9
0d, 9
1d
- 1
80
d, 1
81
d - 1
y, > 1
y
Transactio
n ap
pro
ach
Erste
Qu
antitative d
ata in A
R
N.A
. (We assu
me Y
ES
, given
g
eneral ru
le) A
R - 1
) Sp
ecific, and
2) g
eneric
pro
vision
s A
R, p
resentatio
n – To
tal p
rovisio
ns / g
ross
perfo
rmin
g lo
ans
Imp
roved
disclo
sure fro
m
20
12
. Sp
lit by m
aturity:
31
d - 6
0d
, 60
d - 9
0d, 9
1d
- 1
80
d (also
in 2
01
2),
>1
80
d (also
in 2
01
2)
Au
stria: deb
tor ap
pro
ach;
CE
E: 1
) retail and
SM
Es –
transactio
n ap
pro
ach; 2
) co
rpo
rate – deb
tor ap
pro
ach
Source: D
eutsche Bank, com
pany data
Figu
re 14
0: A
ustrian
ban
ks – disclo
sure o
f forb
orn
e loan
s Fo
rbo
rne lo
ans (q
ualitative /
qu
antitative d
isclosu
re) C
lassification
Tim
ing
/ con
ditio
n fo
r the
transfer to
perfo
rmin
g
Pro
vision
s R
ecent ch
ang
es in classificatio
n d
ue to
EB
A
Su
mm
ary Au
stria
No
t available
N.A
. N
.A.
N.A
. A
lign
men
t of th
e accou
ntin
g p
rincip
les of A
ustrian
ban
ks to th
e EB
A ru
les by th
e end
o
f 20
14
, with
no
disclo
sure o
n fo
rbo
rne exp
osu
res prio
r to th
at.
Raiffeisen
N.A
. N
.A.
N.A
. N
.A.
No
t available, d
espite th
e partial d
isclosu
re available in
the 2
01
2 A
R – w
aiting
for th
e alig
nm
ent to
the n
ew ru
les.
Erste
N.A
. N
.A.
N.A
. N
.A.
No
t available, as in
20
12
– waitin
g fo
r the alig
nm
ent to
the n
ew ru
les S
ource: Deutsche B
ank, company d
ata
Figu
re 14
1: A
ustrian
ban
ks – disclo
sure o
f collateral
Carryin
g valu
e V
aluatio
n o
f collateral
Frequ
ency o
f up
date in
collateral valu
e D
isclosu
re
Su
mm
ary Au
stria
Fair value, g
enerally cap
ped
to th
e loan
no
min
al value
Co
llaterals’ value assessm
ent is p
erform
ed b
y th
e Ban
k’s ow
n staff o
r external sp
ecialists D
epen
ds o
n b
ank’s p
ractice Q
ualitative an
d q
uan
titative do
cum
entatio
n o
n
collaterals in
AR
on
ly.
Raiffeisen
Fair value. N
ot stated
wh
ether if co
llateral is capp
ed to
the
un
derlyin
g valu
e or n
ot; w
e assum
e YE
S, g
iven g
eneral ru
le. B
oth
1) in
ternal an
d 2
) external exp
erts are in
volved
in th
e revaluatio
n
At least o
nce a year
Disclo
sure o
f collateral in
AR
Erste
Fair value, cap
ped
to th
e amo
un
t of th
e secured
transactio
n
(overco
llateralization
is no
t perm
itted)
RE
collateral valu
ed b
y intern
al and
external
experts, d
epen
din
g o
n th
e circum
stances.
At least o
nce a year
Disclo
sure o
f collateral in
AR
(no
split R
E an
d
oth
er) S
ource: Deutsche B
ank, company d
ata

23 November 2017
Banks
European Banks
Deutsche Bank AG/London Page 47
NPL database
NPLs by bank – banks’ disclosure
Figure 142: Italy – overview of NPLs data (1/2) Euro m 2011 2012 2013 2014 2015 2016 9M-17
UCG
Gross NPLs 72,531 79,787 83,590 84,325 77,838 56,342 51,279
Provisions 32,347 35,729 43,844 43,226 39,571 31,347 28,959
Net NPLs 40,184 44,058 39,746 41,099 38,267 24,995 22,320
Coverage 45% 45% 52% 51% 51% 56% 56%
Collateral 41,077 59,147 59,443 64,030 29,068 20,446 n.a.
o/w real 33,644 51,519 52,919 57,477 23,605 16,876 n.a.
o/w other 7,433 7,627 6,524 6,553 5,463 3,570 n.a.
Gross loans 594,810 585,708 530,456 516,341 517,255 478,146 481,594
Gross NPL ratio 12.2% 13.6% 15.8% 16.3% 15.0% 11.8% 10.6%
Net loans 559,553 547,144 483,684 470,569 417,793 417,868 421,064
Net NPL ratio 7.2% 8.1% 8.2% 8.7% 9.2% 6.0% 5.3%
Generic provisions 2,835 3,600 2,505 2,417 2,848 2,124
ISP
Gross NPLs 41,798 49,673 57,342 62,838 63,114 58,137 53,607
Provisions 19,102 21,201 26,355 29,522 30,028 28,370 26,541
Net NPLs 22,696 28,472 30,987 33,316 33,086 29,767 27,066
Coverage 46% 43% 46% 47% 48% 49% 50%
Collateral 31,985 43,352 52,635 62,432 25,316 23,063 n.a.
o/w real 27,822 38,155 47,229 56,060 21,064 19,260 n.a.
o/w other 4,163 5,197 5,406 6,372 4,252 3,803 n.a.
Gross loans 399,807 400,770 372,890 371,147 382,305 394,918 418,789
Gross NPL ratio 10.5% 12.4% 15.4% 16.9% 16.5% 14.7% 12.8%
Net loans 376,744 376,625 343,789 339,002 350,010 364,713 390,394
Net NPL ratio 6.0% 7.6% 9.0% 9.8% 9.5% 8.2% 6.9%
Generic provisions 2,600 2,748 2,660 2,198 1,766 1,854
MPS
Gross NPLs 23,013 29,506 36,062 45,324 46,861 45,785 45,014
Provisions 9,533 12,108 15,062 22,182 22,707 25,466 29,872
Net NPLs 13,480 17,398 21,000 23,142 24,154 20,320 15,142
Coverage 41% 41% 42% 49% 48% 56% 66%
Collateral 23,788 36,046 42,505 58,321 18,753 15,876 n.a.
o/w real 14,397 22,691 27,196 37,261 15,082 12,881 n.a.
o/w other 9,391 13,355 15,309 21,060 3,671 2,995 n.a.
Gross loans 156,917 154,929 146,932 142,773 134,730 132,846 126,328
Gross NPL ratio 14.7% 19.0% 24.5% 31.7% 34.8% 34.5% 35.6%
Net loans 146,608 142,015 130,598 119,676 111,366 106,693 91,041
Net NPL ratio 9.2% 12.3% 16.1% 19.3% 21.7% 19.0% 16.6%
Generic provisions 715 666 904 714 737 556 Source: Deutsche Bank, company data. (*) ISP: figures including VB & BPVI

23 November 2017
Banks
European Banks
Page 48 Deutsche Bank AG/London
Figure 143: Italy – overview of NPLs data (2/2) Euro m 2011 2012 2013 2014 2015 2016 9M-17
Banco BPM
Gross NPLs 16,954 20,453 24,562 27,518 26,642 25,914 27,491
Provisions 4,469 5,791 7,111 9,670 8,961 9,710 13,501
Net NPLs 12,485 14,662 17,451 17,848 17,681 16,204 13,990
Coverage 26% 28% 29% 35% 34% 37% 49%
Collateral 22,028 29,742 39,202 44,187 14,705 13,715 n.a.
o/w real 14,012 17,894 24,838 28,031 12,904 12,238 n.a.
o/w other 8,016 11,849 14,364 16,156 1,801 1,477 n.a.
Gross loans 134,326 132,663 127,048 122,205 126,854 125,834 121,792
Gross NPL ratio 12.6% 15.4% 19.3% 22.5% 21.0% 20.6% 22.6%
Net loans 129,080 126,272 119,494 111,903 112,609 110,611 107,900
Net NPL ratio 9.7% 11.6% 14.6% 15.9% 15.7% 14.6% 13.0%
Generic provisions 602 518 633 513 408 391
UBI
Gross NPLs 8,589 10,959 12,675 13,049 13,435 12,521 14,033
Provisions 2,309 2,853 3,362 3,540 3,746 4,466 5,614
Net NPLs 6,280 8,106 9,313 9,509 9,689 8,056 8,419
Coverage 27% 26% 27% 27% 28% 36% 40%
Collateral 15,626 20,513 25,571 26,360 7,862 6,866 n.a.
o/w real 9,002 11,768 15,589 15,245 6,432 5,995 n.a.
o/w other 6,623 8,745 9,982 11,115 1,429 871 n.a.
Gross loans 102,541 96,212 92,265 89,667 88,748 86,699 99,919
Gross NPL ratio 8.4% 11.4% 13.7% 14.6% 15.1% 14.4% 14.0%
Net loans 99,690 92,888 88,421 85,644 84,586 81,854 93,880
Net NPL ratio 6.3% 8.7% 10.5% 11.1% 11.5% 9.8% 9.0%
Generic provisions 470 482 482 417 379 425
Credem
Gross NPLs 931 1,100 1,285 1,344 1,431 1,403 1,395
Provisions 333 385 497 547 638 596 612
Net NPLs 598 715 788 797 793 807 783
Coverage 36% 35% 39% 41% 45% 43% 44%
Collateral 443 1,922 2,293 2,565 703 720 n.a.
o/w real 369 1,243 1,490 1,688 668 687 n.a.
o/w other 74 679 803 877 35 33 n.a.
Gross loans 19,416 21,056 20,467 22,290 23,809 24,353
Gross NPL ratio 4.8% 5.2% 6.3% 6.0% 6.0% 5.8% 5.8%
Net loans 19,995 20,009 19,938 21,695 23,093 23,687 23,474
Net NPL ratio 3.0% 3.6% 4.0% 3.7% 3.4% 3.4% 3.3%
Generic provisions 54 58 69 78 69 73 Source: Deutsche Bank, company data. (*) UBI: figures including the 3GB.

23 November 2017
Banks
European Banks
Deutsche Bank AG/London Page 49
Figure 144: Iberia – overview of NPLs data (1/3) Euro m 2011 2012 2013 2014 2015 2016 9M-17
Santander
Gross NPLs 32,036 36,100 42,420 41,709 37,094 33,643 51,257
Provisions 19,661 26,194 27,526 28,046 27,121 24,835 33,830
Net NPLs 12,375 9,906 14,894 13,663 9,973 8,808 17,427
Coverage 61% 73% 65% 67% 73% 74% 66%
Gross foreclosed assets 11,157 10,608 10,732 9,680
Provisions 6,087 5,945 5,626 5,100
Net foreclosed assets 5,070 4,663 5,106 4,580
Coverage 55% 56% 52% 53%
Gross NPAs 32,036 36,100 42,420 52,866 47,702 44,375 60,937
Provisions 19,661 26,194 27,526 34,133 33,066 30,461 38,930
Net NPAs 12,375 9,906 14,894 18,733 14,636 13,915 22,007
Coverage 61% 73% 65% 65% 69% 69% 64%
Gross loans 722,207 693,882 750,865 797,595 777,537 855,773
Gross NPA ratio 5.0% 6.1% 7.0% 6.0% 5.7% 7.1%
Net loans 737,319 708,473 666,356 722,819 770,474 752,702 821,943
Net NPA ratio 1.7% 1.4% 2.2% 2.6% 1.9% 1.8% 2.7%
BBVA
Gross NPLs 15,866 20,409 25,978 23,234 25,996 23,595 20,932
Provisions 9,678 9,752 15,538 14,833 19,750 16,207 15,042
Net NPLs 6,188 10,657 10,440 8,401 6,246 7,388 5,890
Coverage 61% 48% 60% 64% 76% 69% 72%
Gross foreclosed assets 13,016 15,243 14,205 11,937
Provisions 6,885 8,729 8,884 7,418
Net foreclosed assets 6,131 6,514 5,321 4,519
Coverage 53% 57% 63% 62%
Gross NPAs 15,866 20,409 25,978 36,250 41,239 37,800 32,869
Provisions 9,678 9,752 15,538 21,718 28,479 25,091 22,460
Net NPAs 6,188 10,657 10,440 14,532 12,760 12,709 10,409
Coverage 61% 48% 60% 60% 69% 66% 68%
Gross loans 350,239 354,973 336,759 366,536 432,855 430,474 416,776
Gross NPA ratio 4.5% 5.7% 7.7% 9.9% 9.5% 8.8% 7.9%
Net loans 351,900 355,271 334,744 351,755 414,165 414,500 401,734
Net NPA ratio 1.8% 3.0% 3.1% 4.1% 3.1% 3.1% 2.6%
Bankia
Gross NPLs 14,931 18,831 19,005 15,706 12,995 11,476 10,194
Provisions 7,453 11,129 10,708 9,086 7,794 5,918 5,480
Net NPLs 7,479 7,702 8,297 6,621 5,201 5,558 4,714
Coverage 50% 59% 56% 58% 60% 52% 54%
Gross foreclosed assets 4,185 3,547 4,098 4,225 3,874 3,449 3,149
Provisions 2,003 1,225 1,442 1,348 1,185 1,198 1,067
Net foreclosed assets 2,182 2,322 2,656 2,877 2,689 2,251 2,082
Coverage 48% 35% 35% 32% 31% 35% 34%
Gross NPAs 19,116 22,378 23,103 19,931 16,869 14,925 13,343
Provisions 9,456 12,354 12,150 10,434 8,979 7,116 6,547
Net NPAs 9,660 10,024 10,953 9,498 7,890 7,809 6,796
Coverage 49% 55% 53% 52% 53% 48% 49%
Gross loans 145,784 129,821 121,782 117,977 110,595 108,573
Gross NPA ratio 15.4% 17.8% 16.4% 14.3% 13.5% 12.3%
Net loans 186,092 134,137 119,116 112,691 110,570 104,677 103,479
Net NPL ratio 4.0% 5.7% 7.0% 5.9% 4.7% 5.3% 4.6% Source: Deutsche Bank, company data

23 November 2017
Banks
European Banks
Page 50 Deutsche Bank AG/London
Figure 145: Iberia – overview of NPLs data (2/3) Euro m 2011 2012 2013 2014 2015 2016 9M-17
Bankinter
Gross NPLs 1,516 1,984 2,275 2,233 2,039 2,297 2,151
Provisions 671 959 957 953 856 1,131 1,031
Net NPLs 844 1,026 1,319 1,280 1,183 1,166 1,120
Coverage 44% 48% 42% 43% 42% 49% 48%
Gross foreclosed assets 612 628 586 531 523 471
Provisions 231 259 229 213 220 210
Net foreclosed assets 381 369 357 318 303 260
Coverage 38% 41% 39% 40% 42% 45%
Gross NPAs 1,516 2,596 2,903 2,819 2,571 2,820 2,622
Provisions 671 1,189 1,215 1,182 1,069 1,351 1,241
Net NPAs 844 1,407 1,688 1,636 1,501 1,469 1,381
Coverage 44% 46% 42% 42% 42% 48% 47%
Gross loans 43,029 42,165 43,405 45,043 52,290 53,234
Gross NPA ratio 6.0% 6.9% 6.5% 5.7% 5.4% 4.9%
Net loans 47,167 42,060 41,196 42,447 44,183 51,185 52,243
Net NPA ratio 1.8% 3.3% 4.1% 3.9% 3.4% 2.9% 2.6%
Banco Sabadell
Gross NPLs 4,877 11,995 16,136 14,193 12,561 9,746 8,346
Provisions 2,276 12,561 12,542 7,716 6,610 4,921 4,192
Net NPLs 2,600 -566 3,594 6,477 5,952 4,825 4,154
Coverage 47% 105% 78% 54% 53% 50% 50%
Gross foreclosed assets 8,047 8,827 9,234 9,035 8,763
Provisions 3,042 3,240 4,063 4,297 4,746
Net foreclosed assets 5,005 5,587 5,171 4,738 4,017
Coverage 38% 37% 44% 48% 54%
Gross NPAs 4,877 11,995 24,183 23,020 21,796 18,781 17,109
Provisions 2,276 12,561 15,584 10,955 10,673 9,218 8,938
Net NPAs 2,600 -566 8,599 12,065 11,123 9,563 8,171
Coverage 47% 105% 64% 48% 49% 49% 52%
Gross loans 121,257 117,979 153,554 150,198 148,348
Gross NPA ratio 19.9% 19.5% 14.2% 12.5% 11.5%
Net loans 72,654 109,348 112,929 110,836 140,018 140,266 137,224
Net NPA ratio 3.6% -0.5% 7.6% 10.9% 7.9% 6.8% 6.0%
CaixaBank
Gross NPLs 9,486 20,150 25,365 20,110 17,100 14,754 15,286
Provisions 11,934 12,564 14,982 10,595 9,512 6,880 7,630
Net NPLs -2,447 7,586 10,383 9,515 7,588 7,874 7,656
Coverage 126% 62% 59% 53% 56% 47% 50%
Gross foreclosed assets 9,328 13,284 11,274 17,123 15,496 14,596
Provisions 4,240 7,115 8,206 9,864 9,240 8,473
Net foreclosed assets 5,088 6,169 3,068 7,259 6,256 6,123
Coverage 45% 54% 73% 58% 60% 58%
Gross NPAs 9,486 29,478 38,649 31,384 34,223 30,250 29,882
Provisions 11,934 16,804 22,097 18,801 19,376 16,120 16,103
Net NPAs -2,447 12,674 16,552 12,583 14,847 14,130 13,779
Coverage 126% 57% 57% 60% 57% 53% 54%
Gross loans 224,605 212,900 197,185 206,437 204,857 225,166
Gross NPA ratio 13.1% 18.2% 15.9% 16.6% 14.8% 13.3%
Net loans 181,940 213,436 198,079 188,762 197,274 198,173 217,821
Net NPA ratio -1.3% 3.6% 5.2% 5.0% 3.8% 4.0% 3.5% Source: Deutsche Bank, company data

23 November 2017
Banks
European Banks
Deutsche Bank AG/London Page 51
Figure 146: Iberia – overview of NPLs data (3/3) Euro m 2014 2015 2016 9M-17
Unicaja Banco
Gross NPLs 4,814 3,555 3,215 2,833
Provisions 2,978 2,033 1,607 1,417
Net NPLs 1,836 1,522 1,608 1,416
Coverage 62% 57% 50% 50%
Gross foreclosed assets 2,567 2,698 2,567 2,131
Provisions 1,453 1,568 1,594 1,349
Net foreclosed assets 1,114 1,130 973 782
Coverage 57% 58% 62% 63%
Gross NPAs 7,381 6,253 5,782 4,964
Provisions 4,431 3,601 3,201 2,766
Net NPAs 2,950 2,652 2,581 2,198
Coverage 60% 58% 55% 56%
Gross loans 35,433 32,730 31,397
Gross NPA ratio 17.6% 17.7% 15.8%
Net loans 33,246 31,878 31,122 29,980
Net NPA ratio 8.9% 8.3% 8.3% 7.3%
BCP
Gross NPLs 6,783 6,051 5,385 4,729
Provisions 2,887 2,609 2,223
Net NPLs 3,164 2,776 2,506
Coverage 48% 48% 47%
Other NPEs (gross) 4,988 4,530 3994 3,350
Provisions 533 1,132 1,106
Other NPEs (net) 3,997 2,862 2,244
Coverage 12% 28% 33%
Gross NPAs 11,771 10,581 9,379 8,079
Provisions 3,478 3,420 3,741 3,363
Net NPAs 8,293 7,161 5,638 4,716
Coverage 30% 32% 40% 42%
Gross loans 57,169 55,438 51,759 50,754
Gross NPA ratio 20.6% 19.1% 18.1% 15.9%
Net loans 53,686 51,970 48,018 47,990
Net NPA ratio 15.4% 13.8% 11.7% 9.8% Source: Deutsche Bank, company data

23 November 2017
Banks
European Banks
Page 52 Deutsche Bank AG/London
Figure 147: Ireland – overview of NPLs data (as of H1-17) Euro m 2011 2012 2013 2014 2015 2016 H1-17
Allied Irish banks
Gross NPLs 17,968 14,072 12,140
Provisions 6,832 4,589 4,106
Net NPLs 11,136 9,483 8,034
Coverage 38% 33% 34%
Collateral
o/w real
o/w other
Gross loans 70,163 65,228 63,928
Gross NPL ratio 25.6% 21.6% 19.0%
Net loans 63,331 62,116 60,815
Net NPL ratio 17.6% 15.3% 13.2%
Generic provisions n.a. n.a. n.a.
Bank of Ireland
Gross NPLs 15,442 17,702 17,125 14,340 10,544 9,430 8,067
Provisions 6,365 7,544 8,241 7,423 5,886 3,885 3,210
Net NPLs 9,077 10,158 8,884 6,917 4,658 5,545 4,857
Coverage 41% 43% 48% 52% 56% 41% 40%
Collateral
o/w real
o/w other
Gross loans 108,102 100,165 92,755 89,540 90,595 82,362 80,105
Gross NPL ratio 14.3% 17.7% 18.5% 16.0% 11.6% 11.4% 10.1%
Net loans 101,737 92,621 84,514 82,117 84,709 78,477 76,895
Net NPL ratio 8.9% 11.0% 10.5% 8.4% 5.5% 7.1% 6.3%
Generic provisions n.a. n.a. n.a. n.a. n.a. n.a. n.a.
Permanent tsb
Gross NPLs 5,299 6,756 8,803 8,308 6,081 5,850 5,782
Provisions 2,095 2,923 3,865 3,584 2,606 2,423 2,425
Net NPLs 3,204 3,833 4,938 4,724 3,475 3,427 3,357
Coverage 40% 43% 44% 43% 43% 41% 42%
Collateral
o/w real
o/w other
Gross loans 35,772 34,681 33,326 31,820 25,727 21,309 21,014
Gross NPL ratio 14.8% 19.5% 26.4% 26.1% 23.6% 27.5% 27.5%
Net loans 33,677 31,758 29,461 28,236 23,121 18,886 18,589
Net NPL ratio 9.5% 12.1% 16.8% 16.7% 15.0% 18.1% 18.1%
Generic provisions n.a. n.a. n.a. n.a. n.a. n.a. n.a. Source: Deutsche Bank, company data

23 November 2017
Banks
European Banks
Deutsche Bank AG/London Page 53
Figure 148: Nordics – overview of NPLs data (1/2) SEK m 2011 2012 2013 2014 2015 2016 9M-17
SEB
Gross NPLs (*) 10,644 8,001 4,931 6,791 5,105 5,046 4,848
Provisions 7,619 5,955 4,283 4,221 3,348 3,467 3,521
Net NPLs 3,025 2,046 648 2,570 1,757 1,579 1,327
Coverage 72% 74% 87% 62% 66% 69% 73%
Gross loans 1,197,024 1,244,957 1,309,103 1,361,837 1,358,264 1,457,808
Gross NPL ratio 0.9% 0.6% 0.4% 0.5% 0.4% 0.3%
Net loans 1,186,223 1,236,088 1,302,568 1,355,680 1,353,386 1,453,019 1,516,611
Net NPL ratio 0.3% 0.2% 0.0% 0.2% 0.1% 0.1% 0.1%
Generic provisions 2,914 2,252 1,936 1,530 1,322 1,350
Swedbank
Gross NPLs 24,805 13,938 7,499 6,281 6,035 8,095 7,867
Provisions 12,820 7,076 2,818 2,197 2,424 2,707 2,985
Net NPLs 11,985 6,862 4,681 4,084 3,611 5,388 4,882
Coverage 52% 51% 38% 35% 40% 33% 38%
Gross loans 1,213,660 1,245,755 1,270,138 1,407,773 1,419,486 1,512,686
Gross NPL ratio 2.0% 1.1% 0.6% 0.4% 0.4% 0.5%
Net loans 1,211,454 1,238,864 1,264,910 1,404,507 1,413,955 1,507,247 1,525,393
Net NPL ratio 1.0% 0.6% 0.4% 0.3% 0.3% 0.4% 0.3%
Generic provisions 1,546 1,256 1,133 957 1,048 988
Nordea (Euro m)
Gross NPLs 5,125 6,905 6,564 6,425 5,960 5,550 5,618
Provisions 2,471 2,400 2,397 2,329 2,213 1,913 1,951
Net NPLs 2,654 4,505 4,167 4,096 3,747 3,637 3,667
Coverage 48% 35% 37% 36% 37% 34% 35%
Gross loans 339,646 349,071 345,243 350,832 343,582 320,113
Gross NPL ratio 1.5% 2.0% 1.9% 1.8% 1.7% 1.7%
Net loans 337,203 346,251 342,451 348,085 340,920 317,689 320,052
Net NPL ratio 0.8% 1.3% 1.2% 1.2% 1.1% 1.7% 1.8%
Generic provisions 448 422 420 451 513 496
Handelsbanken
Gross NPLs 6,858 7,325 6,944 8,702 8,844 7,746 7,594
Provisions 3,680 4,128 3,903 4,111 4,816 4,643 4,430
Net NPLs 3,178 3,197 3,041 4,591 4,028 3,103 3,164
Coverage 54% 56% 56% 47% 54% 60% 58%
Gross loans 1,595,289 1,684,607 1,700,242 1,811,947 1,871,283 1,968,265
Gross NPL ratio 0.4% 0.4% 0.4% 0.5% 0.5% 0.4%
Net loans 1,591,128 1,680,479 1,696,339 1,807,836 1,866,467 1,963,622 1,991,434
Net NPL ratio 0.2% 0.2% 0.2% 0.3% 0.2% 0.2% 0.2%
Generic provisions n.a. n.a. n.a. n.a. n.a. Source: Deutsche Bank, company data. (*) It includes forborne loans

23 November 2017
Banks
European Banks
Page 54 Deutsche Bank AG/London
Figure 149: Nordics – overview of NPLs data (2/2) SEK m 2011 2012 2013 2014 2015 2016 9M-17
Danske (DKK m)
Gross NPLs 113,272 114,268 78,894 72,003 56,181 45,954 42,397
Provisions 44,472 43,977 43,123 36,148 26,201 20,772 19,569
Net NPLs 68,800 70,291 35,771 35,855 29,980 25,182 22,828
Coverage 39% 38% 55% 50% 47% 45% 46%
Collateral n.a. 56,590 46,742 24,700 19,800 18,000 15,661
o/w real 47,649 39,544
o/w other 8,941 7,198
Gross loans 2,207,500 2,301,300 2,345,900 2,552,300
Gross NPL ratio 3.6% 3.1% 2.4% 1.8%
Net loans 1,698,025 1,670,962 1,601,571 1,595,864 1,609,384 1,689,155 1,705,483
Net NPL ratio 4.1% 4.2% 2.2% 2.2% 1.9% 1.5% 1.3%
Generic provisions 3,815 3,776 4,798 5,211 5,384 5,278
DNB (NOK m)
Gross NPLs 27,625 23,733 20,184 32,458 29,993
Provisions 12,370 11,929 11,192 15,615 15,554
Net NPLs 15,255 11,804 8,992 16,843 14,439
Coverage 45% 50% 55% 48% 52%
Collateral 16,062 13,551 15,198 24,355 22,786
o/w real
o/w other
Gross loans 1,343,146 1,440,978 1,545,271 1,513,566
Gross NPL ratio 2.1% 1.6% 1.3% 2.1%
Net loans 1,340,831 1,438,839 1,542,744 1,509,078 1,531,096
Net NPL ratio 1.1% 0.8% 0.6% 1.1% 0.9%
Generic provisions n.a. n.a. n.a. n.a. n.a. Source: Deutsche Bank, company data

23 November 2017
Banks
European Banks
Deutsche Bank AG/London Page 55
Figure 150: Switzerland – overview of NPLs data CHF m 2011 2012 2013 2014 2015 2016 9M-17
UBS
Gross NPLs 1,192 1,192 1,225 972 958
Provisions 671 695 689 596 619
Net NPLs 521 497 536 376 339
Coverage 56% 58% 56% 61% 65%
Collateral 318 180 163 n.a. n.a.
o/w real
o/w other
Gross loans 287,665 316,452 312,643 306,921
Gross NPL ratio 0.4% 0.4% 0.4% 0.3%
Net loans 286,959 315,757 311,954 306,325 314,536
Net NPL ratio 0.2% 0.2% 0.2% 0.1% 0.1%
Generic provisions n.a. n.a. n.a. n.a. n.a.
CS
Gross NPLs 1,718 1,729 1,489 1,390 1,973 2,472 2,194
Provisions 910 922 869 758 866 938 922
Net NPLs 808 807 620 632 1,107 1,534 1,272
Coverage 53% 53% 58% 55% 44% 38% 42%
Collateral
o/w real
o/w other
Gross loans 234,357 243,204 248,014 273,421 274,006 277,043
Gross NPL ratio 0.7% 0.7% 0.6% 0.5% 0.7% 0.9%
Net loans 233,413 242,223 247,065 272,551 272,995 275,976 275,853
Net NPL ratio 0.3% 0.3% 0.3% 0.2% 0.4% 0.6% 0.5%
Generic provisions n.a. n.a. n.a. n.a. n.a. n.a. n.a. Source: Deutsche Bank, company data

23 November 2017
Banks
European Banks
Page 56 Deutsche Bank AG/London
Figure 151: UK – overview of NPLs data (1/2) GBP m 2011 2012 2013 2014 2015 2016 9M-17
Aldermore
Gross NPLs 36 n.a.
Provisions 14 n.a.
Net NPLs 21 n.a.
Coverage 40% n.a.
Collateral 29 n.a.
o/w real
o/w other
Gross loans 7,505
Gross NPL ratio 0.5%
Net loans 7,477 8,400
Net NPL ratio 0.3% n.a.
Generic provisions
Barclays (*)
Gross NPLs 29,519 27,909 25,158 17,869 14,653 12,040 n.a.
Provisions 10,597 9,676 7,258 5,455 4,921 4,620 n.a.
Net NPLs 18,922 18,233 17,900 12,414 9,732 7,420 n.a.
Coverage 36% 35% 29% 31% 34% 38% n.a.
Collateral
o/w real
o/w other
Gross loans 442,486 431,664 437,659 433,222 445,487 440,655
Gross NPL ratio 6.7% 6.5% 5.7% 4.1% 3.3% 2.7%
Net loans 473,600 486,736 482,869 469,878 440,566 436,035 421,407
Net NPL ratio 4.0% 3.7% 3.7% 2.6% 2.2% 1.7% n.a.
Generic provisions
HSBC (USD m)
Gross NPLs 41,584 38,671 36,428 29,283 23,758 18,228 n.a.
Provisions 17,511 16,112 15,143 12,337 9,555 7,850 n.a.
Net NPLs 24,073 22,559 21,285 16,946 14,203 10,378 n.a.
Coverage 42% 42% 42% 42% 40% 43% n.a.
Collateral 26,477 20,590 15,514 14,127 4,796 n.a.
o/w real 22,543 17,546 13,465 10,900 6,116 n.a.
o/w other 3,934 3,044 2,049 3,227 3,579 n.a.
Gross loans 916,521 979,084 1,007,232 986,997 934,009 869,354 952,650
Gross NPL ratio 4.5% 3.9% 3.6% 3.0% 2.5% 2.1%
Net loans 972,001 1,001,522 992,089 974,660 924,454 861,504 945,168
Net NPL ratio 2.5% 2.3% 2.1% 1.7% 1.5% 1.2% n.a.
Generic provisions
Lloyds
Gross NPLs 53,757 46,293 32,259 14,308 9,590 8,495 8,200
Provisions 19,022 15,459 12,091 6,540 4,172 3,532 3,657
Net NPLs 34,735 30,834 20,168 7,768 5,418 4,963 4,543
Coverage 35% 33% 37% 46% 44% 42% 45%
Collateral 17,594 13,925 6,971 5,475 5,619 n.a.
o/w real
o/w other
Gross loans 595,443 540,071 511,504 490,759 459,629 461,671
Gross NPL ratio 9.0% 8.6% 6.3% 2.9% 2.1% 1.8%
Net loans 542,994 517,225 495,281 482,704 455,175 457,958 469,100
Net NPL ratio 6.4% 6.0% 4.1% 1.6% 1.2% 1.1% 1.0%
Generic provisions 6,313 3,616 1,112 n.a. n.a. n.a. Source: Deutsche Bank, company data. (*) We assume that the change in NPLs between FY-15 and FY-16 is only due to the decrease of credit risk loans in the same period

23 November 2017
Banks
European Banks
Deutsche Bank AG/London Page 57
Figure 152: UK – overview of NPLs data (2/2) GBP m 2011 2012 2013 2014 2015 2016 9M-17
Standard Chartered
Gross NPLs 4,351 5,632 6,765 7,897 12,759 9,687
Provisions 1,890 2,330 2,749 3,276 6,128 5,776
Net NPLs 2,461 3,302 4,016 4,621 6,631 3,911
Coverage 43% 41% 41% 41% 48% 60%
Collateral 1,027 1,136 1,259 1,462 2,425 1,605
o/w real 617 n.a. n.a. n.a.
o/w other 642 n.a. n.a. n.a.
Gross loans 271,403 287,668 299,460 292,571 268,083 262,250
Gross NPL ratio 1.6% 2.0% 2.3% 2.7% 4.8% 3.7%
Net loans 271,778 284,616 296,015 288,599 261,403 255,896
Net NPL ratio 0.9% 1.2% 1.4% 1.6% 2.5% 1.5%
Generic provisions 722 696 696 696 687
RBS
Gross NPLs 40,058 41,006 39,322 28,177 12,156 10,310 9,000
Provisions 12,798 19,188 23,150 16,684 6,554 4,055 3,900
Net NPLs 27,260 21,818 16,172 11,493 5,602 6,255 5,100
Coverage 32% 47% 59% 59% 54% 39% 43%
Collateral
o/w real
o/w other
Gross loans 515,606 500,135 440,722 378,238 333,892 351,950 348,417
Gross NPL ratio 7.8% 8.2% 8.9% 7.4% 3.6% 2.9% 2.6%
Net loans 491,790 431,100 392,541 394,706 306,334 323,023 324,650
Net NPL ratio 5.5% 5.1% 4.1% 2.9% 1.8% 1.9% 1.6%
Generic provisions 1,960 2,012 1,316 584 400 210 Source: Deutsche Bank, company data

23 November 2017
Banks
European Banks
Page 58 Deutsche Bank AG/London
Figure 153: France – overview of NPLs data Euro m 2011 2012 2013 2014 2015 2016 9M-17
SG
Gross NPLs 24,100 24,300 24,900 23,700 24,600 23,900 21,400
Provisions 13,500 12,500 13,300 13,100 14,300 13,700 11,800
Net NPLs 10,600 11,800 11,600 10,600 10,300 10,200 9,600
Coverage 56% 51% 53% 55% 58% 57% 55%
Collateral 4,700 6,100 7,300 7,890 8,800 9,530 n.a.
Gross loans 367,704 341,745 332,803 385,789 420,036 440,874
Gross NPL ratio 6.6% 7.1% 7.5% 6.1% 5.9% 5.4%
Net loans 367,517 350,241 333,535 344,368 405,252 426,501 412,200
Net NPL ratio 2.9% 3.4% 3.5% 3.1% 2.5% 2.4% 2.3%
Generic provisions 1,300 1,300 1,300 1,400 1,500 1,400
CASA
Gross NPLs 24,759 17,349 16,936 16,322 16,017 16,842 14,296
Provisions 12,755 10,806 10,013 9,668 9,396 9,560 9,921
Net NPLs 12,004 6,543 6,923 6,654 6,621 7,282 4,375
Coverage 52% 62% 59% 59% 59% 57% 69%
Collateral
Gross loans 415,817 342,012 314,696 325,404 341,813 357,059
Gross NPL ratio 6.0% 5.1% 5.4% 5.0% 4.7% 4.7%
Net loans 399,381 329,756 303,837 314,379 331,100 346,300 349,200
Net NPL ratio 3.0% 2.0% 2.3% 2.1% 2.0% 2.1% 1.3%
Generic provisions 2,007 1,820 1,787 1,813 1,680 2,130
BNP
Gross NPLs 43,696 42,453 45,420 42,896 41,251 41,779 n.a.
Provisions 23,103 22,213 22,828 22,762 22,730 23,924 n.a.
Net NPLs 20,593 20,240 22,592 20,134 18,521 17,855 n.a.
Coverage 53% 52% 50% 53% 55% 57% n.a.
Collateral 10,596 11,429 13,706 13,190 11,814 11,981 n.a.
Gross loans 693,792 657,045 643,777 683,821 708,691 739,278
Gross NPL ratio 6.3% 6.5% 7.1% 6.3% 5.8% 5.7%
Net loans 665,834 630,520 612,455 657,403 682,497 712,233 711,589
Net NPL ratio 3.1% 3.2% 3.7% 3.1% 2.7% 2.5% n.a.
Generic provisions 4,312 3,788 3,656 3,464 3,121 n.a.
Natixis
Gross NPLs 4,534
Provisions 1,851
Net NPLs 2,683
Coverage 41%
Collateral 1,510
Gross loans 142,454
Gross NPL ratio 3.2%
Net loans 140,303
Net NPL ratio 1.9%
Generic provisions 384 Source: Deutsche Bank, company data

23 November 2017
Banks
European Banks
Deutsche Bank AG/London Page 59
Figure 154: Benelux – overview of NPLs data Euro m 2011 2012 2013 2014 2015 2016 9M-17
ABN AMRO (*)
Gross NPLs 6,973 8,912 7,853
Provisions 3,892 3,425 2,721
Net NPLs 3,081 5,487 5,132
Coverage 56% 38% 35%
Collateral n.a. n.a. n.a.
o/w real
o/w other
Gross loans 279,197 271,345 274,825
Gross NPL ratio 2.5% 3.3% 2.9%
Net loans 274,842 267,679 271,917
Net NPL ratio 1.1% 2.0% 1.9%
Generic provisions 505 114 n.a.
KBC
Gross NPLs 11,234 10,757 13,871 13,692 12,305 10,583 10,060
Provisions 4,870 4,614 5,521 5,709 5,517 4,874 4,777
Net NPLs 6,364 6,143 8,350 7,983 6,788 5,709 5,283
Coverage 43% 43% 40% 42% 45% 46% 47%
Collateral 3,981 2,716 2,774 1,741 1,699 3,795 n.a.
o/w real
o/w other
Gross loans 159,043 143,970 138,142 141,585 146,928 157,246
Gross NPL ratio 7.1% 7.5% 10.0% 9.7% 8.4% 6.7%
Net loans 153,894 139,225 130,153 135,784 141,305 152,152 161,702
Net NPL ratio 4.1% 4.4% 6.4% 5.9% 4.8% 3.8% 3.3%
Generic provisions 244 284 215 229 288 n.a.
ING
Gross NPLs 13,382 14,928 15,921 16,889 15,325 13,597 12,650
Provisions 4,166 4,751 5,318 5,215 5,786 5,308 4,967
Net NPLs 9,216 10,177 10,603 11,674 9,539 8,289 7,683
Coverage 31% 32% 33% 31% 38% 39% 39%
Collateral 8,142 14,839 15,910 16,778 14,351 12,811 n.a.
o/w real 9,527 10,966 11,374 9,494 7,549 n.a.
o/w other 5,312 4,944 5,404 4,857 5,262 n.a.
Gross loans 582,862 548,581 517,180 523,467 543,115 568,838 573,360
Gross NPL ratio 2.3% 2.7% 3.1% 3.2% 2.8% 2.4% 2.2%
Net loans 546,121 519,700 492,645 507,540 537,343 563,660 568,508
Net NPL ratio 1.7% 2.0% 2.2% 2.3% 1.8% 1.5% 1.4%
Generic provisions 753 835 780 769 821 n.a. Source: Deutsche Bank, company data. (*) FY-16 data impacted by the introduction of new definitions for default and NPLs

23 November 2017
Banks
European Banks
Page 60 Deutsche Bank AG/London
Figure 155: Germany – overview of NPLs data Euro m 2011 2012 2013 2014 2015 2016 9M-17
CB
Gross NPLs 19,703 18,926 15,563 11,843 7,124 6,914 6,549
Provisions 7,657 7,148 6,241 5,145 3,371 3,243 3,118
Net NPLs 12,046 11,778 9,322 6,698 3,753 3,671 3,431
Coverage 39% 38% 40% 43% 47% 47% 48%
Collateral 9,278 9,296 7,407 5,526 2556 2,256 2,153
o/w real
o/w other
Gross loans 304,499 286,200 252,590 222,737 222,737 216,518
Gross NPL ratio 6.5% 6.6% 6.2% 5.3% 3.2% 3.2%
Net loans 296,586 278,546 245,963 233,377 218,875 212,848 229,374
Net NPL ratio 4.1% 4.2% 3.8% 2.9% 1.7% 1.7% 1.5%
Generic provisions 887 933 822 800 673 624
Aareal bank
Gross NPLs 986 1,364 1,365 1,272
Provisions 491 542 559 554
Net NPLs 495 822 806 718
Coverage 50% 40% 41% 44%
Collateral
o/w real
o/w other
Gross loans 30,549 34,566 31,203
Gross NPL ratio 3.2% 3.9% 4.4%
Net loans 30,069 34,038 30,649 28,481
Net NPL ratio 1.6% 2.4% 2.6% 2.5%
PBB
Gross NPLs 1,090 941 1143 777 388 314
Provisions 382 245 297 342 130 121
Net NPLs 709 696 846 435 258 193
Coverage 35% 26% 26% 44% 34% 39%
Collateral
o/w real
o/w other
Gross loans 49,590 36,242 38,964 41,204 41,146 40,070
Gross NPL ratio 2.2% 2.6% 2.9% 1.9% 0.9%
Net loans 49,265 36,094 38,826 41,055 41,016 39,949
Net NPL ratio 1.4% 1.9% 2.2% 1.1% 0.6% 0.5% Source: Deutsche Bank, company data

23 November 2017
Banks
European Banks
Deutsche Bank AG/London Page 61
Figure 156: Austria – overview of NPLs data Euro m 2011 2012 2013 2014 2015 2016 9M-17
Erste
Gross NPLs 11,800 12,098 12,296 10,878 9,314 6,678 6,189
Provisions 6,113 7,573 7,753 7,491 6,009 4,613 4,302
Net NPLs 5,687 4,525 4,543 3,387 3,305 2,065 1,887
Coverage 52% 63% 63% 69% 65% 69% 70%
Collateral 5,651 5,601 5,197 3,954 3,795 2,913 n.a.
Gross loans 134,750 131,928 127,698 128,325 131,906 135,267 142,308
Gross NPL ratio 8.8% 9.2% 9.6% 8.5% 7.1% 4.9% 4.3%
Net loans 127,448 124,283 119,888 128,325 125,897 130,654 138,005
Net NPL ratio 9.3% 9.7% 10.3% 8.5% 7.4% 5.1% 4.5%
Generic provisions 695 651 768 733 726 735
RBI (*)
Gross NPLs 7,056 8,183 8,657 8,838 8,328 6,486 5,443
Provisions 4,145 4,593 5,010 5,546 5,935 4,905 3,778
Net NPLs 2,911 3,590 3,647 3,293 2,393 1,581 1,665
Coverage 59% 56% 58% 63% 71% 76% 69%
Collateral 2,381 2,195 2,360 2,872 1,837 1,343 n.a.
Gross loans 76,523 77,701 75,029 71,856 69,921 70,514 81,102
Gross NPL ratio 9.2% 10.5% 11.5% 12.3% 11.9% 9.2% 6.7%
Generic provisions 891 477 409 383 379 376 Source: Deutsche Bank, company data. (*) RBI merged with the parent company in Dec-16, so the pro-forma loans would actually be higher. We used stated data from 2016 annual report for consistency

European Banks
Banks
23 November 2017
Page 62 Deutsche Bank AG/London
Figu
re 15
7: S
um
mary valu
ation
sheet
Geography
StockDB Rec.
Priced atTarget
Upside /
Mkt Cap
Adjusted P/EDividend Yield
Price : Tangible BookReturn on Avg. Tangible Equity
21/11/2017price
downside)
E'm2016
2017e2018e
2019e2016
2017e2018e
2019e2016
2017e2018e
2019e2016
2017e2018e
2019eAustria
Erste BankHold
36.237.0
2%15,557
8.612.2
13.514.3
3.6%3.0%
3.3%3.5%
1.131.37
1.291.23
13.8%11.6%
9.8%8.8%
AustriaRaiffeisen Bank Intern.
Hold29.9
28.0(6%
)9,827
12.79.5
10.010.8
0.0%2.2%
2.5%2.8%
0.631.06
1.010.94
5.2%11.9%
10.4%9.0%
BeneluxING
Buy15.1
18.019%
58,6739.4
11.310.6
9.94.9%
4.6%5.0%
5.3%1.07
1.191.14
1.0911.6%
10.7%11.0%
11.3%Benelux
KBCBuy
67.778.0
15%28,309
10.711.2
11.511.4
4.8%4.4%
4.4%6.5%
1.641.78
1.651.59
16.1%16.3%
14.8%14.2%
BeneluxABN AM
ROBuy
24.628.0
14%23,096
9.29.4
10.310.3
4.0%5.7%
5.8%5.8%
1.121.21
1.151.10
12.6%13.4%
11.4%10.9%
FranceBNP Paribas
Buy62.8
77.023%
78,37710.1
9.69.6
8.84.5%
4.9%4.9%
5.3%1.04
1.020.97
0.9210.6%
10.9%10.3%
10.7%France
Credit AgricoleBuy
14.016.6
19%39,845
12.611.6
11.09.8
5.1%4.6%
4.6%5.0%
1.041.24
1.171.10
8.2%10.7%
10.9%11.6%
FranceNatixis
Buy6.5
7.515%
20,53713.0
13.112.7
11.86.5%
5.4%5.9%
6.4%1.26
1.481.46
1.409.8%
11.5%11.6%
12.1%France
Societe GeneraleHold
43.051.0
19%34,695
10.38.2
9.28.3
4.7%5.1%
5.5%6.1%
0.850.77
0.740.71
8.3%9.4%
8.2%8.7%
Germany
Aareal BankBuy
35.841.0
15%2,140
8.811.0
11.79.9
5.6%6.4%
6.7%7.7%
0.870.80
0.790.77
10.1%7.6%
6.8%7.9%
Germany
Comdirect
Hold11.5
10.0(13%
)1,625
22.624.4
27.725.1
2.6%2.2%
2.2%2.2%
2.172.46
2.382.28
9.6%10.3%
8.8%9.3%
Germany
Comm
erzbankHold
12.210.50
(14%)
15,29827.4
87.517.0
13.40.0%
0.0%0.0%
1.6%0.35
0.600.61
0.581.3%
0.7%3.5%
4.4%Germ
anyDeutsche Pfandbriefbank
Hold12.8
12.5(2%
)1,723
10.811.3
12.614.2
11.5%6.2%
6.4%6.3%
0.440.61
0.610.60
4.1%5.5%
4.8%4.3%
IberiaBanco de Sabadell
Hold1.6
1.8313%
9,07010.5
10.09.6
9.03.7%
3.1%3.4%
3.7%0.69
0.790.73
0.716.8%
8.2%8.0%
8.0%Iberia
Banco SantanderBuy
5.56.60
21%88,216
10.911.8
10.39.0
4.2%3.1%
3.7%4.6%
1.131.23
1.131.05
10.6%11.0%
11.4%12.0%
IberiaBankia
Buy3.8
4.6021%
10,91613.9
12.812.9
11.10.7%
3.1%3.5%
4.5%0.87
0.840.81
0.796.3%
6.6%6.4%
7.2%Iberia
BankinterHold
7.68.30
9%6,866
13.514.1
13.812.7
2.9%3.9%
3.8%4.3%
1.721.70
1.601.55
13.3%12.3%
12.0%12.4%
IberiaBBVA
Hold7.0
7.304%
46,82212.5
10.610.5
9.85.8%
3.3%3.3%
3.6%0.98
0.980.93
0.888.1%
9.7%9.1%
9.2%Iberia
CaixaBankBuy
3.95.0
28%23,148
17.911.8
9.78.6
5.1%3.8%
4.3%5.2%
0.951.08
1.010.96
5.1%9.5%
10.8%11.4%
IberiaUnicaja Banco
Buy1.2
1.625%
2,003n/a
11.614.4
9.1n/a
0.0%2.1%
3.8%n/a
0.550.53
0.514.9%
5.2%3.8%
5.8%Iberia
BCPBuy
0.30.3
28%3,791
n/a22.2
9.26.8
0.0%0.0%
0.0%0.0%
0.240.64
0.600.55
(0.0%)
3.4%6.7%
8.4%Ireland
Allied Irish BanksHold
5.14.9
(5%)
13,85713.0
13.214.2
15.51.9%
2.4%2.9%
7.3%1.11
1.081.07
1.038.9%
8.4%7.6%
6.8%Ireland
Bank of IrelandBuy
6.37.9
26%6,783
14.310.1
10.19.5
0.0%3.2%
4.9%6.7%
0.940.87
0.840.82
7.3%8.5%
8.5%8.7%
IrelandPerm
anent tsbHold
2.12.0
(6%)
9648.9
8.39.5
10.6n/a
0.0%0.0%
0.0%0.65
0.470.45
0.436.8%
5.8%4.9%
4.2%Italy
Banco BPMBuy
2.73.8
41%4,088
n/an/m
9.15.5
na1.1%
5.4%8.3%
0.190.41
0.390.37
(6.4%)
0.1%4.4%
6.9%Italy
CredemHold
7.16.9
(2%)
2,35213.3
14.112.0
10.72.6%
2.9%3.4%
3.8%0.92
1.081.03
0.976.9%
7.9%8.8%
9.3%Italy
Intesa SanPaoloBuy
2.83.3
19%43,900
14.712.7
11.49.8
7.3%7.3%
7.1%7.7%
0.930.96
0.960.94
6.4%7.9%
8.4%9.7%
ItalyM
onte dei PaschiHold
3.94.5
15%4,470
n/an/a
68.77.3
0.0%0.0%
0.0%0.0%
0.070.40
0.460.43
(42.0%)
(49.3%)
0.6%6.1%
ItalyUBI Banca
Hold3.8
4.06%
4,305n/a
15.38.2
6.04.2%
2.7%6.9%
9.1%0.35
0.520.49
0.47(4.7%
)3.6%
6.2%7.9%
ItalyUniCredit
Buy16.6
20.222%
36,83513.0
11.99.5
7.90.0%
1.7%2.1%
2.5%0.47
0.690.66
0.643.1%
6.9%7.1%
8.2%Nordics
Danske BankHold
234.9269.0
15%29,570
11.711.1
11.110.7
4.2%4.3%
5.1%5.6%
1.451.50
1.481.46
12.5%13.6%
13.4%13.8%
NordicsDNB
Hold151.3
153.01%
25,53912.0
12.011.5
10.94.4%
4.2%4.2%
4.2%1.04
1.161.12
1.099.2%
10.0%9.9%
10.1%Nordics
NordeaHold
9.910.9
11%39,911
12.112.6
11.610.7
6.1%6.7%
6.8%7.2%
1.501.38
1.341.30
12.5%11.0%
11.7%12.3%
NordicsSEB
Hold98.8
108.09%
21,64812.7
11.912.0
11.75.8%
6.3%6.3%
6.3%1.55
1.541.49
1.4412.5%
13.2%12.6%
12.5%Nordics
Svenska HandelsbankenHold
113.8126.0
11%21,946
16.913.9
12.812.3
3.9%4.5%
4.6%4.7%
1.901.63
1.551.47
11.5%12.0%
12.5%12.3%
NordicsSw
edbankSell
195.8193.0
(1%)
22,39114.8
12.111.8
11.76.0%
6.6%6.5%
6.5%2.16
1.891.81
1.7515.0%
15.7%15.7%
15.2%Sw
itzerlandCem
bra Money Bank
Hold87.1
74.0(15%
)2,246
15.518.9
19.919.4
6.0%5.3%
4.9%5.0%
2.633.04
3.032.98
17.4%16.2%
15.3%15.5%
Switzerland
Credit Suisse GroupBuy
16.319.0
17%35,806
n/m20.0
12.710.1
4.8%1.5%
3.1%4.6%
0.831.07
1.020.96
0.1%5.5%
8.2%9.8%
Switzerland
Julius BaerHold
60.461.0
1%11,608
14.317.4
15.213.4
2.7%2.4%
2.7%3.1%
4.064.68
3.993.41
27.6%28.9%
28.4%27.5%
Switzerland
UBSHold
17.018.0
6%56,153
13.812.7
12.311.3
3.8%3.8%
4.1%4.7%
1.301.37
1.331.29
9.3%10.8%
10.9%11.6%
UKAlderm
oreHold
310.0313.0
1%1,206
9.19.8
10.611.3
0.0%0.3%
1.4%1.8%
1.551.70
1.501.36
18.7%19.0%
15.0%12.6%
UKBarclays
Buy189.2
210.011%
36,38317.8
13.710.9
8.71.3%
1.6%2.6%
4.2%0.77
0.670.70
0.694.5%
4.9%6.3%
8.0%UK
HSBCHold
729.6700.0
(4%)
164,38113.6
13.813.3
12.67.8%
5.3%5.4%
5.5%1.18
1.321.31
1.278.3%
9.9%9.9%
10.2%UK
Lloyds Banking GroupBuy
65.777.0
17%53,357
8.88.4
8.99.3
4.9%6.1%
6.6%7.2%
1.131.23
1.231.21
13.2%14.4%
13.7%13.1%
UKStandard Chartered
Hold723.0
653.0(10%
)26,886
n/m18.8
13.611.8
0.0%1.6%
4.2%5.2%
0.710.79
0.760.72
0.4%4.3%
5.7%6.3%
UKRBS
Hold273.2
300.010%
36,87124.4
11.310.0
9.60.0%
0.0%1.1%
6.0%0.76
0.970.93
0.912.9%
8.4%9.5%
9.5%
Austria(1%
)25,384
9.511.0
11.912.7
2.2%2.7%
3.0%3.2%
0.921.23
1.161.10
10.1%11.7%
10.1%8.9%
Benelux17%
110,0789.7
10.810.8
10.44.7%
4.8%5.0%
5.7%1.19
1.311.24
1.1912.7%
12.3%11.8%
11.7%France
20%173,455
10.910.0
10.19.2
4.9%5.0%
5.1%5.5%
1.001.03
0.990.94
9.4%10.5%
10.0%10.5%
Germany
(10%)
20,78618.5
35.316.3
13.51.7%
1.3%1.4%
2.7%0.44
0.650.66
0.642.4%
1.9%4.0%
4.8%Iberia
17%190,832
12.011.6
10.59.3
4.4%3.2%
3.6%4.3%
0.991.07
1.000.94
8.3%9.7%
9.8%10.4%
Ireland5%
21,60313.0
11.712.3
12.71.2%
2.6%3.4%
6.8%1.01
0.960.93
0.908.1%
8.2%7.6%
7.2%Italy
20%95,949
14.113.1
10.78.4
3.6%4.2%
4.7%5.4%
0.600.74
0.720.70
(0.2%)
2.4%6.8%
8.5%Nordics
8%161,007
13.112.2
11.711.2
5.1%5.5%
5.7%5.9%
1.531.46
1.421.38
12.0%12.2%
12.3%12.5%
Switzerland
9%105,813
13.415.1
12.811.1
4.0%2.9%
3.6%4.5%
1.201.36
1.311.25
6.0%9.2%
10.4%11.5%
UK2%
319,08614.4
12.411.6
10.95.0%
4.1%4.7%
5.6%0.98
1.081.07
1.056.7%
8.8%9.3%
9.7%UK ex HSBC, STAN
13%127,818
13.210.3
9.79.2
2.4%3.0%
3.8%5.9%
0.880.93
0.940.92
6.7%8.9%
9.6%10.1%
Euro zone banks16%
638,08711.1
11.210.7
9.64.2%
4.0%4.3%
5.0%0.92
1.000.96
0.917.3%
8.5%9.2%
9.8%Nordic+Sw
iss+UK banks5%
585,90513.8
12.811.9
11.04.8%
4.2%4.8%
5.5%1.14
1.211.19
1.167.7%
9.6%10.1%
10.6%DB Universe
11%1,223,992
12.812.0
11.210.2
4.5%4.1%
4.5%5.2%
1.021.09
1.061.02
7.5%9.0%
9.6%10.1%
S
ource: Deutsche B
ank estimates, com
pany data, FactS
et

23 November 2017
Banks
European Banks
Deutsche Bank AG/London Page 63
Appendix A Figure 158: European banks – Generic provisions
Euro m 2015 2016 9M-17
Italy
UCG 2,417 2,848 2,124
ISP 2,198 1,766 1,854
MPS 714 737 556
Banco BPM 513 408 391
UBI Banca 417 379 425
Credem 78 69 73
Iberia
Santander n.a. n.a. n.a.
BBVA n.a. n.a. n.a.
Bankia n.a. n.a. n.a.
Bankinter n.a. n.a. n.a.
CaixaBank n.a. n.a. n.a.
Sabadell n.a. n.a. n.a.
Unicaja Banco n.a. n.a. n.a.
BCP n.a. n.a. n.a.
Ireland
Allied Irish Banks n.a. n.a. n.a.
BoI n.a. n.a. n.a.
Permanent tsb n.a. n.a. n.a.
Nordics
Nordea 451 513 490
SHB (SEK m) n.a. n.a. n.a.
Swed (SEK m) 957 1,048 971
SEB (SEK m) 1,530 1,322 1,308
DNB (NOK m) n.a. n.a. n.a.
Danske (DKK m) 5,211 5,384 4,702
Switzerland
UBS (CHF m) n.a. n.a. n.a.
CS (CHF m) n.a. n.a. n.a.
UK
Lloyds (GBP m) n.a. n.a. n.a.
Aldermore (GBP m n.a. n.a.
Barclays (GBP m n.a. n.a. n.a.
RBS (GBP m 584 400 210
HSBC (USD m) n.a. n.a. n.a.
Stan (USD m) 696 687 n.a.
France
BNP 3,464 3,121 n.a.
SocGen 1,400 1,500 1,400
CASA 1,813 1,680 2,130
Natixis 384 n.a.
Benelux
KBC 229 288 n.a.
ABN AMRO 505 114 n.a.
ING 769 821 n.a.
Germany
CBK 800 673 624
Aareal bank n.a. n.a. n.a.
PBB n.a. n.a. n.a.
Austria
Erste 733 726 735
RBI 383 379 376
Source: Deutsche Bank, company data
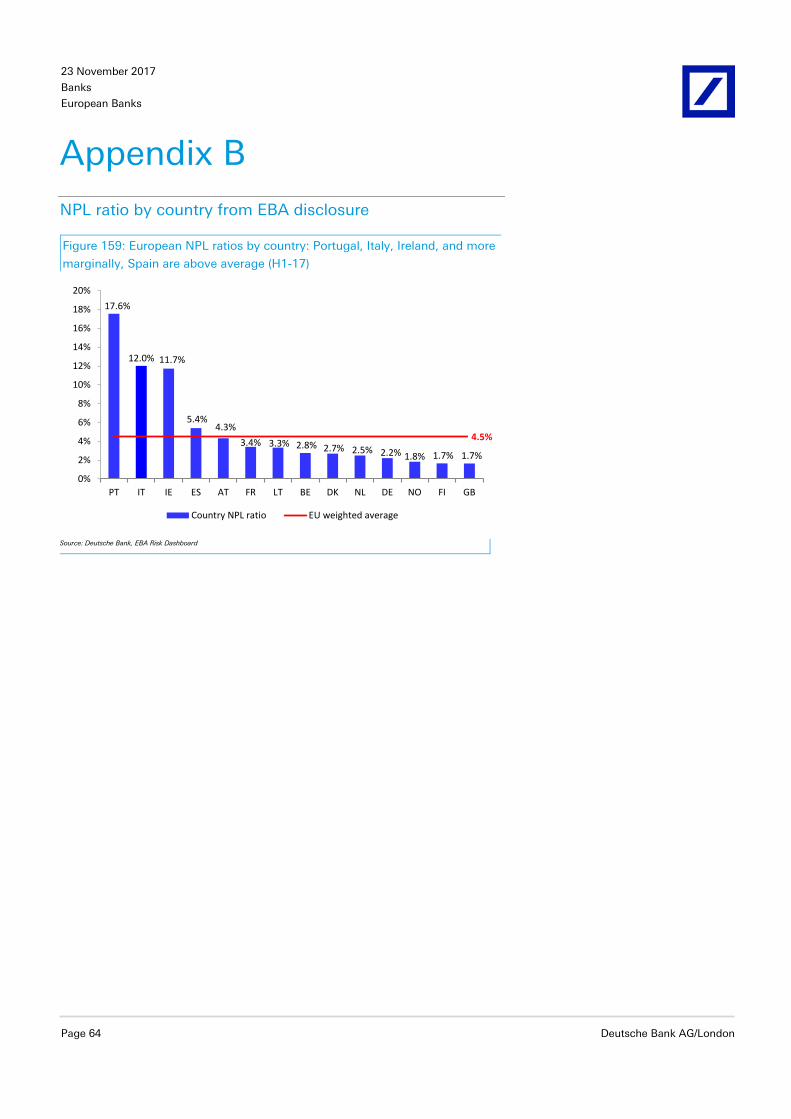
23 November 2017
Banks
European Banks
Page 64 Deutsche Bank AG/London
Appendix B
NPL ratio by country from EBA disclosure
Figure 159: European NPL ratios by country: Portugal, Italy, Ireland, and more
marginally, Spain are above average (H1-17)
17.6%
12.0% 11.7%
5.4%4.3%
3.4% 3.3% 2.8% 2.7% 2.5% 2.2% 1.8% 1.7% 1.7%
4.5%
0%
2%
4%
6%
8%
10%
12%
14%
16%
18%
20%
PT IT IE ES AT FR LT BE DK NL DE NO FI GB
Country NPL ratio EU weighted average
Source: Deutsche Bank, EBA Risk Dashboard

23 November 2017
Banks
European Banks
Deutsche Bank AG/London Page 65
Appendix 1
Important Disclosures *Other information available upon request Prices are current as of the end of the previous trading session unless otherwise indicated and are sourced from local exchanges via Reuters, Bloomberg and other vendors. Other information is sourced from Deutsche Bank, subject companies, and other sources. For disclosures pertaining to recommendations or estimates made on securities other than the primary subject of this research, please see the most recently published company report or visit our global disclosure look-up page on our website at http://gm.db.com/ger/disclosure/DisclosureDirectory.eqsr. Aside from within this report, important conflict disclosures can also be found at https://gm.db.com/equities under the "Disclosures Lookup" and "Legal" tabs. Investors are strongly encouraged to review this information before investing. Analyst Certification
The views expressed in this report accurately reflect the personal views of the undersigned lead analyst about the subject issuers and the securities of those issuers. In addition, the undersigned lead analyst has not and will not receive any compensation for providing a specific recommendation or view in this report. Paola Sabbione/Ignacio Ulargui Equity rating key Equity rating dispersion and banking relationships
Buy: Based on a current 12- month view of total share-holder return (TSR = percentage change in share price from current price to projected target price plus pro-jected dividend yield ) , we recommend that investors buy the stock.
Sell: Based on a current 12-month view of total share-holder return, we recommend that investors sell the stock
Hold: We take a neutral view on the stock 12-months out and, based on this time horizon, do not recommend either a Buy or Sell.
Newly issued research recommendations and target prices supersede previously published research.
42 %50 %
8 %
54 % 39 %
31 %0
50
100
150
200
250
300
350
Buy Hold Sell
European Universe
Companies Covered Cos. w/ Banking Relationship

23 November 2017
Banks
European Banks
Page 66 Deutsche Bank AG/London
Additional Information
The information and opinions in this report were prepared by Deutsche Bank AG or one of its affiliates (collectively "Deutsche Bank"). Though the information herein is believed to be reliable and has been obtained from public sources believed to be reliable, Deutsche Bank makes no representation as to its accuracy or completeness. Hyperlinks to third-party websites in this report are provided for reader convenience only. Deutsche Bank neither endorses the content nor is responsible for the accuracy or security controls of those websites. If you use the services of Deutsche Bank in connection with a purchase or sale of a security that is discussed in this report, or is included or discussed in another communication (oral or written) from a Deutsche Bank analyst, Deutsche Bank may act as principal for its own account or as agent for another person. Deutsche Bank may consider this report in deciding to trade as principal. It may also engage in transactions, for its own account or with customers, in a manner inconsistent with the views taken in this research report. Others within Deutsche Bank, including strategists, sales staff and other analysts, may take views that are inconsistent with those taken in this research report. Deutsche Bank issues a variety of research products, including fundamental analysis, equity-linked analysis, quantitative analysis and trade ideas. Recommendations contained in one type of communication may differ from recommendations contained in others, whether as a result of differing time horizons, methodologies, perspectives or otherwise. Deutsche Bank and/or its affiliates may also be holding debt or equity securities of the issuers it writes on. Analysts are paid in part based on the profitability of Deutsche Bank AG and its affiliates, which includes investment banking, trading and principal trading revenues. Opinions, estimates and projections constitute the current judgment of the author as of the date of this report. They do not necessarily reflect the opinions of Deutsche Bank and are subject to change without notice. Deutsche Bank provides liquidity for buyers and sellers of securities issued by the companies it covers. Deutsche Bank research analysts sometimes have shorter-term trade ideas that may be inconsistent with Deutsche Bank's existing longer-term ratings. Trade ideas for equities can be found at the SOLAR link at http://gm.db.com. A SOLAR idea represents a high-conviction belief by an analyst that a stock will outperform or underperform the market and/or a specified sector over a time frame of no less than two weeks and no more than six months. In addition to SOLAR ideas, analysts may occasionally discuss with our clients, and with Deutsche Bank salespersons and traders, trading strategies or ideas that reference catalysts or events that may have a near-term or medium-term impact on the market price of the securities discussed in this report, which impact may be directionally counter to the analysts' current 12-month view of total return or investment return as described herein. Deutsche Bank has no obligation to update, modify or amend this report or to otherwise notify a recipient thereof if an opinion, forecast or estimate changes or becomes inaccurate. Coverage and the frequency of changes in market conditions and in both general and company-specific economic prospects make it difficult to update research at defined intervals. Updates are at the sole discretion of the coverage analyst or of the Research Department Management, and the majority of reports are published at irregular intervals. This report is provided for informational purposes only and does not take into account the particular investment objectives, financial situations, or needs of individual clients. It is not an offer or a solicitation of an offer to buy or sell any financial instruments or to participate in any particular trading strategy. Target prices are inherently imprecise and a product of the analyst’s judgment. The financial instruments discussed in this report may not be suitable for all investors, and investors must make their own informed investment decisions. Prices and availability of financial instruments are subject to change without notice, and investment transactions can lead to losses as a result of price fluctuations and other factors. If a financial instrument is denominated in a currency other than an investor's currency, a change in exchange rates may adversely affect the investment. Past performance is not necessarily indicative of future results. Performance calculations exclude transaction costs, unless otherwise indicated. Unless otherwise indicated, prices are current as of the end of the previous trading session and are sourced from local exchanges via Reuters, Bloomberg and other vendors. Data is also sourced from Deutsche Bank, subject companies, and other parties. The Deutsche Bank Research Department is independent of other business divisions of the Bank. Details regarding organizational arrangements and information barriers we have established to prevent and avoid conflicts of interest with respect to our research are available on our website under Disclaimer, found on the Legal tab.

23 November 2017
Banks
European Banks
Deutsche Bank AG/London Page 67
Macroeconomic fluctuations often account for most of the risks associated with exposures to instruments that promise to pay fixed or variable interest rates. For an investor who is long fixed-rate instruments (thus receiving these cash flows), increases in interest rates naturally lift the discount factors applied to the expected cash flows and thus cause a loss. The longer the maturity of a certain cash flow and the higher the move in the discount factor, the higher will be the loss. Upside surprises in inflation, fiscal funding needs, and FX depreciation rates are among the most common adverse macroeconomic shocks to receivers. But counterparty exposure, issuer creditworthiness, client segmentation, regulation (including changes in assets holding limits for different types of investors), changes in tax policies, currency convertibility (which may constrain currency conversion, repatriation of profits and/or liquidation of positions), and settlement issues related to local clearing houses are also important risk factors. The sensitivity of fixed-income instruments to macroeconomic shocks may be mitigated by indexing the contracted cash flows to inflation, to FX depreciation, or to specified interest rates – these are common in emerging markets. The index fixings may – by construction – lag or mis-measure the actual move in the underlying variables they are intended to track. The choice of the proper fixing (or metric) is particularly important in swaps markets, where floating coupon rates (i.e., coupons indexed to a typically short-dated interest rate reference index) are exchanged for fixed coupons. Funding in a currency that differs from the currency in which coupons are denominated carries FX risk. Options on swaps (swaptions) the risks typical to options in addition to the risks related to rates movements. Derivative transactions involve numerous risks including market, counterparty default and illiquidity risk. The appropriateness of these products for use by investors depends on the investors' own circumstances, including their tax position, their regulatory environment and the nature of their other assets and liabilities; as such, investors should take expert legal and financial advice before entering into any transaction similar to or inspired by the contents of this publication. The risk of loss in futures trading and options, foreign or domestic, can be substantial. As a result of the high degree of leverage obtainable in futures and options trading, losses may be incurred that are greater than the amount of funds initially deposited – up to theoretically unlimited losses. Trading in options involves risk and is not suitable for all investors. Prior to buying or selling an option, investors must review the "Characteristics and Risks of Standardized Options”, at http://www.optionsclearing.com/about/publications/character-risks.jsp. If you are unable to access the website, please contact your Deutsche Bank representative for a copy of this important document. Participants in foreign exchange transactions may incur risks arising from several factors, including: (i) exchange rates can be volatile and are subject to large fluctuations; (ii) the value of currencies may be affected by numerous market factors, including world and national economic, political and regulatory events, events in equity and debt markets and changes in interest rates; and (iii) currencies may be subject to devaluation or government-imposed exchange controls, which could affect the value of the currency. Investors in securities such as ADRs, whose values are affected by the currency of an underlying security, effectively assume currency risk. Deutsche Bank is not acting as a financial adviser, consultant or fiduciary to you or any of your agents with respect to any information provided in this report. Deutsche Bank does not provide investment, legal, tax or accounting advice, and is not acting as an impartial adviser. Information contained herein is being provided on the basis that the recipient will make an independent assessment of the merits of any investment decision, and is not meant for retirement accounts or for any specific person or account type. The information we provide is directed only to persons we believe to be financially sophisticated, who are capable of evaluating investment risks independently, both in general and with regard to particular transactions and investment strategies, and who understand that Deutsche Bank has financial interests in the offering of its products and services. If this is not the case, or if you or your agent are an IRA or other retail investor receiving this directly from us, we ask that you inform us immediately. Unless governing law provides otherwise, all transactions should be executed through the Deutsche Bank entity in the investor's home jurisdiction. Aside from within this report, important risk and conflict disclosures can also be found at https://gm.db.com on each company’s research page and under the "Disclosures Lookup" and "Legal" tabs. Investors are strongly encouraged to review this information before investing. United States: Approved and/or distributed by Deutsche Bank Securities Incorporated, a member of FINRA, NFA and SIPC. Analysts located outside of the United States are employed by non-US affiliates that are not subject to FINRA regulations, including those regarding contacts with issuer companies. Germany: Approved and/or distributed by Deutsche Bank AG, a joint stock corporation with limited liability incorporated in the Federal Republic of Germany with its principal office in Frankfurt am Main. Deutsche Bank AG is authorized under
23 November 2017
Banks
European Banks
Page 68 Deutsche Bank AG/London
German Banking Law and is subject to supervision by the European Central Bank and by BaFin, Germany’s Federal Financial Supervisory Authority. United Kingdom: Approved and/or distributed by Deutsche Bank AG acting through its London Branch at Winchester House, 1 Great Winchester Street, London EC2N 2DB. Deutsche Bank AG in the United Kingdom is authorised by the Prudential Regulation Authority and is subject to limited regulation by the Prudential Regulation Authority and Financial Conduct Authority. Details about the extent of our authorisation and regulation are available on request. Hong Kong: Distributed by Deutsche Bank AG, Hong Kong Branch or Deutsche Securities Asia Limited. India: Prepared by Deutsche Equities India Private Limited (DEIPL) having CIN: U65990MH2002PTC137431 and registered office at 14th Floor, The Capital, C-70, G Block, Bandra Kurla Complex Mumbai (India) 400051. Tel: + 91 22 7180 4444. It is registered by the Securities and Exchange Board of India (SEBI) as a Stock broker bearing registration nos.: NSE (Capital Market Segment) - INB231196834, NSE (F&O Segment) INF231196834, NSE (Currency Derivatives Segment) INE231196834, BSE (Capital Market Segment) INB011196830; Merchant Banker bearing SEBI Registration no.: INM000010833 and Research Analyst bearing SEBI Registration no.: INH000001741. DEIPL may have received administrative warnings from the SEBI for breaches of Indian regulations. Deutsche Bank and/or its affiliate(s) may have debt holdings or positions in the subject company. With regard to information on associates, please refer to the “Shareholdings” section in the Annual Report at: https://www.db.com/ir/en/annual-reports.htm. Japan: Approved and/or distributed by Deutsche Securities Inc.(DSI). Registration number - Registered as a financial instruments dealer by the Head of the Kanto Local Finance Bureau (Kinsho) No. 117. Member of associations: JSDA, Type II Financial Instruments Firms Association and The Financial Futures Association of Japan. Commissions and risks involved in stock transactions - for stock transactions, we charge stock commissions and consumption tax by multiplying the transaction amount by the commission rate agreed with each customer. Stock transactions can lead to losses as a result of share price fluctuations and other factors. Transactions in foreign stocks can lead to additional losses stemming from foreign exchange fluctuations. We may also charge commissions and fees for certain categories of investment advice, products and services. Recommended investment strategies, products and services carry the risk of losses to principal and other losses as a result of changes in market and/or economic trends, and/or fluctuations in market value. Before deciding on the purchase of financial products and/or services, customers should carefully read the relevant disclosures, prospectuses and other documentation. "Moody's", "Standard & Poor's", and "Fitch" mentioned in this report are not registered credit rating agencies in Japan unless Japan or "Nippon" is specifically designated in the name of the entity. Reports on Japanese listed companies not written by analysts of DSI are written by Deutsche Bank Group's analysts with the coverage companies specified by DSI. Some of the foreign securities stated on this report are not disclosed according to the Financial Instruments and Exchange Law of Japan. Target prices set by Deutsche Bank's equity analysts are based on a 12-month forecast period.. Korea: Distributed by Deutsche Securities Korea Co. South Africa: Deutsche Bank AG Johannesburg is incorporated in the Federal Republic of Germany (Branch Register Number in South Africa: 1998/003298/10). Singapore: This report is issued by Deutsche Bank AG, Singapore Branch or Deutsche Securities Asia Limited, Singapore Branch (One Raffles Quay #18-00 South Tower Singapore 048583, +65 6423 8001), which may be contacted in respect of any matters arising from, or in connection with, this report. Where this report is issued or promulgated by Deutsche Bank in Singapore to a person who is not an accredited investor, expert investor or institutional investor (as defined in the applicable Singapore laws and regulations), they accept legal responsibility to such person for its contents. Taiwan: Information on securities/investments that trade in Taiwan is for your reference only. Readers should independently evaluate investment risks and are solely responsible for their investment decisions. Deutsche Bank research may not be distributed to the Taiwan public media or quoted or used by the Taiwan public media without written consent. Information on securities/instruments that do not trade in Taiwan is for informational purposes only and is not to be construed as a recommendation to trade in such securities/instruments. Deutsche Securities Asia Limited, Taipei Branch may not execute transactions for clients in these securities/instruments.

23 November 2017
Banks
European Banks
Deutsche Bank AG/London Page 69
Qatar: Deutsche Bank AG in the Qatar Financial Centre (registered no. 00032) is regulated by the Qatar Financial Centre Regulatory Authority. Deutsche Bank AG - QFC Branch may undertake only the financial services activities that fall within the scope of its existing QFCRA license. Its principal place of business in the QFC: Qatar Financial Centre, Tower, West Bay, Level 5, PO Box 14928, Doha, Qatar. This information has been distributed by Deutsche Bank AG. Related financial products or services are only available only to Business Customers, as defined by the Qatar Financial Centre Regulatory Authority. Russia: The information, interpretation and opinions submitted herein are not in the context of, and do not constitute, any appraisal or evaluation activity requiring a license in the Russian Federation. Kingdom of Saudi Arabia: Deutsche Securities Saudi Arabia LLC Company (registered no. 07073-37) is regulated by the Capital Market Authority. Deutsche Securities Saudi Arabia may undertake only the financial services activities that fall within the scope of its existing CMA license. Its principal place of business in Saudi Arabia: King Fahad Road, Al Olaya District, P.O. Box 301809, Faisaliah Tower - 17th Floor, 11372 Riyadh, Saudi Arabia. United Arab Emirates: Deutsche Bank AG in the Dubai International Financial Centre (registered no. 00045) is regulated by the Dubai Financial Services Authority. Deutsche Bank AG - DIFC Branch may undertake only the financial services activities that fall within the scope of its existing DFSA license. Its principal place of business in the DIFC: Dubai International Financial Centre, The Gate Village, Building 5, PO Box 504902, Dubai, U.A.E. This information has been distributed by Deutsche Bank AG. Related financial products or services are available only to Professional Clients, as defined by the Dubai Financial Services Authority. Australia: Retail clients should obtain a copy of a Product Disclosure Statement (PDS) relating to any financial product referred to in this report and consider the PDS before making any decision about whether to acquire the product. Please refer to Australia-specific research disclosures and related information at https://australia.db.com/australia/content/research-information.html Australia and New Zealand: This research is intended only for "wholesale clients" within the meaning of the Australian Corporations Act and New Zealand Financial Advisors Act, respectively. Additional information relative to securities, other financial products or issuers discussed in this report is available upon request. This report may not be reproduced, distributed or published without Deutsche Bank's prior written consent. Copyright © 2017 Deutsche Bank AG

David Folkerts-Landau
Group Chief Economist and Global Head of Research
Raj Hindocha Global Chief Operating Officer
Research
Michael Spencer Head of APAC Research
Global Head of Economics
Steve Pollard Head of Americas Research
Global Head of Equity Research
Anthony Klarman Global Head of Debt Research
Paul Reynolds Head of EMEA
Equity Research
Dave Clark Head of APAC
Equity Research
Pam Finelli Global Head of
Equity Derivatives Research
Andreas Neubauer Head of Research - Germany
Spyros Mesomeris Global Head of Quantitative
and QIS Research
International locations Deutsche Bank AG Deutsche Bank Place Level 16 Corner of Hunter & Phillip Streets Sydney, NSW 2000 Australia Tel: (61) 2 8258 1234
Deutsche Bank AG Mainzer Landstrasse 11-17 60329 Frankfurt am Main Germany Tel: (49) 69 910 00
Deutsche Bank AG Filiale Hongkong International Commerce Centre, 1 Austin Road West,Kowloon, Hong Kong Tel: (852) 2203 8888
Deutsche Securities Inc. 2-11-1 Nagatacho Sanno Park Tower Chiyoda-ku, Tokyo 100-6171 Japan Tel: (81) 3 5156 6770
Deutsche Bank AG London 1 Great Winchester Street London EC2N 2EQ United Kingdom Tel: (44) 20 7545 8000
Deutsche Bank Securities Inc. 60 Wall Street New York, NY 10005 United States of America Tel: (1) 212 250 2500