D&B Analysis | Flat Spot in US Economic Recovery (Fall 2012)
7
D&B Analysis Confirms Flat Spot in U.S. Economic Recovery Fall 2012
-
Upload
dun-bradstreet -
Category
Economy & Finance
-
view
549 -
download
0
Transcript of D&B Analysis | Flat Spot in US Economic Recovery (Fall 2012)

D&B Analysis Confirms Flat Spot in U.S. Economic Recovery Fall 2012
2
The hesitant U.S. recovery continues to face significant headwinds and the pace of growth is likely to remain subdued heading into 2013. D&B’s proprietary analysis across all sectors of the economy confirms that growth has downshifted substantially, with few areas of the economy demonstrating momentum. The struggling recovery is certainly not good news for U.S. households due to the limited growth in income and employment, but at the same time there remains evidence that the recovery will continue. In addition, there are a number of favorable developments occurring below the surface that bode well for the economy once top-line growth resumes.
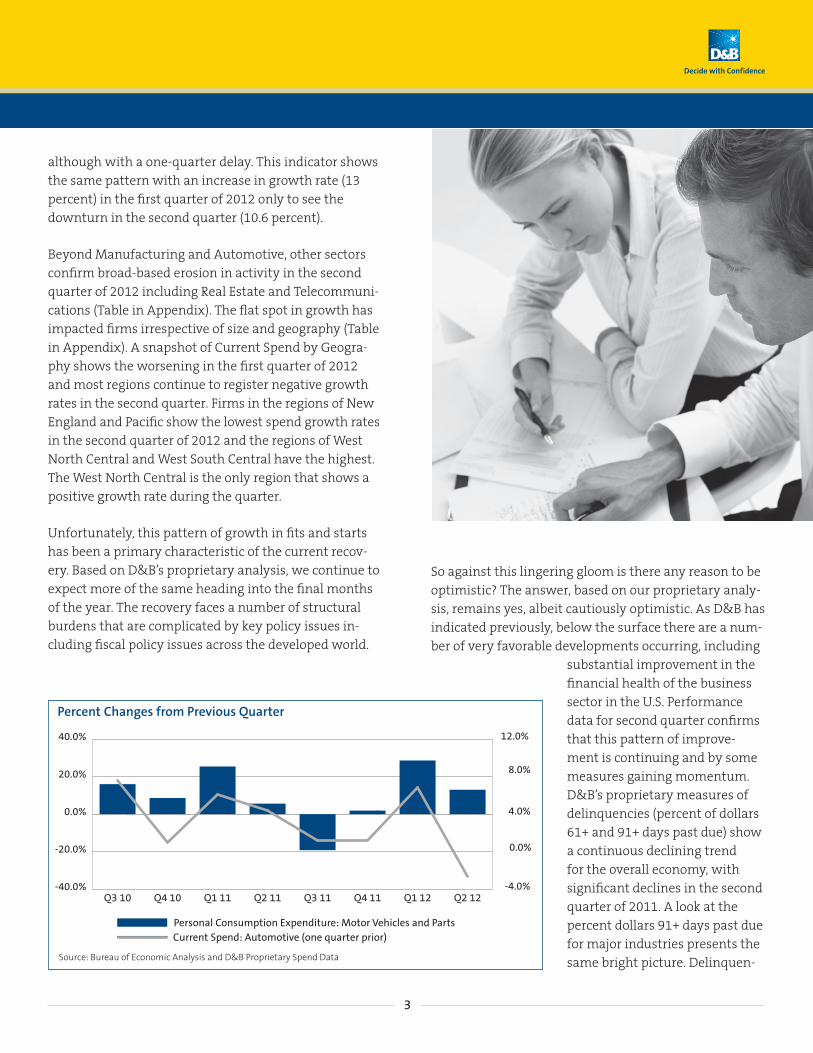
Most measures of U.S. economic activity showed signs of a significant slowdown during the first half of 2012. This economic slowdown is also evident in D&B’s propri-etary Current Spend data, which tracks business activity across industries. D&B’s Overall Current Spend growth contracted by almost 6 percent in the second quarter 2012, a significant decline in relationship to the healthy growth of almost 7 percent in the final quarter of 2011.
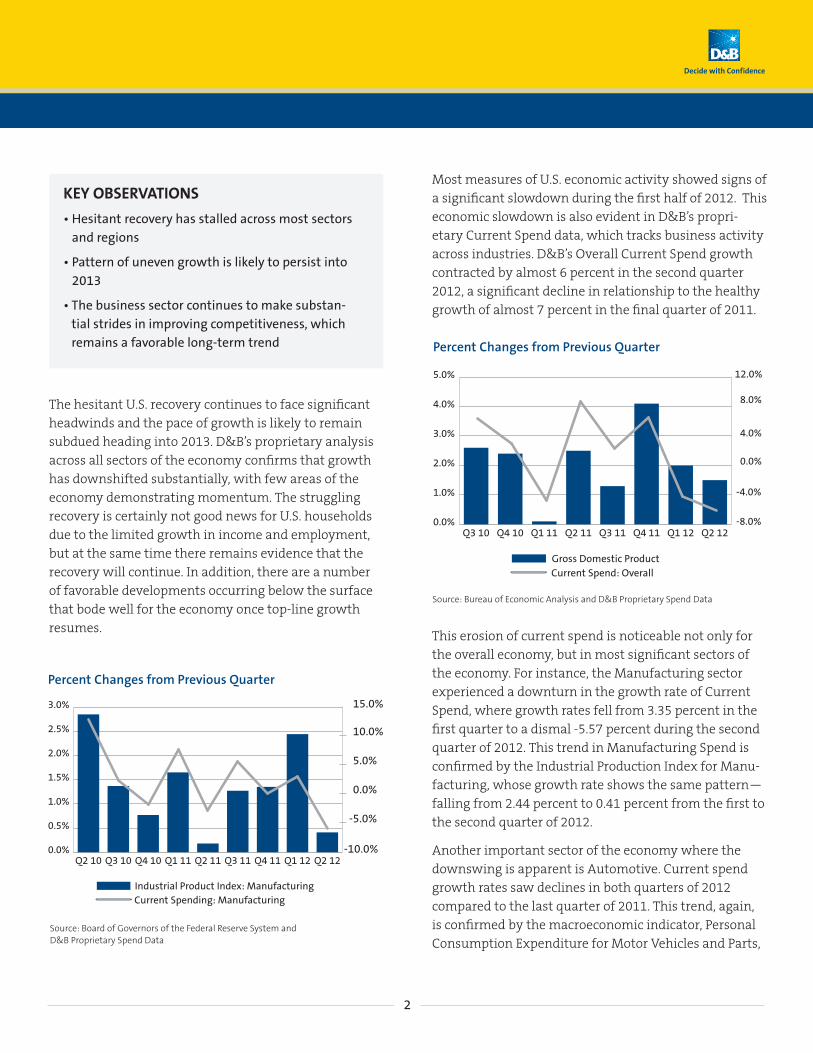
This erosion of current spend is noticeable not only for the overall economy, but in most significant sectors of the economy. For instance, the Manufacturing sector experienced a downturn in the growth rate of Current Spend, where growth rates fell from 3.35 percent in the first quarter to a dismal -5.57 percent during the second quarter of 2012. This trend in Manufacturing Spend is confirmed by the Industrial Production Index for Manu-facturing, whose growth rate shows the same pattern—falling from 2.44 percent to 0.41 percent from the first to the second quarter of 2012.
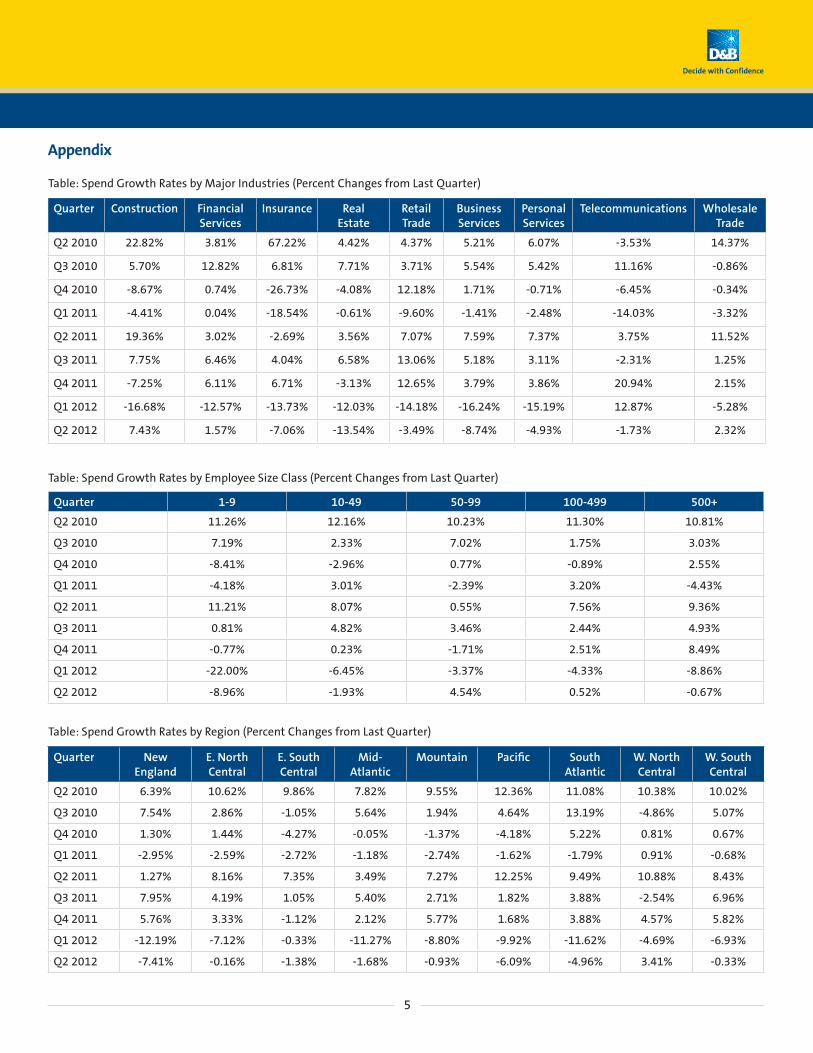
Another important sector of the economy where the downswing is apparent is Automotive. Current spend growth rates saw declines in both quarters of 2012 compared to the last quarter of 2011. This trend, again, is confirmed by the macroeconomic indicator, Personal Consumption Expenditure for Motor Vehicles and Parts,
KEY OBSERVATIONS
• Hesitant recovery has stalled across most sectors and regions
• Pattern of uneven growth is likely to persist into 2013
• The business sector continues to make substan-tial strides in improving competitiveness, which remains a favorable long-term trend
0.0%
0.5%
1.0%
1.5%
2.0%
2.5%
3.0%
Industrial Product Index: Manufacturing
Q2 12Q1 12Q4 11Q3 11Q2 11Q1 11Q4 10Q3 10Q2 10-10.0%
-5.0%
0.0%
5.0%
10.0%
15.0%
Current Spending: Manufacturing
Q2 2012Q1 2012Q4 2011Q3 2011Q2 2011Q1 2011Q4 2010Q3 2010Q2 2010
Source: Board of Governors of the Federal Reserve System and D&B Proprietary Spend Data
Percent Changes from Previous Quarter
0.0%
1.0%
2.0%
3.0%
4.0%
5.0%
Gross Domestic Product
Q2 12Q1 12Q4 11Q3 11Q2 11Q1 11Q4 10Q3 10-8.0%
-4.0%
0.0%
4.0%
8.0%
12.0%
Current Spend: Overall
Q2 2012Q1 2012Q4 2011Q3 2011Q2 2011Q1 2011Q4 2010Q3 2010
Source: Bureau of Economic Analysis and D&B Proprietary Spend Data
Percent Changes from Previous Quarter
3
although with a one-quarter delay. This indicator shows the same pattern with an increase in growth rate (13 percent) in the first quarter of 2012 only to see the downturn in the second quarter (10.6 percent).
Beyond Manufacturing and Automotive, other sectors confirm broad-based erosion in activity in the second quarter of 2012 including Real Estate and Telecommuni-cations (Table in Appendix). The flat spot in growth has impacted firms irrespective of size and geography (Table in Appendix). A snapshot of Current Spend by Geogra-phy shows the worsening in the first quarter of 2012 and most regions continue to register negative growth rates in the second quarter. Firms in the regions of New England and Pacific show the lowest spend growth rates in the second quarter of 2012 and the regions of West North Central and West South Central have the highest. The West North Central is the only region that shows a positive growth rate during the quarter.
Unfortunately, this pattern of growth in fits and starts has been a primary characteristic of the current recov-ery. Based on D&B’s proprietary analysis, we continue to expect more of the same heading into the final months of the year. The recovery faces a number of structural burdens that are complicated by key policy issues in-cluding fiscal policy issues across the developed world.
So against this lingering gloom is there any reason to be optimistic? The answer, based on our proprietary analy-sis, remains yes, albeit cautiously optimistic. As D&B has indicated previously, below the surface there are a num-ber of very favorable developments occurring, including
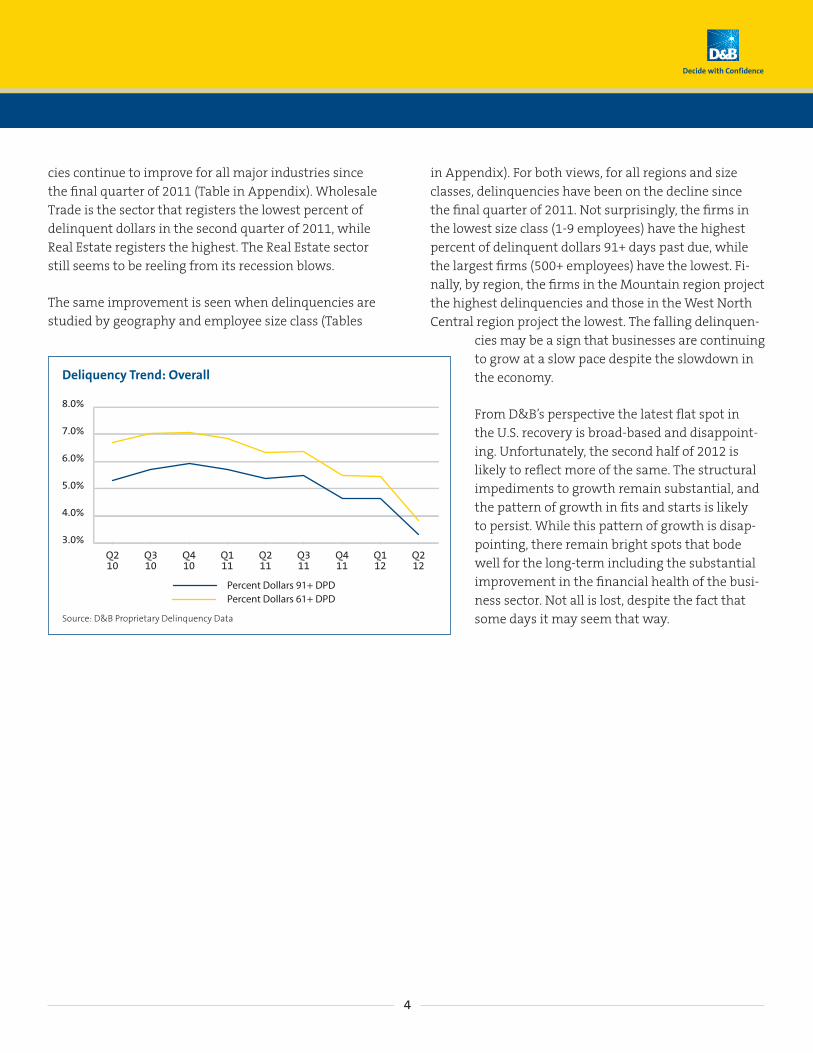
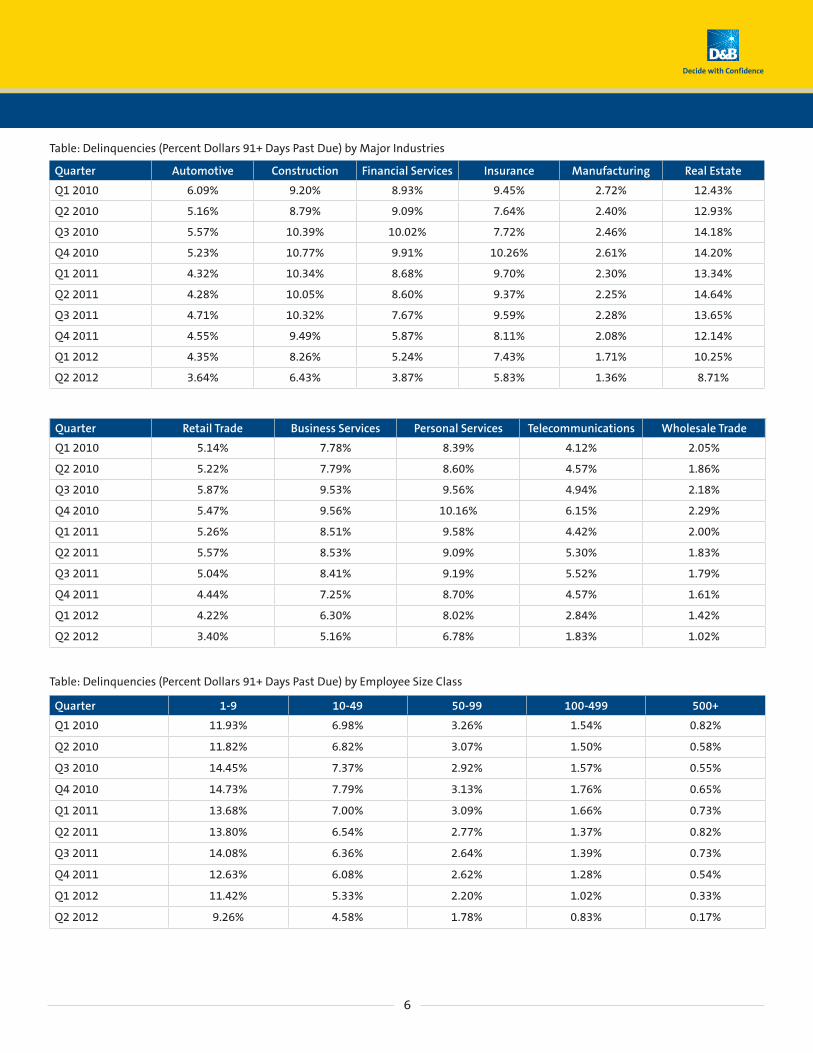
substantial improvement in the financial health of the business sector in the U.S. Performance data for second quarter confirms that this pattern of improve-ment is continuing and by some measures gaining momentum. D&B’s proprietary measures of delinquencies (percent of dollars 61+ and 91+ days past due) show a continuous declining trend for the overall economy, with significant declines in the second quarter of 2011. A look at the percent dollars 91+ days past due for major industries presents the same bright picture. Delinquen-
-40.0%
-20.0%
0.0%
20.0%
40.0%
Personal Consumption Expenditure: Motor Vehicles and Parts
Q2 12Q1 12Q4 11Q3 11Q2 11Q1 11Q4 10Q3 10-4.0%
0.0%
4.0%
8.0%
12.0%
Current Spend: Automotive (one quarter prior)
Q2 2012Q1 2012Q4 2011Q3 2011Q2 2011Q1 2011Q4 2010Q3 2010
Source: Bureau of Economic Analysis and D&B Proprietary Spend Data
Percent Changes from Previous Quarter
4
cies continue to improve for all major industries since the final quarter of 2011 (Table in Appendix). Wholesale Trade is the sector that registers the lowest percent of delinquent dollars in the second quarter of 2011, while Real Estate registers the highest. The Real Estate sector still seems to be reeling from its recession blows.
The same improvement is seen when delinquencies are studied by geography and employee size class (Tables
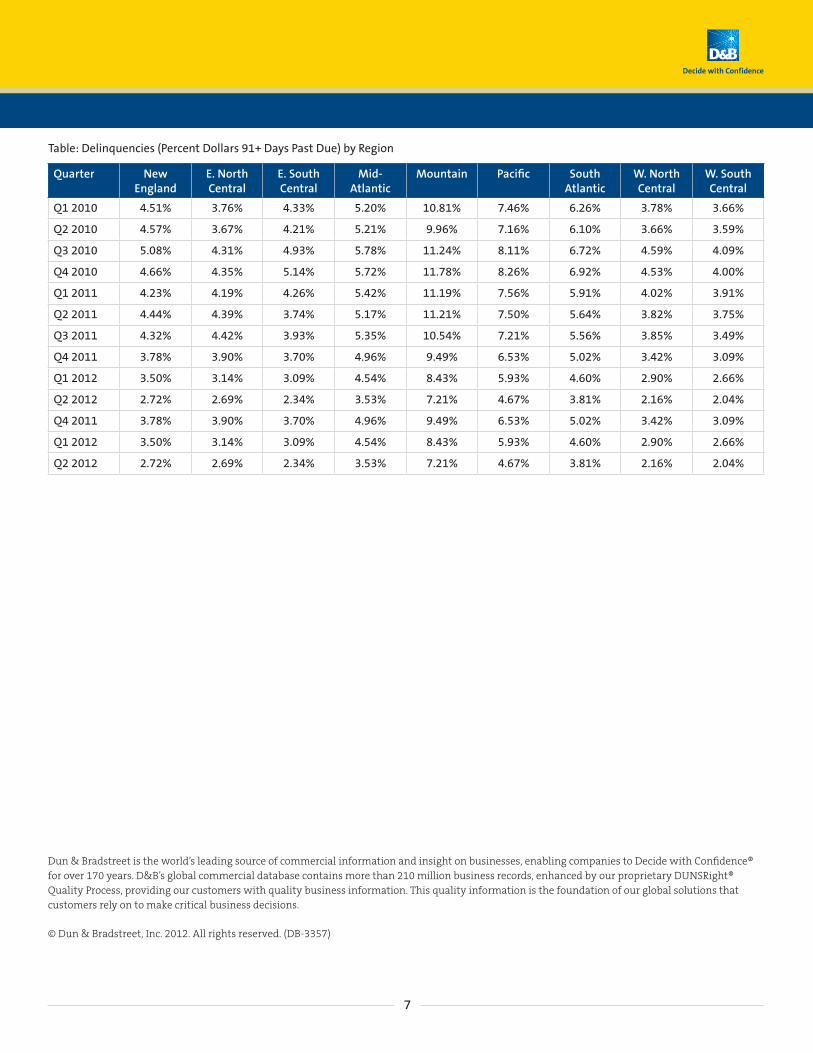
in Appendix). For both views, for all regions and size classes, delinquencies have been on the decline since the final quarter of 2011. Not surprisingly, the firms in the lowest size class (1-9 employees) have the highest percent of delinquent dollars 91+ days past due, while the largest firms (500+ employees) have the lowest. Fi-nally, by region, the firms in the Mountain region project the highest delinquencies and those in the West North Central region project the lowest. The falling delinquen-
cies may be a sign that businesses are continuing to grow at a slow pace despite the slowdown in the economy.
From D&B’s perspective the latest flat spot in the U.S. recovery is broad-based and disappoint-ing. Unfortunately, the second half of 2012 is likely to reflect more of the same. The structural impediments to growth remain substantial, and the pattern of growth in fits and starts is likely to persist. While this pattern of growth is disap-pointing, there remain bright spots that bode well for the long-term including the substantial improvement in the financial health of the busi-ness sector. Not all is lost, despite the fact that some days it may seem that way.
3.0%
4.0%
5.0%
6.0%
7.0%
8.0%
Percent Dollars 91+ DPDPercent Dollars 61+ DPD
Q212
Q112
Q411
Q311
Q211
Q111
Q410
Q310
Q210
Deliquency Trend: Overall
Source: D&B Proprietary Delinquency Data
5
Appendix
Table: Spend Growth Rates by Major Industries (Percent Changes from Last Quarter)
Quarter Construction Financial Services
Insurance Real Estate
Retail Trade
Business Services
Personal Services
Telecommunications Wholesale Trade
Q2 2010 22.82% 3.81% 67.22% 4.42% 4.37% 5.21% 6.07% -3.53% 14.37%
Q3 2010 5.70% 12.82% 6.81% 7.71% 3.71% 5.54% 5.42% 11.16% -0.86%
Q4 2010 -8.67% 0.74% -26.73% -4.08% 12.18% 1.71% -0.71% -6.45% -0.34%
Q1 2011 -4.41% 0.04% -18.54% -0.61% -9.60% -1.41% -2.48% -14.03% -3.32%
Q2 2011 19.36% 3.02% -2.69% 3.56% 7.07% 7.59% 7.37% 3.75% 11.52%
Q3 2011 7.75% 6.46% 4.04% 6.58% 13.06% 5.18% 3.11% -2.31% 1.25%
Q4 2011 -7.25% 6.11% 6.71% -3.13% 12.65% 3.79% 3.86% 20.94% 2.15%
Q1 2012 -16.68% -12.57% -13.73% -12.03% -14.18% -16.24% -15.19% 12.87% -5.28%
Q2 2012 7.43% 1.57% -7.06% -13.54% -3.49% -8.74% -4.93% -1.73% 2.32%
Table: Spend Growth Rates by Employee Size Class (Percent Changes from Last Quarter)
Quarter 1-9 10-49 50-99 100-499 500+
Q2 2010 11.26% 12.16% 10.23% 11.30% 10.81%
Q3 2010 7.19% 2.33% 7.02% 1.75% 3.03%
Q4 2010 -8.41% -2.96% 0.77% -0.89% 2.55%
Q1 2011 -4.18% 3.01% -2.39% 3.20% -4.43%
Q2 2011 11.21% 8.07% 0.55% 7.56% 9.36%
Q3 2011 0.81% 4.82% 3.46% 2.44% 4.93%
Q4 2011 -0.77% 0.23% -1.71% 2.51% 8.49%
Q1 2012 -22.00% -6.45% -3.37% -4.33% -8.86%
Q2 2012 -8.96% -1.93% 4.54% 0.52% -0.67%
Table: Spend Growth Rates by Region (Percent Changes from Last Quarter)
Quarter New England
E. North Central
E. South Central
Mid- Atlantic
Mountain Pacific South Atlantic
W. North Central
W. South Central
Q2 2010 6.39% 10.62% 9.86% 7.82% 9.55% 12.36% 11.08% 10.38% 10.02%
Q3 2010 7.54% 2.86% -1.05% 5.64% 1.94% 4.64% 13.19% -4.86% 5.07%
Q4 2010 1.30% 1.44% -4.27% -0.05% -1.37% -4.18% 5.22% 0.81% 0.67%
Q1 2011 -2.95% -2.59% -2.72% -1.18% -2.74% -1.62% -1.79% 0.91% -0.68%
Q2 2011 1.27% 8.16% 7.35% 3.49% 7.27% 12.25% 9.49% 10.88% 8.43%
Q3 2011 7.95% 4.19% 1.05% 5.40% 2.71% 1.82% 3.88% -2.54% 6.96%
Q4 2011 5.76% 3.33% -1.12% 2.12% 5.77% 1.68% 3.88% 4.57% 5.82%
Q1 2012 -12.19% -7.12% -0.33% -11.27% -8.80% -9.92% -11.62% -4.69% -6.93%
Q2 2012 -7.41% -0.16% -1.38% -1.68% -0.93% -6.09% -4.96% 3.41% -0.33%
6
Table: Delinquencies (Percent Dollars 91+ Days Past Due) by Major Industries
Quarter Automotive Construction Financial Services Insurance Manufacturing Real Estate
Q1 2010 6.09% 9.20% 8.93% 9.45% 2.72% 12.43%
Q2 2010 5.16% 8.79% 9.09% 7.64% 2.40% 12.93%
Q3 2010 5.57% 10.39% 10.02% 7.72% 2.46% 14.18%
Q4 2010 5.23% 10.77% 9.91% 10.26% 2.61% 14.20%
Q1 2011 4.32% 10.34% 8.68% 9.70% 2.30% 13.34%
Q2 2011 4.28% 10.05% 8.60% 9.37% 2.25% 14.64%
Q3 2011 4.71% 10.32% 7.67% 9.59% 2.28% 13.65%
Q4 2011 4.55% 9.49% 5.87% 8.11% 2.08% 12.14%
Q1 2012 4.35% 8.26% 5.24% 7.43% 1.71% 10.25%
Q2 2012 3.64% 6.43% 3.87% 5.83% 1.36% 8.71%
Quarter Retail Trade Business Services Personal Services Telecommunications Wholesale Trade
Q1 2010 5.14% 7.78% 8.39% 4.12% 2.05%
Q2 2010 5.22% 7.79% 8.60% 4.57% 1.86%
Q3 2010 5.87% 9.53% 9.56% 4.94% 2.18%
Q4 2010 5.47% 9.56% 10.16% 6.15% 2.29%
Q1 2011 5.26% 8.51% 9.58% 4.42% 2.00%
Q2 2011 5.57% 8.53% 9.09% 5.30% 1.83%
Q3 2011 5.04% 8.41% 9.19% 5.52% 1.79%
Q4 2011 4.44% 7.25% 8.70% 4.57% 1.61%
Q1 2012 4.22% 6.30% 8.02% 2.84% 1.42%
Q2 2012 3.40% 5.16% 6.78% 1.83% 1.02%
Table: Delinquencies (Percent Dollars 91+ Days Past Due) by Employee Size Class
Quarter 1-9 10-49 50-99 100-499 500+
Q1 2010 11.93% 6.98% 3.26% 1.54% 0.82%
Q2 2010 11.82% 6.82% 3.07% 1.50% 0.58%
Q3 2010 14.45% 7.37% 2.92% 1.57% 0.55%
Q4 2010 14.73% 7.79% 3.13% 1.76% 0.65%
Q1 2011 13.68% 7.00% 3.09% 1.66% 0.73%
Q2 2011 13.80% 6.54% 2.77% 1.37% 0.82%
Q3 2011 14.08% 6.36% 2.64% 1.39% 0.73%
Q4 2011 12.63% 6.08% 2.62% 1.28% 0.54%
Q1 2012 11.42% 5.33% 2.20% 1.02% 0.33%
Q2 2012 9.26% 4.58% 1.78% 0.83% 0.17%
7
Table: Delinquencies (Percent Dollars 91+ Days Past Due) by Region
Quarter New England
E. North Central
E. South Central
Mid- Atlantic
Mountain Pacific South Atlantic
W. North Central
W. South Central
Q1 2010 4.51% 3.76% 4.33% 5.20% 10.81% 7.46% 6.26% 3.78% 3.66%
Q2 2010 4.57% 3.67% 4.21% 5.21% 9.96% 7.16% 6.10% 3.66% 3.59%
Q3 2010 5.08% 4.31% 4.93% 5.78% 11.24% 8.11% 6.72% 4.59% 4.09%
Q4 2010 4.66% 4.35% 5.14% 5.72% 11.78% 8.26% 6.92% 4.53% 4.00%
Q1 2011 4.23% 4.19% 4.26% 5.42% 11.19% 7.56% 5.91% 4.02% 3.91%
Q2 2011 4.44% 4.39% 3.74% 5.17% 11.21% 7.50% 5.64% 3.82% 3.75%
Q3 2011 4.32% 4.42% 3.93% 5.35% 10.54% 7.21% 5.56% 3.85% 3.49%
Q4 2011 3.78% 3.90% 3.70% 4.96% 9.49% 6.53% 5.02% 3.42% 3.09%
Q1 2012 3.50% 3.14% 3.09% 4.54% 8.43% 5.93% 4.60% 2.90% 2.66%
Q2 2012 2.72% 2.69% 2.34% 3.53% 7.21% 4.67% 3.81% 2.16% 2.04%
Q4 2011 3.78% 3.90% 3.70% 4.96% 9.49% 6.53% 5.02% 3.42% 3.09%
Q1 2012 3.50% 3.14% 3.09% 4.54% 8.43% 5.93% 4.60% 2.90% 2.66%
Q2 2012 2.72% 2.69% 2.34% 3.53% 7.21% 4.67% 3.81% 2.16% 2.04%
Dun & Bradstreet is the world’s leading source of commercial information and insight on businesses, enabling companies to Decide with Confidence® for over 170 years. D&B’s global commercial database contains more than 210 million business records, enhanced by our proprietary DUNSRight® Quality Process, providing our customers with quality business information. This quality information is the foundation of our global solutions that customers rely on to make critical business decisions. © Dun & Bradstreet, Inc. 2012. All rights reserved. (DB-3357)