day old chick quality evaluation
33
Day old chick quality evaluation Dr. Marleen Boerjan May 2014
-
Upload
hesham-kotb1 -
Category
Career
-
view
2.356 -
download
19
Transcript of day old chick quality evaluation

Day old chick quality evaluation
Dr. Marleen BoerjanMay 2014
Day old chick quality evaluation
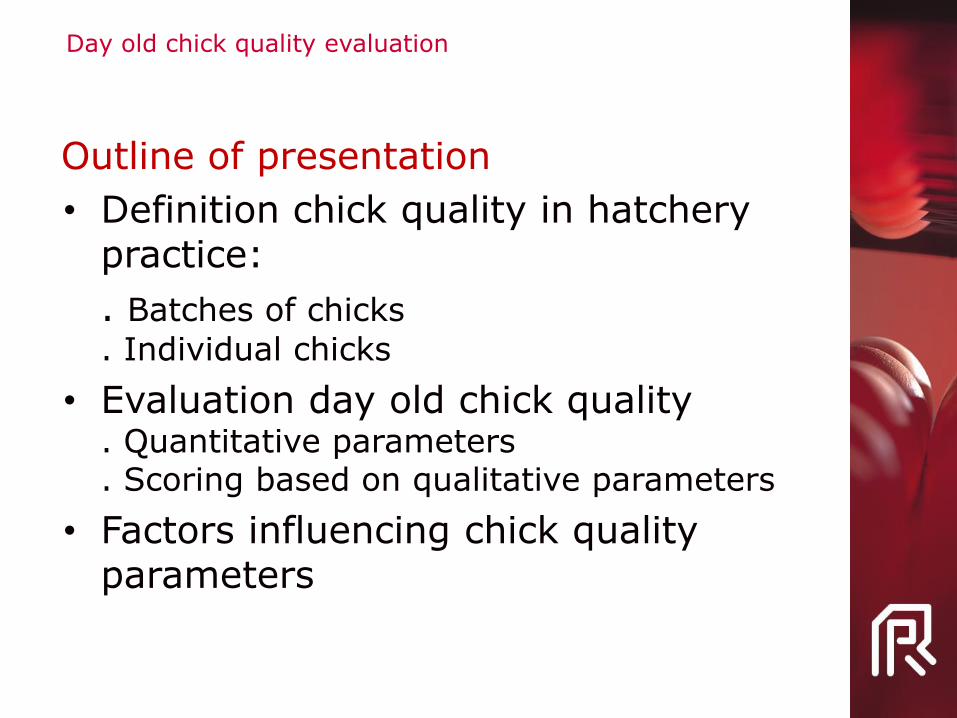
Outline of presentation
• Definition chick quality in hatchery practice:
. Batches of chicks
. Individual chicks
• Evaluation day old chick quality. Quantitative parameters. Scoring based on qualitative parameters
• Factors influencing chick quality parameters

A batch of good quality chicks:
• Is uniform with respect to uniformity parameters (weight,
size, chick yield, growth first week, etc………)
• Performs according to standards (breeder companies, hatchery reference data)
• Is uniform with respect to quantitative scoring systems(Tona-score. Pasgar-score)
Chick quality: batch
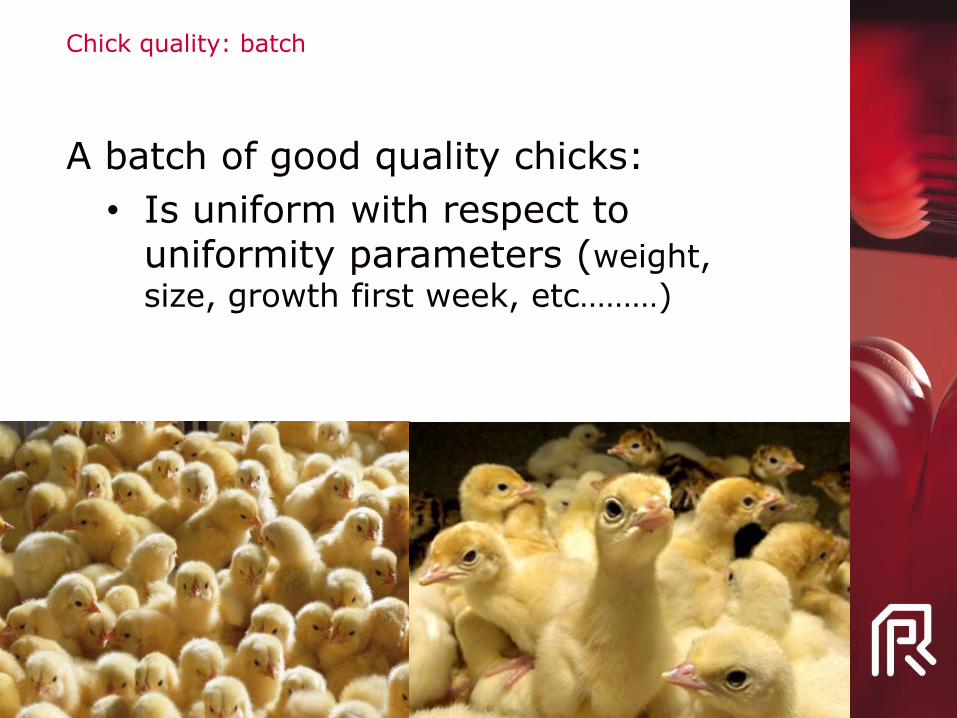
A batch of good quality chicks:
• Is uniform with respect to uniformity parameters (weight,
size, growth first week, etc………)
Chick quality: batch

Xn = 44.2 + 3.6 (g); n = 59
Uniformity = 88.1 %
A batch of good quality chicks:
• Is uniform (> 80%) with respect to uniformity parameters like chick weight
Chick quality: batch

Flock age29 wks 39 wks 62 wks
Flock age
N Mean s.d. CV Uniformity( mean 10 +/-%)
29 502 33.3 2.7 8.3 77.3
39 699 38.6 3.2 8.3 78.0
62 201 46.8 4.5 9.6 66.7
A batch of good quality chicks:
• Is uniform with respect to uniformity parameters within a class of flock age
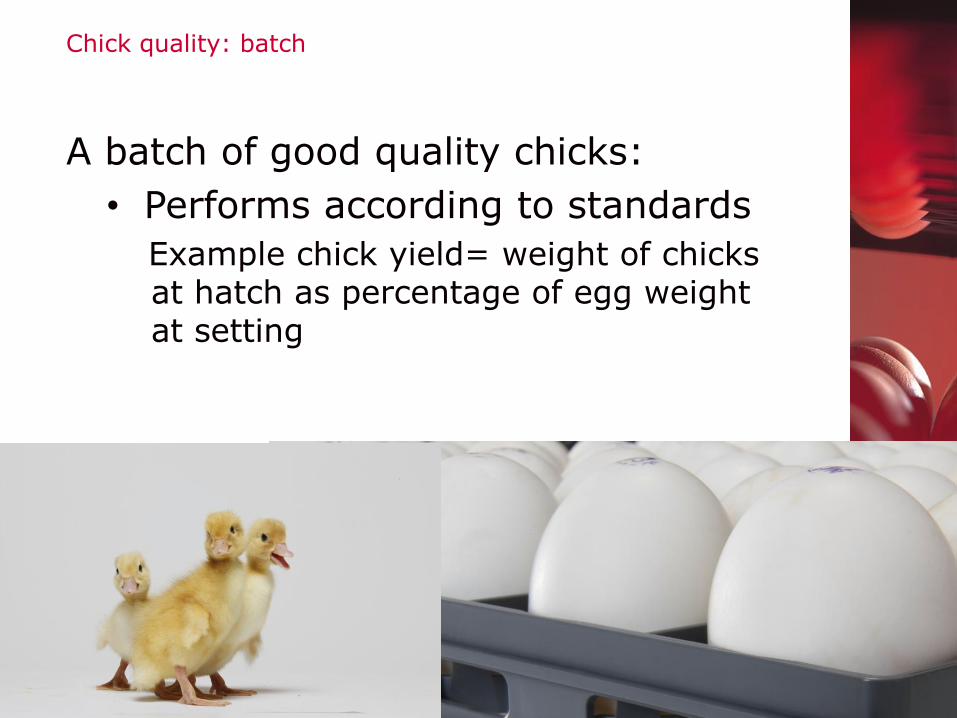
A batch of good quality chicks:
• Performs according to standards
Example chick yield= weight of chicks at hatch as percentage of egg weight at setting
Chick quality: batch
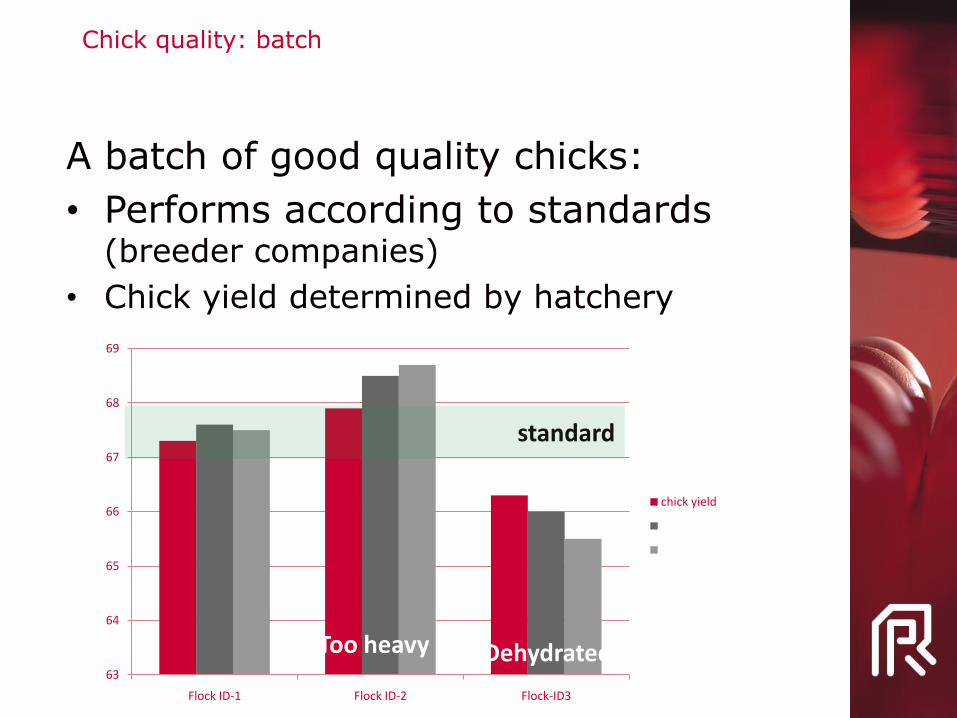
A batch of good quality chicks:
• Performs according to standards (breeder companies)
• Chick yield determined by hatchery
63
64
65
66
67
68
69
Flock ID-1 Flock ID-2 Flock-ID3
chick yield
standard
Too heavy Dehydrated
Chick quality: batch
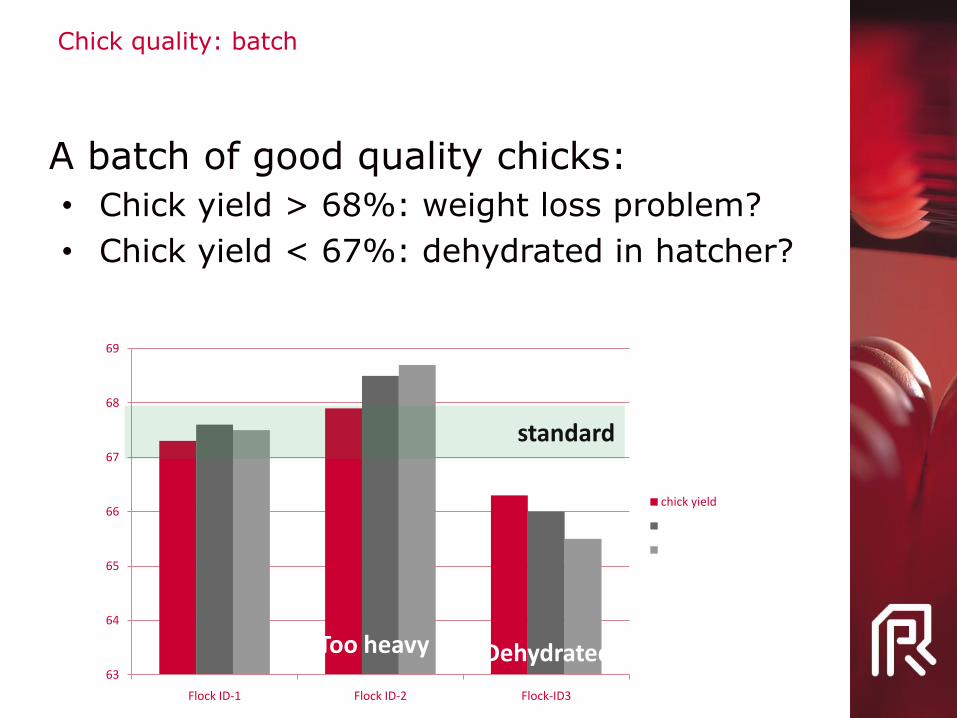
A batch of good quality chicks:
• Chick yield > 68%: weight loss problem?
• Chick yield < 67%: dehydrated in hatcher?
63
64
65
66
67
68
69
Flock ID-1 Flock ID-2 Flock-ID3
chick yield
standard
Too heavy Dehydrated
Chick quality: batch
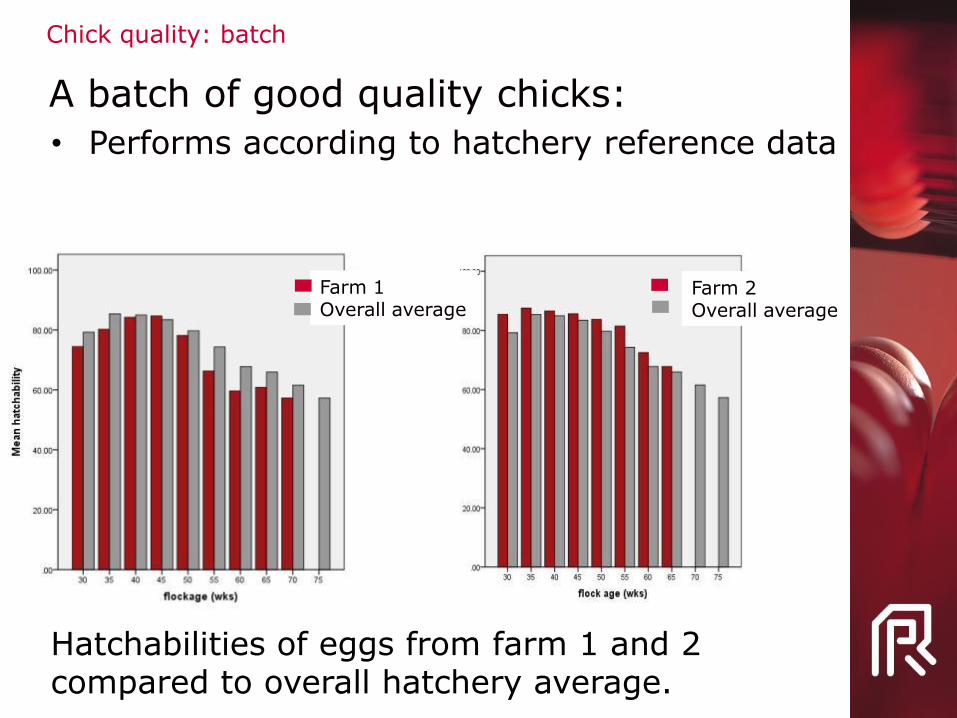
Hatchabilities of eggs from farm 1 and 2 compared to overall hatchery average.
Farm 1Overall average
Farm 2Overall average
A batch of good quality chicks:
• Performs according to hatchery reference data
Chick quality: batch

• Results of Dutch reference hatcheries
• Average results for one flock*: 87 % of eggs set (single stage incubation)
*Presented results summarize different breeds
** Pasgar-score
Flock age(weeks)
Hatchability(eggs set)
Hatchability(after candling)
Chick quality**
Mortalityfirst week
30 85 94 9.2 < 1 %
32 89 96 9.3 < 1 %
45 89 96 9.3 < 1 %
54 85 95 8.8 < 1 %
63 60 92 8.5 < 1 %
Chick quality: batch
A batch of good quality chicks:
• Performs according to hatchery reference data
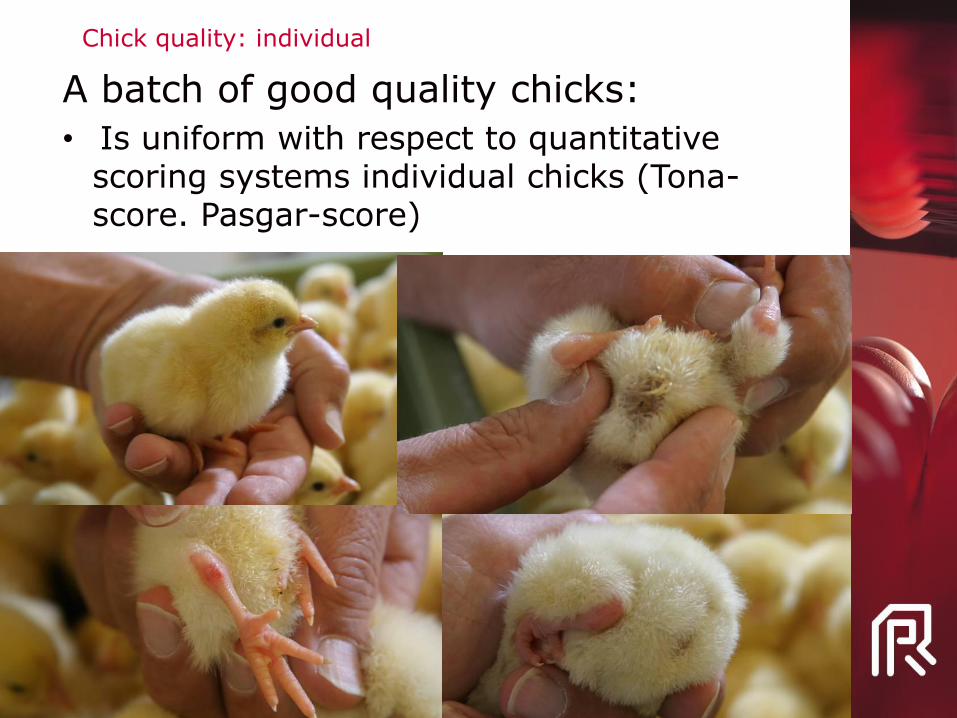
Chick quality: individual
A batch of good quality chicks:
• Is uniform with respect to quantitative scoring systems individual chicks (Tona-score. Pasgar-score)

Day old chick quality evaluation
Outline of presentation
• Definition chick quality in hatchery practice:
. Batches of chicks
. Individual chicks
• Evaluation day old chick quality. Scoring based on qualitative parameters. Quantitative parameters
• Factors influencing chick quality parameters
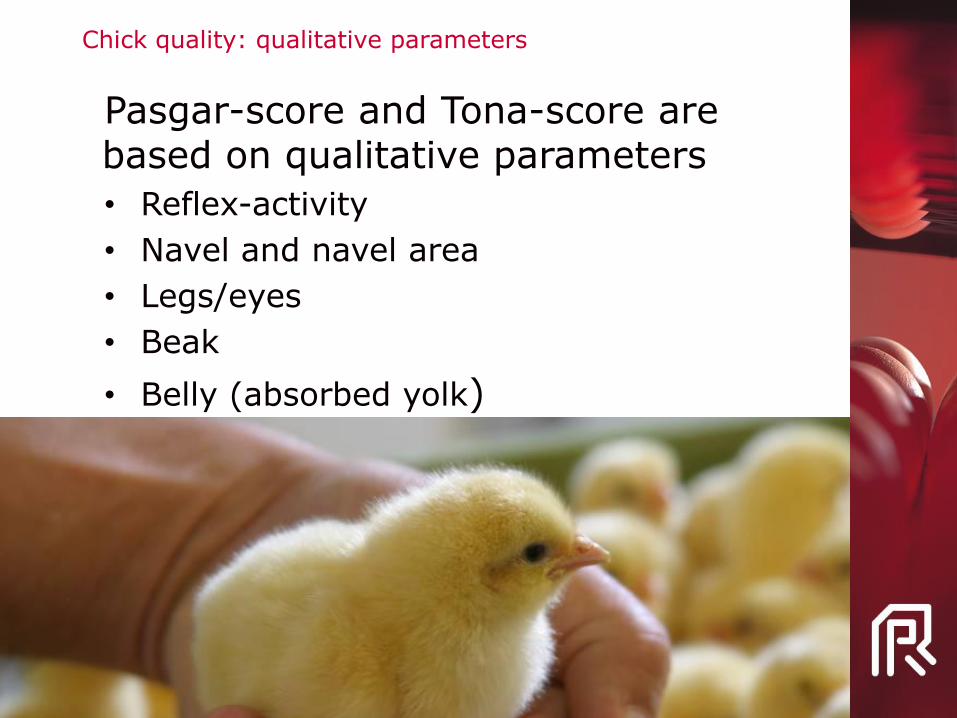
Pasgar-score and Tona-score are based on qualitative parameters
• Reflex-activity
• Navel and navel area
• Legs/eyes
• Beak
• Belly (absorbed yolk)
Chick quality: qualitative parameters
Chick quality: qualitative parameters
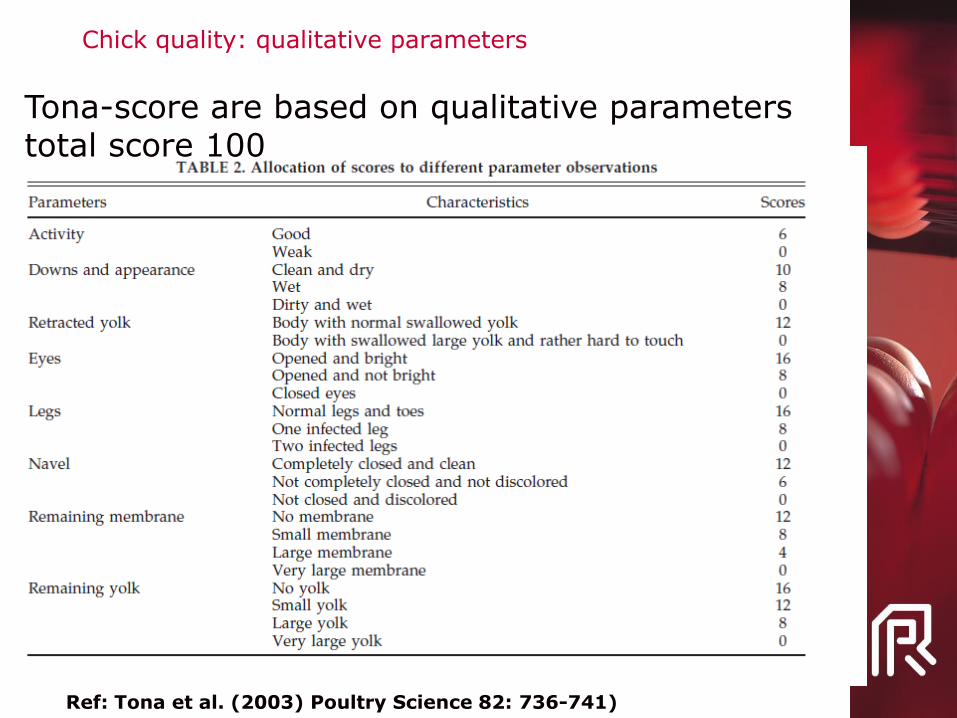
Ref: Tona et al. (2003) Poultry Science 82: 736-741)
Tona-score are based on qualitative parameters total score 100

Ref: Tona et al. (2003) Poultry Science 82: 736-741)
Tona-score are based on qualitative parameters total score 100
Chick quality: qualitative parameters

Ref: Tona et al. (2003) Poultry Science 82: 736-741)
Tona-score are based on qualitative parameters total score 100
• Level of score is related to importance to contribution of survival of chicken
Parameter characteristic scores
Legs •Normal legs and toes•One infected (red) leg
•Two infected (red) legs
•16•8•0
activity •Good•weak
•6•0
Chick quality: qualitative parameters

Pasgar©score: top quality chick = 10
Chick quality: qualitative parameters
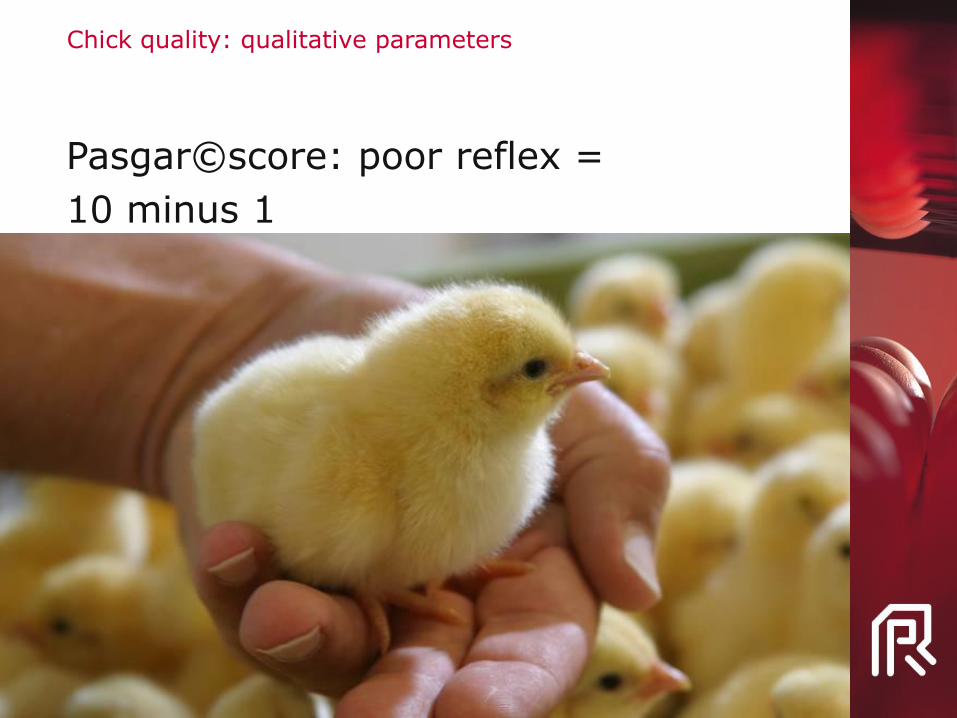
Pasgar©score: poor reflex =
10 minus 1
Chick quality: qualitative parameters

Pasgar©score: poor navel =
10 minus 1
Chick quality: qualitative parameters
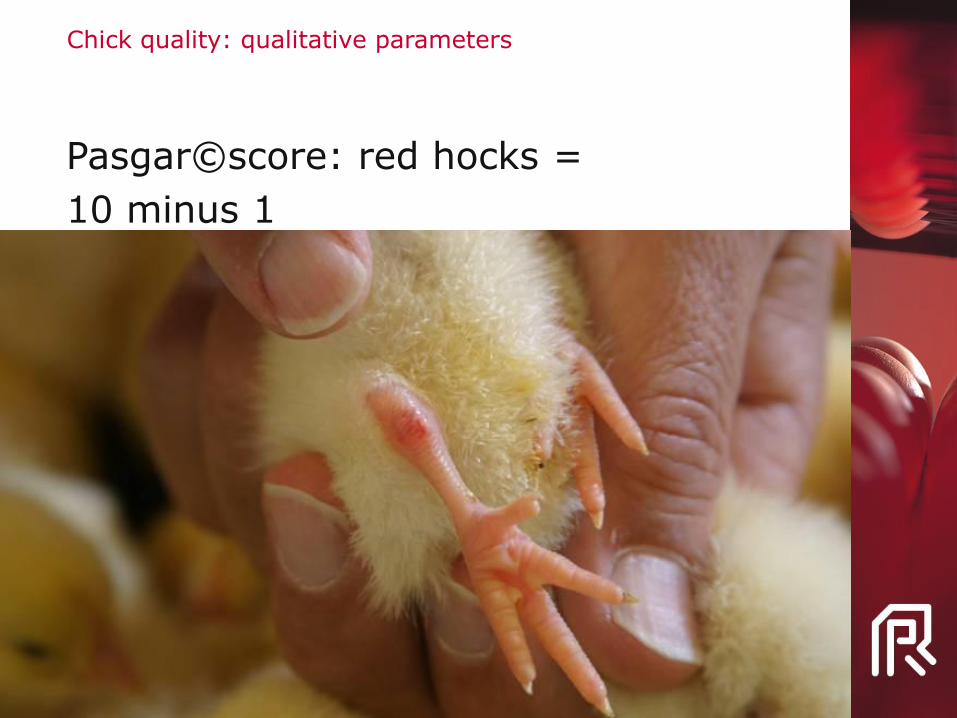
Pasgar©score: red hocks =
10 minus 1
Chick quality: qualitative parameters
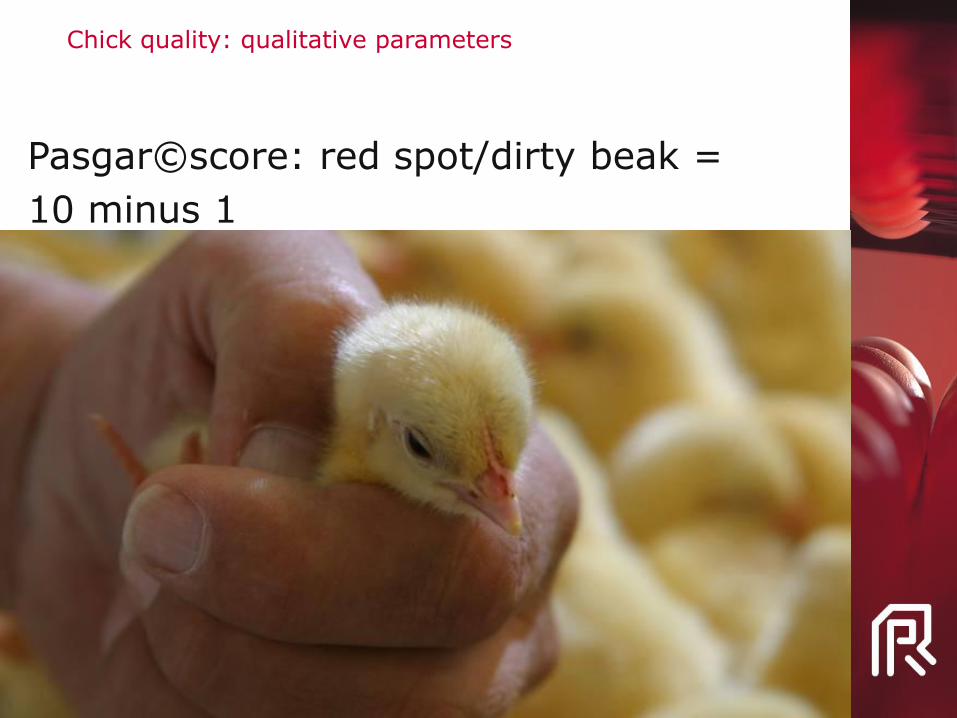
Pasgar©score: red spot/dirty beak =
10 minus 1
Chick quality: qualitative parameters

Pasgar©score full belly =
10 minus 1
Chick quality: qualitative parameters

Pasgar©score: an example
Chick reflex navel leg beak belly Pasgar©score
1 0 1 0 0 1 8
2 0 0 0 0 0 10
3 0 1 1 1 0 7
4 0 0 0 0 0 10
5 0 1 0 0 0 9
6 0 1 0 0 0 9
7 1 0 0 0 1 8
total 1 4 1 1 2 61
Average Pasgarscore = 61/7 = 8.7
Navel problems in 4 out 7 chicks = 57%
Chick quality: qualitative parameters

Pasgar-score and Tona-score are based on qualitative parameters
• Tona-score more detailed
• Pasgar-score simple easy to teach
Chick quality: qualitative parameters

Day old chick quality evaluation
Outline of presentation
• Definition chick quality in hatchery practice:
. Batches of chicks
. Individual chicks
• Evaluation day old chick quality. Scoring based on qualitative parameters. Quantitative parameters
• Factors influencing chick quality parameters

Day old chick quality evaluation
How to use the Tona- and Pasgar-score?
What do they tell us?
• Relationship performance in farm low!(except red hocks De Jong et al 2004)
• Get more insight in ‘chick quality’
• Tool to improve incubation protocols

Day old chick quality evaluation
How to interpret Pasgar-score?
• Relationship red hocks and leg weakness week 6 (De Jong et al. 2004)
Test Parameter Pasgar-score 7*
Pasgar-score 10
P-value
Growth Relative growth fist week (%) 215.4 225.1 0.03
Walking ability
Step width (cm) at day 39
9.55 8.61 0.006
Latency –to-lie (sec) at day 40
210 263 0.06
* Including red hocks

Pasgar-score used to improve incubation protocol
• Low incubation temperature (red line)related to low Pasgar score
Temperature set points
Egg shell temperatures
Day old chick quality evaluation
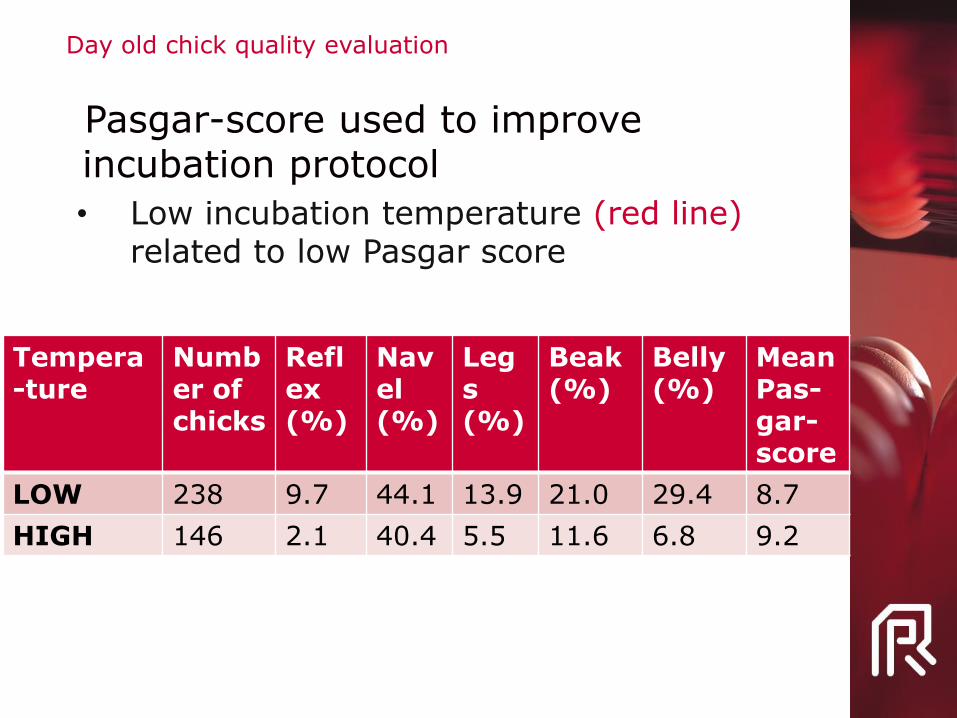
Pasgar-score used to improve incubation protocol
• Low incubation temperature (red line)related to low Pasgar score
Day old chick quality evaluation
Tempera-ture
Number of chicks
Reflex(%)
Navel(%)
Legs(%)
Beak(%)
Belly(%)
MeanPas-gar-score
LOW 238 9.7 44.1 13.9 21.0 29.4 8.7
HIGH 146 2.1 40.4 5.5 11.6 6.8 9.2
Day old chick quality evaluation
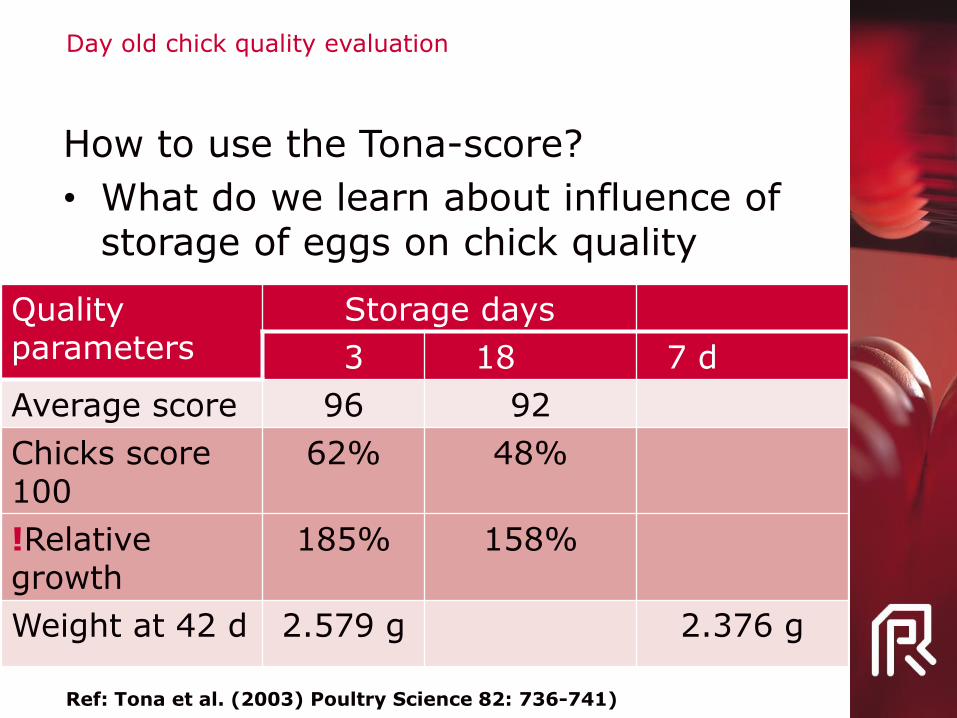
How to use the Tona-score?
• What do we learn about influence of storage of eggs on chick quality
Quality parameters
Storage days
33 1818 77 d
Average score 96 92
Chicks score 100
62% 48%
!Relativegrowth
185% 158%
Weight at 42 d 2.579 g 2.376 g
Ref: Tona et al. (2003) Poultry Science 82: 736-741)
Day old chick quality evaluation
What do quantitative score tell us?
• Relationship performance in farm low!(except red hocks De Jong et al 2004)
• Get more insight of egg storage and incubation temperature on ‘chick quality’
• Tool to improve incubation protocols

Thank you
Dr. Marleen BoerjanMay 2014