Integrated genomic analyses in PDX model reveal a cyclin ...
Day, F. R., et al., & Perry, J. R. B. (2017). Genomic analyses identifyhundreds of variants associated with age at menarche and support a role forpuberty timing in cancer risk. Nature Genetics.https://doi.org/10.1038/ng.3841
Peer reviewed version
Link to published version (if available):10.1038/ng.3841
Link to publication record in Explore Bristol ResearchPDF-document
This is the author accepted manuscript (AAM). The final published version (version of record) is available onlinevia Nature at http://www.nature.com/ng/journal/vaop/ncurrent/full/ng.3841.html. Please refer to any applicableterms of use of the publisher.
University of Bristol - Explore Bristol ResearchGeneral rights
This document is made available in accordance with publisher policies. Please cite only the publishedversion using the reference above. Full terms of use are available:http://www.bristol.ac.uk/pure/about/ebr-terms

Genomic analyses identify hundreds of variants associated with age at menarche and 1
support a role for puberty timing in cancer risk 2
Felix R. Day*1, Deborah J. Thompson*2, Hannes Helgason*3,4, Daniel I. Chasman5,6, Hilary 3
Finucane7,8, Patrick Sulem3, Katherine S. Ruth9, Sean Whalen10, Abhishek K. Sarkar11,12, 4
Eva Albrecht13, Elisabeth Altmaier14,15, Marzyeh Amini16, Caterina M. Barbieri17, Thibaud 5
Boutin18, Archie Campbell19, Ellen Demerath20, Ayush Giri21,22, Chunyan He23,24, Jouke J. 6
Hottenga25, Robert Karlsson26, Ivana Kolcic27, Po-Ru Loh7,28, Kathryn L. Lunetta29,30, 7
Massimo Mangino31,32, Brumat Marco33, George McMahon34, Sarah E. Medland35, Ilja M. 8
Nolte16, Raymond Noordam36, Teresa Nutile37, Lavinia Paternoster34,38, Natalia Perjakova39, 9
Eleonora Porcu40, Lynda M. Rose5, Katharina E. Schraut41,42, Ayellet V. Segrè43, Albert V. 10
Smith44,45, Lisette Stolk46, Alexander Teumer47, Irene L. Andrulis48,49, Stefania Bandinelli50, 11
Matthias W. Beckmann51, Javier Benitez52,53, Sven Bergmann54,55, Murielle Bochud56, Eric 12
Boerwinkle57, Stig E. Bojesen58-60, Manjeet K. Bolla2, Judith S. Brand26, Hiltrud Brauch61-63, 13
Hermann Brenner63-65, Linda Broer46, Thomas Brüning66, Julie E. Buring5,6, Harry Campbell42, 14
Eulalia Catamo67, Stephen Chanock68, Georgia Chenevix-Trench69, Tanguy Corre54-56, 15
Fergus J. Couch70, Diana L. Cousminer71,72, Angela Cox73, Laura Crisponi40, Kamila Czene26, 16
George Davey-Smith34,38, Eco J.C.N de Geus25, Renée de Mutsert74, Immaculata De Vivo7,75, 17
Joe Dennis2, Peter Devilee76,77, Isabel dos-Santos-Silva78, Alison M. Dunning79, Johan G. 18
Eriksson80, Peter A. Fasching51,81, Lindsay Fernández-Rhodes82, Luigi Ferrucci83, Dieter 19
Flesch-Janys84,85, Lude Franke86, Marike Gabrielson26, Ilaria Gandin33, Graham G. Giles87,88, 20
Harald Grallert14,15,89, Daniel F. Gudbjartsson3,4, Pascal Guénel90, Per Hall26, Emily 21
Hallberg91, Ute Hamann92, Tamara B. Harris93, Catharina A. Hartman94, Gerardo Heiss82, 22
Maartje J. Hooning95, John L. Hopper88, Frank Hu75,96, David Hunter7,75,96, M. Arfan Ikram97, 23
Hae Kyung Im98, Marjo-Riitta Järvelin99-103, Peter K. Joshi42, David Karasik6,104, Zoltan 24
Kutalik54,56, Genevieve LaChance31, Diether Lambrechts105,106, Claudia Langenberg1, Lenore 25
J. Launer93, Joop S.E. Laven107, Stefania Lenarduzzi67, Jingmei Li26, Penelope A. Lind35, 26
Sara Lindstrom108, YongMei Liu109, Jian'an Luan1, Reedik Mägi39, Arto Mannermaa110-112, 27
Hamdi Mbarek25, Mark I. McCarthy113-115, Christa Meisinger14,116, Thomas Meitinger117, 28
Cristina Menni31, Andres Metspalu39, Kyriaki Michailidou2,118, Lili Milani39, Roger L. Milne87,88, 29
Grant W. Montgomery119, Anna M. Mulligan120,121, Mike A. Nalls122, Pau Navarro18, Heli 30
Nevanlinna123, Dale R. Nyholt124, Albertine J. Oldehinkel125, Tracy A. O'Mara69, Sandosh 31
Padmanabhan126, Aarno Palotie28,127-131, Nancy Pedersen26, Annette Peters14,89, Julian 32
Peto78, Paul D.P. Pharoah2,79, Anneli Pouta132, Paolo Radice133, Iffat Rahman134, Susan M. 33
Ring34,38, Antonietta Robino67, Frits R. Rosendaal74, Igor Rudan42, Rico Rueedi54,55, Daniela 34
Ruggiero37, Cinzia F. Sala17, Marjanka K. Schmidt135,136, Robert A. Scott1, Mitul Shah79, 35
Rossella Sorice37, Melissa C. Southey137, Ulla Sovio99,138, Meir Stampfer7,75, Maristella 36
Steri40, Konstantin Strauch13,139, Toshiko Tanaka83, Emmi Tikkanen131,140, Nicholas J. 37
Timpson34,38, Michela Traglia17, Thérèse Truong90, Jonathan P. Tyrer79, André G. 38
Uitterlinden46,97, Digna R. Velez Edwards22,141,142, Veronique Vitart18, Uwe Völker143, Peter 39
Vollenweider144, Qin Wang2, Elisabeth Widen131, Ko Willems van Dijk77,145,146, Gonneke 40
Willemsen25, Robert Winqvist147,148, Bruce H.R Wolffenbuttel149, Jing Hua Zhao1, Magdalena 41
Zoledziewska40, Marek Zygmunt150, Behrooz Z. Alizadeh16, Dorret I. Boomsma25, Marina 42
Ciullo37, Francesco Cucca40,151, Tõnu Esko28,39, Nora Franceschini82, Christian Gieger14,15,89, 43
Vilmundur Gudnason44,45, Caroline Hayward18, Peter Kraft7,152, Debbie A. Lawlor34,38, Patrik 44
K.E Magnusson26, Nicholas G. Martin35, Dennis O. Mook-Kanamori74,153, Ellen A. Nohr154, 45
Ozren Polasek27, David Porteous19, Alkes L. Price7,8,28, Paul M. Ridker5,6, Harold Snieder16, 46
Tim D. Spector31, Doris Stöckl14,155, Daniela Toniolo17, Sheila Ulivi67, Jenny A. Visser46, 47

Henry Völzke47, Nicholas J. Wareham1, James F. Wilson18,42, The LifeLines Cohort Study156, 48
The InterAct Consortium156, kConFab/AOCS Investigators156, Endometrial Cancer 49
Association Consortium156, Ovarian Cancer Association Consortium156, PRACTICAL 50
consortium156, Amanda B. Spurdle69, Unnur Thorsteindottir3,44, Katherine S. Pollard10,157, 51
Douglas F. Easton2,79, Joyce Y. Tung158, Jenny Chang-Claude159,160, David Hinds158, Anna 52
Murray9, Joanne M. Murabito30,161, Kari Stefansson*3,44, Ken K. Ong*1,162 and John R.B 53
Perry*1 54
* denotes equal contribution 55
Affiliations 56
1. MRC Epidemiology Unit, University of Cambridge School of Clinical Medicine, Box 285 57 Institute of Metabolic Science, Cambridge Biomedical Campus, Cambridge, CB2 0QQ, UK. 58 2. Centre for Cancer Genetic Epidemiology, Department of Public Health and Primary Care, 59 University of Cambridge, CB1 8RN, UK. 60 3. deCODE genetics/Amgen, Inc., IS-101 Reykjavik, Iceland. 61 4. School of Engineering and Natural Sciences, University of Iceland, IS-101 Reykjavik, 62 Iceland,. 63 5. Division of Preventive Medicine, Brigham and Women's Hospital, Boston, MA 02215. 64 6. Harvard Medical School, Boston, MA 02115, USA. 65 7. Department of Epidemiology, Harvard School of Public Health, Boston, MA 02115, USA. 66 8. Department of Mathematics, Massachusetts Institute of Technology, Cambridge, 67 Massachusetts 02139-4307, USA. 68 9. Genetics of Complex Traits, University of Exeter Medical School, University of Exeter, 69 Exeter, EX2 5DW, UK. 70 10. Gladstone Institutes, San Francisco, California, 94158, USA. 71 11. Computer Science and Artificial Intelligence Lab, Massachusetts Institute of Technology, 72 Cambridge, MA, USA. 73 12. Broad Institute of the Massachusetts Institute of Technology and Harvard University, 74 140 Cambridge 02142, MA, USA. 75 13. Institute of Genetic Epidemiology, Helmholtz Zentrum München - German Research 76 Center for Environmental Health, 85764 Neuherberg, Germany. 77 14. Institute of Epidemiology II, Helmholtz Zentrum München - German Research Center for 78 Environmental Health, 85764 Neuherberg, Germany. 79 15. Research Unit of Molecular Epidemiology, Helmholtz Zentrum München - German 80 Research Center for Environmental Health, 85764 Neuherberg, Germany. 81 16. Department of Epidemiology, University of Groningen, University Medical Center 82 Groningen, Groningen, The Netherlands. 83 17. Genetics of Common Disorders Unit, IRCCS San Raffaele Scientific Institute and Vita-84 Salute San Raffaele University, Milan, Italy. 85 18. Medical Research Council Human Genetics Unit, Institute of Genetics and Molecular 86 Medicine, University of Edinburgh, Edinburgh EH4 2XU, UK. 87 19. Medical Genetics Section, Centre for Genomic and Experimental Medicine, Institute of 88 Genetics and Molecular Medicine, University of Edinburgh, Edinburgh EH4 2XU, UK. 89 20. Division of Epidemiology & Community Health, University of Minnesotta, Minneapolis 90 MN 55455. 91 21. Division of Epidemiology, Institute for Medicine and Public Health, Vanderbilt University, 92 Nashville, TN 37235, USA. 93 22. Vanderbilt Genetics Institute, Vanderbilt University, Nashville, TN. 94 23. Department of Epidemiology, Indiana University Richard M. Fairbanks School of Public 95 Health, Indianapolis, IN 46202, USA. 96 24. Indiana University Melvin and Bren Simon Cancer Center, Indianapolis, IN 46202, USA. 97
25. Department of Biological Psychology, VU University Amsterdam, van der 98 Boechorststraat 1, 1081 BT, Amsterdam, The Netherlands. 99 26. Department of Medical Epidemiology and Biostatistics, Karolinska Institutet, 17177 100 Stockholm, Sweden. 101 27. Faculty of Medicine, University of Split, Split, Croatia. 102 28. Program in Medical and Population Genetics, Broad Institute, Cambridge, MA, USA. 103 29. Boston University School of Public Health, Department of Biostatistics. Boston, 104 Massachusetts 02118, USA. 105 30. NHLBI's and Boston University's Framingham Heart Study, Framingham, 106 Massachusetts 01702-5827, USA. 107 31. Department of Twin Research and Genetic Epidemiology, King's College London, 108 London SE1 7EH, UK. 109 32. National Institute for Health Research (NIHR) Biomedical Research Centre at Guy’s and 110 St. Thomas’ Foundation Trust, London, UK. 111 33. Department of Clinical Medical Sciences, Surgical and Health, University of Trieste, 112 34149 Trieste, Italy. 113 34. School of Social and Community Medicine, University of Bristol, Bristol BS8 2BN, UK. 114 35. QIMR Berghofer Medical Research Institute, Brisbane, Queensland, Australia. 115 36. Department of Internal Medicine, Section Gerontology and Geriatrics, Leiden University 116 Medical Center, Leiden, the Netherlands. 117 37. Institute of Genetics and Biophysics - CNR, via Pietro Castellino 111, 80131, Naples, 118 Italy. 119 38. MRC Integrative Epidemiology Unit, University of Bristol, Bristol, UK. 120 39. Estonian Genome Center, University of Tartu, Tartu, 51010, Estonia. 121 40. Institute of Genetics and Biomedical Research, National Research Council, Cagliari, 122 09042 Sardinia, Italy. 123 41. Centre for Cardiovascular Sciences, Queen's Medical Research Institute, University of 124 Edinburgh, Royal Infirmary of Edinburgh, Little France Crescent, Edinburgh, EH16 4TJ, 125 Scotland. 126 42. Centre for Global Health Research, Usher Institute of Population Health Sciences and 127 Informatics, University of Edinburgh, Teviot Place, Edinburgh, EH8 9AG, Scotland. 128 43. Cancer Program, Broad Institute, Cambridge, MA, USA. 129 44. Faculty of Medicine, University of Iceland, IS-101 Reykjavik, Iceland. 130 45. Icelandic Heart Association, Kopavogur, Iceland. 131 46. Department of Internal Medicine, Erasmus MC, 3015GE Rotterdam, the Netherlands. 132 47. Institute for Community Medicine, University Medicine Greifswald, 17475 Greifswald, 133 Germany. 134 48. Fred A. Litwin Center for Cancer Genetics, Lunenfeld-Tanenbaum Research Institute of 135 Mount Sinai Hospital, Toronto, ON, Canada. 136 49. Department of Molecular Genetics, University of Toronto, Toronto, Ontario, Canada. 137 50. Geriatric Unit, Azienda Sanitaria di Firenze, Florence, Italy. 138 51. Department of Gynaecology and Obstetrics, University Hospital Erlangen, Friedrich-139 Alexander University Erlangen-Nuremberg, Erlangen, Germany. 140 52. Human Genetics Group, Human Cancer Genetics Program, Spanish National Cancer 141 Research Centre (CNIO), Madrid, Spain. 142 53. Centro de Investigación en Red de Enfermedades Raras (CIBERER), Valencia, Spain. 143 54. Swiss Institute of Bioinformatics, CH-1015, Lausanne, Switzerland. 144 55. Department of Computational Biology, University of Lausanne, Lausanne, Switzerland. 145 56. Institute of Social and Preventive Medicine, University Hospital of Lausanne, Lausanne, 146 Switzerland. 147 57. Human Genetics Center, School of Public Health, The University of Texas Health 148 Science Center at Houston, Houston, TX 77030, USA. 149 58. Copenhagen General Population Study, Herlev Hospital, Copenhagen University 150 Hospital, University of Copenhagen, Copenhagen, Denmark. 151
59. Department of Clinical Biochemistry, Herlev Hospital, Copenhagen University Hospital, 152 University of Copenhagen, Copenhagen, Denmark. 153 60. Faculty of Health and Medical Sciences, University of Copenhagen, Copenhagen, 154 Denmark. 155 61. Dr. Margarete Fischer-Bosch-Institute of Clinical Pharmacology, Stuttgart, Germany. 156 62. University of Tübingen, Tübingen, Germany. 157 63. German Cancer Consortium (DKTK), German Cancer Research Center (DKFZ), 158 Heidelberg, Germany. 159 64. Division of Clinical Epidemiology and Aging Research, German Cancer Research 160 Center (DKFZ), Heidelberg, Germany. 161 65. Division of Preventive Oncology, German Cancer Research Center (DKFZ) and National 162 Center for Tumor Diseases (NCT), Heidelberg, Germany. 163 66. Institute for Prevention and Occupational Medicine of the German Social Accident 164 Insurance, Institute of the Ruhr University Bochum (IPA), Bochum, Germany. 165 67. Institute for Maternal and Child Health - IRCCS “Burlo Garofolo”, 34137 Trieste, Italy. 166 68. Division of Cancer Epidemiology and Genetics, National Cancer Institute, Bethesda, 167 MD, USA. 168 69. Department of Genetics, QIMR Berghofer Medical Research Institute, Brisbane, 169 Australia. 170 70. Department of Laboratory Medicine and Pathology, Mayo Clinic, Rochester, MN, USA. 171 71. Division of Genetics, Children's Hospital of Philadelphia, Philadelphia, PA, USA. 172 72. Department of Genetics, University of Pennsylvania, Philadelphia, PA, USA. 173 73. Academic Unit of Molecular Oncology, Department of Oncology and Metabolism, 174 University of Sheffield, Sheffield, UK. 175 74. Department of Clinical Epidemiology, Leiden University Medical Center, Leiden, the 176 Netherlands. 177 75. Channing Division of Network Medicine, Department of Medicine, Brigham and 178 Women’s Hospital and Harvard Medical School, Boston, MA 02115, USA. 179 76. Department of Pathology, Leiden University Medical Center, Leiden, The Netherlands. 180 77. Department of Human Genetics, Leiden University Medical Center, 2300 RC Leiden, 181 The Netherlands. 182 78. Non-communicable Disease Epidemiology Department, London School of Hygiene and 183 Tropical Medicine, London, UK. 184 79. Centre for Cancer Genetic Epidemiology, Department of Oncology, University of 185 Cambridge, Cambridge, CB1 8RN, UK. 186 80. Department of General Practice and Primary health Care, University of Helsinki, 187 Finland. 188 81. David Geffen School of Medicine, Department of Medicine Division of Hematology and 189 Oncology, University of California at Los Angeles, CA, USA. 190 82. Department of Epidemiology, Gillings School of Global Public Health, University of North 191 Carolina, Chapel Hill, NC 27514. 192 83. Longitudinal Studies Section, Translational Gerontology Branch, National Institute on 193 Aging, Baltimore, Maryland 21224, United States of America. 194 84. Institute for Medical Biometrics and Epidemiology, University Clinic Hamburg-195 Eppendorf, Hamburg, Germany. 196 85. Department of Cancer Epidemiology/Clinical Cancer Registry, University Clinic 197 Hamburg-Eppendorf, Hamburg, Germany. 198 86. Department of Genetics, University of Groningen, University Medical Centre Groningen, 199 Groningen, The Netherlands. 200 87. Cancer Epidemiology Centre, Cancer Council Victoria, Melbourne, Australia. 201 88. Centre for Epidemiology and Biostatistics, Melbourne School of Population and Global 202 Health, The University of Melbourne, Melbourne, Australia. 203 89. German Center for Diabetes Research, 85764 Neuherberg, Germany. 204 90. Cancer & Environment Group, Center for Research in Epidemiology and Population 205 Health (CESP), INSERM, University Paris-Sud, University Paris-Saclay, Villejuif, France. 206
91. Division of Epidemiology, Department of Health Sciences Research, Mayo Clinic, 207 Rochester, Minnesota, USA. 208 92. Molecular Genetics of Breast Cancer, Deutsches Krebsforschungszentrum (DKFZ), 209 Heidelberg, Germany. 210 93. Laboratory of Epidemiology and Population Sciences, National Institute on Aging, 211 Intramural Research Program, National Institutes of Health, Bethesda, Maryland, 20892, 212 USA. 213 94. Department of Psychiatry, University of Groningen, University Medical Center 214 Groningen, Groningen, The Netherlands. 215 95. Department of Medical Oncology, Family Cancer Clinic, Erasmus MC Cancer Institute, 216 Rotterdam, The Netherlands. 217 96. Department of Nutrition, Harvard School of Public Health, Boston, MA 02115, USA. 218 97. Department of Epidemiology, Erasmus MC, Rotterdan, the Netherlands. 219 98. Section of Genetic Medicine, Department of Medicine, University of Chicago, Chicago, 220 IL, USA. 221 99. Department of Epidemiology and Biostatistics, MRC Health Protection Agency (HPA) 222 Centre for Environment and Health, School of Public Health, Imperial College London, UK. 223 100. Biocenter Oulu, P.O.Box 5000, Aapistie 5A, FI-90014 University of Oulu, Finland. 224 101. Department of Children and Young People and Families, National Institute for Health 225 and Welfare, Aapistie 1, Box 310, FI-90101 Oulu, Finland. 226 102. Institute of Health Sciences, P.O.Box 5000, FI-90014 University of Oulu, Finland. 227 103. Unit of Primary Care, Oulu University Hospital, Kajaanintie 50, P.O.Box 20, FI-90220 228 Oulu, 90029 OYS, Finland. 229 104. Hebrew SeniorLife Institute for Aging Research, Boston, MA, 02131, USA. 230 105. Laboratory for Translational Genetics, Department of Oncology, University of Leuven, 231 Leuven, Belgium. 232 106. Vesalius Research Center (VRC), VIB, Leuven, Belgium. 233 107. Division of Reproductive Medicine, Department of Obstetrics and Gynaecology, 234 Erasmus MC, Rotterdam, The Netherlands. 235 108. Department of Epidemiology, School of Public Health, University of Washington, 236 Seattle, WA 98195, USA. 237 109. Center for Human Genetics, Division of Public Health Sciences, Wake Forest School of 238 Medicine. 239 110. Translational Cancer Research Area, University of Eastern Finland, Kuopio, Finland. 240 111. Institute of Clinical Medicine, Pathology and Forensic Medicine, University of Eastern 241 Finland, Kuopio, Finland. 242 112. Imaging Center, Department of Clinical Pathology, Kuopio University Hospital, Kuopio, 243 Finland. 244 113. NIHR Oxford Biomedical Research Centre, Churchill Hospital, OX3 7LE Oxford, UK. 245 114. Oxford Centre for Diabetes, Endocrinology, & Metabolism, University of Oxford, 246 Churchill Hospital, OX3 7LJ Oxford, UK. 247 115. Wellcome Trust Centre for Human Genetics, University of Oxford, Oxford, UK. 248 116. Central Hospital of Augsburg, MONICA/KORA Myocardial Infarction Registry, 249 Augsburg, Germany. 250 117. Institute of Human Genetics, Helmholtz Zentrum München, German Research Center 251 for Environmental Health, Neuherberg, Germany. 252 118. Department of Electron Microscopy/Molecular Pathology, The Cyprus Institute of 253 Neurology and Genetics, Nicosia, Cyprus. 254 119. Institute for Molecular Bioscience, The University of Queensland, Brisbane, Australia. 255 120. Department of Laboratory Medicine and Pathobiology, University of Toronto, Toronto, 256 ON, Canada. 257 121. Laboratory Medicine Program, University Health Network, Toronto, ON, Canada. 258 122. Laboratory of Neurogenetics, National Institute on Aging, Bethesda, MD, USA. 259 123. Department of Obstetrics and Gynecology, Helsinki University Hospital, University of 260 Helsinki, Helsinki, Finland. 261
124. Institute of Health and Biomedical Innovation, Queensland University of Technology, 262 Australia. 263 125. Interdisciplinary Center Psychopathology and Emotion Regulation, University of 264 Groningen, University Medical Center Groningen, Groningen, The Netherlands. 265 126. British Heart Foundation Glasgow Cardiovascular Research Centre, Institute of 266 Cardiovascular and Medical Sciences, College of Medical, Veterinary and Life Sciences, 267 University of Glasgow, Glasgow G12 8TA, UK. 268 127. Psychiatric & Neurodevelopmental Genetics Unit, Department of Psychiatry, 269 Massachusetts General Hospital, Boston, MA, USA. 270 128. Stanley Center for Psychiatric Research, Broad Institute of MIT and Harvard, 271 Cambridge, Massachusetts 02142, USA. 272 129. Wellcome Trust Sanger Institute, Wellcome Trust Genome Campus, Hinxton, UK. 273 130. Analytic and Translational Genetics Unit, Massachusetts General Hospital and Harvard 274 Medical School, Boston, Massachusetts, USA. 275 131. Institute for Molecular Medicine Finland (FIMM), University of Helsinki, Finland. 276 132. National Institute for Health and Welfare, Finland. 277 133. Unit of Molecular Bases of Genetic Risk and Genetic Testing, Department of 278 Preventive and Predictive Medicine, Fondazione IRCCS Istituto Nazionale dei Tumori (INT), 279 Milan, Italy. 280 134. Institute of Environmental Medicine, Karolinska Institutet, Stockholm, Sweden. 281 135. Division of Molecular Pathology, The Netherlands Cancer Institute - Antoni van 282 Leeuwenhoek Hospital, Amsterdam, The Netherlands. 283 136. Division of Psychosocial Research and Epidemiology, The Netherlands Cancer 284 Institute - Antoni van Leeuwenhoek hospital, Amsterdam, The Netherlands. 285 137. Department of Pathology, The University of Melbourne, Melbourne, Australia. 286 138. Department of Obstetrics and Gynaecology, University of Cambridge, Cambridge, 287 United Kingdom. 288 139. Institute of Medical Informatics, Biometry and Epidemiology, Chair of Genetic 289 Epidemiology, Ludwig-Maximilians-Universität, 81377 Munich, Germany. 290 140. Department of Public Health, University of Helsinki, Helsinki, Finland. 291 141. Vanderbilt Epidemiology Center, Institute for Medicine and Public Health, Vanderbilt 292 University, Nashville, TN, USA. 293 142. Department of Obstetrics and Gynecology, Vanderbilt University School of Medicine, 294 Nashville, TN, USA. 295 143. Interfaculty Institute for Genetics and Functional Genomics, University Medicine 296 Greifswald, 17475 Greifswald, Germany. 297 144. University Hospital of Lausanne, Lausanne, Switzerland. 298 145. Department of Internal Medicine, Division of Endocrinology, Leiden University Medical 299 Center, Leiden, the Netherlands. 300 146. Einthoven Laboratory for Experimental Vascular Medicine, Leiden University Medical 301 Center, Leiden, the Netherlands. 302 147. Laboratory of Cancer Genetics and Tumor Biology, Cancer and Translational Medicine 303 Research Unit, Biocenter Oulu, University of Oulu, Oulu, Finland. 304 148. Laboratory of Cancer Genetics and Tumor Biology, Northern Finland Laboratory 305 Centre NordLab, Oulu, Finland. 306 149. Department of Endocrinology, University of Groningen, University Medical Centre 307 Groningen, Groningen, The Netherlands. 308 150. Department of Obstetrics and Gynecology, University Medicine Greifswald, 17475 309 Greifswald, Germany. 310 151. University of Sassari, Department of Biomedical Sciences, Sassari, 07100 Sassari, 311 Italy. 312 152. Department of Biostatistics, Harvard School of Public Health, Boston, MA 02115, USA. 313 153. Department of Public Health and Primary Care, Leiden University Medical Center, 314 Leiden, the Netherlands. 315

154. Research Unit for Gynaecology and Obstetrics, Department of Clinical Research, 316 University of Southern Denmark, Denmark. 317 155. Department of Obstetrics and Gynaecology, Campus Grosshadern, Ludwig-318 Maximilians-University, Munich, Germany. 319 156. Full consortium membership is displayed in the supplementary material. 320 157. Division of Biostatistics, Institute for Human Genetics, and Institute for Computational 321 Health Sciences, University of California, San Francisco, California, 94158, USA. 322 158. 23andMe Inc., 899 W. Evelyn Avenue, Mountain View, California 94041, USA. 323 159. Division of Cancer Epidemiology, German Cancer Research Center (DKFZ), 324 Heidelberg, Germany. 325 160. University Cancer Center Hamburg (UCCH), University Medical Center Hamburg-326 Eppendorf, Hamburg, Germany. 327 161. Boston University School of Medicine, Department of Medicine, Section of General 328 Internal Medicine, Boston, MA 02118, USA. 329 162. Department of Paediatrics,University of Cambridge,Cambridge, CB2 0QQ, UK. 330
Correspondence to John R.B. Perry ([email protected]) and Ken K. Ong 331 ([email protected]). 332
333
334
335
336
337
Abstract 338
The timing of puberty is a highly polygenic childhood trait that is epidemiologically associated 339
with various adult diseases. Using 1000-Genome imputed genotype data in up to ~370,000 340
women, we identify 389 independent signals (P<5×10⁻⁸) for age at menarche, a notable 341
milestone in female pubertal development. In Icelandic data from deCODE, these signals 342
explain ~7.4% of the population variance in age at menarche, corresponding to ~25% of the 343
estimated heritability. We implicate ~250 genes via coding variation or associated 344
expression, demonstrating significant enrichment in neural tissues. Rare variants near 345
imprinted genes MKRN3 and DLK1 were identified, exhibiting large effects only when 346
paternally inherited. Mendelian randomization analyses indicate causal inverse associations, 347
independent of BMI, between puberty timing and risks for breast and endometrial cancers in 348
women, and prostate cancer in men. In aggregate, our findings reveal new complexity in the 349
genetic regulation of puberty timing and support causal links with cancer susceptibility. 350
Introduction 351
Puberty is the developmental stage of transition from childhood to physical and sexual 352
maturity and its timing varies markedly between individuals1. This variation reflects the 353
influence of genetic, nutritional and other environmental factors and is associated with the 354
subsequent risks for several diseases in adult life2. Our previous large-scale genomic 355
studies identified 113 independent regions associated with age at menarche (AAM), a well-356
recalled milestone of puberty in females3,4. The vast majority of those signals have 357
concordant effects on the age at voice breaking (genome-wide genetic correlation between 358
traits rg=0.74), a corresponding milestone in males5. Those genetic findings implicated a 359
diverse range of mechanisms involved in the regulation of puberty timing, identified 360
significant enrichment of AAM-associated variants in/near genes disrupted in rare disorders 361
of puberty, and highlighted shared aetiological factors between puberty timing and metabolic 362
disease outcomes2,3. 363
However, those previous studies were based on genome-wide association data that were 364
imputed to the relatively sparse HapMap2 reference panel or they used gene-centric arrays. 365
Consequently, the reported genetic signals explained only a small fraction of the population 366
variance, suggesting that several hundreds or thousands of signals are involved3,4. Here, we 367
report an enlarged genomic analysis for AAM in a nearly 2-fold higher sample of women 368
than previously3, and using more densely imputed genomic data. Our findings increase by 369
more than 3-fold the number of independently associated signals and indicate likely causal 370
effects of puberty timing on risks of various sex steroid sensitive cancers in men and women. 371
Results 372
Genome-wide array data, imputed to the 1000-Genome reference panel, were available in 373
up to 329,345 women of European ancestry. These comprised 40 studies from the 374
ReproGen consortium (N=179,117), in addition to the 23andMe, Inc. (N=76,831) and UK 375
Biobank studies (N=73,397) (Table S1). The distribution of genome-wide test statistics 376
demonstrated significant inflation (lambda GC = 1.75), however LD score regression 377
analyses confirmed that this inflation was solely due to polygenicity rather than population 378
structure (LD score intercept = 1.00, s.e 0.02). In total, 37,925 variants were associated with 379
AAM at P<5×10⁻⁸, which were resolved to 389 statistically-independent signals (Figure S1, 380

Table S2). Per-allele effect sizes ranged from ~1 week to 5 months, 16 index variants were 381
classed as low-frequency (minor allele frequency <5%; minimum observed 0.5%), and 26 382
were insertion/deletion polymorphisms. Signals were distributed evenly across all 23 383
chromosomes with respect to chromosome size (Figure S2). Of the previously reported 106 384
autosomal, 5 exome-array and 2 X-chromosome signals for AAM, all remained associated at 385
genome-wide significance, except for two common loci (reported as SCRIB/PARP10 386
[P=5x10⁻⁴] and FUT8 [P=5.4x10⁻⁷]) and one rare variant not captured by the 1000G 387
reference panel (p.W275X, TACR3). 388
Independent replication in the deCODE study (N=39,543 women) showed that 367 (94.3%) 389
of the 389 signals had directionally-concordant effects (187 at P<0.05) and 368 retained 390
genome-wide significance in a combined meta-analysis (Table S3). In aggregate, the top 391
389 index SNPs explained 7.4% of the trait variance in deCODE and 7.2% in UK Biobank 392
(the latter estimate used weights derived from a meta-analysis excluding UK Biobank). 393
These estimates are double that explained by the previously reported 106 signals3 (3.7% in 394
deCODE) and are equivalent to one quarter of the total chip-captured heritability 395
(h2SNP=32%, se=1%) for AAM, estimated in UK Biobank. 396
Consistent with our previous reports, we found a strongly shared genetic architecture 397
between AAM in women and age at voice breaking in men (considered as a continuous trait 398
in 55,871 men in 23andMe, Inc.) (genetic correlation (rg)=0.75 P=1.2×10-79). Of the 389 AAM 399
signals, 327 demonstrated directionally-consistent trends or associations with age at voice 400
breaking in men (binomial P=1.4×10-44), and 18 signals reached a conservative multiple test-401
corrected significance threshold (P<1x10⁻⁴; i.e. 0.05 / 389) (Table S4). Similarly, in UK 402
Biobank where age at voice breaking was recorded using only 3 categories, 277 and 297 of 403
the 377 autosomal loci demonstrated directionally-consistent trends or associations with 404
“relatively early voice breaking” (N=2,678 cases, N=55,763 controls, binomial P=2.4×10⁻²⁰) 405
and “relatively late voice breaking” (N=3,566 cases, P=1.9×10⁻³⁰), respectively (Table S5). 406
Implicated genes and tissues 407
We used a number of analytical techniques to implicate genes in the regulation of AAM. 408
These included: mapping of non-synonymous SNPs, gene expression QTLs and integration 409
of Hi-C chromatin interaction data. Eight of the 389 lead variants were non-synonymous, and 410
a further 24 genes were implicated by highly correlated non-synonymous variants (r2>0.8) 411
(Table S6). These include genes disrupted in rare disorders of puberty: aromatase 412
(CYP19A1, #307), gonadotropin-releasing hormone (GNRH1, #178), kisspeptin (KISS1, 413
signal #31); and the stop-gained variant in fucosyltransferase 2 (FUT2, #357) that confers 414
blood group secretor status. 415
Two approaches were used to interrogate publicly available gene expression datasets, both 416
of which use one or more SNPs (not restricted to lead SNPs) to infer patterns of gene 417
expression based on imputation reference panels (see methods). Firstly, to maximise power 418
we analysed data from the largest available eQTL dataset for any tissue (whole blood, 419
N=5,311)6, under the assumption that some causal genes and regulatory mechanisms might 420
be ubiquitously expressed or functionally involved in blood tissues. Systematic eQTL 421
integration using the Summary Mendelian Randomization approach7 prioritised 113 422
transcripts, for 60 of which there was evidence for causal or pleiotropic effects, rather than 423
coincidental overlap of signal (as indicated by HEIDI heterogeneity test P>0.009) (Table S7). 424
Secondly, we used LD score regression applied to specifically expressed genes (LDSC-425
SEG)8 to identify AAM-relevant tissues and cell types that are enriched for AAM heritability. 426
Five of the 46 GTEx tissues were positively enriched for AAM-associated variants (Figure 427
1). Notably, all of these were central nervous system tissues, including the pituitary and, 428
additionally, the hypothalamus was just below the significance threshold for enrichment 429
(P=9.8×10⁻³), consistent with the key role of this central axis2. Targeted assessment of these 430
six enriched brain tissues using MetaXcan identified 205 genes whose expression was 431
regulated by AAM-associated variants (Table S8). Of note, later AAM was associated with 432
higher transcript levels of LIN28B (#147) in the pituitary, NCOA6 (Nuclear receptor 433
coactivator 6; #365) in the cerebellum, and HSD17B12 (encoding Hydroxysteroid (17-Beta) 434
Dehydrogenase 12; #250) in various tissues. 435
To identify possible distal causal genes, we interrogated reported Hi-C data to assess if any 436
of the AAM loci are located in regions of chromatin looping9. 335 of the 389 loci were located 437
within a topologically associating domain (TAD) – a defined boundary region containing 438
chromatin contact points, each of which contained on average ~5 genes (Table S9). These 439
included 22 of the 31 gene desert regions (nearest protein-coding gene >300kb), where 440
TADs contained notable distal candidate genes such as INHBA (#158), BDNF (#248), 441
JARID2 (#128) and several gamma-aminobutyric acid receptors (#91). We also observed 442
several regions where multiple independent AAM signals all reside within one TAD 443
containing the same single gene – RORB (signal #200 intronic, signal #199 ~200kb 444
downstream, #198 ~1.2Mb downstream), THRB (#67 intronic, #68 ~180kb upstream) and 445
TACR3 (#96 5’UTR, #97 ~25kb upstream, #98 ~133kb upstream and #95 ~263Kb 446
downstream). 447
66 AAM signals were located in a specific contact point (between 5-25kb in size) within the 448
335 TADs, indicating a direct physical connection between these signals and a distal 449
genomic region, on average ~320kb away. This included the previously reported example of 450
the BMI-associated (and AAM-associated) FTO SNP and a distal IRX3 promoter ~1Mb away 451
(signal #326)10. The longest chromatin interaction observed was ~38.6Mb, where two distinct 452
AAM signals located ~300kb apart (#206 and #207) were both in contact with the same 453
distal genomic region ~38.6Mb away that contains only one gene: prostaglandin E synthase 454
2 (PTGES2). 455
Transcription factor binding enrichment 456
To identify functional gene networks implicated in the regulation of AAM, we tested for 457
enriched co-occurrence of AAM associations and predicted regulators within 226 enhancer 458
modules combining DNaseI hypersensitive sites and chromatin states in 111 cell types and 459
tissues. In total, we tested 2,382 transcription factor-enhancer module combinations. Sixteen 460
transcription factor motifs were enriched for co-occurrence with AAM-associated variants 461
within enhancer regions at study level significance (FDR<0.05) (Table S10). Furthermore, 5 462
of the 16 motif-associated transcription factors also mapped within 1Mb of an index AAM-463
associated SNP. These transcription factors included notable candidates; firstly, pituitary 464
homeobox 1 (PITX1), is located within 50kb of genome-wide significant SNPs (~500kb from 465
lead index #114). Secondly, SMAD3, a gene recently implicated in susceptibility to dizygous 466
twinning11, is located within 600kb of an index SNP and its expression in several GTEx brain 467
tissues is genetically correlated with AAM. Thirdly, RXRB is located within ~500kb of a novel 468
index SNP (signal #133), and it represents the fifth (out of nine) retinoid-related receptor 469
gene implicated by genome-wide significant AAM variants. This set now includes all three 470
retinoid X receptor genes (RXRA, RXRB and RXRG), and retinoid-related receptor genes 471
are the nearest gene to the index SNP at three AAM loci (RXRA, RORA and RORB). 472
Pathway analyses 473
To identify other mechanisms that regulate pubertal timing, we tested all SNPs genome-wide 474
for enrichment of AAM associations with pre-defined biological pathway genes. Ten 475
pathways reached study-wise significance (FDR<0.05). Five pathways were related to 476
transcription factor binding, and the other pathways were: peptide hormone binding, PI3-477
kinase binding, angiotensin stimulated signalling, neuron development and gamma-478
aminobutyric acid (GABA) type B receptor signalling (Table S11). 479
All of our previously reported custom pathways (Table S12)3 remained significant in this 480
expanded dataset: nuclear hormone receptors (P=2.4×10⁻³); Mendelian pubertal disorder 481
genes (P=1.9×10⁻³); and JmjC-domain-containing lysine-specific demethylases (P=1×10⁻⁴). 482
Notably, new genome-wide significant signals mapped to lysine-specific demethylase genes: 483
JMJD1C (signal #223), PHF2 (#208), KDM4B (#347), KDM6B (#332), JARID2 (#128), or to 484
Mendelian pubertal disorder genes: CYP19A1 (#307), FGF8 (#230), GNRH1 (#178) KAL1 485
(#378), KISS1 (#31), NR5A1 (#215), and NR0B1 (#379). The strongest AAM signal remains 486
at LIN28B3,12,13, which encodes a key repressor of let-7 miRNA biogenesis and cell 487
pluripotency14. Transgenic Lin28a/b mice demonstrate both altered pubertal growth and 488
glycaemic control15, suggesting that the Lin28/let-7 axis could link puberty timing to type 2 489
diabetes susceptibility in humans. let-7 miRNA targets are reportedly enriched for variants 490
associated with type 2 diabetes16. We tested the same set of computationally-predicted and 491
experimentally-derived mRNA/protein let-7 miRNA targets16, and observed significant 492
enrichment of AAM-associated variants at miRNA targets that are down-regulated by let-7b 493
overexpression in primary human fibroblasts (Table S12, Pmin=1×10⁻³). 494
Imprinted genes and parent-of-origin effects 495
We previously reported an excess of parent-of-origin specific associations for those AAM 496
variants that map near imprinted genes, as defined primarily from animal studies3. Recent 497
data from the GTEx consortium now allow a more systematic assessment of imprinted gene 498
enrichment using genes defined from human transcriptome-wide analyses17. Consistent with 499
our previous observations, imprinted genes were enriched for AAM-associated variants 500
(MAGENTA P=4×10⁻³), with a concordant excess of parent-of-origin specific associations for 501
the 389 index AAM variants (Figure S3, Table S3). 502
Systematic assessment of the 389 AAM gene regions in the Icelandic deCODE study 503
revealed novel rare variants in two imprinted gene regions with robust parent-of-origin 504
specific associations with AAM. Firstly, we identified a rare 5‘ UTR variant rs530324840 505
(MAF=0.80% in Iceland) in MKRN3 that is associated with AAM under the paternal 506
(P=6.4×10⁻¹¹, β= -0.52 years) but not the maternal model (P=0.20, β=0.098, Phet=1.3x10⁻⁷) 507
(Table 1 & S13). rs530324840 is by far the most significant variant at the MKRN3 locus and 508
is uncorrelated with our previously reported common variant rs12148769 at the same locus 509
(r2 <0.001 in deCODE)3 (Figure S4). We note that the rare 5‘ UTR variant rs184950120 510
detected in the current GWAS meta-analysis also shows paternal-specific association in 511
deCODE and, despite their near location (235bp from rs530324840), is uncorrelated to 512
rs530324840 (r2<0.0001 in deCODE). 513
The second novel robust parent-of-origin specific signal is indicated by a rare intergenic 514
variant at the DLK1 locus (rs138827001; MAF=0.36% in Iceland) that associates with AAM 515
under the paternal model (P=4.7×10⁻¹⁰, β= -0.70 years) but not the maternal model (P=0.88, 516
β= -0.018 years, Phet=1.4x10⁻⁴) (Table 1, Figure S5). rs138827001 is uncorrelated with the 517
two previously reported common variants rs10144321 and rs7141210 at the DLK1 locus (r2 518
<0.01 in Iceland) that both also showed paternal allele-specific associations3. At this locus, 519
we observed a further common variant rs61992671 (MAF=48.5% in Iceland) 4.4kb upstream 520
of the Maternally Expressed 9 (MEG9) gene (~300kb from DLK1) that was associated with 521
AAM under the maternal model (P=6.0×10⁻⁸, β= -0.077 years) but not the paternal model 522
(P=0.27, β=0.015 years, Phet=1.9x10⁻⁵). rs61992671 was uncorrelated (r2<0.05) with the two 523
common signals identified in the meta-analysis (rs10144321 and rs7141210) and replicated 524
with a consistent magnitude of effect in the our GWAS meta-analysis (additive model, 525
P=5.1×10⁻⁶). 526
Disproportionate genetic effects on early or late puberty timing 527
Family-based studies in twins have suggested age-related differences in the impacts of 528
genetic and environmental factors on AAM18. To test for asymmetry in the genetic effects on 529
puberty timing, we defined two groups of women in the UK Biobank study based on 530
approximated quintiles for AAM – “early” (8-11 years inclusive, N=14,922) and “late” (15-19, 531
N=12,290). Each group was compared to the same median quintile AAM reference group 532
(age 13, N=17,717). Estimated genome-wide heritability was higher for early AAM 533
(h2SNP=28.8%; s.e 2.3%) than late AAM (h2
SNP=21.5%; s.e. 2.5%, Pdif=0.03). Accordingly, 534
217/377 (57.7%) autosomal index SNPs had larger effect estimates on early than late AAM 535
(binomial P=0.004 vs. 50% expected), and the aggregated effect of the 377 SNPs also 536
differed between strata (P=2.3×10⁻⁴) (Figure 2, Table S14). These differences remained 537
when matching the early and late AAM strata for sample size and phenotype ranges (Table 538
S15). 539
In contrast, we observed the opposite pattern of disproportion in the genetic effects on male 540
voice breaking in UK Biobank (“relatively early” N=2678, “relatively late” N=3566). Genome-541
wide heritability estimates tended to be higher for relatively late voice breaking (7.8%, s.e 542
1.2%) than for relatively early (6.9%, s.e 1.3%), and 227/377 (60.2%) index SNPs had larger 543
effect estimates on relatively late than relatively early voice breaking (binomial P=4.3×10⁻⁵). 544
BMI-independent effects of puberty timing on cancer risks 545
Traditional (non-genetic) epidemiological studies have reported complex associations 546
between puberty timing, body mass index (BMI) and adult cancer risks. For example, large 547
studies using historical growth records identified lower adolescent BMI and earlier puberty 548
timing (estimated by the age at peak adolescent growth) as predictors of higher breast 549
cancer risk in women19,20. Conversely, BMI is positively associated with breast cancer risk in 550
postmenopausal women21. Furthermore, the strong inter-relationship between puberty timing 551
and BMI limits the ability to consider their distinct influences on disease risks in traditional 552
observational studies. Consistent with our previous report5, we observed a strong inverse 553
genetic correlation between AAM and BMI (rg= -0.35, P=1.6×10-72). 39 AAM loci overlapped 554
with reported loci for adult BMI22, yet even those AAM signals with weak individual 555
associations with adult BMI still contributed to BMI when considered in aggregate: the 237 556
AAM variants without a nominal individual association with adult BMI (all P>0.05) were 557
collectively associated with adult BMI (P=4.2×10⁻⁹) (Figure S6). This finding precludes an 558
absolute distinction between BMI-related and BMI-unrelated AAM variants. 559
In Mendelian randomisation analyses, we therefore included adjustment for genetically-560
predicted BMI (as predicted by the 375 autosomal AAM variants) in order to assess the likely 561
direct (i.e. BMI-independent) effects of AAM on the risks for various sex steroid-sensitive 562
cancers (see methods). In these BMI-adjusted models, increasing AAM was associated with 563
lower risk for breast cancer (OR=0.935 per year, 95% confidence interval: 0.894-0.977; 564
P=2.6×10⁻³), and in particular with oestrogen receptor (ER)-positive but not ER-negative 565
breast cancer (P-heterogeneity =0.02) (Figure 3, Table S16). Similarly, increasing AAM 566
adjusted for genetically-predicted BMI was associated with lower risks for: ovarian cancer 567
(OR=0.930, 0.880-0.982; P=9.3×10⁻³), in particular serous ovarian cancer (OR=0.917, 568
0.859-0.978; P=8.9×10⁻³); and endometrial cancer (OR=0.781, 0.699-0.872; P=9.97×10⁻⁶). 569
Assuming an equivalent per-year effect of the current AAM variants on age at voice 570
breaking, as we reported for the 106 previously identified AAM variants 5, we could also infer 571
a protective effect of later puberty timing, independent of BMI, on lower risk for prostate 572
cancer in men (OR=0.925, 0.876-0.976; P=4.4×10⁻³). 573
These findings were supported by sensitivity tests using sub-groups of AAM signals stratified 574
by their individual associations with adult BMI. The ‘BMI-unrelated’ variant score (comprising 575
314 variants) supported a direct effect of AAM timing on breast cancer risk in women 576
(OR=0.946, 0.904-0.988; P=1.3×10⁻²). In contrast, a score using only the 61 BMI-related 577
AAM variants gave a significant result in the opposite direction (OR=1.15, 1.06-1.25; 578
P=4.3×10⁻⁴) (Table S16), consistent with the recently reported inverse association between 579
genetically-predicted BMI and breast cancer risk23,24. Further sensitivity tests (heterogeneity 580
and MR-Egger tests) using the ‘BMI-unrelated’ variant score suggested that additional sub-581
pathways might link AAM to risk of ovarian cancer (MR-Egger Intercept P=0.036), but 582
reassuringly these tests indicated no further pleiotropy (i.e. beyond the effects of BMI) in our 583
analyses of breast, endometrial and prostate cancers (for all: I-square <23% and MR-Egger 584
Intercept P>0.1) (Table S16, Figure S7). 585

Discussion 586
In a substantially enlarged genomic analysis using densely imputed genomic data, we have 587
identified 389 independent, genome-wide significant signals for AAM. In aggregate, these 588
signals explain ~7.4% of the population variance in AAM, corresponding to ~25% of the 589
estimated heritability. While assigning possible causal genes to associated loci is an ongoing 590
challenge for GWAS findings, we adopted a number of recently described methods to 591
implicate the underlying genes and tissues. 33 genes were implicated by non-synonymous 592
variants and >200 genes were implicated by transcriptome-wide association in the five 593
neural tissues enriched for AAM-associated gene activation. Transcriptome-wide association 594
analyses also enabled the estimation of direction of gene expression in relation to AAM, 595
notably indicating the likely delaying effect of LIN28B gene expression on AAM, which is 596
consistent with inhibitory effects of this gene on developmental timing in animal and cell 597
models14,15. 598
Our findings add to the growing evidence for a significant role of imprinted genes in the 599
regulation of puberty timing3. In a recent family study, rare coding mutations (two frameshift, 600
one stop-gained and one missense) in MKRN3 were shown to cause central precocious 601
puberty when paternally inherited25. Taken together, three distinct types of variants at 602
MKRN3 appear to influence puberty timing when paternally inherited: (i) multiple rare loss-of-603
function mutations with large effects25 (ii) a common intergenic variant (rs530324840) with 604
small effect, and (iii) two 5‘ UTR variants (rs184950120 and rs12148769) with intermediate 605
allele frequencies (1 in 95 Icelandic women) and effects (~0.5 years per allele). Similarly, we 606
found allelic heterogeneity at the imprinted DLK1 locus where, as at MKRN3, a low 607
frequency paternally-inherited allele conferred a substantial decrease in the age of puberty 608
timing. At the same locus, maternal allele-specific association with an unrelated variant near 609
to the maternally-expressed gene MEG9 is consistent with multiple imprinting control centres 610
at this imprinted gene cluster26. 611
The strong collective influence of the identified loci on AAM allowed informative stratification 612
of AAM-associated variants in causal analyses to distinguish between BMI-related and BMI-613
unrelated pathways linking puberty timing to risk of sex steroid sensitive cancers. These 614
findings were supported in BMI-adjusted models and, except for ovarian cancer, by 615
additional tests for pleiotropy, and indicate causal influences of both lower adolescent BMI 616
and earlier AAM on later cancer risks. The association between BMI and breast cancer risk 617
is complex; directionally-opposing associations have been reported with adolescent and 618
adult BMI, and with differing associations with pre- and post-menopausal breast 619
cancer19,20,21. Recent Mendelian randomisation studies report a consistent protective effect 620
of higher BMI on pre- and post-menopausal breast cancer23,24. Some studies have reported 621
on the association between later puberty timing and lower risk of prostate cancer in men, but 622
such data on puberty timing in men is scarcely recorded27. The influences of earlier puberty 623
timing, independent of BMI, on higher risks of breast, ovarian and endometrial cancers in 624
women, and prostate cancer in men, could be mediated by a longer duration of exposure to 625
sex steroids. Alternatively, mechanisms that confer earlier puberty timing might also promote 626
higher levels of hypothalamic-pituitary-gonadal axis activity, as exemplified by a variant in 627
FSHB that confers earlier AAM, higher circulating follicle stimulating hormone concentrations 628
in women, and higher susceptibility to dizygous twinning11. 629

We identified disproportionate effects of AAM variants on early or late puberty timing in a 630
sex-discordant pattern. In females, variant effect estimates and heritability were higher for 631
early versus late puberty timing, but the opposite was seen in males. These findings are 632
concordant with clinical observations of sex-dependent penetrance of abnormal early and 633
late puberty timing, even when accounting for presentation bias. Girls are more susceptible 634
than boys to start puberty at abnormally young ages28, whereas boys are more susceptible 635
than girls to have delayed onset of puberty29. These findings suggest some, yet to be 636
unidentified, sex-specific gene-environment interactions. Future studies should 637
systematically explore the potential influence of AAM-associated variants on rare disorders 638
of puberty. In summary, our findings suggest unprecedented genetic complexity in the 639
regulation of puberty timing and support new causal links with susceptibility to sex steroid-640
sensitive cancers in women and men. 641
Online Methods 642
GWAS meta-analysis for age at menarche in women 643
Each individual study tested SNPs using a two tailed additive linear regression model for 644
association with age at menarche (AAM), including age at study visit and other study specific 645
covariates. Insertion/deletion polymorphisms were coded as “I” and “D” for data storage 646
efficiency and to allow harmonisation across all studies. Genetic variants and individuals 647
were filtered on the basis of study specific quality control metrics. Association statistics for 648
each SNP were then uploaded by study analysts for central processing. Study level results 649
files were assessed following standardised quality control pipeline30, and results for each 650
SNP were meta-analysed across studies using an inverse variance weighted model using 651
METAL31 in a two stage process. Firstly, results from ReproGen consortium studies (Table 652
S1) were combined and then filtered so that only those SNPs which appeared in over half of 653
these studies were taken forward. Secondly, aggregated ReproGen consortium results were 654
combined with data from the UK Biobank32,33 and 23andMe, Inc. studies5. Variants were only 655
included in the final results file if they had results from at least two of these three sources, 656
and a combined minor allele frequency (MAF) > 0.1%. We assessed potential inflation of test 657
statistics due to sample relatedness and population stratification using LD score 658
regression34. Here, an intercept value not significantly different from 1 indicates no such 659
inflation, with a value over 1 indicating inflation. 660
A final list of index variants was first defined using a distance based metric, by which any 661
SNPs passing the two tailed threshold of significance (P<5×10⁻⁸) within 1Mb of another 662
significant SNP were considered to be located in the same locus. This list of signals was 663
then further augmented using approximate conditional analysis in GCTA, using an LD 664
reference panel from the UK Biobank study. Only secondary signals that were uncorrelated 665
(r2<0.05) were included in the final list. 666
Replication and parent-of-origin testing 667
Replication of identified hits was performed in an independent sample of 39,486 women of 668
European ancestry from the deCODE study, Iceland. Main effects and parent-of-origin 669
association testing was performed using the same methodology as previously reported3,4. 670
The fraction of variance explained by a variant associating under the additive model was 671
calculated using the formula 2 f (1−f) βa2, where f denotes the minor allele frequency of the 672
variant and βa is the additive effect. For variants associating under the recessive model, the 673
formula fh (1−fh) βr2 was used, where fh denotes the homozygous frequency of the variant 674
and βr denotes the recessive effect. For variants associating under parent-of-origin models, 675
fraction of variance explained was computed using the formulas f (1−f) βm2 for the maternal 676
model and f (1−f) βp2 for the paternal model, where f denotes the minor allele frequency of 677
the variant, βm denotes the effect under the maternal model and βp denotes the effect under 678
the paternal model. Variance explained across multiple SNPs was calculated by summing 679
the individual variances for all uncorrelated variants. We also estimate variance explained for 680
top hits in UK Biobank using a combined allele score of all 377 autosomal genetic variants. 681
Each individual variant was weighted using effect estimates derived from a meta-analysis 682
excluding UK Biobank. 683
684
Age at voice breaking in men 685
Data on male voice breaking were available from two sources. Firstly, the 23andMe, Inc. 686
study recorded recalled age at voice breaking in a sample of 55,871 men, as previously 687
described5. This was recorded as a quantitative trait into pre-defined 2-year age bins by 688
online questionnaire in response to the question “How old were you when your voice began 689
to crack/deepen?”5. Individual SNP effect estimates from the two year age bins were 690
rescaled to 1 year estimates for both voice breaking and AAM as reported previously. 691
Age at voice breaking was also recalled in the UK Biobank study, as previously described33. 692
This was recorded as a categorical trait: “younger than average”, “about average age”, “older 693
than average”, “do not know” or “prefer not to answer” in response to the question “When did 694
your voice break”. In separate models, the earlier or later voice breaking groups were 695
compared to the average group (used as the reference group). 696
Disproportionate effects on early or late puberty timing 697
Disproportionate effects on early or late puberty timing of AAM-associated SNPs were tested 698
for AAM in UK Biobank. The distribution of AAM was divided into approximate quintiles, as 699
previously reported33. Odds ratios for being in the youngest quintile (range 8-11) or the 700
oldest (range 15-19) were compared to the middle quintile (age 13) as the reference, for 701
each AAM-associated SNP and also for a combined weighted AAM-increasing allele score, 702
with weights derived from a meta-analysis of all other studies except for UK Biobank. 703
Sensitivity tests were performed by dividing UK Biobank individuals into broad strata based 704
on birth year (before or after 1950) and geographic location (attendance at a study 705
assessment centre in the North or South of the UK, as indicated by a line joining Mersey-706
Humber). 707
Genetic correlation and genome-wide variance analysis 708
Genome-wide genetic correlations with adult BMI22 and voice breaking5 were estimated 709
using LD score regression implemented in LDSC34. The total trait variance of all genotyped 710
SNPs was calculated using Restricted Estimate Maximum Likelihood (REML) implemented 711
in BOLT35. This was estimated using the same UK Biobank study sample in the discovery 712
analysis, excluding any related individuals. The proportion of heritability explained by index 713
SNPs was estimated by dividing the variance explained by the index SNPs, by the total 714
variance explained by all genotyped SNPs genome-wide. 715
Mendelian randomisation analyses 716
Individual genotype data on cancer outcomes were available from the Breast Cancer 717
Association Consortium (BCAC) and Endometrial Cancer Association Consortium (ECAC). 718
In addition, summary level results for ovary and prostate cancer were made available from 719
the Ovarian Cancer Association Consortium (OCAC) and the Prostate Cancer Association 720
Group to Investigate Cancer Associated Alterations in the Genome (PRACTICAL) 721
consortium, respectively. Total analysed numbers were: 47,800 breast cancer cases and 722
40,302 controls, 4401 endometrial cancer cases and 28,758 controls, 18,175 ovarian cancer 723
cases and 26,134 controls, and 20,219 prostate cancer cases and 20,440 controls (from the 724
PRACTICAL iCOGS dataset). 725
We performed Mendelian randomisation analyses to assess the likely causal effects of 726
puberty timing on the risks for various sex steroid-sensitive cancers. Hence, AAM was 727
predicted by a weighted genetic risk score of all 375 autosomal AAM-associated SNPs, and 728
genetically-predicted AAM was tested for association with each cancer in a logistic 729
regression model. The individual SNP genotype dosages comprising this score were 730
imputed using the 1000 Genomes reference panel (minimum imputation r2=0.43, median 731
0.95). To avoid potential confounding by effects of the AAM genetic risk score on BMI, we 732
performed BMI-adjusted analyses by including in models as a covariate the same AAM 733
genetic risk score, but weighting each SNP for its effect on BMI (rather than on AAM) in the 734
same study sample. Hence, we estimated the effect of genetically-predicted AAM controlling 735
for genetically-predicted BMI by the same SNPs. BMI weighting was based on the 736
association between each SNP and adult BMI in this sample (childhood BMI measurements 737
were not available but there is reportedly high genetic correlation between adult and 738
childhood obesity (rg=0.73)36. We did not adjust for measured BMI because such 739
measurements in prevalent cancer cases are likely to introduce bias. As sensitivity tests, 740
three further genetic score associations were performed for each cancer outcome: firstly, 741
AAM predicted by the 314 AAM-associated SNPs that were not also individually associated 742
with BMI in the BCAC iCOGs sample (at a nominal level of p<0.05); secondly, AAM 743
predicted by the 61 AAM-associated SNPs that were also associated with BMI in this sample 744
(i.e P<0.05); finally, AAM predicted by all 375 autosomal AAM-associated SNPs (unadjusted 745
for BMI). To further consider pleiotropy, we tested for presence of heterogeneity between 746
AAM-associated SNPs and analysed MR-Egger regression models 37. 747
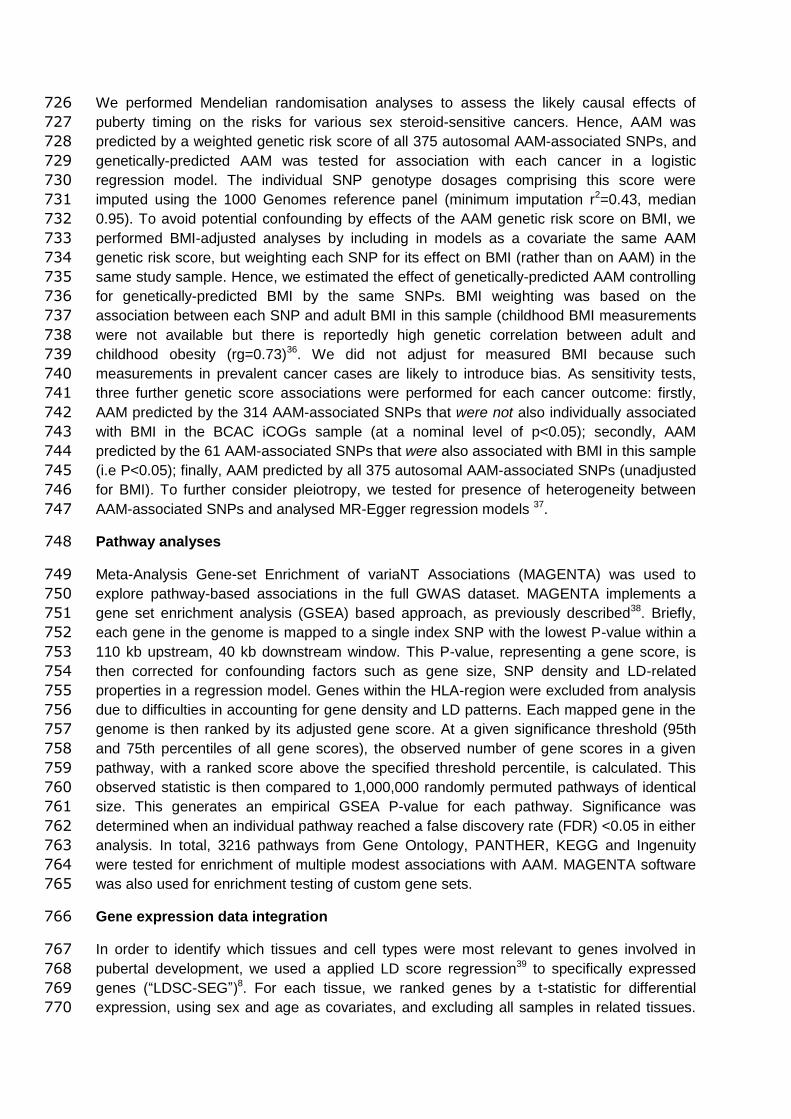
Pathway analyses 748
Meta-Analysis Gene-set Enrichment of variaNT Associations (MAGENTA) was used to 749
explore pathway-based associations in the full GWAS dataset. MAGENTA implements a 750
gene set enrichment analysis (GSEA) based approach, as previously described38. Briefly, 751
each gene in the genome is mapped to a single index SNP with the lowest P-value within a 752
110 kb upstream, 40 kb downstream window. This P-value, representing a gene score, is 753
then corrected for confounding factors such as gene size, SNP density and LD-related 754
properties in a regression model. Genes within the HLA-region were excluded from analysis 755
due to difficulties in accounting for gene density and LD patterns. Each mapped gene in the 756
genome is then ranked by its adjusted gene score. At a given significance threshold (95th 757
and 75th percentiles of all gene scores), the observed number of gene scores in a given 758
pathway, with a ranked score above the specified threshold percentile, is calculated. This 759
observed statistic is then compared to 1,000,000 randomly permuted pathways of identical 760
size. This generates an empirical GSEA P-value for each pathway. Significance was 761
determined when an individual pathway reached a false discovery rate (FDR) <0.05 in either 762
analysis. In total, 3216 pathways from Gene Ontology, PANTHER, KEGG and Ingenuity 763
were tested for enrichment of multiple modest associations with AAM. MAGENTA software 764
was also used for enrichment testing of custom gene sets. 765
Gene expression data integration 766
In order to identify which tissues and cell types were most relevant to genes involved in 767
pubertal development, we used a applied LD score regression39 to specifically expressed 768
genes (“LDSC-SEG”)8. For each tissue, we ranked genes by a t-statistic for differential 769
expression, using sex and age as covariates, and excluding all samples in related tissues. 770
For example, we compared expression in hippocampus samples to expression in all non-771
brain samples. We then took the top 10% of genes by this ranking, formed a genome 772
annotation including these genes (exons and introns) plus 100kb on either side, and used 773
stratified LD score regression to estimate the contribution of this annotation to per-SNP AAM 774
heritability, adjusting for all categories in the baseline model39. We computed significance 775
using a block jackknife over SNPs, and corrected for 46 hypotheses tested at P=0.05. 776
To identify specific eQTL linked genes, we utilised two complementary approaches to 777
systematically integrate publicly available gene expression data with our genome-wide 778
dataset: 779
Summary Mendelian Randomization (SMR) uses summary-level gene expression data to 780
map potentially functional genes to trait-associated SNPs7. We ran this approach against the 781
publicly available whole-blood eQTL dataset published by Westra et al.6, giving association 782
statistics for 5,950 transcripts. A conservative significance threshold was set at P<8.4x10⁻⁶, 783
in addition to a heterogeneity in dependent instruments (HEIDI) test statistic P>0.009 for any 784
variants which surpass the main threshold. 785
MetaXcan, a meta-analysis extension of the PrediXcan method40, was used to infer the 786
association between genetically predicted gene expression (GPGE) and AAM. PrediXcan is 787
a novel gene-based data aggregation and integration method which incorporates information 788
from gene-expression data and GWAS data to translate evidence of association with a 789
phenotype from the SNP-level to the gene. Briefly, PrediXcan first imputes gene-expression 790
at an individual level using prediction models trained on measured transcriptome datasets 791
with genome-wide SNP data and then regresses the imputed transcriptome levels with 792
phenotype of interest. MetaXcan extends its application to allow inference of the direction 793
and magnitude of GPGE-phenotype associations with only summary GWAS statistics, which 794
is advantageous when SNP-phenotype associations result from a meta-analysis setting and 795
also when individual level data are not available. As input we utilized GWAS meta-analysis 796
summary statistics for AAM, LD matrix from the 1000 Genomes project, and as weights, 797
gene-expression regression coefficients for SNPs from models trained with transcriptome 798
data (V6p) from the GTEx Project41. GTEx is a large-scale collaborative effort where DNA 799
and RNA from multiple tissues were sequenced from almost 1,000 deceased individuals of 800
European, African, and Asian ancestries. MetaXcan analyses were targeted to those tissue 801
types with prior evidence of association with AAM (based on the GTEx enrichment analyses 802
described above). The threshold for statistical significance was estimated using the 803
Bonferroni method for multiple testing correction across all tested tissues (P<2.57x10⁻⁶). 804
Motif enrichment testing 805
We identified transcription factors whose binding could be disrupted by AAM associated 806
variants in enhancer regions by combining predicted enhancer regions across 111 human 807
cell types and tissues with predicted motif instances of 651 transcription factor families as 808
previously described42. 809
Briefly, we defined enhancer regions by first applying ChromHMM43, training a 15-state 810
model for each reference epigenome on 5 histone modifications: H3K4me1, H3K4me3, 811
H3K36me3, H3K9me3, and H3K27me3. We then produced a higher confidence set of 812
predicted enhancer regions in each reference epigenome by intersecting DNaseI 813

hypersensitive sites (taking the union over 53 reference epigenomes for which DNase-Seq 814
was performed) with enhancer-like chromatin states predicted in that reference 815
epigenomes42. We defined 226 disjoint enhancer modules with distinct patterns of activity by 816
hierarchically clustering the high confidence regions according to their patterns of activity 817
(presence/absence) across the 111 reference epigenomes. 818
We predicted motif instances by first building a database of position weight matrices (PWMs) 819
combining known motifs from Transfac and Jaspar with de novo discovered motifs in 427 820
ChIP-Seq experiments for 123 transcription factors from ENCODE44. We predicted active 821
regulators in each enhancer module by computing the enrichment of true PWM matches in 822
the set of regions assigned to that module against the background of shuffled PWM 823
matches. We only considered PWMs with conservation score at least 0.3, and used log2-fold 824
enrichment > 1.5 as the significance cutoff. 825
We used the full set of AAM association summary statistics, excluding the 23andMe 826
component, to identify a heuristic p-value threshold42. Briefly, we pruned a set of 8,094,080 827
variants to 432,550 independent loci (pairwise r^2 < 0.1). We scored each locus as the 828
proportion of variants in the locus overlapping a predicted enhancer region, ranked loci by 829
the best p-value in the locus, and then plotted enrichment curves comparing the cumulative 830
score every 100 loci against the expected score for that total number of loci under the null 831
where the score increases uniformly to the genome-wide value. We defined the right-most 832
elbow point (inflection point) among all the enrichment curves as the heuristic p-value cutoff. 833
For each combination of enhancer module and predicted regulator, we constructed a 2×2 834
contingency table counting enhancer regions in that module partitioned by presence of that 835
motif and orthogonally by presence of an AAM association (based on the heuristic p-value 836
cutoff described above). We restricted the set of regions to the domain on which motifs were 837
discovered (excluding coding regions, 3' UTRs, transposons, and repetitive regions) and 838
additionally to the subset of regions which harbor an imputed SNP for the disease. We 839
computed one-sided p-values using Fisher’s exact test. 840
Hi-C integration 841
Significant Hi-C interactions and contact domains were obtained from Rao et al. (GSE63525) 842
for 6 ENCODE cell lines: K562, GM12878, HeLa-S3, IMR90, NHEK, and HUVEC. Their 843
Juicer pipeline assigns statistical significance to each Hi-C interaction at resolutions ranging 844
from 5kb-25kb, depending on coverage, at a 10% False Discovery Rate (FDR). Contact 845
domains are genomic regions enriched for regulatory interactions and are more conserved 846
across cell types than are specific interactions. They are conceptually similar to 847
Topologically Associating Domains (TADs, Dixon et al. 2012) but with improved resolution 848
(185kb median length vs. 880kb). We used the intersect command of bedtools to produce a 849
list of significantly interacting Hi-C fragments containing one or more of our identified SNPs 850
in either fragment from any of the six cell lines. For each SNP-containing fragment, genes 851
present in the corresponding interacting fragment were identified as potential regulatory 852
targets. As a second approach, we also scored genes based on the number of ENCODE cell 853
types in which they were in the same contact domain as a SNP. 854

Figure 1. GTEx tissue enrichment using LD score regression. Numbers on the X-axis show sample number for each tissue. Dotted line
represents significance at FDR<5%, solid horizontal line represents Bonferonni-corrected significance for number of tissues tested.

Figure 2. Stronger effects of age at menarche-associated signals on early menarche
(blue) than late menarche (red) in women. The 377 index menarche-associated SNPs are
ordered from smallest to largest p-value for their continuous associations with age at
menarche. The Y-axis indicates the log-odds ratio for each SNP on early menarche (blue;
ages 8–11 years inclusive) or late menarche (red; 15–19 years inclusive). The reference
group are women with menarche at 13 years. Insert shows the –log10 p-values for the
heterogeneity (based on Cochran’s Q) between the early and late menarche associations
plotted against the –log10 p-value for the continuous age at menarche association.
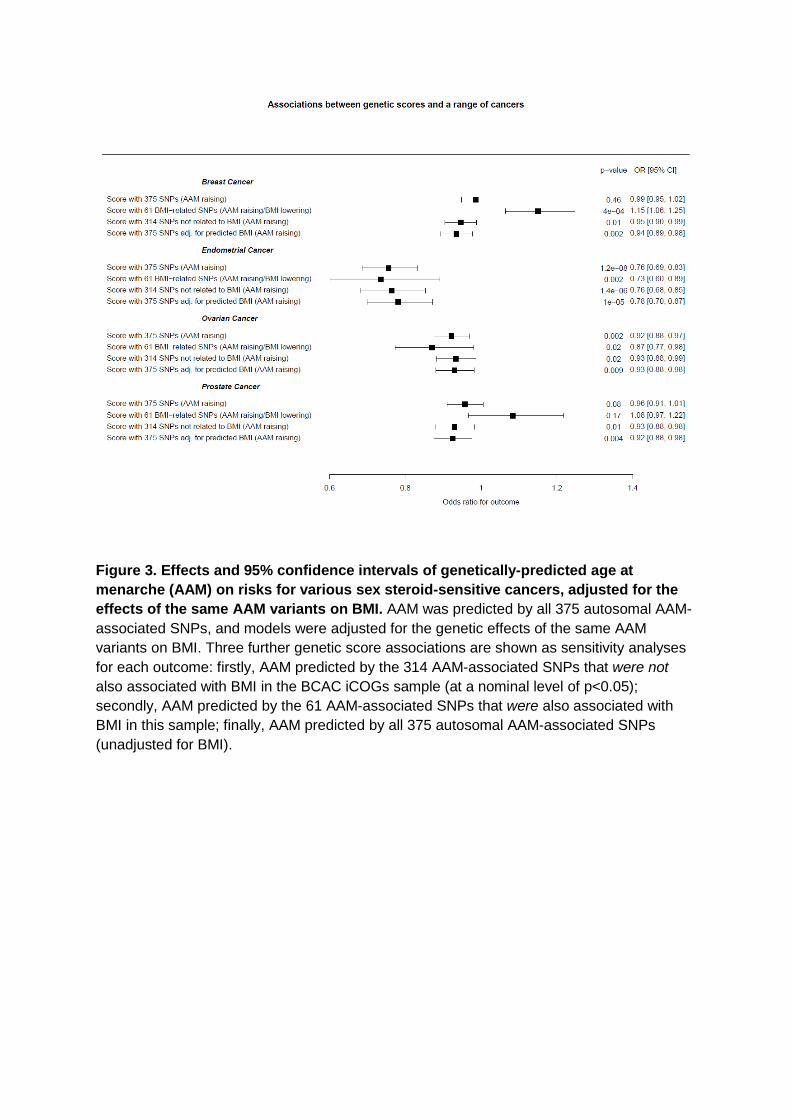
Figure 3. Effects and 95% confidence intervals of genetically-predicted age at
menarche (AAM) on risks for various sex steroid-sensitive cancers, adjusted for the
effects of the same AAM variants on BMI. AAM was predicted by all 375 autosomal AAM-
associated SNPs, and models were adjusted for the genetic effects of the same AAM
variants on BMI. Three further genetic score associations are shown as sensitivity analyses
for each outcome: firstly, AAM predicted by the 314 AAM-associated SNPs that were not
also associated with BMI in the BCAC iCOGs sample (at a nominal level of p<0.05);
secondly, AAM predicted by the 61 AAM-associated SNPs that were also associated with
BMI in this sample; finally, AAM predicted by all 375 autosomal AAM-associated SNPs
(unadjusted for BMI).
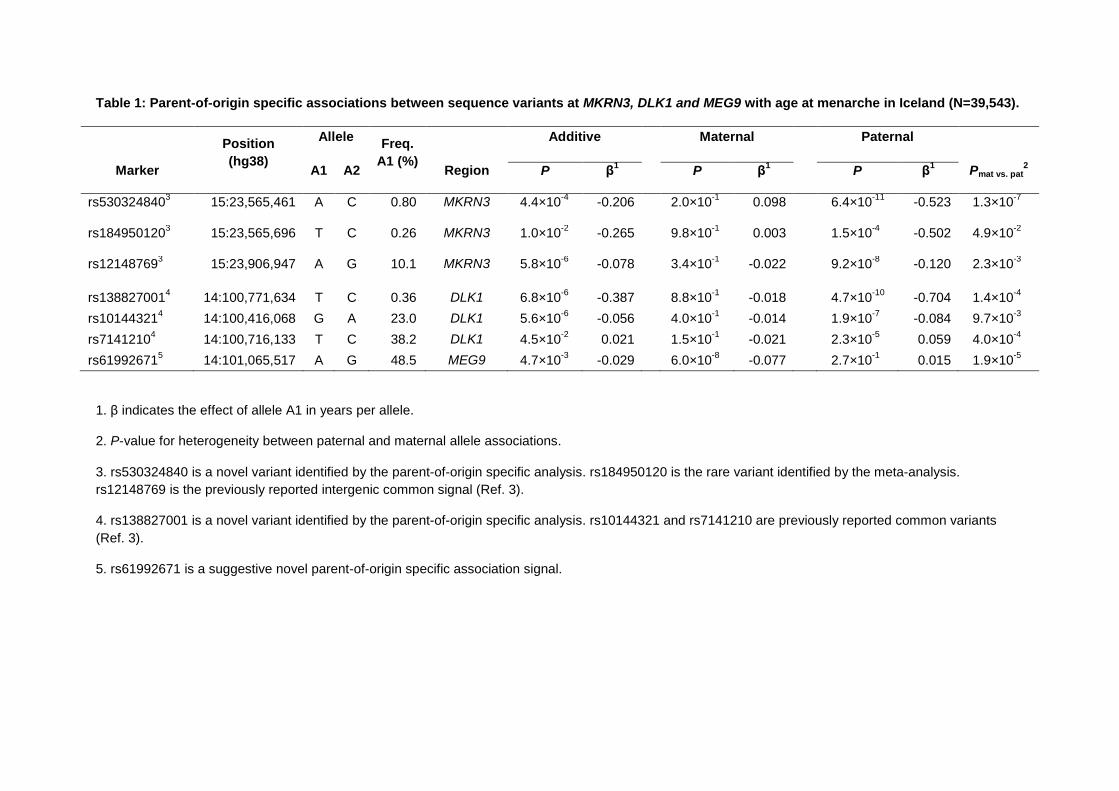
Table 1: Parent-of-origin specific associations between sequence variants at MKRN3, DLK1 and MEG9 with age at menarche in Iceland (N=39,543).
Position
(hg38)
Allele Freq.
A1 (%)
Additive Maternal Paternal
Marker A1 A2 Region P β1 P β
1 P β
1 Pmat vs. pat
2
rs5303248403 15:23,565,461 A C 0.80 MKRN3 4.4×10
-4 -0.206 2.0×10
-1 0.098 6.4×10
-11 -0.523 1.3×10
-7
rs1849501203 15:23,565,696 T C 0.26 MKRN3 1.0×10
-2 -0.265 9.8×10
-1 0.003 1.5×10
-4 -0.502 4.9×10
-2
rs121487693 15:23,906,947 A G 10.1 MKRN3 5.8×10
-6 -0.078 3.4×10
-1 -0.022 9.2×10
-8 -0.120 2.3×10
-3
rs1388270014 14:100,771,634 T C 0.36 DLK1 6.8×10
-6 -0.387 8.8×10
-1 -0.018 4.7×10
-10 -0.704 1.4×10
-4
rs101443214 14:100,416,068 G A 23.0 DLK1 5.6×10
-6 -0.056 4.0×10
-1 -0.014 1.9×10
-7 -0.084 9.7×10
-3
rs71412104 14:100,716,133 T C 38.2 DLK1 4.5×10
-2 0.021 1.5×10
-1 -0.021 2.3×10
-5 0.059 4.0×10
-4
rs619926715 14:101,065,517 A G 48.5 MEG9 4.7×10
-3 -0.029 6.0×10
-8 -0.077 2.7×10
-1 0.015 1.9×10
-5
1. β indicates the effect of allele A1 in years per allele.
2. P-value for heterogeneity between paternal and maternal allele associations.
3. rs530324840 is a novel variant identified by the parent-of-origin specific analysis. rs184950120 is the rare variant identified by the meta-analysis.
rs12148769 is the previously reported intergenic common signal (Ref. 3).
4. rs138827001 is a novel variant identified by the parent-of-origin specific analysis. rs10144321 and rs7141210 are previously reported common variants
(Ref. 3).
5. rs61992671 is a suggestive novel parent-of-origin specific association signal.

References
1. Parent, A.S. et al. The timing of normal puberty and the age limits of
sexual precocity: variations around the world, secular trends, and changes after migration. Endocr Rev 24, 668-93 (2003).
2. Perry, J.R., Murray, A., Day, F.R. & Ong, K.K. Molecular insights into the
aetiology of female reproductive ageing. Nat Rev Endocrinol 11, 725-34 (2015).
3. Perry, J.R. et al. Parent-of-origin-specific allelic associations among 106 genomic loci for age at menarche. Nature 514, 92-97 (2014).
4. Lunetta, K.L. et al. Rare coding variants and X-linked loci associated with
age at menarche. Nat Commun 6, 7756 (2015). 5. Day, F.R. et al. Genetic determinants of puberty timing in men and
women: shared genetic aetiology between sexes and with health-related outcomes. Nat Commun 6, 8842 (2015).
6. Westra, H.J. et al. Systematic identification of trans eQTLs as putative
drivers of known disease associations. Nat Genet 45, 1238-43 (2013). 7. Zhu, Z. et al. Integration of summary data from GWAS and eQTL studies
predicts complex trait gene targets. Nat Genet 48, 481-7 (2016). 8. Finucane, H.K. et al. Heritability enrichment of specifically expressed
genes identifies disease-relevant tissues and cell types. Preprint at bioRxiv https://doi.org/10.1101/103069 (2017).
9. Rao, S.S. et al. A 3D map of the human genome at kilobase resolution
reveals principles of chromatin looping. Cell 159, 1665-80 (2014). 10. Smemo, S. et al. Obesity-associated variants within FTO form long-range
functional connections with IRX3. Nature 507, 371-5 (2014). 11. Mbarek, H. et al. Identification of Common Genetic Variants Influencing
Spontaneous Dizygotic Twinning and Female Fertility. Am J Hum Genet
98, 898-908 (2016). 12. Ong, K.K. et al. Genetic variation in LIN28B is associated with the timing
of puberty. Nat Genet 41, 729-733 (2009). 13. Perry, J.R. et al. Meta-analysis of genome-wide association data identifies
two loci influencing age at menarche. Nat Genet 41, 648-650 (2009).
14. Zhang, J. et al. LIN28 Regulates Stem Cell Metabolism and Conversion to Primed Pluripotency. Cell Stem Cell 19, 66-80 (2016).
15. Zhu, H. et al. Lin28a transgenic mice manifest size and puberty phenotypes identified in human genetic association studies. Nat Genet 42, 626-30 (2010).
16. Zhu, H. et al. The Lin28/let-7 axis regulates glucose metabolism. Cell 147, 81-94 (2011).
17. Baran, Y. et al. The landscape of genomic imprinting across diverse adult human tissues. Genome Res 25, 927-36 (2015).
18. van den Berg, S.M. & Boomsma, D.I. The familial clustering of age at
menarche in extended twin families. Behav Genet 37, 661-7 (2007). 19. Ahlgren, M., Melbye, M., Wohlfahrt, J. & Sorensen, T.I. Growth patterns
and the risk of breast cancer in women. N Engl J Med 351, 1619-26 (2004).
20. Collaborative Group on Hormonal Factors in Breast, C. Menarche,
menopause, and breast cancer risk: individual participant meta-analysis, including 118 964 women with breast cancer from 117 epidemiological
studies. Lancet Oncol 13, 1141-51 (2012).
21. Bhaskaran, K. et al. Body-mass index and risk of 22 specific cancers: a population-based cohort study of 5.24 million UK adults. Lancet 384, 755-
65 (2014). 22. Locke, A.E. et al. Genetic studies of body mass index yield new insights
for obesity biology. Nature 518, 197-206 (2015). 23. Gao, C. et al. Mendelian randomization study of adiposity-related traits
and risk of breast, ovarian, prostate, lung and colorectal cancer. Int J
Epidemiol 45, 896-908 (2016). 24. Guo, Y. et al. Genetically predicted body mass index and breast cancer
risk: Mendelian randomization analyses of data from 145,000 women of European descent. PLoS Med 13, 1002105 (2016).
25. Abreu, A.P. et al. Central precocious puberty caused by mutations in the
imprinted gene MKRN3. N Engl J Med 368, 2467-75 (2013). 26. da Rocha, S.T., Edwards, C.A., Ito, M., Ogata, T. & Ferguson-Smith, A.C.
Genomic imprinting at the mammalian Dlk1-Dio3 domain. Trends Genet 24, 306-16 (2008).
27. Giles, G.G. et al. Early growth, adult body size and prostate cancer risk.
Int J Cancer 103, 241-5 (2003). 28. de Vries, L., Kauschansky, A., Shohat, M. & Phillip, M. Familial central
precocious puberty suggests autosomal dominant inheritance. J Clin Endocrinol Metab 89, 1794-800 (2004).
29. Wehkalampi, K., Widen, E., Laine, T., Palotie, A. & Dunkel, L. Patterns of inheritance of constitutional delay of growth and puberty in families of adolescent girls and boys referred to specialist pediatric care. J Clin
Endocrinol Metab 93, 723-8 (2008). 30. Winkler, T.W. et al. Quality control and conduct of genome-wide
association meta-analyses. Nat Protoc 9, 1192-212 (2014). 31. Willer, C.J., Li, Y. & Abecasis, G.R. METAL: fast and efficient meta-analysis
of genomewide association scans. Bioinformatics 26, 2190-1 (2010).
32. Sudlow, C. et al. UK biobank: an open access resource for identifying the causes of a wide range of complex diseases of middle and old age. PLoS
Med 12, e1001779 (2015). 33. Day, F., Elks, C.E., Murray, A.M., Ong, K.K. & Perry, J.R. Puberty timing
associated with diabetes, cardiovascular disease and also diverse health
outcomes in men and women: the UK Biobank study. Sci Rep 5, 11208 (2015).
34. Bulik-Sullivan, B.K. et al. LD Score regression distinguishes confounding from polygenicity in genome-wide association studies. Nat Genet 47, 291-5 (2015).
35. Loh, P.R. et al. Efficient Bayesian mixed-model analysis increases association power in large cohorts. Nat Genet 47, 284-90 (2015).
36. Bulik-Sullivan, B. et al. An atlas of genetic correlations across human diseases and traits. Nat Genet 47, 1236-41 (2015).
37. Bowden, J., Davey Smith, G. & Burgess, S. Mendelian randomization with
invalid instruments: effect estimation and bias detection through Egger regression. Int J Epidemiol 44, 512-25 (2015).
38. Segre, A.V. et al. Common inherited variation in mitochondrial genes is not enriched for associations with type 2 diabetes or related glycemic traits. PLoS Genet 6, e1001058 (2010).
39. Finucane, H.K. et al. Partitioning heritability by functional annotation using genome-wide association summary statistics. Nat Genet 47, 1228-35
(2015).
40. Gamazon, E.R. et al. A gene-based association method for mapping traits using reference transcriptome data. Nat Genet 47, 1091-8 (2015).
41. Consortium, G.T. The Genotype-Tissue Expression (GTEx) project. Nat Genet 45, 580-5 (2013).
42. Sarkar, A., Ward, L.D. & Kellis, M. Functional enrichments of disease variants across thousands of independent loci in eight diseases. Preprint at bioRxiv http://dx.doi.org/10.1101/048066 (2016).
43. Ernst, J. et al. Mapping and analysis of chromatin state dynamics in nine human cell types. Nature 473, 43-9 (2011).
44. Roadmap Epigenomics, C. et al. Integrative analysis of 111 reference human epigenomes. Nature 518, 317-30 (2015).
Acknowledgements
This research has been conducted using the UK Biobank Resource under application 5122
and 9797. Full study-specific acknowledgements can be found in the online supplement.
Competing financial interests
The authors declare no competing financial interests
Data availability statement
GWAS meta-analysis summary statistics from the ReproGen consortium are available to
download from the ReproGen website (www.reprogen.org).
Author Contributions
All authors reviewed the original and revised manuscripts. Statistical analysis: F.R.D, D.J.T,
H.H, D.I.C, H.F, P.S, K.S.R, S.W, A.Sa, E.Alb, E.Alt, M.A, C.M.B, T.Bo, A.Ca, E.D, A.G,
C.He, J.J.H, R.K, I.K, P.L, K.L.L, M.M, B.M, G.M, S.E.M, I.M.N, R.N, T.N, L.P, N.Per, E.P,
L.M.R, K.E.S, A.Se, A.V.S, L.S, A.T, J.R.B.P. Sample collection, genotyping and
phenotyping: I.L.A, S.Ba, M.W.B, J.B, S.Be, M.B, E.B, S.E.B, M.K.B, J.S.B, H.Bra, H.Bre,
L.B, T.Br, J.E.B, H.C, E.C, S.C, G.C, T.C, F.J.C, D.L.C, A.Co, L.C, K.C, G.D, E.J.C.N.d, R.d,
I.DeV, J.D, P.D, I.D-S, A.M.D, J.G.E, P.A.F, L.F-R, L.Fe, D.F, L.Fr, M.G, I.G, G.G.G, H.G,
D.F.G, P.G, P.H, E.H, U.H, T.B.H, C.A.H, G.H, M.J.H, J.L.H, F.H, D.Hu, A.I, H.I, M.J, P.K.J,
D.K, Z.K, G.L, D.L, C.L, L.J.L, J.S.E.L, S.Le, J.Li, P.A.L, S.Li, Y.L, J.Lu, R.M, A.Ma, H.M,
M.I.M, C.Mei, T.M, C.Men, A.Me, K.M, L.M, R.L.M, G.W.M, A.M.M, M.A.N, P.N, H.N, D.R.N,
A.J.O, T.A.O, S.P, A.Pa, N.Ped, A.Pe, J.P, P.D.P.P, A.Po, P.R, I.Ra, S.M.R, A.R, F.R.R,
I.Ru, R.R, D.R, C.F.S, M.K.S, R.A.S, M.Sh, R.S, M.C.S, U.S, M.Sta, M.Ste, K.Str, T.Ta, E.T,
N.J.T, M.T, T.Tr, J.P.T, A.G.U, D.R.V, V.V, U.V, P.V, Q.W, E.W, K.W, G.W, R.W, B.H.RW,
J.Z, M.Zo, M.Zy. Individual study principal investigators: B.Z.A, D.I.B, M.C, F.C, T.E, N.F,
C.G, V.G, C.Ha, P.K, D.A.L, P.K.EM, N.G.M, D.O.M, E.A.N, O.P, D.P, A.L.P, P.M.R, H.S,
T.D.S, D.S, D.T, S.U, J.A.V, H.V, N.J.W, J.F.W, A.B.S, U.T, K.P, D.F.E, J.Y.T, J.C, D.Hi,
A.Mu, J.M.M, K.Ste, K.K.O, J.R.B.P. Working group: F.R.D, D.J.T, H.H, D.I.C, H.F, P.S,
K.S.R, S.W, A.Sa, A.B.S, U.T, K.P, D.F.E, J.Y.T, J.C, D.Hi, A.Mu, J.M.M, K.Ste, K.K.O,
J.R.B.P.