Day 2 Evolution of Decision-Making. Tversky and Kahneman, 1974 Heuristics – general rules of...
41
MARK 5342 Advanced Topics Day 2 Evolution of Decision-Making
-
Upload
keshawn-such -
Category
Documents
-
view
216 -
download
0
Transcript of Day 2 Evolution of Decision-Making. Tversky and Kahneman, 1974 Heuristics – general rules of...
MARK 5342 Advanced Topics
Day 2Evolution of Decision-Making
2
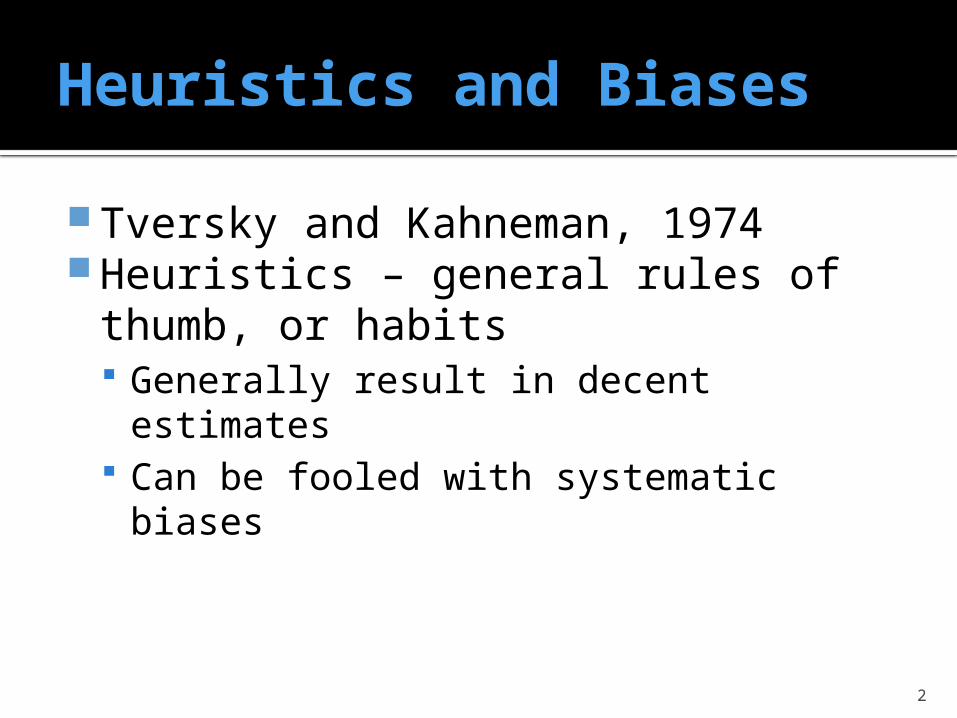
Heuristics and Biases
Tversky and Kahneman, 1974 Heuristics – general rules of thumb,
or habits Generally result in decent estimates Can be fooled with systematic biases
3
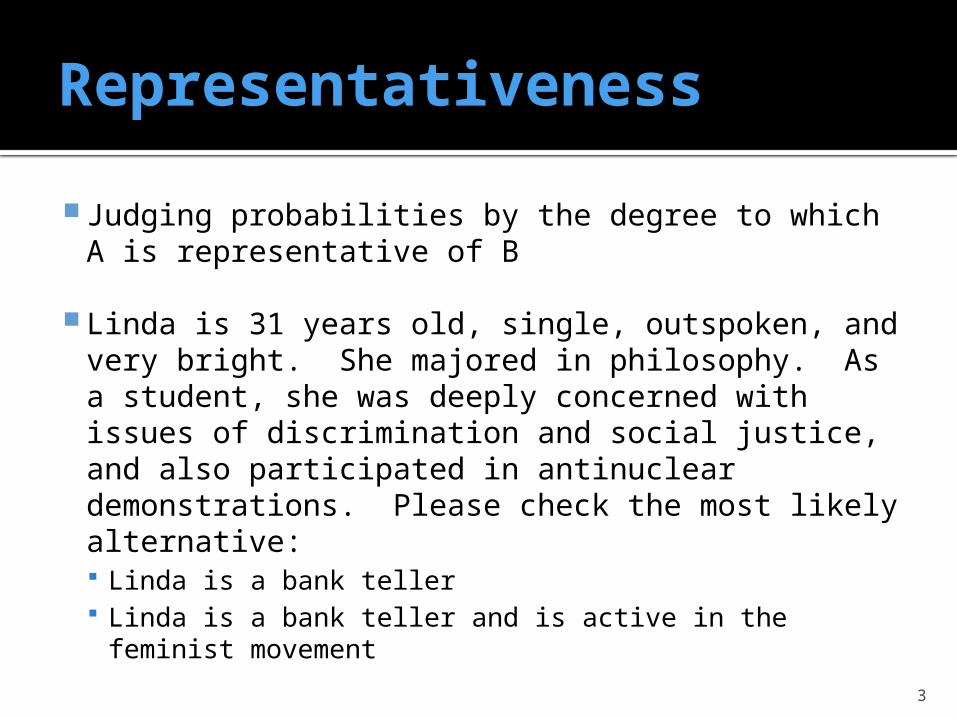
Representativeness
Judging probabilities by the degree to which A is representative of B
Linda is 31 years old, single, outspoken, and very bright. She majored in philosophy. As a student, she was deeply concerned with issues of discrimination and social justice, and also participated in antinuclear demonstrations. Please check the most likely alternative: Linda is a bank teller Linda is a bank teller and is active in the feminist
movement
4
Representativeness
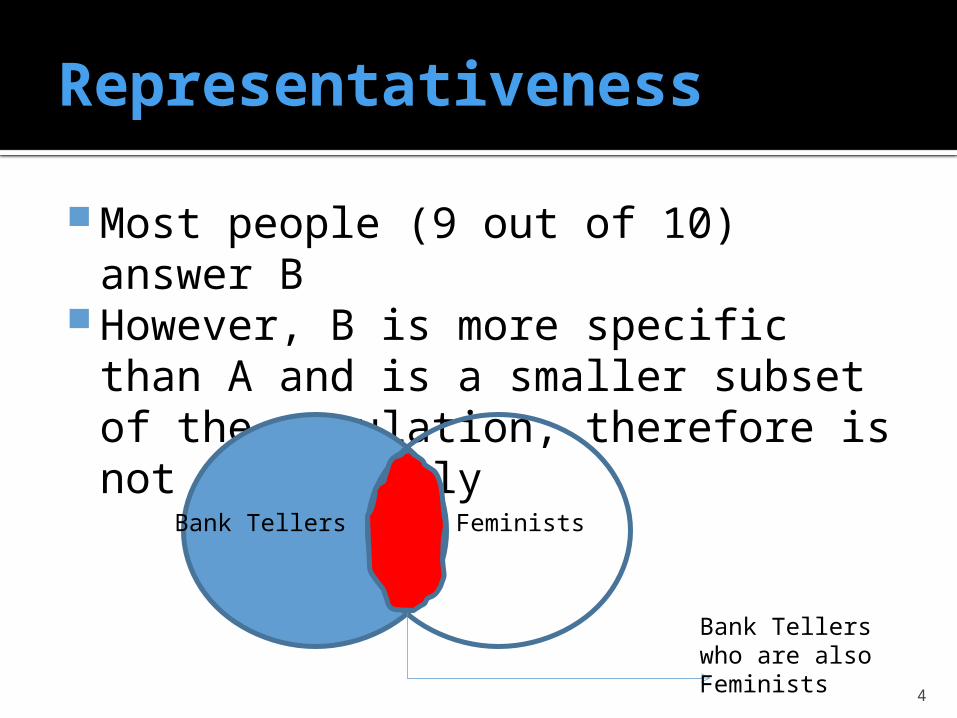
Most people (9 out of 10) answer B However, B is more specific than A
and is a smaller subset of the population, therefore is not more likely
Bank Tellers Feminists
Bank Tellers who are also Feminists
5
Law of Small Numbers
Belief that random samples of a population will resemble each other
The mean IQ of a population of eighth graders in a city is known to be 100. You have selected a random sample of 50 children for a study of educational achievements. The first child tested has an IQ of 150. What do you expect the mean IQ to be for the whole sample?
6
Law of Small Numbers
First child has IQ of 150 Remaining 40 have mean IQ of 100 Total is 5050, average is 101, not
100 We expect remaining sample to
somehow “balance out” Small samples don’t randomly cancel
out outliers with other outlier values Fallacy of the Hot Hand
7
Availability
Heuristic in which decision-makers “assess the frequency of a class or the probability of an event by the ease with which instances or occurrences can be brought to mind
What is a more likely cause of death in the US – being killed by falling airplane parts or by a shark?
Death by falling airplane parts is 30 times more likely, but shark death is more easily imagined
8
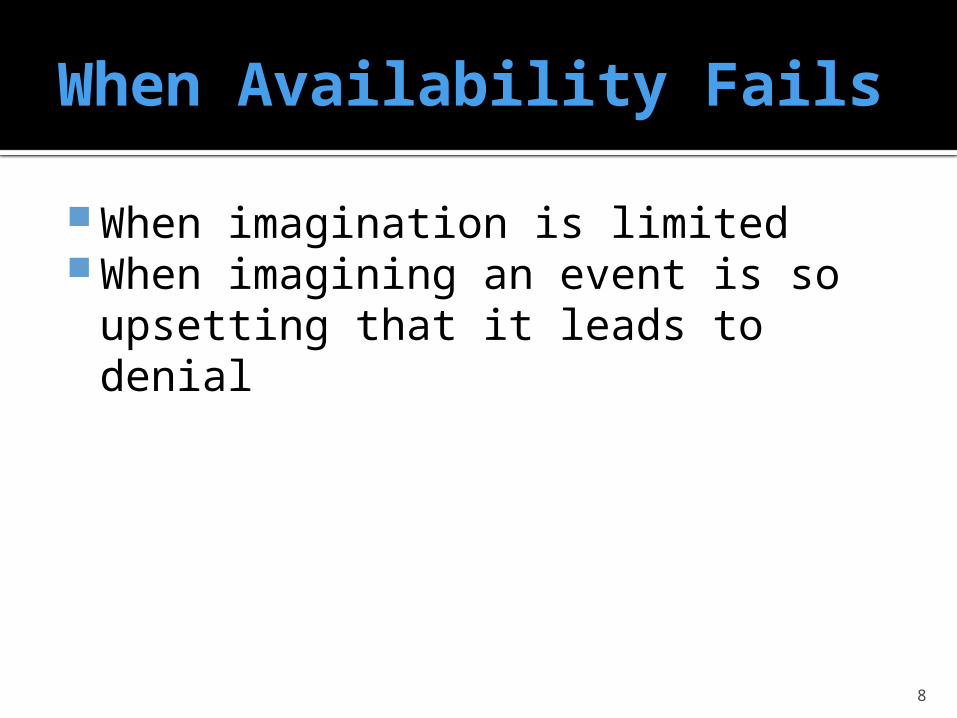
When Availability Fails
When imagination is limited When imagining an event is so
upsetting that it leads to denial
9
Context and Framing
10
Framing
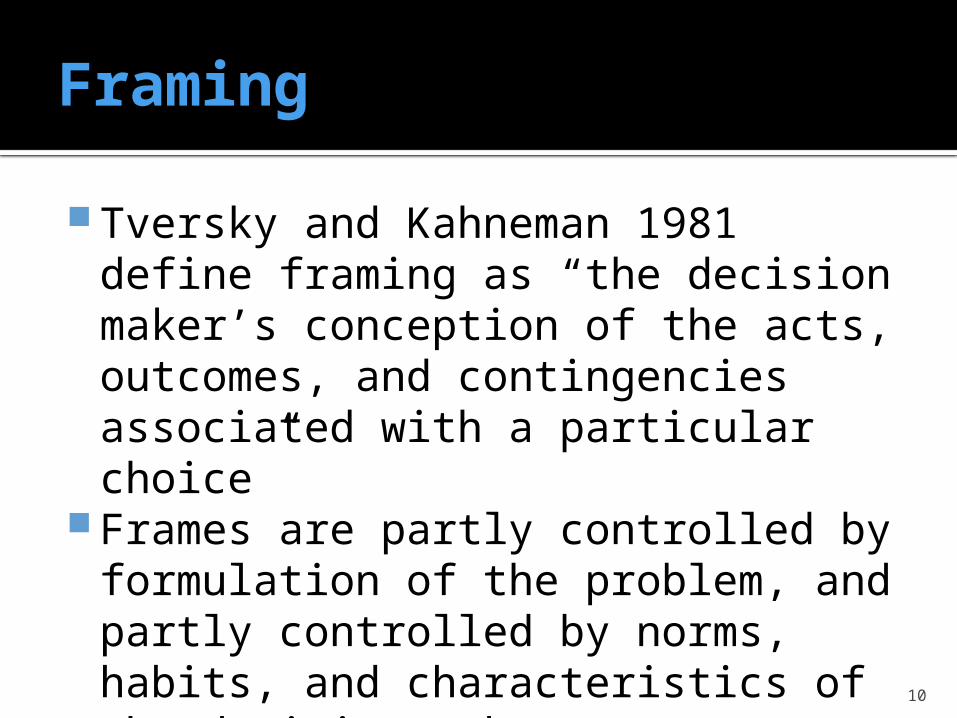
Tversky and Kahneman 1981 define framing as “the decision maker’s conception of the acts, outcomes, and contingencies associated with a particular choice”
Frames are partly controlled by formulation of the problem, and partly controlled by norms, habits, and characteristics of the decision maker
11
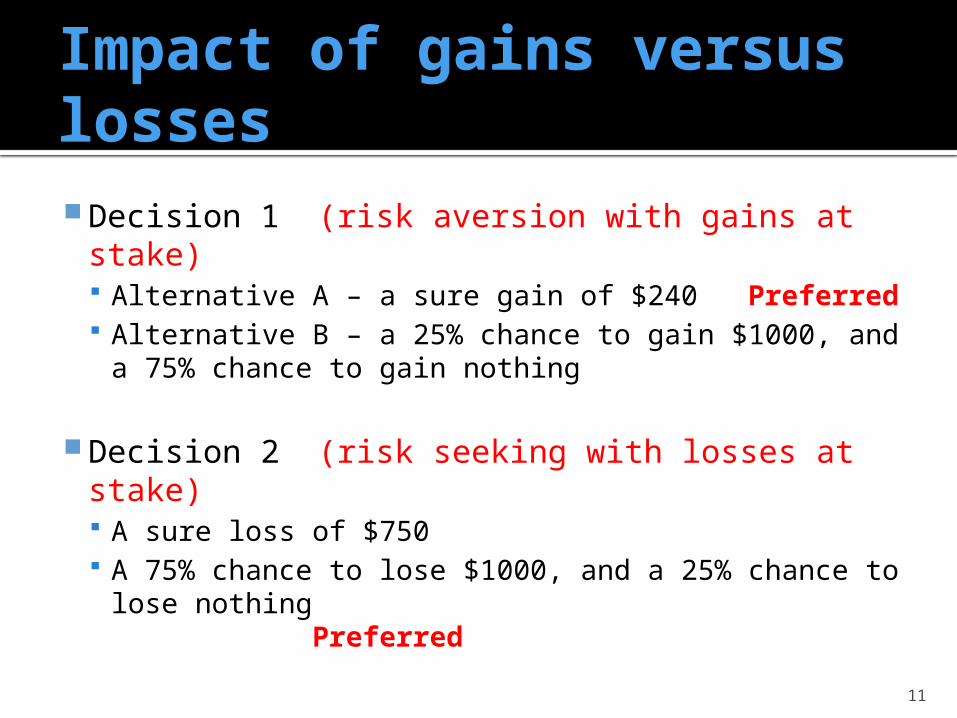
Impact of gains versus losses Decision 1 (risk aversion with gains at stake)
Alternative A – a sure gain of $240 Preferred Alternative B – a 25% chance to gain $1000, and
a 75% chance to gain nothing
Decision 2 (risk seeking with losses at stake) A sure loss of $750 A 75% chance to lose $1000, and a 25% chance
to lose nothing Preferred
12
Asian Disease Problem
Classic exercise in loss aversion Two choices presented to
respondents They had to choose option A or
option B
13
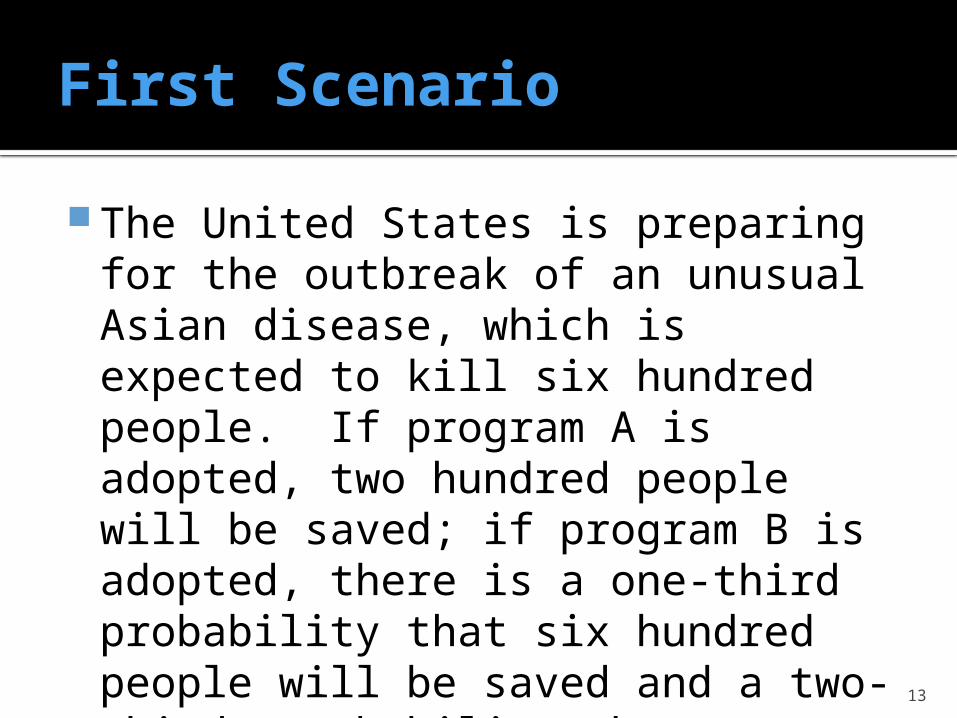
First Scenario
The United States is preparing for the outbreak of an unusual Asian disease, which is expected to kill six hundred people. If program A is adopted, two hundred people will be saved; if program B is adopted, there is a one-third probability that six hundred people will be saved and a two-thirds probability that no people will be saved. Which program do you favor?
14
When asked of physicians, 72% chose option A, the safe-and-sure strategy
15
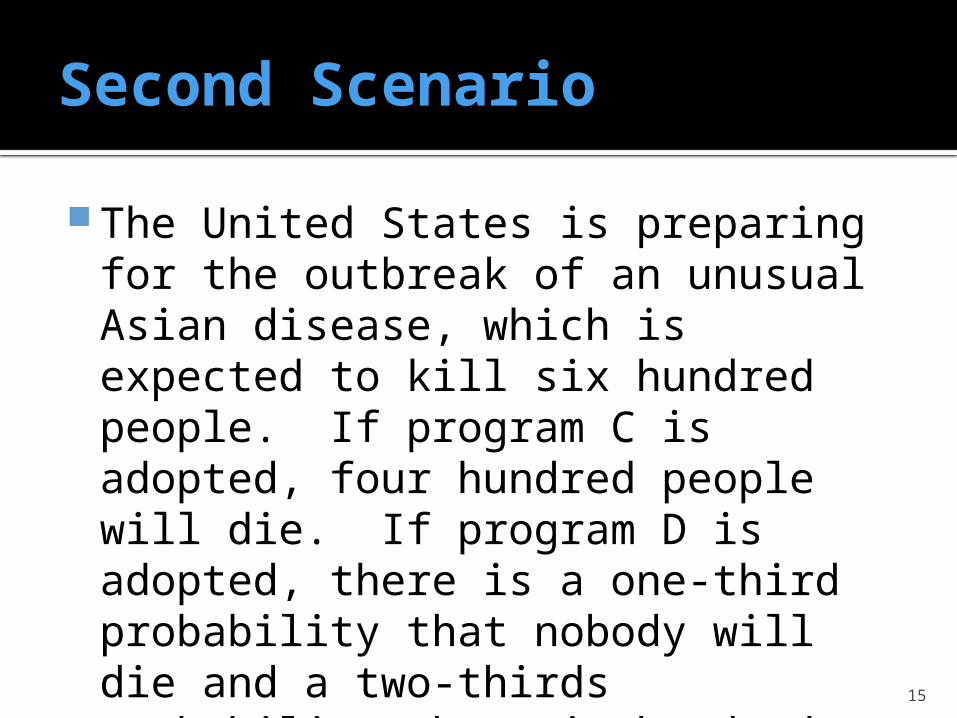
Second Scenario
The United States is preparing for the outbreak of an unusual Asian disease, which is expected to kill six hundred people. If program C is adopted, four hundred people will die. If program D is adopted, there is a one-third probability that nobody will die and a two-thirds probability that six hundred will die. Which of the two programs do you favor?
16
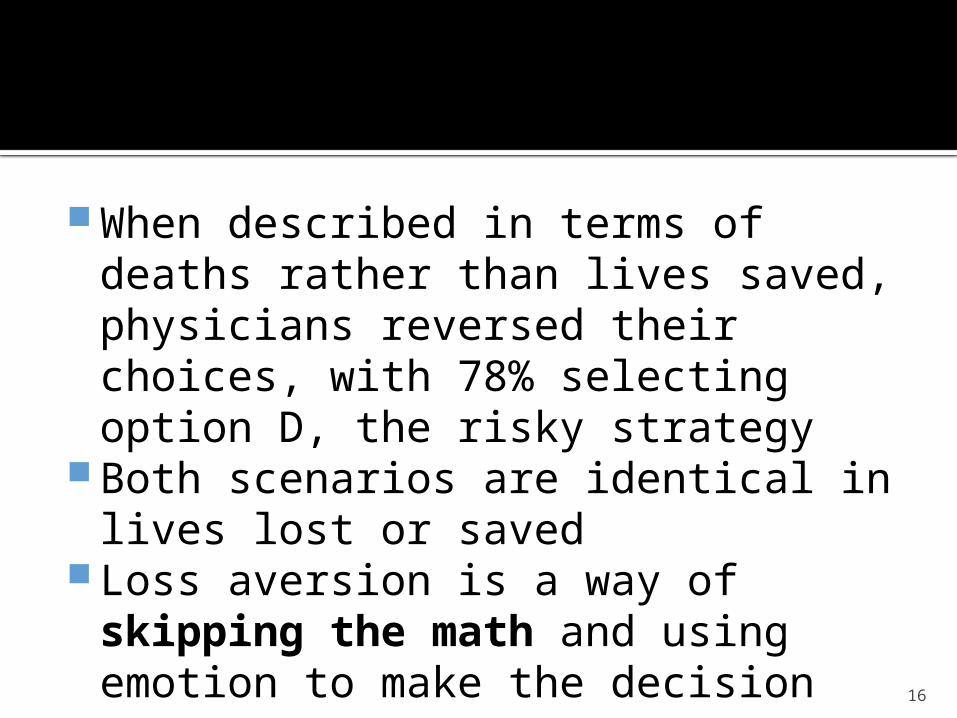
When described in terms of deaths rather than lives saved, physicians reversed their choices, with 78% selecting option D, the risky strategy
Both scenarios are identical in lives lost or saved
Loss aversion is a way of skipping the math and using emotion to make the decision
17
Three Major Decision-Making Theories
18
Expected Utility Theory
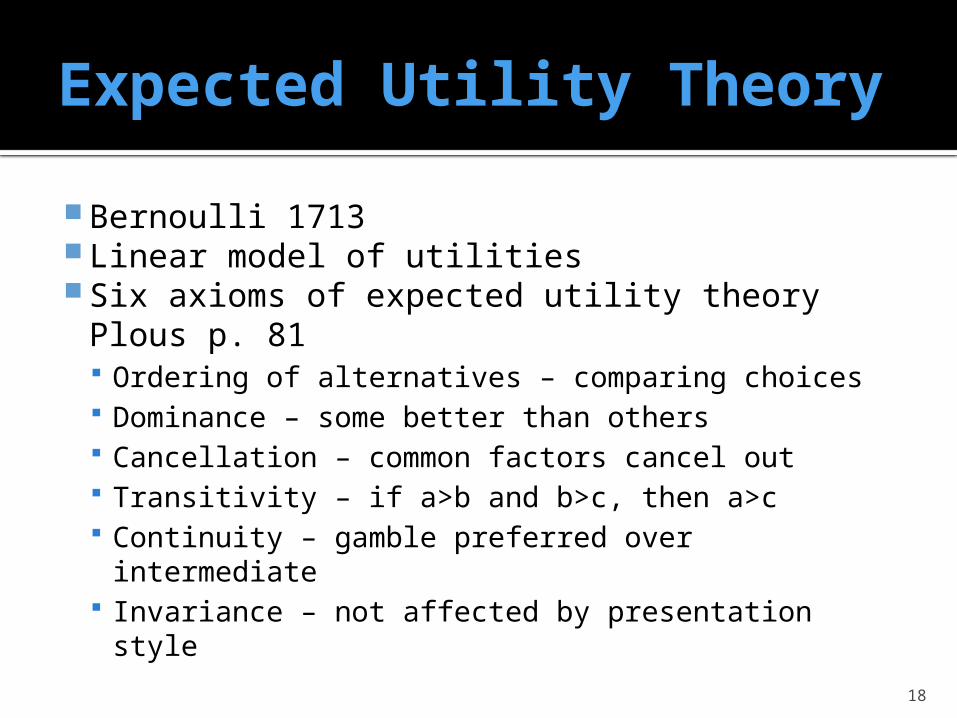
Bernoulli 1713 Linear model of utilities Six axioms of expected utility theory Plous
p. 81 Ordering of alternatives – comparing choices Dominance – some better than others Cancellation – common factors cancel out Transitivity – if a>b and b>c, then a>c Continuity – gamble preferred over
intermediate Invariance – not affected by presentation style
19
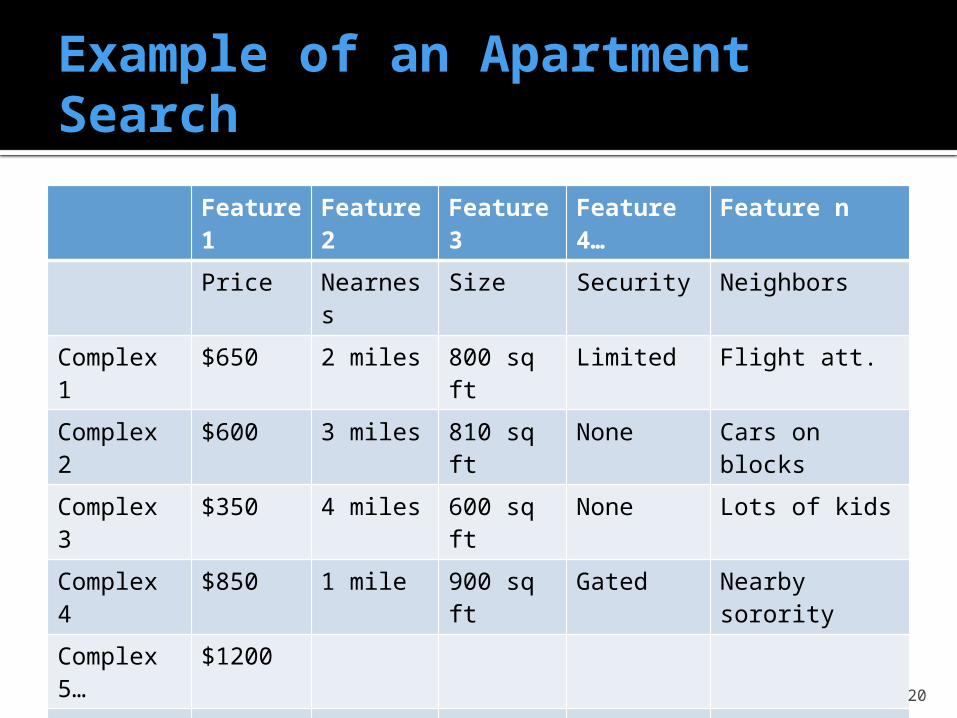
Satisficing Theory
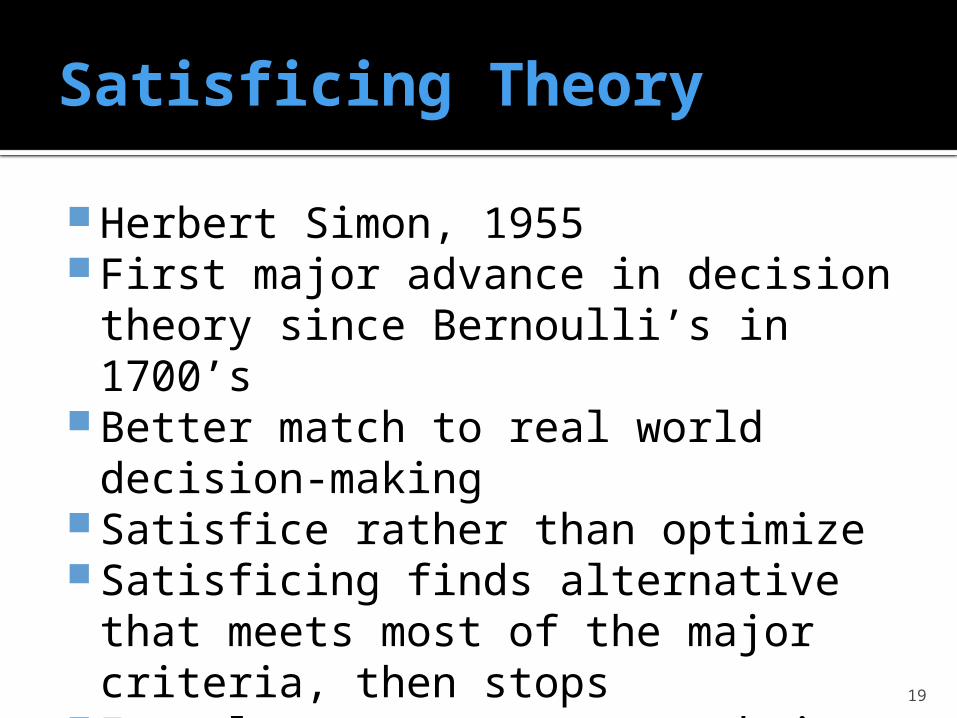
Herbert Simon, 1955 First major advance in decision
theory since Bernoulli’s in 1700’s Better match to real world decision-
making Satisfice rather than optimize Satisficing finds alternative that
meets most of the major criteria, then stops
Example – apartment search in Arlington
20
Example of an Apartment Search
Feature 1
Feature 2
Feature 3
Feature 4…
Feature n
Price Nearness
Size Security Neighbors
Complex 1
$650 2 miles 800 sq ft Limited Flight att.
Complex 2
$600 3 miles 810 sq ft None Cars on blocks
Complex 3
$350 4 miles 600 sq ft None Lots of kids
Complex 4
$850 1 mile 900 sq ft Gated Nearby sorority
Complex 5…
$1200
Complex n
$900
21
Unexplained Consumer Behaviors
Lichtenstein (1971) Utility theory doesn’t quite all
aspects of consumer behavior Rating of attractiveness (a weight
applied to a probably outcome) A gamble is seen by the authors as a
multi-dimensional stimulus Some dimensions of affect are
playing a role in what should be a cognitive decision
22
Prospect Theory
Kahneman and Tversky, 1979 Replaces “utility” concept with
“value” Utility is defined in terms of net worth Value is defined in terms of gains and
losses Losses loom larger than gains Endowment effect
What one owns is more valuable than what someone else owns
23
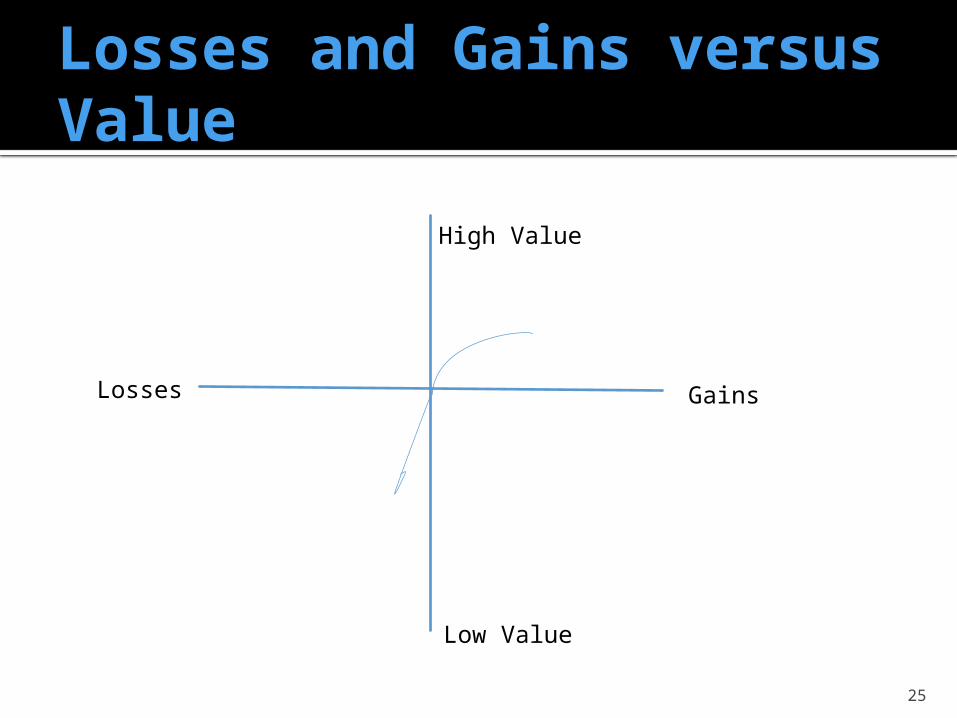
Weighting Function
The value of each outcome is multiplied by a decision weight
Decision weights are very subject to biases
This leads to a decidedly n0n-symmetrical value function, where the value function for losses is decidedly steeper than that for gains
24
Weighting Biases
Outcomes with small probabilities are overweighted relative to outcomes with higher certainty
This tendency leads to the concepts of insurance and gambling as industries
25
Losses and Gains versus Value
High Value
Low Value
GainsLosses
26
Impact of Losses on Risk
Example of $1 found by a millionaire or a homeless person – who values the incremental $1 more?
Who would be more concerned with the loss of that incremental $1?
For gains, this produces risk aversion For losses, this produces gambling
27
Importance of losses
Damasio and Loewenstein investing game In each round, subject decides to invest
$1 or invest nothing No invest, subject keeps dollar Invest, researcher flips coin for $1 loss or
$2.50 gain Rational investors should always choose
to invest
28
Regret
Decisions made relative to a reference point
Comparison of imaginary outcomes referred to as “counterfactutal reasoning”
Regret is based on two assumptions: People experience sensations of regret and
rejoicing When making decision under uncertainty,
people try to anticipate and take into account these sensations

29
Risk
30
Estimation of Risk
People tend to evaluate personal risk outcomes based on the valence Positive outcomes – more probable Negative outcomes – less probable Rose colored glasses as a lens to our
lives
31
Compound Events
Conjunctive compound events are A+B, where A and B are simple events
Compound events are preferred when conjunctive
Simple events are preferred when compound events are disjunctive (A or B)
People anchor on the probabilities of the simple events that make up the compound event and fail to adjust probabilities
32
Conservatism
Once we estimate probabilities, we are slow to modify those estimates
When modified, the estimates are changed more slowly than the data would dictate
33
Perceptions of Risk
Three dimensions for public perception of risk (Slovic, 1987) Dread risk – lack of control, catastrophic
potential Unknown risk – risks that are
unobservable Magnitude of risk – number of people
exposed to it
34
Reducing Biases in Risk Estimation
Maintain accurate records – minimize primacy and recency effects
Beware of wishful thinking – wishing for positive outcomes
Disaggregate compound events into simple events
35
Correlation and Causation
What is correlation?
What is causation?
Are they the same?
36
Correlation and Causation
What is correlation? Degree of covariation between two variables
What is causation? The outcome of one event resulting in the outcome of another event
Are they the same? No – a common mistake made by many market researchers
37
Illusory and Invisible Correlation
Illusory - People can “see” a correlation between objects based on the objects semantic similarities, even when no correlation exists
Invisible – People fail to see a correlation even when it exists – our expectations of visible patterns causes us to miss some strong but unexpected patterns
38
Causalation
Einhorn and Hogarth, 1986 Correlation need not imply causal
connection Causation need not imply a strong
correlation Some people believe that causation
implies correlation – they called it “causalation”
39
Attribution Theory
How people make causal attributions (Kelley, 1967)
Three main variables to explain behavior The person The entity – feature of the situation The time – feature of the occasion
Based on three sources of information Consensus, distinctiveness, and
consistency
40
Consensus
Sometimes people ignore base rate information
Sometimes people focus on salient, available, or vivid information
Fundamental attribution error (Ross, 1958) is that people’s behaviors tend to swamp all other situational variables
41
Self-Serving Bias
When faced with a successful outcome, people are more likely to accept responsibility and take more credit for the outcome
When faced with an unsuccessful outcome, people are more likely to attribute blame to others
Ego-centric biases – married couple example Positivity effect – attribute positive
behaviors to dispositional factors and negative behaviors to situational factors