Day 1 of Counting Methods and Probability Fundamental...
52
Day 1 of Counting Methods and Probability Fundamental Counting Principle and Permutations Grade Level: 10 th -11 th Subject Area: Algebra II Materials Needed: Pencils, Notebooks, Graphing Calculators, Slide show presentation on smart board. Standards: REVIEW: 7.SP.8 Find probabilities of compound events using organized lists, tables, tree diagrams, and simulation. a. Understand that, just as with simple events, the probability of a compound event is the fraction of outcomes in the sample space for which the compound event occurs. b. Represent sample spaces for compound events using methods such a organized lists, tables and tree diagrams. For an event described in everyday language (e.g., “rolling double sixes”), identify the outcomes in the sample space which compose the event. HS.SCP.9 (+) Use permutations and combinations to compute probabilities of compound events and solve problems. Objectives: 1. TLW be able to use a tree diagram and the fundamental counting principle to count the number of ways to perform a task. 2. TLW use the counting principle to find the number of permutations. 3. TLW define and use factorials. 4. TLW use factorials to determine the number of permutations of r objects taken from a group of n distinct objects through this formula: ! ( )! n r n P n r 5. TLW use factorials to determine the number of distinguishable permutations of n objects where one object is repeated s 1 times, another is repeated s 2 times, and so on, using this formula: a. 1 2 ! ! ! ! k n s s s Learning Activity: Introduction and Overview: Beginning a chapter on Counting Methods and Probability Here are a few big ideas we will be covering this chapter: Using permutations and combinations Finding probabilities Constructing binomial distributions
Transcript of Day 1 of Counting Methods and Probability Fundamental...

Day 1 of Counting Methods and Probability
Fundamental Counting Principle and Permutations
Grade Level: 10th-11th
Subject Area: Algebra II
Materials Needed: Pencils, Notebooks, Graphing Calculators, Slide show presentation on smart
board.
Standards: REVIEW: 7.SP.8 Find probabilities of compound events using organized lists, tables, tree
diagrams, and simulation.
a. Understand that, just as with simple events, the probability of a compound event is the fraction of
outcomes in the sample space for which the compound event occurs.
b. Represent sample spaces for compound events using methods such a organized lists, tables and tree
diagrams. For an event described in everyday language (e.g., “rolling double sixes”), identify the
outcomes in the sample space which compose the event.
HS.SCP.9 (+) Use permutations and combinations to compute probabilities of compound events and
solve problems.
Objectives: 1. TLW be able to use a tree diagram and the fundamental counting principle to count the number
of ways to perform a task. 2. TLW use the counting principle to find the number of permutations. 3. TLW define and use factorials. 4. TLW use factorials to determine the number of permutations of r objects taken from a group of
n distinct objects through this formula: !
( )!n r
nP
n r
5. TLW use factorials to determine the number of distinguishable permutations of n objects where one object is repeated s1 times, another is repeated s2 times, and so on, using this formula:
a. 1 2
!
! ! !k
n
s s s
Learning Activity: Introduction and Overview: Beginning a chapter on Counting Methods and Probability
Here are a few big ideas we will be covering this chapter:
Using permutations and combinations
Finding probabilities
Constructing binomial distributions

Today we will be examining the Fundamental Principle of Counting as well as Permutations.
Our most basic method for counting in problems where there are multiple aspects is through the
Fundamental Counting Principle. Do you remember drawing trees to represent different options? The
Fundamental Counting Principle will shorten the work but illustrate the same idea. Let’s say we wanted
to make a pizza. To illustrate all the options, we will make what I call a “pizza tree!”
Suppose with our pizza, we are allowed to pick between mozzarella and parmesan for the cheese, and
for toppings we can pick one of the following: pepperoni, pineapple, or chicken. How many different
pizzas could we make?
While this may not be the most realistic pizza problem, it does illustrate how powerful the fundamental
counting principle is. Let’s draw a tree to represent the options for the pizza.
We can see that when we have two choices for cheese, and three choices for topping, we have a total of
six different pizza combinations.
Direct Instruction: This will be on the smartboard
Fundamental Counting Principle
Suppose k items are to be chosen. If there are n1 ways to choose the first item, n2 ways to choose the
second item, and so on, then there are 1 2 kn n n ways to choose all k items.
Pizza
mozzarella
pepperoni
pineapple
chicken
parmesan
pepperoni
pineapple
chicken

In OTHER WORDS, if one event can occur in m ways and another event can occur in n ways, then the
number of ways that both events can occur is m n . If there are three events occur in m, n, and p ways,
then the number of ways that all three events can occur is m n p
Notice that there were 2 items to be chosen (cheese type and topping type). There are 2 ways to choose
the cheese, and 3 ways to choose the topping, so by the fundamental counting principle, we can simply
multiply 2 x 3 to get a total of 6 ways to choose both a cheese and a topping. This fundamental counting
principle becomes particularly handy when a tree would be difficult to draw, for example, if the pizza
parlor allowed the option of thick or thin crust, alfredo sauce or red sauce, three types of cheese to
choose from and for toppings you were allowed to pick one of their 14 available toppings. Using the
fundamental counting principle, we know that there are:
2 x 2 x 3 x 14 = 168 ways to choose a crust, a sauce, a cheese, and a topping.
Guided discovery: Using the fundamental counting principle to derive the
permutation formula!
Ask 5 out of the 25 students to stand in front of the class.
Draw out 5 blanks on the board like this: ____ ____ ____ ____ ____
Ask the class the following questions:
o We are going to use our knowledge of the fundamental counting principle to determine
how many ways there are to arrange (name the five people) into a line. Each spot in line
will have a certain number of options for how we can fill it, and like the different parts
of our pizza, we will multiply the different ways to fill each spot. Make sense?
o How many ways can we fill spot number one? 5 ways, since there are 5 people who
could fill that spot, pick student to stand in the first spot.
o Ok, now that we have spot number one filled, we should fill spot number two. How
many ways are there to fill spot number two? 4 ways, since 1 person is already standing
in spot number one, and cannot be in both spot number one and spot number two.
o Notice we only have four ways to fill spot number two. How many ways can we fill spot
number 3? Will there be a pattern? 3 ways, and yes there is a pattern, the number of
ways to fill a spot will keep decreasing by one until we reach the last spot, where there
will be only one way.
o Think of this process now in terms of a tree. The base of our tree (I would label it “Line
of five people”) has five branches (each of our five options). The second layer, coming
off each of those five branches, is an additional four branches representing the four
people who are available to fill spot number two, and so on. Draw an incomplete tree
diagram, showing all the different levels but not filling the whole tree out.
o We know we can use the fundamental counting principle to describe this tree, so the
total number of ways to arrange these five people in a line is:

5 x 4 x 3 x 2 x 1. We can use a short hand symbol to describe this kind of multiplication:
Display this on smartboard:
n Factorial The factorial of n is denoted as n!
! ( 1)( 2)( 3)...1n n n n n
So instead of writing 5 x 4 x 3 x 2 x 1 we could write 5! How does this relate to permutations?
A permutation is an arrangement of all or part of a set of items where order is important.
Permutations are expressed by this formula, where n represents the whole set, and r represents
the part of the set that is being arranged.
Permutations
The permutation of n objects taken r at a time is:
!( , )
( )!n r
nP n r P
n r
Another way of thinking:
The number of permutations of r objects taken from a group of n distinct objects is denoted by nPr.
Note that 0 factorial (0!) is defined to be 1. (How many ways can we arrange 0 items? One way! It is
already done!) Also notice that 0! must be defined as 1 so that P(n,n) will equal the familiar n!
For example, let’s take a look at lining up five people from our class. Suppose n is 25 (since there are 25
of you) and r is 5 (since I want 5 people to be lined up). According to the formula, there are:
25! 25 24 23 22 21 20! 25 24 23 22 21 6,375,600
(25 5)! 20!
distinct (or different)
ways to arrange five people from the 25 available. This formula makes sense, since there are 25 ways to
pick the first person, 24 ways to pick the second, all the way down to 21 ways to fill the last spot. After
all spots are filled, we don’t care about the order of the rest of the people. That is why we divide by 20!
(the number of ways to order the rest of the class).
***If you are wanting to find the “!” symbol on your calculator, go into CATALOG, hit A on your
keypad to bring it to the top, and then scroll up through the symbols until you find “!”.***
Suppose we want to find how many different arrangements we can make with the letters in the word
BANANA. In this case, we know that the “A’s” and “N’s” are indistinguishable (meaning we can’t tell one
“A” from another), therefore we need a slightly different formula to solve this problem.

Permutations with Repetition
The number of distinguishable permutations of n objects where one object is repeated s1 times, another is repeated s2 times, and so on, using this formula:
1 2
!
! ! !k
n
s s s
For the word “BANANA” there are 6 letters in all (n=6) and “A” is repeated 3 times, and “N” is repeated
two times. Therefore the number of distinguishable permutations of “BANANA” is
6! 6 5 4 3!
3! 2!
3!3 5 4 = 60
2 1
Work these problems as a class if time allows:
Find the number of distinguishable permutations of the letters in the word CLEVELAND.
Answer: 9!
90,7202! 2!
Find the number of permutations: 6 2P
Answer: 6 2
6!30
(6 2)!P
For the given configuration, determine how many different license plates are possible if (a) digits and
letters can be repeated, and (b) digits and letters cannot be repeated. Use the Fundamental Counting
Principle.
4 letters followed by 3 digits
a) 4 326 26 26 26 10 10 10= 26 10 456,976,000
b) 26 25 24 23 10 9 8 258,336,000
****Remind students there will be a quiz on Day 3 on Permutations (with and without repetition) and
Combinations, covered on day 2, (formulas will be provided but not labeled)****
Allow students to work quietly on homework during the remaining time period.
Assessment:

Objectives 1-2: Informal Assessment done by in class observation. Formal Assessment via homework. Objectives 3-5: Informal Assessment done by in class observation. Formal Assessment via homework, quiz, and unit test. Homework assignment: #1 (vocabulary), #3 (tree diagram), #7-9 (Fundamental Counting Principle), #12-14 (License Plate configurations), #27-29 (Factorials), #33-36 (Permutations), #43-46 (Permutations with Repetition) #56 (Error Analysis)
Response:

Day 2 of Counting Methods and Probability
Combinations
Using the Calculator for Permutations and Combinations
Grade Level: 10th-11th
Subject Area: Algebra II
Materials Needed: Pencils, Notebooks, Graphing Calculators, 25 Calculator Instruction sheets, 25
group worksheets on Combinations and Permutations, Graphing Calculator Simulator on smartboard.
Standards: HS.SCP.9 (+) Use permutations and combinations to compute probabilities of compound
events and solve problems.
Objectives: TLW find the number of combinations of n objects taken r at a time using the following formula:
!( , )
!( )!
nC n r
r n r
TLW will distinguish between when to use a permutation vs. a combination.
Learning Activity:
ANSWER ANY QUESTIONS ON HOMEWORK.
Grade homework using a “homework quiz”—have students copy their solutions for #7, #14, #35, and #45 on to a blank sheet of paper. Collect the homework quizzes.
Review of what we discussed yesterday: Tree Diagrams, Fundamental Counting Principle, Factorials, Permutations, Permutations with Repetition. Have students summarize what they learned about each of those areas. Direct Instruction: *Displayed on smartboard: A combination is a selection of items where order does not matter.
Combinations
The combinations of n objects taken r at a time is:
!( , )
!( )!n r
nC n r C
r n r
Another way of thinking:
The number of combinations of r objects taken from a group of n distinct objects is denoted by nCr

**Notice that a combination, like a permutation, can be notated a number of different ways. nCr and
C(n, r) will be the two ways I will write combinations for tests or quizzes.
Example: I am forming a math club on campus and I will be selecting 7 of the students in this class to be part of this club (no, the students do not have a choice as to whether or not they want to be in the club ). There are 25 people in the class, which means that n= 25. I am choosing 7 out of the 25 to be in my club, so that means r= 7. Let’s plug these numbers into the formula to see if the formula makes sense:
25! 25 24 23 22 21 20 19 18!(25,7)
7!(25 7)!C
7! 18!480,700
Once again, since repetition is not allowed (I can’t pick the same person twice to be in my club), the options there are 25 options to pick the first person, and 19 options to pick the last person.
What’s different about the combinations formula in comparison to the permutations formula?
Why do you think that is? Remember, the order of those that are selected into our groups no longer matters (unlike permutations).
Notice that since order no longer matters, any rearrangement (or permutation) of the same seven people makes it the same group. How many different ways can we arrange 7 people? 7! That is why we divide by r!; since the order in which we pick the objects no longer matters.
Have students use the formula to solve for C(5,3) and C(14,5):
(5,3) 10C (14,5) 2002C
Decide whether to multiply or add combinations! Are we choosing one thing OR another? The word OR is a signal that we must add the two events. Are we doing one thing AND another? The word AND is a signal that we must multiply the outcomes of the two events.
A story of Miss Lange’s date night with Mr. Combination (see what I did there?).
Combinations Example: PIZZA!
Story: Mr. Combination and I decided that we would decide to order a pizza since there was a special going on at Bruno’s pizza. How many different pizza varieties can be created if there are two choices of crust, thick or thin, and two out of three possible toppings are selected? Notice we pick a crust AND two out of three toppings?
Solution
The combinations of the 2 types of crusts is (2,1)C . The combination of 2 out of 3 toppings is (3,2)C
So the number of pizza varieties that can be created is:
2! 3!(2,1) (3,2)
1!(2 1)! 2!(3 2)!
2 3 2
1
C C
2 1
6

Next, we went to a movie store. The movie store advertises that it houses 100 movies, 32 of which are comedies, 17 are horror, 22 are family, and 29 are dramas.
How many different sets of exactly 2 comedies, AND 3 dramas can we rent?
Solution: You can choose 2 out of the 32 comedies and 3 out of the 29 dramas, so the number of possible movie rentals is:
32 2 29 3
32! 29! 32 31 30!
2!(32 2)! 3!(29 3)!C C
2 1 30!
29 28 27 26!
3 2 1 26!
496 3654 = 1,812,384 movie rentals!
How many different sets of exactly 2 comedies OR 3 dramas can we rent?
32 2 29 3
32! 29! 32 31 30! +
2!(32 2)! 3!(29 3)!C C
2 1 30!
29 28 27 26! +
3 2 1 26!
496 + 3654 = 4150 movie rentals!
How many different sets of at most 3 movies can we rent?
Solution: we can rent 0, 1, 2, or 3 movies. Because there are 100 movies available, the number of possible sets of movies is:
(100,0) (100,1) (100,2) (100,3) 1 100 4950 161,700 166,751 possible setsC C C C
PERMUTATION OR COMBINATION?
Because distinguishing between a permutation and combination can be tricky, I want to provide you a lot of practice doing so. First we will cover some examples together as a class, and then I will divide you into groups of three (with one group of 4) to work on a worksheet I have prepared
Discuss the difference between a permutation and a combination.
A permutation is an arrangement of all or part of a set of items where order is important.
A combination is an arrangement of all or part of a set of items where order is not important.
For example, given the objects a, b, c
3P2= 6 {ab, ac, bc, ba, ca, cb}
3C2 = 3 {ab, ac, bc}
Example:
Explain whether the following is a combination or a permutation and find the solution. How many two-letter arrangements can be formed from the letters CAT?
Solution

Order makes a difference in this problem because CA and AC are not the same arrangement. The
solution using permutations: 3!
(3,2) 6(3 2)!
P
.There are 6 possible arrangements
{CA, AC, CT, TC, AT, TA}
Example:
Explain whether the following is a combination or a permutation and find the solution. How many two-
man crews can be selected from the set of three males: {Charlie, Anton, Tom}?
Solution
For this problem, order does not make a difference. The two-man crew of Charlie/Anton is the same as
the two-man crew of Anton/Charlie. The solution is found using combinations: 3!
(3,2) 32!(3 2)!
C
.
There are only 3 different two-man crews {Charlie/Anton, Charlie/Tom, Anton/Tom}
Explain whether each situation is a combination or a permutation and find the solution. (questions will be displayed on smartboard)
How many 4-letter passwords can be made from the first 10 letters of the alphabet if no letter is used more than once in the same password?
Solution: Permutation; (10,4) 5,040P
How many sets of officers of 3 people can be selected from a club that has 22 members?
Solution: Combination; (22,3) 1,540C
Guided Discovery Problems (link to bigger ideas)
1. Give an example to show why 3P2 = 3P3.
Consider the objects a, b, c.
3P2 =6 {ab, ac, bc, ba, ca, cb}
3P3 =6 {abc, acb, bac, bca, cba, cab}
Or when we think of this problem in regards to using the formula:
3 2
3 3
3!6
(3 2)!
3!6
(3 3)!
P
P

Hand out Calculator Instruction sheets, walk through examples on the page using the graphing
calculator simulator on the smartboard for students to follow along.
At this point remind students that they will be having a QUIZ tomorrow at the end of class,
covering permutations (with and without repetition) and combinations and one easy question
on tomorrow’s lesson dealing with the Binomial Theorem and Pascal’s Triangles.
Break students off into their groups, handing each student a group worksheet on Combinations
and Permutations. Students are to work on these worksheets for the remainder of the class
period. If students are unable to complete the worksheet during class, they are to take it home
and finish it themselves, along with the few homework problems assigned from the book.
Assessment: Objectives 1-2: Informal Assessment done by in class observation. Formal Assessment via homework assignment and Unit test Homework assignment: 1.) Complete worksheets for class tomorrow. 2.) page 694, #3-5 (Basic Combinations, use formula for #3, can use calculator for 4 and 5), #11-12 (Error Analysis), #15-17 (Possible 5 card hands taken from standard 52 deck). Instructions for calculator included below. Group worksheet not included.
Response:

Calculator Instructions for Permutations and Combinations with Examples
PERMUTATIONS
Example: How many possible permutations of 2 cards can be chosen from a deck of 5
cards?
• Input 5.
• Press [MATH], arrow left to highlight PRB, then press [2] to select the nPr function.
• Input 2 and press [ENTER]. There are 20 possible permutations of choosing 2 cards from a
deck of 5 cards.
COMBINATIONS
Example: How many possible combinations of 2 cards can be chosen from a deck of 5
cards?
• Input 5.
• Press [MATH], arrow left to highlight PRB, then press [3] to select the nCr function.
• Input 2 and press [ENTER]. There are 10 possible combinations of choosing 2 cards from a
deck of 5 cards

1 1 1
1 2 1 1 3 3 1
1 4 6 4 1 ? ? ? ? ? ?
Day 3 of Counting Methods and Probability
Binomial Theorem, Pascal’s Triangle and Combinations
Grade Level: 10th-11th
Subject Area: Algebra II
Materials Needed: Pencils, Notebooks, Graphing Calculators, Extra Calculator Instruction Sheets,
Slideshow for Pascal’s Triangle pictures and it’s connections.
Standards: HS.SCP.9 (+) Use permutations and combinations to compute probabilities of compound
events and solve problems.
HS.AAPR. 5 (+)
Know and apply the Binomial Theorem gives the expansion of (x + y)n in powers of x and y for a positive
integer n, where x and y are any numbers, with coefficients determined for example by Pascal’s Triangle.
The Binomial Theorem can be proved by mathematical induction or by a combinatorial argument. (CCSS)
Objectives: 1 TLW complete additional rows of Pascal’s Triangle 2 TLW explore the connections between the entries of Pascal’s Triangle and combinations and
binomial expansions. 3 TLW use the entries of Pascal’s Triangle to find the values for specific combinations. 4 TLW use the entries of Pascal’s Triangle to complete binomial expansions. 5 TLW Know and apply the Binomial Theorem to expand binomials.
Learning Activity: ANSWER ANY QUESTIONS ON PREVIOUS HOMEWORK ASSIGNMENT. Have students pass in their group worksheets on combinations and permutations as well as the textbook assignment.
Announce that there will be a quiz on combinations and permutations at the end of the class period, as well as a simple question about today’s topic: binomial theorem, Pascal’s triangle, and combinations. Hook: Start drawing out the entries for Pascal’s Triangle down to the fifth row. Introduce the drawing as Pascal’s Triangle and ask if any of the students could take a guess as to what the 6th row would be. Allow students to work together to solve for the next row. If students believe they have figured out the pattern, instruct them to write the next row of Pascal’s Triangle in their notebooks.
Drawing of Pascal’s Triangle
Hints:
There is a pattern. The next row relies on the row before it. Can you spot the pattern?
Notice that all the outside entries are 1’s. Do you think that will be true for the next row?
Why does each row get bigger by one entry?
Notice how the rows are spaced, with some numbers falling in between two numbers of the row above it. Is there any pattern to that? Try using addition.
After giving all of the hints, reveal the next row in the triangle! Write this in for the next line:
1 5 10 10 5 1
Did anyone find that to be the next row? If so, can you explain to us how you got those numbers?
The trick to finding the entries of the next row is to take the two numbers above the entry and add them together. That is why the outsides were always “1” (0+1=1), and why the second entry for the row was 5 (1+4=5) and so on.
This is just one of the patterns associated with Pascal’s Triangle, created by the famous French mathematician Blaise Pascal.
We will look at two very important connections with Pascal’s triangle: It’s connection with combinations and with expanding binomials ((x+y)n).
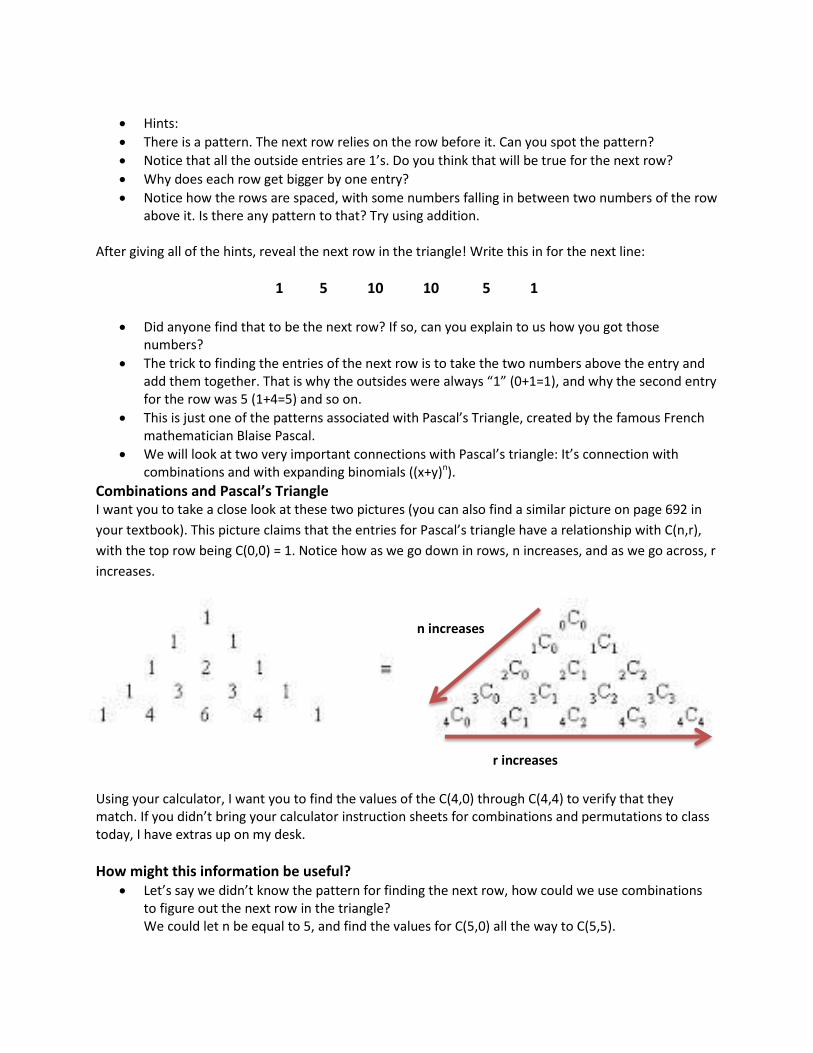
Combinations and Pascal’s Triangle I want you to take a close look at these two pictures (you can also find a similar picture on page 692 in
your textbook). This picture claims that the entries for Pascal’s triangle have a relationship with C(n,r),
with the top row being C(0,0) = 1. Notice how as we go down in rows, n increases, and as we go across, r
increases.
Using your calculator, I want you to find the values of the C(4,0) through C(4,4) to verify that they match. If you didn’t bring your calculator instruction sheets for combinations and permutations to class today, I have extras up on my desk.
How might this information be useful?
Let’s say we didn’t know the pattern for finding the next row, how could we use combinations to figure out the next row in the triangle? We could let n be equal to 5, and find the values for C(5,0) all the way to C(5,5).
n increases
r increases

More realistic use: Let’s say we wanted to write out all the values for C(5,0) to C(5,5). Instead of going through the process of solving via the formula or using our calculator, we could quickly find the next row in the triangle, and those entries would be the solutions!
On smartboard:
Suppose there are 6 members in student council, and we must choose two of them to present an idea to the principal. Use Pascal’s triangle to find the number of combinations of 2 members that can be chosen as representatives.
Solution: First, we would find the values for the 6th row of Pascal’s triangle. Once that is complete, we would need to find the entry that corresponds with C(6,2). What is that value? C(6,2) = 15. There are 15 combinations of members to present an idea to the principal. This is the first connection we’ve explored with Pascal’s Triangle, and the second one is even more powerful! If I were to ask you to expand (x+y)2 , how would you expand it? Most people would use double distribution, or the FOIL method. What if I wanted you to expand (x+y)7? Or (x+y)15? We will need a better system than just FOIL or distribution! This is where Pascal’s Triangle comes in! Take a look at this picture:
As you can see, the values that are highlighted are the coefficients when the binomial is expanded. AND
they are the SAME values for Pascal’s Triangle and the values for Combinations!
How can we use this information to help us expand binomials? Certainly we don’t want to have to draw
the fifteenth row in order to find the coefficients of (x+y)15. Instead, we use a shortcut! Using the
knowledge we have of combinations!

On Smartboard:
Compare this theorem with picture of the expanded binomials. Notice that the exponents for a and b
always add up to n, starting with the exponent for a being equal to n, and ending with the exponent of b
being equal to n. This is important to note as you try expanding these on your own.
Try expanding these binomials using the formula: You may use the values from the triangle for the
coefficients, but I want you to pay particular attention to the exponents. (Write these problems on the
board, then solve together as a class)
(x+3)5 (a+2b)4
What happens if we want to expand (a-2b)4 ?( Make note that we can use a substitution by letting c= -
2b, using the binomial theorem, and then plug -2b back in for c at the end. Students do not have to write
out all the steps for substitution, but they may find it helpful.)
Isn’t this powerful information?! You will have more opportunities to practice expanding binomials in
your homework, but now it is time to take the quiz. I will hand out the quiz and write your homework
assignment up on the board.
Assessment: Objectives 1-2: Informal Assessment done by in class observation. Objectives 3-5: Informal Assessment done by in class observation. Formal Assessment via homework, quiz, and unit test. Homework assignment: #20-23 (Using rows of Pascal’s Triangle to write binomial expansions—allow students to look up a completed Pascal’s Triangle or draw out a triangle for rows not covered in class) #25-33 odd (use binomial theorem to write expansion) #49 & 50 (Review of Combinations- Word Problems) Quiz on the following page.
Response:
Binomial Theorem
For any positive integer n, the binomial expansion of (a+b)n is: 0 1 1 2 2 0
0 1 2( )n n n n n
n n n n na b C a b C a b C a b C a b
Notice that each term in the expansion of (a+b)n has the form n r r
n rC a b where r is an integer from
0 to n.

Name____________________
Subject___________________ Quiz 10.1-10.3
Date_____________________
Formulas Bank
!
!( )!
n
r n r
1 2
!
! ! !k
n
s s s
!
( )!
n
n r
1. Find C(6,4) using the appropriate formula. Show all your steps. You may check your work with a
calculator.
2. A Spanish club is electing a president, a vice president, and secretary. The club has 9 members
many different ways can the 3 offices be filled? (HINT: Does order matter? Meaning, is there a
difference in the positions of president, vice president and secretary?) Show all your steps, you
may check your work with your calculator.
3. OHIO has 4 letters with O repeated twice. Find the number of distinguishable permutations of
letters in OHIO.

4. Permutation or combination? Examine the following scenario and determine if it is solved using
the permutation formula or combination formula, explain your reasoning. Solve for the answer.
“A photographer lines up the 15 members of a family in a single line in order to take a
photograph. How many different ways can the photographer arrange the family members for
the picture?”
5. List areas of math that have connection to Pascal’s Triangle (Discussed in class today)

Name____________________
Subject___________________ Quiz 10.1-10.3 Answer Key
Date_____________________
Formulas Bank
!
!( )!
n
r n r
1 2
!
! ! !k
n
s s s
!
( )!
n
n r
1. Find C(6,4) using the appropriate formula. Show all your steps. You may check your work with a
calculator.
6! 6!(6,4) 360
(6 4)! 2!C
2. A Spanish club is electing a president, a vice president, and secretary. The club has 9 members
many different ways can the 3 offices be filled? (HINT: Does order matter? Meaning, is there a
difference in the positions of president, vice president and secretary?) Show all your steps. You
may check your work with a calculator.
9! 9!(9,3) 504
(9 3)! 6!P
3. OHIO has 4 letters with O repeated twice. Find the number of distinguishable permutations of
letters in OHIO.
4!12
2! distinguishable permutations of letters in OHIO

4. Permutation or combination? Examine the following scenario and determine if it is solved using
the permutation formula or combination formula, explain your reasoning. Solve for the answer.
“A photographer lines up the 15 members of a family in a single line in order to take a
photograph. How many different ways can the photographer arrange the family members for
the picture?”
This is a permutation, since we are arranging people into a line, therefore order matters.
15!(15,15) 15! 1,307,674,368,000 ways
(15 15)!P
5. List areas of math that have connection to Pascal’s Triangle (Discussed in class today)
Binomial Expansion and the Binomial Theorem (anything that includes “binomial”) and
Combinations

Day 4 of Counting Methods and Probability
Define and Use Probability
Grade Level: 10th-11th
Subject Area: Algebra II
Materials Needed: Pencils, Notebooks, Graphing Calculators, 25 M&M Fun Size packages, 25 M&M
probability worksheets, ** “Card Facts” Handouts for those who want them**
Standards:
REVIEW: 7.SP.5 Understand that the probability of a chance event is a number between 0 and 1 that
expresses the likelihood of the event occurring. Larger numbers indicate greater likelihood. A probability
near 0 indicates an unlikely event, a probability around ½ indicates an event that is neither unlikely nor
likely, and a probability near 1 indicates a likely event.
Objectives: TLW make decisions based on the probability of an event (ranged from 0 to 1). (i.e. Is this event
likely to happen?)
TLW understand the difference between theoretical probability and experimental probability.
TLW determine the odds in favor of or odds against an event
Learning Activity: ANSWER ANY QUESTIONS ON HOMEWORK. Collect the homework.
Hand back quizzes, explain difficult problems.
Direct Instruction:
Definitions:
Probability: The probability of an event is the likelihood of that event.
It is given by a number on a continuous scale from 0 to 1, where 0 means that the event is impossible and 1 means that the event will definitely occur. Probabilities can be written as fractions, decimals, or percents, so for an event that is just as likely to occur as to not occur, the probability, denoted P, is 1/2= 0.5 = 50%
Probability experiment: an occurrence whose outcome is uncertain. Often called a random event, because it occurs at random.
Displayed on Smartboard
Theoretical Probability of an Event

When all outcomes are equally likely, the theoretical probability that an event A will occur is:
Number of outcomes in event A( )
Total number of outcomes (sample space)P A
Often, the theoretical probability of an event is often simply called the probability of the event.
Notice that all outcomes must be equally likely. Think about rolling a die, the likelihood of each of the six
outcomes is the same. If we wanted to find the probability of rolling an odd number (notated P(odd
number)) that would be equal to 3/6 or ½ since there are 3 favorable outcomes (1,3,5) out of the
possible six outcomes. This is a theoretical probability, meaning that this is what should happen. In
theory, half the rolls should yield an odd number, but an actual experiment might show differently.
This probability is determined based on actual trials. The more trials, the more accurate the results for
the probability.
For example: Have you ever made decisions based off a coin toss? Best two out of three? We know that
the theoretical probability of having the coin be “heads up” is 50%, however, there have been times
where the odds appear to not be that way (like the six times in a row you betted it would be heads, and
each time it was tails). According to our experimental probability, if 6 out of 6 times the results came
back tails, then the experimental probability of getting a tails is 100% (6/6) and the probability of getting
a tails is 0% (0/6). We know that those values aren’t accurate reflections of the real probability, and with
more trials we might find that our experimental probability approaches the theoretical probability of
50%.
Today’s activity will focus on finding theoretical probabilities and then experimenting to see if the
experimental probabilities match the theoretical probabilities. I have set up different “probability
stations” where you will be responsible for 1) finding the theoretical probability of your particular
scenario 2) recording the outcomes of the trials to determine the experimental probability.
Determining Odds:
Odds in Favor of or Odds Against an Event
When all outcomes are equally likely, the odds in favor of an event A and the odds against an event A are defined as follows:
Experimental Probability of an Event
When an experiment is performed that consists of a certain number of trials, the experimental probability of an event A is given by:
Number of trials where A occurs( )
Total number of trialsP A

Number of outcomes in AOdds in favor of event A =
Number of outcomes not in A
Number of outcomes not in AOdds against event A=
Number of outcomes in A
You can write the odds in favor of or against an event in the form a/b or in the form a:b.
M&M’s Activity: Theoretical and Experimental Probability
Have you ever wondered if, when you reach into an M&M Fun Size bag, if the probability of picking an
Orange M&M is the same as the probability of picking a blue M&M?
Did you know that it is NOT the same? Did you know that the M&M manufacturing company actually
intentionally creates less orange M&M’s than blue M&M’s? According to some research that I have
done, in a regular package of Milk Chocolate M&M’s should contain :
24% blue, 14% brown, 16% green, 20% orange, 13% red, and 14% yellow M&M’s (Write percentages on
the board). That means, in any given package, the probability of drawing a yellow is 14%.
I want to see if these theoretical probabilities are the same for all packages! So today, I have brought in
enough Fun Size packages of the milk chocolate M&M’s so that each of you will find the experimental
probability of drawing each color.
Hand out M&M Probability worksheets, and display these instructions on the smartboard:
1. Record the theoretical probability for each color.
24% blue, 14% brown, 16% green, 20% orange, 13% red, and 14% yellow
2. Open up your M&M Package, but DO NOT EAT ANY M&M’S!
3. Record your total number of M&M’s. This will be your “total number of outcomes” for the
experimental probability.
Number of outcomes in event A( )
Total number of outcomes (sample space)P A
4. Record how many M&M’s there are of each color (number of outcomes in the event of each
color), and divide each number by the total number of M&M’s. Record your result as a decimal
to two decimal places in the section marked “Theoretical Probability-Personal”.

5. When you are finished, write your theoretical probabilities for each color on the smart board.
We will average the probabilities and see if they approximate the values provided to us by the
M&M manufacturers.
****If you have time: On the backside of your sheet there is a similar table, except this time
there is a section for “Experimental Probability”. With all your M&M’s out on our your desk,
close your eyes and pick an M&M. Open your eyes, and the put a tally mark beside each color.
Repeat this process 20 times, and then calculate the Experimental Probability. Does this match
your personal theoretical probabilities from the first page?
Write assignment up on the board while students are working. If students would like a “card facts” sheet
(Answers questions like: How many cards are in a suit? How many are face cards? How many of each
type of card), instruct them to pick up a sheet on the way out.
Assessment: Objectives 1-3: Informal Assessment done by in class observation. Formal Assessment via homework, quiz, and unit test. Homework Assignment: pg 702 #11-14 (Finding probability- cards) #20-23 (Finding Odds), 24-25 (Error Analysis)
Response:

M&M Probability Sheet
Color
Theoretical Probability Provided
Theoretical Probability Personal Class
Red
Orange
Yellow
Green
Blue
Brown

M&M Probability Sheet
Color Tallies Experimental Probability
Red
Orange
Yellow
Green
Blue
Brown

Day 5 & 6 of Counting Methods and Probability
Finding Probabilities of Disjoint and Overlapping Events
Grade Level: 10th-11th
Subject Area: Algebra II
Materials Needed: Pencils, Notebooks, Graphing Calculators, smartboard slideshow
Standards:
HS.SCP.7 Apply the Addition Rule, P(A or B) = P(A) + P(B) – P(A and B), and interpret the answer in terms
of the model.
HS.SCP. 1 Describe events as subsets of a sample space (the set of outcomes) using characteristics (or
categories) of the outcomes, or as unions, intersections, or complements of other events (“or,” “and,”
“not”).
Objectives: 1.) TLW use the rules of Probability of Compound Events to find the probability of compound
events 2.) TLW use the Probability of the Complement of an Event to find the probability of an event. 3.) TLW use the ideas of set theory to better understand the probability of compound events and
finding the complement of an event.
Day 5 Learning Activity: Begin by answering homework questions and There are times when we want to find the probability of compound events (two events occurring at the
same time). For example, when picking a card out of the deck, what is the probability that we could
draw a 7 or draw a spade? We would use the rules of finding the probability of compound events.
Probability of Compound Events
If A and B are any two events, then the probability of A or B is: P(A or B) = P(A) + P(B) – P(A and B) Inclusive Events
If A and B are disjoint events, then the probability of A or B is: P(A or B)= P(A) + P(B)Mutually Exclusive Events
First thing we need to discuss: What are Inclusive Events? Inclusive Events are events such that
both events share some outcomes, or when thinking of sets, it is two sets that have an
intersection. Think of them as being “Overlapping” (Draw two circles on the board that intersect
to represent inclusive events). An example of this: The event that you draw a 7 and the event

that you draw a spade are inclusive events. This is because we can draw a 7 that is a spade, in
other words, the two events share at least one outcome. That shared outcome is what lies in the
intersection of our circles.
Mutually exclusive events are events that DO NOT share anything in common. If we were to
think of this in terms of sets, it is two sets that have no intersection (Draw two circles on the
board that do not intersect). Think of them as being “Disjoint” An example of this: The event
that we draw a spade and the event that we draw a diamond. We cannot draw both a spade and
a diamond at the same time. These events are mutually exclusive, they share no common
outcomes.
Today we will cover some examples of finding probability using permutations, combinations, and the
rules for finding probability of compound events.
Tomorrow I will set up various scenarios (with cards, dice, and a twister spinner) in which you will first
have to determine the theoretical probability, and then perform trials to come up with an experimental
probability.
Example 1: Suppose I roll a regular six-sided die. Find the probability of rolling a number greater
than or equal to 4 or rolling an even number.
This is a compound event, since I am looking for the probability of one event or the other. Are these
events inclusive or mutually exclusive? (inclusive, because the event of even numbers contains “4” and
“6” which is included in the event of greater than or equal to 4).
First I must find the probability of rolling a number greater or equal to four. Going back to my theoretical
probability formula, what is the total number of outcomes? (6) How many outcomes are in the event of
rolling a 4 or greater? (3).
P(rolling a 4 or greater)= 3/6 or ½
We know that the P(rolling an even number) is also 3/6 or ½.
What is the P(rolling a 4 or greater AND rolling an even number)? The total number of outcomes is the
same (6), but how many outcomes are both 4 or greater and even? (2, “4” and “6”).
Based on the rule for Probability of Compound Events that are Inclusive, we add P(A)+P(B) and subtract
off P(A and B). Therefore, the probability of rolling a number greater than equal to four or an even
number is the following:
1/2 +1/2 – 1/3= 2/3 There is a 2/3 chance that you will role a number greater than equal to four or
an even number.
Example 2: A card is randomly selected from a standard deck of 52 cards. What is the probability that
it is a face card or a diamond?
Have students guide you through the solution, here are the general steps:

Let event A be selecting a face card and event B be selecting a diamond. A has 12 outcomes and B has 13
outcomes. Of these, 3 outcomes are common to A and B. So the probability of selecting a face card or a
diamond is:
P(A or B) = P(A) + P(B)- P(A and B) = 12/52 + 13/52- 3/52.
Example 3: Out of the 25 people in this class, suppose 11 students are either involved in band or on
the football team. There are 7 people in this class who are involved in band, and 7 people who are on
the football team. What is the probability that a randomly selected student is both involved in band AND
on the football team?
P(A)= 7/25, P(B) 7/25 and P(A or B)=11/25. Find P(A and B).
Write the general formula: P(A or B) = P(A) + P(B)- P(A and B)
Substitute in the known probabilities: 11/25= 7/25 +7/25 – P(A and B)
Solve for P(A and B). P(A and B)= 14/25-11/25 = 3/25
Run through these additional example problems if there is time (if not, cover them beginning of Day 6):
A card is randomly selected from a standard deck of 52 cards. Find the probability of the given event:
1) Selecting a two or a king. 2.) Selecting an even number or a red face card.
Assessment Day 5: Objective 1: Informal Assessment done by in class observation. Formal Assessment via homework, quiz, and unit test. Homework assignment: pg 710, 3-5 (Disjoint Events), 9-14 (Overlapping Events), 20-22 (Choosing Cards), 26-27 (Error Analysis), 43, 49 (Story Problems)
Response:
Day 6
Learning Activity:
ANSWER ANY QUESTIONS ON HOMEWORK. Grade homework based on homework quiz. Have each
student take out a half sheet of paper and copy their solutions onto the paper for problems #4, 12, 26,
43. Collect homework quizzes.
Review topics from yesterday: Probability of Compound Events-Inclusive and Mutually Exclusive Events
(Overlapping and Disjoint). Review rules.

Transition: Yesterday, we focused on ways to find the probability of a specific event. We did this by
finding how many outcomes of an event are in A, and dividing that by the total number of outcomes.
Sometimes, it is easier to find the number of outcomes that are NOT in A, rather than those that are in
A.
Example 1: A pair of dice is rolled. What is the probability of NOT rolling doubles?
We could potentially try to how many of the 36 possible outcomes are NOT doubles, however, it would
be easier to simply find the number of outcomes that are doubles, and then subtracting off that
probability. This is called finding the complement of an event.
Displayed on smartboard:
Probability of the Complement of an Event
The probability of the complement of A is 1 ( )P A P A
In this case, let A be the event that we roll doubles. We are looking for the probability that we do not
roll doubles ( P A ). Therefore, if we can find the probability that we do roll doubles, we can subtract
that from 1, and find the probability that we do not roll doubles. Does that make sense?
What is the probability that we roll doubles? To break this problem down, what is the probability that
we roll double one’s?
There is a 1/6 probability that we will roll a “1” for the first die, and a 1/6 probability that we will roll a
“1” for the second die. The probability that both would occur is 1/6 x 1/6 or 1/36.
That is the probability that we would roll double one’s, how many possible “double numbers” can we
roll? (there are 6 numbers). We could roll double one’s, OR double two’s, … OR double six’s. In order to
find the probability of rolling any doubles, we need to add up the probabilities of rolling double digits for
1-6, therefore the probability of rolling doubles is (1/36) x 6 or (1/6).
The probability that we will NOT role doubles is 1- (1/6) = 5/6
Set Theory and Complement of an Event
I want to introduce you to a few of the same ideas we have covered yesterday and today
(working with compound events) but using “set” theory. Do you remember how I drew circles
on the board, two that intersected to represent “inclusive events” and two circles that did not
intersection to represent disjoint events? We will be looking set theory to help us understand
the concept of a complement better.

Picture will be on the smartboard. Label left circle as “A” and
right circle as “B”
Top example: This picture is a representation of the probability
of event A OR B occurring. When both circles are completely
shaded (or when we have all the outcomes from A plus all the
outcomes from B) we can this the union of two sets, written as
A B (write “union” and A B next to the picture.)
The second set of circles represents an intersection of sets A
and B. Everything that falls in this category must be both an
outcome of A and an outcome of B at the same time. This is
written as A B (write “intersection” and A B next to the
picture)
The third set of circles is the one I really would like us to
concentrate on. This is suppose to represent the complement
of a set A, and is written as A . However, there is just one thing wrong with this picture. Yes, A
isn’t shaded, but what should be shaded that is not? Look at your textbook on page 715 and
describe to me the difference between the two pictures (Everything in the background should
be shaded).This background area is what we call the universe and it includes ALL possible
outcomes (it’s like the sample space!) If we shaded the whole box, that would mean that we
wanted to include EVERY possible outcome, those that are in A, and B, and outside of those
too! Can anyone tell me why the background should be shaded? (Because we are looking for all
outcomes that are not in A, which include outcomes outside of B as well). (Using smartboard
marker, fill in the rest of the background and write “complement of A” and A )
Example 2:
The numbers 1-50 are put into a hat, what is the probability that the number drawn is not divisible by 3?
The complement of the event “not divisible by three” is the event “divisible by three”. To calculate the
probability of “not divisible by three” we will find the probability of the complement and subtract it off
from 1.
To find the numbers from 1-50 that are divisible by three, take 50 divided by 3 and round down (16). The
probability of drawing a number divisible by three is 16/50. The probability that the probability of the
number drawn is NOT divisible by three is 1-16/50= 34/50.
Example 3:

Here is a tricky one:
Suppose I am forming a whiteboard cleaning committee (yes, I need people to clean my whiteboards, a
lot of people ). Out of all the possible committees I could form (of all different sizes) what is the
probability that my committee has at least three people?
Ok, let’s first try to think of the total number of committees I could form. How I like to think of it as,
there are 2 options for each person: either they are on the committee, or they are not. Therefore the
total number of committees that could be formed is 225 (since there are 25 people, 2 options for each
person). This is my sample space, or total number of outcomes (which is my denominator) Does this
make sense so far?
What is the complement of having at least 3 people? (having 2 or less people). Therefore, I need to find
the probability that the committee I choose has 2 or less people. How many ways can I choose a
committee of 2 people? ( C(25,2)) And 1 person? (C(25,1)) Don’t forget about 0 people! (C(25,0))
Therefore, the probability of having 2 or less people on my committee is as follows:
25 25 25
(25,2) (25,1) (25,0) 3260.0001
2 2 2 33,554,432
C C C
The probability of me forming a committee of at least three people is 1-326/33,554,432= 0.9999
Summary:
In conclusion, we can see that finding the complement of an event can be a powerful tool for finding the
probability of an event.
If there is time:
At this point in time, I would like you to take out a piece of paper and jot down some thoughts in regards
to these questions:
1. Is there any part of this unit that I am having difficulty understanding? (Fundamental Counting
Principle, Combinations, Permutations, Probability of Compound Events, Using the Complement,
etc.)
2. What is my favorite part of the unit? (Activities, concepts, etc.)
3. Is there a topic in this unit that I would like to know more about?
While students are reflecting, write out homework assignment on the board: #2, 16-19, 35-38, and 1-3
on page 716. Remind students that if they have any questions on homework, they are welcome to stop
by before or after school or to email me with their questions.
Have students turn in their reflections as a “Ticket to Leave”
Assessment:

Objectives 1-3: Informal Assessment done by in class observation. Objectives 2-3: Informal Assessment done by in class observation. Formal Assessment via homework, quiz, and unit test. Homework assignment: #2 (conceptual writing), #16-19 (Finding the Complement of A), #35-38 (Some are done regularly, others are easier to do by finding the complement), and #1-3 on page 716 (Operations on Sets).
Response:

Day 7&8 of Counting Methods and Probability
Finding Probabilities of Independent and Dependent Events
Grade Level: 10th-11th
Subject Area: Algebra II
Materials Needed: Pencils, Notebooks, Graphing Calculators, Slideshow on Smartboard for
Conditional Probability (Finding Probability of Dependent and Independent Events), 25 Opinion Surveys,
25 Opinion Survey Instruction sheets
Standards: HS.SCP.4 Construct and interpret two-way frequency tables of data when two categories
are associated with each object being classified. Use the two-way table as a sample space to decide if
events are independent and to approximate conditional probabilities.
For example, collect data from a random sample of students in your school on their favorite subject
among math, science, and English. Estimate the probability that a randomly selected student from your
school will favor science given that the student is in tenth grade. Do the same for other subjects and
compare the results.
HS.SCP.6 Find the conditional probability of A given B as the fraction of B’s outcomes that also belong to
A, and interpret the answer in terms of the model.
HS.SCP.8 (+) Apply the general Multiplication Rule in a uniform probability model, P(A and B) =
P(A)P(B|A) = P(B)P(A|B), and interpret the answer in terms of the model.
Objectives: TLW make two-frequency tables of data as a sample space to decide if events are independent
and to figure out conditional probabilities.
TLW apply the general multiplication rule to solve for any one of the variables given the other three: P(A and B), P(A) or P(B), P(B|A) or P(A|B).
Day 7 Learning Activity:
ANSWER ANY QUESTIONS ON HOMEWORK. Collect the homework.
Definitions: Independent and Dependent Events Independent Events: Two events are independent if the occurrence of one has no effect on the occurrence of the other. The probability of two independent events occurring is the product of their individual probabilities. Display on smartboard:

1,1 2,1 3,1 4,1
1,2 2,2 3,2 4,2
1,3 2,3 3,3 4,3
1,4 2,4 3,4 4,4
1,1 2,1 3,1 4,1
1,2 2,2 3,2 4,2
1,3 2,3 3,3 4,3
1,4 2,4 3,4 4,4
Probability of Independent Events
If A and B are independent events, then the probability that both A and B occur is:
( and ) ( ) ( )P A B P A P B
Dependent Events: Two events A and B are dependent events if the occurrence of one affects the
occurrence of the other. The probability that B will occur given that A has occurred is called the
conditional probability of B given A and is written as P(B|A).
Probability of Dependent Events
If A and B are dependent events, then the probability that both A and B occur is:
( and ) ( ) ( | )P A B P A P B A
Example 1:
How do we know if events are independent or dependent? Sometimes it helps to list all possible
outcomes, and figure out the probability of B (without A) and then figure out the probability of B given
A. Is there a difference? Let’s try out an example:
Suppose I didn’t study for a test (the probability of that happening is pretty small, but we will go with it
). The test is multiple choice, 4 choices for each question, and there are two questions that I’m stuck
on. I want to find the probability that I get both questions right. I will label my two questions A and B,
and my choices as 1,2,3,4 for clarity sake. I’m looking for the P(A and B).
Here are all possible outcomes: (Bring up two tables on smartboard)
Suppose that the
correct answers for
A and B were 1 and
4. What is the
probability that I got
event B right,
without looking at
A?
(Wait for students to answer, then circle the bottom row on left table). These are all the possible
outcomes, not given A, that would include the correct answer to B which is 4. What is the probability of
guessing B right? 4/16 or ¼.
Now let’s take a look at the probability of B, given A. For the second list of outcomes, since we know
that A is 1, our list is narrowed down to four options (rather than 16). Out of those 4, what is the

1,1 2,1 3,1 4,1
1,2 2,2 3,2 4,2
1,3 2,3 3,3 4,3
1,4 2,4 3,4 4,4
1,1 2,1 3,1 4,1
1,2 2,2 3,2 4,2
1,3 2,3 3,3 4,3
1,4 2,4 3,4 4,4
probability of getting B right? 1/4! We can conclude that since the probability for guessing B correctly is
the same, regardless of whether we have been given A, that the events are independent.
Therefore,
P(A and B)= 1/4 X 1/4= 1/16.
Take a look at the list of outcomes. Out of the 16 outcomes, how many of them have both the answer
for A AND B? 1. Therefore the answer of 1/16 makes sense.
Example 2:
That was a good example of working with independent events, now we will try an example of working
with dependent events.
This time, we are working with two spinners that are divided into four sections. Suppose each spinner is
spun once.
Find the probability that the first spinner lands on an odd number and the sum of the spinners is greater
than 4.
Pull up the two tables again. Erase any markings from previous discussion.
We want to confirm that
the events are
dependent. If we are
disregarding event A
(not looking at whether
or not the first spinner
lands on an odd
number) Find all possibilities that are greater than 4.
(Allow students to guide you in circling all values on the left list that are greater than 4). P(B)= 10/16 =
5/8 because out of the 16 possibilities, 10 of them had a sum of greater than four.
Taking A into consideration, (or if event A does occur), what is the probability that event B occurs? (Have
students guide you in first, underlining all values where A is an odd number, and then circling the values
where A is odd and the sum is greater than 4). P(B|A)=1/2 . This is because half of the values where A is
odd, the sum of the two values is greater than 4. Therefore, the probability of B is dependent upon the
probability of A.
And since the events are dependent, we need to use the rule of probability for dependent events:

( and ) ( ) ( | )
(odd and sum > 4) =P(odd) P(sum > 4 | odd)
1 1 1( and )
2 2 4
P A B P A P B A
P
P A B
Look back at the list on the right hand side, is the amount that we circled ¼ of the total list? Yes, so again
our answer makes sense.
Example 3:
Have students guide you through this problem (display problem on screen):
At a mailing center, it was found that on Tuesday, 44 out of 662 envelopes were stamped upside down,
on Wednesday, 16 out of 251 envelopes were stamped upside down, and on Thursday, 3 out of 598
envelopes were stamped upside down. Find the probability that an envelope was stamped on
Wednesday given that it was stamped right side up.
1. The first thing we need to do is to draw out a table to help us understand this problem. I will set up
the categories and will expect you to help me fill out my table.
Draw this Table on whiteboard, have students provide information to fill in the table:
Tues. Wed. Thurs. Totals
Right side Up 618 235 595 1448
Upside Down 44 16 3 63
Totals 662 251 598 1511
2. The second step is to form a plan. What was the condition of the envelope? (That it was stamped
right side up). I need to locate the spot on my chart where I wrote the total number of envelopes that
were stamped right side up. How many were stamped right side up? This will become my denominator.
(1448, draw fraction and write 1448 in denominator on the board).
How many stamped on Wednesday AND were stamped Right-side Up? (235, write this number in as the
numerator).
3. What is the probability that the envelope was stamped on Wednesday given that it was stamped right
side up? 235
0.1621448
4. The last step is to estimate if the answer is reasonable. If we round, there were about 1500 total
envelopes, and of those envelopes, about 250 of them were stamped right side up and on Wednesday.
This is 250/1500 or 1/6 which is approximately 16%.
Conclusion:

As you can see, the rules of conditional probability allow us to find the probability of situations that
more often occur in real life. This is a really important concept for you to grasp, and you will not only
find it on your unit test (which is on Day 10—3 days away!) but it will come up again on other forms of
standardized testing. In addition, the concepts of conditional probability are important as you are
presented statistics out on your own.
I will write your homework assignment on the board and pass out an opinion survey that we will use
tomorrow in class for a conditional probability exercise. Please fill it out and bring it with you tomorrow!
Day 7 Assessment: Objectives 1-2: Informal Assessment done by in class observation. Formal Assessment via homework, quiz, and unit test. Homework: pg 721 #3-5 odd (independent events) 17-21 odd(Dependent events), 26, 27, 31 (Drawing
Cards, with and without replacement) and 38 (using a table to figure out conditional probability).
Opinion survey provided at the end of the lesson.
Response:
Day 8 Learning Activity:
ANSWER ANY QUESTIONS ON HOMEWORK. Collect homework. Remind students that TOMORROW IS
REVIEW DAY AND THE DAY AFTER IS THE TEST!
Ask students to take out their opinion surveys from yesterday. While students are taking out the
surveys, write these categories on the board going across. Students will place slips of paper into these
different piles:
| Pop Choices | Extra-curricular Activities | Pizza! |
Instruct the person at the front of each row to collect the three slips from each person, and then place
them at the front of the room under the appropriate categories.
Once everyone has returned to his or her desk, hand out the instruction sheets for the activity. Call out
the names for the three groups, placing groups in different areas of the classroom. Instruct the groups
to read the directions carefully. Monitor the groups during the activity.
With 10 minutes of class left, instruct everyone to return to their desks.
Ask spokespeople to share their one question and answer from the activity.
Conclusion:
We can learn a lot by taking samples and finding conditional probability. While these questions may not
be of the most importance, you now have a test as to how we could create a survey and figure out
conditional probability for questions that are really important.
I want to encourage you to be ready with any questions you have for me tomorrow during our review
day. I will be providing different activities to help you review, but I will make time to try to answer any
questions.
Your homework tonight is to 1) finish your table, questions and answers if you haven’t already, and 2)
look over the major ideas covered in this unit and to identify any areas that you will want to review
tomorrow.
Day 8 Assessment:
Objectives 1-2: Informal Assessment done by in class observation. Formal Assessment via tables, questions and answers from today’s activity.

OPINION SURVEY
Please fill out this survey for an in-class activity during tomorrow’s class period. Please cut along
the dotted lines. ONLY SELECT ONE OPTION FOR EACH OF THE QUESTIONS
1. Gender:
______ Male ________Female
2. Which pop do you prefer:
_______ Coke _______ Pepsi ________ Other
1. Gender:
______ Male ________Female
2. What extra-curricular activities are you MOST involved in:
______Sports _______Music ________ Neither
1. Gender:
______ Male ________Female
4. What type of pizza do you prefer out of the following options:
_______ Cheese _______Pepperoni ______ Hawaiian _______Sausage

Opinion Survey Activity
Instruction Sheet
1. Individually, create a frequency table with the rows on the left hand side indicating male
or female, and the columns indicating preferences as given by the category. Be sure to
include a total row and column like we did yesterday in class! For example, see page 719
in your textbook.
2. Work as a group to fill out the table using the slips of paper provided.
3. As a group, create three questions regarding conditional probability using the categories
from your table: Ex: What is the probability of liking cheese pizza if you are a girl? What
is the probability of preferring Pepsi if you are a boy? Etc.
Record your questions with your table!
4. As a group, find the answers to the conditional probability questions you created? Is
there anything surprising in the results?
5. Pick a spokesperson to share one question you created and its answer during group
discussion.
6. Hand in the piece of paper that contains your individual table, questions, answers, and
comments. WRITE YOUR NAME ON THE PAPER!
Day 9 of Counting Methods and Probability
Review Day for Test
Grade Level: 10th-11th
Subject Area: Algebra II
Materials Needed:
Definition, concept and formula flashcards (4 sets)
Worksheets with example problems for: permutations & combinations, probability of compound
events, and conditional probability (12 of each)
Concept prompt cards (3 sets)
Large Paper roll (often used to make posters? I don’t know how else to describe it), and marker
bin for students to make graphic organizers of the material.
Standards: Each of these standards has been covered in detail throughout Unit 10: Counting
Methods and Probability. These are the standards that will be assessed on tomorrow’s test, and thus,
need to be reviewed.
REVIEW: 7.SP.8 Find probabilities of compound events using organized lists, tables, tree diagrams, and
simulation b. Represent sample spaces for compound events using methods such a organized lists,
tables and tree diagrams. For an event described in everyday language (e.g., “rolling double sixes”),
identify the outcomes in the sample space which compose the event.
HS.SCP. 9 (+) Use permutations and combinations to compute probabilities of compound events and solve problems. HS.AAPR. 5 (+) Know and apply the Binomial Theorem gives the expansion of (x + y)n in powers of x and y for a positive integer n, where x and y are any numbers, with coefficients determined for example by Pascal’s Triangle. HS.SCP. 1 Describe events as subsets of a sample space (the set of outcomes) using characteristics (or categories) of the outcomes, or as unions, intersections, or complements of other events (“or,” “and,” “not”). HS.SCP.7 Apply the Addition Rule, P(A or B) = P(A) + P(B) – P(A and B), and interpret the answer in terms of the model. HS.SCP.6 Find the conditional probability of A given B as the fraction of B’s outcomes that also belong to
A, and interpret the answer in terms of the model.
HS.SCP.8 (+) Apply the general Multiplication Rule in a uniform probability model, P(A and B) =
P(A)P(B|A) = P(B)P(A|B), and interpret the answer in terms of the model.

Objectives: TLW use the review day to properly review all standards in preparation for the test. The
students will pick the modality that best serves him or her.
Learning Activity: I will set up review stations with different activities. I will spend the period monitoring these activities,
answering questions and providing discipline as needed. Students are allowed to change stations as
they desire (as long as they are being productive!) Here is a description of the different review stations:
1.) Definition, Concept, and Formula flashcards- at this station, students will work alone or in
groups on quick, short-answer ideas, such as the formula for C(n,r) or P(n,r), the definition of
independent events, the General Multiplication Rule (used in Conditional probability) etc. This
can be great for verbal learners or those who prefer to study by memorization.
Downside: students may not cover areas in much depth.
2.) Worksheets: These worksheets will provide story problems for all major sections of the unit:
combinations, permutations, binomial theorem, probability of compound events and
conditional probability. This is good for kinesthetic learners who want the hands-on process of
going through problems, or for those who want to concentrate on a specific trouble area.
Downside: students may not cover all areas.
3.) Concept Prompt cards: Here, students are asked to discuss or write about how to go about
solving problems from major concept areas covered (Again: combinations, permutations,
binomial theorem, probability of compound events and conditional probability). Example
questions may be: “When do you need the formula for a permutation instead of a
combination?” “Explain in your own words when events are mutually exclusive. How do you find
the probability of event that are inclusive (or overlapping)?” This may be helpful for students
who like to think of overarching concepts to connect specific facts, or who like to study by
discussing or writing about ideas.
Downside: students may not cover all topics.
4.) Graphic Organizers: In this activity, students will be allowed to create their own graphic
organizers of the concepts in the unit. Students can write definitions, examples, major ideas,
and connect them in whatever ways they find helpful. Students will be provided this list of major
topics to cover in their graphic organizer:
1. Fundamental Counting Principle
2. Permutations and Combinations
3. Probability of Compound Events (Inclusive and Exclusive)
4. Probability of Independent and Dependent Events
5. Binomial Theorem
This activity will be helpful for visual-spatial learners who prefer to see the ideas mapped out
and connected in a way that makes sense to them.
Assessment: TEST TOMORROW!!!

Response:

Unit 10 Test: Probability and Counting Methods
1. Make a tree diagram that shows the number of different meals that can be created, then use the
Fundamental Counting Principle to illustrate how many ways all events can occur.
Entrée: Chicken, fish, pasta
Side: corn, green beans, potato
2. Explain in your own words the difference between a combination and a permutation. You may use
examples in your explanation.
Name:_________________
Subject:_________________
Date:___________________

3. At a video store, how many ways can 4 copies of an animal video, 5 copies of an exercise video, and 3
copies of a western be arranged on a shelf? Please show all of your work.
4. How many different 4-card hands are possible if you draw 4 cards from a standard deck of 52 cards? Is
this a permutation or combination? Explain your reasoning and use the formula to show your work. You
may check your work with a calculator.
5. How many different outcomes for a race are there if 25 people enter the race and we only record
who takes 1st, 2nd, and 3rd ? Is this a combination or permutation problem? Explain your reasoning and
use the formula to show your work. You may check your work with a calculator.

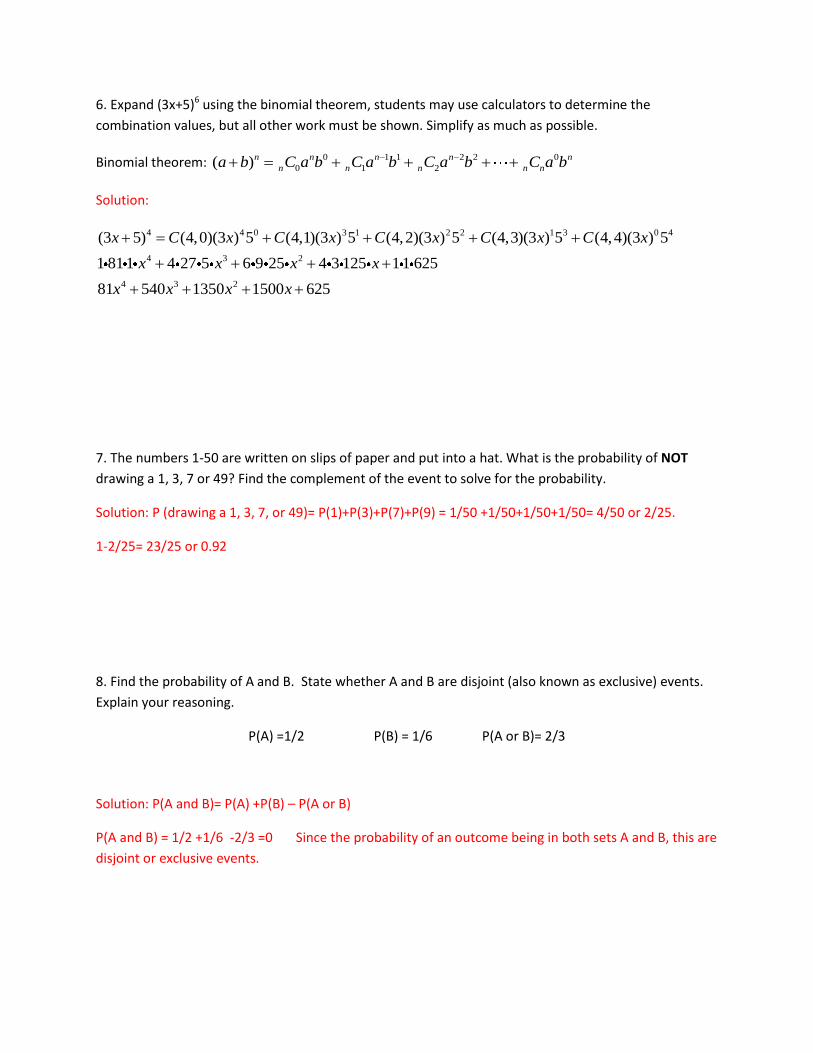
6. Expand (3x+5)6 using the binomial theorem, students may use calculators to determine the
combination values, but all other work must be shown. Simplify as much as possible.
Binomial theorem: 0 1 1 2 2 0
0 1 2( )n n n n n
n n n n na b C a b C a b C a b C a b
7. The numbers 1-50 are written on slips of paper and put into a hat. What is the probability of NOT
drawing a 1, 3, 7 or 49? Find the complement of the event to solve for the probability.
8. Find the probability of A and B. State whether A and B are disjoint (also known as exclusive) events.
Explain your reasoning.
P(A) =1/2 P(B) = 1/6 P(A or B)= 2/3

9. You randomly select two cards from a standard deck of 52 cards. What is the probability that the first
card is not a diamond and the second card is a diamond if you do not put the first card back into the pile
before selecting the second card? Show all your work.
Bonus Problem (+3)
Suppose a toy store has 7 different teddy bears and 4 different baby dolls. In how many ways can 3
teddy bears and 2 dolls be arranged on a display shelf?

Unit 10 Test: Probability and Counting Methods
KEY
1. Make a tree diagram that shows the number of different meals that can be created, then use the
Fundamental Counting Principle to illustrate how many ways all events can occur.
Entrée: Chicken, fish, pasta
Side: corn, green beans, potato
Fundamental Counting Principle: 3 options for entrée x 3 options for side = 9 different meal possibilities.
2. Explain in your own words the difference between a combination and a permutation. You may use
examples in your explanation.
Something along the lines of this: A permutation is a listing or an arrangement. In permutations, order
does matter A combination is a grouping of objects. In combinations, order does not matter.
Meals
chicken
corn
green beans
potato
Fish
Corn
Green beans
potato
Pasta
corn
green beans
potato
Name:_________________
Subject:_________________
Date:___________________

3. At a video store, how many ways can 4 copies of an animal video, 5 copies of an exercise video, and 3
copies of a western be arranged on a shelf? Please show all of your work.
Solution: This is a permutation with repetition problem.12!/ 4!5!3!=27720 ways
4. How many different 4-card hands are possible if you draw 4 cards from a standard deck of 52 cards? Is
this a permutation or combination? Explain your reasoning and use the formula to show your work. You
may check your work with a calculator.
Solution: 52!
(52,4) 270,7254!(52 4)!
C
This is a combination problem.
5. How many different outcomes for a race are there if 25 people enter the race and we only record
who takes 1st, 2nd, and 3rd ? Is this a combination or permutation problem? Explain your reasoning and
use the formula to show your work. You may check your work with a calculator.
Solution: 25!
(25,3) 13800 outcomes(25 3)!
P
This is a permutation problem.
6. Expand (3x+5)6 using the binomial theorem, students may use calculators to determine the
combination values, but all other work must be shown. Simplify as much as possible.
Binomial theorem: 0 1 1 2 2 0
0 1 2( )n n n n n
n n n n na b C a b C a b C a b C a b
Solution:
4 4 0 3 1 2 2 1 3 0 4
4 3 2
4 3 2
(3 5) (4,0)(3 ) 5 (4,1)(3 ) 5 (4,2)(3 ) 5 (4,3)(3 ) 5 (4,4)(3 ) 5
1 81 1 4 27 5 6 9 25 4 3 125 1 1 625
81 540 1350 1500 625
x C x C x C x C x C x
x x x x
x x x x
7. The numbers 1-50 are written on slips of paper and put into a hat. What is the probability of NOT
drawing a 1, 3, 7 or 49? Find the complement of the event to solve for the probability.
Solution: P (drawing a 1, 3, 7, or 49)= P(1)+P(3)+P(7)+P(9) = 1/50 +1/50+1/50+1/50= 4/50 or 2/25.
1-2/25= 23/25 or 0.92
8. Find the probability of A and B. State whether A and B are disjoint (also known as exclusive) events.
Explain your reasoning.
P(A) =1/2 P(B) = 1/6 P(A or B)= 2/3
Solution: P(A and B)= P(A) +P(B) – P(A or B)
P(A and B) = 1/2 +1/6 -2/3 =0 Since the probability of an outcome being in both sets A and B, this are
disjoint or exclusive events.

9. You randomly select two cards from a standard deck of 52 cards. What is the probability that the first
card is not a diamond and the second card is a diamond if you do not put the first card back into the pile
before selecting the second card? Show all your work.
Solution: P(A and B)= P(A) x P(B|A)
39 13 13 0.191
52 51 68
Bonus Problem (+3)
Suppose a toy store has 7 different teddy bears and 4 different baby dolls. In how many ways can 3
teddy bears and 2 dolls be arranged on a display shelf?
Solution:
1. Find combinations for teddy bears. C(7,3)= 35. (1/2 pt)
2. Find the combinations for the baby dolls C(4,2)= 6.(1/2 pt)
3. Multiply to find the number of combinations of the 5 toys. (1/2 pt)
4. Find the number of permutations of 5 toys taken 5 at a time P(5,5)= 120 (1/2 pt)
5. There are 120 permutations for each combination. Multiply. 120 x 210 = 25,200 (1 pt)