
David Colby Executive Vice President & Chief Financial...
45
David Colby Executive Vice President & Chief Financial Officer May 5, 2005
Transcript of David Colby Executive Vice President & Chief Financial...
David ColbyExecutive Vice President & Chief Financial Officer
May 5, 2005

2
Safe Harbor Statement
The statements made during this presentation that are not historical facts are forward-looking statements within the meaning for the Federal securities laws, and may involve a number of risks and uncertainties.
Factors that could cause actual results to differ materially from expectations include, but are not limited to, the risks discussed in the Company’s most recent filings with the SEC, including its Annual Report on Form 10-K for the year ended December 31, 2004.

3
Agenda
WellPoint Profile
WellPoint Growth Model: Executing with Strength
Investment Considerations
4
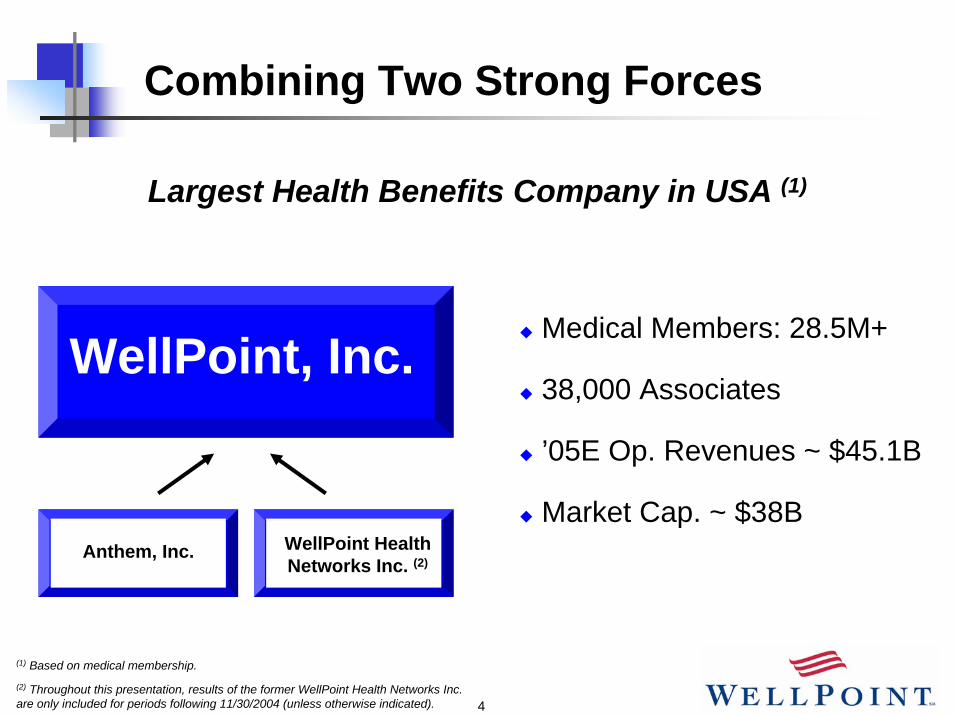
Combining Two Strong Forces
Largest Health Benefits Company in USA (1)
Medical Members: 28.5M+
38,000 Associates
’05E Op. Revenues ~ $45.1B
Market Cap. ~ $38BAnthem, Inc.
WellPoint, Inc.
WellPoint Health Networks Inc. (2)
(1) Based on medical membership.
(2) Throughout this presentation, results of the former WellPoint Health Networks Inc. are only included for periods following 11/30/2004 (unless otherwise indicated).

5
Leading Market Positions
NH
CT
ME
MA
VAKY
OHINIL
WI
MO
TX
COCA
NV
GA
BC or BCBS licensed plansUniCare and HealthLink >100K members
6
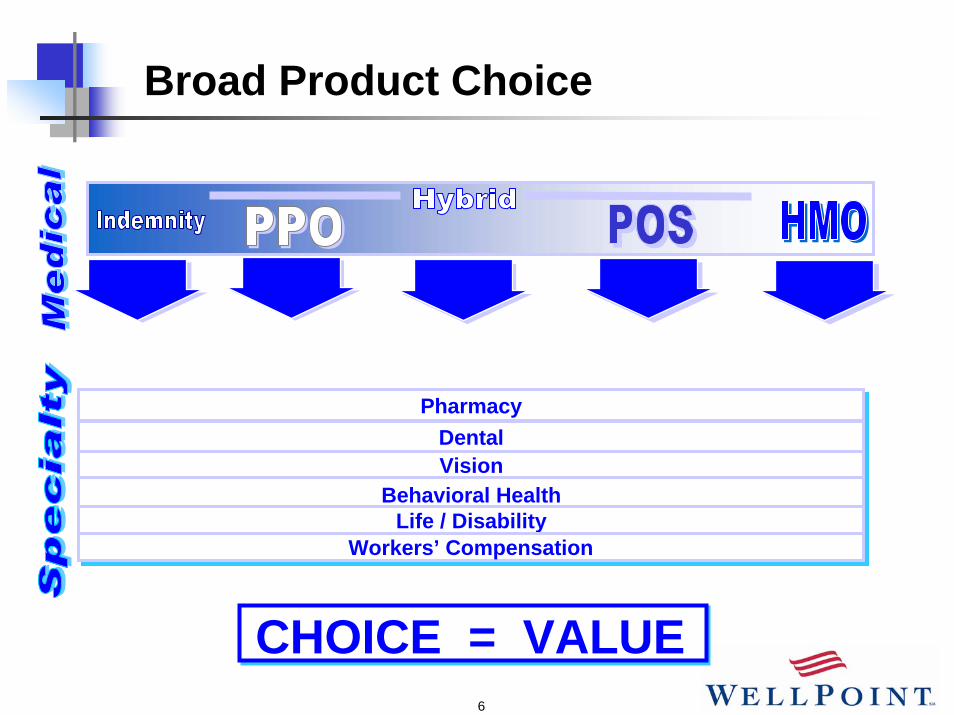
Broad Product Choice
CHOICE = VALUE
PharmacyPharmacyDentalDentalVisionVision
Behavioral HealthBehavioral HealthLife / DisabilityLife / Disability
Workers’ CompensationWorkers’ Compensation
7
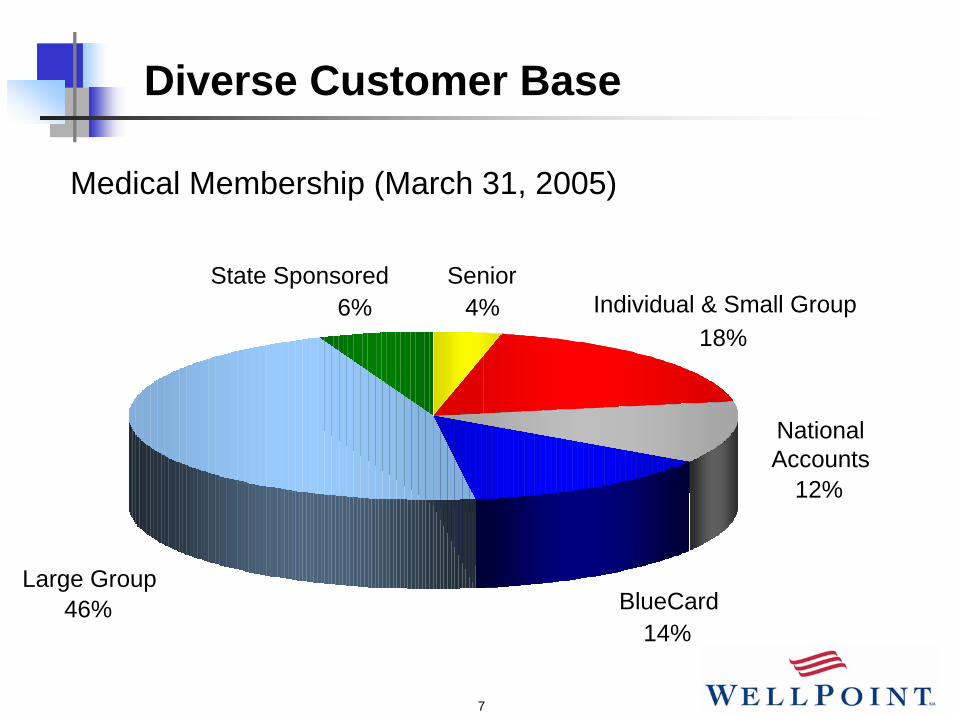
Diverse Customer Base
Medical Membership (March 31, 2005)
Large Group
Individual & Small Group
National Accounts
Senior4%
46%
12%
18%
State Sponsored6%
BlueCard14%

8
Senior Leadership
President and CEOLarry Glasscock
Chairman of the BoardLeonard Schaeffer
Chief Financial Officer - David Colby
General Counsel & Chief Public Affairs Officer - Angela Braly
Chief Medical Officer - Sam Nussbaum
Chief Actuary - Alice Rosenblatt
Chief Information Officer - Ron Ponder
Chief Strategy Officer - Mark Boxer
Chief Compliance Officer – Randall Lewis
9
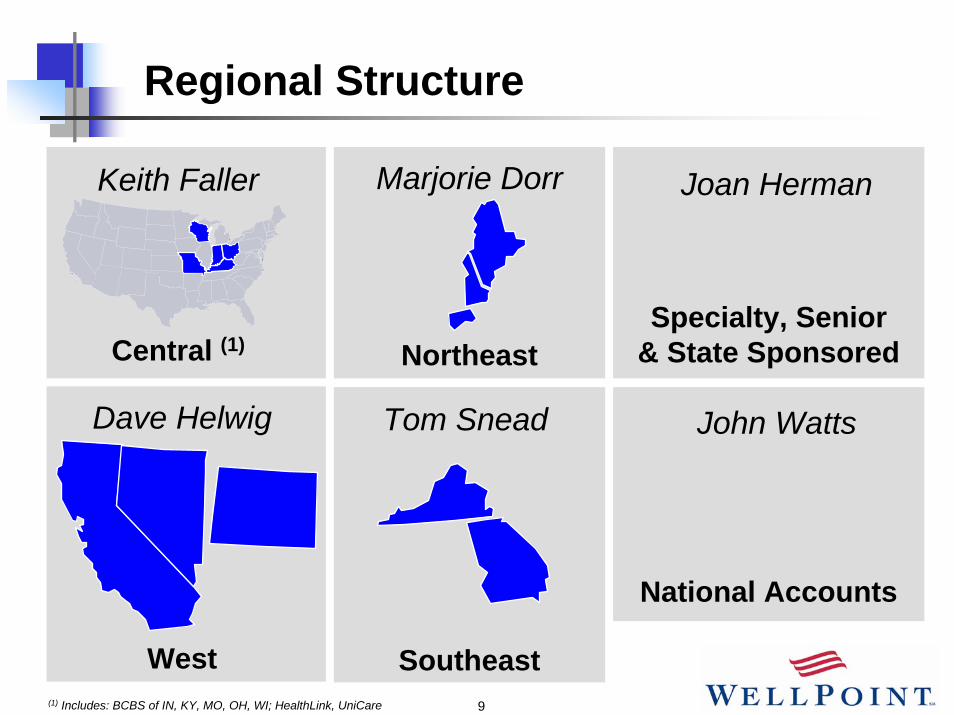
Regional Structure
Marjorie Dorr
Northeast
Joan Herman
Specialty, Senior & State Sponsored
Keith Faller
Central (1)
NV
Dave Helwig
West
John Watts
National Accounts
Tom Snead
Southeast(1) Includes: BCBS of IN, KY, MO, OH, WI; HealthLink, UniCare
10
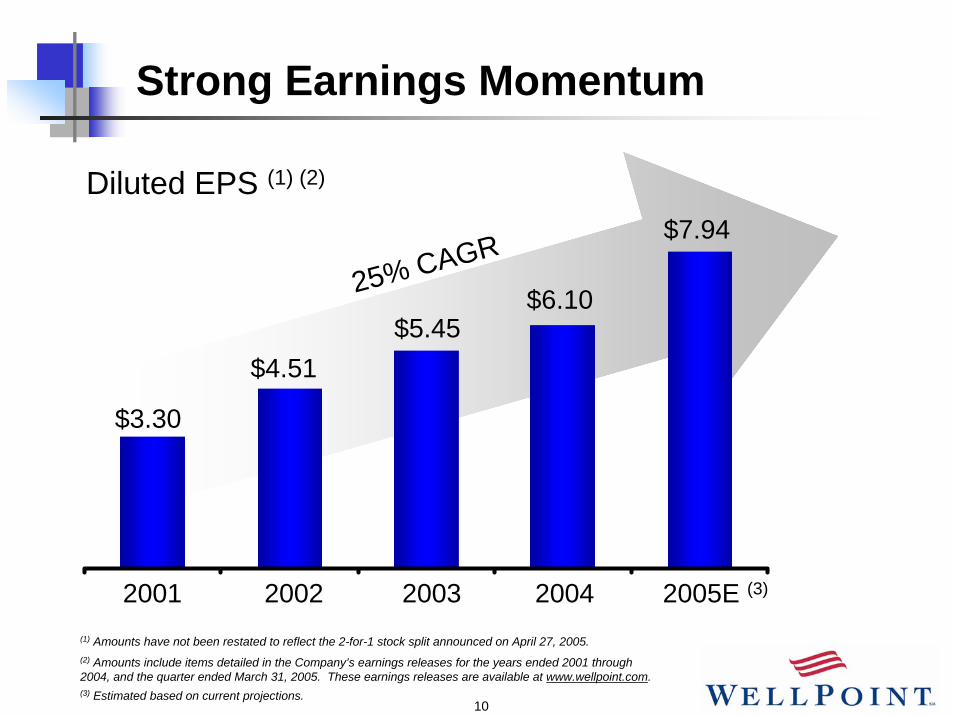
Strong Earnings Momentum
Diluted EPS (1) (2)
$6.1025% CAGR$7.94
$5.45$4.51
$3.30
2001 2002 2003 2004 2005E (3)
(2) Amounts include items detailed in the Company’s earnings releases for the years ended 2001 through 2004, and the quarter ended March 31, 2005. These earnings releases are available at www.wellpoint.com.
(1) Amounts have not been restated to reflect the 2-for-1 stock split announced on April 27, 2005.
(3) Estimated based on current projections.

11
Agenda
WellPoint Profile
WellPoint Growth Model: Executing with Strength
Investment Considerations

12
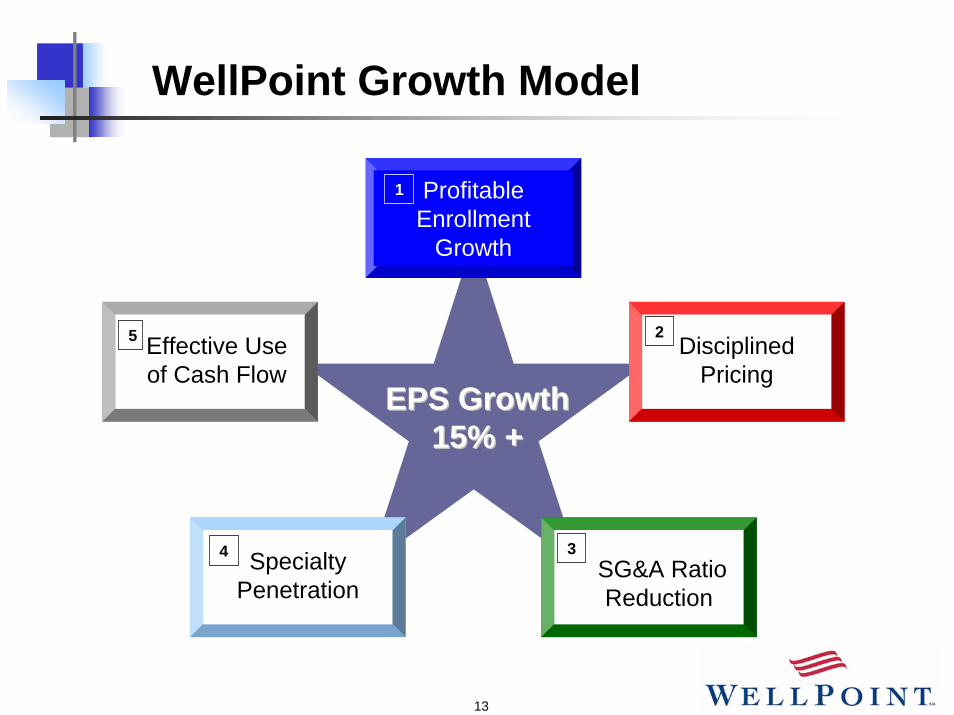
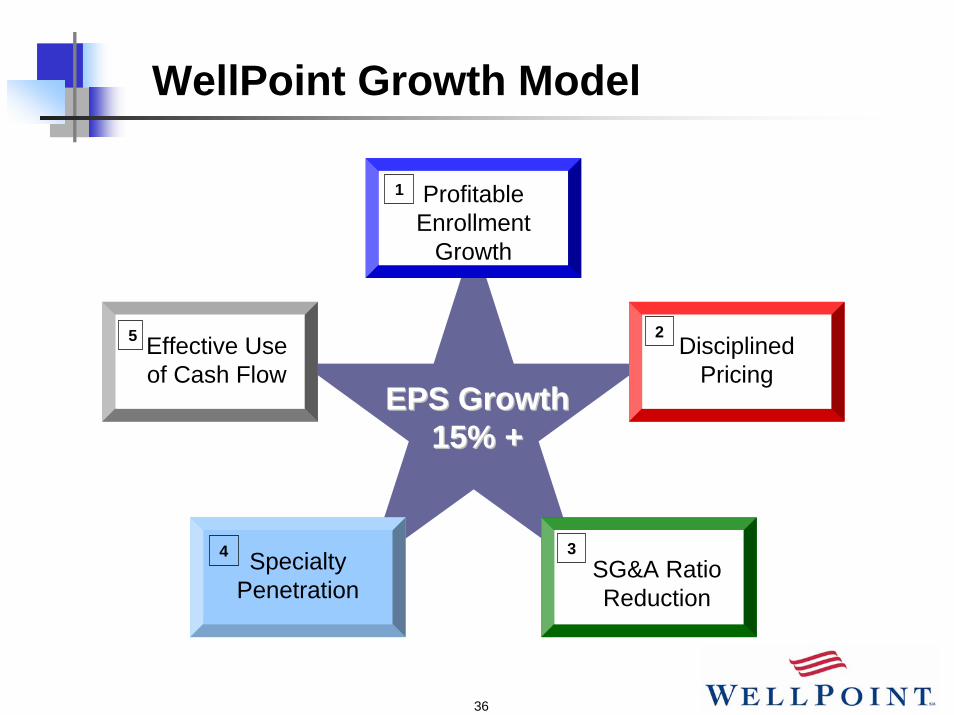
WellPoint Growth Model
EPS GrowthEPS Growth15% +15% +
Profitable Enrollment
Growth
DisciplinedPricing
SG&A RatioReduction
Effective Useof Cash Flow
Specialty Penetration
5
4 3
2
1
13
WellPoint Growth Model
EPS GrowthEPS Growth15% +15% +
Profitable Enrollment
Growth
DisciplinedPricing
SG&A RatioReduction
Effective Useof Cash Flow
Specialty Penetration
1
2
34
5

14
Profitable Enrollment Growth
1999 2000 2001 2002 2003 2004
Medical Membership (in millions)
6.3
11.17.97.3
27.7
11.9
“Same-store” membership Acquisition-related membership
10% “Same-Store” CAGR 28.7+
2005E (1)
(1) Estimated based on current projections. Refer to the Company’s earnings release for the quarter ended March 31, 2005, at www.wellpoint.com.
15
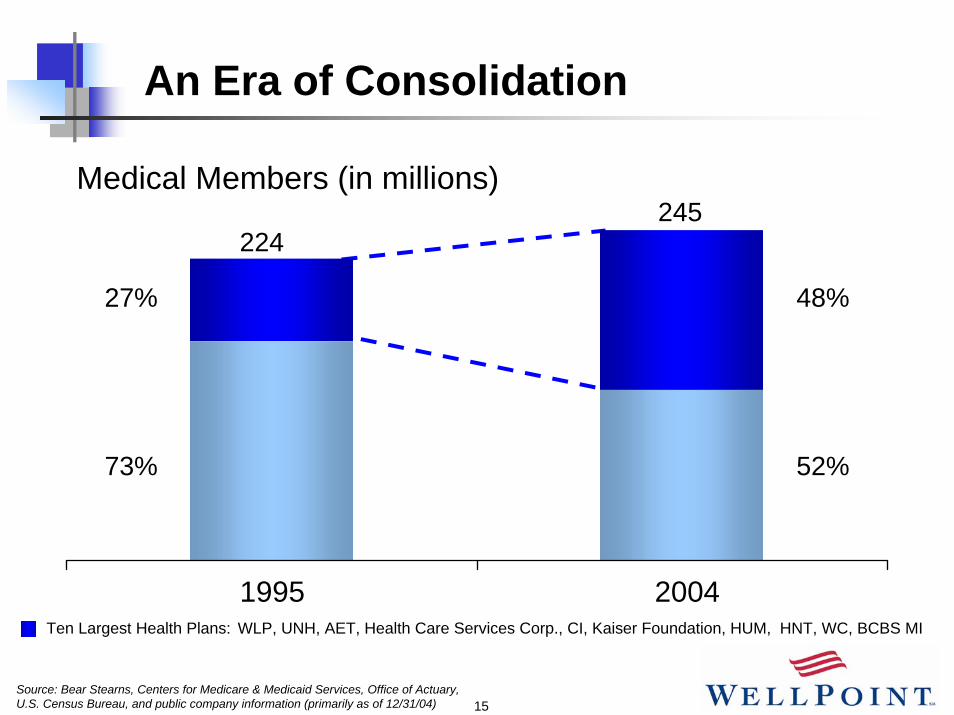
An Era of Consolidation
Medical Members (in millions)
1995 2004
27%
73%
48%
52%
224 245
Ten Largest Health Plans: WLP, UNH, AET, Health Care Services Corp., CI, Kaiser Foundation, HUM, HNT, WC, BCBS MI
Source: Bear Stearns, Centers for Medicare & Medicaid Services, Office of Actuary, U.S. Census Bureau, and public company information (primarily as of 12/31/04)
16
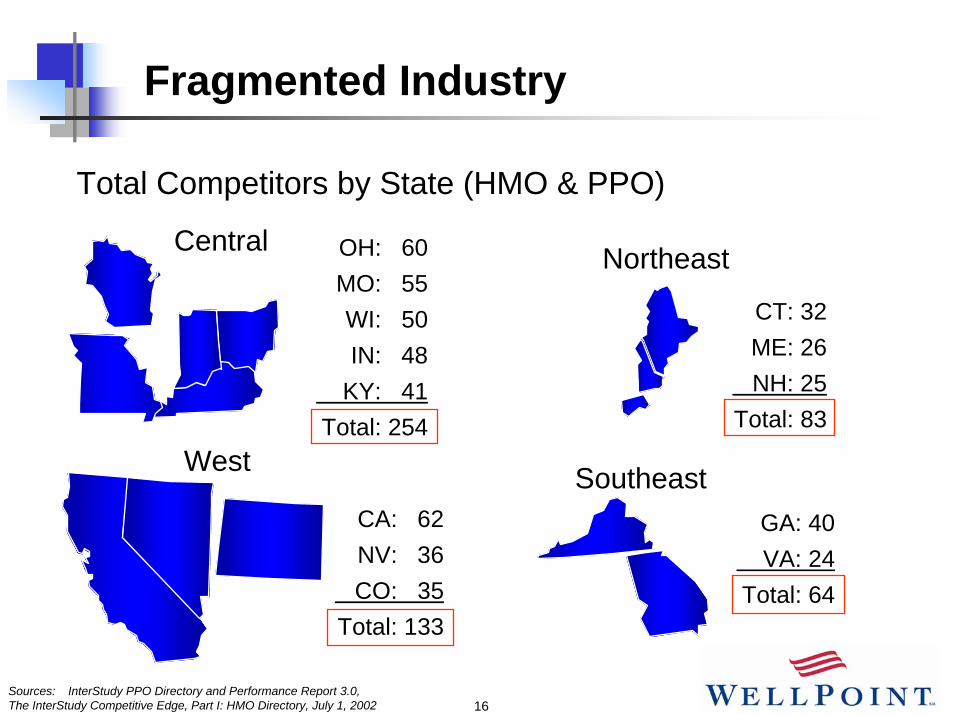
Fragmented Industry
Total Competitors by State (HMO & PPO)
Northeast
CT: 32ME: 26NH: 25
Total: 83
SoutheastGA: 40VA: 24
Total: 64
NV
West
CA: 62NV: 36CO: 35
Total: 133
Central OH: 60MO: 55WI: 50IN: 48
KY: 41Total: 254
Sources: InterStudy PPO Directory and Performance Report 3.0,The InterStudy Competitive Edge, Part I: HMO Directory, July 1, 2002

17
The Power of the Blues
Largest Provider Network
AttractiveDiscounts
Distinctive Customer Service
18
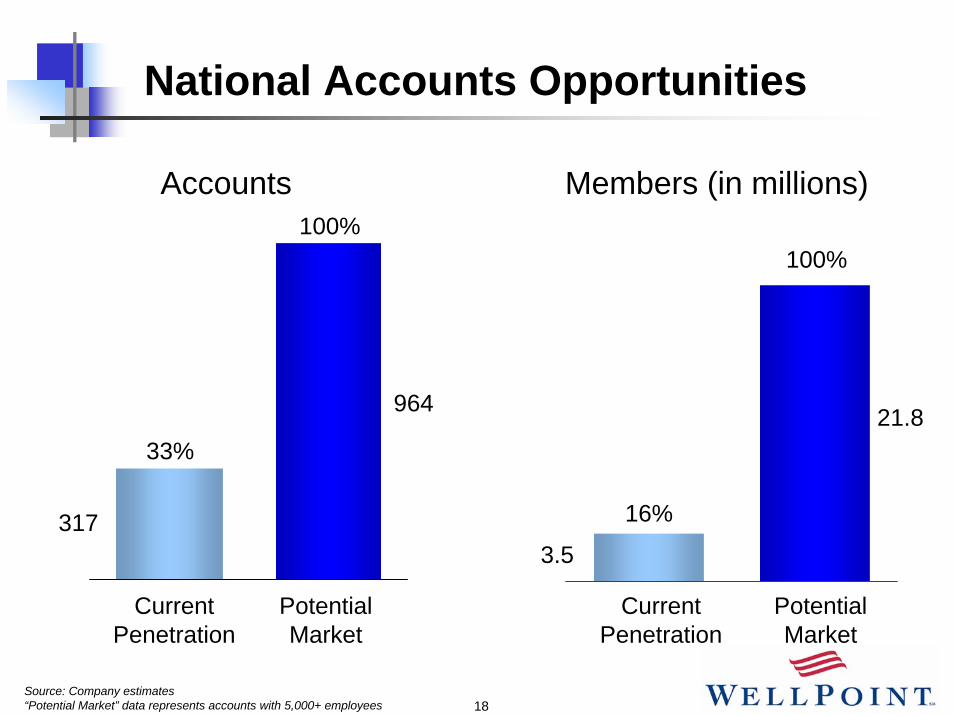
National Accounts Opportunities
Members (in millions)
21.8
3.5
CurrentPenetration
PotentialMarket
100%
16%
Accounts
317
964
CurrentPenetration
PotentialMarket
100%
33%
Source: Company estimates“Potential Market” data represents accounts with 5,000+ employees
19
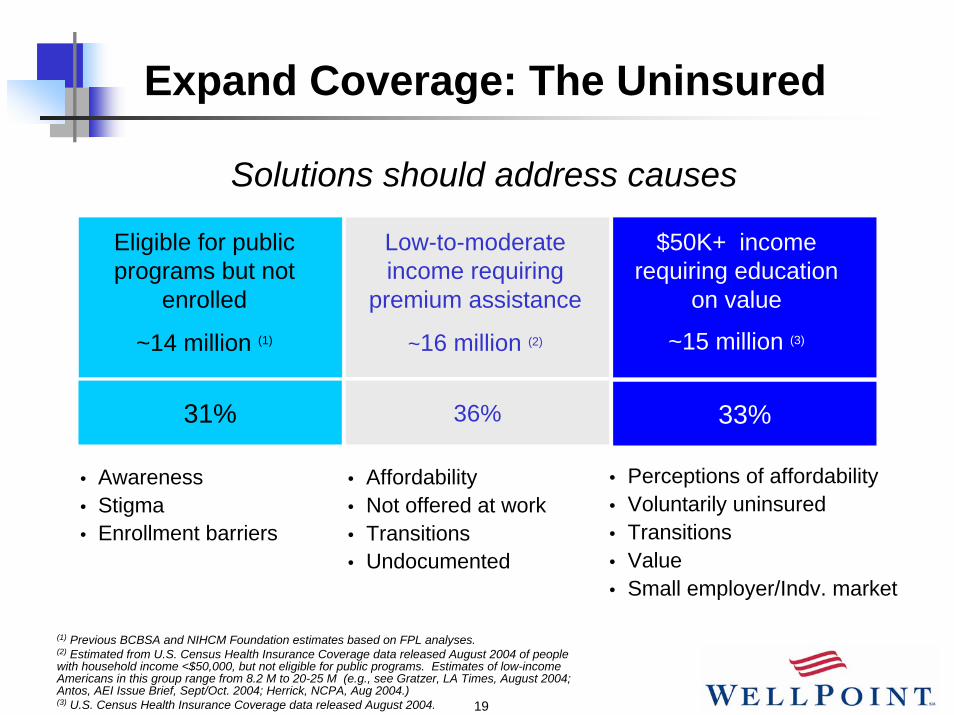
Expand Coverage: The Uninsured
Solutions should address causes
Low-to-moderate income requiring
premium assistance
~16 million (2)
Eligible for public programs but not
enrolled
~14 million (1)
36%
$50K+ income requiring education
on value
~15 million (3)
31% 33%
• Awareness• Stigma• Enrollment barriers
• Affordability • Not offered at work• Transitions• Undocumented
• Perceptions of affordability• Voluntarily uninsured• Transitions • Value • Small employer/Indv. market
(1) Previous BCBSA and NIHCM Foundation estimates based on FPL analyses.(2) Estimated from U.S. Census Health Insurance Coverage data released August 2004 of people with household income <$50,000, but not eligible for public programs. Estimates of low-income Americans in this group range from 8.2 M to 20-25 M (e.g., see Gratzer, LA Times, August 2004; Antos, AEI Issue Brief, Sept/Oct. 2004; Herrick, NCPA, Aug 2004.)(3) U.S. Census Health Insurance Coverage data released August 2004.
20
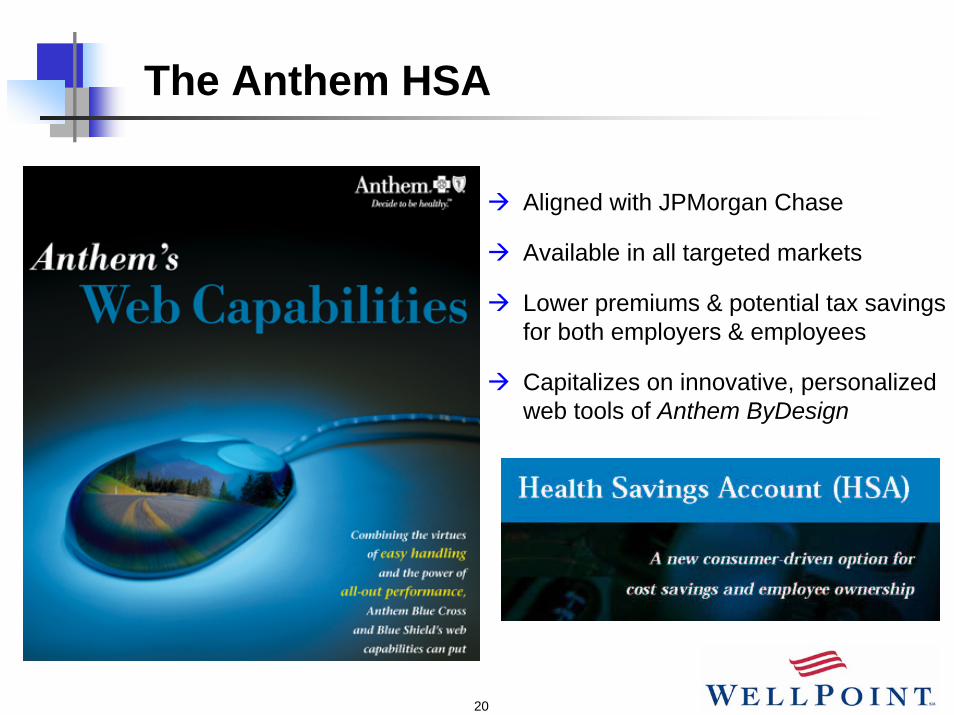
The Anthem HSA
Aligned with JPMorgan Chase
Available in all targeted markets
Lower premiums & potential tax savings for both employers & employees
Capitalizes on innovative, personalized web tools of Anthem ByDesign

21
Tonik Products for Individuals
Developed by and for the “Young Invincibles”
Educates audience
Offers low price points
Unique package of benefits

22
WellPoint Growth Model
EPS GrowthEPS Growth15% +15% +
Profitable Enrollment
Growth
DisciplinedPricing
SG&A Ratio Reduction
Effective Useof Cash Flow
Specialty Penetration
1
2
34
5
23
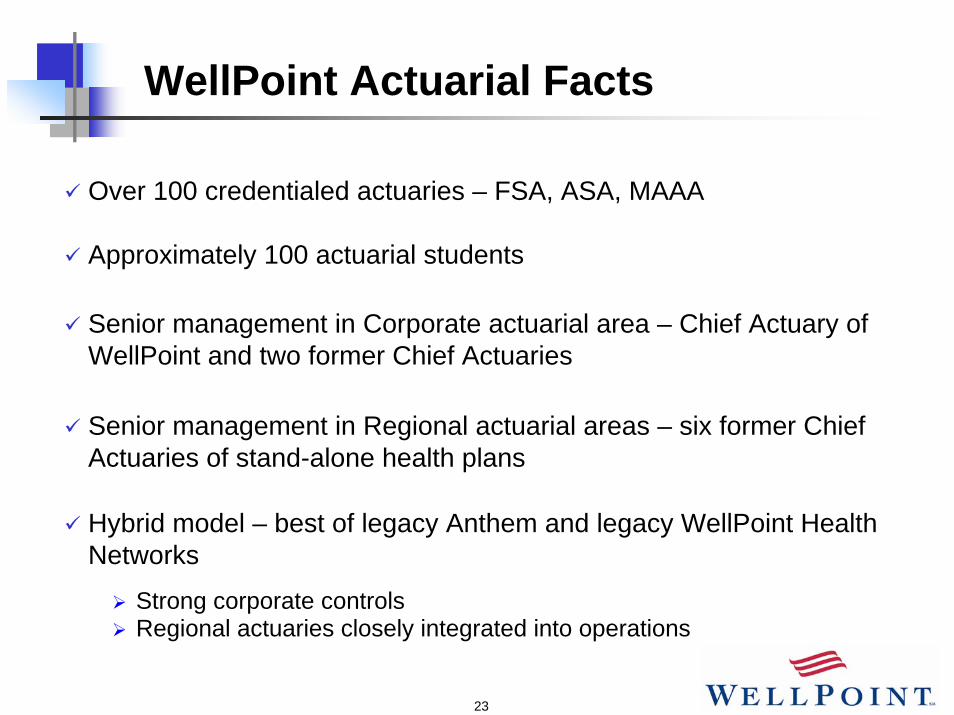
WellPoint Actuarial Facts
Over 100 credentialed actuaries – FSA, ASA, MAAA
Approximately 100 actuarial students
Senior management in Corporate actuarial area – Chief Actuary of WellPoint and two former Chief Actuaries
Senior management in Regional actuarial areas – six former Chief Actuaries of stand-alone health plans
Hybrid model – best of legacy Anthem and legacy WellPoint Health Networks
Strong corporate controlsRegional actuaries closely integrated into operations
24
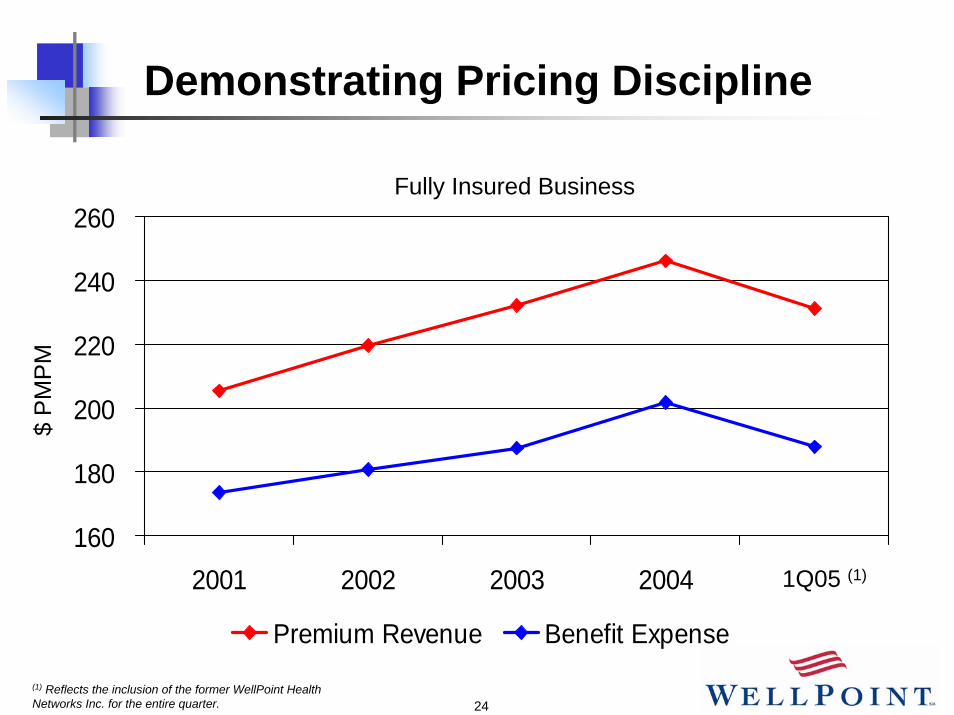
Demonstrating Pricing Discipline
160
180
200
220
240
260
2001 2002 2003 2004
Premium Revenue Benefit Expense
$ P
MP
M
Fully Insured Business
1Q05 (1)
(1) Reflects the inclusion of the former WellPoint Health Networks Inc. for the entire quarter.

25
Pricing Flexibility
0%
10%
20%
30%
40%
50%
Q1 Q2 Q3 Q4 Flexible *
33%
8%
17%13%
29%
* “Flexible” renewals include individual and small group products in certain states where rates can generally be changed with 30-60 days notice.
Note: Patterns calculated as of November 2004

26
Regional Concentration
Health care is locally delivered and locally consumedBetter network leverageGreater actuarial precisionMore efficient marketing and operations
UniCare regions (also include IN, MD, OH and VA)
BC or BCBS licensed plans
HealthLink states (also include IL, VA, MO and TX)

27
Predictive Models: A Framework for Success
Demographics
Patient Reported Information
Claims DataData Warehouse
Targeted MedicalManagement Actuarial Precision
Trend Analysis
More Accurate Cost Prediction & Profitability
ModelRegression
Rules-based
Artificial Intelligence
Neural Networks
Combinations
Clinical Intervention
Quality Improvement & Financial Impact

28
Health Care Management Strategies
Increasing Health RiskCosts: 13% 24% 63%
Low RiskMembers
Moderate Risk Members
Members: 69% 24% 7%
Well Members
High RiskMembers
Complex & Intensive Care
Prevention and Early Identification – Risk AvoidanceCase Management
Integrated Advanced Care Models
Disease Management
Shared Decision Making (Web Support, Healthcare Advisor)
Pay for Performance
Centers of Excellence
IRIS Program
29
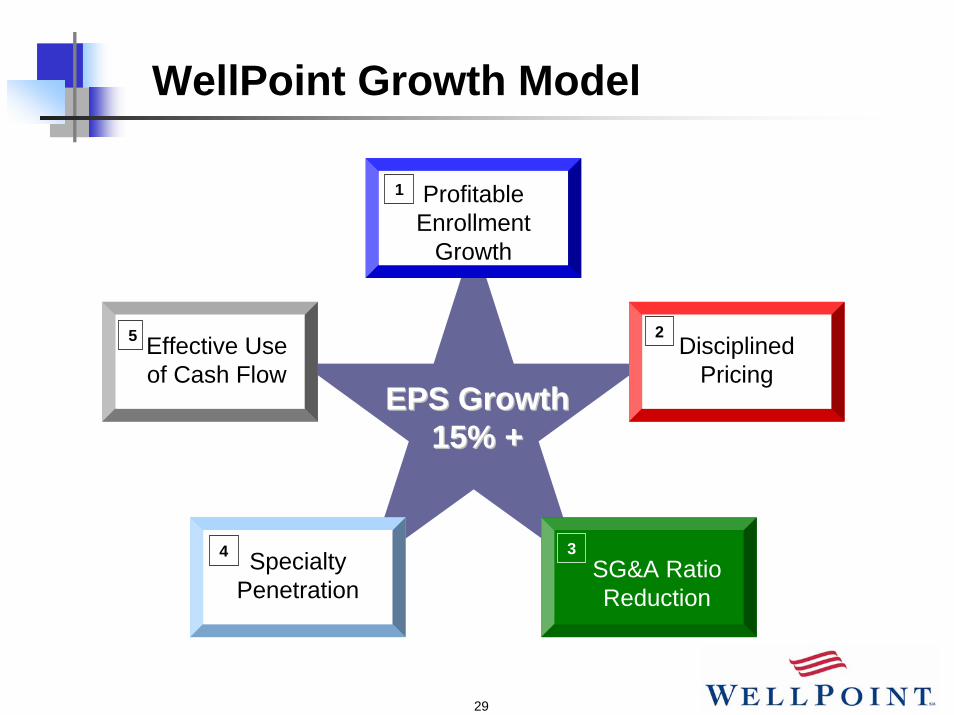
WellPoint Growth Model
EPS GrowthEPS Growth15% +15% +
Profitable Enrollment
Growth
DisciplinedPricing
SG&A Ratio Reduction
Effective Useof Cash Flow
Specialty Penetration
1
2
34
5
30
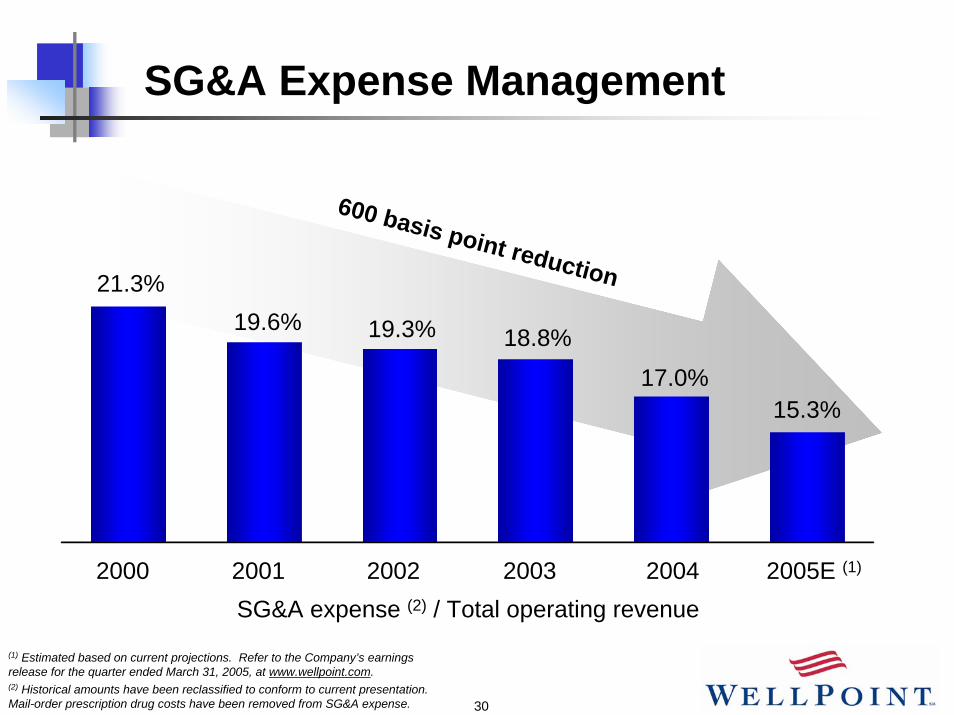
SG&A Expense Management
21.3%19.6% 19.3% 18.8%
17.0%
600 basis point reduction
2002 2003 200420012000
15.3%
2005E (1)
SG&A expense (2) / Total operating revenue
(1) Estimated based on current projections. Refer to the Company’s earnings release for the quarter ended March 31, 2005, at www.wellpoint.com.(2) Historical amounts have been reclassified to conform to current presentation. Mail-order prescription drug costs have been removed from SG&A expense.

31
Physician Quality & Technology Initiative
Move from basic administrative services to transactions that support quality care
GOAL:
BasicConnectivity
ClaimsProcesses
MedicalManagement
Clinical Support
EligibilityMember BenefitsClaim StatusReferralsClaim SubmissionRe-CredentialingProvider Directory Provider Change
Preprocessing Claims Remittance Allowance Inquiry Claims CorrectionPlan AR Aging
E-prescribingOutcomes ResearchPatient RecruitmentDisease RegistriesElectronic Med RecordVirtual Visits
ER Notifications Formulary Management Alerts and Reminders Auto-AdjudicationPre-Certification Dz Mgmt Integration
32
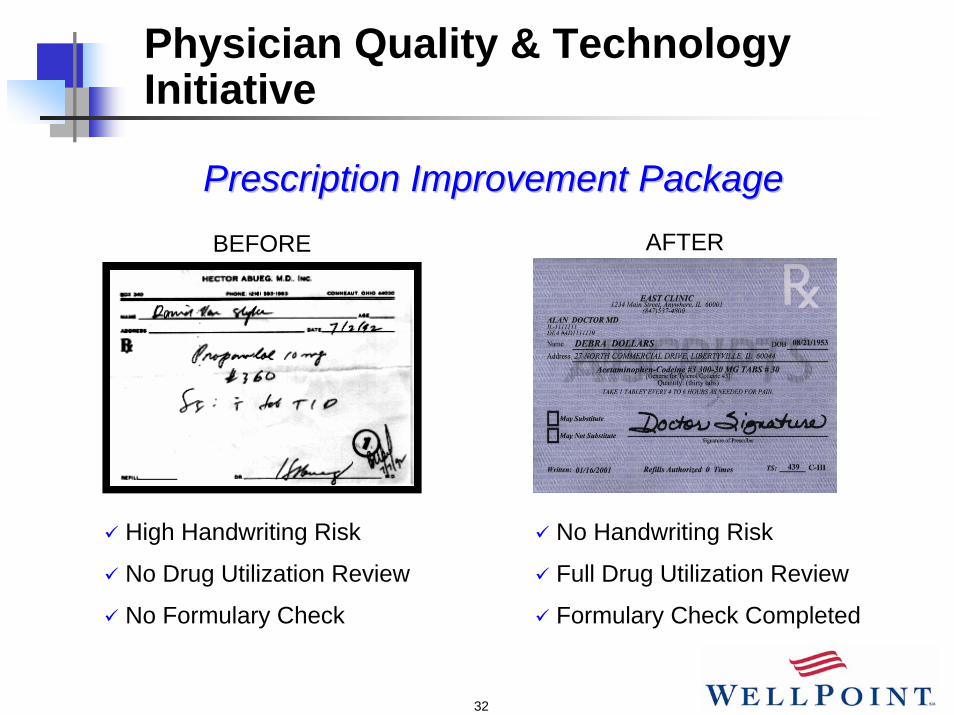
Physician Quality & Technology Initiative
Prescription Improvement PackagePrescription Improvement PackageAFTERBEFORE
High Handwriting Risk
No Drug Utilization Review
No Formulary Check
No Handwriting Risk
Full Drug Utilization Review
Formulary Check Completed
33
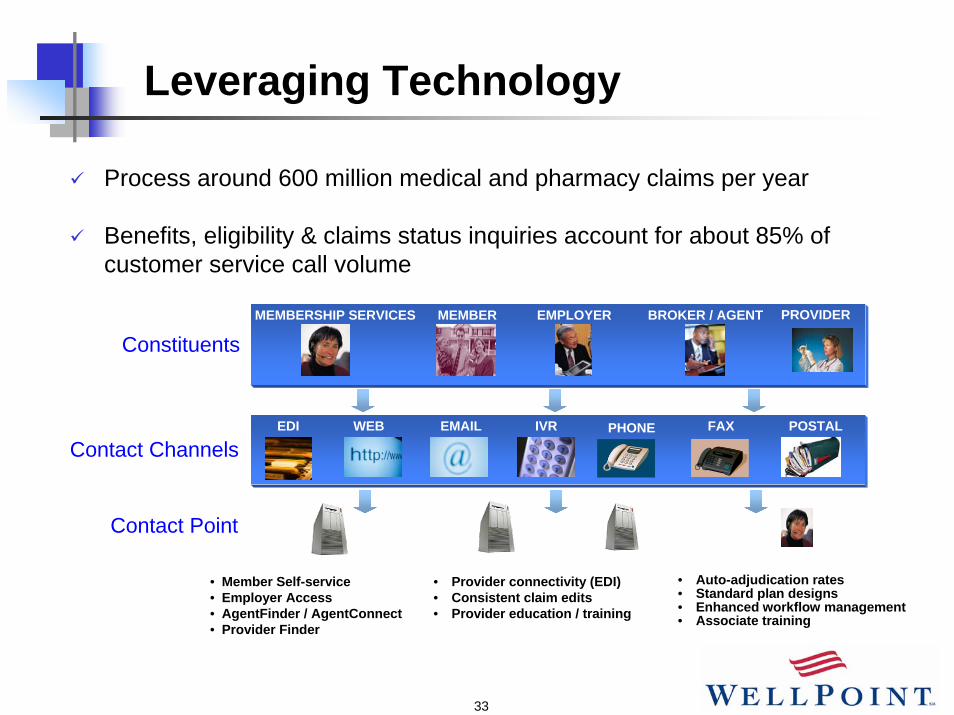
Leveraging Technology
Process around 600 million medical and pharmacy claims per year
Benefits, eligibility & claims status inquiries account for about 85% of customer service call volume
MEMBERMEMBERSHIP SERVICES EMPLOYER BROKER / AGENT
Membership Service
AssociateWeb EDIEET
PROVIDER
IVRWEB PHONEEMAIL FAX POSTALEDI
Constituents
Contact Channels
Contact Point
• Member Self-service• Employer Access• AgentFinder / AgentConnect• Provider Finder
• Auto-adjudication rates• Standard plan designs• Enhanced workflow management• Associate training
• Provider connectivity (EDI)• Consistent claim edits• Provider education / training
34
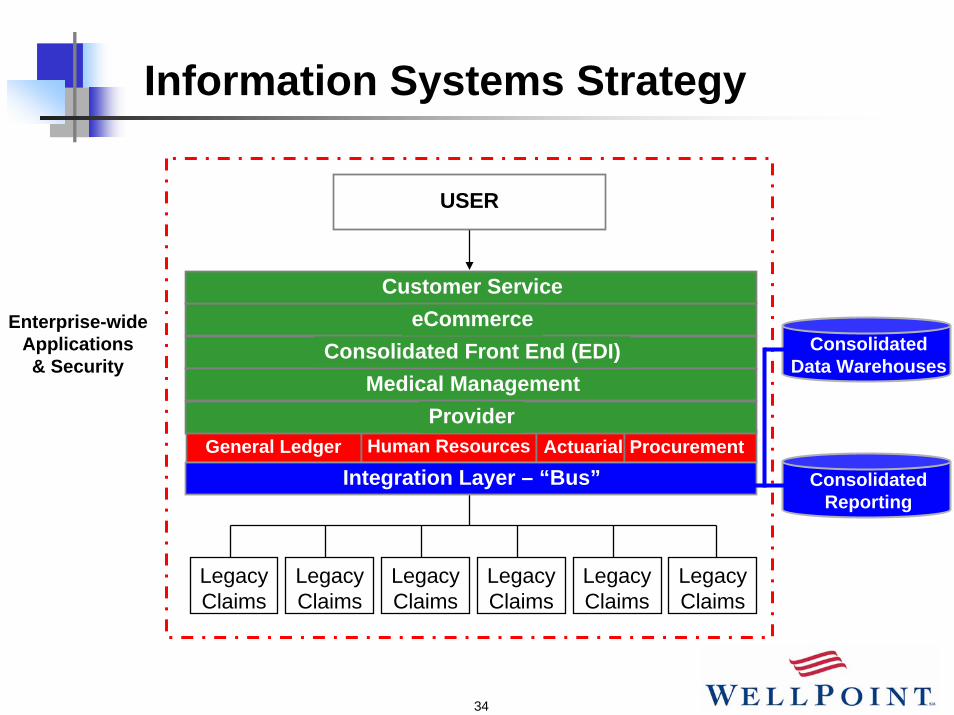
Information Systems Strategy
General Ledger Human Resources Actuarial Procurement
Consolidated Front End (EDI)
Provider
USER
Integration Layer – “Bus”
Medical Management
eCommerceCustomer Service
Enterprise-wideApplications& Security
Consolidated Reporting
LegacyClaims
LegacyClaims
LegacyClaims
LegacyClaims
LegacyClaims
LegacyClaims
ConsolidatedData Warehouses
35
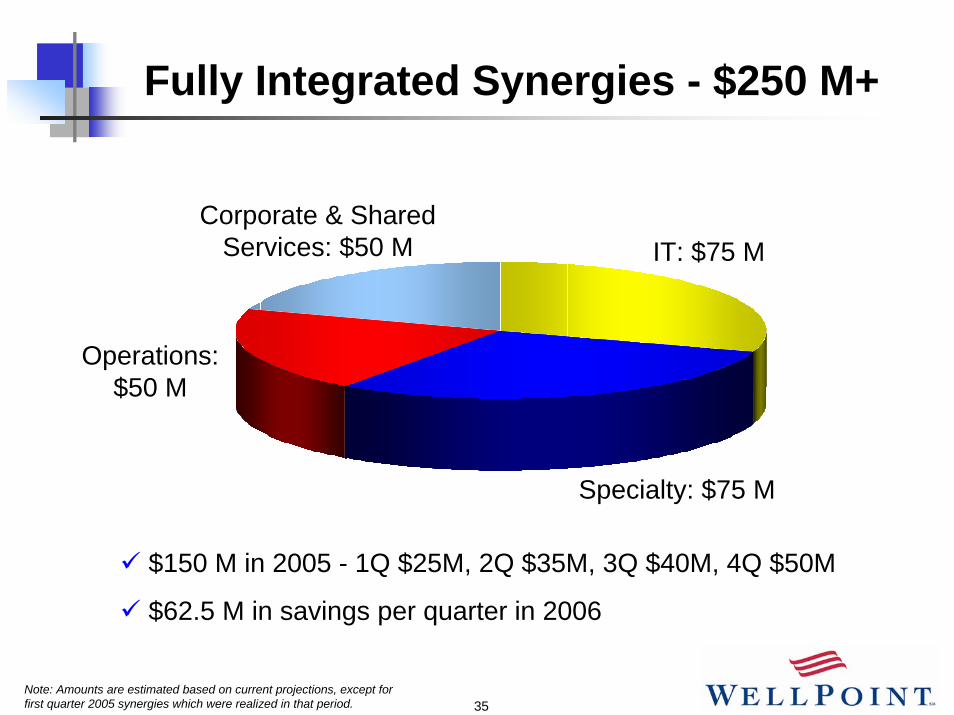
Fully Integrated Synergies - $250 M+
$150 M in 2005 - 1Q $25M, 2Q $35M, 3Q $40M, 4Q $50M
$62.5 M in savings per quarter in 2006
Corporate & Shared Services: $50 M IT: $75 M
Operations: $50 M
Specialty: $75 M
Note: Amounts are estimated based on current projections, except for first quarter 2005 synergies which were realized in that period.
36
WellPoint Growth Model
EPS GrowthEPS Growth15% +15% +
Profitable Enrollment
Growth
DisciplinedPricing
SG&A Ratio Reduction
Effective Useof Cash Flow
Specialty Penetration
1
2
34
5
37
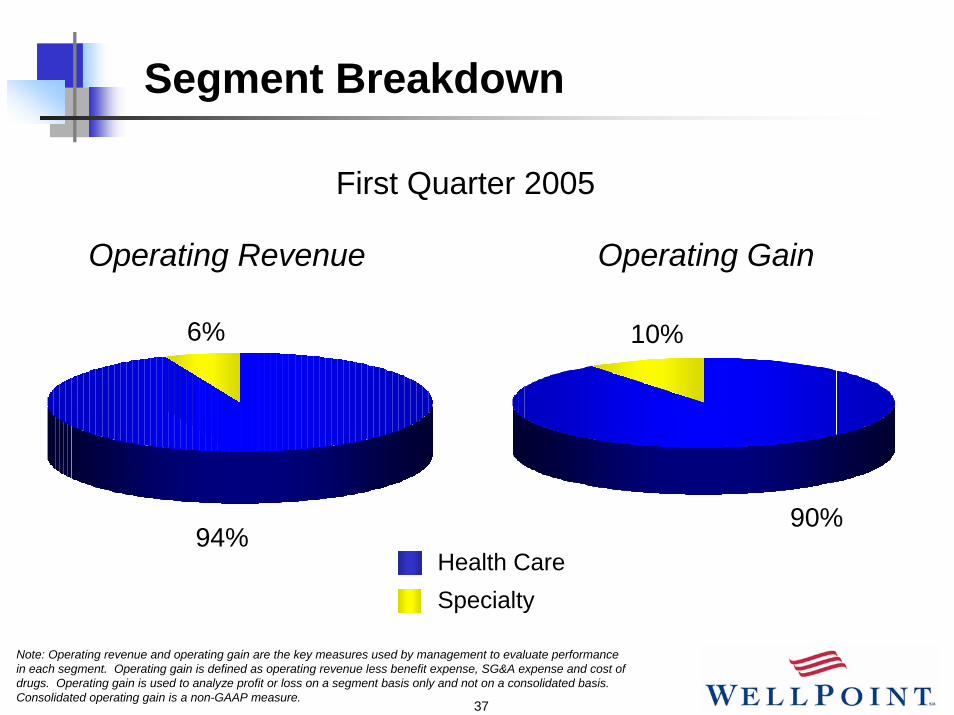
Segment Breakdown
94%
6% 10%
90%Health CareSpecialty
Operating Revenue Operating Gain
First Quarter 2005
Note: Operating revenue and operating gain are the key measures used by management to evaluate performance in each segment. Operating gain is defined as operating revenue less benefit expense, SG&A expense and cost of drugs. Operating gain is used to analyze profit or loss on a segment basis only and not on a consolidated basis. Consolidated operating gain is a non-GAAP measure.

38
Specialty Opportunity
Delivering more comprehensive benefit packages
Medical Benefits
Life/Disability PBM Behavioral Health
VisionDental Workers’ Comp
Increases profitability of medical membership
Improves retention rates
39
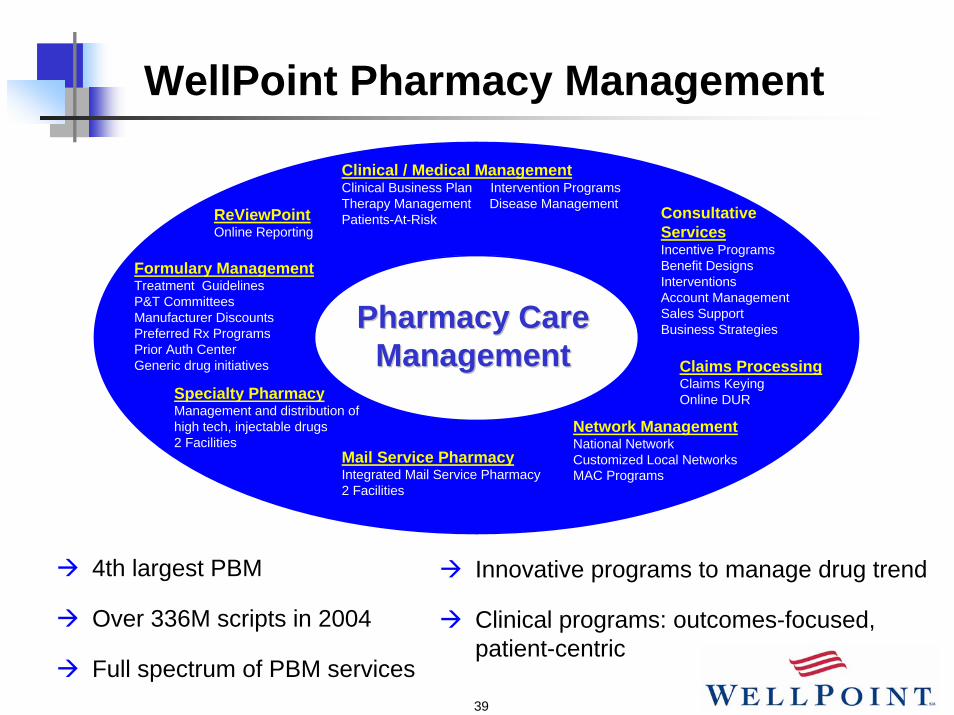
WellPoint Pharmacy Management
Clinical / Medical ManagementClinical Business Plan Intervention ProgramsTherapy Management Disease ManagementPatients-At-Risk
Formulary ManagementTreatment GuidelinesP&T CommitteesManufacturer DiscountsPreferred Rx ProgramsPrior Auth CenterGeneric drug initiatives
ReViewPointOnline Reporting
Claims ProcessingClaims KeyingOnline DUR
Network ManagementNational NetworkCustomized Local NetworksMAC Programs
ConsultativeServicesIncentive ProgramsBenefit DesignsInterventionsAccount ManagementSales SupportBusiness StrategiesPharmacy Care Pharmacy Care
ManagementManagement
Mail Service PharmacyIntegrated Mail Service Pharmacy2 Facilities
Specialty PharmacyManagement and distribution of high tech, injectable drugs2 Facilities
4th largest PBM
Over 336M scripts in 2004
Full spectrum of PBM services
Innovative programs to manage drug trend
Clinical programs: outcomes-focused, patient-centric

40
WellPoint Growth Model
EPS GrowthEPS Growth15% +15% +
Profitable Enrollment
Growth
DisciplinedPricing
SG&A Ratio Reduction
Specialty Penetration
Effective Useof Cash Flow
1
2
34
5

41
Effective Cash Management
Operating Cash Flow(in billions)
$0.5
$1.0$0.8
$1.2$1.0
$1.3
$3.0+
~ $2.5
2005E (1)20042002 2003Net Income Operating Cash Flow
(1) Estimated based on current projections. Refer to the Company’s earnings release for the quarter ended March 31, 2005, at www.wellpoint.com.
42
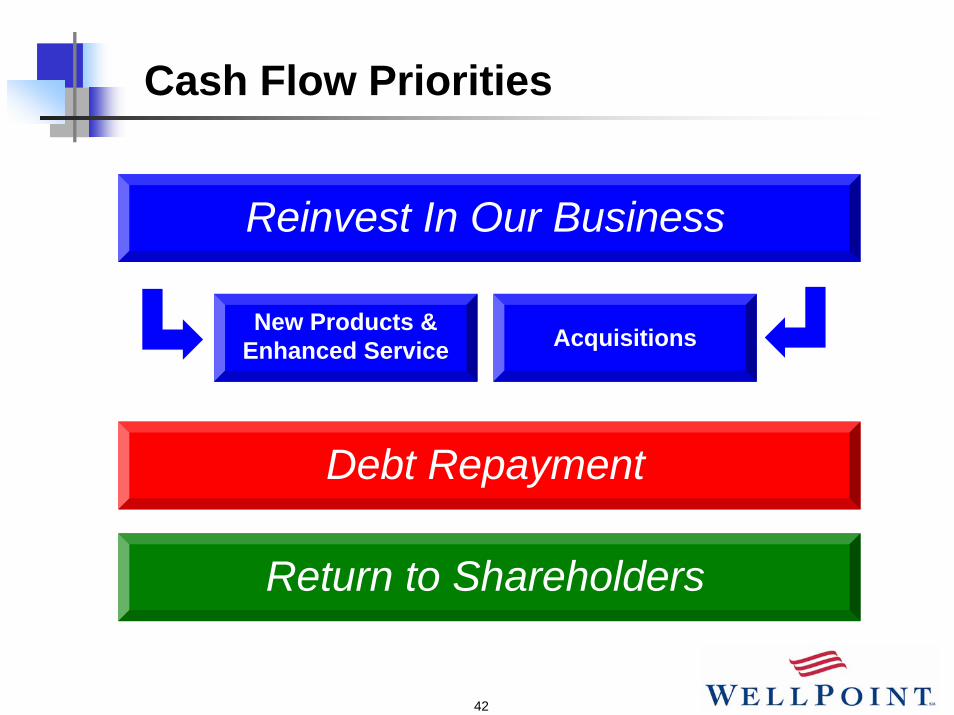
Cash Flow Priorities
Reinvest In Our Business
New Products & Enhanced Service Acquisitions
Debt Repayment
Return to Shareholders
43
Agenda
WellPoint Profile
WellPoint Growth Model: Executing with Strength
Investment Considerations
44
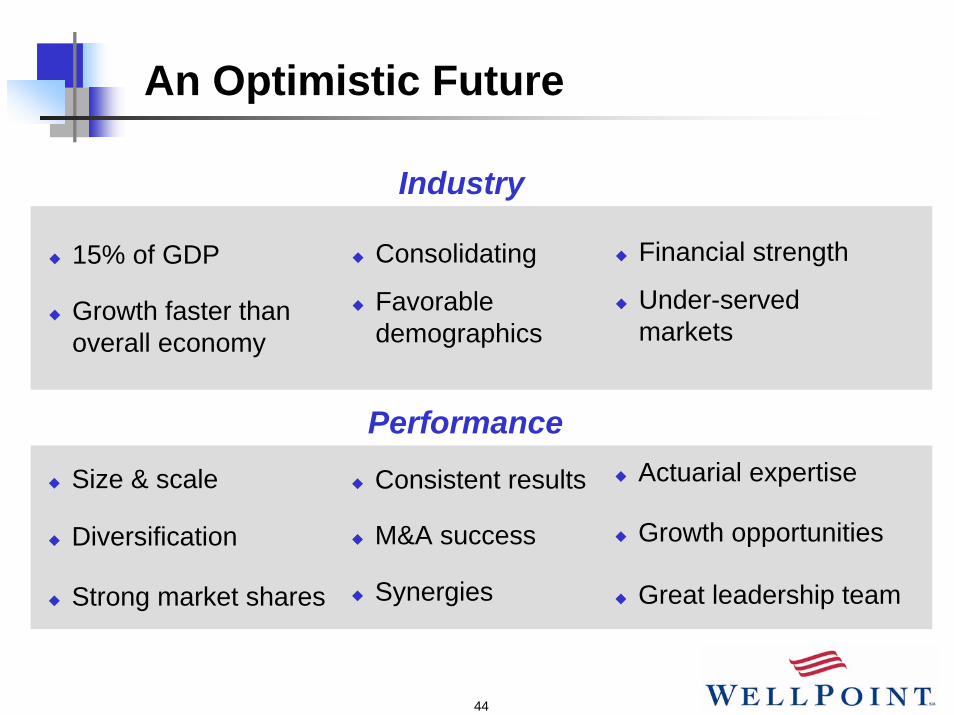
An Optimistic Future
Industry
15% of GDP
Growth faster than overall economy
Consolidating
Favorable demographics
Financial strength
Under-served markets
PerformanceSize & scale
Diversification
Strong market shares
Consistent results
M&A success
Synergies
Actuarial expertise
Growth opportunities
Great leadership team