David Barber NPS Thesis
161
NAVAL POSTGRADUATE SCHOOL MONTEREY, CALIFORNIA THESIS Approved for public release; distribution is unlimited PREDICTING THE EFFECT OF MARINE CORPS SELECTIVE REENLISTMENT BONUSES IN THE POST- 9/11 ERA: INTEGRATING THE EFFECTS OF DEPLOYMENT TEMPO by David Barber March 2009 Thesis Co-Advisors: Stephen L. Mehay Elda Pema
-
Upload
david-barber -
Category
Documents
-
view
52 -
download
0
Transcript of David Barber NPS Thesis

NAVAL
POSTGRADUATE SCHOOL
MONTEREY, CALIFORNIA
THESIS
Approved for public release; distribution is unlimited
PREDICTING THE EFFECT OF MARINE CORPS SELECTIVE REENLISTMENT BONUSES IN THE POST-
9/11 ERA: INTEGRATING THE EFFECTS OF DEPLOYMENT TEMPO
by
David Barber
March 2009
Thesis Co-Advisors: Stephen L. Mehay Elda Pema

THIS PAGE INTENTIONALLY LEFT BLANK

i
REPORT DOCUMENTATION PAGE Form Approved OMB No. 0704-0188 Public reporting burden for this collection of information is estimated to average 1 hour per response, including the time for reviewing instruction, searching existing data sources, gathering and maintaining the data needed, and completing and reviewing the collection of information. Send comments regarding this burden estimate or any other aspect of this collection of information, including suggestions for reducing this burden, to Washington headquarters Services, Directorate for Information Operations and Reports, 1215 Jefferson Davis Highway, Suite 1204, Arlington, VA 22202-4302, and to the Office of Management and Budget, Paperwork Reduction Project (0704-0188) Washington DC 20503. 1. AGENCY USE ONLY (Leave blank)
2. REPORT DATE March 2009
3. REPORT TYPE AND DATES COVERED Master’s Thesis
4. TITLE AND SUBTITLE Predicting the Effect of Marine Corps Selective Reenlistment Bonuses in the Post- 9/11 Era: Integrating the Effects of Deployment Tempo
5. FUNDING NUMBERS
6. AUTHOR(S) David S. Barber 7. PERFORMING ORGANIZATION NAME(S) AND ADDRESS(ES)
Naval Postgraduate School Monterey, CA 93943-5000
8. PERFORMING ORGANIZATION REPORT NUMBER
9. SPONSORING /MONITORING AGENCY NAME(S) AND ADDRESS(ES) Enlisted Plans, Manpower Plans and Policy, Manpower and Reserve Affairs Headquarters U.S. Marine Corps 3280 Russell Road Quantico, VA 22134
10. SPONSORING/MONITORING AGENCY REPORT NUMBER 7220
11. SUPPLEMENTARY NOTES The views expressed in this thesis are those of the author and do not reflect the official policy or position of the Department of Defense or the U.S. Government. 12a. DISTRIBUTION / AVAILABILITY STATEMENT Approved for public release; distribution is unlimited
12b. DISTRIBUTION CODE A
13. ABSTRACT (maximum 200 words)
This thesis explores the predictive effects of the Marine Corps Selective Reenlistment Bonus (SRB) on first-term retention while controlling for varying levels of deployment tempo. In order to successfully predict reenlistment decisions in the current era, the model must control for conditions that affect a Marine’s choice to reenlist, none being more influential than deployments to Operation Iraqi/Enduring Freedom. Adding deployment tempo variables to the logit prediction model enables Marine Corps manpower planners to properly account for changing conditions in the “Long War.”
The results of this analysis find the increased deployment tempo in recent years has had a negative affect on reenlistments. To counter this effect the Marine Corps has steadily increased its SRB budget and subsequent SRB offers to all Marines. In order to improve the accuracy of reenlistment predictions, this thesis estimated a model with alternative indicators of deployment tempo. The model developed is parsimonious, yet predicts accurately. Validation results show that if the model was utilized to predict FY07 reenlistment rates, it would have average prediction errors of 12 percent for the 27 high-density MOSs, who make up nearly 61 percent of the first-term population. 14. SUBJECT TERMS Selective Reenlistment Bonuses (SRBs), Deployment Tempo, Retention, Reenlistment
15. NUMBER OF PAGES
161 16. PRICE CODE
17. SECURITY CLASSIFICATION OF REPORT
Unclassified
18. SECURITY CLASSIFICATION OF THIS PAGE
Unclassified
19. SECURITY CLASSIFICATION OF ABSTRACT
Unclassified
20. LIMITATION OF ABSTRACT
UU NSN 7540-01-280-5500 Standard Form 298 (Rev. 2-89) Prescribed by ANSI Std. 239-18

ii
THIS PAGE INTENTIONALLY LEFT BLANK
iii
Approved for public release; distribution is unlimited
PREDICTING THE EFFECT OF MARINE CORPS SELECTIVE REENLISTMENT BONUSES IN THE POST- 9/11 ERA: INTEGRATING THE
EFFECTS OF DEPLOYMENT TEMPO
David S. Barber Captain, United States Marine Corps
B.S., University of Arizona, 2003
Submitted in partial fulfillment of the requirements for the degree of
MASTER OF SCIENCE IN MANAGEMENT
from the
NAVAL POSTGRADUATE SCHOOL March 2009
Author: David S. Barber
Approved by: Stephen L. Mehay Co-Advisor
Elda Pema Co-Advisor
William R. Gates Dean, Graduate School of Business and Public Policy

iv
THIS PAGE INTENTIONALLY LEFT BLANK

v
ABSTRACT
This thesis explores the predictive effects of the Marine Corps Selective
Reenlistment Bonus (SRB) on first-term retention while controlling for varying levels of
deployment tempo. In order to successfully predict reenlistment decisions in the current
era, the model must control for conditions that affect a Marine’s choice to reenlist, none
being more influential than deployments to Operation Iraqi/Enduring Freedom. Adding
deployment tempo variables to the logit prediction model enables Marine Corps
manpower planners to properly account for changing conditions in the “Long War.”
The results of this analysis find the increased deployment tempo in recent years
has had a negative affect on reenlistments. To counter this effect, the Marine Corps has
steadily increased its SRB budget and subsequent SRB offers to all Marines. In order to
improve the accuracy of reenlistment predictions, this thesis estimated a model with
alternative indicators of deployment tempo. The model developed is parsimonious, yet
predicts accurately. Validation results show that if the model was utilized to predict
FY07 reenlistment rates, it would have average prediction errors of 12 percent for the 27
high-density MOSs, who make up nearly 61 percent of the first-term population.

vi
THIS PAGE INTENTIONALLY LEFT BLANK

vii
TABLE OF CONTENTS
I. INTRODUCTION ........................................................................................................... 1 A. BACKGROUND .................................................................................................. 1 B. PURPOSE ............................................................................................................. 1 C. RESEARCH QUESTIONS ................................................................................ 2
1. Primary Research Questions ................................................................. 2 2. Secondary Research Questions ............................................................. 2
D. BENEFITS OF THE STUDY ............................................................................ 2 E. SCOPE AND METHODOLOGY ..................................................................... 2 F. OVERVIEW OF THE SELECTIVE REENLISTMENT BONUS
PROGRAM .......................................................................................................... 3 G. SUMMARY .......................................................................................................... 4 H. ORGANIZATION OF THE STUDY ............................................................... 5
II. LITERATURE REVIEW ............................................................................................... 7 A. CHAPTER OVERVIEW ................................................................................... 7 B. CURRENT SRB MODEL .................................................................................. 7
1. North (1994) ............................................................................................. 7 C. DEPLOYMENT TEMPO ................................................................................ 14
1. Hattiangadi, Lee, and Quester (2005) ................................................ 14 2. Hosek, Kavanagh, and Miller (2006) ................................................. 16 3. Quester, Hattiangadi, and Shuford (2006) ........................................ 17 4. Quester, Hattiangadi, Lee, and Shuford (2006) ............................... 20 5. Lien, Quester, and Shuford (forthcoming, October 2008) ............. 22
D. CHAPTER SUMMARY ................................................................................... 24 III. DATA AND METHODOLOGY ................................................................................. 25
A. DATA SOURCES .............................................................................................. 25 1. Total Force Data Warehouse .............................................................. 25 2. Bureau of Labor Statistics ................................................................... 25 3. United States Marine Corps ................................................................ 25
B. VARIABLE DESCRIPTIONS ........................................................................ 26 1. Reenlistment Decisions ......................................................................... 27 2. Selective Reenlistment Bonuses .......................................................... 28 3. Deployments to Operation Iraqi/Enduring Freedom ..................... 28 4. Economic Factors .................................................................................. 29 5. Demographic Variables........................................................................ 30 6. Military Occupational Specialty ......................................................... 30
C. DESCRIPTIVE STATISTICS ........................................................................ 30 1. Reenlistment Decisions ......................................................................... 31 2. Selective Reenlistment Bonus Offers ................................................. 33 3. Marital Status ........................................................................................ 34 4. Economic Factors .................................................................................. 34 5. Deployments to Operation Iraqi/Enduring Freedom ..................... 35

viii
6. Military Occupational Specialty Reenlistment Rates ..................... 37 D. METHODOLOGY ............................................................................................ 38
IV. MULTIVARIATE MODEL RESULTS ..................................................................... 41 A. OVERVIEW ....................................................................................................... 41 B. MODEL #1: FULLY-SPECIFIED REENLISTMENT MODEL
WITH DEPLOYMENT DATA ....................................................................... 41 1. Effects of Selective Reenlistment Bonuses ........................................ 43 2. Effects of Deployment Tempo ............................................................. 43 3. Effects of Fiscal Year Controls ........................................................... 43 4. Effects of Demographic Variables ...................................................... 44 5. Effects of Rank ...................................................................................... 44
C. MODEL #2: REENLISTMENT MODEL WITH DEPLOYMENT DATA BUT WITHOUT RANK, GENDER, AND MARITAL STATUS .............................................................................................................. 44 1. Effects of the Selective Reenlistment Bonus Multiple ..................... 46 2. Effects of Deployment Tempo ............................................................. 47 3. Effects of Fiscal Year Controls ........................................................... 47
D. MODEL #3: REENLISTMENT MODEL WITH DEPLOYMENT DATA INCLUDING NATIONAL UNEMPLOYMENT RATE AND MILITARY-CIVILIAN PAY RATIOS ......................................................... 47 1. Effects of the Selective Reenlistment Bonus Multiple ..................... 48 2. Effects of Deployment Tempo ............................................................. 49 3. Effects of Economic Variables ............................................................ 49
E. MODEL #4: REENLISTMENT MODEL WITHOUT DEPLOYMENT VARIABLES ....................................................................... 50 1. Effects of the Selective Reenlistment Bonus Multiple ..................... 51 2. Effects of Economic Variables ............................................................ 52
F. PREDICTION MODEL ................................................................................... 52 1. Model #1 and Model #2 Assumptions ................................................ 54 2. Model #3 and Model #4 Assumptions ................................................ 54 3. Fiscal Year 2008 Prediction Results ................................................... 54
G. CHAPTER SUMMARY ................................................................................... 55 V. VALIDATION AND SENSITIVITY ANALYSIS .................................................... 57
A. OVERVIEW ....................................................................................................... 57 B. VALIDATION REENLISTMENT MODEL ................................................ 57 C. FISCAL YEAR 2007 PREDICTION RESULTS ......................................... 59
1. Predictions Using USMC-Wide Mean FY07 Values for the Explanatory Variables ......................................................................... 59
2. Predictions Using Mean Values for the x’s for Each MOS ............ 62 D. VALIDATION REENLISTMENT MODEL – OMITS
DEPLOYMENT VARIABLES ....................................................................... 66 1. Predictions for FY07 Omitting Deployment Variables................... 67
E. SUMMARY ........................................................................................................ 70
VI. CONCLUSIONS AND RECOMMENDATIONS .................................................... 73

ix
A. CONCLUSIONS ................................................................................................ 73 B. THESIS RESEARCH QUESTIONS .............................................................. 73
1. How has the Increased Deployment Tempo since 9/11 Affected First-Term Enlisted Reenlistment Rates by MOS? ......................... 73
2. Has the Increased Deployment Tempo Affected the Magnitude of the Effect of SRBs on Reenlistment Behavior?............................ 74
3. Is There a Difference in Reenlistment Rates for Marines with and without Dependents? .................................................................... 75
4. What are the Effects of Not Deploying at all on Individuals’ Reenlistment Decisions? ....................................................................... 75
5. Is the Prediction Model More Accurate with Deployment Variables?............................................................................................... 76
C. RECOMMENDATIONS .................................................................................. 77 1. Validation with Fiscal Year 2008 and 2009 Reenlistment Data .... 77 2. Update Model on a Fiscal Year Basis ................................................ 77 3. Incorporate Local Area Unemployment Data into the
Prediction Models ................................................................................. 77
APPENDIX A. MILITARY OCCUPATIONAL SPECIALTY LISTING ...................... 79
APPENDIX B. LOGISTIC REGRESSION RESULTS ...................................................... 85
APPENDIX C. FY 2008 PREDICTED REENLISTMENT RATES BY MOS FOR ALTERNATE SRB MULTIPLES ............................................................................ 101
APPENDIX D. MICROSOFT EXCEL MODELS ............................................................ 107
APPENDIX E. VALIDATION REGRESSION MODEL................................................. 113
APPENDIX F. FY07 PREDICTION RESULTS (USMC WIDE MEAN VALUES FOR X’S) ....................................................................................................................... 125
APPENDIX G. VALIDATION REGRESSION MODEL—OMITS DEPLOYMENT VARIABLES.................................................................................. 131
LIST OF REFERENCES ........................................................................................................ 141
INITIAL DISTRIBUTION LIST........................................................................................... 143

x
THIS PAGE INTENTIONALLY LEFT BLANK

xi
LIST OF FIGURES
Figure 1. FY04 FTAP Reenlistment Rates ........................................................................ 15 Figure 2. FY04 reenlistment rates for first-term (zone A) Marines, by number of
days deployed ...................................................................................................... 18 Figure 3. First-term reenlistment rates for Marines, by dependency status ..................... 19 Figure 4. FY05 first-term reenlistment rates by days deployed for Marines with and
without dependents .............................................................................................. 21 Figure 5. FTAP reenlistment rates by year of decision and number of days deployed .. 23 Figure 6. Reenlistment Rates by Fiscal Year ..................................................................... 32 Figure 7. Reenlistment Rates by Rank ............................................................................... 33 Figure 8. Average SRB Offers by Fiscal Year .................................................................. 33 Figure 9. Reenlistment Rates by Marital Status ................................................................ 34 Figure 10. Percent of First-Term Marines Deployed to OIF/OEF ..................................... 35 Figure 11. Average Number of Deployed Days by Fiscal Year ......................................... 36 Figure 12. Average Number of Deployed Days by Marital Status and Fiscal Year ......... 36 Figure 13. Reenlistment Rates by Number of Days Deployed to OIF/OEF ...................... 37

xii
THIS PAGE INTENTIONALLY LEFT BLANK

xiii
LIST OF TABLES
Table 1. Logit coefficient estimates for Zone A reenlistments (FY1987 – 1992) ........... 9 Table 2. Predicted FY 1995 reenlistment rates by occupational field and SRB
multiple (percentages) ......................................................................................... 12 Table 3. Descriptive Statistics for first-term Marines ...................................................... 26 Table 4. Summary Statistics for First-Term Marines ...................................................... 31 Table 5. Reenlistment Rates for Selected Military Occupational Specialties ................ 38 Table 6. Logistic Model Variables .................................................................................... 39 Table 7. Logit Reenlistment Model (#1) .......................................................................... 42 Table 8. Logit Reenlistment Model (#2) – Deletes Rank, Gender, and Marital
Status .................................................................................................................... 46 Table 9. Logit Reenlistment Model (#3) – Including National Unemployment Rate
and Military-Civilian Pay Ratio ......................................................................... 48 Table 10. Logit Reenlistment Model (#4) – Omitting Deployment Tempo ..................... 51 Table 11. Predicted Fiscal Year 2008 Reenlistment Rates for High-Density MOSs ...... 53 Table 12. Logit Validation Reenlistment Model, Estimated Using Data for FY 2003-
2006 ...................................................................................................................... 58 Table 13. Prediction Values Used in USMC Average Predictions for MOS 0341.......... 60 Table 14. Prediction Values Used in MOS Average Predictions for MOS 0341 ............ 63 Table 15. Fiscal Year 2007 Predicted Reenlistment Rates (Selected MOSs) Using
USMC-Wide Values for the Explanatory Variables ......................................... 65 Table 16. Fiscal Year 2007 Predicted Reenlistment Rates (Selected MOSs) Using
Individual MOS Mean Values for the Explanatory Variables.......................... 66 Table 17. Logit Validation Model – No Deployment Variables (Data for FY03-
FY06) ................................................................................................................... 67 Table 18. Fiscal Year 2007 Predicted Reenlistment Rates (Selected MOSs) —
Omitting Deployment Tempo Variables Using USMC-Wide Mean Values for the Explanatory Variables ............................................................................. 68
Table 19. Fiscal Year 2007 Predicted Reenlistment Rates (Selected MOSs) — Omitting Deployment Tempo Variables Using Individual MOS Mean Values for the Explanatory Variables ................................................................ 68
Table 20. FY07 Predicted Reenlistment Rates (Selected MOSs) – Using Individual MOS Mean Values for the Explanatory Variables (SRB Multiples 0-5) ........ 71
Table 21. Estimated Marginal Effects of SRB Multiple .................................................... 75 Table 22. Actual Reenlistment Rates by Deployed Days .................................................. 76 Table 23. Fiscal Year 2007 Predicted Reenlistment Rates (Selected MOSs) –
Validation Models with and without Deployment Tempo Variables .............. 76

xiv
THIS PAGE INTENTIONALLY LEFT BLANK
xv
ACKNOWLEDGMENTS
This thesis would not have been possible without the unwavering support of my
loving wife and wonderful daughter. Tiffany and Sierra, from the bottom of my heart
“thank you for everything!” Your understanding and support made this academic
experience enjoyable and worthwhile. You are the reason I kept pushing myself to
succeed even when things were at their toughest.
I would also like to thank my advisors for the support and patience. Professors
Mehay and Pema, your guidance was exceptional. Thank you for the time and effort you
put into helping me make this project a success and something the Marine Corps can
actually use. I could not have asked for better advisors – thank you!

xvi
THIS PAGE INTENTIONALLY LEFT BLANK

1
I. INTRODUCTION
A. BACKGROUND
The Marine Corps was authorized in 2007 to increase its active duty end strength
from 175,000 to 202,000. Additionally, the Global War on Terror has become the Long
War and the Marine Corps is facing continued high levels of deployment tempo. Even
with these two constraints, the Marine Corps continues to meet its first-term retention
goals. Meeting these retention goals has come at cost: a steep increase in the amount and
number of Selective Reenlistment Bonuses (SRBs) offered to Marines. According to the
Marine Corps SRB Planner, Captain Paul Bock, the SRB budget has increased from $58
million in Fiscal Year 2002 to $268 million in Fiscal Year 2007.1
B. PURPOSE
The increased
deployment tempo from the Long War and end strength increases are the reasons for this
increase in SRB payments offered.
The main tool utilized by Marine Corps Manpower Planners to appropriately
shape the force is the SRB program. The goal of the SRB program is to attract and retain
the desired number of Marines each fiscal year (FY) by offering a monetary incentive to
reenlistment-eligible Marines. However, the SRB Program is limited by appropriations
each FY by Congress and this pool of funding is limited. This budget constraint poses a
problem for Marine Corps Manpower Planners in determining how much and to whom
they offer SRBs to each FY in order to shape the force to the desired manning levels.
The purpose of this thesis is to examine the predictive effects of the Marine Corps
Selective Reenlistment Bonus on first-term retention when controlling for varying levels
of deployment tempo. Given the required end strength increase and sustained high
deployment tempo during the Long War, the SRB Program will serve as a critical
1 Paul Bock, e-mail to author, October 22, 2008.

2
component in shaping the force for the future. Ultimately, this thesis will propose a new
model for Marine Corps Manpower Planners to utilize in forecasting SRB amounts to be
offered each fiscal year.
C. RESEARCH QUESTIONS
1. Primary Research Questions
How has the increased deployment tempo since 9/11 affected first-term enlisted
reenlistment rates by MOS?
Has the increased deployment tempo affected the magnitude of the effect of SRBs
on reenlistment behavior?
2. Secondary Research Questions
Is there a difference in reenlistment rates for Marines with and without
dependents?
What are the effects of not deploying at all on individuals’ reenlistment decisions?
D. BENEFITS OF THE STUDY
This study will provide the Marine Corps with a statistical analysis of
reenlistment behavior for first-term Marines in the Post-9/11 Era. It will also provide an
easily updatable model from which Marine Corps Manpower Planners can determine
SRB levels by Military Occupational Specialty (MOS) for an upcoming fiscal year. The
results from the model in this thesis can be compared to the prediction model currently in
use by the SRB Planner.
E. SCOPE AND METHODOLOGY
This thesis analyzes the current SRB Model utilized by the Marine Corps. It also
analyzes the effects of both deployment and SRB offers on reenlistment decisions for
first-term enlisted Marines. The data used for this research was obtained by the Marine
Corps Total Force Data Warehouse (TFDW) and includes three datasets. The first
dataset contains reenlistment and separation personnel data for first-term Marines from

3
FY03 through FY07. The second dataset contains SRB payments made during the same
timeframe. The third dataset contains deployment data for all Marines from FY03
through FY07. This study is primarily quantitative in nature, utilizing a multivariate
logistic analysis to predict the effects of SRB offers and deployment tempo on individual
reenlistment behavior.
F. OVERVIEW OF THE SELECTIVE REENLISTMENT BONUS PROGRAM
The general concept of the SRB Program is outlined in Marine Corps Order
7220.24M as follows:
The SRB program was established to assist in attaining and sustaining adequate numbers of career enlisted personnel in designate Military Occupational Specialties (MOS’s) and within particular years-of-service groupings. The program provides a monetary incentive for a reenlistment of at least 4 years at three career decision points during the first 14 years of service. Marine Corps Bulleting 7220 series, published separately and revised as required to meet the needs of the Marine Corps, identify MOS’s eligible for a SRB and their multiples. The intent of this program is that Marines who receive a bonus for reenlistment in a particular skill serve the entire period of reenlistment in that skill.2
The Marine Corps pays the SRB in a lump-sum payment to Marines upon an
eligible reenlistment. The amount paid is determined by rank and MOS at time of
reenlistment, and length of the reenlistment term. For Zone A, first-term Marines, there
are three rank categories; E-3 and below, E-4, and E-5 and above.
3 Zone A eligible
Marines are defined as those possessing “17 months to 6 years of active Marine Corps
Service of which at least 17 months was continuous active service other than for
training.”4
2 Marine Corps Order 7220.24M, Subject: Selective Reenlistment Bonus Program, May 1990, 1-2. 3 Marine Corps Administrative Message, Subject: MCBUL 7220 Fiscal Year 2009 (FY09) Selective
Reenlistment Bonus (SRB) Program and FY09 Broken Service SRB (BSSRB) Program, June 2008, 1. 4 Ibid., 1.
Additionally, there have been recent changes to the way that SRB payments

4
amounts are calculated. In years past, prior to FY08, the payment was based on the
product of a Marine’s base pay, additional years of obligated service, and an SRB
multiple (1-5).5
There have also been yearly increases in the maximum amount of SRB that can be
paid to an eligible reenlisting Marine. For FY09 the total amount paid for an SRB cannot
exceed $90,000.
6 This amount has increased dramatically since the onset of the Global
War on Terror. In comparison to FY09, the cap for FY02 SRB payments was limited to
$30,000 for Zone A reenlistments.7
Retaining our combat experienced Marines, and their combat experienced leaders, is one of the Commandant’s highest priorities and is a crucial component of achieving the future 202k Marine Corps.
This change highlights the importance of using the
SRB as the primary retention tool for Marine Corps Manpower Planners. This
importance is also highlighted in the most recent MCBUL 7220 which states:
8
G. SUMMARY
Clearly, the SRB Program will be a vital component in shaping the force of the Marine
Corps during the current heightened deployment cycle and push to increase the force to
202,000 Marines.
This thesis analyzes the current Marine Corps SRB program and how the
increased deployment tempo since the onset of the Global War on Terror has affected
reenlistment behavior of first-term Marines, focusing on the effect of SRB payments.
The results of this study will be of significant value to Marine Corps Manpower Planners
in determining the appropriate rate of SRB payment to offer to each MOS in shaping the
force for the Long War and continued high level of deployment tempo experienced by the
Marine Corps. Ultimately, this study will provide manpower planners with an easily
5 Marine Corps Administrative Message, Subject: MCBUL 7220 Fiscal Year 2007 (FY07) Selective
Reenlistment Bonus (SRB) Program, July 2006, 1. 6 Ibid., 1. 7 Marine Corps Administrative Message, Subject: MCBUL 7220 Multiples for the Fiscal Year 2002
(FY02) Selective Reenlistment Bonus (SRB) Program, September 2001, 1. 8 Ibid., 1.
5
updatable spreadsheet, based on multivariate logistical regressions, which will allow
forecasting of SRB payment offers in order to shape the force to the desired levels.
H. ORGANIZATION OF THE STUDY
This study is organized into five chapters. Chapter II is a literature review of
several previous studies on the Marine Corps SRB Program, as well as the impacts of the
Long War and its associated deployment tempo on reenlistment behavior. This chapter
provides an in-depth look into how the Marine Corps determines what SRB amounts to
be offered. It also examines how the increased deployment tempo since 9/11 has
impacted individual reenlistment decisions. Chapter III describes the data utilized to
conduct this research. This includes both descriptive and summary statistics, research
methodology, and the general logistical regression models. This chapter describes in
detail the data used and develops the hypothesized model for multivariate regression
analysis. Chapter IV contains the results of the logistical regression models and
introduces a Microsoft Excel Model for use by Marine Corps Manpower Planners. The
multivariate results will predict reenlistment rates by Military Occupational Specialty
(MOS). These results will be contained in the Microsoft Excel Model for use by
manpower planners to determine SRB offers. Chapter V contains a validation of the
prediction model along with some basic sensitivity analysis. Chapter VI concludes by
summarizing the findings of the study and offering recommendations.

6
THIS PAGE INTENTIONALLY LEFT BLANK

7
II. LITERATURE REVIEW
A. CHAPTER OVERVIEW
The study of the effects of increases in deployment tempo for the Marine Corps
has been an important theme since the onset of the Global War on Terror. The main
focus of these Marine Corps-sponsored studies has been on the effect of deployments on
retention. There have been far fewer studies that actually predict reenlistment rates.
Specifically, one Center for Naval Analyses (CNA) study predicts reenlistment rates for a
given Selective Reenlistment Bonus (SRB) level. However, this is a dated study that
does not account for the current military environment. Being able to accurately predict
reenlistment behavior is imperative in ensuring Marine Corps Manpower Planners can
shape the force for the future.
Although there have been several recent studies on deployment tempo and its
effects, none of them have tied in the predictive effects of the SRB program. This thesis
looks at the current model and procedures for determining the SRB level, as well as
incorporating the deployment tempo in order to formulate a new SRB model that utilizes
more recent reenlistment data to better reflect present day conditions.
This chapter is divided into two main parts. This first part will present the current
SRB model and its use by the Marine Corps. The second part will present five studies
(four conducted by CNA and one by the RAND Corporation) that analyze how increases
in deployment tempo have impacted Marine Corps retention. These studies share a
common result in that the increased deployment tempo since 9/11 has negatively
impacted reenlistment behavior in some way throughout the past several years.
B. CURRENT SRB MODEL
1. North (1994)
James H. North’s analysis, “A Cost-Effective Use of Selective Reenlistment
Bonuses and Lateral Occupational Moves” is the cornerstone from which the Marine
Corps sets its SRB amounts to this day. According to the Marine Corps SRB planner,

8
Captain Paul Bock, the analysis derived in the North study is still used as an essential
component in determining what SRB amounts are offered each fiscal year.9 Each year
the Center for Naval Analyses updates the prediction model produced by North and
submits the new predictions to the Marine Corps. These predictions become the main
part of the actual Marine Corps SRB model. CNA’s logistic regression model is
combined with a weighed average of the current inventory and future requirements to
produce an SRB offer for each Military Occupational Specialty (MOS).10
His statistical model was somewhat simple to ensure it could be replicated and
used in a practical sense by manpower planners. He acknowledges that prior studies have
shown that other factors, not included in his model, affect reenlistment behavior.
However, he states his purpose is to “develop a model that accurately predicts
reenlistment behavior and is easy to update.”
North’s study was composed of two key elements: estimating Marines
reenlistment probabilities and estimating the costs of paying SRBs. He estimated
reenlistment probabilities using historical reenlistment data from fiscal years 1987
through 1992 utilizing the CNA ARSTAT tracking file. The study focused on Zone A
enlisted Marines making reenlistment decisions in their first 72 months of active service.
The data population for each fiscal year included only those first-term Marines who
either reenlisted or separated during that particular fiscal year, regardless of end of active
service (EAS) date. To ensure he was getting reliable multivariate results he restricted
his data to only those Marines that were recommended and eligible for reenlistment. This
helped to negate any bias in his coefficient estimates due to Marines being in the sample
that had no chance of reenlisting in the first place. One further data restriction to mitigate
any potential bias was that he removed all MOS’s that were classified as “restricted”,
meaning that there were limits placed on the number of Marines that could reenlist in a
particular MOS. His final dataset contained 40,984 observations for the six fiscal years.
11
9 Paul Bock, e-mail to author, August 21, 2008.
10 Ibid. 11 James H. North, “A Cost-Effective Use of Selective Reenlistment Bonuses and Lateral
Occupational Moves,” Center for Naval Analyses, September 1994, 27.
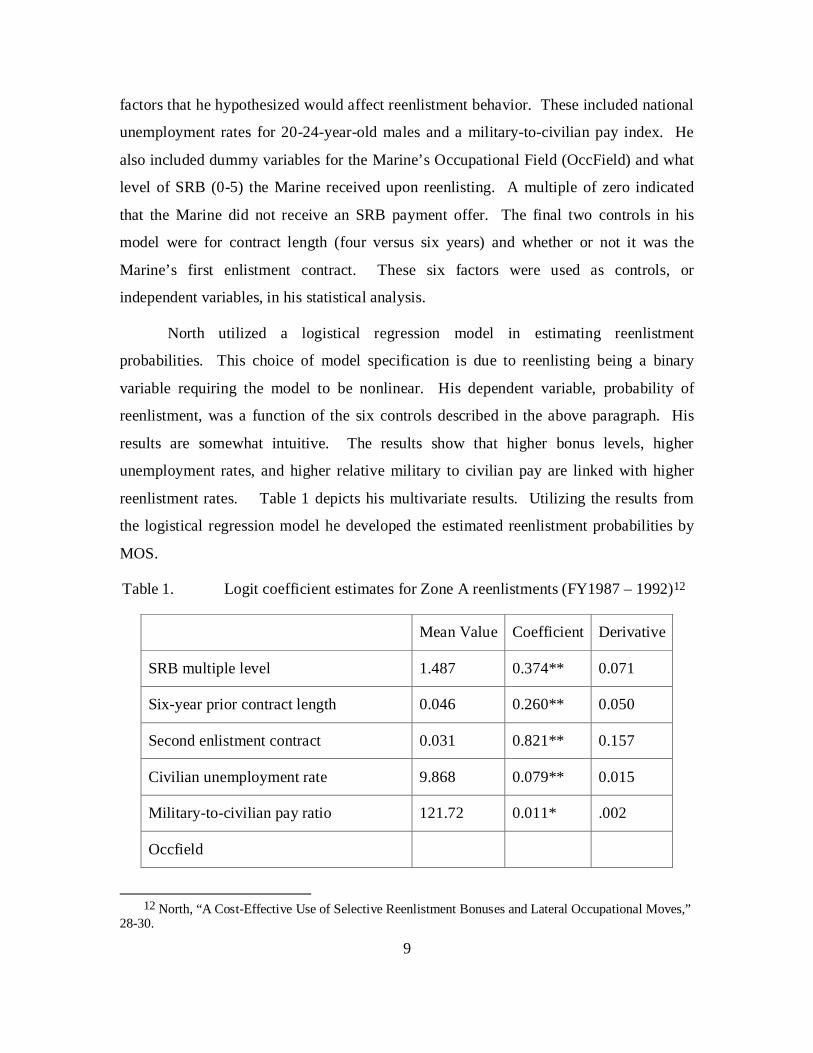
Included in his model were economic
9
factors that he hypothesized would affect reenlistment behavior. These included national
unemployment rates for 20-24-year-old males and a military-to-civilian pay index. He
also included dummy variables for the Marine’s Occupational Field (OccField) and what
level of SRB (0-5) the Marine received upon reenlisting. A multiple of zero indicated
that the Marine did not receive an SRB payment offer. The final two controls in his
model were for contract length (four versus six years) and whether or not it was the
Marine’s first enlistment contract. These six factors were used as controls, or
independent variables, in his statistical analysis.
North utilized a logistical regression model in estimating reenlistment
probabilities. This choice of model specification is due to reenlisting being a binary
variable requiring the model to be nonlinear. His dependent variable, probability of
reenlistment, was a function of the six controls described in the above paragraph. His
results are somewhat intuitive. The results show that higher bonus levels, higher
unemployment rates, and higher relative military to civilian pay are linked with higher
reenlistment rates. Table 1 depicts his multivariate results. Utilizing the results from
the logistical regression model he developed the estimated reenlistment probabilities by
MOS.
Table 1. Logit coefficient estimates for Zone A reenlistments (FY1987 – 1992)12
Mean Value Coefficient Derivative
SRB multiple level 1.487 0.374** 0.071
Six-year prior contract length 0.046 0.260** 0.050
Second enlistment contract 0.031 0.821** 0.157
Civilian unemployment rate 9.868 0.079** 0.015
Military-to-civilian pay ratio 121.72 0.011* .002
Occfield
12 North, “A Cost-Effective Use of Selective Reenlistment Bonuses and Lateral Occupational Moves,”
28-30.

10
01 Personnel and administration 0.056 1.789** .342
02 Intelligence 0.005 0.033 0.006
04 Logistics 0.035 0.608** 0.116
08 Field artillery 0.039 0.269** 0.051
11 Utilities 0.017 0.199* 0.038
13 Engineer 0.064 0.338** 0.065
15 Printing and reproduction 0.001 1.847** 0.353
18 Tank and assault amphibious 0.011 0.149 0.028
21 Ordnance 0.034 0.402** 0.077
23 Ammunition 0.006 0.002 0.000
25 Operational communications 0.054 0.963** 0.184
26 Signal intelligence 0.012 -0.052 -0.010
28 Data/communications maintenance 0.027 0.025 0.005
30 Supply 0.085 1.288** 0.246
31 Traffic management 0.002 1.757** 0.336
33 Food service 0.020 0.821** 0.157
34 Audit, finance and accounting 0.008 1.007** 0.191
35 Motor transport 0.055 0.304** 0.058
40 Data systems 0.012 0.476** 0.091
41 Marine Corps exchange 0.001 2.963** 0.566
43 Public affairs 0.002 -0.184 -0.035
44 Legal services 0.004 0.930** 0.178
46 Training and visual information 0.002 0.887** 0.170

11
55 Music 0.009 1.353** 0.258
57 Nuclear, biological and chemical 0.004 0.534** 0.102
58 Military police and corrections 0.020 0.181 0.034
59 Electronics maintenance 0.015 0.087 0.017
60 Aircraft maintenance-fixed wing 0.078 0.275** 0.053
61 Aircraft maintenance-helicopter 0.052 0.330** 0.063
63 Avionics 0.039 0.078 0.015
64 Advanced avionics 0.031 0.151 0.029
65 Aviation ordnance 0.020 0.434** 0.083
68 Weather service 0.002 0.406 0.078
70 Airfield services 0.015 0.891** 0.170
72 Air control/air support 0.013 0.269* 0.051
73 Air traffic control and flight crews 0.009 -0.154 -0.030
Constant 1 -4.389**
Mean Value of the dependent variable 0.257
**Statistical significance at the 1-percent level. *Statistical significance at the 5-percent level.
He predicted reenlistment rates by OccField and SRB level for fiscal year 1995
using the results of the logistical regression model and estimates provided from Marine
Corps Manpower Planners for the six control variables. Table 2 below depicts these
results. Predicted reenlistment rates ranged from 9.4 percent (multiple of 0 for the Public
Affairs OccField) to 94.0 percent (multiple of 5 for the Marine Corps Exchange
OccField). He used these predicted rates to develop estimates of SRB program costs.

12
Table 2. Predicted FY 1995 reenlistment rates by occupational field and SRB multiple (percentages)13
SRB Multiple
Occfield Zero One Two Three Four Five
01 Personnel and administration 42.4 51.7 60.9 69.3 76.7 82.7
02 Intelligence 12.3 17.0 22.9 30.1 38.6 47.7
03 Infantry 10.6 14.7 20.1 26.8 34.7 43.6
04 Logistics 18.2 24.4 32.0 40.6 49.8 59.1
08 Field artillery 13.5 18.5 24.8 32.4 41.0 50.3
11 Utilities 12.8 17.6 23.7 31.1 39.6 48.8
13 Engineer 14.7 20.0 26.7 34.6 43.5 52.8
15 Printing and reproduction 42.5 51.8 61.0 69.5 76.8 82.8
18 Tank and assault amphibious 12.4 17.0 23.0 30.2 38.6 47.8
21 Ordnance 15.4 20.9 27.7 35.8 44.8 54.1
23 Ammunition 10.8 14.9 20.3 27.0 35.0 43.9
25 Operational communications 24.1 31.6 40.1 49.4 58.6 67.3
26 Signal intelligence 10.7 14.8 20.2 26.9 34.8 43.7
28 Data/communications maintenance 11.6 16.0 21.6 28.6 36.8 45.9
30 Supply 30.4 38.8 48.0 57.3 66.1 73.9
31 Traffic management 40.9 50.1 59.4 68.0 75.5 81.8
33 Food service 21.2 28.2 36.3 45.3 54.6 63.7
34 Audit, finance and accounting 26.1 33.9 42.8 52.1 61.2 69.6
13North, “A Cost-Effective Use of Selective Reenlistment Bonuses and Lateral Occupational Moves,”
34-35.

13
35 Motor transport 14.0 19.2 25.6 33.4 42.1 51.4
40 Data systems 16.2 21.9 29.0 37.2 46.3 55.6
41 Marine Corps exchange 70.7 77.8 83.6 88.1 91.5 94.0
43 Public affairs 9.4 13.1 18.0 24.2 31.7 40.3
44 Legal services 24.2 31.7 40.3 49.5 58.8 67.5
46 Training and visual information 22.1 29.2 37.5 46.6 55.9 64.8
55 Music 31.4 39.9 49.1 58.4 67.1 74.8
57 Nuclear, biological and chemical 17.3 23.4 30.7 39.2 48.4 57.7
58 Military police and corrections 12.7 17.5 23.5 30.9 39.4 48.6
59 Electronics maintenance 11.9 16.4 22.2 29.3 37.6 46.7
60 Aircraft maintenance-fixed wing 14.2 19.4 26.0 33.8 42.6 51.9
61 Aircraft maintenance-helicopter 14.8 20.1 26.8 34.7 43.6 52.9
63 Avionics 12.2 16.8 22.6 29.8 38.2 47.3
64 Advanced avionics 13.3 18.2 24.4 31.9 40.6 49.8
65 Aviation ordnance 16.1 21.8 28.9 37.1 46.2 55.5
68 Weather service 15.3 20.8 27.7 35.7 44.7 54.0
70 Airfield services 22.8 30.0 38.4 47.6 56.9 65.7
72 Air control/air support 13.6 18.7 25.0 32.7 41.4 50.6
73 Air traffic control and flight crews 9.2 12.9 17.7 23.8 31.2 39.8
Utilizing the predicted reenlistment rates derived from the logistical regression
model North developed cost estimates. He calculated the “bonus cost of an additional
reenlistment” for each OccField at each SRB level. The amounts calculated for
additional bonus costs ranged from just over $17,000 to nearly $207,000 per additional
14
reenlistment. Essentially, the additional bonus cost is capturing the economic rent that is
required to entice more Marines to reenlist. The higher economic rents are representative
of OccFields that began with higher initial reenlistment rates (prior to an increase in the
SRB multiple). These cost estimates can help manpower planners determine which
OccFields are the most or least cost-effective to offer an SRB.
C. DEPLOYMENT TEMPO
1. Hattiangadi, Lee, and Quester (2005)
The Assistant Commandant of the Marine Corps asked the Center for Naval
Analyses to examine the effects of deployment tempo on retention. In October 2005,
CNA published the annotated briefing: “Deployment Tempo and Retention in the Marine
Corps.” This is the first in a series of CNA studies on deployment tempo and its effects
on retention in the Marine Corps. The authors’ results were based on both statistical
analysis and input from focus groups.
The statistical analysis of their study focused on all Marines making reenlistment
decisions in fiscal year 2004. The dataset was limited to those Marines who either
reenlisted or separated during the fiscal year; regardless of their accession date,
reenlistment zone, or end of active service (EAS) date. The dataset did not include
Marines who were involuntarily separated or extended beyond fiscal year 2004. They
analyzed reenlistment rates as a function of number of days deployed. The analysis
shows that reenlistment rates drop as number of deployed days increase. The study also
finds that as deployed days increase single Marines are far less likely to reenlist than their
married counterparts. Figure 1 depicts the reenlistment rate for first-term Marines as a
function of deployed days for both single and married Marines. The study also finds that
single Marines deploy more heavily than do married Marines. In fact, for fiscal year
2004, single Marines averaged 49 more deployed days than married Marines. This issue
was also addressed in the focus groups.

15
Figure 1. FY04 FTAP Reenlistment Rates14
The second part of their analysis was based on focus groups held throughout the
Marine Corps. They conducted 26 focus groups, 13 from each coast. The focus groups
were comprised of 20 to 30 Marines of varying grades and operational elements of the
Marine Corps. Some of the key problems brought about from the focus groups were:
Individual Augment (IA) assignments.
Changing deployment dates and short time between deployments.
Lost leave.
Availability of downtime.
Lack of opportunities for off-duty education.
Single Marines chosen for quick fill deployments.
The authors made several recommendations based on their statistical analysis and
the results of the focus groups. They describe their recommendations as “things that the
Marine Corps could do to ease the stress that high deployment tempo causes.”15
14 A.U. Hattiangadi, and L.G. Lee, and A.O. Quester, “Deployment Tempo and Retention in the
Marine Corps,” Center for Naval Analyses, October 2005, 6. 15 Ibid., 25.
The
recommendations were: (1) Examine the possibilities for exchanges between heavy
deployers and nondeployers; (2) Continue to review and validate the IA process; (3)

16
Consider forward deployed education vans; and (4) Consider a wartime Regular
Reenlistment Bonus for all. Several of these recommendations have already made their
way into Marine Corps policy. For instance, in fiscal year 2007 the Marine Corps offered
an assignment incentive pay bonus of $10,000 for all enlisted Marines.16
2. Hosek, Kavanagh, and Miller (2006)
In 2006, the RAND Corporation published the study; “How Deployments Affect
Service Members.” This study focused on how more recent deployments have affected
military personnel from all branches of the armed forces. Their conceptual approach
included analyzing the economical, sociological, and psychological effects of
deployments on personnel. The authors’ results were based on focus group research and
statistical analysis of survey data.
Focus groups were conducted with both enlisted personnel and officers from each
service during the first half of 2004. There was a wide array of topics covered, ranging
from expectations of service life to deployment experiences. Deployment stress and the
many ways it can be caused was one of the key topics discussed by service members.
Even personnel who never deployed reported being stressed by deployments due to the
increased workload and work hours. This resulted from shortages of personnel who were
left behind to take care of business as usual. Even though there were many negative
facets of deployments brought up, the focus groups also provide numerous positive facets
of deploying. Two key examples of these positive aspects were increased pay and the
opportunity for increased responsibility. Additionally, there were mixed opinions as to
whether the deployment tempo would affect their reenlistment decisions.
The second part of their research was based on survey data collected by the
Defense Manpower Data Center (DMDC). Their analysis of the data “focused on stress
and the intention to stay in the military.”17
16 Marine Corps Administrative Message, Subject: MCBUL 7220 FY07 End Strength Incentive,
February 2007, 1. 17 J. Hosek, and J. Kavanagh, and L. Miller, “How Deployments Affect Servicemembers,” RAND
Corporation, 2006, 1.
The overwhelming results of the survey
analysis showed that factors which increased stress “decreased the likelihood of intention
17
to stay.”18
Based on their analysis the authors make several recommendations for policy and
future research. Policy implications include:
Some of these factors included longer than usual work days, uncertainty in
deployments, and spousal attitudes. The author’s note that these results are consistent
with those found in the focus groups.
19
Deployments should be spread widely across qualified service members and units rather than limited to repeatedly deploying the same individuals.
Military official should examine additional ways to compensate personnel who are sent on long, difficult, or dangerous deployments or are deployed frequently.
It is worth considering additional pay and recognition for nondeployed personnel who are often called upon to work longer than the usual duty-day.
It may be worthwhile to consider ways to remove the stigma, or reluctance, to seek professional counseling and, further, to consider additional training to enable service members to be more effective in counseling or supporting one another.
They also recommend further research be conducted on the issue of how deployments
affect reenlistment. They also note that: “future work should also revisit the question of
how reenlistment bonuses and special pays affect reenlistment of personnel with
extensive deployments.”20
3. Quester, Hattiangadi, and Shuford (2006)
This study, “Marine Corps Retention in the Post 9/11 Era: The Effects of
Deployment Tempo on Marines With and Without Dependents” is the second in a series
of Marine Corps-sponsored studies by the Center for Naval Analyses on deployment
tempo and retention specific to the Marine Corps. This study focused on deployment
tempo and retention for fiscal year 2004, but also looked at fiscal years 2002 and 2003.
The dataset for each fiscal year was limited to those Marines who either reenlisted or
18 Hosek, and Kavanagh, and Miller, “How Deployments Affect Servicemembers,” xix. 19 Ibid., xxi-xxiii. 20 Ibid., xxiv.

18
separated during the particular fiscal year; regardless of their accession date, reenlistment
zone, or end of active service date. The dataset did not include Marines who were
involuntarily separated or extended beyond the fiscal year being analyzed. The main
finding for first-term Marines is that both not deploying at all and being heavily deployed
resulted in lower reenlistment rates. The authors also found that single Marines are more
negatively affected by high deployment tempo than their married counterparts.
The authors analyze two key factors affecting reenlistment decisions for first-term
Marines. They first analyze the effects of number of days deployed on reenlistment rates.
Figure 2 shows the reenlistment rates for fiscal year 2004 for first-term Marines as a
function of number of days deployed in the current contract. Days deployed is defined as
“the sum of five categories of time spent away from home: operational days, exercise
days, unit training days, home station training days, and mission support temporary duty
(TDY) days.”21 As deployed days increase, the associated reenlistment rate declines.
Additionally, reenlistment rates are higher for those Marines that deploy 1-100 days
compared with those who did not deploy at all.
Figure 2. FY04 reenlistment rates for first-term (zone A) Marines, by number of days
deployed22
21 A.U. Hattiangadi, and R.W. Shuford, and A.O. Quester, “Marine Corps Retention in the Post 9/11
Era: The Effects of Deployment Tempo on Marines With and Without Dependents,” Center for Naval Analyses, January 2006, 7.
22 Ibid., 8.

19
The study next analyzes the effect of dependency status on reenlistment rates.
They look at reenlistment rates from fiscal year 1995 through 2004 and the results are
very significant. As shown in Figure 3, in each of the ten fiscal years first-term Marines
with dependents reenlist at higher rates than those without dependents. This finding also
holds true for second and third-term Marines in fiscal year 2004, although, the difference
is much smaller than for first-termers. The authors also found that deployment to a crisis
area decreased the probability of reenlistment.
Figure 3. First-term reenlistment rates for Marines, by dependency status23
In their statistical analysis (multivariate logistic regression), they find that
deployment to a crisis area reduces the probability of first-term reenlistment by
8percentage points, all else equal. This effect was fairly similar for Marines with and
without dependents. They define a crisis area as “primarily Iraq or Afghanistan.”24
Similar reenlistment models were constructed for fiscal years 2002 and 2003. For
fiscal year 2002, deployment to a crisis area actually increased the reenlistment
probability by 5 percentage points. This, however, could be due to deploying to a crisis
These results were compared to fiscal years 2002 and 2003.
23 Hattiangadi, and Shuford, and Quester, “Marine Corps Retention in the Post 9/11 Era: The Effects
of Deployment Tempo on Marines With and Without Dependents,” 13.
24 Ibid., 13.
20
area being far less common than in fiscal year 2004 (2 percent of Zone A Marines
deployed to a crisis area in fiscal year 2002 compared to 49 percent in fiscal year 2004).
For fiscal year 2003, deploying to a crisis area decreased the reenlistment probability by
16 percentage points.
The study also analyzed reenlistment and continuation patterns for career enlisted
Marines and officers. As mentioned before, those without dependents reenlisted or
continued at lower rates than did their counterparts with dependents. However, being
heavily deployed had little to no effect on the reenlistment patterns of career Marines and
had and increasing effect for the continuation of officers.
4. Quester, Hattiangadi, Lee, and Shuford (2006)
The Center for Naval Analyses study “Marine Corps Deployment Tempo and
Retention in FY05” is very similar to the previous CNA study. However, it analyzed the
deployment tempo and retention patterns specific to fiscal year 2005. The dataset was
limited to those Marines who either reenlisted or separated during the fiscal year;
regardless of their accession date, reenlistment zone, or end of active service date. The
dataset did not include Marines who were involuntarily separated or extended beyond
fiscal year 2005. For fiscal year 2005, there were several key differences in the
reenlistment patterns of first-term Marines.
Despite similar differences in reenlistment rates for Marines with and without
dependents, those Marines who were considered most heavily deployed (500+ days)
actually had increasing reenlistment rates. This increase held true for both Marines with
and without dependents. Figure 4 below shows this increase for both Marines with and
without dependents. Similar to fiscal year 2004, being heavily deployed most affects
Marines without dependents. Even with the increase for most heavily deployed Marines,
being deployed to a crisis area still negatively affected reenlistments.

21
Figure 4. FY05 first-term reenlistment rates by days deployed for Marines with and
without dependents25
Similar to 2004, deployments to a crisis area reduce reenlistment rates for first-
term Marines. This is particularly true for multiple deployments to a crisis area. As a
Marine’s number of deployments to Iraq or Afghanistan increase, the reenlistment rate
decreases. Also, Marines without dependents deployed an average of 57 more days than
did Marines with dependents. This was very similar to the results found in the 2004
CNA study. Similar to their earlier studies they conducted logistic regressions for their
statistical analysis.
Their statistical analysis consisted of logistic regressions to explain reenlistment
behavior. The major findings for first-term Marines are:
• Reenlistment probabilities for Marines with dependents increase slowly as days increase until the number of days deployed reaches 500 days. At that point, they begin to increase more rapidly.
• Reenlistment probabilities for Marines without dependents decrease slowly as days deployed increase until the number of days deployed reaches 500 days. At that point, they increase.
• For Marines both with and without dependents, reenlistment probabilities decrease as the number of deployments to Iraq or Afghanistan increase.26
25 A.U. Hattiangadi, and L.G. Lee, and A.O. Quester, “Marine Corps Deployment Tempo and
Retention in FY05,” Center for Naval Analyses, March 2006, 7. 26 A.U. Hattiangadi, and L.G. Lee, and A.O. Quester, “Marine Corps Deployment Tempo and
Retention in FY05,” Center for Naval Analyses, March 2006, 11.

22
Statistical analysis of career enlisted Marines and officers showed that both number of
days deployed and number of deployments to Iraq or Afghanistan increase the
reenlistment and continuation rates almost across the board.
5. Lien, Quester, and Shuford (forthcoming, October 2008)
The most recent Center for Naval Analyses study on deployment tempo and
retention is “Marine Corps Deployment Tempo and Retention from FY04 through
FY07.” This study takes on the same general theme as the previous two CNA studies on
deployment tempo and retention. This study analyzed reenlistment decisions for fiscal
years 2004 through 2007; however, it also did a separate analysis of fiscal year 2007.
The dataset for each fiscal year was limited to those Marines who either reenlisted or
separated during the particular fiscal year; regardless of their accession date, reenlistment
zone, or end of active service date. The dataset did not include Marines who were
involuntarily separated or extended beyond the fiscal year being analyzed. Overall
findings are comparable with the previous studies in that deployment days and number of
deployments to the Iran/Afghanistan country group reduce reenlistment rates. There are
some subtle differences, though.
The study finds that overall reenlistment rates are affected by number of
deployment days and number of deployments for first-term Marines. For the entire
period, fiscal year 2004 through 2007, there is a negative relationship between number of
days a Marine deploys and whether or not that Marine reenlists. The study also illustrates
that the share of Marines deployed, both in terms of deployed at all and specifically to the
Iran/Afghanistan country group, have increased from 2004 to 2007. In fiscal year 2004,
58 percent of first-term Marines deployed to the Iraq/Afghanistan country group at least
once. In 2007, the percentage deployed at least once rose 20 points to 78 percent.
Overall, there has been a gradual increase in the total number of deployed days
experienced by first-term Marines.
Despite the increase in overall deployment days, there have not been substantial
decreases in overall reenlistment rates. Figure 5 highlights that overall reenlistment rates
have remained quite steady. In fact, there was a rather large increase in fiscal year 2007.
This increase is highlighted by the authors in some detail.

23
Figure 5. FTAP reenlistment rates by year of decision and number of days deployed27
This study finds that the reenlistment rate for first-term Marines in fiscal year
2007 is 41.9 percent. This is a significant increase over previous years. The authors
highlight three reasons for this:
(1) In FY07 there were no longer caps on the amount of first-term Marines that could reenlist.
(2) Higher SRB amounts were offered.
(3) Recommended and eligible first-term Marines that were to reenlist in FY08 were allowed to reenlist in FY07.28
This rate, however, differs from the official Marine Corps reenlistment rate. According
to Captain Paul Bock, the Marine Corps SRB Planner, the official reenlistment rate for
fiscal year 2007 was only 31.5 percent.
29
27 D. Lien, and A. Quester, and R. Shuford, “Marine Corps Deployment Tempo and Retention from
FY04 through FY07,” Center for Naval Analyses, October 2008, 11. 28 Ibid., 9. 29 Paul Bock, e-mail to author, September 22, 2008.
This large difference is likely due to
differences in the population used. The official Marine Corps rate was derived from just
those Marines who had an end of active service date in fiscal year 2007. The CNA
reenlistment rate was derived from anyone that reenlisted in fiscal year 2007, regardless
of EAS. As with the previous studies, this study also found that Marines without
dependents were less likely to reenlist as deployments increased.
24
The statistical analysis consisted of multivariate logistic regressions very similar
to the previous studies. Logistic regressions predicted reenlistment behavior for all four
years and then just for fiscal year 2007. Some of the key findings are listed below:
Days deployed decreased the probability of reenlistment for the entire period and for just fiscal year 2007.
In all cases having dependents increased the probability of reenlistment.
Number of deployments to Iraq/Afghanistan decreased the probability for reenlistment for Marines without dependents for the entire period. However, number of deployments to Iraq/Afghanistan increased the probability of reenlistment for Marines with and without dependents for fiscal year 2007.
Statistical analysis of career Marines and officers shows that there has been little to no
effect of high deployment tempo on their reenlistment or continuation patterns. This is
consistent with the analysis provided in earlier studies.
D. CHAPTER SUMMARY
This chapter has provided a review of the current SRB model, as well as
published work on deployment tempo and how it affects retention. Several conclusions
can be made from this review:
Deployment tempo affects first-term Marine reenlistment behavior. Despite subtle changes from fiscal year to fiscal year, increased deployment leads to decreased reenlistment rates.
Increased deployment tempo more negatively affects Marines without dependents than their counterparts with dependents.
Deployment tempo has had little effect on the reenlistment behavior and continuation behavior of career Marines and officers.
This thesis builds upon the model produced by James H. North (1994) and
incorporates the effects of deployment tempo on reenlistment decisions for first-term
Marines. It also provides an easily updatable model to assist Marine Corps Manpower
Planners in shaping the force that better accounts for the increased deployment tempo
since 9/11.

25
III. DATA AND METHODOLOGY
A. DATA SOURCES
1. Total Force Data Warehouse
Two datasets were created from the Marine Corps’ Total Force Data Warehouse
(TFDW) that included background information on all enlisted Marines who made
reenlistment decisions between fiscal years 2003 and 2007, including on their
deployments. The first dataset included all reenlistment decisions. It also contained
demographic variables including gender, marital status, race, and number of dependents.
This dataset also included information on the Marine’s rank, Military Occupational
Specialty (MOS), End of Current Contract Date (ECC), and End of Active Service Date
(EAS). The second dataset received from the TFDW included information on
deployments for all Marines contained in the first dataset. These two datasets were
merged with the Bureau of Labor Statistics data and Selective Reenlistment Bonus data
as discussed below.
2. Bureau of Labor Statistics
The U.S. Bureau of Labor Statistics (BLS) warehouses current and historic labor
force and economic data. Historic national-level unemployment rates and usual weekly
earnings for 20-24 year males were retrieved from the BLS master database. The
unemployment rate/information is based on a national-level monthly average for the
period between 2002 and 2007. Similarly, the usual weekly earnings data is based on a
national-level quarterly average of the usual weekly earnings for 20-24 year old males.
These two variables are used in the reenlistment models as proxies for employment
conditions in the civilian labor market.
3. United States Marine Corps
Each fiscal year the Marine Corps publishes a MCBUL 7220 that outlines the
SRB offers by MOS for the upcoming fiscal year. These SRB offers were retrieved for
each fiscal year and merged with the TFDW dataset by MOS and fiscal year.

26
B. VARIABLE DESCRIPTIONS
The final dataset for this analysis represents pooled cross-sectional data of
enlisted first-term Marines who were “recommended and eligible” for reenlistment and
who either reenlisted or separated. Variable descriptions for each variable used in this
analysis are shown in Table 3. These descriptions represent the final merged product of
the four datasets outlined above. Key variables of interest will be discussed at greater
length in the following paragraphs.
Table 3. Descriptive Statistics for first-term Marines
Variable Name Variable Description
Variable Type Range
Dependent Variable reenlist Marine’s
reenlistment decision
Binary =1 if reenlisted; 0 otherwise
Independent Variables srb_multiple SRB offered to
eligible Marine Continuous 0-5
total_gwot_deployments Number of deployments iso OIF/OEF
Continuous 0-4
total_gwot_days_deployed Number of days deployed iso OIF/OEF
Continuous 0-798
_0_gwot_deployments No deployments iso OIF/OEF
Binary =1 if no deployments; 0 otherwise
_1_gwot_deployments 1 deployment iso OIF/OEF
Binary =1 if 1 deployment; 0 otherwise
_2_gwot_deployments 2 deployments iso OIF/OEF
Binary =1 if 2 deployments; 0 otherwise
_3_or_more_gwot_deployments 3 or more deployments iso OIF/OEF
Binary =1 if 3 or more deployments; 0 otherwise
_0_gwot_days_deployed 0 days deployed iso OIF/OEF
Binary =1 if 0 days deployed; 0 otherwise
_1_to_100_gwot_days_deployed 1-100 days deployed iso OIF/OEF
Binary =1 if 1-100 days deployed; 0 otherwise
_101_to_200_gwot_days_deployed 101-200 days deployed iso OIF/OEF
Binary =1 if 101-200 days deployed; 0 otherwise
_201_to_300_gwot_days_deployed 201-300 days deployed iso OIF/OEF
Binary =1 if 201-300 days deployed; 0 otherwise

27
_301_to_400_gwot_days_deployed 301-400 days deployed iso OIF/OEF
Binary =1 if 301-400 days deployed; 0 otherwise
_more_than_400_gwot_days_deployed More than 400 days deployed iso OIF/OEF
Binary =1 if days deployed >400; 0 otherwise
unemployment_rate National unemployment rate
Continuous 8.733-10.525
mil_civ_pay_ratio Military to civilian pay ratio
Continuous 1.0479-1.1126
FY03 Fiscal year of ECC Binary =1 if ECC is in FY03; otherwise
FY04 Fiscal year of ECC Binary =1 if ECC is in FY04; 0 otherwise
FY05 Fiscal year of ECC Binary =1 if ECC is in FY05; 0 otherwise
FY06 Fiscal year of ECC Binary =1 if ECC is in FY06; 0 otherwise
FY07 Fiscal year of ECC Binary =1 if ECC is in FY07; 0 otherwise
married Marital status Binary =1 if married; 0 otherwise
number_dependents Number of dependents
Continuous 0-10
female Sex Binary =1 if female; 0 otherwise
E3 Rank Binary =1 if E3; 0 otherwise
E4 Rank Binary =1 if E4; 0 otherwise
E5 Rank Binary =1 if E5; 0 otherwise
E6 Rank Binary =1 if E6; 0 otherwise
mos_* Military Occupational Specialty
Binary =1 if MOS indicated; 0 otherwise
*214 binary variables for each MOS. Appendix A is a MOS listing with titles.
1. Reenlistment Decisions
The reenlist variable is a binary variable that represents whether a Marine
reenlisted or separated. The dataset was restricted to only those first-term Marines who
were recommended and eligible for reenlistment. First-term Marines are defined by the
Marine Corps as those Marines having “17 months to 6 years of active Marine Corps
Service of which at least 17 months was continuous active service other than for

28
training.”30
2. Selective Reenlistment Bonuses
If a Marine reenlisted during the period, he was included in the dataset as
“1” for the reenlist variable. If a Marine did an extension, his/her End of Current
Contract (ECC) date would be changed to reflect the extension and he would be included
either later that fiscal year or in the next fiscal year, depending on the length of the
extension. If a Marine separated for an honorable condition, he/she was included in the
dataset as a “0” for the reenlist variable. If a Marine separated under non-honorable
conditions, he/she was excluded from the dataset.
The srb_multiple variable represents the Selective Reenlistment Bonus that was
offered to a Marine during his reenlistment decision process. SRBs are offered in .5
increments ranging from 0 to 5. As previously stated, SRBs are offered to Marines in
certain Military Occupational Specialties in an attempt to boost reenlistments.
3. Deployments to Operation Iraqi/Enduring Freedom
Deployment information was retrieved from the GWOT database contained in the
TFDW. A deployment (or deployed days) is defined as any time spent in support of
Operations Iraqi/Enduring Freedom (OIF/OEF). The Marine Corps tracks this
information by use of a crisis remark code in their administrative system, the Marine
Corps Total Force System (MCTFS). This data is in two forms: total number of
deployments and total number of days deployed during the Marine’s initial contract.
The variable names in the dataset for these two continuous variables are
total_gwot_deployments and total_gwot_days_deployed, respectively. Marines in the
dataset deployed anywhere from 0-4 times and the number of deployed days ranged from
0-798 days. The dataset also contains ten binary variables that were created from the two
continuous variables. There are four binary variables that account for how many
deployments the Marine participated in (0, 1, 2, and 3 or more). Additionally, there are
six binary variables that account for the deployment tempo of a Marine, measured in days
deployed (0, 1-100, 101-200, 201-300, 301-400, and more than 400).
30 Marine Corps Order 7220.24M, Subject: Selective Reenlistment Bonus Program, May 1990, 1-2.

29
This study does not include data on what is considered “normal deployments.”
Normal deployments could represent a broad range of circumstances; ranging from
Temporary Additional Duty (TAD) to non-combat related deployments with a Marine
Expeditionary Unit (MEU). There have been several studies in the past that have
concluded that these types of deployments have little to no affect on reenlistment
behavior.31
4. Economic Factors
Therefore, this analysis will only consider deployments in support of
OIF/OEF.
Economic factors that are hypothesized to affect reenlistment decisions include
unemployment rates and relative military pay. Included in the dataset are two variables
to represent these factors: unemployment_rate and mil_civ_pay_ratio. The
unemployment_rate variable represents the average national unemployment rate for 20-
24 males. This average rate was matched to each individual Marine during his
reenlistment decision fiscal year. The mil_civ_pay_ratio is a simple ratio of military to
civilian pay for each fiscal year. Military pay was calculated for each fiscal year based
on the current basic pay that an E-4 with four years of service would receive. This
amount was utilized because the vast majority of Marines making reenlistment decisions
are very close to four years of and nearly 60 percent are E-4’s. The civilian pay was
calculated as an annual average of the national-level usual weekly earnings for 20-24
year old males. For example in fiscal year 2007 an E-4 with four years of service earned
$494.63 per week compared to the usual weekly earnings for 20-24 year old males of
$472. This yields a military to civilian pay ratio of 1.04. Throughout the fiscal years in
the dataset this rate has ranged from 1.02-1.11.
Additionally, there are five dummy variables that account for the fiscal year in
which the reenlistment decision was made. Dummy variables that account for fiscal year
could also be utilized in multivariate models to control for economic conditions, as well
as other unobservable characteristics for a given fiscal year.
31 Hosek, and Kavanagh, and Miller, “How Deployments Affect Servicemembers,” xix.

30
5. Demographic Variables
Included in the dataset are four variables that depict a particular Marine’s personal
characteristics. The married variable is a binary variable that represents whether a
Marine is married or not. The variable for number of dependents (number_dependents) is
a continuous variable that represents how many dependents a Marine has; these values
ranged from 0-10. The male and female variables are dummy variables that indicate the
sex of a Marine.
6. Military Occupational Specialty
The original dataset received from the TFDW included a variable for each
Marine’s MOS. This data was coded to represent dummy variables for each MOS for
inclusion in the statistical models. There are 214 dummy variables which represent all of
the MOSs. Appendix A is a listing of the title and number of each MOS included in the
dataset
C. DESCRIPTIVE STATISTICS
Table 4 lays out the summary statistics for all variables included in the dataset.
The mean value for the dependent variable is 0.30, indicating the overall reenlistment rate
for the five-year period is right at 30 percent. The mean value (1.16) for SRB multiple
offers indicates that across all MOSs an average SRB multiple of just over one was
offered. Marines averaged just over one (1.13) deployment in support of Operations
Iraqi/Enduring Freedom. Additionally, Marines averaged 166.7 days deployed in support
of OIF/OEF. The mean unemployment rate for the five year period was 9.6 percent and
the mean military-to-civilian pay ratio was 1.08. The sample is evenly distributed among
the five fiscal years with roughly 20 percent from each fiscal year. Nearly 46 percent of
the Marines in the dataset are married. The mean number of dependents is .68. Male
Marines make up 94 percent of the dataset. The majority of Marines in the dataset are E-
4s (59 percent), while E-3s make up 10 percent, E-5s make up 30 percent, and E-6s are
less than one percent of the dataset (.002).

31
Table 4. Summary Statistics for First-Term Marines
Variable | Obs Mean Std. Dev. Dependent Variable reenlist | 105371 .303537 .4597872 Independent Variables srb_multiple | 105371 1.157429 1.328291 Total gwot_deployments | 105371 1.134325 1.060792 total_gwot~days_deployed | 105371 166.7071 163.596 _0_gwot_deployments | 105371 .3469645 .4760066 _1_gwot_deployment | 105371 .3066214 .461093 _2_gwot_deployments | 105371 .2341916 .4234945 _3_or_more_gwot_deployments | 105371 .1122225 .3156415 _0_gwot_days_deployed | 105371 .3469645 .4760066 _1_to_100_days_deployed | 105371 .0555656 .2290819 _101_to_200_days_deployed | 105371 .212345 .4089696 _201_to_300_days_deployed | 105371 .1591614 .3658283 _301_to_400_days_deployed | 105371 .1158763 .320078 more_than_400_days_deployed | 105371 .1100872 .3129999 Unemployment_rate | 105371 9.614936 .7340741 mil_civ_pay_ratio | 105371 1.08487 .0261408 FY03 | 105371 .1829346 .3866147 FY04 | 105371 .2137305 .4099407 FY05 | 105371 .2005201 .4003914 FY06 | 105371 .2019056 .4014241 FY07 | 105371 .2009092 .4006822 married | 105371 .4560743 .4980692 number_dependents | 105371 .684771 .9284723 male | 105371 .9385979 .2400675 female | 105371 .0614021 .2400675 E3 | 105371 .1015555 .3020643 E4 | 105371 .595382 .4908203 E5 | 105371 .3008228 .458618 E6 | 105371 .0022397 .0472727
1. Reenlistment Decisions
Reenlistment rates for first-terms Marines have fluctuated during the post-9/11
period. Figure 6 describes overall first-term reenlistment rates by fiscal year. These
fluctuations in reenlistment rates are hypothesized to be attributed to several factors:
Prior to the initial deployments to Iraq in fiscal year 2003 many Marines were involuntarily extended to carry out deployments.
Many Marines joined the Marine Corps to “deploy and fight.” The start of OIF could have increased esprit de corps and the desire to be a part of the war.
The authorized increase in total end-strength to 202,000 Marines.

32
A $10,000 reenlistment incentive was given to all Marines, regardless of rank or MOS, reenlisting during fiscal year 2006 and part of 2007.
0.2338
0.3430.3188
0.2988
0.3147
0.15
0.2
0.25
0.3
0.35
0.4
0.45
2003 2004 2005 2006 2007FY
Ree
nlis
tmen
t Rat
e
Figure 6. Reenlistment Rates by Fiscal Year
The data shows that reenlistment rates also vary widely by rank. As could be
expected, Marines in higher ranks reenlist at considerably higher rates than those in lower
ranks. A Marine’s motivation and desire for success is hypothesized to have a direct
impact on the rank in which he/she attains. A Marine that has a greater taste for “staying
Marine” will likely strive to attain higher physical fitness scores, higher proficiency and
conduct marks, and higher rifle qualifications, all which contribute to a Marine getting
promoted to the next rank. Figure 7 highlights the difference in reenlistment rates for
first-term Marines of different ranks. Nearly 90 percent of Marines in the dataset were
either E-4 or E-5, only 10 percent were E-3, and less than 1 percent was E-6.

33
0.1715
0.4492
0.30700.3401
0.10
0.15
0.20
0.25
0.30
0.35
0.40
0.45
0.50
E3 E4 E5 E6Rank
Ree
nlis
tmen
t Rat
e
Figure 7. Reenlistment Rates by Rank
2. Selective Reenlistment Bonus Offers
Selective Reenlistment Bonus offers have drastically increased since the onset of
the Long War. The average SRB multiple offer for fiscal year 2006 was less than 1.0,
whereas by fiscal year 2007 it had risen to nearly 2.0. This increase can be attributed to
two factors; the increase in end-strength to 202,000 Marines, and the strain of the
increased deployment tempo placed on our Marines. Figure 8 displays the average SRB
multiple offers to all first-term Marines for each fiscal year.
0 0.2 0.4 0.6 0.8 1 1.2 1.4 1.6 1.8
Average SRB Multiple Offered
FY03
FY04
FY05
FY06
FY07
Figure 8. Average SRB Offers by Fiscal Year

34
3. Marital Status
Most Marines enter the Marine Corps single; however, by the time they make
their first reenlistment decision nearly half of them (46 percent) are married. Previous
studies have highlighted the fact that married Marines reenlist at higher rates than do their
single counterparts.32
0.3796
0.2398
0.00
0.05
0.10
0.15
0.20
0.25
0.30
0.35
0.40
Married Single
This fact holds true for this study as well. Figure 9 highlights the
differences in reenlistment rates based on marital status and shows that reenlistment rates
for married Marines exceed those of single Marines by 14 percentage points (.37 vs. .23).
Figure 9. Reenlistment Rates by Marital Status
4. Economic Factors
Economic conditions have seen some variation throughout the time period being
analyzed. National unemployment rates for 20-24 year old males have ranged from a
high of 11.9 percent in July 2003 to a low of 8 percent in June 2006, with an average rate
of 9.6 percent. The military to civilian pay ratio has also seen some variation. This ratio
was at a low of 1.04 in 2007 and saw a high of 1.11 in 2006.
32 Hattiangadi, and Shuford, and Quester, “Marine Corps Retention in the Post-9/11 Era: The Effects
of Deployment Tempo on Marines With and Without Dependents,” 9-14.

35
5. Deployments to Operation Iraqi/Enduring Freedom
As a result of combat operations in Iraq and Afghanistan, Marines have been
deploying more often and for a longer duration. Figure 10 displays the percentage of
first-term Marines that deployed at least once in their first-term to either OIF or OEF.
0.3930
0.5841
0.69860.7741 0.7961
0.2
0.3
0.4
0.5
0.6
0.7
0.8
0.9
FY03 FY04 FY05 FY06 FY07Fiscal Year
Perc
ent D
eplo
yed
(1 o
r mor
e tim
es)
Figure 10. Percent of First-Term Marines Deployed to OIF/OEF
Not only has the sheer number of Marines deploying increased, but also the
amount of time, in number of days, a Marine deploys has increased significantly. Figure
11 below shows that the average number of days a Marine deployed to OIF/OEF has
risen drastically over time. In fiscal year 2003, the average number of days deployed to
OIF/OEF for all first-term Marines in the dataset was 58 days. In contrast, the average
days deployed rose to 259 in fiscal year 2007.

36
58
103
171
236259
0
50
100
150
200
250
300
Ave
rage
Day
s D
eplo
yed
FY03 FY04 FY05 FY06 FY07
Fiscal Year
Figure 11. Average Number of Deployed Days by Fiscal Year
Similar to previous studies, this study also finds that single Marines deploy more
frequently than do their married counterparts. As shown in Figure 12 below,
deployments for single Marines are longer on average by 21.6 days.
5163
94110
156
184
221
251 247269
0
50
100
150
200
250
300
FY03 FY04 FY05 FY06 FY07
Married
Single
Figure 12. Average Number of Deployed Days by Marital Status and Fiscal Year
Reenlistment rates as a function of deployed days also shows the negative impact
of deployment on reenlistment decisions. First-term Marines who did not deploy to Iraq
or Afghanistan or spend very little time deployed (1-100 days) have significantly higher
reenlistment rates than first-term Marines with more deployed time. Interestingly,
reenlistment rates for Marines who deployed 101 days or more are relatively flat as days

37
deployed increases. Figure 13 highlights reenlistment rates as a function of total days
deployed in support of OIF/OEF during a Marines initial contract.
0.35470.3319
0.2659 0.2743 0.27040.2778
0.15
0.20
0.25
0.30
0.35
0.40
0 1-100 101-200 201-300 301-400 more than400
Total Days Deployed
Ree
nlis
tmen
t Rat
e
Figure 13. Reenlistment Rates by Number of Days Deployed to OIF/OEF
6. Military Occupational Specialty Reenlistment Rates
Reenlistment rates vary widely among the different Military Occupational
Specialties. Table 5 highlights the average reenlistment rate for several high density
MOSs and MOSs with exceptionally high or low reenlistment rates over the five-year
period.

38
Table 5. Reenlistment Rates for Selected Military Occupational Specialties
MOS MOS Title Reenlistment Rate High Density MOSs
0121 Personnel Clerk 0.3780 0151 Administrative Clerk 0.4774 0311 Rifleman 0.2321 0331 Machine Gunner 0.2406 0341 Mortarman 0.2179 3043 Supply Administration and Operations Specialist 0.4182 3051 Warehouse Clerk 0.3429 0621 Field Radio Operator 0.2987 3531 Motor Vehicle Operator 0.3116 5811 Military Police 0.2868 6046 Aircraft Maintenance Administrative Specialist 0.4078
Exceptionally High Reenlistment Rate MOSs 2336 Explosive Ordnance Disposal (EOD) Technician 0.7778 4066 Small Computer Systems Specialist 0.9357 6232 Fixed Wing Aircraft Flight Mechanic, KC-130 0.7500 6335 Aircraft Electrical Systems Technician 0.9167
Exceptionally Low Reenlistment Rate MOSs 0622 Digital Wideband Transmission Equipment Operator 0.1856 0626 Fleet SATCOM Terminal Operator 0.0952 5939 Aviation Communications System Technician 0.1818 6214 Unmanned Aerial Vehicle (UAV) Mechanic 0.1591
D. METHODOLOGY
Because of the binary nature of the reenlistment decision, a logistic regression
model is specified to estimate the predictive effect of SRBs on the probability of first-
term reenlistment by MOS. Due to the model being a prediction model for probabilities,
the outcomes need to be limited to between zero and one; therefore, the functional form
must be nonlinear.
The Marine Corps is looking for an easily updatable model that can be recreated
each fiscal year, if needed. Therefore, the final model specification will only include
those independent variables that can be easily obtained or that can be estimated for each
year. This study will explore four separate logistic regression models in an attempt to get
the true effect of SRB offers on reenlistment decisions. Table 6 displays the variables
included in the four logistic regression estimates.

39
Table 6. Logistic Model Variables
Model #1 Model #2 Model #3 Model #4
reenlist reenlist reenlist reenlist
srb_multiple srb_multiple srb_multiple srb_multiple
_0_gwot_days_deployed _0_gwot_days_deployed _0_gwot_days_deployed -
_1_to_100_gwot_days_deployed _1_to_100_gwot_days_deployed _1_to_100_gwot_days_deployed -
_101_to_200_gwot_days_deployed _101_to_200_gwot_days_deployed _101_to_200_gwot_days_deployed -
_201_to_300_gwot_days_deployed _201_to_300_gwot_days_deployed _201_to_300_gwot_days_deployed -
_301_to_400_gwot_days_deployed _301_to_400_gwot_days_deployed _301_to_400_gwot_days_deployed -
_more_than_400_days_deployed _more_than_400_days_deployed _more_than_400_days_deployed -
FY04 FY04 - -
FY05 FY05 - -
FY06 FY06 - -
FY07 FY07 - -
- - unemployment_rate unemployment_rate
- - mil_civ_pay_ratio mil_civ_pay_ratio
married - - -
female - - -
E4 - - -
E5 - - -
E6 - - -
mos_* mos_* mos_* mos_*
* - All models will include all 214 dummy variables for MOS as independent variables.

40
The generic logit model specification is shown in the equation below:
1 1( /(1 )) ... k kLN P P x xα β β− = +
where P is the probability of reenlisting, and LN is the natural logarithm. The estimated
coefficients, 1β through kβ must be converted to obtain the predicted changes in
probability given the independent variables 1x through kx (called the marginal effect).

41
IV. MULTIVARIATE MODEL RESULTS
A. OVERVIEW
This chapter will present the multivariate results for the four logit regression
models that estimate the predictive effects of Selective Reenlistment Bonus (SRB) offers
on reenlistment. This chapter will present the results for the key independent variables.
Appendix B contains the complete logit regression results for all four models. The
results of the logit regressions for each model are used to determine the predicted
reenlistment rates by Military Occupational Specialty (MOS). Reenlistment rates will be
predicted for fiscal year 2008 using each of the four models.
B. MODEL #1: FULLY-SPECIFIED REENLISTMENT MODEL WITH DEPLOYMENT DATA
This model is the most fully-specified of the four logit regression models due to
the inclusion of the most explanatory control variables. The dependent variable in this
model individual reenlistment decision, measured as a binary variable (yes, no). The
explanatory variables include SRB multiple offered, deployment days served, fiscal year
dummies, marital status, gender, rank, and dummies for MOS. It is hypothesized that all
of the explanatory variables affect whether or not a Marine chooses to reenlist. There are
likely many other factors that influence a Marine’s decision to reenlist; however, in
keeping with the goal of developing a parsimonious, yet accurate, model these
characteristics were omitted from the model. The actual model specification is:
1 2 3
4 5
6 7 8 9 10
( /(1 )) _ 1 100 _ _ 101 200 __ 201 300 _ _ 301 400 _ _
_ 400 _ _ 04 05 06
LN P P srb multiple to gwot days deployed to gwotdays deployed to gwot days deployed to gwot days deployed
more than gwot days deployed FY FY FY
α β β ββ β
β β β β β
− = + + ++ + +
+ + + +
11 12 13 14 15 16
074 5 6 i i
FYmarried female E E E mosβ β β β β β
++ + + + +∑
The results of estimating this model are presented in Table 7. The primary logit
coefficient estimates are displayed along with the derivative, or marginal effects, which
were calculated at the mean reenlistment rate. Overall, the estimation model fits the data
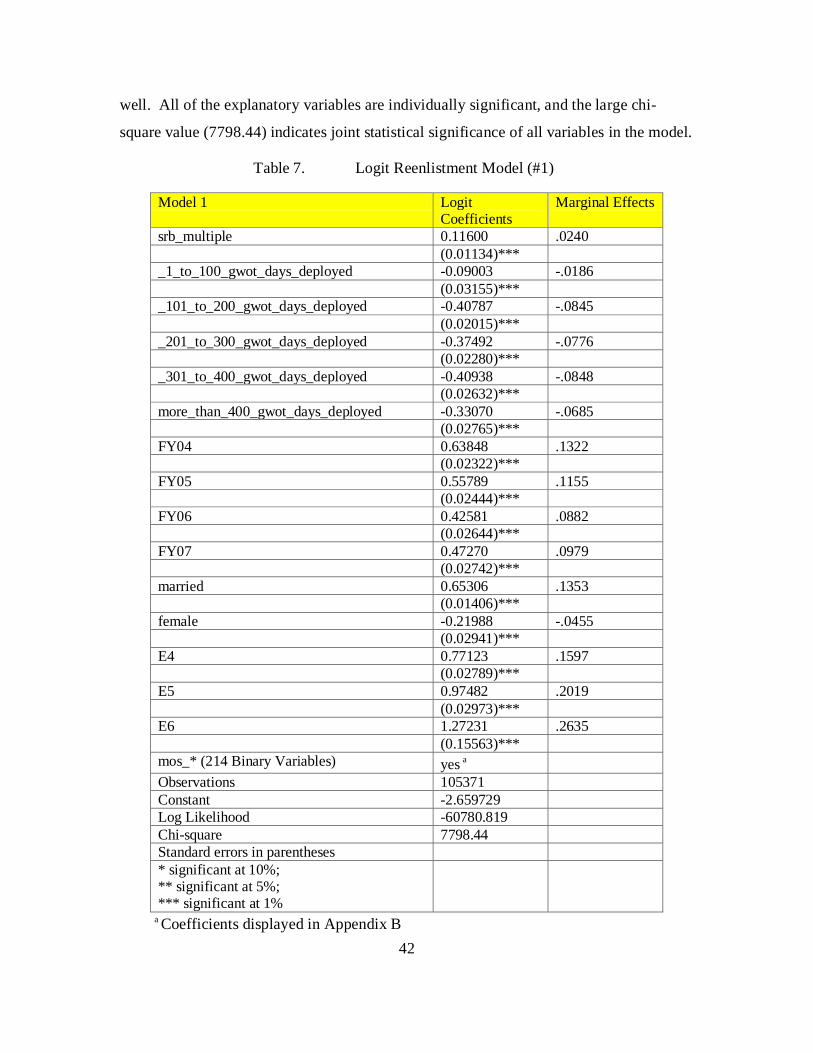
42
well. All of the explanatory variables are individually significant, and the large chi-
square value (7798.44) indicates joint statistical significance of all variables in the model.
Table 7. Logit Reenlistment Model (#1)
Model 1 Logit Coefficients
Marginal Effects
srb_multiple 0.11600 .0240 (0.01134)*** _1_to_100_gwot_days_deployed -0.09003 -.0186 (0.03155)*** _101_to_200_gwot_days_deployed -0.40787 -.0845 (0.02015)*** _201_to_300_gwot_days_deployed -0.37492 -.0776 (0.02280)*** _301_to_400_gwot_days_deployed -0.40938 -.0848 (0.02632)*** more_than_400_gwot_days_deployed -0.33070 -.0685 (0.02765)*** FY04 0.63848 .1322 (0.02322)*** FY05 0.55789 .1155 (0.02444)*** FY06 0.42581 .0882 (0.02644)*** FY07 0.47270 .0979 (0.02742)*** married 0.65306 .1353 (0.01406)*** female -0.21988 -.0455 (0.02941)*** E4 0.77123 .1597 (0.02789)*** E5 0.97482 .2019 (0.02973)*** E6 1.27231 .2635 (0.15563)*** mos_* (214 Binary Variables) yes a Observations 105371 Constant -2.659729 Log Likelihood -60780.819 Chi-square 7798.44 Standard errors in parentheses * significant at 10%; ** significant at 5%; *** significant at 1%
a Coefficients displayed in Appendix B
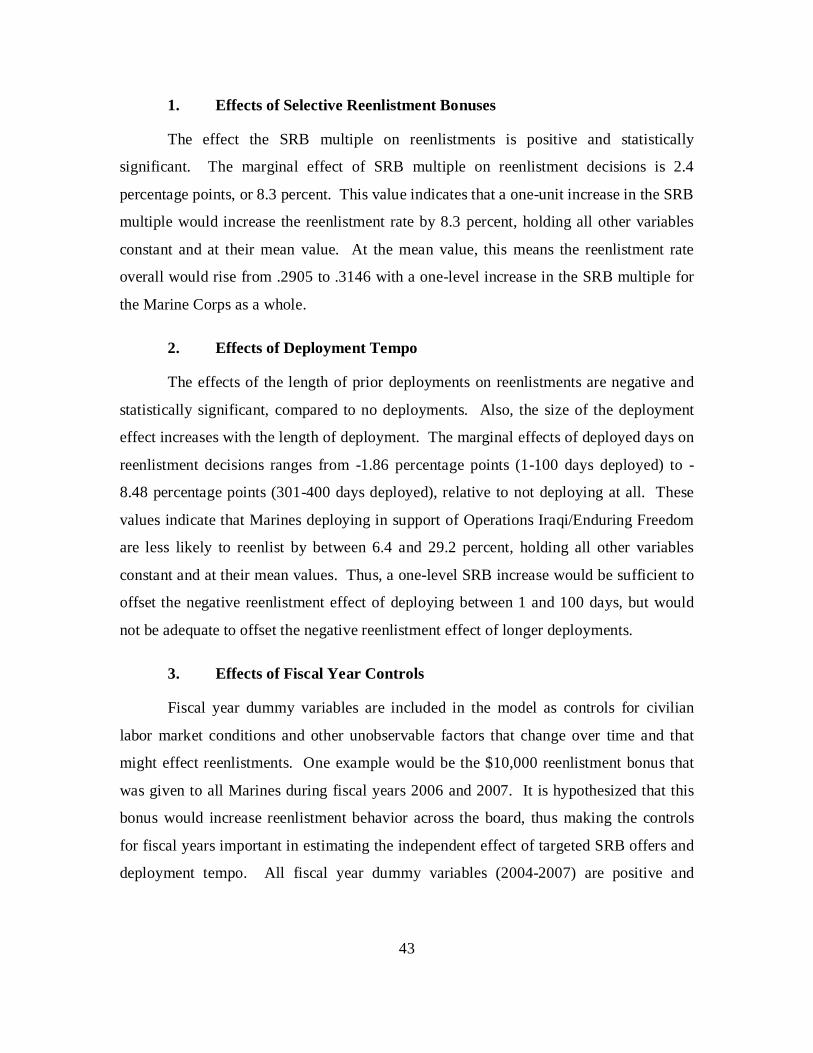
43
1. Effects of Selective Reenlistment Bonuses
The effect the SRB multiple on reenlistments is positive and statistically
significant. The marginal effect of SRB multiple on reenlistment decisions is 2.4
percentage points, or 8.3 percent. This value indicates that a one-unit increase in the SRB
multiple would increase the reenlistment rate by 8.3 percent, holding all other variables
constant and at their mean value. At the mean value, this means the reenlistment rate
overall would rise from .2905 to .3146 with a one-level increase in the SRB multiple for
the Marine Corps as a whole.
2. Effects of Deployment Tempo
The effects of the length of prior deployments on reenlistments are negative and
statistically significant, compared to no deployments. Also, the size of the deployment
effect increases with the length of deployment. The marginal effects of deployed days on
reenlistment decisions ranges from -1.86 percentage points (1-100 days deployed) to -
8.48 percentage points (301-400 days deployed), relative to not deploying at all. These
values indicate that Marines deploying in support of Operations Iraqi/Enduring Freedom
are less likely to reenlist by between 6.4 and 29.2 percent, holding all other variables
constant and at their mean values. Thus, a one-level SRB increase would be sufficient to
offset the negative reenlistment effect of deploying between 1 and 100 days, but would
not be adequate to offset the negative reenlistment effect of longer deployments.
3. Effects of Fiscal Year Controls
Fiscal year dummy variables are included in the model as controls for civilian
labor market conditions and other unobservable factors that change over time and that
might effect reenlistments. One example would be the $10,000 reenlistment bonus that
was given to all Marines during fiscal years 2006 and 2007. It is hypothesized that this
bonus would increase reenlistment behavior across the board, thus making the controls
for fiscal years important in estimating the independent effect of targeted SRB offers and
deployment tempo. All fiscal year dummy variables (2004-2007) are positive and

44
statistically significant relative to fiscal year 2003. However, the estimated coefficients
are larger for fiscal years 2004 and 2005 than for fiscal years 2006 and 2007, as would be
expected.
4. Effects of Demographic Variables
The retention effect of being married is positive and statistically significant. The
marginal effect of being of married on reenlistment decisions is 13.53 percentage points,
or 46.6 percent. This value indicates that being married increases the probability of
reenlistment by 46.6 percent, holding all other variables constant and at their mean
values. The magnitude of this effect is quite large. The effects of gender are also
statistically significant. Female Marines are 4.55 percentage points, or 15.7 percent, less
likely to reenlist than males, holding all other variables constant at their mean values.
5. Effects of Rank
The effect of rank on reenlistment decisions is statistically significant. All of the
higher ranks (E-4, E-5, and E-6) display positive marginal effects when compared to E-
3’s. As hypothesized, as a Marine gains more rank, his likelihood of reenlistment
increases. This is displayed in the marginal effects of the dummy variables for E-4, E-5,
and E6. These values indicate that first-term Marines making reenlistment decisions who
are in the grades of E-4, E-5, and E-6 are more likely to reenlist than E-3s by 15.97,
20.19, and 26.35 percentage points, respectively, all else equal. The speed of
advancement is an important prediction of retention behavior.
C. MODEL #2: REENLISTMENT MODEL WITH DEPLOYMENT DATA BUT WITHOUT RANK, GENDER, AND MARITAL STATUS
This model is very similar to the first model, except it omits marital status,
gender, and rank. These variables are omitted to examine how coefficient of the SRB
multiple changes compared to the first model. Omitting these three variables would
eliminate potentially unneeded data collection by the Marine Corps SRB Planner.
This model was developed to provide a more simplified version of Model #1,
while still controlling for key explanatory variables. The actual model specification is:

45
1 2 3
4 5
6 7 8 9 10
( /(1 )) _ 1 100 _ _ 101 200 __ 201 300 _ _ 301 400 _ _
_ 400 _ _ 04 05 06
LN P P srb multiple to gwot days deployed to gwotdays deployed to gwot days deployed to gwot days deployed
more than gwot days deployed FY FY FY
α β β ββ β
β β β β β
− = + + ++ + +
+ + + + 1107 i iFY mosβ+∑
The results of this model specification are presented in Table 8. Displayed are the
logit coefficient estimates along with the derivative, or marginal effects, which are
calculated at the mean reenlistment rate. As with Model #1, this specification fits the
data well and displays overall strong statistical significance as demonstrated by the chi-
square value of 4374.18. However, the goodness of fit is not as strong as with Model #1.

46
Table 8. Logit Reenlistment Model (#2) – Deletes Rank, Gender, and Marital Status
Model #2 Logit Coefficients
Marginal Effects
srb_multiple 0.10571 .0221 (0.01116)*** _1_to_100_gwot_days_deployed -0.06732 -.0141 (0.03099)** _101_to_200_gwot_days_deployed -0.39180 -.0821 (0.01975)*** _201_to_300_gwot_days_deployed -0.39048 -.0818 (0.02233)*** _301_to_400_gwot_days_deployed -0.41609 -.0872 (0.02578)*** more_than_400_gwot_days_deployed -0.36684 -.0769 (0.02708)*** FY04 0.61900 .1297 (0.02283)*** FY05 0.53888 .1129 (0.02401)*** FY06 0.44807 .0939 (0.02600)*** FY07 0.51853 .1086 (0.02696)*** mos_* (214 Binary Variables) yes a Observations 105371 Constant -1.638342 Log Likelihood -62492.948 Chi-square 4374.18 Standard errors in parentheses * significant at 10%; ** significant at 5%; *** significant at 1%
a Coefficients displayed in Appendix B
1. Effects of the Selective Reenlistment Bonus Multiple
The effect of SRB offers on reenlistments is positive and statistically significant
in Model #2. The marginal effect of SRB offers on reenlistment decisions is 2.21
percentage points, or 7.6 percent. The estimation results are very similar to that found in
Model #1 (2.4 percentage points), with less than one-half of a percent difference in the
marginal effect of a one-unit increase in SRB.

47
2. Effects of Deployment Tempo
The effect of deployment tempo on reenlistments is negative and statistically
significant. The marginal effects of deployed days on reenlistment decisions ranges from
-1.41 percentage points (1-100 days deployed) to -8.72 percentage points (301-400 days
deployed), relative to not deploying at all. These values indicate that Marines deploying
in support of Operations Iraqi/Enduring Freedom anywhere from 4.9 to 30.0 percent less
likely to reenlist, holding all other variables constant and at their mean value. As with
SRB offers, the marginal effects of deployment tempo for Model #2 are similar to those
found in Model #1. The differences in coefficients range from -.0045 (1-100 days
deployed) to .0084 (more than 400 days deployed).
3. Effects of Fiscal Year Controls
Similar to Model #1, fiscal year dummy variables were included in Model #2 as
controls for economic conditions and other unobservable conditions that might be present
from year to year. As was the case in Model #1, all fiscal year dummy variables (2004-
2007) are positive and statistically significant relative to fiscal year 2003. However, the
coefficient estimates are larger than in Model #1, which is likely due to the omission of
marital status, gender, and rank in Model #2.
D. MODEL #3: REENLISTMENT MODEL WITH DEPLOYMENT DATA INCLUDING NATIONAL UNEMPLOYMENT RATE AND MILITARY-CIVILIAN PAY RATIOS
Model #3 utilizes a different approach than in Models #1 or #2. Explanatory
variables for the SRB multiple, deployment tempo, and MOS are included; however,
fiscal year dummy variables are replaced with variables for the national unemployment
rate and the military-to-civilian pay ratio. Both of these variables are measured on an
annual basis. The actual model specification is:
1 2 3
4 5
6 7 8
( /(1 )) _ 1 100 _ _ 101 200 __ 201 300 _ _ 301 400 _ _
_ 400 _ _ _ _
LN P P srb multiple to gwot days deployed to gwotdays deployed to gwot days deployed to gwot days deployed
more than gwot days deployed unemploy rate mil ci
α β β ββ β
β β β
− = + + ++ + +
+ + 9_ _ i iv pay ratio mosβ+∑

48
The results of this model specification are presented in Table 9. Displayed are the
logit coefficients along with the derivative, or marginal effects, which are calculated at
the mean reenlistment rate. As was the case with the previous two models, this
estimation model also fits the data quite well. The chi-square of 3693.37 highlights the
strong statistical significance of the overall model.
Table 9. Logit Reenlistment Model (#3) – Including National Unemployment Rate and Military-Civilian Pay Ratio
Model #3 Logit Coefficients
Marginal Effects
srb_multiple 0.10218 .0215 (0.01109)*** _1_to_100_gwot_days_deployed -0.01980 -.0042 (0.03079) _101_to_200_gwot_days_deployed -0.34408 -.0722 (0.01956)*** _201_to_300_gwot_days_deployed -0.33910 -.0712 (0.02221)*** _301_to_400_gwot_days_deployed -0.37575 -.0789 (0.02572)*** more_than_400_gwot_days_deployed -0.33166 -.0696 (0.02703)*** unemployment_rate -0.09238 -.0194 (0.01193)*** mil_civ_pay_ratio 2.53602 .5325 (0.26340)*** mos_* (214 Binary Variables) yes a Observations 105371 Constant -3.090534 Log Likelihood -62833.353 Chi-square 3693.37 Standard errors in parentheses * significant at 10%; ** significant at 5%; *** significant at 1%
a Coefficients displayed in Appendix B
1. Effects of the Selective Reenlistment Bonus Multiple
The effect of the SRB multiple on reenlistments is positive and statistically
significant. The marginal effect of SRB on reenlistment decisions is 2.15 percentage

49
points, or 7.4 percent. The magnitude of the SRB effect is very similar to those found in
the two previous models, with less than a one percent difference in the size of the
marginal effect.
2. Effects of Deployment Tempo
The effect of deployment tempo on reenlistments is negative and statistically
significant for all deployment variables. The lone exception is the coefficient for
deployments of 1-100 days, which is insignificant. The marginal effects of deployed
days on reenlistment decisions ranges from -.42 percentage points (1-100 days deployed)
to -7.89 percentage points (301-400 days deployed), relative to not deploying at all.
These values indicate that Marines deploying in support of Operations Iraqi/Enduring
Freedom are less likely to reenlist by anywhere from 1.5 to 27.2 percent, holding all other
variables constant and at their mean value. However, the (1-100 days deployed) variable
is not statistically significant at any acceptable level.
3. Effects of Economic Variables
The effect of national-level unemployment rates for 20 to24-year old males on
reenlistment is negative and statistically significant. The marginal effect of
unemployment rates on reenlistment decisions is 1.94 percentage points, indicating a 1
percentage point increase in national unemployment rates decreases reenlistments by 1.94
percentage points, holding all other variables constant at their mean value. This finding
is not consistent with previous studies of reenlistment, nor with economic theory.
Several previous studies have found that higher unemployment rates are associated with
higher reenlistment rates.33
33 North, “A Cost-Effective Use of Selective Reenlistment Bonuses and Lateral Occupational Moves,”
31.
One possible explanation for the negative effect is that it is
due to the lack of variation in the national level unemployment rate for 20 to 24-year-old
males during the time period analyzed. Another explanation is that the national
unemployment rate is not a good proxy for the actual unemployment, perhaps at the local
level, that affects individuals' reenlistment decision.

50
The effect of military pay relative to civilian pay on reenlistments is positive and
statistically significant, as expected. The marginal effect of the military-to-civilian pay
ratio is .53 percentage points, indicating that a one percentage point increase in the
military-to- civilian pay ratio results in a .53 percentage point increase in reenlistments.
This finding is in line with previous studies that have found that higher levels of relative
military pay lead to higher reenlistments.34
E. MODEL #4: REENLISTMENT MODEL WITHOUT DEPLOYMENT VARIABLES
Model #4 was created to analyze the predictive ability of a model that omits
controls for prior deployment tempo. Model #4 mirrors the specification in Model #3
with the exception of the omission of controls for deployment tempo. The estimated
effects of the Selective Reenlistment Bonus multiple will be compared to those in Model
#3 to assess the need for incorporating deployment data in the overall model. The actual
model specification is:
1 2
3 4
( /(1 )) _ __ _ _ i i
LN P P srb multiple unemploy ratemil civ pay ratio mos
α β ββ β
− = + ++ +∑
The results of estimating Model #4 are presented in Table 10. Displayed are the
logit coefficients along with the derivatives, or marginal effects, which were calculated at
the mean reenlistment rate. Similar to the previous three models, this estimation model
seems to fit the data well, indicated by the chi-square value of 3199.18.
34 North, “A Cost-Effective Use of Selective Reenlistment Bonuses and Lateral Occupational Moves,” 31.

51
Table 10. Logit Reenlistment Model (#4) – Omitting Deployment Tempo
Model #4 Logit Coefficients
Marginal Effects
Reenlist srb_multiple 0.09624 .0202 (0.01100)*** unemployment_rate -0.02401 -.0051 (0.01103)** mil_civ_pay_ratio 2.14039 .4501 (0.26152)*** mos_* (214 Binary Variables) yes a Observations 105371 Constant -3.551835 Log Likelihood -63080.446 Chi-square 3199.18 Standard errors in parentheses * significant at 10%; ** significant at 5%; *** significant at 1%
a Coefficients displayed in Appendix B
1. Effects of the Selective Reenlistment Bonus Multiple
As with Model #3, the effects of the SRB multiple is positive and statistically
significant. The marginal effect of the SRB multiple on reenlistment decisions is 2.02
percentage points, or 6.95 percent. This effect is considerably smaller than those found
in previous studies.35
35 North, “A Cost-Effective Use of Selective Reenlistment Bonuses and Lateral Occupational Moves,”
28.
The North study found that the marginal effect of SRB offers on
reenlistment decisions was 7.1 percentage points, or 27.6 percent. In comparison to
Model #3, the SRB marginal effect is .13 percentage points, or .45 percent, lower. This
indicates that for a one-unit increase in SRB offers the reenlistment rate would be .45
percent lower using Model #4 vice Model #3, holding all other variables constant at their
mean value. This difference may seem small, but it is highly significant. When using
models #3 and #4 to predict reenlistment rates for a given MOS, the predicted
reenlistment rates vary by 1 to 9 percent, depending on MOS and SRB multiple. For

52
example, the predicted reenlistment rates for Ammunition Technicians (MOS 2311) at an
SRB multiple of 4 is 39 percent under Model #3 and 42 percent under Model #4. Using
the model that omits deployment data could over-predict reenlistment rates and under-
retain Marines to the desired manning levels. There is a clear difference in models when
deployment tempo is included in the estimation model.
2. Effects of Economic Variables
The effect of the 20-24 year old male national-level unemployment rate on
reenlistment continues to be negative, which is inconsistent with previous literature. The
marginal effect of unemployment rates on reenlistment decisions is -.005 percentage
points, which is consistent with the results found in Model #3. The effect of military pay
relative to civilian pay on reenlistments is positive and statistically significant. The
marginal effect of the military-to-civilian pay ratio is .45 percentage points, indicating
that a one percentage point increase in the ratio results in a .45 percentage point increase
in reenlistments. This result is similar to that found in Model #3. Previous studies of
reenlistment found the marginal effect of military-to-civilian pay to be .20 percentage
points.36
F. PREDICTION MODEL
The results from the four logit models are used to predict the probability of
reenlistment by Military Occupational Specialty for fiscal year 2008. The predicted
reenlistment probabilities are constructed using the logit coefficients and some basic
assumptions about values of the explanatory variables for fiscal year 2008. Predicted
reenlistment rates for fiscal year 2008 for several high density MOSs are presented in
Table 11. A comprehensive listing of predicted reenlistment rates for all MOSs is
contained in Appendix C. Additionally, four separate Microsoft Excel spreadsheets are
developed to assist manpower planners to calculate predicted reenlistment rates.
Screenshots from each of these models are contained in Appendix D.
36 North, “A Cost-Effective Use of Selective Reenlistment Bonuses and Lateral Occupational Moves,”
31.

53
Table 11. Predicted Fiscal Year 2008 Reenlistment Rates for High-Density MOSs
SRB Multiple of 0
Model # SRB Multiple of 1
Model # SRB Multiple of 2
Model # SRB Multiple of 3
Model # SRB Multiple of 4
Model # SRB Multiple of 5
Model #
MOS 1 2 3 4 1 2 3 4 1 2 3 4 1 2 3 4 1 2 3 4 1 2 3 4
0121 0.35 0.35 0.31 0.36 0.38 0.37 0.33 0.39 0.40 0.40 0.36 0.41 0.43 0.42 0.38 0.43 0.46 0.45 0.41 0.46 0.49 0.48 0.43 0.48
0151 0.46 0.45 0.41 0.46 0.49 0.48 0.43 0.49 0.52 0.50 0.46 0.51 0.55 0.53 0.48 0.54 0.57 0.56 0.51 0.56 0.60 0.58 0.54 0.58
0311 0.20 0.19 0.17 0.18 0.21 0.21 0.18 0.19 0.24 0.23 0.20 0.21 0.26 0.25 0.21 0.23 0.28 0.27 0.23 0.24 0.30 0.29 0.25 0.26
0331 0.20 0.20 0.18 0.19 0.22 0.22 0.19 0.20 0.24 0.24 0.21 0.22 0.26 0.26 0.22 0.24 0.28 0.28 0.24 0.25 0.31 0.30 0.26 0.27
0341 0.18 0.18 0.16 0.17 0.20 0.20 0.17 0.18 0.22 0.22 0.19 0.20 0.24 0.24 0.20 0.21 0.26 0.26 0.22 0.23 0.28 0.28 0.24 0.25
0621 0.27 0.28 0.25 0.27 0.30 0.30 0.27 0.28 0.32 0.33 0.29 0.30 0.35 0.35 0.31 0.33 0.37 0.38 0.33 0.35 0.40 0.40 0.36 0.37
3043 0.41 0.41 0.37 0.40 0.44 0.43 0.39 0.43 0.47 0.46 0.42 0.45 0.49 0.49 0.44 0.48 0.52 0.51 0.47 0.50 0.55 0.54 0.49 0.52
3051 0.35 0.34 0.30 0.33 0.37 0.36 0.32 0.35 0.40 0.39 0.34 0.37 0.43 0.41 0.37 0.40 0.46 0.44 0.39 0.42 0.49 0.47 0.42 0.44
3531 0.30 0.31 0.27 0.30 0.33 0.34 0.30 0.32 0.35 0.36 0.32 0.34 0.38 0.38 0.34 0.36 0.41 0.41 0.36 0.38 0.44 0.43 0.39 0.41
5811 0.24 0.25 0.22 0.26 0.27 0.28 0.24 0.28 0.29 0.30 0.26 0.30 0.31 0.32 0.28 0.32 0.34 0.34 0.30 0.34 0.37 0.37 0.32 0.36
6046 0.36 0.38 0.34 0.37 0.38 0.40 0.36 0.40 0.41 0.43 0.38 0.42 0.44 0.45 0.41 0.44 0.47 0.48 0.43 0.47 0.50 0.51 0.46 0.49

54
1. Model #1 and Model #2 Assumptions
In developing the predicted reenlistment rates by MOS, several assumptions are
made for the independent variables. It is hypothesized that fiscal year 2008 would be
more like fiscal year 2007 than any other fiscal year in the sample. For this reason, and
due to lack of availability of data for fiscal year 2008, the average values for fiscal year
2007 for deployed days, percent married, percent female, and rank distribution were used
to calculate the predicted reenlistment rates for fiscal year 2008. The difference between
Model #1 and Model #2 is that married, female, and rank are omitted in model #2.
Appendix D contains several screenshots from the Microsoft Excel Models which
demonstrates these assumptions.
2. Model #3 and Model #4 Assumptions
Similar assumptions to those made for Models #1 and #2 are made in constructing
the predicted reenlistment rates for Models #3 and #4. Average deployment days for
fiscal year 2007 are utilized in the prediction models. However, actual unemployment
rates for 2008 and military-to-civilian pay ratios for 20-24 year old males at the national
level are used.37
3. Fiscal Year 2008 Prediction Results
This data was obtained from the Bureau of Labor Statistics. Appendix
D contains several screenshots from the Microsoft Excel Model which demonstrate these
assumptions.
The predicted fiscal year 2008 reenlistment rates for several high density MOSs
are contained in Table 11. For each of the MOSs, the model specifications in columns 1-
4 clearly change the predicted reenlistment rate. For example, MOS 0311 (rifleman)
would have a predicted reenlistment rate of .26 with an SRB multiple of 3.0 under model
#1 compared to a rate of .23 for model #4 with the same SRB multiple. These results are
37 The Bureau of Labor Statistics, “Searchable Database,” https://data.bls.gov (accessed 20 October
2008).

55
comparable with previous studies.38
G. CHAPTER SUMMARY
The North study predicted reenlistment rates for the
Infantry occupational field to be .268 for a SRB multiple of 3.0.
This chapter has presented the multivariate results for the four logit regression
models developed to estimate the predictive effects of Selective Reenlistment Bonus
offers on reenlistment decisions. It also developed and presented predicted reenlistment
rates for fiscal year 2008 based on the four logit model specifications. The results clearly
show that SRB offers are a positive and statistically significant indicator of increased
reenlistments. Additionally, the results show that deployments to Operations
Iraqi/Enduring Freedom have a negative and statistically significant effect on
reenlistment decisions, thus should be included in any model that attempts to predict
reenlistment decisions.
38 North, “A Cost-Effective Use of Selective Reenlistment Bonuses and Lateral Occupational Moves,”
34-35.

56
THIS PAGE INTENTIONALLY LEFT BLANK

57
V. VALIDATION AND SENSITIVITY ANALYSIS
A. OVERVIEW
This chapter will validate the results of the multivariate logit models in Chapter
IV. The validation is done by estimating the logit reenlistment model using data for
fiscal years 2003 through 2006. The coefficients from this model are then used to predict
reenlistment rates by Military Occupational Specialty for fiscal year 2007 (which is the
"hold out" sample). The predicted rates for 2007 are then compared to the actual fiscal
year 2007 reenlistment rates and the percent prediction error is calculated. Model #1
from Chapter IV of this thesis was chosen to conduct the validation because it displayed
the highest predictive ability compared to the other three models.
B. VALIDATION REENLISTMENT MODEL
Model #1 was chosen for the validation exercise because it is the most fully
specified of the four logit regression models. The only difference between the validation
model and Model #1 from Chapter IV is that the validation model was estimated using
data for fiscal years 2003 through 2006 rather than the full data set for fiscal years 2003
through 2007. Fiscal year 2007 data constitutes the "hold out" sample. Deleting
observations for 2007 reduced the total observations to 84,191. The dependent variable
in this model is the binary reenlistment variable. The explanatory variables include SRB
multiple offered, deployment days, and dummies for fiscal year, marital status, gender,
rank, and MOS. As with Model #1 from Chapter IV, it is hypothesized that all of the
explanatory variables affect whether or not a Marine chooses to reenlist. The actual
model specification is:
1 2 3
4 5
6 7 8 9 10
( /(1 )) _ 1 100 _ _ 101 200 __ 201 300 _ _ 301 400 _ _
_ 400 _ _ 04 05 06
LN P P srb multiple to gwot days deployed to gwotdays deployed to gwot days deployed to gwot days deployed
more than gwot days deployed FY FY FY
α β β ββ β
β β β β β
− = + + ++ + +
+ + + +
11 12 13 14 154 5 6 i i
marriedfemale E E E mosβ β β β β+ + + + +∑
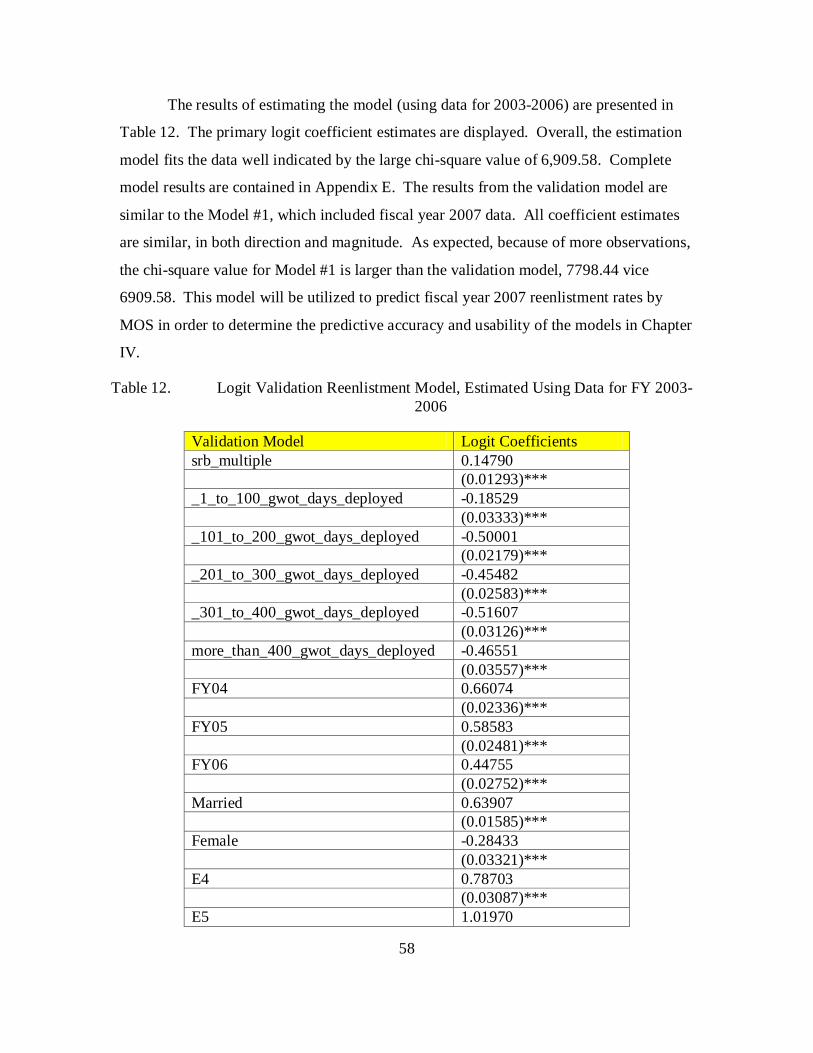
58
The results of estimating the model (using data for 2003-2006) are presented in
Table 12. The primary logit coefficient estimates are displayed. Overall, the estimation
model fits the data well indicated by the large chi-square value of 6,909.58. Complete
model results are contained in Appendix E. The results from the validation model are
similar to the Model #1, which included fiscal year 2007 data. All coefficient estimates
are similar, in both direction and magnitude. As expected, because of more observations,
the chi-square value for Model #1 is larger than the validation model, 7798.44 vice
6909.58. This model will be utilized to predict fiscal year 2007 reenlistment rates by
MOS in order to determine the predictive accuracy and usability of the models in Chapter
IV.
Table 12. Logit Validation Reenlistment Model, Estimated Using Data for FY 2003-2006
Validation Model Logit Coefficients srb_multiple 0.14790 (0.01293)*** _1_to_100_gwot_days_deployed -0.18529 (0.03333)*** _101_to_200_gwot_days_deployed -0.50001 (0.02179)*** _201_to_300_gwot_days_deployed -0.45482 (0.02583)*** _301_to_400_gwot_days_deployed -0.51607 (0.03126)*** more_than_400_gwot_days_deployed -0.46551 (0.03557)*** FY04 0.66074 (0.02336)*** FY05 0.58583 (0.02481)*** FY06 0.44755 (0.02752)*** Married 0.63907 (0.01585)*** Female -0.28433 (0.03321)*** E4 0.78703 (0.03087)*** E5 1.01970
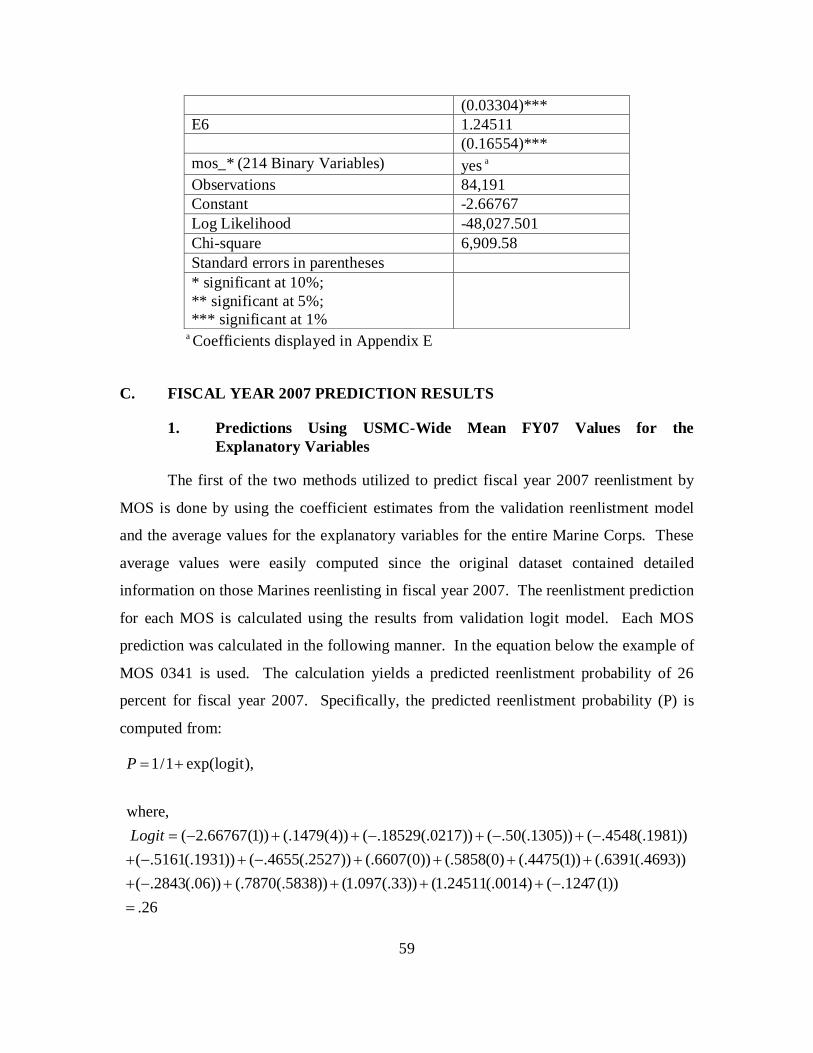
59
(0.03304)*** E6 1.24511 (0.16554)*** mos_* (214 Binary Variables) yes a Observations 84,191 Constant -2.66767 Log Likelihood -48,027.501 Chi-square 6,909.58 Standard errors in parentheses * significant at 10%; ** significant at 5%; *** significant at 1%
a Coefficients displayed in Appendix E
C. FISCAL YEAR 2007 PREDICTION RESULTS
1. Predictions Using USMC-Wide Mean FY07 Values for the Explanatory Variables
The first of the two methods utilized to predict fiscal year 2007 reenlistment by
MOS is done by using the coefficient estimates from the validation reenlistment model
and the average values for the explanatory variables for the entire Marine Corps. These
average values were easily computed since the original dataset contained detailed
information on those Marines reenlisting in fiscal year 2007. The reenlistment prediction
for each MOS is calculated using the results from validation logit model. Each MOS
prediction was calculated in the following manner. In the equation below the example of
MOS 0341 is used. The calculation yields a predicted reenlistment probability of 26
percent for fiscal year 2007. Specifically, the predicted reenlistment probability (P) is
computed from:
1/1 exp(logit),
where, ( 2.66767(1)) (.1479(4)) ( .18529(.0217)) ( .50(.1305)) ( .4548(.1981))
( .5161(.1931)) ( .4655(.2527)) (.6607(0)) (.5858(0) (.4475(1)) (.6391(.4693))( .2843(.06)) (.787
P
Logit
= +
= − + + − + − + −+ − + − + + + ++ − + 0(.5838)) (1.097(.33)) (1.24511(.0014) ( .1247(1))
.26+ + + −
=

60
Table 13 describes the mean values used for each explanatory variable ( X ), and the logit
coefficients ( β ) used to determine the predicted reenlistment probability, P (as in the
equation above).
Table 13. Prediction Values Used in USMC Average Predictions for MOS 0341
Variable Logit Coefficient (β ) Value Used ( X )
Constant -2.6676 1 in all models
SRB Multiple .1479 Actual SRB offered in FY07 for each
MOS (4.0 for MOS 0341 in the
example)
1-100 days deployed -.18529 USMC wide average for FY07 (.02168
for all MOS predictions)
101-200 days deployed -.500 USMC wide average for FY07 (.1305
for all MOS predictions)
201-300 days deployed -.4548 USMC wide average for FY07 (.1981
for all MOS predictions)
301-400 days deployed -.5161 USMC wide average for FY07 (.1931
for all MOS predictions)
>400 days deployed -.4655 USMC wide average for FY07 (.2527
for all MOS predictions)
FY06 .4475 1 For all MOS Predictions (FY07 is
more like FY06 than any other FY in the
sample39
Married .63907 USMC wide average for FY07 (.469296
for all MOS predictions)
39 An alternative method often used in forecasting models is to include a time-series variable that
captures changes over time. This method would have assigned a sequential numeric value for each FY in the sample (1 for FY03, 2 for FY04, etc.). The prediction estimation would then be computed using the next sequential number (6 for FY07 in the MOS 0341 example).

61
Female -.28433 USMC wide average for FY07 (.060 for
all MOS predictions)
E4 .787 USMC wide average for FY07 (.5838
for all MOS predictions)
E5 1.0197 USMC wide average for FY07 (.33 for
all MOS predictions)
E6 1.24511 USMC wide average for FY07 (.001 for
all MOS predictions)
MOS dummies -.1247 (for 0341) varies
by MOS
=1 for the MOS being predicted; 0 for
all others
The results from the predictions are only moderately accurate. The average
percent error for all MOSs in the sample is .32.
The average percent error is derived using the following formula:
Average Percent Error = ((predicted reenlistment rate – actual reenlistment rate) / (actual
reenlistment rate))
Appendix F contains the predicted reenlistment rates for all MOSs compared to the actual
fiscal year 2007 reenlistment rate.
Because many MOSs have a small sample size, a second method for assessing
predictive accuracy is to examine only high-density MOSs. There are 27 MOSs that this
thesis defines as high-density MOSs. These 27 MOSs make up 60.57 percent of Marines
making first term reenlistment decisions in fiscal year 2007. Additionally, individually,
each of the 27 MOSs makes up at least 1 percent of the total sample. When examining
the predictive ability of the model using these 27 MOSs, the predictions are much more
accurate based on the prediction error. Table 15 displays the prediction results and
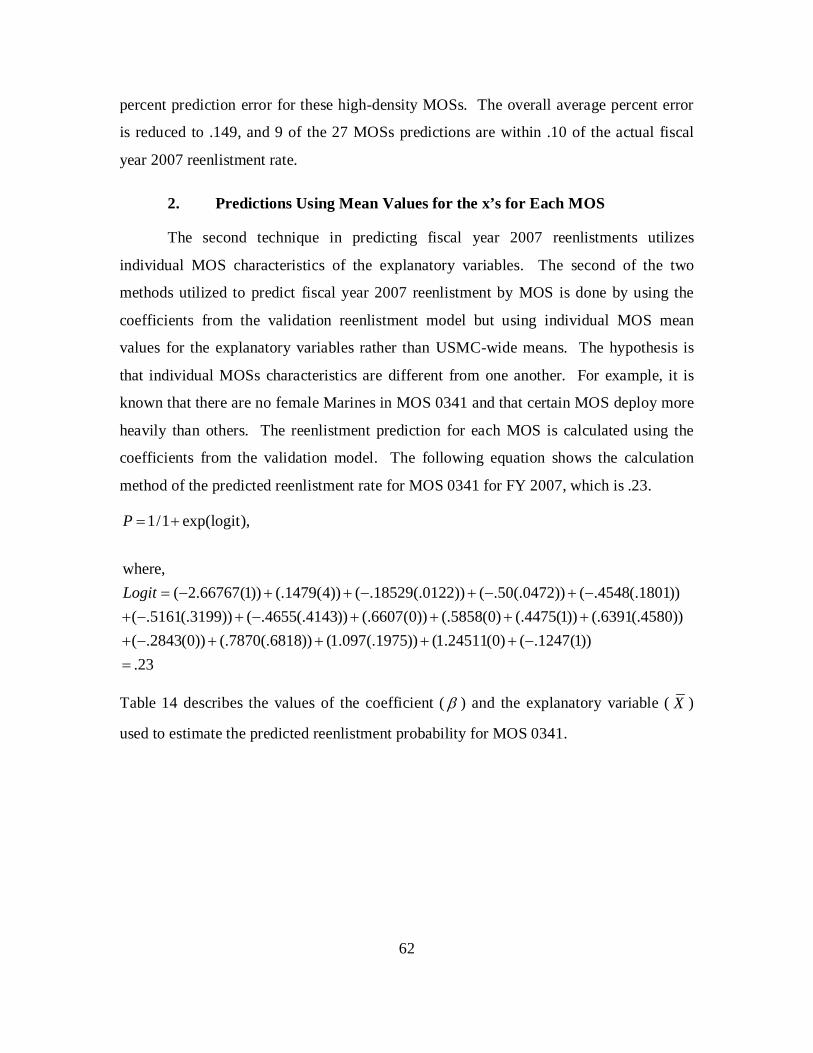
62
percent prediction error for these high-density MOSs. The overall average percent error
is reduced to .149, and 9 of the 27 MOSs predictions are within .10 of the actual fiscal
year 2007 reenlistment rate.
2. Predictions Using Mean Values for the x’s for Each MOS
The second technique in predicting fiscal year 2007 reenlistments utilizes
individual MOS characteristics of the explanatory variables. The second of the two
methods utilized to predict fiscal year 2007 reenlistment by MOS is done by using the
coefficients from the validation reenlistment model but using individual MOS mean
values for the explanatory variables rather than USMC-wide means. The hypothesis is
that individual MOSs characteristics are different from one another. For example, it is
known that there are no female Marines in MOS 0341 and that certain MOS deploy more
heavily than others. The reenlistment prediction for each MOS is calculated using the
coefficients from the validation model. The following equation shows the calculation
method of the predicted reenlistment rate for MOS 0341 for FY 2007, which is .23.
1/1 exp(logit),
where, ( 2.66767(1)) (.1479(4)) ( .18529(.0122)) ( .50(.0472)) ( .4548(.1801))
( .5161(.3199)) ( .4655(.4143)) (.6607(0)) (.5858(0) (.4475(1)) (.6391(.4580))( .2843(0)) (.7870(
P
Logit
= +
= − + + − + − + −+ − + − + + + ++ − + .6818)) (1.097(.1975)) (1.24511(0) ( .1247(1))
.23+ + + −
=
Table 14 describes the values of the coefficient ( β ) and the explanatory variable ( X )
used to estimate the predicted reenlistment probability for MOS 0341.
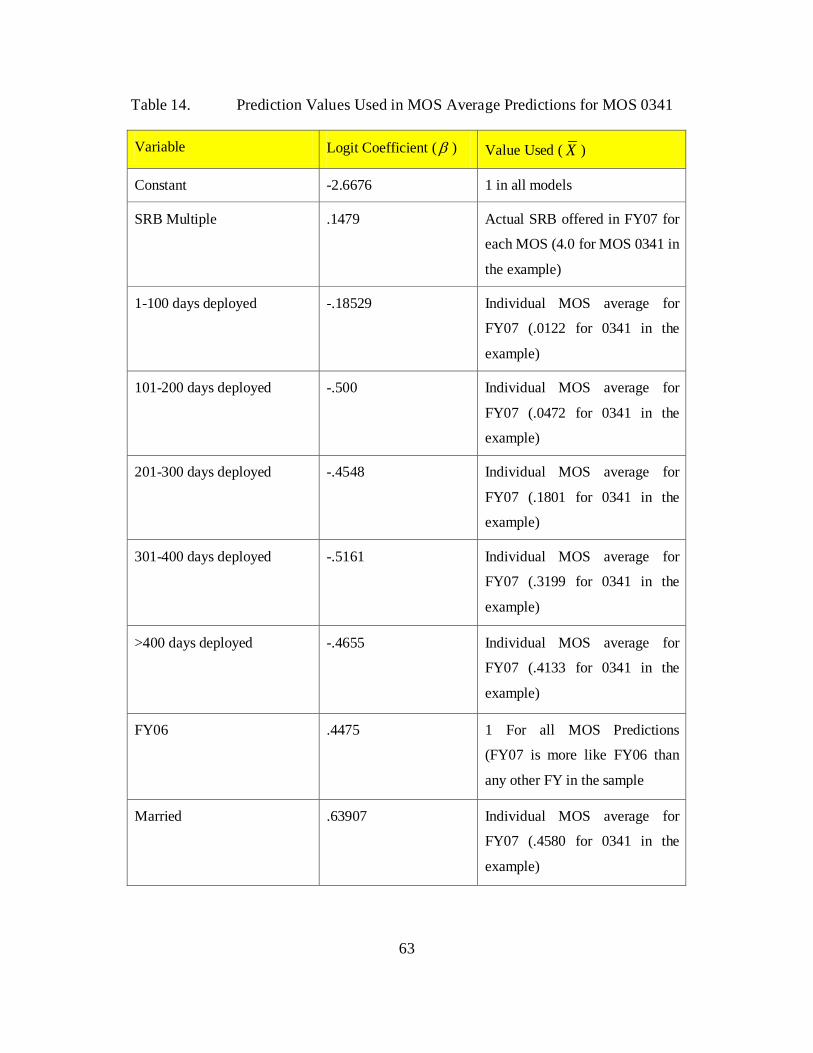
63
Table 14. Prediction Values Used in MOS Average Predictions for MOS 0341
Variable Logit Coefficient (β ) Value Used ( X )
Constant -2.6676 1 in all models
SRB Multiple .1479 Actual SRB offered in FY07 for
each MOS (4.0 for MOS 0341 in
the example)
1-100 days deployed -.18529 Individual MOS average for
FY07 (.0122 for 0341 in the
example)
101-200 days deployed -.500 Individual MOS average for
FY07 (.0472 for 0341 in the
example)
201-300 days deployed -.4548 Individual MOS average for
FY07 (.1801 for 0341 in the
example)
301-400 days deployed -.5161 Individual MOS average for
FY07 (.3199 for 0341 in the
example)
>400 days deployed -.4655 Individual MOS average for
FY07 (.4133 for 0341 in the
example)
FY06 .4475 1 For all MOS Predictions
(FY07 is more like FY06 than
any other FY in the sample
Married .63907 Individual MOS average for
FY07 (.4580 for 0341 in the
example)

64
Female -.28433 Individual MOS average for
FY07 (0 for 0341 in the
example)
E4 .787 Individual MOS average for
FY07 (.6818 for 0341 in the
example)
E5 1.0197 Individual MOS average for
FY07 (.1975 for 0341 in the
example)
E6 1.24511 Individual MOS average for
FY07 (0 for 0341 in the
example)
MOS dummies -.1247 (0341) varies by
MOS
1 for the MOS being predicted;
0 for all others
The predictive accuracy of this method is better than the first method. The
average percent prediction error for the 27 high-density MOSs is reduced from .147 in
the first method to .12. In the example for MOS 0341 the first method predicted a .26
reenlistment rate, while the second method predicted a .23 reenlistment rate. The actual
reenlistment rate for MOS 0341 in 2007 was .23, making the second method a more
accurate predictor (zero prediction error). However, 7 of the 27 MOSs were predicted
more accurately using the first method. Overall, the second method appears to be a better
predictor, at least for the 27 high-density MOSs. However, the second method is far
more labor intensive, because the planner must calculate and input the mean of the
explanatory variables for each MOS.
The prediction estimates from the two methods are presented in Tables 15 and 16.
Displayed are the predicted reenlistment rate and actual reenlistment rate for the 27 high-
density MOSs selected. Additionally, the table presents the percent prediction error for
both methods. MOSs that are under-predicted (predicted reenlistment rate is lower than

65
the actual reenlistment rate) are displayed with parentheses and are highlighted. Those
MOSs that were over-predicted (predicted reenlistment rate is higher than the actual
reenlistment rate) are displayed without parentheses and are not highlighted. Also, the
average percent error for each of the two methods is displayed. The average percent error
is calculated from the absolute value of the prediction error for each of the 27 MOSs.
Table 15. Fiscal Year 2007 Predicted Reenlistment Rates (Selected MOSs) Using USMC-Wide Values for the Explanatory Variables
MOS Predicted Reenlist Rate Actual 07 Reenlist Rate Percent Error mos_0121 0.32 0.44 (0.27) mos_0151 0.44 0.48 (0.08) mos_0311 0.28 0.24 0.19 mos_0331 0.29 0.24 0.18 mos_0341 0.26 0.23 0.11 mos_0351 0.28 0.21 0.33 mos_0621 0.27 0.33 (0.19) mos_0651 0.18 0.26 (0.31) mos_0656 0.18 0.26 (0.33) mos_0811 0.29 0.29 0.01 mos_1341 0.25 0.28 (0.12) mos_1345 0.24 0.25 (0.04) mos_1371 0.29 0.25 0.15 mos_1391 0.28 0.24 0.15 mos_1833 0.33 0.25 0.34 mos_2311 0.34 0.33 0.05 mos_3043 0.40 0.41 (0.02) mos_3051 0.32 0.38 (0.14) mos_3381 0.30 0.36 (0.16) mos_3521 0.30 0.31 (0.02) mos_3531 0.30 0.32 (0.05) mos_3533 0.24 0.29 (0.15) mos_5811 0.25 0.29 (0.13) mos_6046 0.36 0.44 (0.18) mos_6531 0.33 0.35 (0.05) mos_6672 0.43 0.53 (0.19) mos_7051 0.24 0.23 0.05
Average Percent Error 14.79%
FY07 Predictions Using FY07 USMC Mean Values for the x's

66
Table 16. Fiscal Year 2007 Predicted Reenlistment Rates (Selected MOSs) Using Individual MOS Mean Values for the Explanatory Variables
MOS Predicted Reenlist Rate Actual 07 Reenlist Rate Percent Error
mos_0121 0.36 0.44 (0.18)mos_0151 0.47 0.48 (0.02)mos_0311 0.25 0.24 0.04mos_0331 0.26 0.24 0.07mos_0341 0.23 0.23 (0.00)mos_0351 0.24 0.21 0.14mos_0621 0.26 0.33 (0.21)mos_0651 0.20 0.26 (0.23)mos_0656 0.18 0.26 (0.31)mos_0811 0.28 0.29 (0.03)mos_1341 0.24 0.28 (0.14)mos_1345 0.23 0.25 (0.07)mos_1371 0.29 0.25 0.13mos_1391 0.27 0.24 0.13mos_1833 0.32 0.25 0.30mos_2311 0.34 0.33 0.04mos_3043 0.42 0.41 0.03mos_3051 0.31 0.38 (0.16)mos_3381 0.29 0.36 (0.18)mos_3521 0.32 0.31 0.04mos_3531 0.31 0.32 (0.04)mos_3533 0.22 0.29 (0.23)mos_5811 0.27 0.29 (0.08)mos_6046 0.39 0.44 (0.12)mos_6531 0.33 0.35 (0.06)mos_6672 0.45 0.53 (0.13)mos_7051 0.26 0.23 0.14
Average Percent Error 12.00%
FY07 Predictions Using FY07 MOS Mean Values for the x's
D. VALIDATION REENLISTMENT MODEL – OMITS DEPLOYMENT VARIABLES
To further assess the usefulness of incorporating deployment variables into the
prediction model, a separate validation model was estimated (using data for FY03-FY06)
which mirrors the initial validation model, except it omits the deployment tempo
variables. The actual model specification is:
1 2 3 4 5
6 7 8 9 10
( /(1 )) _ 04 05 064 5 6 i i
LN P P srb multiple FY FY FY marriedfemale E E E mos
α β β β β ββ β β β β
− = + + + + ++ + + + +∑
Results of this model specification are listed in Table 17. Appendix G contains the
complete results.

67
Table 17. Logit Validation Model – No Deployment Variables (Data for FY03-FY06)
Validation Model – No Deployment Tempo Logit Coeeficients srb_multiple 0.14234 (0.01278)*** FY04 0.57164 (0.02296)*** FY05 0.43219 (0.02369)*** FY06 0.25996 (0.02559)*** married 0.64446 (0.01575)*** female -0.18757 (0.03282)*** E4 0.78044 (0.03076)*** E5 1.02273 (0.03293)*** E6 1.32367 (0.16440)*** mos_* (214 Binary Variables) yes a Observations 84191 Constant -2.87832 Log Likelihood 48385.01 Chi-square 6194.56 Standard errors in parentheses * significant at 10%; ** significant at 5%; *** significant at 1%
a Coefficients displayed in Appendix G
1. Predictions for FY07 Omitting Deployment Variables
The results from the validation model that omits variables for deployment tempo
are then used to predict fiscal year 2007 MOS reenlistment rates in the same manner as in
paragraphs C.1 and C.2 of this chapter—one using overall Marine Corps-wide mean
values for the explanatory variables and the other using mean values for the explanatory
variables for each MOS. Tables 18 and 19 display the prediction results for the same 27
high-density MOSs as in the previous two methods.

68
Table 18. Fiscal Year 2007 Predicted Reenlistment Rates (Selected MOSs) — Omitting Deployment Tempo Variables Using USMC-Wide Mean Values for the
Explanatory Variables
Predicted Reenlist Rate Actual 07 Reenlist Rate Percent Error
0.36 0.44 (0.19)0.48 0.48 0.000.28 0.24 0.160.28 0.24 0.140.25 0.23 0.070.27 0.21 0.300.27 0.33 (0.20)0.19 0.26 (0.25)0.19 0.26 (0.29)0.28 0.29 (0.02)0.25 0.28 (0.11)0.24 0.25 (0.07)0.28 0.25 0.110.28 0.24 0.140.32 0.25 0.270.35 0.33 0.060.41 0.41 0.020.33 0.38 (0.11)0.31 0.36 (0.14)0.30 0.31 (0.03)0.31 0.32 (0.04)0.24 0.29 (0.18)0.27 0.29 (0.05)0.37 0.44 (0.15)0.34 0.35 (0.03)0.45 0.53 (0.14)0.26 0.23 0.15
Average Percent Error 12.70%
FY07 Predictions Using FY07 Mean and no deployments
Table 19. Fiscal Year 2007 Predicted Reenlistment Rates (Selected MOSs) — Omitting Deployment Tempo Variables Using Individual MOS Mean Values for
the Explanatory Variables
Predicted Reenlist Rate Actual 07 Reenlist Rate Percent Error0.35 0.44 (0.20)0.46 0.48 (0.03)0.25 0.24 0.050.27 0.24 0.090.24 0.23 0.030.24 0.21 0.180.27 0.33 (0.18)0.20 0.26 (0.23)0.19 0.26 (0.28)0.28 0.29 (0.01)0.25 0.28 (0.12)0.24 0.25 (0.05)0.29 0.25 0.150.28 0.24 0.150.32 0.25 0.290.34 0.33 0.030.42 0.41 0.040.32 0.38 (0.14)0.31 0.36 (0.15)0.32 0.31 0.050.32 0.32 (0.02)0.22 0.29 (0.22)0.27 0.29 (0.07)0.39 0.44 (0.12)0.34 0.35 (0.02)0.46 0.53 (0.12)0.26 0.23 0.15
Average Percent Error 11.75%
FY07 Predictions Using FY07 MOS Mean and no deployments

69
Based on the overall average percent error, the results from this method appear to
be more accurate than from the validation model that includes deployment tempo
variables. However, the difference is small, especially for the prediction method that
utilizes individual MOS mean values for the explanatory variables (Table 19). The
overall average percent error is only 0.25 smaller when comparing the models without
and with deployment variables, (.1175 vice .1200). Additionally, the prediction error
varies by individual MOS. For example, when using Marine Corps-wide means for the
explanatory variables, MOS 7051 is predicted with greater accuracy using the model that
incorporates deployment variables (.05 percent error vice .15 percent error); however,
MOS 0151 is predicted with greater accuracy utilizing the model that omits deployment
variables (.00 percent error vice .08 percent error). It is clear that the accuracy of the
prediction not only depends on the model, but also on the individual MOS being
predicted.
Previous studies on retention patterns in the Navy have found similar variations in
prediction error based on model specification.40 Hansen and Wenger found that
excluding explanatory variables from their baseline model changed the level of over-
prediction, both up and down, depending on the variable(s) excluded.41 For example,
they found that by excluding race and age from their baseline model the percent error of
over-prediction changed from 2.1 in the baseline model to 0.7 in the excluded model. 42
This would appear to indicate that the model that excludes race and age is better than the
one that includes these two variables. However, Hansen and Wenger conclude that “the
pay elasticity of reenlistment is highly sensitive to the choice of empirical
specification.”43
One additional measure of the accuracy of the model specification is the
confidence interval around the prediction. Although the point prediction may vary by
40 Michael L. Hansen, and Jennie W. Wenger, “Why Do Pay Elasticity Estimates Differ?”, Center for
Naval Analyses, March 2002, 61. 41 Ibid., 60. 42 Ibid., 60. 43 Ibid., 67.

70
MOS and may be more accurate for one model vice the other, the confidence interval
around the prediction presents the “spread” around a prediction. A smaller spread
indicates a better model because the prediction error is reduced, producing a smaller
range of possible outcomes. This thesis examined the confidence interval around the
prediction for the two models— one with and one without deployment tempo variables.
The model that includes deployment tempo variables not only has larger pseudo- 2R and
chi-square values, it also has a narrower confidence interval around the prediction when
compared to the model that omits deployment variables. The combination of the higher
pseudo- 2R and chi-square values, and the narrower confidence interval around the
prediction suggest that incorporating deployment tempo variables in the estimating model
is worthwhile.
On the surface it may appear that the model that omits deployment variables is a
more accurate predictor of reenlistment, but this may not necessarily be true. It must also
be noted that the validation contained in this chapter only analyzes predictions for one
fiscal year and there could be unobservable factors that are not being accounted for in
fiscal year 2007.
E. SUMMARY
This chapter has provided an analysis of the usefulness of the models contained in
Chapter IV. Overall, the models developed are moderately accurate in predicting
reenlistment decisions for all MOSs. However, the models become far more accurate
when predicting reenlistments in what are considered high-density MOSs. The improved
accuracy is likely due to the large sample size of the high-density MOSs, which improves
statistical significance.
Table 20 displays the predicted reenlistment rate for alternate SRB multiples (0-5)
for the 27 high-density MOSs using the Validation Model that includes deployment
variables and using individual MOS mean values for the explanatory variables. The
results are comparable to the North study.44
44 North, “A Cost-Effective Use of Selective Reenlistment Bonuses and Lateral Occupational Moves,”
34.
This thesis finds that Marines in combat

71
arms MOSs have smaller predicted reenlistment rates than their counterparts in the
support MOSs, these findings are similar to those the 1994 North study.
Table 20. FY07 Predicted Reenlistment Rates (Selected MOSs) – Using Individual MOS Mean Values for the Explanatory Variables (SRB Multiples 0-5)
MOS0 1 2 3 4 5
mos_0121 0.36 0.39 0.43 0.46 0.50 0.54mos_0151 0.47 0.51 0.54 0.58 0.61 0.65mos_0311 0.15 0.17 0.20 0.22 0.25 0.28mos_0331 0.16 0.18 0.21 0.23 0.26 0.29mos_0341 0.14 0.16 0.18 0.21 0.23 0.26mos_0351 0.15 0.17 0.19 0.21 0.24 0.26mos_0621 0.24 0.26 0.29 0.33 0.36 0.39mos_0651 0.17 0.20 0.22 0.25 0.28 0.31mos_0656 0.16 0.18 0.20 0.23 0.26 0.29mos_0811 0.20 0.22 0.25 0.28 0.31 0.34mos_1341 0.24 0.27 0.30 0.33 0.37 0.40mos_1345 0.22 0.25 0.28 0.31 0.34 0.37mos_1371 0.24 0.27 0.30 0.33 0.37 0.40mos_1391 0.27 0.30 0.34 0.37 0.40 0.44mos_1833 0.25 0.28 0.31 0.34 0.37 0.41mos_2311 0.31 0.34 0.37 0.41 0.44 0.48mos_3043 0.42 0.46 0.49 0.53 0.57 0.60mos_3051 0.31 0.35 0.38 0.42 0.45 0.49mos_3381 0.29 0.33 0.36 0.39 0.43 0.47mos_3521 0.30 0.33 0.37 0.40 0.44 0.48mos_3531 0.29 0.32 0.36 0.39 0.43 0.46mos_3533 0.21 0.23 0.26 0.29 0.32 0.36mos_5811 0.24 0.27 0.29 0.33 0.36 0.39mos_6046 0.35 0.39 0.42 0.46 0.49 0.53mos_6531 0.28 0.31 0.35 0.38 0.42 0.45mos_6672 0.40 0.44 0.47 0.51 0.55 0.58mos_7051 0.25 0.28 0.31 0.34 0.37 0.41
FY07 Predicted Reenlistment Rates (Selected MOSs) - 0-5 SRB MultipleSRB Multiple

72
THIS PAGE INTENTIONALLY LEFT BLANK

73
VI. CONCLUSIONS AND RECOMMENDATIONS
A. CONCLUSIONS
This thesis developed and estimated four alternate logit models to predict
reenlistment rates for first-term Marines by Military Occupational Specialty. The goal
was to determine the effect of incorporating deployment tempo into the statistical models
on their predictive accuracy. This technique determined the effect of the Selective
Reenlistment Bonus multiple in a manner different from those in use by the Marine
Corps. The current SRB prediction model in use by Marine Corps manpower planners
does not include controls for varying levels of deployment tempo.
The results of the multivariate models clearly show that SRB multiples are a
positive and statistically significant predictor of increased reenlistments. Additionally,
the results show that high deployment tempo is a statistically significant, independent,
negative, predictor of reenlistments. This thesis also analyzed the validity and statistical
usefulness of the logit models developed. The validation results indicate that the logit
models are an accurate predictor of reenlistment decisions for high-density MOSs and are
a fairly accurate predictor of reenlistment decisions for all other MOSs.
B. THESIS RESEARCH QUESTIONS
1. How has the Increased Deployment Tempo since 9/11 Affected First-Term Enlisted Reenlistment Rates by MOS?
The results of this thesis indicate that the increased deployment tempo has had a
significant negative effect on reenlistment rates. This statement can be made due to
several results highlighted in this thesis. Despite overall reenlistments rates remaining
fairly steady over time, there are several key conclusions to be drawn from this analysis.
First, reenlistments are negatively correlated with the number of deployed days.
Reenlistment rates appear to decrease from 35 percent for Marines with zero deployed
days to 28 percent for Marines with more than 400 deployed days. To explain why
overall reenlistment rates have remained steady over time this thesis analyzed the effect
of SRB multiples as deployment tempo increased. Average days deployed to OIF/OEF

74
have steadily increased from fiscal year 2003 to fiscal year 2007. The average deployed
days in fiscal year 2003 was 55 compared to 259 days in fiscal year 2007. Additionally,
the average SRB offer has increased over this same period. The average SRB offer in
fiscal year 2003 was less than 1.0, whereas, it was nearly 2.0 in fiscal year 2007. The
Marine Corps appears to have been steadily increasing SRB offers, across all MOSs and
zones, in an attempt to offset the negative effect of increased deployment tempo on
reenlistments. This has resulted in the Marine Corps SRB budget increasing by over
$200 million in the past five years, ($58 million in FY02 vice $268 million in FY07). 45
2. Has the Increased Deployment Tempo Affected the Magnitude of the Effect of SRBs on Reenlistment Behavior?
The results of this thesis indicate that the effect of the SRB multiple on
reenlistment decisions has decreased over time. This can be highlighted by the marginal
effects of the SRB multiple developed in this thesis as compared to the results in the
earlier North study. However, the results of this thesis are nearly identical to those found
in a 2006 CNA study, which had a more similar model specification and sample data.
Table 20 displays the marginal effects of SRB multiples on reenlistment decisions from
this study compared to the 2006 CNA study46 and the North study.47
45 Paul Bock, e-mail to author, October 22, 2008. 46 Hattiangadi, and Shuford, and Quester, “Marine Corps Retention in the Post 9/11 Era: The Effects
of Deployment Tempo on Marines With and Without Dependents,” 40. 47 North, “A Cost-Effective Use of Selective Reenlistment Bonuses and Lateral Occupational Moves,”
28.
It appears that the
marginal effect of SRB offers on reenlistments has decreased. However, this difference
could also be explained by other factors. First, North excluded “restricted MOSs” from
his data sample, which reduced his sample size, and did not include all MOSs. In
contrast, this thesis and the 2006 CNA study did not exclude any MOSs from their
samples. Second, North’s model specification was different than those in this thesis, as
well as those in the 2006 CNA study. The results of this thesis are more comparable to
the 2006 CNA, which also controlled for deployment tempo. Therefore, it is highly
likely that differences in model specification, sample restrictions, and potential structural

75
changes in the reenlistment behavior of first-term Marines over time account for the
variation in the estimated effects of SRB multiples.
Table 21. Estimated Marginal Effects of SRB Multiple
Model #1 Model #2 Model #3 Model #4 CNA 200648
North
49
SRB Multiple
.024 .0221 .0215 .0202 .024 .071
3. Is There a Difference in Reenlistment Rates for Marines with and without Dependents?
The results of this thesis clearly show that there is a sizeable difference in
reenlistment rates for Marines with and without dependents. The overall reenlistment
rate for Marines with dependents is .37 compared to .23 for Marines without dependents.
This finding is comparable to results found in previous CNA studies on USMC
reenlistment.50
4. What are the Effects of Not Deploying at all on Individuals’ Reenlistment Decisions?
The adage that you “enlist the Marine and retain the family” appears to
still hold true. Additionally, Marines with dependents deploy less than Marines without
dependents. This study found that, on average, Marines without dependents deploy 21.6
more days during their first enlistment than do Marines with dependents.
This thesis finds that not deploying at actually increases reenlistments. Overall,
Marines who did not deploy reenlisted at slightly higher rates than Marines who deployed
for at least 1 day, and much higher rates than for Marines who deployed 100+ days.
Table 21 depicts the reenlistment rates for varying levels of deployment tempo.
48 Hattiangadi, and Shuford, and Quester, “Marine Corps Retention in the Post 9/11 Era: The Effects of Deployment Tempo on Marines With and Without Dependents,” 40.
49 North, “A Cost-Effective Use of Selective Reenlistment Bonuses and Lateral Occupational Moves,” 28.
50 Ibid., 11-14.

76
Table 22. Actual Reenlistment Rates by Deployed Days
Deployed Days in First-Term Reenlistment Rate 0 .354 1-100 .334 101-200 .265 201-300 .274 301-400 .270 More than 400 .277
5. Is the Prediction Model More Accurate with Deployment Variables?
The results of this thesis are not conclusive in determining if incorporating
deployment variables into the prediction model yields a more accurate model. The
validation models estimated in Chapter IV show that both models, with and without
deployment variables, had very similar results in predicting reenlistments for fiscal year
2007. However, this thesis, along with prior CNA studies, has shown that deployment
tempo is a significant factor in first-term Marines’ reenlistment decisions. Table 23
displays the average percent prediction error for each of the validation models when
predicting fiscal year 2007 reenlistment rates for the 27 high-density MOSs.
Table 23. Fiscal Year 2007 Predicted Reenlistment Rates (Selected MOSs) – Validation Models with and without Deployment Tempo Variables
With Deployment – USMC Means
Without Deployment – USMC Means
With Deployment – MOS Means
Without Deployment – MOS Means
Average Percent Error
.0147 0.127 0.12 0.117
Additionally, three other statistical measures that highlight the “worth” of a
model; the confidence interval around the prediction, pseudo- 2R , and the chi-square
value, are all improved when the estimating models include deployment tempo variables.
The combination of the higher pseudo- 2R and chi-square values, and the narrower
confidence interval around the prediction suggest that incorporating deployment tempo
variables in the estimating model is worthwhile.

77
C. RECOMMENDATIONS
1. Validation with Fiscal Year 2008 and 2009 Reenlistment Data
Although this thesis attempted to validate the prediction results, the validation
exercise was based only on one fiscal year and the results are not sufficiently strong for
the Marine Corps to change its current method for determining SRB offers. To further
determine the predictive ability of the models, it is recommended that the models in this
study be used to predict the actual reenlistment rates for fiscal year 2008, which are
currently available, and for fiscal year 2009 when they become available later this year.
By doing so, there would be a total of three years worth of validation results to ensure
that the predictive accuracy of this model is acceptable.
2. Update Model on a Fiscal Year Basis
It is also recommended that the models developed in this thesis be updated each
fiscal year with current reenlistment data. Labor economic theory suggests that the
model will remain relevant unless there have been structural changes in Marines’
behavior. Given the changing nature of the “Long War”, this study recommends that the
model be updated each fiscal year with the latest data to ensure the model is capturing
any structural changes that may occur during this period. Additionally, the volatile state
of the economy and employment conditions should have a significant impact on
reenlistment decisions in fiscal year 2008, and especially in 2009. The data needed to
update the logit models is readily available from the Total Force Data Warehouse and can
be easily coded to replicate the analysis in this thesis.
3. Incorporate Local Area Unemployment Data into the Prediction Models
This thesis attempted to add proxies for economic conditions in the form of
national-level unemployment rates; however, the results were not consistent with
previous studies, nor with economic theory. A more accurate measure of economic
conditions that might affect a Marines' decision to reenlist would be in the form of local
area unemployment rates based on a Marines' home of record. More often than not, first-
term Marines who choose not to reenlist return to their home of record; therefore, the

78
unemployment rate for that area would more accurately account for the economic
opportunities available to a particular Marine. It is recommended that further research
into first-term reenlistment decisions include local level unemployment data for a
Marines' home of record to better account for his/her particular economic opportunities.
The data needed for this analysis is readily available from the Total Force Data
Warehouse and the Bureau of Labor Statistics.

79
APPENDIX A. MILITARY OCCUPATIONAL SPECIALTY LISTING
MOS CODE MOS TITLE 0121 Personnel Clerk
0151 Administrative Clerk
0161 Postal Clerk
0193 Personnel/Administrative Chief
0211 Counterintelligence/HUMINT Specialist
0231 Intelligence Specialist
0241 Imagery Analysis Specialist
0261 Geographic Intelligence Specialist
0311 Rifleman
0313 LAV Crewman
0321 Reconnaissance Man
0331 Machine Gunner
0341 Mortarman
0351 Infantry Assaultman
0352 Anti-Tank Missileman
0369 Infantry Unit Leader
0411 Maintenance Management Specialist
0431 Logistics/Embarkation Specialist
0451 Air Delivery Specialist
0481 Landing Support Specialist
0511 MAGTF Planning Specialist
0612 Tactical Switching Operator
0613 Construction Wireman
0614 Unit Level Circuit Switch Operator
0619 Wire Chief
0621 Field Radio Operator
0622 Digital Wideband Transmission Equipment Operator
0623 Tropospheric Scatter Radio Multi-Channel Equipment Operator
0624 High Frequency Communication Central Operator
0626 Fleet SATCOM Terminal Operator
0627 SHF Satellite Communications Operator
0629 Radio Chief
0651 Data Network Specialist

80
MOS CODE MOS TITLE 0656 Tactical Network Specialist
0689 Information Assurance Technician
0811 Field Artillery Cannoneer
0842 Field Artillery Radar Operator
0844 Field Artillery Fire Control Man
0847 Artillery Meteorological Man
0861 Fire Support Man
1141 Electrician
1142 Engineer Equipment Electrical Systems Technician
1161 Refrigeration and Air Conditioning Technician
1171 Water Support Technician
1181 Fabric Repair Specialist
1316 Metal Worker
1341 Engineer Equipment Mechanic
1345 Engineer Equipment Operator
1361 Engineer Assistant
1371 Combat Engineer
1391 Bulk Fuel Specialist
1812 M1A1 Tank Crewman
1833 Assault Amphibious Vehicle (AAV) Crewman
2111 Small Arms Repairer/Technician
2131 Towed Artillery Systems Technician
2141 Assault Amphibious Vehicle (AAV) Repairer/Technician
2146 Main Battle Tank Repairer/Technician
2147 Light Armored Vehicle (LAV) Repairer/Technician
2161 Machinist
2171 Electro-Optical Ordnance Repairer
2311 Ammunition Technician
2336 Explosive Ordnance Disposal (EOD)
2621 Special Communications Signals Collection Operator
2631 Electronic Intelligence Intercept Operator
2651 Special Intelligence Systems Administrator
2671 Middle East Cryptologic Linguist
2673 Asia-Pacific Cryptologic Linguist
2674 Cryptologic Linguist I
2676 Cryptologic Linguist II

81
MOS CODE MOS TITLE 2818 Personal Computer/Tactical Office Machine Repairer
2822 Electronic Equipment Switching Technician
2823 Technical Control Chief
2831 AN/TRC-170 Technician
2834 Satellite Communications Technician
2841 Ground Radio Repairer
2844 Ground Communications Organizational Repairer
2846 Ground Intermediate Repairer
2847 Telephone Systems/Personal Computer Intermediate Repairer
2862 Electronics Maintenance Technician
2871 Calibration Technician
2874 Metrology Technician
2881 2M/ATE Technician
2887 Artillery Electronics Technician
3043 Supply Administration and Operations Specialist
3051 Warehouse Clerk
3052 Packaging Specialist
3112 Distribution Management Specialist
3381 Food Service Specialist
3432 Finance Technician
3451 Financial Management Resource Analyst
3521 Automotive Organizational Mechanic
3529 Motor Transport Maintenance Chief
3531 Motor Vehicle Operator
3533 Logistics Vehicle Systems Operator
3537 Motor Transport Operation Chief
4066 Small Computer Systems Specialist
4067 Programmer
4133 Marine Corps Community Services Marine
4341 Combat Correspondent
4421 Legal Services Specialist
4611 Combat Illustrator
4612 Combat Camera Production Specialist
4641 Combat Photographer
4671 Combat Videographer
5512 Member, “Commandants Own”, Drum and Bugle Corps

82
MOS CODE MOS TITLE 5524 Musician
5711 Chemical, Biological, Radiological, and Nuclear Defense Specialist
5811 Military Police
5821 Criminal Investigator CID Agent
5831 Correctional Specialist
5937 Aviation Radio Repairer
5939 Aviation Communications Systems Technician
5942 Aviation Radar Repairer
5952 Air Traffic Control Navigational Aids Technician
5953 Air Traffic Control Radar Technician
5954 Air Traffic Control Communications Technician
5962 Tactical Data Systems Equipment Repairer
5963 Tactical Air Operations Module Repairer
5974 Tactical Data Systems Administrator
5979 Tactical Air Operations Module/Air Defense Technician
6042 Individual Material Readiness List (IMRL) Asset Manager
6046 Aircraft Maintenance Administrative Specialist
6048 Flight Equipment Technician
6062 Aircraft Intermediate Level Hydraulic Mechanic
6072 Aircraft Maintenance Supply Equipment Mechanic
6073 Aircraft Maintenance Support Equipment Electrician
6074 Cryogenics Equipment Operator
6092 Aircraft Intermediate Level Structures Mechanic
6112 Helicopter Mechanic, CH-46
6113 Helicopter Mechanic, CH-53
6114 Helicopter Mechanic,UH/AH-1
6116 Tiltrotor Mechanic, MV-22
6122 Helicopter Power Plants Mechanic, T-400/T-700
6123 Helicopter Power Plants Mechanic, T-58
6124 Helicopter Power Plants Mechanic, T-64
6132 Helicopter/Tiltrotor Dynamic Components Mechanic
6152 Helicopter Airframe Mechanic, CH-46
6153 Helicopter Airframe Mechanic, CH-53
6154 Helicopter Airframe Mechanic, UH/AH-1
6156 Tiltrotor Airframe Mechanic, MV-22
6172 Helicopter Crew Chief, CH-46

83
MOS CODE MOS TITLE 6173 Helicopter Crew Chief, CH-53
6174 Helicopter Crew Chief, UH-1
6176 Tiltrotor Crew Chief, MV-22
6212 Fixed-Wing Aircraft Mechanic, AV-8/TAV-8
6213 Fixed-Wing Aircraft Mechanic, EA-6
6214 Unmanned Aerial Vehicle (UAV) Mechanic
6216 Fixed-Wing Aircraft Mechanic, KC-130
6217 Fixed-Wing Aircraft Mechanic, F/A-18
6222 Fixed-Wing Aircraft Power Plants Mechanic, F-402
6223 Fixed-Wing Aircraft Power Plants Mechanic, J-52
6226 Fixed-Wing Aircraft Power Plants Mechanic, T-56
6227 Fixed-Wing Aircraft Power Plants Mechanic, F-404
6232 Fixed Wing Aircraft Flight Mechanic, KC-130
6252 Fixed-Wing Aircraft Airframe Mechanic, AV-8/TAV-8
6253 Fixed-Wing Aircraft Airframe Mechanic, EA-6
6256 Fixed-Wing Aircraft Airframe Mechanic, KC-130
6257 Fixed-Wing Aircraft Airframe Mechanic, F/A-18
6276 Fixed-Wing Aircraft Crew Chief, KC-130
6282 Fixed-Wing Aircraft Safety Equipment Mechanic, AV-8/TAV-8
6283 Fixed-Wing Aircraft Safety Equipment Mechanic, EA-6
6286 Fixed-Wing Aircraft Safety Equipment Mechanic, KC-130/V-22
6287 Fixed-Wing Aircraft Safety Equipment Mechanic, F/A-18
6311 Aircraft Communications/Navigation/Electrical Systems Trainee
6312 Aircraft Communications /Navigation/Radar Technician, AV-8
6313 Aircraft Communications /Navigation/Radar Technician, EA-6
6314 Unmanned Aerial System (UAS) Avionics Technician
6316 Aircraft Communications /Navigation Systems Technician, KC-130
6317 Aircraft Communications /Navigation/Radar Technician, F/A-18
6322 Aircraft Communications /Navigation/Electrical Technician, CH-46
6323 Aircraft Communications /Navigation/Electrical Technician, CH-53
6324 Aircraft Communications /Navigation/Electrical Technician, U/AH-1
6326 Aircraft Communications /Navigation/Electrical Technician, V-22
6332 Aircraft Electrical Systems Technician, AV-8
6333 Aircraft Electrical Systems Technician, EA-6
6335 Aircraft Electrical Systems Technician
6336 Aircraft Electrical Systems Technician, KC-130

84
MOS CODE MOS TITLE 6337 Aircraft Electrical Systems Technician, F/A-18
6386 Aircraft Electronics Countermeasures Systems Technician, EA-6B
6412 Aircraft Communications System Technician
6413 Aircraft Navigation Systems Technician
6414 Advanced Aircraft Communications Systems Technician
6423 Aviation Electronic Instrument and Cable Repair Technician
6432 Aircraft Electrical Flight Control Systems Technician, Fixed-Wing
6433 Aircraft Electrical Flight Control Systems Technician, Helicopter
6461 Hybrid Test Set Technician, IMA
6462 Avionics Test Set Technician
6463 CASS HP Configuration Operator/Maintainer/Technician
6464 Aircraft Inertial Navigation System Technician
6466 CASS EO Configuration Operator/Maintainer/Technician
6467 Consolidated Automated Support System Technician
6482 Aircraft Electronics Countermeasures Systems Technician, Fixed-Wing
6483 Aircraft Electronics Countermeasures Systems Technician, Helicopter
6484 CASS EW Configuration Operator/Maintainer/Technician
6492 Aviation Precision Measurement Equipment Repair Technician
6493 Aviation Meteorological Equipment Technician
6531 Aircraft Ordnance Technician
6541 Aviation Ordnance Systems Technician
6672 Aviation Supply Specialist
6694 Aviation Logistics Information Management Specialist
6821 METOC Observer
6842 METOC Analyst Forecaster
7011 Expeditionary Airfield Systems Technician
7041 Aviation Operations Specialist
7051 Aircraft Rescue and Firefighting Specialist
7212 Low Altitude Air Defense (LAAD) Gunner
7234 Air Control Electronics Operator
7236 Tactical Air Defense Controller
7242 Air Support Operations Operator
7257 Air Traffic Controller
7314 Unmanned Aerial Vehicle (UAV) Operator
7372 Tactical Systems Operator/Mission Specialist
7382 Airborne Radio Operator/Loadmaster
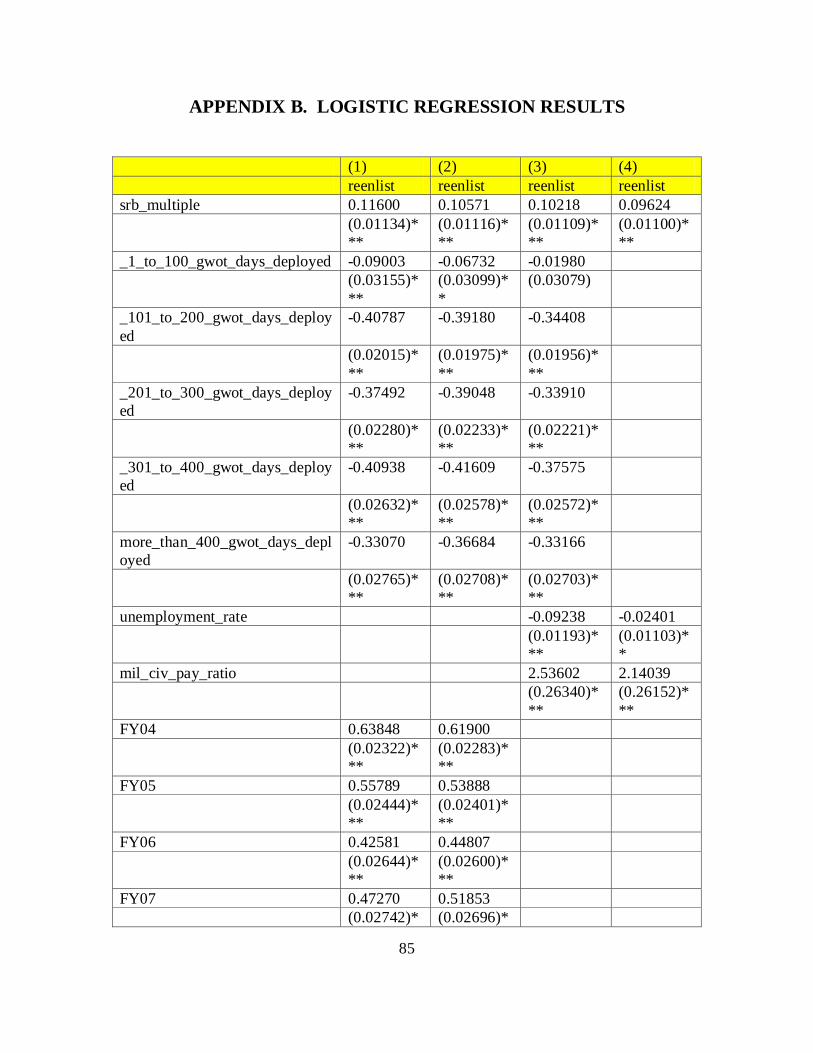
85
APPENDIX B. LOGISTIC REGRESSION RESULTS
(1) (2) (3) (4) reenlist reenlist reenlist reenlist srb_multiple 0.11600 0.10571 0.10218 0.09624 (0.01134)*
** (0.01116)***
(0.01109)***
(0.01100)***
_1_to_100_gwot_days_deployed -0.09003 -0.06732 -0.01980 (0.03155)*
** (0.03099)**
(0.03079)
_101_to_200_gwot_days_deployed
-0.40787 -0.39180 -0.34408
(0.02015)***
(0.01975)***
(0.01956)***
_201_to_300_gwot_days_deployed
-0.37492 -0.39048 -0.33910
(0.02280)***
(0.02233)***
(0.02221)***
_301_to_400_gwot_days_deployed
-0.40938 -0.41609 -0.37575
(0.02632)***
(0.02578)***
(0.02572)***
more_than_400_gwot_days_deployed
-0.33070 -0.36684 -0.33166
(0.02765)***
(0.02708)***
(0.02703)***
unemployment_rate -0.09238 -0.02401 (0.01193)*
** (0.01103)**
mil_civ_pay_ratio 2.53602 2.14039 (0.26340)*
** (0.26152)***
FY04 0.63848 0.61900 (0.02322)*
** (0.02283)***
FY05 0.55789 0.53888 (0.02444)*
** (0.02401)***
FY06 0.42581 0.44807 (0.02644)*
** (0.02600)***
FY07 0.47270 0.51853 (0.02742)* (0.02696)*

86
** ** married 0.65306 (0.01406)*
**
female -0.21988 (0.02941)*
**
E4 0.77123 (0.02789)*
**
E5 0.97482 (0.02973)*
**
E6 1.27231 (0.15563)*
**
mos_0121 0.78720 0.79965 0.82082 0.96098 (0.05585)*
** (0.05479)***
(0.05449)***
(0.05394)***
mos_0151 1.24545 1.22486 1.23814 1.36982 (0.05399)*
** (0.05292)***
(0.05264)***
(0.05214)***
mos_0161 1.21155 1.13524 1.14720 1.18014 (0.12301)*
** (0.12037)***
(0.11989)***
(0.11954)***
mos_0193 0.42307 0.95463 0.97493 1.19529 (0.79566) (0.77029) (0.76528) (0.76489) mos_0211 -0.71558 -0.33364 -0.30879 -0.26134 (0.81058) (0.80573) (0.80398) (0.80303) mos_0231 0.40778 0.53912 0.51948 0.53396 (0.08669)*
** (0.08487)***
(0.08407)***
(0.08382)***
mos_0241 1.72935 2.27775 2.27963 2.37734 (0.81148)*
* (0.80555)***
(0.80476)***
(0.80230)***
mos_0261 -0.18003 -0.12960 -0.13363 -0.11174 (0.20933) (0.20626) (0.20523) (0.20460) mos_0313 -0.08958 -0.03921 -0.03935 -0.05834 (0.09077) (0.08944) (0.08935) (0.08919) mos_0321 0.31705 0.37142 0.37935 0.35860 (0.09150)*
** (0.09013)***
(0.08980)***
(0.08954)***
mos_0331 0.01193 0.05679 0.05895 0.05050 (0.05177) (0.05097) (0.05089) (0.05082)

87
mos_0341 -0.11408 -0.07203 -0.07160 -0.07705 (0.05234)*
* (0.05155) (0.05147) (0.05140)
mos_0351 -0.06770 -0.05170 -0.04703 -0.05066 (0.06168) (0.06076) (0.06067) (0.06059) mos_0352 0.08255 0.20803 0.21467 0.19687 (0.08127) (0.07996)*
** (0.07981)***
(0.07968)**
mos_0369 -1.34214 -0.64735 -0.63402 -0.56573 (0.77680)* (0.75736) (0.75479) (0.75374) mos_0411 0.75080 0.71990 0.72134 0.77099 (0.08631)*
** (0.08438)***
(0.08407)***
(0.08379)***
mos_0431 0.87470 0.92122 0.94398 0.97593 (0.07776)*
** (0.07649)***
(0.07621)***
(0.07599)***
mos_0451 0.53088 0.45636 0.45684 0.50310 (0.18409)*
** (0.18096)**
(0.18078)**
(0.18022)***
mos_0481 0.15535 0.25399 0.24735 0.23554 (0.09581) (0.09441)*
** (0.09418)***
(0.09399)**
mos_0511 0.41546 0.42521 0.40468 0.48307 (0.17527)*
* (0.17236)**
(0.17122)**
(0.17065)***
mos_0612 0.33387 0.39903 0.39636 0.39639 (0.07281)*
** (0.07161)***
(0.07144)***
(0.07129)***
mos_0613 0.12890 0.25673 0.26887 0.38114 (0.22127) (0.21763) (0.21705) (0.21568)* mos_0614 0.10095 0.10610 0.12229 0.13029 (0.13684) (0.13495) (0.13484) (0.13448) mos_0619 1.07059 1.52352 1.46138 1.39331 (1.42007) (1.41500) (1.41516) (1.41476) mos_0621 0.42912 0.49133 0.50327 0.49949 (0.04529)*
** (0.04453)***
(0.04437)***
(0.04426)***
mos_0622 -0.10286 -0.06262 -0.06659 -0.07856 (0.10441) (0.10321) (0.10293) (0.10270) mos_0623 1.31400 1.11981 1.23976 1.51857 (1.41684) (1.41497) (1.41495) (1.41488) mos_0624 0.25093 0.44774 0.23572 0.23248 (0.66745) (0.66362) (0.66049) (0.65890) mos_0626 -0.93360 -0.92035 -0.87099 -0.85972

88
(0.75396) (0.74573) (0.74496) (0.74420) mos_0627 0.02136 0.11043 0.09490 0.08870 (0.17780) (0.17554) (0.17492) (0.17451) mos_0629 0.01553 0.69760 0.70446 0.74132 (1.23872) (1.23126) (1.22723) (1.22585) mos_0651 -0.10177 -0.06298 -0.04601 0.04092 (0.08766) (0.08653) (0.08628) (0.08596) mos_0656 -0.09000 -0.03062 -0.01047 0.04422 (0.08144) (0.08044) (0.08017) (0.07995) mos_0689 0.50105 1.09346 1.16899 1.26898 (1.51062) (1.44234) (1.43467) (1.41765) mos_0811 0.17695 0.23197 0.24133 0.23246 (0.05945)*
** (0.05846)***
(0.05832)***
(0.05816)***
mos_0842 0.32130 0.38861 0.37376 0.32988 (0.22553) (0.22282)* (0.22211)* (0.22168) mos_0844 0.42093 0.49698 0.51510 0.53243 (0.09071)*
** (0.08897)***
(0.08868)***
(0.08843)***
mos_0847 0.78489 0.89431 0.87420 0.92240 (0.27392)*
** (0.27017)***
(0.26942)***
(0.26862)***
mos_0861 0.36362 0.45389 0.46838 0.47087 (0.13548)*
** (0.13278)***
(0.13248)***
(0.13232)***
mos_1141 0.53215 0.48872 0.48577 0.50468 (0.10605)*
** (0.10376)***
(0.10338)***
(0.10314)***
mos_1142 0.52471 0.56738 0.55012 0.56494 (0.09615)*
** (0.09442)***
(0.09406)***
(0.09386)***
mos_1161 0.34059 0.34467 0.33606 0.35793 (0.13083)*
** (0.12879)***
(0.12836)***
(0.12804)***
mos_1171 0.60646 0.58876 0.58129 0.59108 (0.09229)*
** (0.09069)***
(0.09035)***
(0.09014)***
mos_1181 0.38880 0.52645 0.51683 0.57760 (0.28210) (0.27743)* (0.27674)* (0.27604)*
* mos_1316 0.35824 0.40289 0.39697 0.41375 (0.14927)*
* (0.14656)***
(0.14613)***
(0.14582)***
mos_1341 0.38260 0.45522 0.44507 0.45920

89
(0.07763)***
(0.07651)***
(0.07625)***
(0.07609)***
mos_1345 0.24882 0.30303 0.29562 0.28192 (0.07559)*
** (0.07442)***
(0.07420)***
(0.07407)***
mos_1361 0.60263 0.59007 0.59584 0.61554 (0.20224)*
** (0.19869)***
(0.19782)***
(0.19737)***
mos_1371 0.30625 0.40305 0.39962 0.37573 (0.06024)*
** (0.05939)***
(0.05922)***
(0.05906)***
mos_1391 0.46221 0.47808 0.46831 0.47630 (0.07818)*
** (0.07700)***
(0.07671)***
(0.07653)***
mos_1812 0.48209 0.57823 0.57395 0.52291 (0.11050)*
** (0.10868)***
(0.10843)***
(0.10821)***
mos_1833 0.37279 0.45495 0.46738 0.42779 (0.06618)*
** (0.06507)***
(0.06487)***
(0.06469)***
mos_2111 0.60726 0.63867 0.64863 0.71527 (0.07559)*
** (0.07427)***
(0.07396)***
(0.07369)***
mos_2131 0.33354 0.35018 0.35594 0.37580 (0.16549)*
* (0.16311)**
(0.16255)**
(0.16210)**
mos_2141 0.31075 0.48042 0.49547 0.49963 (0.09681)*
** (0.09515)***
(0.09491)***
(0.09455)***
mos_2146 0.58886 0.66120 0.65869 0.63698 (0.12882)*
** (0.12635)***
(0.12604)***
(0.12567)***
mos_2147 0.37591 0.49281 0.49181 0.48121 (0.12842)*
** (0.12629)***
(0.12597)***
(0.12569)***
mos_2161 0.27585 0.35125 0.34754 0.41885 (0.19153) (0.18819)* (0.18737)* (0.18680)*
* mos_2171 0.21134 0.32300 0.31444 0.32722 (0.13122) (0.12938)*
* (0.12892)**
(0.12863)**
mos_2311 0.67783 0.74630 0.75044 0.79139 (0.07293)*
** (0.07149)***
(0.07115)***
(0.07091)***

90
mos_2336 1.95100 2.24962 2.34621 2.32016 (0.57614)*
** (0.56860)***
(0.56918)***
(0.56795)***
mos_2621 0.42893 0.55008 0.57409 0.64252 (0.11006)*
** (0.10829)***
(0.10805)***
(0.10767)***
mos_2631 0.30208 0.43153 0.41138 0.48385 (0.21448) (0.21145)*
* (0.21040)* (0.20984)*
* mos_2651 0.31326 0.42184 0.45191 0.50027 (0.14009)*
* (0.13775)***
(0.13755)***
(0.13710)***
mos_2671 -0.44953 -0.22177 -0.20651 -0.19025 (0.18148)*
* (0.17898) (0.17851) (0.17821)
mos_2673 -0.10987 0.03727 0.05636 0.23224 (0.26681) (0.26221) (0.26114) (0.26032) mos_2674 -0.03671 0.10580 0.13022 0.24339 (0.18824) (0.18544) (0.18479) (0.18421) mos_2676 -0.03668 0.14048 0.15949 0.24612 (0.20111) (0.19811) (0.19708) (0.19655) mos_2818 4.87202 4.99901 4.89793 5.02163 (1.01868)*
** (1.01636)***
(1.01529)***
(1.01485)***
mos_2822 0.29882 0.43359 0.45916 0.58055 (0.21216) (0.20912)*
* (0.20877)**
(0.20801)***
mos_2823 0.93149 1.32053 1.28358 1.16139 (0.61325) (0.60804)*
* (0.60823)**
(0.60702)*
mos_2831 0.48018 0.54745 0.54664 0.56750 (0.17801)*
** (0.17460)***
(0.17403)***
(0.17354)***
mos_2834 0.39485 0.66818 0.67773 0.63959 (0.64287) (0.63598) (0.62923) (0.62732) mos_2841 6.22351 6.35532 6.31954 6.42117 (1.00489)*
** (1.00437)***
(1.00414)***
(1.00404)***
mos_2844 0.10585 0.26319 0.26765 0.29553 (0.08537) (0.08409)*
** (0.08388)***
(0.08361)***
mos_2846 0.05978 0.19779 0.18227 0.21600 (0.10548) (0.10397)* (0.10374)* (0.10344)*
*

91
mos_2847 -0.16267 0.04145 0.05693 0.09903 (0.10537) (0.10394) (0.10365) (0.10336) mos_2862 1.19541 1.93170 1.95712 1.98686 (0.88488) (0.86826)*
* (0.86852)**
(0.86657)**
mos_2871 -0.30226 -0.14999 -0.12580 -0.02153 (0.28948) (0.28423) (0.28315) (0.28252) mos_2874 0.44607 0.85806 0.76915 0.69648 (1.24129) (1.22572) (1.22561) (1.22539) mos_2881 0.11685 0.27393 0.25858 0.31432 (0.17012) (0.16741) (0.16703) (0.16656)* mos_2887 0.15111 0.33171 0.31357 0.36749 (0.32890) (0.32461) (0.32137) (0.32017) mos_3043 1.04324 1.04990 1.06214 1.12889 (0.05546)*
** (0.05442)***
(0.05414)***
(0.05391)***
mos_3051 0.77566 0.76010 0.76110 0.80909 (0.05942)*
** (0.05827)***
(0.05799)***
(0.05778)***
mos_3052 1.03926 1.07167 1.07033 1.14282 (0.16046)*
** (0.15707)***
(0.15630)***
(0.15592)***
mos_3112 0.86260 0.89984 0.92235 1.07327 (0.10520)*
** (0.10349)***
(0.10299)***
(0.10246)***
mos_3381 0.67139 0.70880 0.70084 0.72860 (0.06154)*
** (0.06038)***
(0.06009)***
(0.05993)***
mos_3432 1.15268 1.13881 1.15407 1.26384 (0.09007)*
** (0.08818)***
(0.08772)***
(0.08727)***
mos_3451 1.04754 1.05959 1.07995 1.24488 (0.13069)*
** (0.12786)***
(0.12710)***
(0.12654)***
mos_3521 0.52840 0.63813 0.63628 0.64473 (0.05304)*
** (0.05221)***
(0.05200)***
(0.05189)***
mos_3529 0.81403 1.56446 1.44010 1.46841 (1.01794) (1.01432) (1.00555) (1.00111) mos_3531 0.57277 0.63179 0.63571 0.65788 (0.04827)*
** (0.04750)***
(0.04731)***
(0.04717)***
mos_3533 0.31022 0.33543 0.32472 0.30919 (0.06899)* (0.06794)* (0.06774)* (0.06759)*

92
** ** ** ** mos_3537 -0.08221 0.38106 0.58307 0.79390 (1.23985) (1.22618) (1.22534) (1.22535) mos_4066 4.06224 4.05457 3.98378 4.13026 (0.34860)*
** (0.34746)***
(0.34682)***
(0.34646)***
mos_4067 0.17605 0.26784 0.33374 0.50123 (0.21224) (0.20902) (0.20799) (0.20760)*
* mos_4133 0.09115 0.70825 0.65375 0.75328 (1.29001) (1.23257) (1.22800) (1.22573) mos_4341 0.61452 0.58107 0.61400 0.75958 (0.14753)*
** (0.14485)***
(0.14416)***
(0.14354)***
mos_4421 1.00078 0.90178 0.91877 1.05352 (0.12151)*
** (0.11845)***
(0.11791)***
(0.11737)***
mos_4611 0.56321 0.49896 0.49258 0.69816 (0.32632)* (0.31726) (0.31551) (0.31498)*
* mos_4612 0.61006 0.40946 0.45435 0.57690 (0.27707)*
* (0.27088) (0.27004)* (0.26930)*
* mos_4641 0.53995 0.47335 0.47131 0.56162 (0.17853)*
** (0.17443)***
(0.17379)***
(0.17331)***
mos_4671 0.58106 0.51139 0.54581 0.66496 (0.22432)*
** (0.21962)**
(0.21833)**
(0.21772)***
mos_5512 0.51906 0.42666 0.54662 0.82542 (1.22571) (1.22562) (1.22560) (1.22552) mos_5524 0.73784 0.82966 0.85732 1.01549 (0.09849)*
** (0.09672)***
(0.09621)***
(0.09565)***
mos_5711 0.68715 0.72804 0.73693 0.78411 (0.08780)*
** (0.08630)***
(0.08603)***
(0.08572)***
mos_5811 0.28351 0.34943 0.36249 0.45413 (0.05426)*
** (0.05342)***
(0.05319)***
(0.05284)***
mos_5821 0.17852 0.90871 0.87761 0.99373 (0.94229) (0.92918) (0.92268) (0.91460) mos_5831 0.52233 0.55656 0.56966 0.78884 (0.10330)* (0.10161)* (0.10117)* (0.10044)*

93
** ** ** ** mos_5937 0.75624 0.69082 0.73042 0.75585 (0.20735)*
** (0.20357)***
(0.20251)***
(0.20182)***
mos_5939 -0.33828 -0.44068 -0.41206 -0.37719 (0.45759) (0.45297) (0.45260) (0.45198) mos_5942 0.48626 0.55201 0.51908 0.59375 (0.18493)*
** (0.18164)***
(0.18080)***
(0.18020)***
mos_5952 0.51569 0.70324 0.72011 0.75192 (0.21816)*
* (0.21453)***
(0.21347)***
(0.21268)***
mos_5953 0.24217 0.41896 0.44118 0.52691 (0.17486) (0.17205)*
* (0.17113)***
(0.17066)***
mos_5954 0.43422 0.55519 0.54832 0.60340 (0.17816)*
* (0.17557)***
(0.17479)***
(0.17427)***
mos_5962 0.17160 0.27769 0.26892 0.33767 (0.20632) (0.20245) (0.20157) (0.20111)* mos_5963 0.10080 0.29271 0.31462 0.43151 (0.30167) (0.29642) (0.29489) (0.29415) mos_5974 0.42504 0.46975 0.56329 0.63624 (0.54219) (0.53630) (0.53591) (0.53406) mos_5979 -0.33081 -0.11602 -0.15040 -0.03814 (0.50327) (0.49867) (0.49836) (0.49725) mos_6042 0.62043 0.69652 0.68847 0.75878 (0.14427)*
** (0.14181)***
(0.14126)***
(0.14083)***
mos_6046 0.82102 0.91962 0.93157 1.00338 (0.08392)*
** (0.08250)***
(0.08215)***
(0.08185)***
mos_6048 0.22142 0.40878 0.42298 0.49546 (0.10408)*
* (0.10254)***
(0.10217)***
(0.10184)***
mos_6062 0.11679 0.29848 0.28879 0.34523 (0.15655) (0.15411)* (0.15359)* (0.15319)*
* mos_6072 0.55389 0.75383 0.75469 0.82823 (0.10384)*
** (0.10212)***
(0.10173)***
(0.10139)***
mos_6073 0.39535 0.57828 0.59290 0.67858 (0.13041)*
** (0.12850)***
(0.12812)***
(0.12767)***
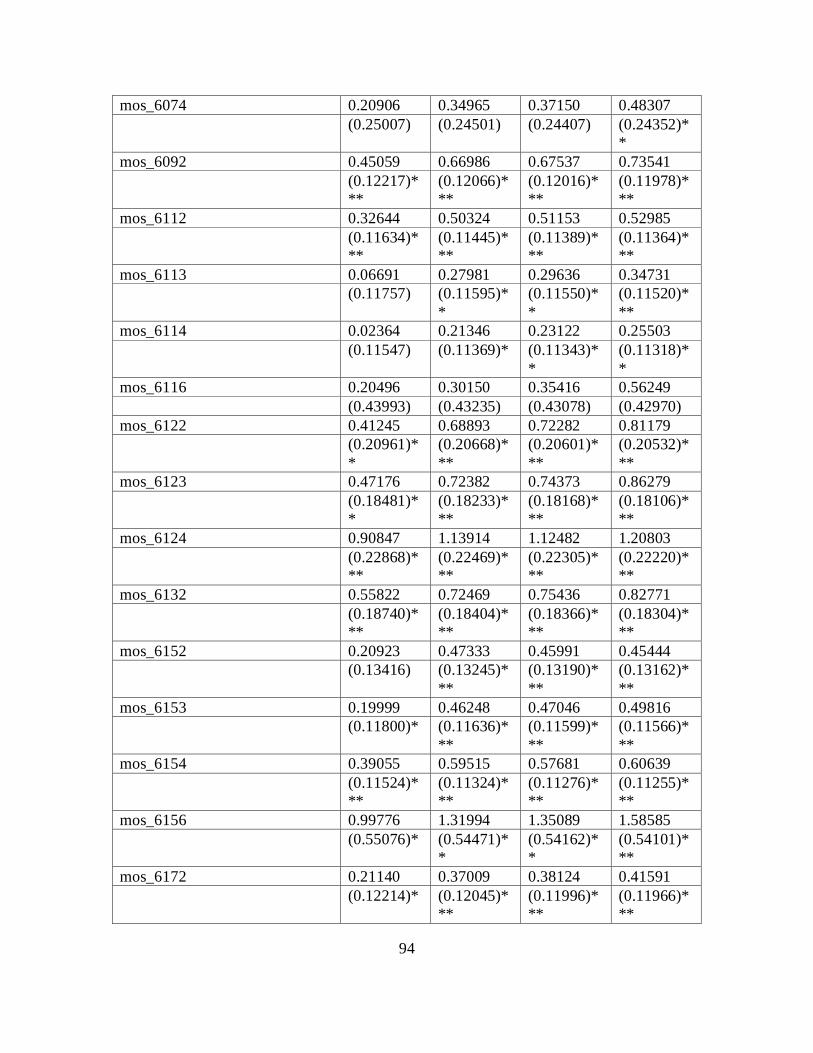
94
mos_6074 0.20906 0.34965 0.37150 0.48307 (0.25007) (0.24501) (0.24407) (0.24352)*
* mos_6092 0.45059 0.66986 0.67537 0.73541 (0.12217)*
** (0.12066)***
(0.12016)***
(0.11978)***
mos_6112 0.32644 0.50324 0.51153 0.52985 (0.11634)*
** (0.11445)***
(0.11389)***
(0.11364)***
mos_6113 0.06691 0.27981 0.29636 0.34731 (0.11757) (0.11595)*
* (0.11550)**
(0.11520)***
mos_6114 0.02364 0.21346 0.23122 0.25503 (0.11547) (0.11369)* (0.11343)*
* (0.11318)**
mos_6116 0.20496 0.30150 0.35416 0.56249 (0.43993) (0.43235) (0.43078) (0.42970) mos_6122 0.41245 0.68893 0.72282 0.81179 (0.20961)*
* (0.20668)***
(0.20601)***
(0.20532)***
mos_6123 0.47176 0.72382 0.74373 0.86279 (0.18481)*
* (0.18233)***
(0.18168)***
(0.18106)***
mos_6124 0.90847 1.13914 1.12482 1.20803 (0.22868)*
** (0.22469)***
(0.22305)***
(0.22220)***
mos_6132 0.55822 0.72469 0.75436 0.82771 (0.18740)*
** (0.18404)***
(0.18366)***
(0.18304)***
mos_6152 0.20923 0.47333 0.45991 0.45444 (0.13416) (0.13245)*
** (0.13190)***
(0.13162)***
mos_6153 0.19999 0.46248 0.47046 0.49816 (0.11800)* (0.11636)*
** (0.11599)***
(0.11566)***
mos_6154 0.39055 0.59515 0.57681 0.60639 (0.11524)*
** (0.11324)***
(0.11276)***
(0.11255)***
mos_6156 0.99776 1.31994 1.35089 1.58585 (0.55076)* (0.54471)*
* (0.54162)**
(0.54101)***
mos_6172 0.21140 0.37009 0.38124 0.41591 (0.12214)* (0.12045)*
** (0.11996)***
(0.11966)***

95
mos_6173 0.16157 0.34232 0.36744 0.41985 (0.13408) (0.13188)*
** (0.13155)***
(0.13111)***
mos_6174 0.48628 0.66800 0.70559 0.71794 (0.18049)*
** (0.17791)***
(0.17772)***
(0.17720)***
mos_6176 1.05230 1.12031 1.23120 1.53510 (0.65632) (0.64642)* (0.64620)* (0.64598)*
* mos_6212 -0.07801 0.15666 0.15513 0.16867 (0.15045) (0.14866) (0.14823) (0.14786) mos_6213 -0.10280 0.15695 0.16564 0.22301 (0.36761) (0.36478) (0.36440) (0.36379) mos_6214 -0.24386 -0.12096 -0.15741 -0.20584 (0.42092) (0.41593) (0.41595) (0.41535) mos_6216 0.30281 0.48673 0.52928 0.64372 (0.20573) (0.20286)*
* (0.20261)***
(0.20183)***
mos_6217 0.15273 0.40982 0.41908 0.51105 (0.12276) (0.12055)*
** (0.12006)***
(0.11962)***
mos_6222 0.20999 0.56942 0.60071 0.71096 (0.24407) (0.24062)*
* (0.23992)**
(0.23913)***
mos_6223 -0.15742 0.15829 0.19794 0.36611 (0.39527) (0.39125) (0.39089) (0.39015) mos_6226 0.24358 0.52435 0.55465 0.71246 (0.27345) (0.27002)* (0.26921)*
* (0.26850)***
mos_6227 0.71892 0.88313 0.91299 1.05172 (0.20394)*
** (0.19972)***
(0.19876)***
(0.19804)***
mos_6232 2.67872 2.68968 2.45503 2.57610 (0.82159)*
** (0.81893)***
(0.81803)***
(0.81766)***
mos_6252 -0.00665 0.26862 0.27904 0.29129 (0.16101) (0.15871)* (0.15829)* (0.15792)* mos_6253 0.11242 0.35080 0.33670 0.42598 (0.32365) (0.31902) (0.31855) (0.31759) mos_6256 0.62057 0.83784 0.86641 0.95677 (0.18783)*
** (0.18501)***
(0.18483)***
(0.18404)***
mos_6257 -0.02638 0.19644 0.21000 0.30931 (0.15083) (0.14891) (0.14843) (0.14796)*

96
* mos_6276 -0.29467 -0.08390 -0.03511 0.06147 (0.21586) (0.21280) (0.21234) (0.21164) mos_6282 0.03409 0.27995 0.31559 0.32266 (0.28645) (0.28349) (0.28304) (0.28221) mos_6283 0.71486 0.91669 0.89507 0.96237 (0.42974)* (0.42388)*
* (0.42221)**
(0.42165)**
mos_6286 0.39045 0.51445 0.51189 0.56151 (0.41197) (0.40391) (0.40196) (0.39995) mos_6287 0.36633 0.56663 0.58885 0.68159 (0.23946) (0.23485)*
* (0.23413)**
(0.23351)***
mos_6311 3.90144 3.87164 3.89067 3.98419 (0.74326)*
** (0.73705)***
(0.73673)***
(0.73592)***
mos_6312 -0.12859 0.02356 0.02981 0.07331 (0.20011) (0.19738) (0.19689) (0.19641) mos_6313 0.45417 0.56162 0.60154 0.70716 (0.29483) (0.28851)* (0.28824)*
* (0.28762)**
mos_6314 -0.06454 0.05702 0.05756 0.01057 (0.43997) (0.43236) (0.43080) (0.43048) mos_6316 0.66821 0.76897 0.80711 0.90059 (0.24960)*
** (0.24506)***
(0.24429)***
(0.24333)***
mos_6317 0.68562 0.77508 0.80022 0.91093 (0.13807)*
** (0.13550)***
(0.13470)***
(0.13421)***
mos_6322 0.56553 0.65938 0.66481 0.68535 (0.13144)*
** (0.12924)***
(0.12863)***
(0.12832)***
mos_6323 0.47239 0.65794 0.68317 0.73407 (0.10913)*
** (0.10736)***
(0.10709)***
(0.10675)***
mos_6324 0.55733 0.70155 0.70642 0.72395 (0.10953)*
** (0.10779)***
(0.10739)***
(0.10715)***
mos_6326 0.40955 0.54353 0.67129 0.91955 (0.43905) (0.43182) (0.43025) (0.42940)*
* mos_6332 -0.09341 0.08021 0.05962 0.09011 (0.19869) (0.19583) (0.19516) (0.19460) mos_6333 -0.07809 0.04029 0.07919 0.18626

97
(0.29146) (0.28806) (0.28781) (0.28740) mos_6335 3.59688 3.89123 3.87250 3.89513 (1.05387)*
** (1.05040)***
(1.04626)***
(1.04506)***
mos_6336 0.54050 0.67715 0.69003 0.77905 (0.24885)*
* (0.24224)***
(0.24056)***
(0.23952)***
mos_6337 0.49995 0.68713 0.68370 0.80888 (0.14491)*
** (0.14240)***
(0.14130)***
(0.14083)***
mos_6386 0.42487 0.48662 0.50560 0.59274 (0.30116) (0.29826) (0.29725)* (0.29692)*
* mos_6412 0.31697 0.50862 0.51241 0.61716 (0.15542)*
* (0.15318)***
(0.15270)***
(0.15215)***
mos_6413 0.26152 0.46581 0.46496 0.54839 (0.12945)*
* (0.12749)***
(0.12690)***
(0.12648)***
mos_6414 0.59061 1.14330 1.21369 1.46145 (1.44219) (1.41495) (1.41494) (1.41532) mos_6423 0.22857 0.37525 0.38685 0.49632 (0.19232) (0.18921)*
* (0.18846)**
(0.18778)***
mos_6432 0.22460 0.33897 0.36633 0.50418 (0.17930) (0.17577)* (0.17509)*
* (0.17454)***
mos_6433 0.59348 0.68168 0.66490 0.70502 (0.16890)*
** (0.16643)***
(0.16554)***
(0.16511)***
mos_6461 -0.09390 -0.00730 0.00193 0.16203 (0.30107) (0.29745) (0.29658) (0.29584) mos_6462 0.58971 0.67963 0.68014 0.84097 (0.26127)*
* (0.25672)***
(0.25590)***
(0.25521)***
mos_6463 1.04001 1.12017 1.14521 1.29976 (0.33552)*
** (0.32220)***
(0.31992)***
(0.31829)***
mos_6464 -0.47929 -0.21193 -0.16992 0.05139 (0.40595) (0.40040) (0.39958) (0.39913) mos_6466 0.39494 0.55426 0.55277 0.68590 (0.24821) (0.24467)*
* (0.24367)**
(0.24287)***
mos_6467 0.12484 0.20456 0.22012 0.35593

98
(0.18983) (0.18693) (0.18620) (0.18553)* mos_6482 0.57881 0.73333 0.77575 0.87459 (0.22005)*
** (0.21772)***
(0.21687)***
(0.21623)***
mos_6483 0.98271 1.07491 1.05964 1.10922 (0.19366)*
** (0.18951)***
(0.18863)***
(0.18804)***
mos_6484 0.07959 0.22067 0.25747 0.49749 (0.23674) (0.23299) (0.23268) (0.23220)*
* mos_6492 0.47012 0.65059 0.67072 0.80504 (0.11488)*
** (0.11299)***
(0.11259)***
(0.11204)***
mos_6493 0.61398 0.78845 0.74951 0.84431 (0.31943)* (0.31201)*
* (0.30849)**
(0.30733)***
mos_6531 0.58984 0.61785 0.61454 0.66086 (0.06881)*
** (0.06766)***
(0.06741)***
(0.06718)***
mos_6541 0.63040 0.66217 0.65892 0.72579 (0.08008)*
** (0.07880)***
(0.07846)***
(0.07815)***
mos_6672 1.02537 1.06721 1.09074 1.18921 (0.07138)*
** (0.07003)***
(0.06968)***
(0.06935)***
mos_6694 0.54907 0.52660 0.55761 0.67178 (0.15533)*
** (0.15213)***
(0.15189)***
(0.15135)***
mos_6821 0.12033 0.19106 0.21566 0.27677 (0.18246) (0.17899) (0.17814) (0.17758) mos_6842 0.68631 1.02742 1.04759 1.10142 (0.47016) (0.46422)*
* (0.46163)**
(0.46016)**
mos_7011 0.23092 0.32980 0.33802 0.37315 (0.14395) (0.14168)*
* (0.14124)**
(0.14088)***
mos_7041 1.03431 1.05516 1.06303 1.13411 (0.09444)*
** (0.09249)***
(0.09207)***
(0.09172)***
mos_7051 0.23416 0.30273 0.31432 0.40578 (0.08571)*
** (0.08433)***
(0.08403)***
(0.08367)***
mos_7212 0.26274 0.30902 0.30008 0.31765 (0.10859)* (0.10654)* (0.10631)* (0.10595)*

99
* ** ** ** mos_7234 0.42377 0.62756 0.62432 0.66340 (0.16873)*
* (0.16646)***
(0.16539)***
(0.16478)***
mos_7236 1.70906 1.98766 1.97665 1.87851 (0.72194)*
* (0.71167)***
(0.70893)***
(0.70799)***
mos_7242 0.73495 0.88405 0.89947 0.89805 (0.15136)*
** (0.14918)***
(0.14859)***
(0.14812)***
mos_7251 0.09528 -0.26365 -0.24882 -0.17715 (1.10864) (1.10315) (1.09956) (1.09623) mos_7257 0.18586 0.36073 0.38171 0.45351 (0.10065)* (0.09876)*
** (0.09814)***
(0.09761)***
mos_7314 0.01897 0.25471 0.27641 0.21292 (0.33246) (0.32723) (0.32601) (0.32570) mos_7372 0.89726 1.04843 1.01054 1.13885 (0.23721)*
** (0.23512)***
(0.23305)***
(0.23182)***
mos_7382 0.62435 0.70752 0.71440 0.77041 (0.28039)*
* (0.27609)**
(0.27553)***
(0.27459)***
Constant -2.65973 -1.63834 -3.09053 -3.55183 (0.04653)*
** (0.03785)***
(0.32517)***
(0.32112)***
Observations 105371 105371 105371 105371 Standard errors in parentheses * significant at 10%; ** significant at 5%; *** significant at 1%

100
THIS PAGE INTENTIONALLY LEFT BLANK

101
APPENDIX C. FY 2008 PREDICTED REENLISTMENT RATES BY MOS FOR ALTERNATE SRB MULTIPLES
SRB Multiple of 0
Model # SRB Multiple of 1
Model # SRB Multiple of 2
Model # SRB Multiple of 3
Model # SRB Multiple of 4
Model # SRB Multiple of 5
Model #
MOS 1 2 3 4 1 2 3 4 1 2 3 4 1 2 3 4 1 2 3 4 1 2 3 4
0121 0.35 0.35 0.31 0.36 0.38 0.37 0.33 0.39 0.40 0.40 0.36 0.41 0.43 0.42 0.38 0.43 0.46 0.45 0.41 0.46 0.49 0.48 0.43 0.48
0151 0.46 0.45 0.41 0.46 0.49 0.48 0.43 0.49 0.52 0.50 0.46 0.51 0.55 0.53 0.48 0.54 0.57 0.56 0.51 0.56 0.60 0.58 0.54 0.58
0161 0.45 0.43 0.39 0.42 0.48 0.45 0.41 0.44 0.51 0.48 0.44 0.46 0.54 0.51 0.46 0.49 0.57 0.53 0.49 0.51 0.59 0.56 0.51 0.54
0193 0.27 0.39 0.35 0.42 0.29 0.41 0.37 0.44 0.32 0.44 0.39 0.47 0.35 0.46 0.42 0.49 0.37 0.49 0.44 0.52 0.40 0.52 0.47 0.54
0211 0.11 0.15 0.13 0.14 0.12 0.16 0.14 0.16 0.13 0.18 0.15 0.17 0.14 0.19 0.17 0.18 0.16 0.21 0.18 0.20 0.18 0.23 0.20 0.21
0231 0.27 0.29 0.25 0.27 0.29 0.31 0.27 0.29 0.32 0.34 0.29 0.31 0.34 0.36 0.31 0.33 0.37 0.39 0.34 0.35 0.40 0.41 0.36 0.38
0241 0.58 0.70 0.66 0.70 0.61 0.72 0.68 0.72 0.63 0.74 0.71 0.74 0.66 0.76 0.73 0.76 0.69 0.78 0.75 0.78 0.71 0.80 0.77 0.79
0261 0.17 0.17 0.15 0.16 0.19 0.19 0.16 0.18 0.20 0.21 0.18 0.19 0.22 0.23 0.19 0.21 0.24 0.24 0.21 0.22 0.27 0.26 0.23 0.24
0311 0.20 0.19 0.17 0.18 0.21 0.21 0.18 0.19 0.24 0.23 0.20 0.21 0.26 0.25 0.21 0.23 0.28 0.27 0.23 0.24 0.30 0.29 0.25 0.26
0313 0.18 0.19 0.16 0.17 0.20 0.20 0.18 0.19 0.22 0.22 0.19 0.20 0.24 0.24 0.21 0.22 0.26 0.26 0.22 0.23 0.28 0.28 0.24 0.25
0321 0.25 0.26 0.23 0.24 0.27 0.28 0.24 0.26 0.30 0.30 0.26 0.28 0.32 0.32 0.28 0.30 0.35 0.35 0.31 0.32 0.37 0.37 0.33 0.34
0331 0.20 0.20 0.18 0.19 0.22 0.22 0.19 0.20 0.24 0.24 0.21 0.22 0.26 0.26 0.22 0.24 0.28 0.28 0.24 0.25 0.31 0.30 0.26 0.27
0341 0.18 0.18 0.16 0.17 0.20 0.20 0.17 0.18 0.22 0.22 0.19 0.20 0.24 0.24 0.20 0.21 0.26 0.26 0.22 0.23 0.28 0.28 0.24 0.25
0351 0.19 0.19 0.16 0.17 0.20 0.20 0.17 0.19 0.22 0.22 0.19 0.20 0.24 0.24 0.21 0.22 0.27 0.26 0.22 0.23 0.29 0.28 0.24 0.25
0352 0.21 0.23 0.20 0.21 0.23 0.25 0.22 0.23 0.25 0.27 0.23 0.24 0.27 0.29 0.25 0.26 0.30 0.31 0.27 0.28 0.32 0.33 0.29 0.30
0369 0.06 0.11 0.10 0.11 0.07 0.12 0.11 0.12 0.07 0.13 0.12 0.13 0.08 0.15 0.13 0.14 0.09 0.16 0.14 0.15 0.10 0.18 0.15 0.17
0411 0.34 0.33 0.29 0.32 0.37 0.35 0.31 0.34 0.39 0.38 0.34 0.37 0.42 0.40 0.36 0.39 0.45 0.43 0.38 0.41 0.48 0.46 0.41 0.43
0431 0.37 0.38 0.34 0.37 0.40 0.40 0.36 0.39 0.42 0.43 0.39 0.41 0.45 0.45 0.41 0.44 0.48 0.48 0.44 0.46 0.51 0.51 0.46 0.49
0451 0.29 0.28 0.24 0.27 0.32 0.30 0.26 0.29 0.34 0.32 0.28 0.31 0.37 0.34 0.30 0.33 0.40 0.37 0.32 0.35 0.43 0.39 0.35 0.37
0481 0.22 0.24 0.20 0.22 0.24 0.26 0.22 0.23 0.26 0.28 0.24 0.25 0.29 0.30 0.26 0.27 0.31 0.32 0.28 0.29 0.34 0.35 0.30 0.31
0511 0.27 0.27 0.23 0.26 0.29 0.29 0.25 0.28 0.32 0.31 0.27 0.30 0.34 0.34 0.29 0.32 0.37 0.36 0.31 0.34 0.40 0.38 0.33 0.37
0612 0.25 0.26 0.23 0.25 0.28 0.29 0.25 0.26 0.30 0.31 0.27 0.28 0.33 0.33 0.29 0.30 0.35 0.35 0.31 0.32 0.38 0.38 0.33 0.35
0613 0.22 0.24 0.21 0.24 0.24 0.26 0.22 0.26 0.26 0.28 0.24 0.28 0.28 0.30 0.26 0.30 0.31 0.32 0.28 0.32 0.33 0.35 0.30 0.34
0614 0.21 0.21 0.18 0.20 0.23 0.23 0.20 0.22 0.25 0.25 0.22 0.23 0.28 0.27 0.24 0.25 0.30 0.29 0.25 0.27 0.32 0.31 0.27 0.29
0619 0.42 0.53 0.46 0.47 0.44 0.55 0.49 0.49 0.47 0.58 0.51 0.52 0.50 0.60 0.54 0.54 0.53 0.63 0.56 0.56 0.56 0.65 0.59 0.59
0621 0.27 0.28 0.25 0.27 0.30 0.30 0.27 0.28 0.32 0.33 0.29 0.30 0.35 0.35 0.31 0.33 0.37 0.38 0.33 0.35 0.40 0.40 0.36 0.37
0622 0.18 0.18 0.16 0.17 0.20 0.20 0.17 0.18 0.22 0.22 0.19 0.20 0.24 0.24 0.20 0.21 0.26 0.26 0.22 0.23 0.28 0.28 0.24 0.25
0623 0.48 0.42 0.41 0.50 0.50 0.45 0.43 0.52 0.53 0.48 0.46 0.55 0.56 0.50 0.48 0.57 0.59 0.53 0.51 0.60 0.62 0.56 0.54 0.62
0624 0.24 0.27 0.20 0.22 0.26 0.30 0.22 0.23 0.28 0.32 0.24 0.25 0.31 0.34 0.26 0.27 0.33 0.37 0.28 0.29 0.36 0.39 0.30 0.31
0626 0.09 0.09 0.08 0.08 0.10 0.10 0.08 0.09 0.11 0.11 0.09 0.10 0.12 0.12 0.10 0.11 0.13 0.13 0.11 0.12 0.15 0.14 0.12 0.13
0627 0.20 0.21 0.18 0.19 0.22 0.23 0.20 0.21 0.24 0.25 0.21 0.23 0.26 0.27 0.23 0.24 0.28 0.29 0.25 0.26 0.31 0.31 0.27 0.28

102
0629 0.20 0.33 0.29 0.32 0.22 0.35 0.31 0.34 0.24 0.37 0.33 0.36 0.26 0.40 0.35 0.38 0.28 0.42 0.38 0.40 0.31 0.45 0.40 0.43
0651 0.18 0.18 0.16 0.19 0.20 0.20 0.17 0.20 0.22 0.22 0.19 0.22 0.24 0.24 0.21 0.23 0.26 0.26 0.22 0.25 0.28 0.28 0.24 0.27
0656 0.18 0.19 0.17 0.19 0.20 0.21 0.18 0.20 0.22 0.22 0.20 0.22 0.24 0.24 0.21 0.23 0.26 0.26 0.23 0.25 0.28 0.28 0.25 0.27
0689 0.29 0.42 0.39 0.44 0.31 0.44 0.42 0.46 0.34 0.47 0.44 0.49 0.36 0.50 0.47 0.51 0.39 0.52 0.49 0.53 0.42 0.55 0.52 0.56
0811 0.23 0.23 0.20 0.22 0.25 0.25 0.22 0.23 0.27 0.27 0.24 0.25 0.29 0.29 0.26 0.27 0.32 0.32 0.28 0.29 0.34 0.34 0.30 0.31
0842 0.25 0.26 0.23 0.23 0.27 0.28 0.24 0.25 0.30 0.31 0.26 0.27 0.32 0.33 0.28 0.29 0.35 0.35 0.30 0.31 0.38 0.38 0.33 0.33
0844 0.27 0.28 0.25 0.27 0.29 0.31 0.27 0.29 0.32 0.33 0.29 0.31 0.34 0.35 0.31 0.33 0.37 0.38 0.34 0.35 0.40 0.40 0.36 0.38
0847 0.35 0.37 0.32 0.36 0.37 0.40 0.35 0.38 0.40 0.42 0.37 0.40 0.43 0.45 0.39 0.42 0.46 0.47 0.42 0.45 0.49 0.50 0.44 0.47
0861 0.26 0.28 0.24 0.26 0.28 0.30 0.26 0.28 0.31 0.32 0.28 0.30 0.33 0.34 0.30 0.32 0.36 0.37 0.32 0.34 0.39 0.39 0.35 0.36
1141 0.29 0.28 0.25 0.27 0.32 0.30 0.26 0.29 0.34 0.33 0.29 0.31 0.37 0.35 0.31 0.33 0.40 0.37 0.33 0.35 0.43 0.40 0.35 0.37
1142 0.29 0.30 0.26 0.28 0.32 0.32 0.28 0.30 0.34 0.34 0.30 0.32 0.37 0.37 0.32 0.34 0.40 0.39 0.34 0.36 0.42 0.42 0.37 0.38
1161 0.26 0.25 0.22 0.24 0.28 0.27 0.24 0.26 0.30 0.30 0.26 0.28 0.33 0.32 0.28 0.30 0.35 0.34 0.30 0.32 0.38 0.37 0.32 0.34
1171 0.31 0.30 0.26 0.28 0.33 0.33 0.28 0.30 0.36 0.35 0.31 0.32 0.39 0.37 0.33 0.35 0.42 0.40 0.35 0.37 0.44 0.42 0.37 0.39
1181 0.26 0.29 0.25 0.28 0.29 0.31 0.27 0.30 0.31 0.34 0.29 0.32 0.34 0.36 0.31 0.34 0.36 0.38 0.34 0.36 0.39 0.41 0.36 0.39
1316 0.26 0.27 0.23 0.25 0.28 0.29 0.25 0.27 0.31 0.31 0.27 0.29 0.33 0.33 0.29 0.31 0.36 0.36 0.31 0.33 0.38 0.38 0.33 0.35
1341 0.26 0.28 0.24 0.26 0.29 0.30 0.26 0.28 0.31 0.32 0.28 0.30 0.34 0.34 0.30 0.32 0.36 0.37 0.32 0.34 0.39 0.39 0.34 0.36
1345 0.24 0.25 0.21 0.23 0.26 0.27 0.23 0.24 0.28 0.29 0.25 0.26 0.31 0.31 0.27 0.28 0.33 0.33 0.29 0.30 0.36 0.36 0.31 0.32
1361 0.31 0.30 0.27 0.29 0.33 0.33 0.29 0.31 0.36 0.35 0.31 0.33 0.39 0.37 0.33 0.35 0.41 0.40 0.35 0.37 0.44 0.42 0.38 0.40
1371 0.25 0.27 0.23 0.24 0.27 0.29 0.25 0.26 0.29 0.31 0.27 0.28 0.32 0.33 0.29 0.30 0.34 0.36 0.31 0.32 0.37 0.38 0.33 0.34
1391 0.28 0.28 0.24 0.26 0.30 0.30 0.26 0.28 0.33 0.32 0.28 0.30 0.35 0.35 0.30 0.32 0.38 0.37 0.32 0.34 0.41 0.40 0.35 0.36
1812 0.28 0.30 0.26 0.27 0.31 0.32 0.28 0.29 0.33 0.35 0.30 0.31 0.36 0.37 0.33 0.33 0.39 0.40 0.35 0.35 0.41 0.42 0.37 0.37
1833 0.26 0.28 0.24 0.25 0.28 0.30 0.26 0.27 0.31 0.32 0.28 0.29 0.33 0.34 0.30 0.31 0.36 0.37 0.32 0.33 0.39 0.39 0.35 0.35
2111 0.31 0.31 0.28 0.31 0.33 0.34 0.30 0.33 0.36 0.36 0.32 0.35 0.39 0.39 0.34 0.37 0.42 0.41 0.37 0.40 0.44 0.44 0.39 0.42
2131 0.25 0.25 0.22 0.24 0.28 0.28 0.24 0.26 0.30 0.30 0.26 0.28 0.33 0.32 0.28 0.30 0.35 0.34 0.30 0.32 0.38 0.37 0.32 0.34
2141 0.25 0.28 0.25 0.27 0.27 0.30 0.27 0.28 0.30 0.32 0.29 0.30 0.32 0.35 0.31 0.33 0.35 0.37 0.33 0.35 0.37 0.40 0.35 0.37
2146 0.31 0.32 0.28 0.29 0.33 0.34 0.30 0.31 0.36 0.37 0.32 0.33 0.38 0.39 0.34 0.36 0.41 0.42 0.37 0.38 0.44 0.44 0.39 0.40
2147 0.26 0.28 0.25 0.26 0.28 0.30 0.27 0.28 0.31 0.33 0.29 0.30 0.33 0.35 0.31 0.32 0.36 0.38 0.33 0.34 0.39 0.40 0.35 0.36
2161 0.24 0.26 0.22 0.25 0.27 0.28 0.24 0.27 0.29 0.30 0.26 0.29 0.31 0.32 0.28 0.31 0.34 0.34 0.30 0.33 0.36 0.37 0.32 0.35
2171 0.23 0.25 0.22 0.23 0.25 0.27 0.23 0.25 0.28 0.29 0.25 0.27 0.30 0.31 0.27 0.29 0.32 0.34 0.29 0.31 0.35 0.36 0.31 0.33
2311 0.32 0.34 0.30 0.33 0.35 0.36 0.32 0.35 0.38 0.39 0.34 0.37 0.40 0.41 0.37 0.39 0.43 0.44 0.39 0.42 0.46 0.46 0.41 0.44
2336 0.63 0.70 0.68 0.69 0.66 0.72 0.70 0.71 0.68 0.74 0.72 0.73 0.71 0.76 0.74 0.75 0.73 0.78 0.76 0.77 0.75 0.80 0.78 0.78
2621 0.27 0.29 0.26 0.29 0.30 0.32 0.28 0.31 0.32 0.34 0.30 0.34 0.35 0.36 0.33 0.36 0.37 0.39 0.35 0.38 0.40 0.41 0.37 0.40
2631 0.25 0.27 0.23 0.26 0.27 0.29 0.25 0.28 0.29 0.31 0.27 0.30 0.32 0.34 0.29 0.32 0.34 0.36 0.31 0.34 0.37 0.39 0.33 0.37
2651 0.25 0.27 0.24 0.27 0.27 0.29 0.26 0.28 0.30 0.31 0.28 0.30 0.32 0.34 0.30 0.33 0.35 0.36 0.32 0.35 0.37 0.38 0.34 0.37
2671 0.13 0.16 0.14 0.15 0.15 0.18 0.15 0.17 0.16 0.19 0.17 0.18 0.18 0.21 0.18 0.19 0.20 0.23 0.20 0.21 0.22 0.25 0.21 0.23
2673 0.18 0.20 0.17 0.22 0.20 0.22 0.19 0.23 0.22 0.24 0.21 0.25 0.24 0.26 0.22 0.27 0.26 0.28 0.24 0.29 0.28 0.30 0.26 0.31
2674 0.19 0.21 0.19 0.22 0.21 0.23 0.20 0.24 0.23 0.25 0.22 0.25 0.25 0.27 0.24 0.27 0.27 0.29 0.26 0.29 0.30 0.31 0.28 0.31
2676 0.19 0.22 0.19 0.22 0.21 0.24 0.21 0.24 0.23 0.26 0.22 0.25 0.25 0.28 0.24 0.27 0.27 0.30 0.26 0.29 0.30 0.32 0.28 0.31
2818 0.97 0.97 0.96 0.97 0.97 0.98 0.97 0.97 0.98 0.98 0.97 0.98 0.98 0.98 0.97 0.98 0.98 0.98 0.98 0.98 0.98 0.98 0.98 0.98

103
2822 0.25 0.27 0.24 0.28 0.27 0.29 0.26 0.30 0.29 0.31 0.28 0.32 0.32 0.34 0.30 0.34 0.34 0.36 0.32 0.37 0.37 0.39 0.35 0.39
2823 0.38 0.47 0.42 0.41 0.41 0.50 0.44 0.44 0.44 0.53 0.47 0.46 0.47 0.55 0.50 0.48 0.50 0.58 0.52 0.51 0.52 0.60 0.55 0.53
2831 0.28 0.29 0.26 0.28 0.31 0.32 0.28 0.30 0.33 0.34 0.30 0.32 0.36 0.36 0.32 0.34 0.39 0.39 0.34 0.36 0.41 0.41 0.37 0.39
2834 0.27 0.32 0.28 0.29 0.29 0.34 0.30 0.31 0.31 0.37 0.33 0.34 0.34 0.39 0.35 0.36 0.37 0.42 0.37 0.38 0.39 0.44 0.40 0.40
2841 0.99 0.99 0.99 0.99 0.99 0.99 0.99 0.99 0.99 0.99 0.99 0.99 0.99 0.99 0.99 0.99 0.99 1.00 0.99 0.99 1.00 1.00 0.99 1.00
2844 0.21 0.24 0.21 0.23 0.23 0.26 0.22 0.25 0.25 0.28 0.24 0.26 0.28 0.30 0.26 0.28 0.30 0.32 0.28 0.30 0.33 0.35 0.30 0.32
2846 0.21 0.23 0.19 0.21 0.23 0.25 0.21 0.23 0.25 0.27 0.23 0.25 0.27 0.29 0.25 0.27 0.29 0.31 0.27 0.29 0.32 0.33 0.29 0.31
2847 0.17 0.20 0.17 0.19 0.19 0.22 0.19 0.21 0.21 0.24 0.21 0.23 0.23 0.26 0.22 0.24 0.25 0.28 0.24 0.26 0.27 0.30 0.26 0.28
2862 0.45 0.62 0.59 0.62 0.47 0.65 0.61 0.64 0.50 0.67 0.63 0.66 0.53 0.70 0.66 0.68 0.56 0.72 0.68 0.70 0.59 0.74 0.70 0.72
2871 0.15 0.17 0.15 0.18 0.17 0.19 0.16 0.19 0.19 0.20 0.18 0.21 0.20 0.22 0.19 0.22 0.22 0.24 0.21 0.24 0.24 0.26 0.23 0.26
2874 0.28 0.36 0.30 0.31 0.30 0.39 0.32 0.33 0.32 0.41 0.35 0.35 0.35 0.44 0.37 0.37 0.38 0.46 0.39 0.39 0.40 0.49 0.42 0.42
2881 0.21 0.24 0.21 0.23 0.24 0.26 0.22 0.25 0.26 0.28 0.24 0.27 0.28 0.30 0.26 0.29 0.30 0.33 0.28 0.31 0.33 0.35 0.30 0.33
2887 0.22 0.25 0.21 0.24 0.24 0.27 0.23 0.26 0.26 0.29 0.25 0.28 0.29 0.32 0.27 0.30 0.31 0.34 0.29 0.32 0.34 0.36 0.31 0.34
3043 0.41 0.41 0.37 0.40 0.44 0.43 0.39 0.43 0.47 0.46 0.42 0.45 0.49 0.49 0.44 0.48 0.52 0.51 0.47 0.50 0.55 0.54 0.49 0.52
3051 0.35 0.34 0.30 0.33 0.37 0.36 0.32 0.35 0.40 0.39 0.34 0.37 0.43 0.41 0.37 0.40 0.46 0.44 0.39 0.42 0.49 0.47 0.42 0.44
3052 0.41 0.41 0.37 0.41 0.44 0.44 0.39 0.43 0.46 0.47 0.42 0.45 0.49 0.49 0.44 0.48 0.52 0.52 0.47 0.50 0.55 0.54 0.49 0.53
3112 0.37 0.37 0.33 0.39 0.39 0.40 0.36 0.41 0.42 0.42 0.38 0.44 0.45 0.45 0.41 0.46 0.48 0.47 0.43 0.49 0.51 0.50 0.46 0.51
3381 0.32 0.33 0.29 0.31 0.35 0.35 0.31 0.33 0.38 0.38 0.33 0.36 0.40 0.40 0.35 0.38 0.43 0.43 0.38 0.40 0.46 0.45 0.40 0.42
3432 0.44 0.43 0.39 0.44 0.46 0.46 0.41 0.46 0.49 0.48 0.44 0.48 0.52 0.51 0.46 0.51 0.55 0.53 0.49 0.53 0.58 0.56 0.51 0.56
3451 0.41 0.41 0.37 0.43 0.44 0.44 0.39 0.46 0.47 0.46 0.42 0.48 0.50 0.49 0.44 0.50 0.52 0.51 0.47 0.53 0.55 0.54 0.50 0.55
3521 0.29 0.31 0.27 0.29 0.32 0.34 0.30 0.32 0.34 0.36 0.32 0.34 0.37 0.39 0.34 0.36 0.40 0.41 0.36 0.38 0.42 0.44 0.39 0.40
3529 0.35 0.54 0.46 0.49 0.38 0.56 0.48 0.51 0.41 0.59 0.51 0.54 0.44 0.61 0.53 0.56 0.47 0.64 0.56 0.58 0.50 0.66 0.58 0.61
3531 0.30 0.31 0.27 0.30 0.33 0.34 0.30 0.32 0.35 0.36 0.32 0.34 0.38 0.38 0.34 0.36 0.41 0.41 0.36 0.38 0.44 0.43 0.39 0.41
3533 0.25 0.25 0.22 0.23 0.27 0.27 0.23 0.25 0.30 0.29 0.25 0.27 0.32 0.32 0.27 0.29 0.35 0.34 0.29 0.31 0.37 0.36 0.32 0.33
3537 0.18 0.26 0.26 0.33 0.20 0.28 0.28 0.35 0.22 0.30 0.31 0.37 0.24 0.33 0.33 0.39 0.26 0.35 0.35 0.42 0.29 0.37 0.37 0.44
4066 0.93 0.93 0.91 0.93 0.94 0.94 0.92 0.94 0.95 0.94 0.93 0.94 0.95 0.95 0.94 0.95 0.96 0.95 0.94 0.95 0.96 0.96 0.95 0.96
4067 0.23 0.24 0.22 0.27 0.25 0.26 0.24 0.29 0.27 0.28 0.26 0.31 0.29 0.30 0.28 0.33 0.32 0.32 0.30 0.35 0.34 0.35 0.32 0.37
4133 0.21 0.33 0.28 0.32 0.23 0.35 0.30 0.34 0.25 0.38 0.32 0.36 0.27 0.40 0.34 0.38 0.30 0.43 0.37 0.41 0.32 0.45 0.39 0.43
4341 0.31 0.30 0.27 0.32 0.34 0.32 0.29 0.34 0.36 0.35 0.31 0.36 0.39 0.37 0.33 0.38 0.42 0.40 0.36 0.41 0.45 0.42 0.38 0.43
4421 0.40 0.37 0.33 0.39 0.43 0.40 0.36 0.41 0.46 0.42 0.38 0.43 0.48 0.45 0.41 0.46 0.51 0.48 0.43 0.48 0.54 0.50 0.46 0.50
4611 0.30 0.28 0.25 0.31 0.32 0.31 0.27 0.33 0.35 0.33 0.29 0.35 0.38 0.35 0.31 0.37 0.40 0.38 0.33 0.39 0.43 0.40 0.35 0.42
4612 0.31 0.27 0.24 0.28 0.33 0.29 0.26 0.30 0.36 0.31 0.28 0.32 0.39 0.33 0.30 0.34 0.42 0.36 0.32 0.36 0.44 0.38 0.34 0.39
4641 0.29 0.28 0.24 0.28 0.32 0.30 0.26 0.30 0.35 0.32 0.28 0.32 0.37 0.35 0.30 0.34 0.40 0.37 0.33 0.36 0.43 0.40 0.35 0.38
4671 0.30 0.29 0.26 0.30 0.33 0.31 0.28 0.32 0.35 0.33 0.30 0.34 0.38 0.36 0.32 0.36 0.41 0.38 0.34 0.39 0.44 0.41 0.37 0.41
5512 0.29 0.27 0.26 0.33 0.31 0.29 0.28 0.36 0.34 0.31 0.30 0.38 0.37 0.34 0.32 0.40 0.39 0.36 0.34 0.42 0.42 0.39 0.37 0.45
5524 0.34 0.36 0.32 0.38 0.36 0.38 0.34 0.40 0.39 0.41 0.37 0.42 0.42 0.43 0.39 0.45 0.45 0.46 0.42 0.47 0.48 0.48 0.44 0.49
5711 0.33 0.33 0.29 0.32 0.35 0.36 0.32 0.35 0.38 0.38 0.34 0.37 0.41 0.41 0.36 0.39 0.44 0.43 0.39 0.41 0.46 0.46 0.41 0.44
5811 0.24 0.25 0.22 0.26 0.27 0.28 0.24 0.28 0.29 0.30 0.26 0.30 0.31 0.32 0.28 0.32 0.34 0.34 0.30 0.34 0.37 0.37 0.32 0.36
5821 0.23 0.37 0.32 0.37 0.25 0.40 0.35 0.39 0.27 0.42 0.37 0.42 0.29 0.45 0.40 0.44 0.32 0.48 0.42 0.47 0.34 0.50 0.45 0.49
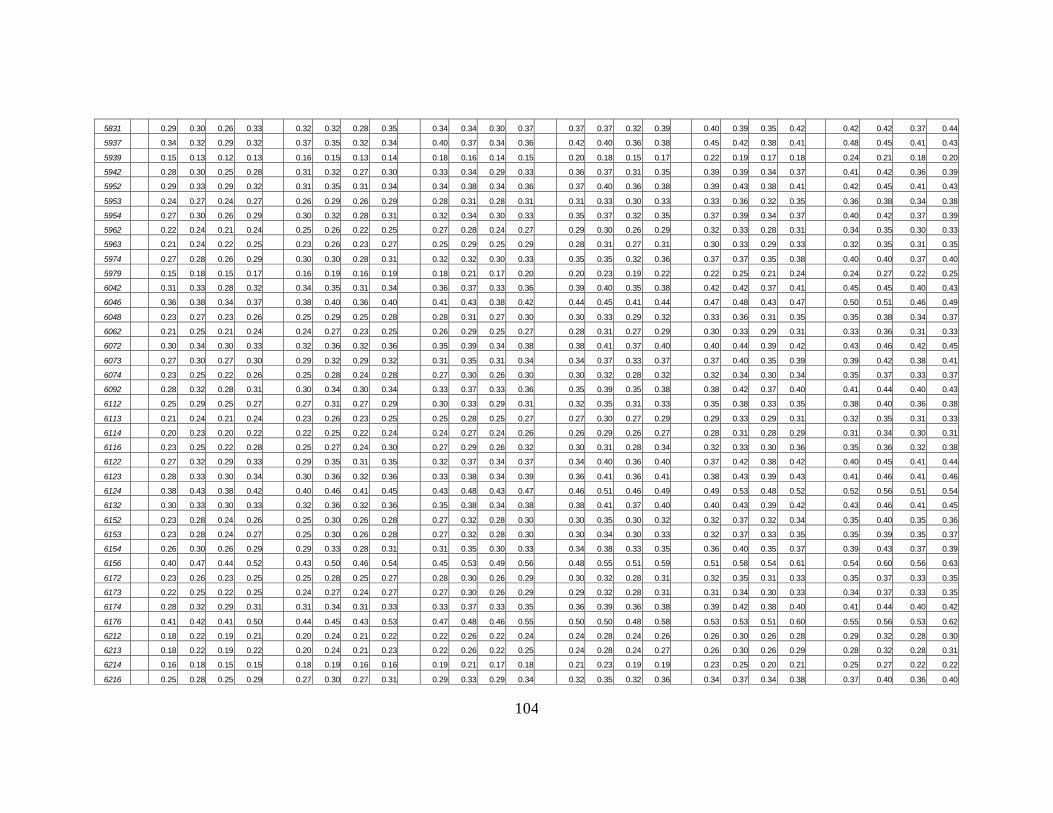
104
5831 0.29 0.30 0.26 0.33 0.32 0.32 0.28 0.35 0.34 0.34 0.30 0.37 0.37 0.37 0.32 0.39 0.40 0.39 0.35 0.42 0.42 0.42 0.37 0.44
5937 0.34 0.32 0.29 0.32 0.37 0.35 0.32 0.34 0.40 0.37 0.34 0.36 0.42 0.40 0.36 0.38 0.45 0.42 0.38 0.41 0.48 0.45 0.41 0.43
5939 0.15 0.13 0.12 0.13 0.16 0.15 0.13 0.14 0.18 0.16 0.14 0.15 0.20 0.18 0.15 0.17 0.22 0.19 0.17 0.18 0.24 0.21 0.18 0.20
5942 0.28 0.30 0.25 0.28 0.31 0.32 0.27 0.30 0.33 0.34 0.29 0.33 0.36 0.37 0.31 0.35 0.39 0.39 0.34 0.37 0.41 0.42 0.36 0.39
5952 0.29 0.33 0.29 0.32 0.31 0.35 0.31 0.34 0.34 0.38 0.34 0.36 0.37 0.40 0.36 0.38 0.39 0.43 0.38 0.41 0.42 0.45 0.41 0.43
5953 0.24 0.27 0.24 0.27 0.26 0.29 0.26 0.29 0.28 0.31 0.28 0.31 0.31 0.33 0.30 0.33 0.33 0.36 0.32 0.35 0.36 0.38 0.34 0.38
5954 0.27 0.30 0.26 0.29 0.30 0.32 0.28 0.31 0.32 0.34 0.30 0.33 0.35 0.37 0.32 0.35 0.37 0.39 0.34 0.37 0.40 0.42 0.37 0.39
5962 0.22 0.24 0.21 0.24 0.25 0.26 0.22 0.25 0.27 0.28 0.24 0.27 0.29 0.30 0.26 0.29 0.32 0.33 0.28 0.31 0.34 0.35 0.30 0.33
5963 0.21 0.24 0.22 0.25 0.23 0.26 0.23 0.27 0.25 0.29 0.25 0.29 0.28 0.31 0.27 0.31 0.30 0.33 0.29 0.33 0.32 0.35 0.31 0.35
5974 0.27 0.28 0.26 0.29 0.30 0.30 0.28 0.31 0.32 0.32 0.30 0.33 0.35 0.35 0.32 0.36 0.37 0.37 0.35 0.38 0.40 0.40 0.37 0.40
5979 0.15 0.18 0.15 0.17 0.16 0.19 0.16 0.19 0.18 0.21 0.17 0.20 0.20 0.23 0.19 0.22 0.22 0.25 0.21 0.24 0.24 0.27 0.22 0.25
6042 0.31 0.33 0.28 0.32 0.34 0.35 0.31 0.34 0.36 0.37 0.33 0.36 0.39 0.40 0.35 0.38 0.42 0.42 0.37 0.41 0.45 0.45 0.40 0.43
6046 0.36 0.38 0.34 0.37 0.38 0.40 0.36 0.40 0.41 0.43 0.38 0.42 0.44 0.45 0.41 0.44 0.47 0.48 0.43 0.47 0.50 0.51 0.46 0.49
6048 0.23 0.27 0.23 0.26 0.25 0.29 0.25 0.28 0.28 0.31 0.27 0.30 0.30 0.33 0.29 0.32 0.33 0.36 0.31 0.35 0.35 0.38 0.34 0.37
6062 0.21 0.25 0.21 0.24 0.24 0.27 0.23 0.25 0.26 0.29 0.25 0.27 0.28 0.31 0.27 0.29 0.30 0.33 0.29 0.31 0.33 0.36 0.31 0.33
6072 0.30 0.34 0.30 0.33 0.32 0.36 0.32 0.36 0.35 0.39 0.34 0.38 0.38 0.41 0.37 0.40 0.40 0.44 0.39 0.42 0.43 0.46 0.42 0.45
6073 0.27 0.30 0.27 0.30 0.29 0.32 0.29 0.32 0.31 0.35 0.31 0.34 0.34 0.37 0.33 0.37 0.37 0.40 0.35 0.39 0.39 0.42 0.38 0.41
6074 0.23 0.25 0.22 0.26 0.25 0.28 0.24 0.28 0.27 0.30 0.26 0.30 0.30 0.32 0.28 0.32 0.32 0.34 0.30 0.34 0.35 0.37 0.33 0.37
6092 0.28 0.32 0.28 0.31 0.30 0.34 0.30 0.34 0.33 0.37 0.33 0.36 0.35 0.39 0.35 0.38 0.38 0.42 0.37 0.40 0.41 0.44 0.40 0.43
6112 0.25 0.29 0.25 0.27 0.27 0.31 0.27 0.29 0.30 0.33 0.29 0.31 0.32 0.35 0.31 0.33 0.35 0.38 0.33 0.35 0.38 0.40 0.36 0.38
6113 0.21 0.24 0.21 0.24 0.23 0.26 0.23 0.25 0.25 0.28 0.25 0.27 0.27 0.30 0.27 0.29 0.29 0.33 0.29 0.31 0.32 0.35 0.31 0.33
6114 0.20 0.23 0.20 0.22 0.22 0.25 0.22 0.24 0.24 0.27 0.24 0.26 0.26 0.29 0.26 0.27 0.28 0.31 0.28 0.29 0.31 0.34 0.30 0.31
6116 0.23 0.25 0.22 0.28 0.25 0.27 0.24 0.30 0.27 0.29 0.26 0.32 0.30 0.31 0.28 0.34 0.32 0.33 0.30 0.36 0.35 0.36 0.32 0.38
6122 0.27 0.32 0.29 0.33 0.29 0.35 0.31 0.35 0.32 0.37 0.34 0.37 0.34 0.40 0.36 0.40 0.37 0.42 0.38 0.42 0.40 0.45 0.41 0.44
6123 0.28 0.33 0.30 0.34 0.30 0.36 0.32 0.36 0.33 0.38 0.34 0.39 0.36 0.41 0.36 0.41 0.38 0.43 0.39 0.43 0.41 0.46 0.41 0.46
6124 0.38 0.43 0.38 0.42 0.40 0.46 0.41 0.45 0.43 0.48 0.43 0.47 0.46 0.51 0.46 0.49 0.49 0.53 0.48 0.52 0.52 0.56 0.51 0.54
6132 0.30 0.33 0.30 0.33 0.32 0.36 0.32 0.36 0.35 0.38 0.34 0.38 0.38 0.41 0.37 0.40 0.40 0.43 0.39 0.42 0.43 0.46 0.41 0.45
6152 0.23 0.28 0.24 0.26 0.25 0.30 0.26 0.28 0.27 0.32 0.28 0.30 0.30 0.35 0.30 0.32 0.32 0.37 0.32 0.34 0.35 0.40 0.35 0.36
6153 0.23 0.28 0.24 0.27 0.25 0.30 0.26 0.28 0.27 0.32 0.28 0.30 0.30 0.34 0.30 0.33 0.32 0.37 0.33 0.35 0.35 0.39 0.35 0.37
6154 0.26 0.30 0.26 0.29 0.29 0.33 0.28 0.31 0.31 0.35 0.30 0.33 0.34 0.38 0.33 0.35 0.36 0.40 0.35 0.37 0.39 0.43 0.37 0.39
6156 0.40 0.47 0.44 0.52 0.43 0.50 0.46 0.54 0.45 0.53 0.49 0.56 0.48 0.55 0.51 0.59 0.51 0.58 0.54 0.61 0.54 0.60 0.56 0.63
6172 0.23 0.26 0.23 0.25 0.25 0.28 0.25 0.27 0.28 0.30 0.26 0.29 0.30 0.32 0.28 0.31 0.32 0.35 0.31 0.33 0.35 0.37 0.33 0.35
6173 0.22 0.25 0.22 0.25 0.24 0.27 0.24 0.27 0.27 0.30 0.26 0.29 0.29 0.32 0.28 0.31 0.31 0.34 0.30 0.33 0.34 0.37 0.33 0.35
6174 0.28 0.32 0.29 0.31 0.31 0.34 0.31 0.33 0.33 0.37 0.33 0.35 0.36 0.39 0.36 0.38 0.39 0.42 0.38 0.40 0.41 0.44 0.40 0.42
6176 0.41 0.42 0.41 0.50 0.44 0.45 0.43 0.53 0.47 0.48 0.46 0.55 0.50 0.50 0.48 0.58 0.53 0.53 0.51 0.60 0.55 0.56 0.53 0.62
6212 0.18 0.22 0.19 0.21 0.20 0.24 0.21 0.22 0.22 0.26 0.22 0.24 0.24 0.28 0.24 0.26 0.26 0.30 0.26 0.28 0.29 0.32 0.28 0.30
6213 0.18 0.22 0.19 0.22 0.20 0.24 0.21 0.23 0.22 0.26 0.22 0.25 0.24 0.28 0.24 0.27 0.26 0.30 0.26 0.29 0.28 0.32 0.28 0.31
6214 0.16 0.18 0.15 0.15 0.18 0.19 0.16 0.16 0.19 0.21 0.17 0.18 0.21 0.23 0.19 0.19 0.23 0.25 0.20 0.21 0.25 0.27 0.22 0.22
6216 0.25 0.28 0.25 0.29 0.27 0.30 0.27 0.31 0.29 0.33 0.29 0.34 0.32 0.35 0.32 0.36 0.34 0.37 0.34 0.38 0.37 0.40 0.36 0.40

105
6217 0.22 0.27 0.23 0.27 0.24 0.29 0.25 0.29 0.26 0.31 0.27 0.31 0.29 0.33 0.29 0.33 0.31 0.36 0.31 0.35 0.34 0.38 0.34 0.37
6222 0.23 0.30 0.27 0.31 0.25 0.32 0.29 0.33 0.27 0.34 0.31 0.35 0.30 0.37 0.33 0.37 0.32 0.39 0.35 0.40 0.35 0.42 0.38 0.42
6223 0.17 0.22 0.20 0.24 0.19 0.24 0.21 0.26 0.21 0.26 0.23 0.28 0.23 0.28 0.25 0.30 0.25 0.30 0.27 0.32 0.27 0.32 0.29 0.34
6226 0.24 0.29 0.26 0.31 0.26 0.31 0.28 0.33 0.28 0.33 0.30 0.35 0.31 0.36 0.32 0.37 0.33 0.38 0.34 0.40 0.36 0.41 0.37 0.42
6227 0.33 0.37 0.33 0.39 0.36 0.39 0.36 0.41 0.39 0.42 0.38 0.43 0.41 0.44 0.40 0.46 0.44 0.47 0.43 0.48 0.47 0.50 0.45 0.50
6232 0.78 0.78 0.70 0.74 0.80 0.80 0.72 0.76 0.82 0.81 0.74 0.78 0.83 0.83 0.76 0.79 0.85 0.84 0.78 0.81 0.86 0.86 0.80 0.82
6252 0.19 0.24 0.21 0.23 0.21 0.26 0.23 0.24 0.23 0.28 0.25 0.26 0.26 0.30 0.26 0.28 0.28 0.32 0.28 0.30 0.30 0.35 0.31 0.32
6253 0.21 0.26 0.22 0.25 0.23 0.28 0.24 0.27 0.26 0.30 0.26 0.29 0.28 0.32 0.28 0.31 0.30 0.34 0.30 0.33 0.33 0.37 0.32 0.35
6256 0.31 0.36 0.32 0.36 0.34 0.38 0.35 0.39 0.36 0.41 0.37 0.41 0.39 0.43 0.39 0.43 0.42 0.46 0.42 0.46 0.45 0.49 0.44 0.48
6257 0.19 0.23 0.20 0.23 0.21 0.25 0.21 0.25 0.23 0.27 0.23 0.27 0.25 0.29 0.25 0.29 0.27 0.31 0.27 0.31 0.30 0.33 0.29 0.33
6276 0.15 0.18 0.16 0.19 0.17 0.20 0.18 0.20 0.19 0.21 0.19 0.22 0.20 0.23 0.21 0.24 0.22 0.25 0.23 0.26 0.24 0.27 0.24 0.27
6282 0.20 0.24 0.22 0.23 0.22 0.26 0.23 0.25 0.24 0.28 0.25 0.27 0.26 0.30 0.27 0.29 0.29 0.33 0.29 0.31 0.31 0.35 0.31 0.33
6283 0.33 0.38 0.33 0.36 0.36 0.40 0.35 0.39 0.39 0.43 0.38 0.41 0.41 0.45 0.40 0.43 0.44 0.48 0.42 0.46 0.47 0.51 0.45 0.48
6286 0.26 0.29 0.25 0.28 0.29 0.31 0.27 0.30 0.31 0.33 0.29 0.32 0.34 0.36 0.31 0.34 0.36 0.38 0.33 0.36 0.39 0.41 0.36 0.38
6287 0.26 0.30 0.27 0.30 0.28 0.32 0.29 0.32 0.31 0.34 0.31 0.34 0.33 0.37 0.33 0.37 0.36 0.39 0.35 0.39 0.39 0.42 0.38 0.41
6311 0.92 0.92 0.91 0.92 0.93 0.93 0.92 0.93 0.94 0.93 0.92 0.93 0.94 0.94 0.93 0.94 0.95 0.95 0.94 0.95 0.96 0.95 0.94 0.95
6312 0.18 0.20 0.17 0.19 0.19 0.22 0.19 0.21 0.21 0.23 0.20 0.22 0.23 0.25 0.22 0.24 0.25 0.27 0.24 0.26 0.28 0.30 0.26 0.28
6313 0.28 0.30 0.27 0.31 0.30 0.32 0.29 0.33 0.33 0.34 0.31 0.35 0.35 0.37 0.33 0.37 0.38 0.39 0.35 0.40 0.41 0.42 0.38 0.42
6314 0.19 0.20 0.17 0.18 0.20 0.22 0.19 0.20 0.22 0.24 0.21 0.21 0.24 0.26 0.22 0.23 0.27 0.28 0.24 0.25 0.29 0.30 0.26 0.26
6316 0.32 0.34 0.31 0.35 0.35 0.37 0.33 0.37 0.37 0.39 0.35 0.40 0.40 0.42 0.38 0.42 0.43 0.44 0.40 0.44 0.46 0.47 0.43 0.47
6317 0.33 0.34 0.31 0.35 0.35 0.37 0.33 0.38 0.38 0.39 0.35 0.40 0.41 0.42 0.38 0.42 0.43 0.44 0.40 0.44 0.46 0.47 0.43 0.47
6322 0.30 0.32 0.28 0.30 0.33 0.34 0.30 0.32 0.35 0.37 0.32 0.35 0.38 0.39 0.35 0.37 0.41 0.42 0.37 0.39 0.43 0.44 0.39 0.41
6323 0.28 0.32 0.28 0.31 0.31 0.34 0.31 0.33 0.33 0.37 0.33 0.36 0.36 0.39 0.35 0.38 0.38 0.42 0.37 0.40 0.41 0.44 0.40 0.43
6324 0.30 0.33 0.29 0.31 0.32 0.35 0.31 0.33 0.35 0.38 0.33 0.35 0.38 0.40 0.36 0.38 0.40 0.43 0.38 0.40 0.43 0.45 0.40 0.42
6326 0.27 0.29 0.28 0.35 0.29 0.32 0.30 0.38 0.32 0.34 0.32 0.40 0.34 0.36 0.35 0.42 0.37 0.39 0.37 0.45 0.40 0.41 0.39 0.47
6332 0.18 0.21 0.18 0.19 0.20 0.22 0.19 0.21 0.22 0.24 0.21 0.23 0.24 0.26 0.22 0.24 0.26 0.29 0.24 0.26 0.28 0.31 0.26 0.28
6333 0.18 0.20 0.18 0.21 0.20 0.22 0.19 0.23 0.22 0.24 0.21 0.24 0.24 0.26 0.23 0.26 0.26 0.28 0.25 0.28 0.29 0.30 0.27 0.30
6335 0.90 0.92 0.91 0.92 0.91 0.93 0.91 0.92 0.92 0.94 0.92 0.93 0.93 0.94 0.93 0.94 0.93 0.95 0.94 0.94 0.94 0.95 0.94 0.95
6336 0.29 0.32 0.29 0.32 0.32 0.35 0.31 0.34 0.35 0.37 0.33 0.37 0.37 0.39 0.35 0.39 0.40 0.42 0.38 0.41 0.43 0.45 0.40 0.44
6337 0.29 0.32 0.28 0.33 0.31 0.35 0.31 0.35 0.34 0.37 0.33 0.37 0.36 0.40 0.35 0.40 0.39 0.42 0.37 0.42 0.42 0.45 0.40 0.44
6386 0.27 0.28 0.25 0.28 0.30 0.30 0.27 0.30 0.32 0.33 0.29 0.32 0.35 0.35 0.31 0.35 0.37 0.37 0.33 0.37 0.40 0.40 0.36 0.39
6412 0.25 0.29 0.25 0.29 0.27 0.31 0.27 0.31 0.30 0.33 0.29 0.33 0.32 0.36 0.31 0.35 0.35 0.38 0.33 0.37 0.37 0.40 0.36 0.40
6413 0.24 0.28 0.24 0.28 0.26 0.30 0.26 0.29 0.29 0.32 0.28 0.32 0.31 0.35 0.30 0.34 0.33 0.37 0.32 0.36 0.36 0.39 0.35 0.38
6414 0.31 0.43 0.40 0.49 0.33 0.46 0.43 0.51 0.36 0.48 0.45 0.53 0.38 0.51 0.48 0.56 0.41 0.54 0.50 0.58 0.44 0.56 0.53 0.60
6423 0.23 0.26 0.23 0.26 0.26 0.28 0.25 0.28 0.28 0.30 0.27 0.30 0.30 0.33 0.29 0.32 0.33 0.35 0.31 0.35 0.35 0.37 0.33 0.37
6432 0.23 0.25 0.22 0.27 0.26 0.27 0.24 0.29 0.28 0.29 0.26 0.31 0.30 0.32 0.28 0.33 0.33 0.34 0.30 0.35 0.35 0.36 0.32 0.37
6433 0.31 0.32 0.28 0.31 0.33 0.35 0.30 0.33 0.36 0.37 0.32 0.35 0.38 0.40 0.35 0.37 0.41 0.42 0.37 0.39 0.44 0.45 0.39 0.42
6461 0.18 0.19 0.17 0.21 0.20 0.21 0.18 0.22 0.22 0.23 0.20 0.24 0.24 0.25 0.21 0.26 0.26 0.27 0.23 0.27 0.28 0.29 0.25 0.29
6462 0.31 0.32 0.28 0.34 0.33 0.35 0.30 0.36 0.36 0.37 0.33 0.38 0.38 0.40 0.35 0.40 0.41 0.42 0.37 0.43 0.44 0.45 0.40 0.45

106
6463 0.41 0.42 0.39 0.45 0.44 0.45 0.41 0.47 0.47 0.48 0.44 0.49 0.49 0.50 0.46 0.52 0.52 0.53 0.49 0.54 0.55 0.56 0.51 0.57
6464 0.13 0.16 0.14 0.19 0.14 0.18 0.16 0.20 0.16 0.19 0.17 0.22 0.18 0.21 0.19 0.24 0.19 0.23 0.20 0.25 0.21 0.25 0.22 0.27
6466 0.27 0.30 0.26 0.30 0.29 0.32 0.28 0.32 0.31 0.34 0.30 0.35 0.34 0.37 0.32 0.37 0.37 0.39 0.34 0.39 0.39 0.42 0.37 0.41
6467 0.22 0.23 0.20 0.24 0.24 0.25 0.22 0.26 0.26 0.27 0.23 0.28 0.28 0.29 0.25 0.29 0.31 0.31 0.27 0.32 0.33 0.33 0.29 0.34
6482 0.30 0.33 0.30 0.34 0.33 0.36 0.33 0.37 0.35 0.38 0.35 0.39 0.38 0.41 0.37 0.41 0.41 0.43 0.40 0.44 0.44 0.46 0.42 0.46
6483 0.39 0.41 0.37 0.40 0.42 0.44 0.39 0.42 0.45 0.47 0.41 0.45 0.48 0.49 0.44 0.47 0.51 0.52 0.46 0.49 0.54 0.55 0.49 0.52
6484 0.21 0.23 0.21 0.27 0.23 0.25 0.22 0.28 0.25 0.27 0.24 0.30 0.27 0.29 0.26 0.33 0.30 0.31 0.28 0.35 0.32 0.34 0.30 0.37
6492 0.28 0.32 0.28 0.33 0.30 0.34 0.30 0.35 0.33 0.36 0.32 0.37 0.36 0.39 0.35 0.40 0.38 0.41 0.37 0.42 0.41 0.44 0.39 0.44
6493 0.31 0.35 0.30 0.34 0.34 0.37 0.32 0.36 0.36 0.40 0.34 0.38 0.39 0.42 0.37 0.41 0.42 0.45 0.39 0.43 0.45 0.47 0.41 0.45
6531 0.31 0.31 0.27 0.30 0.33 0.33 0.29 0.32 0.36 0.36 0.31 0.34 0.38 0.38 0.33 0.36 0.41 0.41 0.36 0.38 0.44 0.43 0.38 0.41
6541 0.31 0.32 0.28 0.31 0.34 0.34 0.30 0.33 0.37 0.37 0.32 0.35 0.39 0.39 0.34 0.38 0.42 0.42 0.37 0.40 0.45 0.44 0.39 0.42
6672 0.40 0.41 0.37 0.42 0.43 0.44 0.40 0.44 0.46 0.46 0.42 0.47 0.49 0.49 0.45 0.49 0.52 0.52 0.47 0.51 0.55 0.54 0.50 0.54
6694 0.30 0.29 0.26 0.30 0.32 0.31 0.28 0.32 0.35 0.34 0.30 0.34 0.37 0.36 0.32 0.36 0.40 0.38 0.34 0.39 0.43 0.41 0.37 0.41
6821 0.22 0.23 0.20 0.22 0.24 0.24 0.22 0.24 0.26 0.26 0.23 0.26 0.28 0.29 0.25 0.28 0.30 0.31 0.27 0.30 0.33 0.33 0.29 0.32
6842 0.33 0.40 0.36 0.40 0.35 0.43 0.39 0.42 0.38 0.45 0.41 0.44 0.41 0.48 0.44 0.47 0.43 0.51 0.46 0.49 0.46 0.53 0.49 0.52
7011 0.23 0.25 0.22 0.24 0.26 0.27 0.24 0.26 0.28 0.29 0.26 0.28 0.30 0.32 0.28 0.30 0.33 0.34 0.30 0.32 0.35 0.36 0.32 0.34
7041 0.41 0.41 0.37 0.41 0.43 0.43 0.39 0.43 0.46 0.46 0.42 0.45 0.49 0.49 0.44 0.48 0.52 0.51 0.47 0.50 0.55 0.54 0.49 0.52
7051 0.24 0.25 0.22 0.25 0.26 0.27 0.23 0.27 0.28 0.29 0.25 0.29 0.30 0.31 0.27 0.31 0.33 0.33 0.29 0.33 0.35 0.36 0.31 0.35
7212 0.24 0.25 0.21 0.23 0.26 0.27 0.23 0.25 0.29 0.29 0.25 0.27 0.31 0.31 0.27 0.29 0.34 0.33 0.29 0.31 0.36 0.36 0.31 0.33
7234 0.27 0.31 0.27 0.30 0.29 0.33 0.29 0.32 0.32 0.36 0.31 0.34 0.35 0.38 0.34 0.36 0.37 0.41 0.36 0.38 0.40 0.43 0.38 0.41
7236 0.57 0.64 0.59 0.59 0.60 0.66 0.62 0.61 0.63 0.68 0.64 0.64 0.66 0.71 0.66 0.66 0.68 0.73 0.68 0.68 0.71 0.75 0.71 0.70
7242 0.34 0.37 0.33 0.35 0.36 0.39 0.35 0.37 0.39 0.42 0.38 0.39 0.42 0.44 0.40 0.42 0.45 0.47 0.43 0.44 0.48 0.50 0.45 0.47
7251 0.21 0.16 0.13 0.16 0.23 0.17 0.15 0.17 0.25 0.19 0.16 0.18 0.28 0.20 0.17 0.20 0.30 0.22 0.19 0.21 0.32 0.24 0.21 0.23
7257 0.23 0.26 0.23 0.26 0.25 0.28 0.25 0.28 0.27 0.30 0.26 0.30 0.29 0.32 0.28 0.32 0.32 0.35 0.31 0.34 0.34 0.37 0.33 0.36
7314 0.20 0.24 0.21 0.21 0.22 0.26 0.23 0.23 0.24 0.28 0.24 0.25 0.26 0.30 0.26 0.27 0.28 0.32 0.28 0.29 0.31 0.35 0.31 0.31
7372 0.37 0.41 0.35 0.41 0.40 0.43 0.38 0.43 0.43 0.46 0.40 0.45 0.46 0.49 0.43 0.48 0.49 0.51 0.45 0.50 0.52 0.54 0.48 0.53
7382 0.31 0.33 0.29 0.32 0.34 0.35 0.31 0.34 0.36 0.38 0.33 0.36 0.39 0.40 0.36 0.39 0.42 0.43 0.38 0.41 0.45 0.45 0.41 0.43

107
APPENDIX D. MICROSOFT EXCEL MODELS
The following table explains the Microsoft Excel models contained in this
appendix. The values for the explanatory variables can be changed to reflect the
conditions of the Marine Corps at the time of prediction. The values for the explanatory
variables in the four models contained in this appendix were used to predict fiscal year
2008 reenlistment rates with an SRB multiple of zero. The table below depicts the values
for model #1 only. Each MOS has its own predicted reenlistment probability based on
the inputs in the model. Each MOS has its own logit formula for calculating the
predicted reenlistment rate at a given SRB multiple.
Variable Logit Coefficient Input Value
Constant -2.65973 1 in all models
SRB Multiple .116 SRB Multiple to be analyzed
(0 in model #1)
0 days deployed 0 (omitted group
from models)
USMC wide average for FY07
(.2039206 in model #1)
1-100 days deployed -.09009 USMC wide average for FY07
(.0216816 in model #1)
101-200 days deployed -.40787 USMC wide average for FY07
(.1305149 in model #1)
201-300 days deployed -.37492 USMC wide average for FY07
(.1981105 in model #1)
301-400 days deployed -.40938 USMC wide average for FY07
(.1930562 in model #1)
>400 days deployed -.3307 USMC wide average for FY07

108
(.2527161 in model #1)
FY03 0 (omitted group
from models)
0
FY04 .63848 0
FY05 .55789 0
FY06 .42581 0
FY07 .4727 1 For all MOS Predictions (FY07
is more like FY08 than any other
FY in the sample)
Married .65306 USMC wide average for FY07
(.4692962 in model #1)
Female -.21988 USMC wide average for FY07
(.0600378 in model #1)
E3 0 USMC wide average for FY07
(.0846481 in model #1)
E4 .77123 USMC wide average for FY07
(.5838451 in model #1)
E5 .97482 USMC wide average for FY07
(.3300897 in model #1)
E6 1.27231 USMC wide average for FY07
(.00147171 model #1)
MOS dummies Varies by MOS 1 for the MOS being predicted; 0
for all others

109
Model #1

110
Model #2
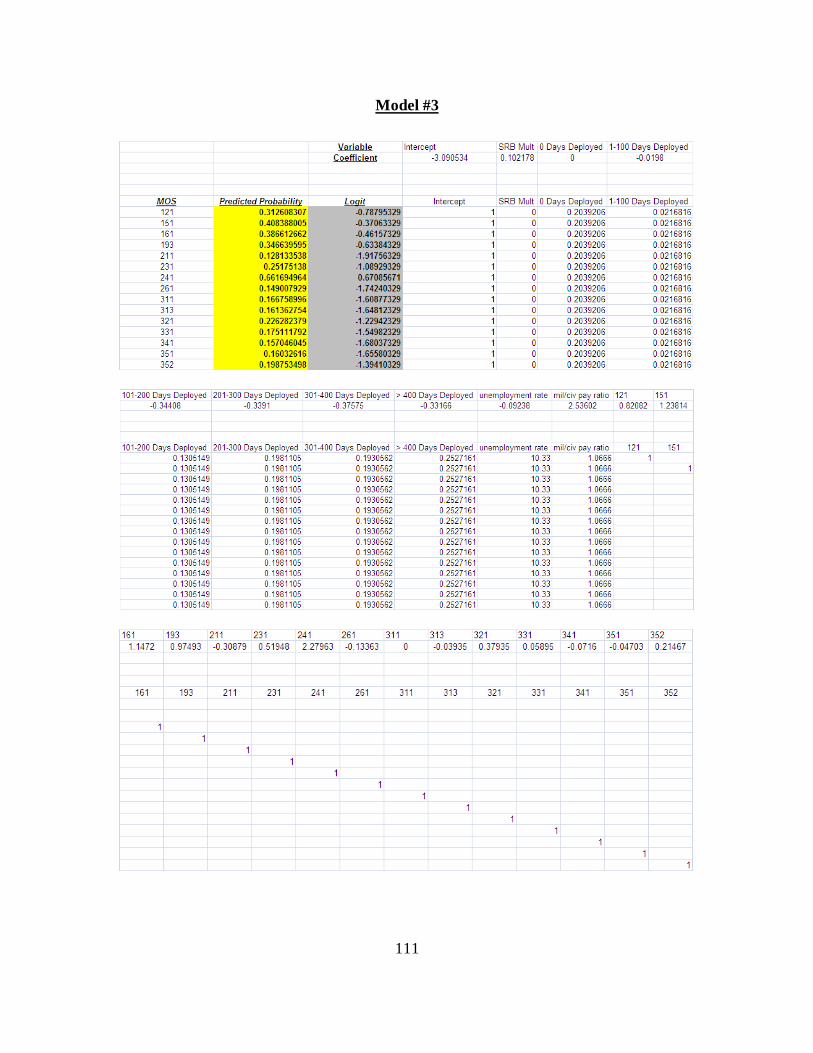
111
Model #3

112
Model #4

113
APPENDIX E. VALIDATION REGRESSION MODEL
Validation Model reenlist srb_multiple 0.14790 (0.01293)*** _1_to_100_gwot_days_deployed -0.18529 (0.03333)*** _101_to_200_gwot_days_deployed -0.50001 (0.02179)*** _201_to_300_gwot_days_deployed -0.45482 (0.02583)*** _301_to_400_gwot_days_deployed -0.51607 (0.03126)*** more_than_400_gwot_days_deployed -0.46551 (0.03557)*** FY04 0.66074 (0.02336)*** FY05 0.58583 (0.02481)*** FY06 0.44755 (0.02752)*** married 0.63907 (0.01585)*** female -0.28433 (0.03321)*** E4 0.78703 (0.03087)*** E5 1.01970 (0.03304)*** E6 1.24511 (0.16554)*** mos_0121 0.75125 (0.06047)*** mos_0151 1.26796 (0.05825)*** mos_0161 1.22258 (0.14089)*** mos_0193 -0.78022 (1.14834) mos_0211 -1.30314 (1.10361) mos_0231 0.42392 (0.09639)***
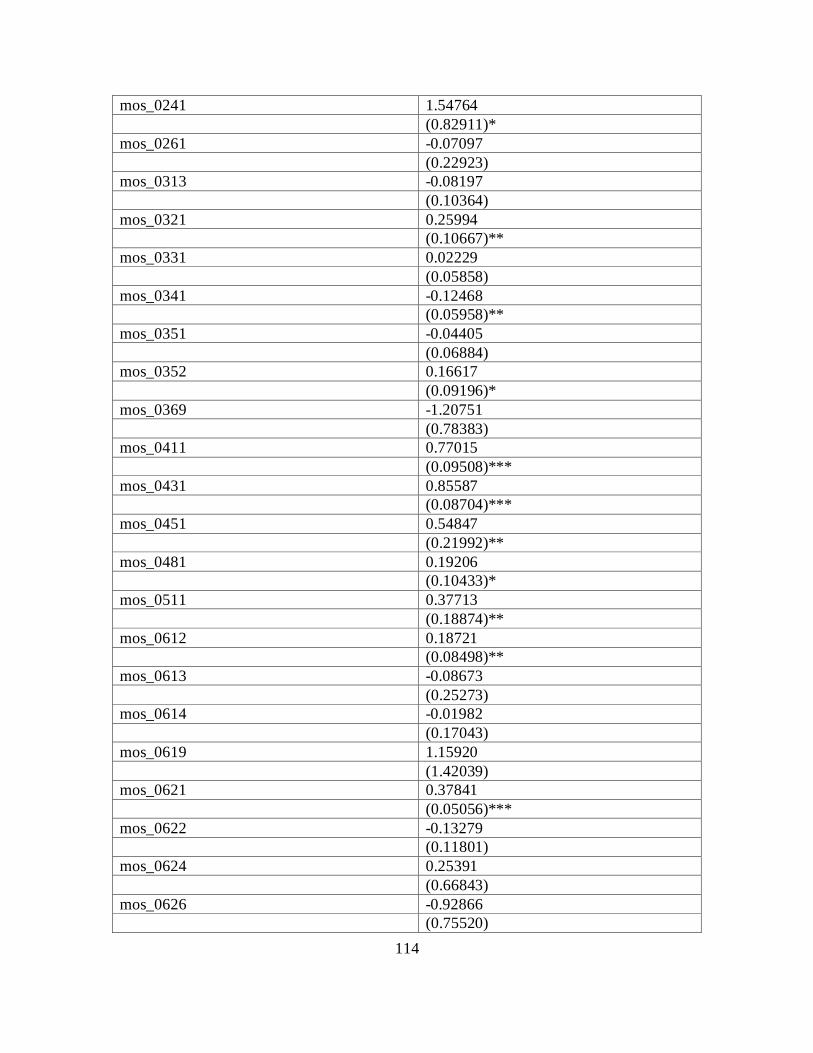
114
mos_0241 1.54764 (0.82911)* mos_0261 -0.07097 (0.22923) mos_0313 -0.08197 (0.10364) mos_0321 0.25994 (0.10667)** mos_0331 0.02229 (0.05858) mos_0341 -0.12468 (0.05958)** mos_0351 -0.04405 (0.06884) mos_0352 0.16617 (0.09196)* mos_0369 -1.20751 (0.78383) mos_0411 0.77015 (0.09508)*** mos_0431 0.85587 (0.08704)*** mos_0451 0.54847 (0.21992)** mos_0481 0.19206 (0.10433)* mos_0511 0.37713 (0.18874)** mos_0612 0.18721 (0.08498)** mos_0613 -0.08673 (0.25273) mos_0614 -0.01982 (0.17043) mos_0619 1.15920 (1.42039) mos_0621 0.37841 (0.05056)*** mos_0622 -0.13279 (0.11801) mos_0624 0.25391 (0.66843) mos_0626 -0.92866 (0.75520)

115
mos_0627 -0.07681 (0.19158) mos_0651 -0.17100 (0.10282)* mos_0656 -0.17202 (0.09368)* mos_0811 0.17332 (0.06782)** mos_0842 0.37389 (0.25505) mos_0844 0.40822 (0.10392)*** mos_0847 0.98688 (0.29040)*** mos_0861 0.26779 (0.15872)* mos_1141 0.58180 (0.11701)*** mos_1142 0.63949 (0.10630)*** mos_1161 0.40817 (0.14398)*** mos_1171 0.60825 (0.10314)*** mos_1181 0.44234 (0.28399) mos_1316 0.45472 (0.16601)*** mos_1341 0.40224 (0.08559)*** mos_1345 0.29599 (0.08389)*** mos_1361 0.72630 (0.21695)*** mos_1371 0.40091 (0.06771)*** mos_1391 0.55723 (0.08548)*** mos_1812 0.51218 (0.12253)*** mos_1833 0.45843 (0.07253)*** mos_2111 0.65740 (0.08267)***

116
mos_2131 0.23083 (0.18888) mos_2141 0.42893 (0.10778)*** mos_2146 0.64984 (0.14590)*** mos_2147 0.31230 (0.14591)** mos_2161 -0.02728 (0.23568) mos_2171 0.36467 (0.14222)** mos_2311 0.71044 (0.08149)*** mos_2336 1.13150 (0.94073) mos_2621 0.37889 (0.12188)*** mos_2631 0.38039 (0.23440) mos_2651 0.24935 (0.16324) mos_2671 -0.59257 (0.20854)*** mos_2673 -0.25756 (0.31301) mos_2674 -0.29985 (0.21662) mos_2676 -0.08947 (0.22784) mos_2818 4.87626 (1.01990)*** mos_2822 0.17938 (0.23890) mos_2823 0.94616 (0.61219) mos_2831 0.47223 (0.19049)** mos_2834 0.33029 (0.64372) mos_2841 6.23141 (1.00508)*** mos_2844 -0.03232 (0.09446)

117
mos_2846 -0.10463 (0.12052) mos_2847 -0.28856 (0.11663)** mos_2871 -0.14800 (0.30542) mos_2874 0.50680 (1.24095) mos_2881 0.18929 (0.18111) mos_2887 0.34202 (0.35736) mos_3043 1.09788 (0.05991)*** mos_3051 0.77941 (0.06491)*** mos_3052 0.97105 (0.18465)*** mos_3112 0.82956 (0.11668)*** mos_3381 0.67828 (0.06661)*** mos_3432 1.27355 (0.09991)*** mos_3451 1.13115 (0.14446)*** mos_3521 0.59202 (0.05846)*** mos_3529 0.88808 (1.02079) mos_3531 0.61757 (0.05317)*** mos_3533 0.31175 (0.07715)*** mos_4066 4.05892 (0.34929)*** mos_4067 0.12252 (0.21487) mos_4133 0.14179 (1.28895) mos_4341 0.69642 (0.17225)*** mos_4421 0.92789 (0.13519)***

118
mos_4611 0.73855 (0.33560)** mos_4612 0.52847 (0.31496)* mos_4641 0.49562 (0.20517)** mos_4671 0.47714 (0.24702)* mos_5524 0.81366 (0.10951)*** mos_5711 0.67232 (0.10017)*** mos_5811 0.27068 (0.05922)*** mos_5821 -0.65814 (1.18328) mos_5831 0.48426 (0.11496)*** mos_5937 0.73245 (0.21173)*** mos_5939 -0.99970 (1.05010) mos_5942 0.67239 (0.19523)*** mos_5952 0.40773 (0.24051)* mos_5953 0.33744 (0.18768)* mos_5954 0.50816 (0.19611)*** mos_5962 0.08353 (0.22041) mos_5963 0.09934 (0.30271) mos_5979 -0.64349 (0.76926) mos_6042 0.52072 (0.16042)*** mos_6046 0.79547 (0.09362)*** mos_6048 0.10307 (0.11709) mos_6062 0.11379 (0.17145)

119
mos_6072 0.51068 (0.11290)*** mos_6073 0.46571 (0.14220)*** mos_6074 -0.16710 (0.32098) mos_6092 0.45061 (0.13253)*** mos_6112 0.20683 (0.13175) mos_6113 0.13373 (0.12981) mos_6114 0.06044 (0.12494) mos_6116 0.73285 (0.62598) mos_6122 0.33583 (0.23458) mos_6123 0.47114 (0.20399)** mos_6124 0.93919 (0.24724)*** mos_6132 0.58698 (0.20501)*** mos_6152 0.17091 (0.14936) mos_6153 0.24650 (0.12946)* mos_6154 0.39096 (0.12718)*** mos_6156 1.15115 (0.74901) mos_6172 0.17035 (0.13459) mos_6173 0.22232 (0.15014) mos_6174 0.41988 (0.21944)* mos_6212 -0.17556 (0.17501) mos_6213 -0.07569 (0.44029) mos_6214 -0.20341 (0.45172)

120
mos_6216 0.28885 (0.23934) mos_6217 0.06091 (0.13828) mos_6222 0.24932 (0.27242) mos_6223 -0.94884 (0.54918)* mos_6226 0.02089 (0.32337) mos_6227 0.50703 (0.22884)** mos_6232 2.68435 (0.82271)*** mos_6252 -0.02495 (0.17961) mos_6253 0.15389 (0.35320) mos_6256 0.53566 (0.20877)** mos_6257 -0.21086 (0.18114) mos_6276 -0.42005 (0.26913) mos_6282 -0.00905 (0.32499) mos_6283 0.49643 (0.49575) mos_6286 0.39152 (0.46758) mos_6287 0.32757 (0.26914) mos_6311 3.49874 (0.76560)*** mos_6312 -0.29670 (0.23972) mos_6313 0.65605 (0.31922)** mos_6314 -0.25867 (0.51408) mos_6316 0.53397 (0.27428)* mos_6317 0.78014 (0.15320)***

121
mos_6322 0.54410 (0.14444)*** mos_6323 0.41534 (0.11953)*** mos_6324 0.45643 (0.12498)*** mos_6326 0.48627 (0.73930) mos_6332 -0.30834 (0.23355) mos_6333 0.03524 (0.31621) mos_6335 3.62107 (1.05464)*** mos_6336 0.24948 (0.29778) mos_6337 0.55356 (0.15495)*** mos_6386 0.49142 (0.32677) mos_6412 0.31744 (0.16978)* mos_6413 0.26839 (0.14323)* mos_6423 0.17743 (0.21395) mos_6432 0.28750 (0.19011) mos_6433 0.55285 (0.19053)*** mos_6461 -0.09479 (0.33604) mos_6462 0.65177 (0.27848)** mos_6463 1.21847 (0.37959)*** mos_6464 -0.62040 (0.42951) mos_6466 0.41242 (0.27324) mos_6467 -0.12538 (0.23762) mos_6482 0.40553 (0.25977)

122
mos_6483 0.97739 (0.22112)*** mos_6484 -0.16739 (0.27907) mos_6492 0.39614 (0.12837)*** mos_6493 0.63672 (0.37075)* mos_6531 0.59139 (0.07609)*** mos_6541 0.63390 (0.08800)*** mos_6672 0.99569 (0.07955)*** mos_6694 0.62292 (0.17402)*** mos_6821 0.16069 (0.20161) mos_6842 0.55396 (0.57085) mos_7011 0.35857 (0.15736)** mos_7041 1.04218 (0.10572)*** mos_7051 0.30428 (0.09511)*** mos_7212 0.23244 (0.12092)* mos_7234 0.50848 (0.18725)*** mos_7236 1.92711 (0.85875)** mos_7242 0.79838 (0.16887)*** mos_7251 0.11949 (1.11093) mos_7257 0.12049 (0.11225) mos_7314 0.29318 (0.36252) mos_7372 0.88412 (0.27059)*** mos_7382 0.61505 (0.32424)*

123
Constant -2.66767 (0.04999)*** Observations 84191 Standard errors in parentheses * significant at 10%; ** significant at 5%; *** significant at 1%

124
THIS PAGE INTENTIONALLY LEFT BLANK

125
APPENDIX F. FY07 PREDICTION RESULTS (USMC WIDE MEAN VALUES FOR X’S)
MOS Predicted Reenlist Rate Actual 07 Reenlist Rate Percent Error mos_0121 0.32 0.44 (0.27) mos_0151 0.44 0.48 (0.08) mos_0161 0.43 0.45 (0.06) mos_0211 0.11 0.33 (0.67) mos_0231 0.41 0.31 0.35 mos_0261 0.30 0.15 1.02 mos_0311 0.28 0.24 0.19 mos_0313 0.27 0.24 0.13 mos_0321 0.37 0.36 0.04 mos_0331 0.29 0.24 0.18 mos_0341 0.26 0.23 0.11 mos_0351 0.28 0.21 0.33 mos_0352 0.34 0.23 0.49 mos_0411 0.35 0.36 (0.01) mos_0431 0.37 0.43 (0.12) mos_0451 0.32 0.32 0.01 mos_0481 0.24 0.24 (0.00) mos_0511 0.32 0.37 (0.14) mos_0612 0.25 0.37 (0.34) mos_0613 0.19 0.30 (0.38) mos_0614 0.21 0.31 (0.31) mos_0621 0.27 0.33 (0.19) mos_0622 0.18 0.26 (0.31) mos_0627 0.23 0.44 (0.48) mos_0651 0.18 0.26 (0.31) mos_0656 0.18 0.26 (0.33) mos_0811 0.29 0.29 0.01 mos_0842 0.27 0.26 0.04 mos_0844 0.34 0.35 (0.02) mos_0847 0.42 0.13 2.39 mos_0861 0.38 0.41 (0.09) mos_1141 0.28 0.23 0.20 mos_1142 0.31 0.25 0.26 mos_1161 0.25 0.22 0.11 mos_1171 0.29 0.32 (0.11) mos_1316 0.26 0.21 0.20 mos_1341 0.25 0.28 (0.12) mos_1345 0.24 0.25 (0.04) mos_1361 0.31 0.22 0.40

126
mos_1371 0.29 0.25 0.15 mos_1391 0.28 0.24 0.15 mos_1812 0.33 0.32 0.03 mos_1833 0.33 0.25 0.34 mos_2111 0.30 0.30 0.01 mos_2131 0.24 0.36 (0.32) mos_2141 0.33 0.25 0.31 mos_2146 0.40 0.33 0.21 mos_2147 0.32 0.41 (0.23) mos_2161 0.21 0.46 (0.54) mos_2171 0.30 0.17 0.76 mos_2311 0.34 0.33 0.05 mos_2621 0.30 0.33 (0.10) mos_2631 0.37 0.28 0.32 mos_2651 0.35 0.38 (0.08) mos_2671 0.20 0.24 (0.17) mos_2673 0.26 0.33 (0.21) mos_2674 0.25 0.52 (0.51) mos_2676 0.27 0.30 (0.10) mos_2818 0.97 1.00 (0.03) mos_2822 0.26 0.40 (0.35) mos_2831 0.39 0.44 (0.11) mos_2841 0.99 1.00 (0.01) mos_2844 0.25 0.40 (0.38) mos_2846 0.21 0.38 (0.45) mos_2847 0.18 0.30 (0.40) mos_2871 0.18 0.08 1.16 mos_2881 0.31 0.19 0.66 mos_2887 0.34 0.11 2.07 mos_3043 0.40 0.41 (0.02) mos_3051 0.32 0.38 (0.14) mos_3052 0.37 0.49 (0.25) mos_3112 0.33 0.45 (0.26) mos_3381 0.30 0.36 (0.16) mos_3432 0.46 0.38 0.20 mos_3451 0.44 0.41 0.08 mos_3521 0.30 0.31 (0.02) mos_3531 0.30 0.32 (0.05) mos_3533 0.24 0.29 (0.15) mos_4066 0.93 1.00 (0.07) mos_4341 0.37 0.28 0.33 mos_4421 0.36 0.53 (0.32) mos_4612 0.29 0.42 (0.31) mos_4641 0.26 0.36 (0.27)

127
mos_4671 0.28 0.43 (0.36) mos_5524 0.36 0.34 0.08 mos_5711 0.33 0.36 (0.09) mos_5811 0.25 0.29 (0.13) mos_5831 0.28 0.38 (0.28) mos_5939 0.13 0.24 (0.46) mos_5942 0.30 0.10 2.16 mos_5952 0.25 0.50 (0.50) mos_5953 0.24 0.18 0.32 mos_5954 0.27 0.27 0.00 mos_5962 0.19 0.56 (0.65) mos_5979 0.10 0.25 (0.59) mos_6042 0.32 0.49 (0.35) mos_6046 0.36 0.44 (0.18) mos_6048 0.22 0.40 (0.46) mos_6062 0.22 0.27 (0.18) mos_6072 0.30 0.41 (0.28) mos_6073 0.29 0.28 0.05 mos_6074 0.19 0.52 (0.64) mos_6092 0.30 0.35 (0.15) mos_6112 0.25 0.40 (0.37) mos_6113 0.25 0.21 0.22 mos_6114 0.24 0.22 0.07 mos_6116 0.38 0.21 0.78 mos_6122 0.28 0.40 (0.31) mos_6123 0.34 0.33 0.01 mos_6124 0.47 0.36 0.28 mos_6132 0.31 0.31 0.03 mos_6152 0.23 0.31 (0.26) mos_6153 0.26 0.27 (0.03) mos_6154 0.29 0.35 (0.19) mos_6156 0.48 0.50 (0.03) mos_6172 0.29 0.35 (0.16) mos_6173 0.30 0.29 0.04 mos_6174 0.38 0.39 (0.03) mos_6212 0.18 0.33 (0.47) mos_6213 0.19 0.23 (0.17) mos_6214 0.18 0.25 (0.27) mos_6216 0.27 0.34 (0.22) mos_6217 0.23 0.40 (0.43) mos_6222 0.26 0.31 (0.17) mos_6226 0.21 0.50 (0.59) mos_6227 0.31 0.63 (0.50) mos_6252 0.21 0.21 0.02

128
mos_6253 0.24 0.25 (0.03) mos_6256 0.29 0.50 (0.42) mos_6257 0.17 0.36 (0.53) mos_6276 0.18 0.28 (0.33) mos_6282 0.19 0.31 (0.38) mos_6283 0.36 0.60 (0.40) mos_6286 0.27 0.33 (0.18) mos_6287 0.26 0.35 (0.26) mos_6312 0.18 0.30 (0.39) mos_6313 0.36 0.10 2.63 mos_6314 0.20 0.33 (0.41) mos_6316 0.32 0.60 (0.47) mos_6317 0.39 0.27 0.45 mos_6322 0.34 0.34 (0.01) mos_6323 0.34 0.41 (0.17) mos_6324 0.33 0.48 (0.31) mos_6326 0.39 0.42 (0.07) mos_6332 0.20 0.42 (0.53) mos_6333 0.23 0.15 0.52 mos_6336 0.31 0.56 (0.45) mos_6337 0.34 0.24 0.41 mos_6386 0.33 0.22 0.46 mos_6412 0.25 0.28 (0.12) mos_6413 0.24 0.28 (0.15) mos_6423 0.22 0.31 (0.28) mos_6432 0.27 0.19 0.41 mos_6433 0.31 0.38 (0.20) mos_6461 0.21 0.25 (0.15) mos_6462 0.34 0.22 0.55 mos_6463 0.54 0.29 0.88 mos_6464 0.11 0.50 (0.79) mos_6466 0.28 0.29 (0.03) mos_6467 0.23 0.43 (0.45) mos_6482 0.29 0.46 (0.36) mos_6483 0.40 0.40 (0.00) mos_6484 0.20 0.50 (0.60) mos_6492 0.27 0.41 (0.33) mos_6493 0.36 0.36 (0.02) mos_6531 0.33 0.35 (0.05) mos_6541 0.34 0.35 (0.03) mos_6672 0.43 0.53 (0.19) mos_6694 0.31 0.29 0.06 mos_6821 0.30 0.23 0.34 mos_6842 0.39 0.50 (0.22)

129
mos_7011 0.25 0.19 0.37 mos_7041 0.42 0.47 (0.11) mos_7051 0.24 0.23 0.05 mos_7212 0.30 0.26 0.14 mos_7234 0.38 0.28 0.35 mos_7236 0.72 0.50 0.43 mos_7242 0.40 0.36 0.10 mos_7257 0.34 0.40 (0.14) mos_7314 0.31 0.09 2.46 mos_7372 0.38 0.47 (0.19) mos_7382 0.32 0.33 (0.04)
Average Total Percent Error 0.32

130
THIS PAGE INTENTIONALLY LEFT BLANK

131
APPENDIX G. VALIDATION REGRESSION MODEL—OMITS DEPLOYMENT VARIABLES
Validation Model – Omits Deployment Tempo
Coefficient Estimates
srb_multiple 0.14234 (0.01278)*** FY04 0.57164 (0.02296)*** FY05 0.43219 (0.02369)*** FY06 0.25996 (0.02559)*** married 0.64446 (0.01575)*** female -0.18757 (0.03282)*** E4 0.78044 (0.03076)*** E5 1.02273 (0.03293)*** E6 1.32367 (0.16440)*** mos_0121 0.93706 (0.05978)*** mos_0151 1.43827 (0.05764)*** mos_0161 1.25329 (0.14009)*** mos_0193 -0.56290 (1.14601) mos_0211 -1.30024 (1.10679) mos_0231 0.42832 (0.09572)*** mos_0241 1.62314 (0.82040)** mos_0261 -0.04255 (0.22806) mos_0313 -0.12062 (0.10325) mos_0321 0.22351 (0.10615)**

132
mos_0331 0.01303 (0.05840) mos_0341 -0.12685 (0.05941)** mos_0351 -0.04242 (0.06859) mos_0352 0.13927 (0.09169) mos_0369 -1.14750 (0.78018) mos_0411 0.82249 (0.09459)*** mos_0431 0.89360 (0.08675)*** mos_0451 0.58775 (0.21941)*** mos_0481 0.17015 (0.10390) mos_0511 0.46116 (0.18751)** mos_0612 0.18126 (0.08475)** mos_0613 0.06364 (0.25080) mos_0614 -0.02652 (0.16993) mos_0619 1.03681 (1.41846) mos_0621 0.37632 (0.05034)*** mos_0622 -0.15951 (0.11762) mos_0624 0.24681 (0.66466) mos_0626 -0.88154 (0.74989) mos_0627 -0.09287 (0.19112) mos_0651 -0.05397 (0.10228) mos_0656 -0.08249 (0.09325) mos_0811 0.16701 (0.06744)**

133
mos_0842 0.32860 (0.25329) mos_0844 0.44128 (0.10325)*** mos_0847 1.05794 (0.28970)*** mos_0861 0.27899 (0.15820)* mos_1141 0.61067 (0.11624)*** mos_1142 0.64615 (0.10582)*** mos_1161 0.44231 (0.14363)*** mos_1171 0.61651 (0.10263)*** mos_1181 0.49638 (0.28214)* mos_1316 0.48311 (0.16527)*** mos_1341 0.42790 (0.08524)*** mos_1345 0.28201 (0.08358)*** mos_1361 0.75966 (0.21536)*** mos_1371 0.37538 (0.06736)*** mos_1391 0.57224 (0.08507)*** mos_1812 0.44124 (0.12216)*** mos_1833 0.40653 (0.07209)*** mos_2111 0.75084 (0.08214)*** mos_2131 0.25346 (0.18867) mos_2141 0.42233 (0.10718)*** mos_2146 0.60980 (0.14518)*** mos_2147 0.28456 (0.14569)*

134
mos_2161 0.07092 (0.23427) mos_2171 0.37228 (0.14155)*** mos_2311 0.75112 (0.08092)*** mos_2336 1.02110 (0.93222) mos_2621 0.47928 (0.12140)*** mos_2631 0.45243 (0.23375)* mos_2651 0.30605 (0.16267)* mos_2671 -0.56234 (0.20727)*** mos_2673 -0.04902 (0.31118) mos_2674 -0.14555 (0.21566) mos_2676 0.02076 (0.22650) mos_2818 5.02863 (1.01905)*** mos_2822 0.33114 (0.23831) mos_2823 0.75533 (0.61407) mos_2831 0.49381 (0.18953)*** mos_2834 0.27173 (0.64122) mos_2841 6.36700 (1.00493)*** mos_2844 0.00240 (0.09403) mos_2846 -0.06586 (0.12011) mos_2847 -0.23561 (0.11615)** mos_2871 -0.02918 (0.30443) mos_2874 0.39350 (1.24100)

135
mos_2881 0.26600 (0.18021) mos_2887 0.39334 (0.35329) mos_3043 1.18728 (0.05953)*** mos_3051 0.84627 (0.06452)*** mos_3052 1.04707 (0.18403)*** mos_3112 1.03393 (0.11596)*** mos_3381 0.71457 (0.06629)*** mos_3432 1.41843 (0.09918)*** mos_3451 1.34841 (0.14313)*** mos_3521 0.60373 (0.05823)*** mos_3529 0.85591 (1.02044) mos_3531 0.65578 (0.05289)*** mos_3533 0.28640 (0.07689)*** mos_4066 4.25084 (0.34873)*** mos_4067 0.36247 (0.21421)* mos_4133 0.21283 (1.29213) mos_4341 0.86698 (0.17063)*** mos_4421 1.10289 (0.13416)*** mos_4611 1.01579 (0.33376)*** mos_4612 0.70427 (0.31397)** mos_4641 0.61157 (0.20386)*** mos_4671 0.63920 (0.24460)***

136
mos_5524 1.01588 (0.10866)*** mos_5711 0.72808 (0.09966)*** mos_5811 0.40104 (0.05868)*** mos_5821 -0.43400 (1.16848) mos_5831 0.77775 (0.11407)*** mos_5937 0.76600 (0.21097)*** mos_5939 -0.97217 (1.04910) mos_5942 0.74354 (0.19417)*** mos_5952 0.44739 (0.23912)* mos_5953 0.43664 (0.18649)** mos_5954 0.58834 (0.19537)*** mos_5962 0.17689 (0.21882) mos_5963 0.26242 (0.30035) mos_5979 -0.50264 (0.76646) mos_6042 0.60598 (0.15959)*** mos_6046 0.87661 (0.09312)*** mos_6048 0.19689 (0.11654)* mos_6062 0.18885 (0.17059) mos_6072 0.61776 (0.11240)*** mos_6073 0.57673 (0.14151)*** mos_6074 0.02464 (0.31898) mos_6092 0.53457 (0.13195)***
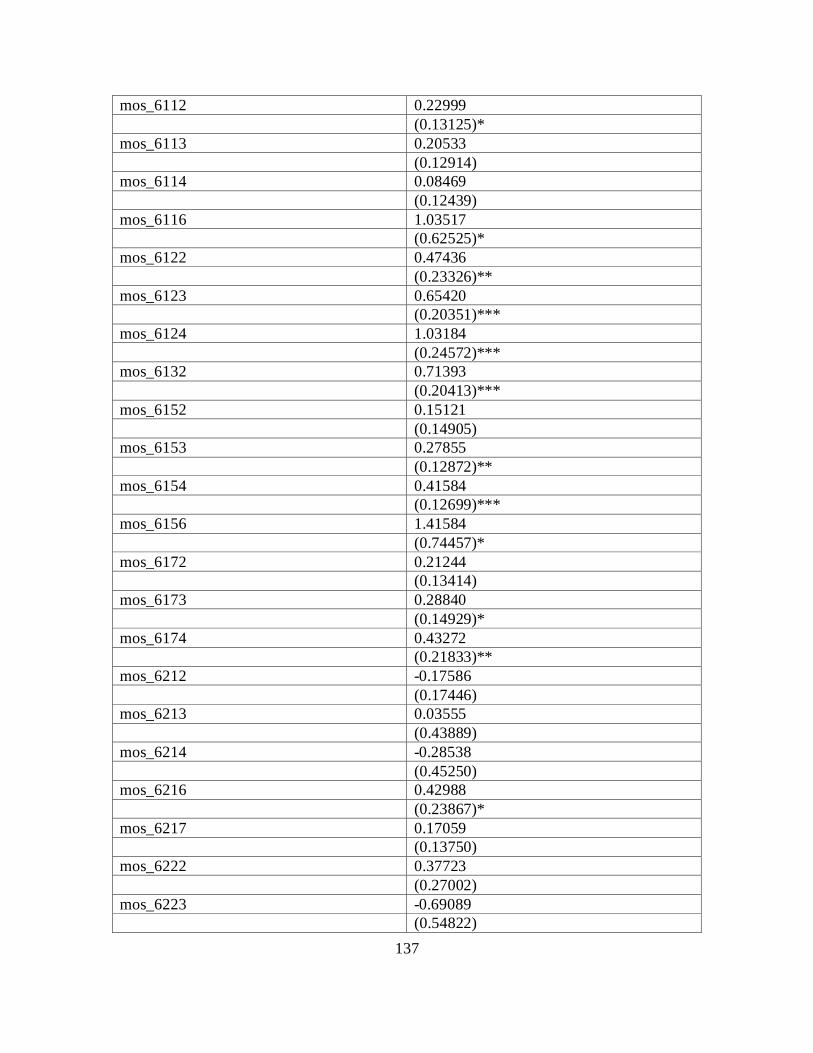
137
mos_6112 0.22999 (0.13125)* mos_6113 0.20533 (0.12914) mos_6114 0.08469 (0.12439) mos_6116 1.03517 (0.62525)* mos_6122 0.47436 (0.23326)** mos_6123 0.65420 (0.20351)*** mos_6124 1.03184 (0.24572)*** mos_6132 0.71393 (0.20413)*** mos_6152 0.15121 (0.14905) mos_6153 0.27855 (0.12872)** mos_6154 0.41584 (0.12699)*** mos_6156 1.41584 (0.74457)* mos_6172 0.21244 (0.13414) mos_6173 0.28840 (0.14929)* mos_6174 0.43272 (0.21833)** mos_6212 -0.17586 (0.17446) mos_6213 0.03555 (0.43889) mos_6214 -0.28538 (0.45250) mos_6216 0.42988 (0.23867)* mos_6217 0.17059 (0.13750) mos_6222 0.37723 (0.27002) mos_6223 -0.69089 (0.54822)

138
mos_6226 0.25884 (0.32268) mos_6227 0.67930 (0.22802)*** mos_6232 2.78765 (0.82068)*** mos_6252 -0.01543 (0.17883) mos_6253 0.27932 (0.35136) mos_6256 0.63696 (0.20808)*** mos_6257 -0.08386 (0.18020) mos_6276 -0.36491 (0.26734) mos_6282 -0.01597 (0.32307) mos_6283 0.58376 (0.49449) mos_6286 0.50446 (0.46118) mos_6287 0.44044 (0.26755)* mos_6311 3.66332 (0.76424)*** mos_6312 -0.22852 (0.23864) mos_6313 0.80081 (0.31788)** mos_6314 -0.32689 (0.51165) mos_6316 0.63903 (0.27281)** mos_6317 0.90543 (0.15253)*** mos_6322 0.57805 (0.14380)*** mos_6323 0.48799 (0.11895)*** mos_6324 0.46602 (0.12445)*** mos_6326 0.82398 (0.73801)

139
mos_6332 -0.27900 (0.23277) mos_6333 0.18806 (0.31536) mos_6335 3.67029 (1.05510)*** mos_6336 0.38900 (0.29487) mos_6337 0.69841 (0.15427)*** mos_6386 0.60080 (0.32576)* mos_6412 0.44930 (0.16903)*** mos_6413 0.37114 (0.14231)*** mos_6423 0.32527 (0.21291) mos_6432 0.45168 (0.18897)** mos_6433 0.61558 (0.18981)*** mos_6461 0.09055 (0.33484) mos_6462 0.86698 (0.27765)*** mos_6463 1.43167 (0.37302)*** mos_6464 -0.34114 (0.42912) mos_6466 0.56758 (0.27151)** mos_6467 -0.01068 (0.23710) mos_6482 0.53621 (0.25883)** mos_6483 1.04630 (0.21987)*** mos_6484 0.09520 (0.27868) mos_6492 0.56781 (0.12750)*** mos_6493 0.79289 (0.36547)**

140
mos_6531 0.64972 (0.07566)*** mos_6541 0.72827 (0.08746)*** mos_6672 1.11930 (0.07908)*** mos_6694 0.77739 (0.17333)*** mos_6821 0.24749 (0.19948) mos_6842 0.65416 (0.57115) mos_7011 0.42702 (0.15636)*** mos_7041 1.13235 (0.10494)*** mos_7051 0.43649 (0.09444)*** mos_7212 0.26256 (0.12011)** mos_7234 0.53347 (0.18624)*** mos_7236 1.76910 (0.85311)** mos_7242 0.77599 (0.16798)*** mos_7251 0.21996 (1.10710) mos_7257 0.20462 (0.11118)* mos_7314 0.17047 (0.36162) mos_7372 0.97051 (0.26972)*** mos_7382 0.64425 (0.32255)** Constant -2.87832 (0.04925)*** Observations 84191 Standard errors in parentheses * significant at 10%; ** significant at 5%; *** significant at 1%

141
LIST OF REFERENCES
The Bureau of Labor Statistics. “Searchable Database.” https://data.bls.gov (accessed 20 October 2008).
Hansen, Michael L. and Wegner, Jennie W. “Why Do Pay Elasticity Estimates Differ?” Center for Naval Analyses, March 2002.
Hattiangadi, A.U. and Lee, L.G. and Quester, A.O. “Deployment Tempo and Retention in the Marine Corps.” Center for Naval Analyses, October 2005.
———. “Marine Corps Deployment Tempo and Retention in FY05.” Center for Naval Analyses, March 2006.
Hattiangadi, A.U. and Shuford, R.W. and Quester, A.O. “Marine Corps Retention in the Post 9/11 Era: The Effects of Deployment Tempo on Marines With and Without Dependents.” Center for Naval Analyses, January 2006.
Hosek, J. and Kavanagh, J. and Miller, L. “How Deployments Affect Servicemembers,” RAND Corporation, 2006.
Lien, D. and Quester, A. and Shuford, R. “Marine Corps Deployment Tempo and Retention from FY04 through FY07.” Center for Naval Analyses, October 2008.
Marine Corps Administrative Message. Subject: MCBUL 7220 Multiples for the Fiscal Year 2002 (FY02) Selective Reenlistment Bonus (SRB) Program, September 2001.
———. Subject: MCBUL 7220 Fiscal Year 2007 (FY07) Selective Reenlistment Bonus (SRB) Program, July 2006.
———. Subject: MCBUL 7220 FY07 End Strength Incentive, February 2007.
———. Subject: MCBUL 7220 Fiscal Year 2009 (FY09) Selective Reenlistment Bonus (SRB) Program and FY09 Broken Service SRB (BSSRB) Program, June 2008.
Marine Corps Order 7220.24M. Subject: Selective Reenlistment Bonus Program, May 1990.
North, James H. “A Cost-Effective Use of Selective Reenlistment Bonuses and Lateral Occupational Moves.” Center for Naval Analyses, September 1994.

142
THIS PAGE INTENTIONALLY LEFT BLANK

143
INITIAL DISTRIBUTION LIST
1. Defense Technical Information Center Ft. Belvoir, Virginia
2. Dudley Knox Library Naval Postgraduate School Monterey, California
3. Marine Corps Representative Naval Postgraduate School Monterey, California
4. Headquarters Marine Corps
Manpower and Reserve Affairs MPP-20 Quantico, Virginia
5. Dr. Stephen Mehay
Naval Postgraduate School Monterey, California
6. Dr. Elda Pema
Naval Postgraduate School Monterey, California
7. Director, Training and Education, MCCDC, Code C46
Quantico, Virginia 8. Director, Marine Corps Research Center, MCCDC, Code C40RC
Quantico, Virginia 9. Marine Corps Tactical Systems Support Activity (Attn: Operations Officer)
Camp Pendleton, California