(Dated: June 27, 2014)
19
An experimental model of reflection and transmission of ocean waves by an ice floe Alessandro TOFFOLI, 1 , Alberto ALBERELLO, 1 , Luke G. BENNETTS, 2 , Michael H. MEYLAN, 3 , Claudio CAVALIERE, 4 , and Alexander V. BABANIN 1 1 Centre for Ocean Engineering Science and Technology, Swinburne University of Technology, Melbourne, VIC 3122, Australia E-mail: toff[email protected] 2 School of Mathematical Sciences, University of Adelaide, Adelaide, SA 5005, Australia 3 School of Mathematical and Physical Sciences, University of Newcastle, Callaghan NSW 2308, Australia 4 Polytechnic University of Milan, Milan, 20133, Italy (Dated: November 3, 2021) Abstract An experimental model of reflection and transmission of ocean waves by an ice floe is presented. Evolution of mechanically-generated, regular waves is monitored in front and in the lee of a solitary, square floe, made of a synthetic material. Results confirm dependence of reflection and transmission on the period of the incident wave. Results also indicate that wave overwash on the floe affects reflection and transmission. PACS numbers: 1 arXiv:1402.1555v3 [physics.flu-dyn] 26 Jun 2014
Transcript of (Dated: June 27, 2014)

An experimental model of reflection and transmission of ocean
waves by an ice floe
Alessandro TOFFOLI,1, Alberto ALBERELLO,1, Luke G. BENNETTS,2,
Michael H. MEYLAN,3, Claudio CAVALIERE,4, and Alexander V. BABANIN1
1Centre for Ocean Engineering Science and Technology,
Swinburne University of Technology, Melbourne, VIC 3122, Australia
E-mail: [email protected]
2School of Mathematical Sciences, University of Adelaide, Adelaide, SA 5005, Australia
3School of Mathematical and Physical Sciences,
University of Newcastle, Callaghan NSW 2308, Australia
4Polytechnic University of Milan, Milan, 20133, Italy
(Dated: November 3, 2021)
Abstract
An experimental model of reflection and transmission of ocean waves by an ice floe is presented.
Evolution of mechanically-generated, regular waves is monitored in front and in the lee of a solitary,
square floe, made of a synthetic material. Results confirm dependence of reflection and transmission
on the period of the incident wave. Results also indicate that wave overwash on the floe affects
reflection and transmission.
PACS numbers:
1
arX
iv:1
402.
1555
v3 [
phys
ics.
flu-
dyn]
26
Jun
2014

I. INTRODUCTION
Ocean surface waves penetrate tens to hundreds of kilometres into the sea ice-covered
oceans. Wave motions force ice floes to bend and flex. This can cause the floes to fracture
and, subsequently, to break into smaller floes. The region of ice-covered ocean that is broken
by waves provides a convenient definition of the marginal ice zone for ice/ocean models, as
the relatively small floes sizes are likely to affect the dynamic and thermodynamic properties
of the ice cover [1, 2].
The waves themselves are affected by interactions with the floes. In particular, wave
energy attenuates approximately exponentially with distance into the ice-covered ocean [e.g.
3]. There is also evidence that the directional wave spectrum becomes isotropic in the ice-
covered ocean [4]. Wave scattering by floes can explain both exponential attenuation and
spreading of the directional spectrum. However, comparisons between numerical scattering
models and field data indicate that scattering cannot account for all of the attenuation
experienced by waves [5–7]. Dissipative processes, such as overwash (the wave running over
the top of floes), floe-floe collisions, and viscoelasticity, must also be considered. Wave-
induced drift of ice floes may also affect the strength of the attenuation produced.
[8] and [1, 2] recently proposed a model of wave energy transport in the ice-covered ocean
and concomitant wave-induced floe breaking. [9] and [10] proposed similar models of wave
energy transport in the ice-covered ocean but without floe breaking over 15 years earlier.
The wave energy transport models are based on a modified version of the energy balance
equation [11], which includes a source term for wave-ice interactions, Sice. The wave-ice
term parametrizes directional scattering and dissipation of energy due to the presence of ice
cover. Source terms that exist in the open ocean, i.e. wind input Sin and dissipation Sds, are
also modified in the ice-covered ocean, e.g. by scaling the terms according to the proportion
of open ocean present [9, 12]. It is not yet clear how the nonlinear interaction term, Snl,
should be modified. The resulting balance equation reads as follows:
∂E (f, ϑ)
∂t+ ~Cg · ∇E (f, ϑ) = (1− fi) (Sin + Sds) + Snl + Sice, (1)
where E (τ, ϑ) is the wave energy spectrum, as a function of frequency and direction (f and
ϑ, respectively); ~Cg is the group velocity; and fi is the fraction of ice coverage.
In its most simple form, the wave-ice term is Sice = −fiαE/d, where fiα/d is the expo-
2
nential attenuation rate of wave energy per metre due to ice cover. The quantity α is the
attenuation coefficient, and d is the average diameter of the floes. Using the model of [13],
the attenuation rate is related to the proportion of incident wave energy transmitted by a
single floe, Tr, via α = − log(Tr). Note that, using this simple form for Sice, all reflected
wave energy is lost from the system. Alternatively, conservative, directional scattering can
be incorporated, as outlined in [9], [10] and Meylan and Masson [14].
The attenuation rate is functionally dependent on wave period. Attenuation rates mea-
sured in field experiments range from approximately 8 × 10⁻⁴ m−1 for 8–9 s waves, to ap-
proximately 2× 10⁻⁴ m−1 for long waves (periods > 10 s). Although, generally, attenuation
rates increase with decreasing wave periods, a ‘roll-over’ effect, i.e. a decrease in attenuation
for small wave periods (<8 s) has been noted [4]. A summary of recorded attenuation rates
is given in [15].
Field measurements are normally limited to mild wave conditions. Moreover, existing
numerical attenuation models are linear. The functional dependence of the attenuation rate
on wave height is, therefore, not properly understood yet. This includes the onset and
subsequent contribution of highly non-linear processes, such as overwash and the drift of the
ice floe.
In the present paper, we present an experimental model of wave reflection and transmis-
sion, and hence attenuation, by a floe. The experimental model was implemented in the
coastal wave basin at the Coastal Ocean and Sediment Transport (coast) laboratories of
Plymouth University, UK. The floe is made of a synthetic elastic material, which bends and
flexes with the wave motion. Regular waves of prescribed period and amplitude are gener-
ated mechanically. Wave elevation is measured by arrays of wave gauges before and after the
floe. Despite the idealisations of the real-world phenomenon necessary in a laboratory set-
ting, experimental facilities allow investigation of transmission in a controlled environment,
in which the quantities of interest can be measured at high accuracy.
[16] and [17, 18] report experimental models of wave-floe interactions, which are closely
related to the experimental model described here. However, the previous experiments em-
ployed an edge barrier to preclude overwash. We avoid use of the artificial edge barrier.
Further, we provide evidence that overwash affects reflection and transmission properties of
the floe, using measurements provided by a wave gauge located at the centre of the upper
surface of the floe.
3

FIG. 1: Directional wave basin and experimental set-up.
II. LABORATORY EXPERIMENTS
The laboratory facility consists of a directional wave basin of width of 10 m, length 15.5 m
and water depth 0.5 m (see Fig. 1). The tank is equipped with twenty individually controlled
active-piston wave makers, which are capable of absorbing incoming waves by measuring the
force on the front of the paddle and controlling the velocity [19]. At the opposite end, wave
energy is dissipated by a beach of slope 1:10. A reflection analysis in the centre of the basin
shows that the combined effect of the active pistons and the beach ensures an overall level
of reflection lower than 1% of the incoming energy. Contaminating reflection is filtered from
wave records.
At a distance of 2 m from the wave maker, a plastic sheet was deployed to simulate an
ice floe. Two different types of plastic were tested: a polypropylene plastic with density
of 0.905 g cm−3 and Young’s modulus 1600 MPa; and pvc (forex R©) plastic with density
0.500 g cm−3 and Young’s modulus 500 MPa. Note that polypropylene has density similar to
sea ice but has different rigidity. Pvc has a rigidity comparable to sea ice but substantially
4

lower density, which results in a larger freeboard. Polypropylene sheets were provided with
thicknesses 5 mm, 10 mm, 20 mm and 40 mm; pvc was provided with thicknesses 5 mm,
10 mm and 19 mm. The sheets were cut into square floes with side lengths Lplate = 1 m. The
experimental set-up was designed to represent full scale wave-ice interactions in the ratio
1:100.
At the wave maker, waves were generated by imposing three different wave periods,
namely T = 0.6 s, 0.8 s, and 1 s, with corresponding wavelengths Lwave =0.56 m, 1 m and
1.56 m, respectively. The wave fields therefore tested conditions in which the waves were
shorter than, equal to and longer than the floe. The wave amplitude, a, was selected so that
the wave steepness ka, where k is the wavenumber, matched the following values: 0.04, 0.08,
0.1 and 0.15. This range includes gently sloping waves (ka = 0.04 and 0.08) and storm-like
waves (ka = 0.1 and 0.15), without reaching the breaking limit [cf., 20].
Preliminary tests were conducted to monitor the drift of the floe in a wave flume equipped
with glass walls. Only polypropylene plastic was used. Fig. 2 shows the drift in a sequence
of images, for an incident wave with period T = 0.8s and steepness ka = 0.1. Morrison’s
equation predicts the floe will obey an almost period motion with a mean forward movement
similar to the Stokes drift (≈ 0.001 m/s) [21]. However, the plastic sheet was only subjected
to a forward drift (i.e. no oscillatory components) with speed two orders of magnitude
greater (≈ 0.1 m/s) than the Stokes drift.
In the wave basin experiments, a loose mooring was applied at the four corners of the
floe to suppress drift and subsequently avoid collisions with the wave probes. The mooring
allowed the floe to respond to wave forcing in its six rigid-body degrees of freedom (heave,
surge, sway, pitch roll and yaw) and elastic motions. Under wave forcing the mooring moved
rapidly from being loose to being in tension, due to the drift. It is worth mentioning that,
despite an incipient mooring-free motion, floe kinematics and concurrent wave attenuation
might have been partially affected by mooring forces, especially during more severe wave
conditions.
The water surface elevation, η, was monitored with capacitance gauges at a sampling
frequency of 128 Hz. One gauge was deployed approximately 1 m in front of the floe to
capture the incident and reflected waves. In the lee of the floe, three probes were deployed
every metre to track the evolution of the transmitted wave field. At 2 m from the rear edge
of the floe a six-probe array, arranged as a pentagon of radius of 0.25 m and a middle probe,
5

FIG. 2: Drift of a floe (polypropylene) under the influence of a monochromatic wave with period
T = 0.8s and steepness ka = 0.1.
was deployed to monitor the directional properties of the wave field. In order to quantify the
depth of overwash (and concurrent wave motion), a mini-gauge was deployed in the middle
of the upper surface of the floe (see photo in Fig. 1). Its weight was a negligible small
fraction of the floe’s weight. For each configuration, five-minute time series were recorded.
III. RESULTS
A. Water surface elevation
Fig. 3 shows an example of time series for the surface elevation provided by a wave gauge
in the lee of the floe for gently sloping waves (ka = 0.04, left panel) and storm-like waves
(ka = 0.15, right panel). The corresponding time series from a control test, conducted
without the floe, is also shown. For the gently sloping incident waves a notable attenuation
in wave energy is detected. The transmitted waves, however, retain a regular profile. An
even more substantial attenuation of the transmitted waves is recorded for the storm-like
6

100 100.5 101 101.5 102 102.5 103−2
−1
0
1
2
time (s)
η/σ
100 100.5 101 101.5 102 102.5 103−2
−1
0
1
2
time (s)
no ice
with ice
no ice
with ice
FIG. 3: Normalised surface elevation in the lee of a polypropylene plastic sheet of 5 mm for a wave
filed with period T = 0.8 s (wavelength 1 m) and steepness ka = 0.15.
incident waves. The wave profile assumes a more irregular shape as a result of a far more
complicated propagation of energetic waves. In particular, waves overwash the floe.
Fig. 4 shows examples of overwash behaviours for different wave steepnesses and for the
two types of plastic used. The floe is submerged by the wave, either partially (for pvc,
which has a larger freeboard and/or gentle waves) or fully (for polypropylene and energetic
waves).
Shallow-water waves propagate in the overwashed fluid. These waves are generated at
both ends of the floe and interact with each other. Therefore, wave fields may substantially
steepen in the overwashed region. This often results in wave breaking and hence energy
dissipation, thus contributing to attenuation and generation of spurious high frequency free
wave components. Moreover, steep waves intensify the impact of the floe onto the water sur-
face (slamming). This induces stronger loads on the structure, and contributes to generating
spurious high frequency (free) wave components. We attribute the irregularity observed in
the lee of the floe for steep waves to a combination of slamming and overwash leaving the
floe’s edge.
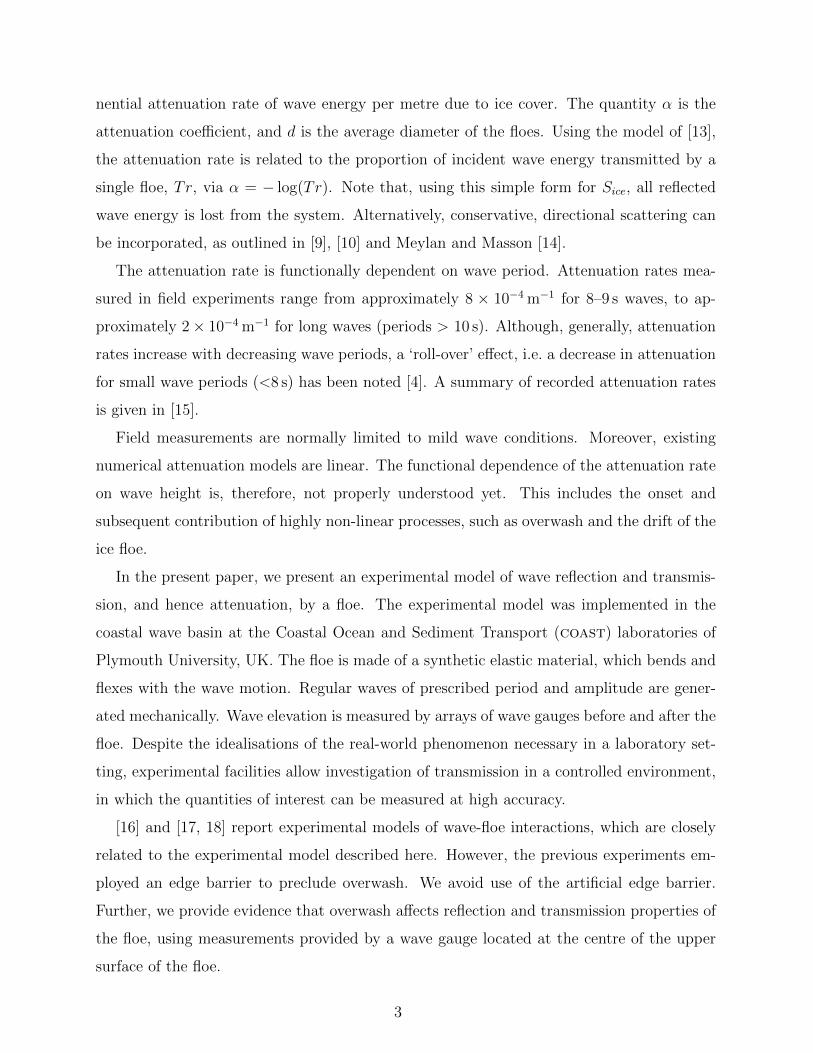
Fig. 5 shows incident (from control tests) and transmitted (in the lee of the floe) wave en-
7

FIG. 4: Overwash of a polypropylene floe (right panels) and pvc floe (left panels) for a wave field
with wavelength equal to the floe length and thickness of 10 mm.
ergy spectra. Spectra are computed from segments of 4096 consecutive records and averaged
over the entire time series. Note that the incident wave is characterised by the dominant
component (monochromatic wave generated at the wave maker) and higher harmonics, i.e.
phase-locked bound waves.
For the smallest wave steepness tested (ka = 0.04), the transmitted wave energy spectrum
of the pvc floe is very close to that of the incident wave. Slight attenuation of wave energy
is detected for polypropylene floe. Overwash and slamming do not occur for the mild
conditions.
Attenuation of the dominant spectral component increases, as incident steepness in-
creases. This is particularly evident for the polypropylene floe, which is subjected to intense
overwash and slamming. The high frequency tails of the spectra for the Polyproplene floe,
contain greater energy than the incident spectra for the three largest steepnesses. Further,
the harmonics are smeared out. This substantiates a relationship with the intensification
of overwash and slamming. Consistent with this hypothesis, growth of the upper tail is far
8
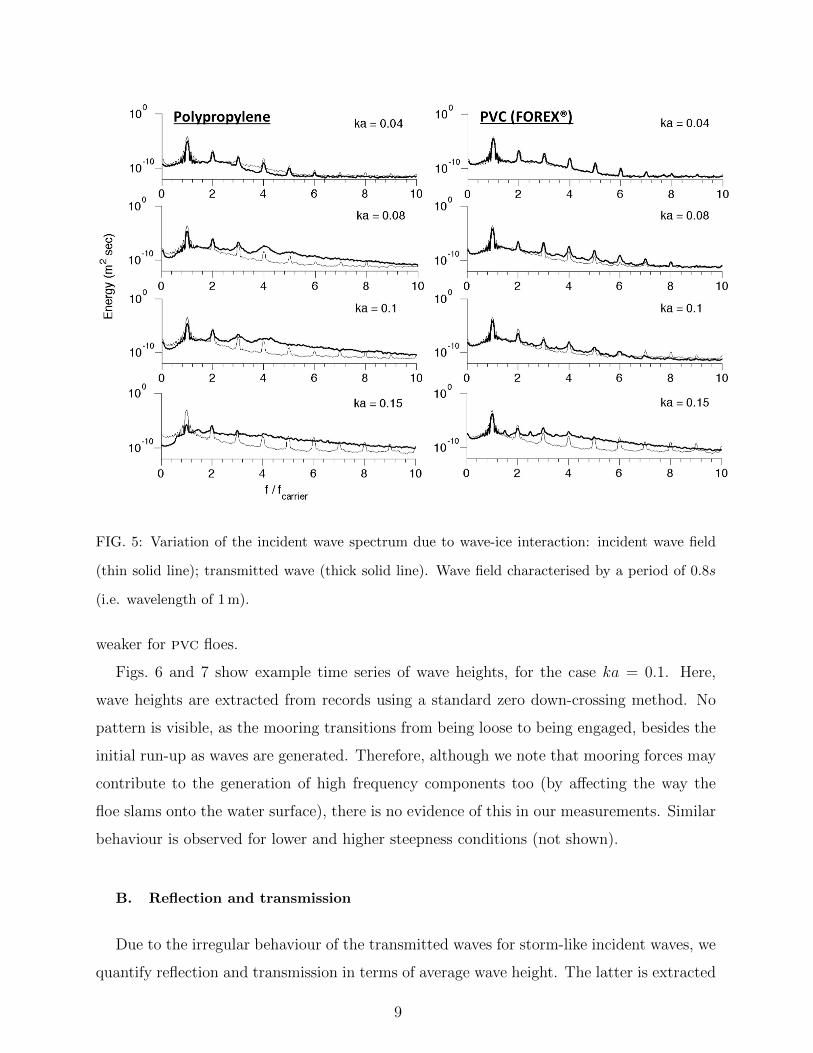
FIG. 5: Variation of the incident wave spectrum due to wave-ice interaction: incident wave field
(thin solid line); transmitted wave (thick solid line). Wave field characterised by a period of 0.8s
(i.e. wavelength of 1 m).
weaker for pvc floes.
Figs. 6 and 7 show example time series of wave heights, for the case ka = 0.1. Here,
wave heights are extracted from records using a standard zero down-crossing method. No
pattern is visible, as the mooring transitions from being loose to being engaged, besides the
initial run-up as waves are generated. Therefore, although we note that mooring forces may
contribute to the generation of high frequency components too (by affecting the way the
floe slams onto the water surface), there is no evidence of this in our measurements. Similar
behaviour is observed for lower and higher steepness conditions (not shown).
B. Reflection and transmission
Due to the irregular behaviour of the transmitted waves for storm-like incident waves, we
quantify reflection and transmission in terms of average wave height. The latter is extracted
9

0 50 100 150 200 250 300
0
0.01
0.02
0.03
0.04
0.05
t (s)
H (
m)
Lwave
= 0.56m
Lwave
= 1.0m
Lwave
= 1.56m
FIG. 6: Temporal variation of zero down-crossing wave height: Polypropylene floe.
from the records with a standard zero down-crossing analysis and further averaged over the
entire time series. Let the average wave height of the incident wave, from the control tests,
be denoted Hi; the average wave height in front of the floe is denoted Hfront; and in the
lee of the floe is denoted Hrear. Reflection and transmission coefficients are computed as
R = (Hfront/Hi)−1 and T = Hrear/Hi, respectively. Note that this approach contains both
linear and nonlinear contributions to the wave field. We also remark that reflection from the
beach and the piston wave maker are removed. Therefore, R only refers to the floe-induced
reflection.
Average reflection and transmission coefficients, as functions of a normalised wavelength
(i.e. a ratio of wavelength to floe length), for the different wave steepness and floe thickness
are presented in Figs. 8 and 9 (polyporpylene and pvc, respectively). Significant variation
of reflection and transmission with wavelength, thickness and steepness are evident.
At the front edge of the floe, a portion of the incident wave is back-scattered. For low wave
steepnesses, reflection increases with increasing floe thickness, in agreement with predictions
of linear models [e.g. 22]. However, the relationship between reflection and thickness becomes
more complicated for larger steepnesses.
Decreasing reflection as wavelength increases is also apparent for low steepness waves.
10

0 50 100 150 200 250 300
0
0.01
0.02
0.03
0.04
0.05
t (s)
H (
m)
Lwave
= 0.56m
Lwave
= 1.0m
Lwave
= 1.56m
FIG. 7: Temporal variation of zero down-crossing wave height: Pvc floe.
This is also consistent with numerical models [e.g. 23]. The relationship becomes more
complicated for larger steepnesses although it is approximately maintained for all steepnesses
by the more compliant pvc floes.
It would be reasonable to expected that, for low wave steepnesses, the transmission coeffi-
cient would follow a complementary monotonic increasing trend with increasing wavelength.
However, the experimental data do not show this expected behaviour. Instead, transmis-
sion is minimum for a wavelength equal to the floe length. This resembles the roll-over in
attenuation found in field data, although we do not claim that our findings are responsible
for the roll-over phenomenon.
As waves become more energetic (that is to say, wave steepness increases), wave reflection
generally reduces. The difference is most pronounced for shorter waves. Strikingly, reduc-
tions in reflection for larger steepnesses are matched by reductions in transmission. The
decrease in transmission is also most significant for shorter waves. This results in a quali-
tative change in the dependence of transmission on wavelength, so that the ‘roll-over’ effect
is diminished. For ka ≥ 0.08, transmission is approximately constant for Lwave/Lplate ≤ 1,
and then increases for the longest wave (see bottom panels in Figs. 8 and 9). Despite some
scatter, transmission trends are the same for the polypropylene and pvc floes. The more
11

FIG. 8: Average transmission coefficient (T ) against the normalised wavelength as a result of the
interaction with a polypropylene floe: thickness = 5 mm (o); thickness = 10 mm (4); thickness =
20 mm (�); and thickness = 40 mm (♦).
compliant pvc floes do, however, transmit a larger proportion of the waves.
C. Effect of overwash
Low steepness waves gently propagate through the floe and hence attenuation is at-
tributed to wave reflection and any energy lost during the flexure of the floe. With the
occurrence of overwash, however, part of the wave energy propagates directly over the floe,
and, thus, is no longer reflected by the front edge of the sheet. This helps to explain the
slight reduction in the reflection coefficient observed for more energetic wave fields. Dissi-
12

FIG. 9: Average transmission coefficient (T ) against the normalised wavelength as a result of the
interaction with a pvc floe: thickness = 5 mm (o); thickness = 10 mm (4); thickness = 19 mm
(�).
pation of wave energy in the overwashed fluid helps explain the reduction of transmission
observed for more energetic waves.
The depth of overwashed fluid and, hence, wave motion over the floe was measured by
a wave gauge. Fig. 10 shows an example time series provided by the wave gauge. From
here on, overwash depth refers to the time series mean. Dependence of overwash depth on
steepness is confirmed in Fig. 11.
The relationship between transmission and overwash depth is shown in Figs. 12 and 13,
for the polypropylene and pvc floes, respectively. Overwash depth is normalised by the
incident wave height. It is evident that the mechanical properties of the floe affect overwash
13

0 5 10 15 20 25 300
2
4
6
8
10
time (s)
η (
X10
−3 m
)
FIG. 10: Example of overwash water surface elevation on a polypropylene plastic sheet of thickness
10 mm in a wave field of wavelength 1 m and steepness ka = 0.15.
0 0.05 0.1 0.15 0.2
0
2
4
6
ka (−)
Ove
rwa
sh
( X
10
−3
m )
FIG. 11: Overwash depth as a function of wave steepness.
depth. In particular, overwash depth is larger for the polypropylene floes, which have smaller
freeboards than the pvc floes.
An overall trend of reducing transmission with increasing overwash depth is evident. The
relationship is mostly clear for the polypropylene floes. Monotonic reduction of transmission
only occurs for the longest waves (Lwave = 1.56m). For shorter waves, there is normally
a sudden drop of the transmission when normalised overwash depth exceeds approximately
0.02. Transmission then further decreases with increasing overwash depth, albeit at a very
14

0 0.02 0.04 0.06 0.08 0.1
0
0.2
0.4
0.6
0.8
1
Overwash / Hi
Tra
nsm
issio
n
Lwave
= 0.56m
Lwave
= 1.0m
Lwave
= 1.56m
FIG. 12: Transmission as a function of normalised overwash depth for polypropylene floes.
0 0.02 0.04 0.06 0.08 0.1
0
0.2
0.4
0.6
0.8
1
Overwash / Hi
Tra
nsm
issio
n
Lwave
= 0.56m
Lwave
= 1.0m
Lwave
= 1.56m
FIG. 13: As in Fig. 12 but for pvc floes.
small rate for polypropylene floes. In comparison, for the pvc floes there is some evidence of
overturning, leading to increasing transmission, for deeper overwash. Note that, eventually,
transmission seems to level off for the largest overwash depths.
The correlation between transmission and normalised overwash depth is weak. Overwash
depth only estimates a uniform layer of water over the floe and it does not consider the
intensity of wave activity. We therefore consider transmission as a function of the significant
wave height of the overwashed fluid (normalised with respect to the incident wave height)
in Figs. 14 and 15. The relationship between transmission and overwash significant wave
height follows a more consistent trend. In particular, there is a monotonic decrease of trans-
15

0 0.1 0.2 0.3 0.4 0.5 0.6 0.7
0
0.2
0.4
0.6
0.8
1
Wave Height on Plate / Incident Wave Height
Tra
nsm
issio
n
Lwave
= 0.56m
Lwave
= 1.0m
Lwave
= 1.56m
FIG. 14: Transmission as a function of normalised overwash significant wave height for polypropy-
lene floes.
0 0.1 0.2 0.3 0.4 0.5 0.6 0.7
0
0.2
0.4
0.6
0.8
1
Wave Height on Floe / Incident Wave Height
Tra
nsm
issio
n
Lwave
= 0.56m
Lwave
= 1.0m
Lwave
= 1.56m
FIG. 15: As in Fig. 14 but for pvc floes.
mission with increasing significant wave height. The rate of decrease is, largely, insensitive
to wavelength, although data are more scattered for shorter waves.
16
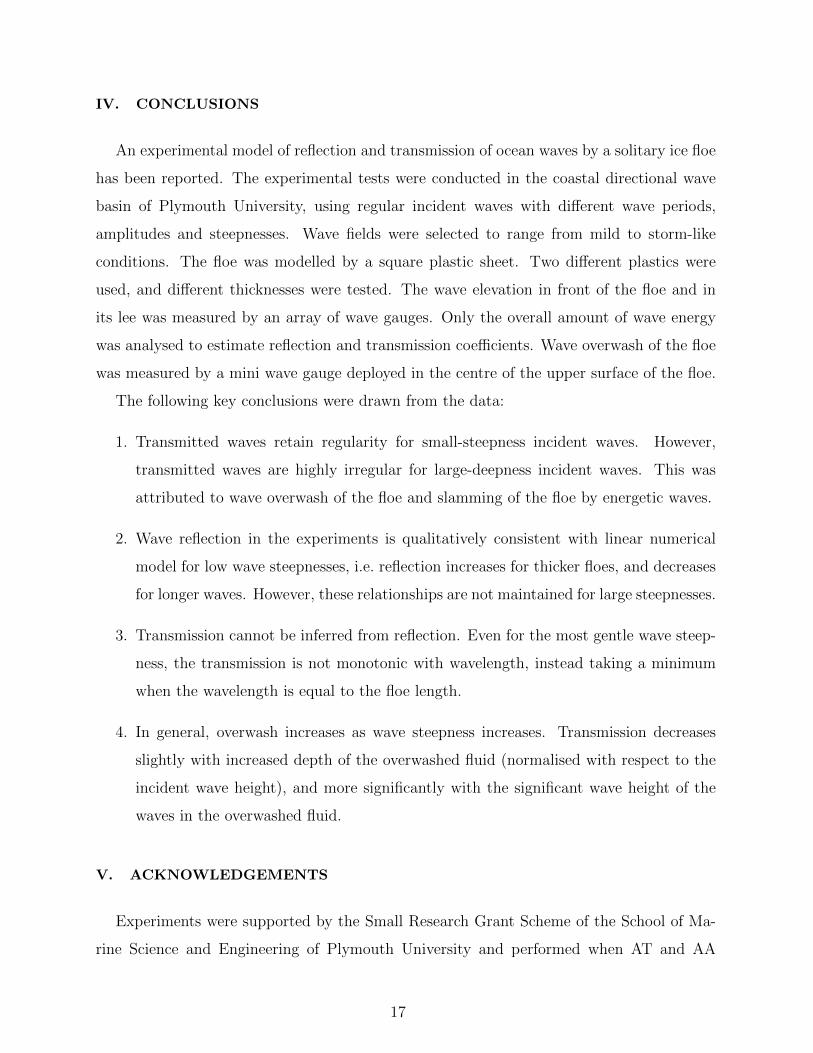
IV. CONCLUSIONS
An experimental model of reflection and transmission of ocean waves by a solitary ice floe
has been reported. The experimental tests were conducted in the coastal directional wave
basin of Plymouth University, using regular incident waves with different wave periods,
amplitudes and steepnesses. Wave fields were selected to range from mild to storm-like
conditions. The floe was modelled by a square plastic sheet. Two different plastics were
used, and different thicknesses were tested. The wave elevation in front of the floe and in
its lee was measured by an array of wave gauges. Only the overall amount of wave energy
was analysed to estimate reflection and transmission coefficients. Wave overwash of the floe
was measured by a mini wave gauge deployed in the centre of the upper surface of the floe.
The following key conclusions were drawn from the data:
1. Transmitted waves retain regularity for small-steepness incident waves. However,
transmitted waves are highly irregular for large-deepness incident waves. This was
attributed to wave overwash of the floe and slamming of the floe by energetic waves.
2. Wave reflection in the experiments is qualitatively consistent with linear numerical
model for low wave steepnesses, i.e. reflection increases for thicker floes, and decreases
for longer waves. However, these relationships are not maintained for large steepnesses.
3. Transmission cannot be inferred from reflection. Even for the most gentle wave steep-
ness, the transmission is not monotonic with wavelength, instead taking a minimum
when the wavelength is equal to the floe length.
4. In general, overwash increases as wave steepness increases. Transmission decreases
slightly with increased depth of the overwashed fluid (normalised with respect to the
incident wave height), and more significantly with the significant wave height of the
waves in the overwashed fluid.
V. ACKNOWLEDGEMENTS
Experiments were supported by the Small Research Grant Scheme of the School of Ma-
rine Science and Engineering of Plymouth University and performed when AT and AA
17

were appointed at Plymouth University. LB acknowledges funding support from the Aus-
tralian Research Council (DE130101571) and the Australian Antarctic Science Grant Pro-
gram (Project 4123).
[1] T. D. Williams, L. G. Bennetts, D. Dumont, V. A. Squire, and L. Bertino, Ocean Mod. 71,
81 (2013).
[2] T. D. Williams, L. G. Bennetts, D. Dumont, V. A. Squire, and L. Bertino, Ocean Mod. 71,
92 (2013).
[3] V. A. Squire and S. C. Moore, Nature 283, 365 (1980).
[4] P. Wadhams, V. A. Squire, D. J. Goodman, A. M. Cowan, and S. C. Moore, J. Geophys. Res.
93, 6799 (1988).
[5] A. L. Kohout and M. H. Meylan, J. Geophys. Res. 113 (2008).
[6] L. G. Bennetts, M. A. Peter, V. A. Squire, and M. H. Meylan, J. Geophys. Res. 115 (2010).
[7] L. G. Bennetts and V. A. Squire, Ocean Model. 45–46, 1 (2012).
[8] D. Dumont, A. L. Kohout, and L. Bertino, J. Geophys. Res. 116, doi:10.1029/2010JC006682
(2011).
[9] D. Masson and P. LeBlond, J. Fluid Mech. 202, 111 (1989).
[10] M. H. Meylan, V. A. Squire, and C. Fox, J. Geophy. Res. 102, 22981 (1997).
[11] G. Komen, L. Cavaleri, M. Donelan, K. Hasselmann, H. Hasselmann, and P. Janssen, Dynam-
ics and modeling of ocean waves (Cambridge University Press, Cambridge, 1994).
[12] W. Perrie and Y. Hu, J. Phys. Oceanogr. 26, 1705 (1996).
[13] L. G. Bennetts and V. A. Squire, Proc. R. Soc. Lond. A 468, 136 (2012).
[14] M. H. Meylan and D. Masson, Ocean Modelling 11, 417 (2006).
[15] J. Schulz-Stellenfleth and S. Lehner, J. Geophys. Res. 107, 20 (2002).
[16] A. L. Kohout, M. H. Meylan, S. Sakai, K. Hanai, P. Leman, and D. Brossard, Journal of
Fluids and Structures 23, 649 (2007).
[17] F. Montiel, F. Bonnefoy, P. Ferrant, L. G. Bennetts, V. A. Squire, and P. Marsault, J. Fluid
Mech. 723, 604 (2013).
[18] F. Montiel, L. G. Bennetts, V. A. Squire, F. Bonnefoy, and P. Ferrant, J. Fluid Mech. 723,
629 (2013).
18

[19] S. H. Salter, in Directional Wave Spectra Applications (ASCE, 1981), pp. 185–202.
[20] A. Toffoli, A. V. Babanin, M. Onorato, and T. Waseda, Geophys. Res. Lett. 37, L05603
(2010).
[21] J. R. Chaplin, J. Fluid Mech. 147, 449 (1984).
[22] M. H. Meylan and V. A. Squire, J. Geophy. Res. 99, 891 (1994).
[23] I. V. Lavrenov and A. V. Novakov, Tech. Rep. Transport and fate of contaminants in the
northern seas. Sea ice project package. AARI final report (2000), URL http://transeff.
npolar.no/transport/Ice/aari_all.pdf.
19