DATE: August 9, 2016 REPORT NO. CD2016-126 TO: ITEM … CD2016-126 STEAM PRO... · by Gino Vannelli...
34
GENERAL MANAGER’S OFFICE Phone: (519) 759-4150, EXT. 5488 Email: [email protected] City Hall, 100 Wellington Square, Brantford, ON N3T 2M3 P.O. Box 818, Brantford, ON N3T 5R7 Fax: (519) 752-6977 www.brantford.ca PAUL MOORE, MCIP, RPP General Manager Community Development DATE: August 9, 2016 REPORT NO. CD2016-126 TO: Chair and Members Committee of the Whole – Community Services FROM: Paul Moore, General Manager Community Development 1.0 TYPE OF REPORT CONSENT ITEM [ X ] ITEM FOR CONSIDERATION [ ] 2.0 TOPIC: Results of the STEAM PRO Economic Assessment Activity Report [Financial Impact – None] [CD2016-126] 3.0 RECOMMENDATION THAT Report No. CD2016-142 regarding the results of the STEAM PRO Economic Impact Assessment of the 2015 Brantford International Jazz Festival and the 2015 Wayne Gretzky International Hockey Tournament BE RECEIVED. 4.0 PURPOSE The purpose of this report is to provide Council with the results of the Economic Impact Assessment analysis on a large sporting event and large festival that took place in 2015: Brantford International Jazz Festival – September 18 to 20, and the Wayne Gretzky International Hockey Tournament – December 27 to 30. 5.0 BACKGROUND In 2015, Economic Development and Tourism staff obtained approval from Council to retain the Canadian Sport Tourism Alliance (CSTA) to undertake an in-depth analysis of the economic impact of two large events (Report No. CD2015-112) using the Sport Tourism Economic Assessment Model (STEAM).
Transcript of DATE: August 9, 2016 REPORT NO. CD2016-126 TO: ITEM … CD2016-126 STEAM PRO... · by Gino Vannelli...
GENERAL MANAGER’S OFFICE Phone: (519) 759-4150, EXT. 5488 Email: [email protected]
City Hall, 100 Wellington Square, Brantford, ON N3T 2M3 P.O. Box 818, Brantford, ON N3T 5R7
Fax: (519) 752-6977 www.brantford.ca
PAUL MOORE, MCIP, RPP General Manager
Community Development
DATE: August 9, 2016 REPORT NO. CD2016-126 TO: Chair and Members Committee of the Whole – Community Services FROM: Paul Moore, General Manager Community Development 1.0 TYPE OF REPORT CONSENT ITEM [ X ] ITEM FOR CONSIDERATION [ ] 2.0 TOPIC: Results of the STEAM PRO Economic Assessment Activity Report [Financial Impact – None] [CD2016-126] 3.0 RECOMMENDATION
THAT Report No. CD2016-142 regarding the results of the STEAM PRO Economic Impact Assessment of the 2015 Brantford International Jazz Festival and the 2015 Wayne Gretzky International Hockey Tournament BE RECEIVED.
4.0 PURPOSE
The purpose of this report is to provide Council with the results of the Economic Impact Assessment analysis on a large sporting event and large festival that took place in 2015: Brantford International Jazz Festival – September 18 to 20, and the Wayne Gretzky International Hockey Tournament – December 27 to 30.
5.0 BACKGROUND
In 2015, Economic Development and Tourism staff obtained approval from Council to retain the Canadian Sport Tourism Alliance (CSTA) to undertake an in-depth analysis of the economic impact of two large events (Report No. CD2015-112) using the Sport Tourism Economic Assessment Model (STEAM).
Report No. CD2016-126 August 9, 2016 Page 2
The CSTA’s ‘STEAM PRO’ model is one of the most comprehensive programs in Canada for measuring the economic impact at sporting events and festivals. Since 2002, more than 150 on-site economic impact assessments including many in Ontario have been completed. The STEAM PRO model helps to determine the economic benefits attributable to a community as a result of hosting an event. The completed reports allow event organizers and local hosts to move beyond the statement of ‘it was good for the community’ to being able to put actual numbers as to the impact of the event. Economic impact comes from three primary sources: the spending of out of town visitors while they attend the event, the expenditures of the event organizers in hosting the event and any capital construction costs that are directly attributable to the hosting of the event. The reports outline visitor expenditures, along with the operational and capital spending made by the local host committee. The Canadian Sport Tourism Alliance’s STEAM PRO economic impact assessment model measures the economic impacts in terms of total output, Gross Domestic Product (GDP), jobs, employment and taxes.
6.0 CORPORATE POLICY CONTEXT This report supports the City of Brantford’s Community Strategic Plan “Shaping Our Future” 2014 - 2018 Goal #1: Economic Vitality and Innovation and the following strategic action; 1.7 Continue to develop, expand and promote tourism opportunities in all sectors and strengthen the relationship between arts, cultural, sports and heritage assets of the city.
7.0 INPUT FROM OTHER SOURCES
Preparation of this report included staff input from Economic Development & Tourism, Brantford Minor Hockey, the Brantford International Jazz Festival and the Canadian Sport Tourism Alliance.
8.0 ANALYSIS
8.1 Assessment of Events Two major events were selected for assessment: a sporting event and a cultural event. Staff and volunteers conducted on-site surveys at the Brantford International Jazz Festival in September 2015 and the Wayne Gretzky International Hockey Tournament in December 2015. The objectives of the study were to determine the increase in spending that took place in Brantford as a result of hosting these events and outline the impact of the events in terms of economic activity. Full reports are included as Appendix A for the 2015 Brantford International Jazz Festival Economic Impact Assessment Report and Appendix B for the 2015 Wayne Gretzky International Hockey Tournament Economic Impact Assessment Report.

Report No. CD2016-126 August 9, 2016 Page 3
Volunteers obtained a statistically significant sample by surveying 200 audience members at the Brantford International Jazz Festival and 136 participant families at the Wayne Gretzky International Hockey Tournament. Respondents were asked a number of questions regarding the number of days in attendance, their place of origin, and their spending patterns while in Brantford.
Table 1: Visitor Attendance at Assessed Events
Brantford International Jazz Festival
Wayne Gretzky International Hockey Tournament
Attendance (individuals) 8,052 9,233 Visitors 2,246 5,713 Visitors % 28% 62% % of visitors staying o/n in Brantford 27% 41%
% of visitors staying in hotels 13% 33%
Average visitor spending $161.14 per person $155.84 per person
A copy of each respective report completed by CSTA has been given to the organization contacts for the Brantford Jazz Festival and Brantford Minor Hockey. 8.2 Economic Impact of Events According to the final reports, a visitor on average spent $161.14 per person for the Brantford International Jazz Festival ($78.04 for a day traveler or $322.97 for overnight), and an average of $155.84 per visitor for the Wayne Gretzky International Hockey Tournament ($128.75 for a day traveler or up to $225.31 for an overnight). Visitor spending includes a number of spending categories, such as accommodation, restaurants, groceries, recreation, shopping and transportation. According to the completed surveys for each of the events, the Gross Domestic Product (GDP) or net economic activity of the Brantford International Jazz Festival was $298,000 and the Wayne Gretzky International Hockey Tournament was $668,000. The GDP measures the value of goods produced, less the cost of inputs to produce them. 8.3 Application of Findings These findings support the economic impact figures used by Tourism Brantford to calculate annual statistics. In 2015, staff assisted 56 different sport groups with their tournaments and sport events, resulting in a total of 24,283 visitors and an estimated economic impact of $3.4 million. This economic impact figure is based on an average “day” visitor

Report No. CD2016-126 August 9, 2016 Page 4
rate of $53.00 per day per person that has been provided by Statistics Canada. Staff use a “day” rate rather than an “overnight” rate to calculate economic impact of tournaments and events to ensure that the numbers reported are as accurate as possible and can be consistently compared year over year. The CSTA STEAM PRO findings demonstrate that the current industry averages used by Tourism Brantford to calculate economic impact are either conservative or accurate for our community. The Statistics Canada sport “day” rate of $53.00 is a conservative calculation, compared to the actual average of $128.75 for a day traveler at the Wayne Gretzky International Hockey Tournament. Although capturing the economic impact of festivals and events is more challenging (particularly for free, unticketed events), the average spending of same day travelers at the Brantford International Jazz Festival was $78.04 per day, which is identical to the industry average used for motor coach travelers.
Moving forward, Tourism Brantford staff can use the information provided in each Economic Impact Assessment report to bid on future events for the City of Brantford, particularly sporting events. Over the past two years, Tourism Brantford staff has met with 47 different sport organizations and will continue to work with each group to bring new and larger events into the City. The information gathered in the two reports will assist other sport organizations when making a decision on whether to move forward with hosting their event in Brantford. Staff can also work to develop consistent tools to assist event organizers in capturing visitor demographics at tournaments and events, such as attendance and place of origin. These reports will also be made available to industry partners interested in obtaining information about visitor spending at tournaments and events.
9.0 FINANCIAL IMPLICATIONS There are no financial implications as the result of this report. 10.0 CONCLUSION
Completion of the Economic Impact Assessments for these two major community events has provided in depth information regarding the impact of major events on the community and has increased the capacity for the Economic Development and Tourism Department to efficiently calculate the economic impact using statistics specific to our community. The completed assessments will be used to provide staff with a competitive edge in preparing future bid opportunities for events.

Report No. CD2016-126 August 9, 2016 Page 5
_______ Donna Clements Paul Moore, MCIP, RPP Tourism Business Development Officer General Manager Economic Development & Tourism Community Development
____________________________ Nicole Drake Manager, Tourism & Marketing Economic Development & Tourism Appendices:
A) 2015 Brantford International Jazz Festival Economic Impact Assessment Report. B) 2015 Wayne Gretzky International Hockey Tournament Economic Impact
Assessment Report. In adopting this report, is a by-law or agreement required? If so, it should be referenced in the recommendation section. Bylaw required [ ] yes [ x ] no Agreement(s) or other documents to be signed by Mayor and/or City Clerk [ ] yes [ x ] no Is the necessary by-law or agreement being sent concurrently to Council? [ ] yes [ x ] no

2015 Brantford International Jazz Festival
Brantford, ON
Economic Impact Assessment
April 2016
The following analysis provides the economic impact of the 2015 Brantford International Jazz Festival
hosted at Harmony Square in Brantford Ontario from September 18-20 2015, as generated by the Sport
Tourism Economic Assessment Model, Professional version.
2015 Brantford International Jazz Festival – Economic Impact Assessment
2
Economic Impact Assessment Funding Partners
The Canadian Sport Tourism Alliance wishes to acknowledge Economic Development & Tourism – City of
Brantford for their funding support and the Brantford International Jazz Festival Inc for providing the
information required in the completion of this study.
For more information about this report, please contact:
Tony Fisher, Canadian Sport Tourism Alliance, [email protected]
Donna Clements, City of Brantford, [email protected]

2015 Brantford International Jazz Festival – Economic Impact Assessment
3
Executive Summary
The Brantford International Jazz Festival took place in downtown Brantford in Harmony Square from
September 18-20 2015, with the event attracting 15,000 local and visiting jazz lovers over the course of
the festival. In addition to the free outdoor festival, the 2015 Brantford International Jazz Festival (BIJF)
featured a headline performance by Gino Vannelli at the Sanderson Centre for the Performing Arts. The
Brantford International Jazz Festival was attended by 8,052 people of which 2,246 came from outside of
Brantford. The spending of these visitors, along with the expenditures made by the organizers in hosting
the 2015 Brantford International Jazz Festival totaled $362,000. This spending supported $921,000 in
economic activity across Ontario, of which $628,000 occurred in Brantford.
Table E1. Economic Impact Summary
Total
Ontario Brantford
Initial Expenditure $406,767 $406,767
GDP $455,611 $297,656
Wages & Salaries $306,990 $223,728
Employment (Jobs) 7.3 6.0
Industry Output $920,830 $628,137
Total Taxes $203,618 $148,426
Federal $94,733 $67,127
Provincial $77,727 $56,963
Municipal $31,159 $24,336
2015 Brantford International Jazz Festival – Economic Impact Assessment
4
1.0 Background
The Brantford International Jazz Festival takes place annually in Brantford Ontario, featuring many
different genres of jazz on four stages that are set up in Brantford’s Harmony Square. 2015 was the
eighth edition of the jazz festival and it featured an impressive lineup of acts that were free for the
public to attend. In addition, the 2015 Brantford International Jazz Festival featured a paid performance
by Gino Vannelli on Saturday September 19 at the Sanderson Centre. With the festival being an outdoor
event, overall attendance is highly weather dependent and the overall attendance of 15,000 was below
expectations due to a rainout on Saturday afternoon which forced the closure of the free outdoor
activities. Despite the rain, the Brantford International Jazz Festival generates a considerable increase in
tourism revenues for Brantford businesses.
The spending of visitors attending the festival, along with the expenditures made by the organizers in
presenting a world class event meant that the Brantford International Jazz Festival created a sizeable
economic impact for Brantford and for the province as a whole. The next section of the report provides
details of the results of an on-site event survey that was delivered to event attendees. The survey results
were used to ascertain both the number of visitors and the expenditures that visitors made while in
Brantford for the jazz festival, which is the subject of the next section of this report. Section 3 provides
details of operational expenditures and revenues that further contributed to the impact of the festival,
while Section 4 presents the STEAM PRO1 results from the combined expenditures of the visitors and the
event organizers operational expenditures. The appendices include additional information regarding the
economic impact model and a glossary of the terms used.
1The Canadian Sport Tourism Alliance’s (CSTA’s) Sport Tourism Economic Assessment Model, Professional version (STEAM
PRO) was used to generate the economic impact estimates detailed in this report. STEAM PRO, which was developed in 2006,
is a model that has been designed to incorporate the results of primary data collected from event visitors and the budget /
capital expenditures of event organizers and others to prepare economic impact assessments. The model is based on the
Canadian Tourism Research Institute’s (CTRI - a branch of The Conference Board of Canada) TEAM model, which is the most
widely used tourism economic impact model in Canada. The results of STEAM PRO are fully consistent with the CSTA’s STEAM
model. A more detailed description of STEAM PRO is contained within Appendix 1.
2015 Brantford International Jazz Festival – Economic Impact Assessment
5
2.0 Methodology / Survey Results
Information regarding the origin and spending of visitors attending the 2015 Brantford International Jazz
Festival was collected through the administration of an on-site intercept survey. The survey was hosted
on Samsung Galaxy tablet computers using Survey Analytics Survey Pocket survey software. The survey
asked questions about the respondents satisfaction with the event, their origin and if they were out of
town spectators, details about their visit to Brantford.
Survey Results
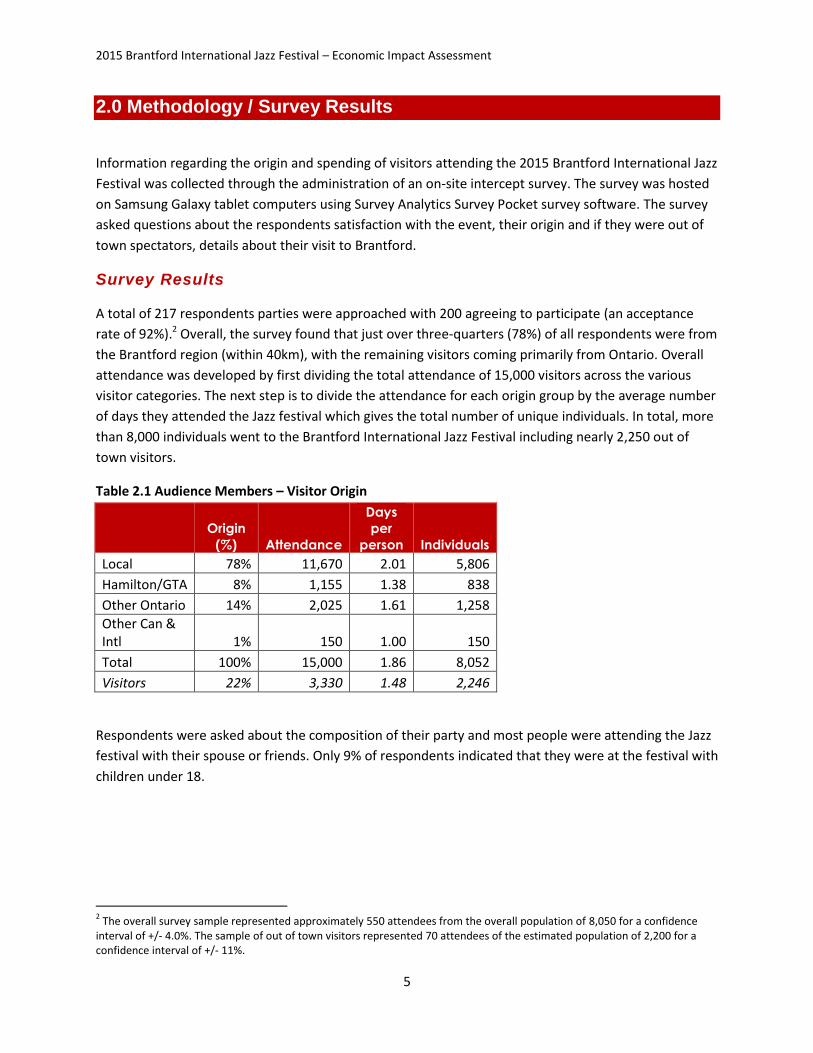
A total of 217 respondents parties were approached with 200 agreeing to participate (an acceptance
rate of 92%).2 Overall, the survey found that just over three-quarters (78%) of all respondents were from
the Brantford region (within 40km), with the remaining visitors coming primarily from Ontario. Overall
attendance was developed by first dividing the total attendance of 15,000 visitors across the various
visitor categories. The next step is to divide the attendance for each origin group by the average number
of days they attended the Jazz festival which gives the total number of unique individuals. In total, more
than 8,000 individuals went to the Brantford International Jazz Festival including nearly 2,250 out of
town visitors.
Table 2.1 Audience Members – Visitor Origin
Origin
(%) Attendance
Days
per
person Individuals
Local 78% 11,670 2.01 5,806
Hamilton/GTA 8% 1,155 1.38 838
Other Ontario 14% 2,025 1.61 1,258
Other Can & Intl 1% 150 1.00 150
Total 100% 15,000 1.86 8,052
Visitors 22% 3,330 1.48 2,246
Respondents were asked about the composition of their party and most people were attending the Jazz
festival with their spouse or friends. Only 9% of respondents indicated that they were at the festival with
children under 18.
2 The overall survey sample represented approximately 550 attendees from the overall population of 8,050 for a confidence
interval of +/- 4.0%. The sample of out of town visitors represented 70 attendees of the estimated population of 2,200 for a confidence interval of +/- 11%.

2015 Brantford International Jazz Festival – Economic Impact Assessment
6
Table 2.2 Party Composition
Party composition %
Spouse or equivalent 36%
Friends 29%
Here alone 23%
Other family 19%
Dependents under 18 9%
Business colleagues 2%
The majority of those surveyed were repeat visitors to the Jazz festival, with the survey finding more
than half of respondents (60%) having been to three or more of the festivals in Brantford. The profile of
repeat visitation was relatively similar between local and out of town respondents.
Table 2.3 Previous Visitations
Local Visitor Overall
2015 was first time 23% 40% 26%
Twice 15% 17% 15%
Three or more times 62% 43% 59%
Survey respondents were asked about their preferences in Jazz music, with traditional jazz being the
most common response (31%) followed closely by big band jazz (27%; Figure 2.1).
Figure 2.1 Favourite Genre of Jazz Music
Respondents were also asked about their satisfaction with the Harmony Square venue with most people
rating it either excellent or good (94%).
Traditional
31%
Big Band 27%
Fusion 8%
Contemporary 19%
Latin 13%
Other 2%

2015 Brantford International Jazz Festival – Economic Impact Assessment
7
Table 2.4 Overall Venue Satisfaction
Overall Venue
Satisfaction Percent
Excellent 73%
Good 21%
OK 6%
Probing more about the venue, respondents indicated they were most satisfied with Harmony Square’s
accessibility, atmosphere and the overall production of the event.
Table 2.5 Harmony Square Satisfaction
Harmony
Square Venue
Very
Unsatisfied Unsatisfied Neutral Satisfied
Very
Satisfied
Layout 13% 1% 9% 42% 36%
Sound Quality 16% 2% 18% 39% 26%
Production 8% 0% 8% 46% 38%
Accessibility 6% 0% 7% 41% 46%
Atmosphere 6% 1% 6% 46% 42%
Security 6% 0% 9% 50% 35%
Respondents were asked about their satisfaction with regards to the food services (food trucks) that
were available at the Harmony Square Venue (Table 2.6).
Table 2.6 Food Service Satisfaction
Food:
Very
Unsatisfied Unsatisfied Neutral Satisfied
Very
Satisfied
Selection 5% 6% 34% 39% 17%
Quality 7% 4% 48% 30% 12%
Price 5% 3% 36% 40% 16%
Accessibility 5% 2% 36% 41% 16%
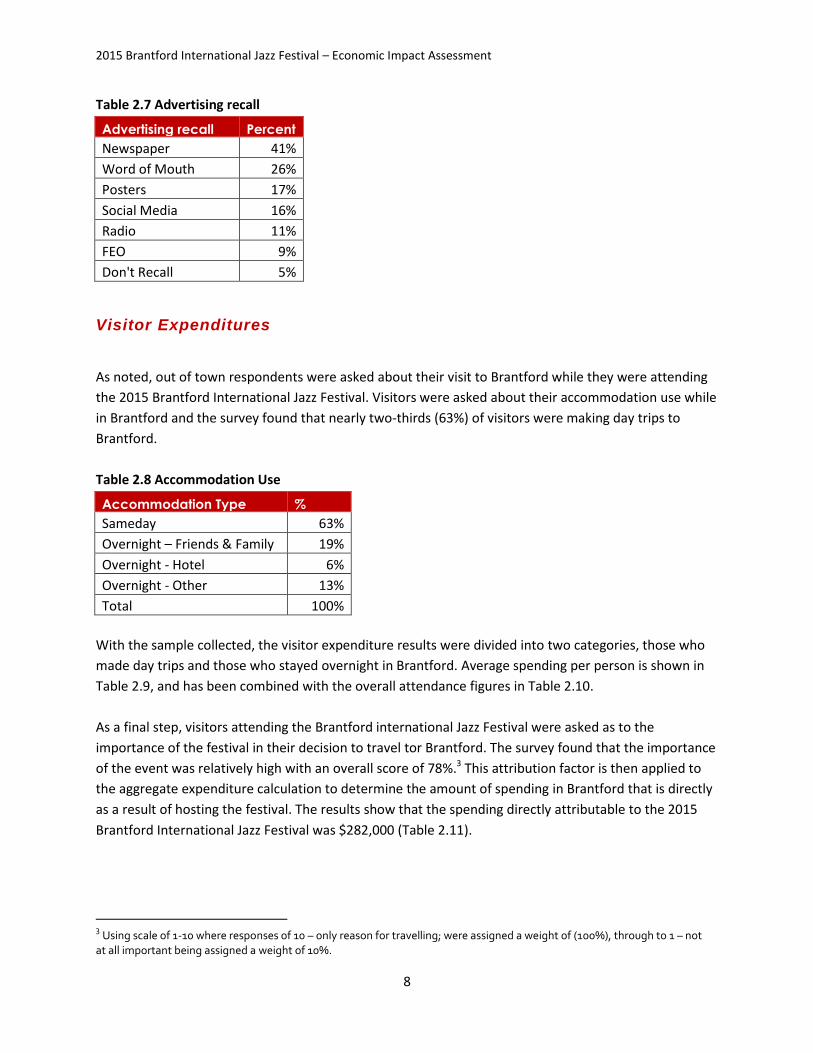
The survey asked attendees how they heard about the Brantford International Jazz Festival, with
respondents being allowed to make multiple responses (Table 2.7)
2015 Brantford International Jazz Festival – Economic Impact Assessment
8
Table 2.7 Advertising recall
Advertising recall Percent
Newspaper 41%
Word of Mouth 26%
Posters 17%
Social Media 16%
Radio 11%
FEO 9%
Don't Recall 5%
Visitor Expenditures
As noted, out of town respondents were asked about their visit to Brantford while they were attending
the 2015 Brantford International Jazz Festival. Visitors were asked about their accommodation use while
in Brantford and the survey found that nearly two-thirds (63%) of visitors were making day trips to
Brantford.
Table 2.8 Accommodation Use
Accommodation Type %
Sameday 63%
Overnight – Friends & Family 19%
Overnight - Hotel 6%
Overnight - Other 13%
Total 100%
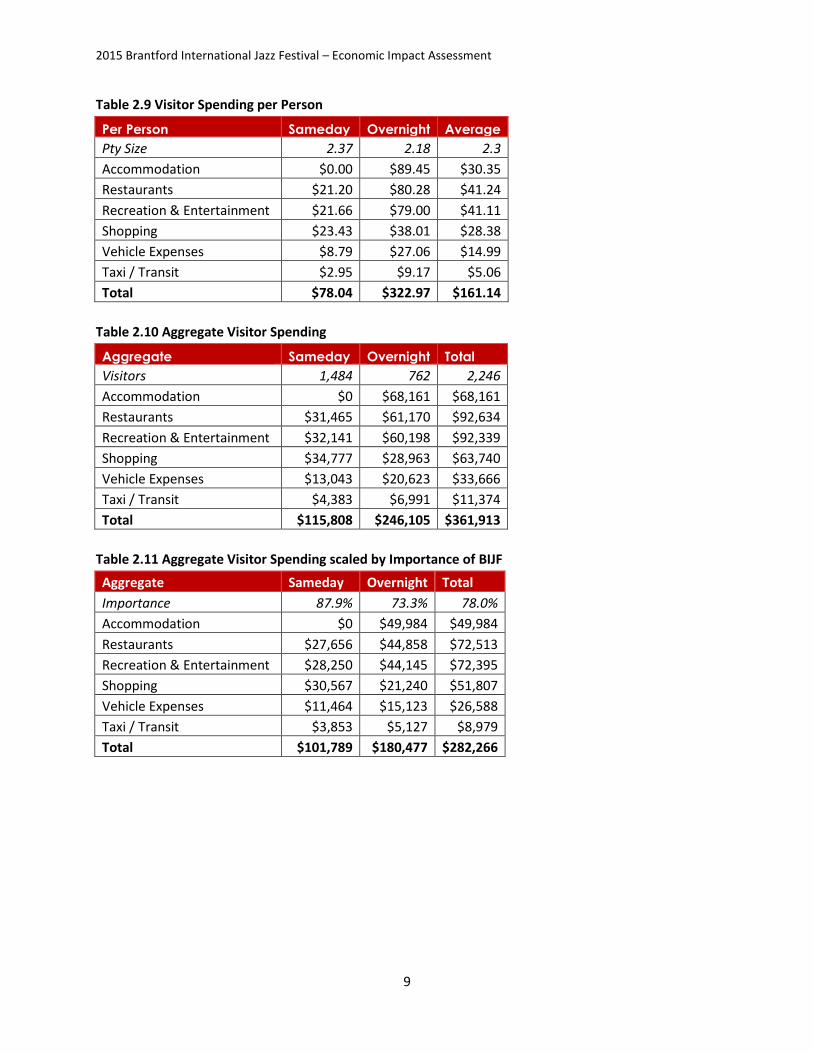
With the sample collected, the visitor expenditure results were divided into two categories, those who
made day trips and those who stayed overnight in Brantford. Average spending per person is shown in
Table 2.9, and has been combined with the overall attendance figures in Table 2.10.
As a final step, visitors attending the Brantford international Jazz Festival were asked as to the
importance of the festival in their decision to travel tor Brantford. The survey found that the importance
of the event was relatively high with an overall score of 78%.3 This attribution factor is then applied to
the aggregate expenditure calculation to determine the amount of spending in Brantford that is directly
as a result of hosting the festival. The results show that the spending directly attributable to the 2015
Brantford International Jazz Festival was $282,000 (Table 2.11).
3 Using scale of 1-10 where responses of 10 – only reason for travelling; were assigned a weight of (100%), through to 1 – not
at all important being assigned a weight of 10%.
2015 Brantford International Jazz Festival – Economic Impact Assessment
9
Table 2.9 Visitor Spending per Person
Per Person Sameday Overnight Average
Pty Size 2.37 2.18 2.3
Accommodation $0.00 $89.45 $30.35
Restaurants $21.20 $80.28 $41.24
Recreation & Entertainment $21.66 $79.00 $41.11
Shopping $23.43 $38.01 $28.38
Vehicle Expenses $8.79 $27.06 $14.99
Taxi / Transit $2.95 $9.17 $5.06
Total $78.04 $322.97 $161.14
Table 2.10 Aggregate Visitor Spending
Aggregate Sameday Overnight Total
Visitors 1,484 762 2,246
Accommodation $0 $68,161 $68,161
Restaurants $31,465 $61,170 $92,634
Recreation & Entertainment $32,141 $60,198 $92,339
Shopping $34,777 $28,963 $63,740
Vehicle Expenses $13,043 $20,623 $33,666
Taxi / Transit $4,383 $6,991 $11,374
Total $115,808 $246,105 $361,913
Table 2.11 Aggregate Visitor Spending scaled by Importance of BIJF
Aggregate Sameday Overnight Total
Importance 87.9% 73.3% 78.0%
Accommodation $0 $49,984 $49,984
Restaurants $27,656 $44,858 $72,513
Recreation & Entertainment $28,250 $44,145 $72,395
Shopping $30,567 $21,240 $51,807
Vehicle Expenses $11,464 $15,123 $26,588
Taxi / Transit $3,853 $5,127 $8,979
Total $101,789 $180,477 $282,266

2015 Brantford International Jazz Festival – Economic Impact Assessment
10
Local Expenditures
Local residents were asked about their expenditures while attending the 2015 Brantford International
Jazz Festival. The typical respondent spent $18.55 per person per day as part of their excursion that
included the Jazz Festival, or a total of $107,700. Local residents were also asked how their spending
compared to what they would normally spend in downtown Brantford if the Jazz Festival wasn’t taking
place. Overall, the results were indeterminate, with some saying they spent more while others
indicating they spent less as a result of the Jazz Festival taking place.
Figure 2.2 Local Expenditures
A lot more (>+$50)
31%
Somewhat more ($10
to $50) 11%
Same (+/- $10)
20%
Somewhat less (-$10 to
-$50) 18%
A lot less (>-$50)
20%
2015 Brantford International Jazz Festival – Economic Impact Assessment
11
3.0 Operations Expenditures
The organizers of the 2015 Brantford International Jazz Festival made a variety of expenditures in
support of the hosting the event such as payment of the musical acts, rental of the stages and purchase
of goods and services necessary to host the music festival.4
Even though they are not included directly in the budget, the Brantford International Jazz Festival was
supported with the time and energy of more than 100 volunteers. Without their support, the event
would not have been the success that it was.
4 The CSTA was provided with financial reports from the Brantford International Jazz Festival; however as the financial details
are confidential, details of the expenditures are not itemized in this study.
2015 Brantford International Jazz Festival – Economic Impact Assessment
12
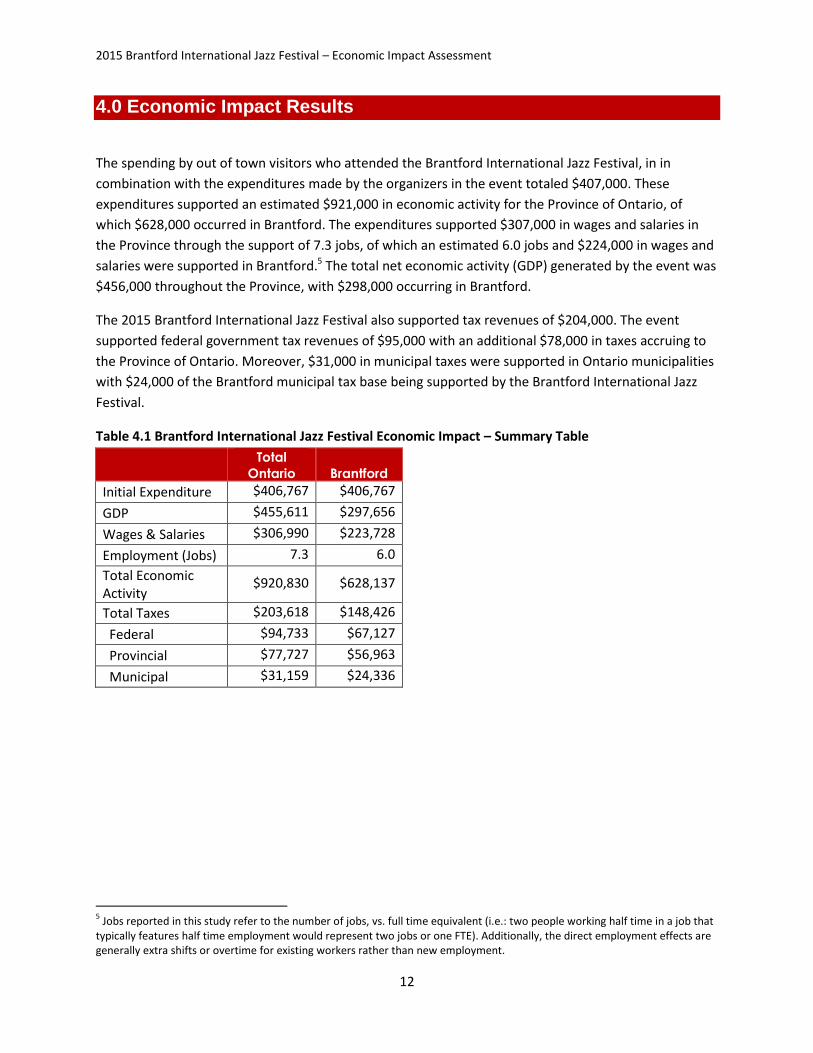
4.0 Economic Impact Results
The spending by out of town visitors who attended the Brantford International Jazz Festival, in in
combination with the expenditures made by the organizers in the event totaled $407,000. These
expenditures supported an estimated $921,000 in economic activity for the Province of Ontario, of
which $628,000 occurred in Brantford. The expenditures supported $307,000 in wages and salaries in
the Province through the support of 7.3 jobs, of which an estimated 6.0 jobs and $224,000 in wages and
salaries were supported in Brantford.5 The total net economic activity (GDP) generated by the event was
$456,000 throughout the Province, with $298,000 occurring in Brantford.
The 2015 Brantford International Jazz Festival also supported tax revenues of $204,000. The event
supported federal government tax revenues of $95,000 with an additional $78,000 in taxes accruing to
the Province of Ontario. Moreover, $31,000 in municipal taxes were supported in Ontario municipalities
with $24,000 of the Brantford municipal tax base being supported by the Brantford International Jazz
Festival.
Table 4.1 Brantford International Jazz Festival Economic Impact – Summary Table
Total
Ontario Brantford
Initial Expenditure $406,767 $406,767
GDP $455,611 $297,656
Wages & Salaries $306,990 $223,728
Employment (Jobs) 7.3 6.0
Total Economic Activity
$920,830 $628,137
Total Taxes $203,618 $148,426
Federal $94,733 $67,127
Provincial $77,727 $56,963
Municipal $31,159 $24,336
5 Jobs reported in this study refer to the number of jobs, vs. full time equivalent (i.e.: two people working half time in a job that
typically features half time employment would represent two jobs or one FTE). Additionally, the direct employment effects are generally extra shifts or overtime for existing workers rather than new employment.
2015 Brantford International Jazz Festival – Economic Impact Assessment
13
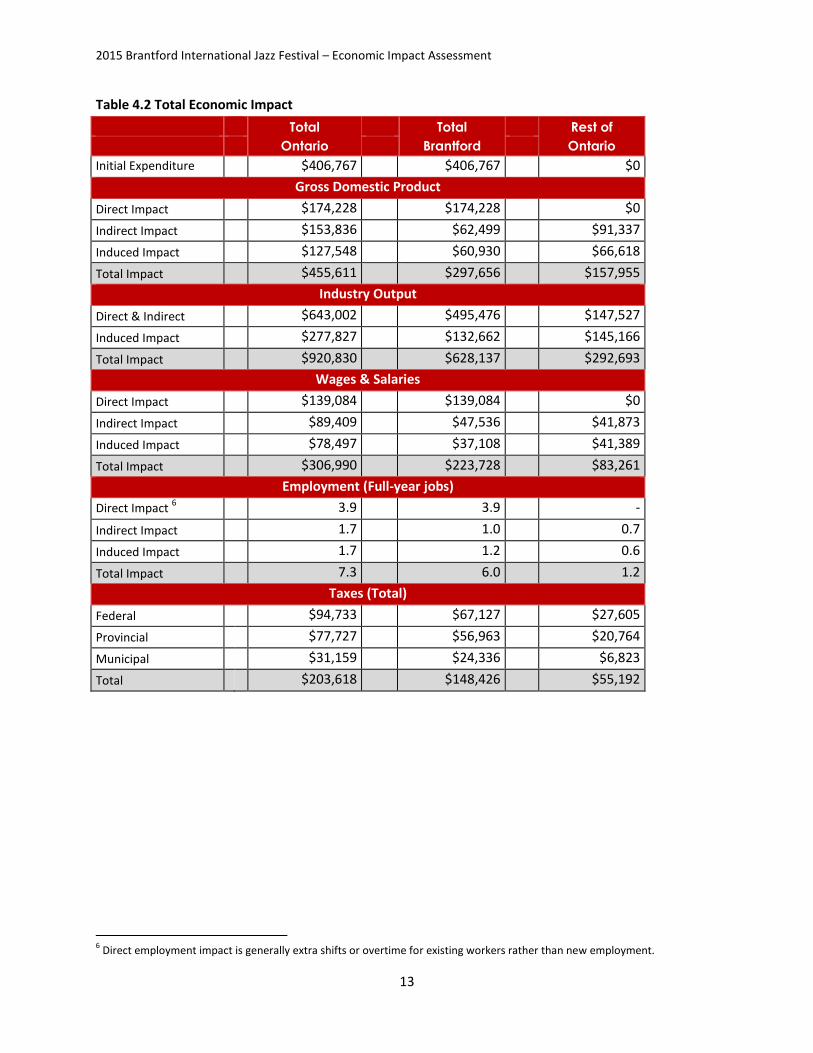
Table 4.2 Total Economic Impact
Total
Ontario
Total
Brantford
Rest of
Ontario
Initial Expenditure $406,767 $406,767 $0
Gross Domestic Product
Direct Impact $174,228 $174,228 $0
Indirect Impact $153,836 $62,499 $91,337
Induced Impact $127,548 $60,930 $66,618
Total Impact $455,611 $297,656 $157,955
Industry Output
Direct & Indirect $643,002 $495,476 $147,527
Induced Impact $277,827 $132,662 $145,166
Total Impact $920,830 $628,137 $292,693
Wages & Salaries
Direct Impact $139,084 $139,084 $0
Indirect Impact $89,409 $47,536 $41,873
Induced Impact $78,497 $37,108 $41,389
Total Impact $306,990 $223,728 $83,261
Employment (Full-year jobs)
Direct Impact 6 3.9 3.9 -
Indirect Impact 1.7 1.0 0.7
Induced Impact 1.7 1.2 0.6
Total Impact 7.3 6.0 1.2
Taxes (Total)
Federal $94,733 $67,127 $27,605
Provincial $77,727 $56,963 $20,764
Municipal $31,159 $24,336 $6,823
Total $203,618 $148,426 $55,192
6 Direct employment impact is generally extra shifts or overtime for existing workers rather than new employment.

2015 Brantford International Jazz Festival – Economic Impact Assessment
14
Appendix 1: Economic Impact Methodology – Sport Tourism
Economic Assessment Model
Background
Briefly, the purpose of STEAM is to calculate both the provincial and regional economic impacts of sport
and event based tourism. The economic impacts are calculated on the basis of capital and operating
expenditures on goods, services and employee salaries, and on the basis of tourist spending within a
designated tourism sector. The elements used to measure the economic impacts are Gross Domestic
Product (GDP), Employment, Taxes, Industry Output and Imports. STEAM measures the direct, indirect &
induced effects for each of these elements.
Technical Description of the Impact Methodology used by STEAM
STEAM PRO and many other impact studies are based on input-output techniques. Input-output models
involve the use of coefficients that are based on economic or business linkages. These linkages trace
how tourist expenditures or business operations filter through the economy. In turn, the coefficients
applied are then used to quantify how tourism related activity in a particular region generates
employment, taxes, income, etc. The input-output approach indicates not only the direct and indirect
impact of tourism, but can also indicate the induced effect resulting from the re-spending of wages and
salaries generated.
All impacts generated by the model are given at the direct impact stage (i.e. the "front line" businesses
impacted by tourism expenditures), indirect impact stage (i.e. those industries which supply
commodities and/or services to the "front line" businesses) and the induced impact stage (induced
consumption attributable to the wages and salaries generated from both the direct and indirect impact).
In this sense, the model is closed with respect to wages. Imports are also determined within the model,
so the model is closed with respect to imports. Exports are not endogenized (i.e. additional exports are
not assumed with the induced impact) which consequently generates more conservative impacts.
Another assumption of the model, which leads to more conservative impacts, is that not all commodities
and/or services purchased are assumed to have at least one stage of production within the province.
This assumption is crucial for souvenirs, gasoline and other commodities.

2015 Brantford International Jazz Festival – Economic Impact Assessment
15
Taxes and employment are key economic considerations. However, as these concepts fall outside of the
System of National Account Provincial input/output tables, their impacts must be calculated separately.
Current tax and employment data for each region is used to econometrically estimate a series of
coefficients and rates. These coefficients and/or rates are then applied to measures determined within
the input-output framework of the model, yielding the final tax and employment figures.
Regional (Sub-Provincial) Impact Methodology
The method used to simulate intraprovincial commodity flows and ultimately regional impacts follows
directly from regional economic principles. The principle is referred to as the "gravity model". Basically
the "gravity model" states that the required commodity (& service) inputs will be "recruited" in a
manner that takes into consideration economies of scale (i.e. production costs), transportation costs
and the availability of specific industries. Economies of scale (i.e. lower production costs) are positively
correlated with input demand while greater transportation costs are negatively correlated with input
demand. Fulfilling that demand from other provincial regions is contingent on the fact that the specific
industry does actually exist. An advantage of using the "gravity model" to simulate intraprovincial
commodity flows is that as the industrial composition of the labour force changes, or as new industries
appear for the first time in specific regions, the share of production between the various sub-provincial
regions also changes.
By following this principle of the gravity model, all sub-provincial regions of a province are assigned a
coefficient for their relative economies of scale in each industry (using the latest industry labour force
measures) as well as a coefficient to represent the transportation cost involved to get each industry's
output to the designated market. One variation on the "gravity model" principle involves the estimation
of "relative trade distances" by incorporating different "weights" for different modes of transport. Once
these coefficients are generated for all regions and over all industries, a measure of sensitivity (mostly
relative to price, but in the case of service industries also to a "local preference criteria") is then applied
to all commodities. Another variation on the strict "gravity model" approach is that the measure of
sensitivity is adjusted by varying the distance exponent (which in the basic "gravity model" is 2) based
on the commodity or service required. The variation in distance exponents revolve, principally, around
two research hypotheses: (1) the greater the proportion of total shipments from the largest producer
(or shipper), the lower the exponent, and (2) the greater the proportion of total flow which is local
(intraregional), the higher the exponent.

2015 Brantford International Jazz Festival – Economic Impact Assessment
16
Appendix 2: Glossary of Terms used by STEAM
Initial Expenditure - This figure indicates the amount of initial expenditures or revenue used in the
analysis. This heading indicates not only the total magnitude of the spending but also the region in
which it was spent (thus establishing the "impact" region).
Direct Impact - Relates ONLY to the impact on “front-line” businesses. These are businesses that initially
receive the operating revenue or tourist expenditures for the project under analysis. From a business
perspective, this impact is limited only to that particular business or group of businesses involved. From
a tourist spending perspective, this can include all businesses such as hotels, restaurants, retail stores,
transportation carriers, attraction facilities and so forth.
Indirect Impact - Refers to the impacts resulting from all intermediate rounds of production in the
supply of goods and services to industry sectors identified in the direct impact phase. An example of this
would be the supply and production of bed sheets to a hotel.
Induced Impact - These impacts are generated as a result of spending by employees (in the form of
consumer spending) and businesses (in the form of investment) that benefited either directly or
indirectly from the initial expenditures under analysis. An example of induced consumer spending would
be the impacts generated by hotel employees on typical consumer items such as groceries, shoes,
cameras, etc. An example of induced business investment would be the impacts generated by the
spending of retained earnings, attributable to the expenditures under analysis, on machinery and
equipment.
Gross Domestic Product (GDP) - This figure represents the total value of production of goods and
services in the economy resulting from the initial expenditure under analysis (valued at market prices).
NOTE: The multiplier (A), Total/Initial, represents the total (direct, indirect and induced) impact on GDP
for every dollar of direct GDP. This is a measure of the level of spin-off activity generated as a result of a
particular project. For instance if this multiplier is 1.5 then this implies that for every dollar of GDP
directly generated by “front-line” tourism businesses an additional $0.50 of GDP is generated in spin-off
activity (e.g. suppliers).
The multiplier (B), Total/$ Expenditure, represent the total (direct, indirect and induced) impact on GDP
for every dollar of expenditure (or revenue from a business perspective). This is a measure of how
effective project related expenditures translate into GDP for the province (or region). Depending upon
the level of expenditures, this multiplier ultimately determines the overall level of net economic activity
associated with the project. To take an example, if this multiplier is 1.0, this means that for every dollar
of expenditure, one dollar of total GDP is generated. The magnitude of this multiplier is influenced by
the level of withdrawals, or imports, necessary to sustain both production and final demand
requirements. The less capable a region or province is at fulfilling all necessary production and final
demand requirements, all things being equal, the lower the eventual economic impact will be.
2015 Brantford International Jazz Festival – Economic Impact Assessment
17
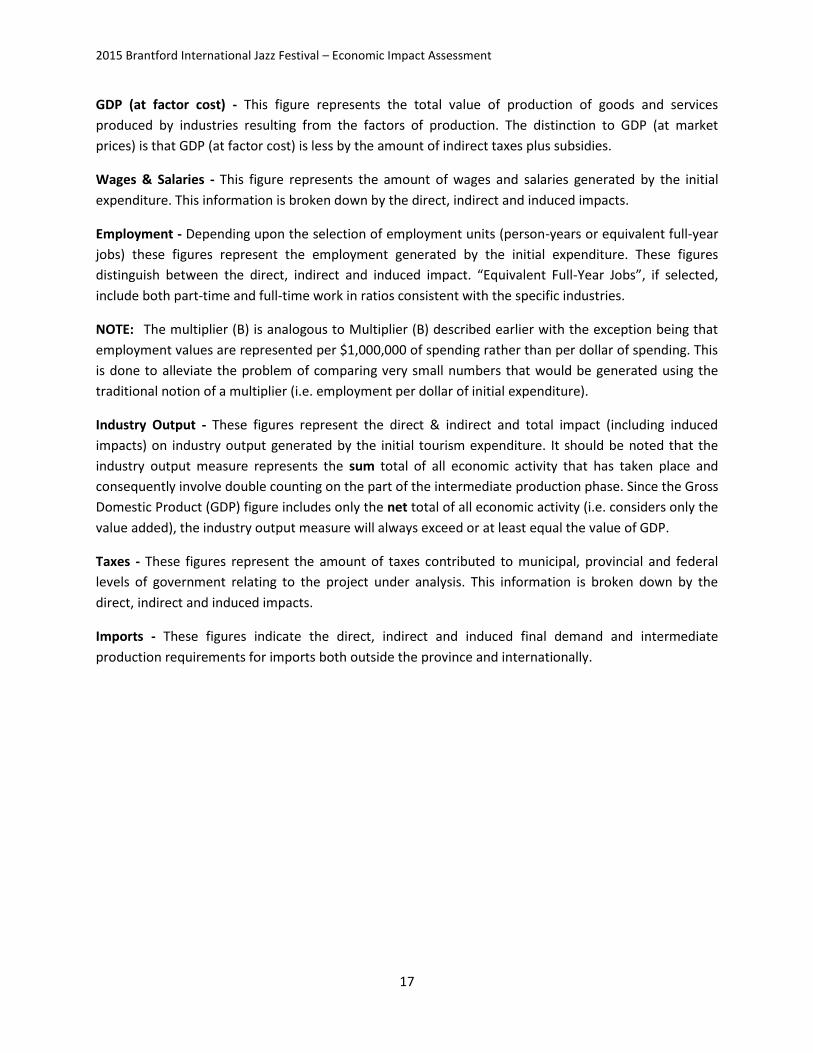
GDP (at factor cost) - This figure represents the total value of production of goods and services
produced by industries resulting from the factors of production. The distinction to GDP (at market
prices) is that GDP (at factor cost) is less by the amount of indirect taxes plus subsidies.
Wages & Salaries - This figure represents the amount of wages and salaries generated by the initial
expenditure. This information is broken down by the direct, indirect and induced impacts.
Employment - Depending upon the selection of employment units (person-years or equivalent full-year
jobs) these figures represent the employment generated by the initial expenditure. These figures
distinguish between the direct, indirect and induced impact. “Equivalent Full-Year Jobs”, if selected,
include both part-time and full-time work in ratios consistent with the specific industries.
NOTE: The multiplier (B) is analogous to Multiplier (B) described earlier with the exception being that
employment values are represented per $1,000,000 of spending rather than per dollar of spending. This
is done to alleviate the problem of comparing very small numbers that would be generated using the
traditional notion of a multiplier (i.e. employment per dollar of initial expenditure).
Industry Output - These figures represent the direct & indirect and total impact (including induced
impacts) on industry output generated by the initial tourism expenditure. It should be noted that the
industry output measure represents the sum total of all economic activity that has taken place and
consequently involve double counting on the part of the intermediate production phase. Since the Gross
Domestic Product (GDP) figure includes only the net total of all economic activity (i.e. considers only the
value added), the industry output measure will always exceed or at least equal the value of GDP.
Taxes - These figures represent the amount of taxes contributed to municipal, provincial and federal
levels of government relating to the project under analysis. This information is broken down by the
direct, indirect and induced impacts.
Imports - These figures indicate the direct, indirect and induced final demand and intermediate
production requirements for imports both outside the province and internationally.

2015 Wayne Gretzky International Hockey
Tournament Brantford, Ontario
Economic Impact Assessment
March 2016
The following analysis provides the economic impact of the 2015 Wayne Gretzky International Hockey
Tournament which took place in Brantford, Ontario from December 27-30, 2015, as generated by the
Sport Tourism Economic Assessment Model, Professional version.
2015 Wayne Gretzky International Hockey Tournament – Economic Impact Assessment
2
Economic Impact Assessment Funding Partners
The Canadian Sport Tourism Alliance wishes to acknowledge the financial and logistics support of
Brantford Economic Development in the completion of this study.
For more information about this report, please contact:
Tony Fisher, Canadian Sport Tourism Alliance, [email protected]
Donna Clements, Economic Development & Tourism – City of Brantford, [email protected]

2015 Wayne Gretzky International Hockey Tournament – Economic Impact Assessment
3
1.0 Background
The 2015 Wayne Gretzky International Hockey Tournament, hosted by the Brantford Minor Hockey
Association in Brantford, Ontario took place between December 27 and 30, 2015. The tournament is one
of Ontario’s oldest, with 2015 being the 46th edition and it attracted thousands of participants in
divisions ranging from Novice to Midget and teams coming from as far away as Norway and Finland.
With the tournament taking place over the Christmas / New-Year’s break, it also attracts a considerable
number of spectators to Brantford and the spending of these visitors, along with the expenditures made
by the organizers in hosting the Wayne Gretzky International Hockey Tournament resulted in a
considerable boost in economic activity for the local economy.
The next section of the report provides details of the results obtained from the on-site survey that was
asked of spectators at the tournament. The survey results were used to ascertain both the number and
origin of visitors and the expenditures that visitors made while in Brantford for the tournament. Section
3 provides details of operational expenditures and revenues that further contributed to the impact of
the championship, while Section 4 presents the STEAM PRO1 results from the combined expenditures of
the visitors and the host committee’s operational expenditures. The appendices include additional
information regarding the economic impact model and a glossary of the terms used.
1The Canadian Sport Tourism Alliance’s (CSTA’s) Sport Tourism Economic Assessment Model, Professional version (STEAM
PRO) was used to generate the economic impact estimates detailed in this report. STEAM PRO, which was developed in 2006,
is a model that has been designed to incorporate the results of primary data collected from event visitors and the budget /
capital expenditures of event organizers and others to prepare economic impact assessments. The model is based on the
Canadian Tourism Research Institute’s (CTRI - a branch of The Conference Board of Canada) TEAM model, which is the most
widely used tourism economic impact model in Canada. The results of STEAM PRO are fully consistent with the CSTA’s STEAM
model. A more detailed description of STEAM PRO is contained within Appendix 1.

2015 Wayne Gretzky International Hockey Tournament – Economic Impact Assessment
4
2.0 Methodology / Survey Results
Information regarding the origin and spending of spectators attending the 2015 Wayne Gretzky
International Hockey Tournament was collected through the administration of an on-site intercept
survey. The survey captured information about the origin and number of family members that
accompanied each participant. Out of town visitors were also asked questions about their visit and the
expenditures while they were in Brantford. Surveys were conducted using tablet computers running
Survey Analytics’ Survey Pocket software.2
Survey Results
A total of 166 parties were approached over the four days, with 19 parties choosing not to participate
(11%) and 11 having been intercepted previously for a total sample size of 136 responses.
Among those surveyed, 38% were local residents (Brantford under 40km), 37% were same-day
travellers, 14% were regional overnight travellers and 12% were respondents from Ontario over 200km,
the U.S. or international.
The number of people (athletes and spectators) attending the 2015 Wayne Gretzky International Hockey
Tournament as spectators was calculated by first calculating the ratio between the number of players
and spectators in each visitor party. The survey found that every athlete on the ice was accompanied by
2.35 family members (i.e. 1 or 2 parents and /or 1 or 2 siblings).
With the tournament featuring 2,755 participants, the results indicate that they were accompanied by
6,478 spectators for a total of 9,233 people.
Table 2.1 Tournament Attendance
Origin Share Individuals Local (under 40km) 38% 3,520
Sameday 37% 3,388
Regional OV 14% 1,262
Other Ontario OV 12% 1,063
Total 100% 9,233
Among out of town visitors who were staying overnight, the majority stayed in commercial
accommodation in Brantford (82%) with 9% staying with friends and family and 9% staying in hotels
outside of Brantford. Those who stayed outside of Brantford did so as there were no hotel available or
there were no hotels with the desired amenities.
2 For information see www.surveypocket.com

2015 Wayne Gretzky International Hockey Tournament – Economic Impact Assessment
5
Spectator Expenditures
Out of town spectators were also asked what they spent in Brantford while they were attending the
2015 Wayne Gretzky International Hockey Tournament. Visitor expenditures were broken out into four
categories: spending by same-day visitors, overnight visitors from regional Ontario and long distance
overnight visitors (including long-haul Ontario, out of province, and the U.S.). The average out of town
same-day traveller spent $129 per person as they made at least two day trips to Brantford. The typical
overnight visitor from regional Ontario spent $202 per person with a trip length of 1.7 nights while long
distance travellers spent $225 per night (Table 2.2). Combining the spending per person with the overall
attendance shows that total visitor spending associated with the 2015 Wayne Gretzky International
Hockey Tournament reached $931,000 (Table 2.3).
Table 2.2 Wayne Gretzky International Hockey Tournament Spectator Spending
Same-
day
Regional
Overnight
Long-haul
Overnight Average Visitor party size 3.8 3.47 3.94 3.76
Total Nights 1.72 2.27 1.97
Accommodation $0.00 $60.74 $69.24 $26.30
Restaurants $52.54 $68.23 $58.47 $57.11
Grocery / Other Food & Beverage $14.85 $13.64 $12.46 $14.14
Recreation & Entertainment $15.52 $16.21 $20.73 $16.64
Shopping $20.76 $14.41 $32.04 $21.46
Transportation in Brantford $19.09 $18.22 $26.03 $20.19
Transportation to Brantford $6.00 $10.81 $6.35 $7.13
Total $128.75 $202.26 $225.31 $162.96
Table 2.3 Wayne Gretzky International Hockey Tournament Spectator Spending
Same-
day
Regional
Overnight
Long-haul
Overnight Total
Visitors 3,388 1,262 1,063 5,713
Accommodation $0 $76,648 $73,597 $150,245
Restaurants $177,995 $86,107 $62,150 $326,252
Grocery / Other Food & Beverage
$50,312 $17,213 $13,242 $80,767
Recreation & Entertainment $52,576 $20,457 $22,034 $95,068
Shopping $70,328 $18,184 $34,062 $122,574
Transportation in Brantford $64,675 $23,000 $27,673 $115,348
Transportation to Brantford $20,328 $13,638 $6,745 $40,711
Total $436,214 $255,248 $239,503 $930,965

2015 Wayne Gretzky International Hockey Tournament – Economic Impact Assessment
6
3.0 Operations Expenditures
The organizers of the 2015 Wayne Gretzky International Hockey Tournament invested significantly in
producing a high-caliber event in Brantford, with expenditures covering items such as rental of the
venue, advertising and the business operations of supporting the event.
Even though they are not included directly in the budget, the 2015 Wayne Gretzky International Hockey
Tournament was supported by many volunteers from Brantford who donated considerable amounts of
their time to make the event happen.
2015 Wayne Gretzky International Hockey Tournament – Economic Impact Assessment
7
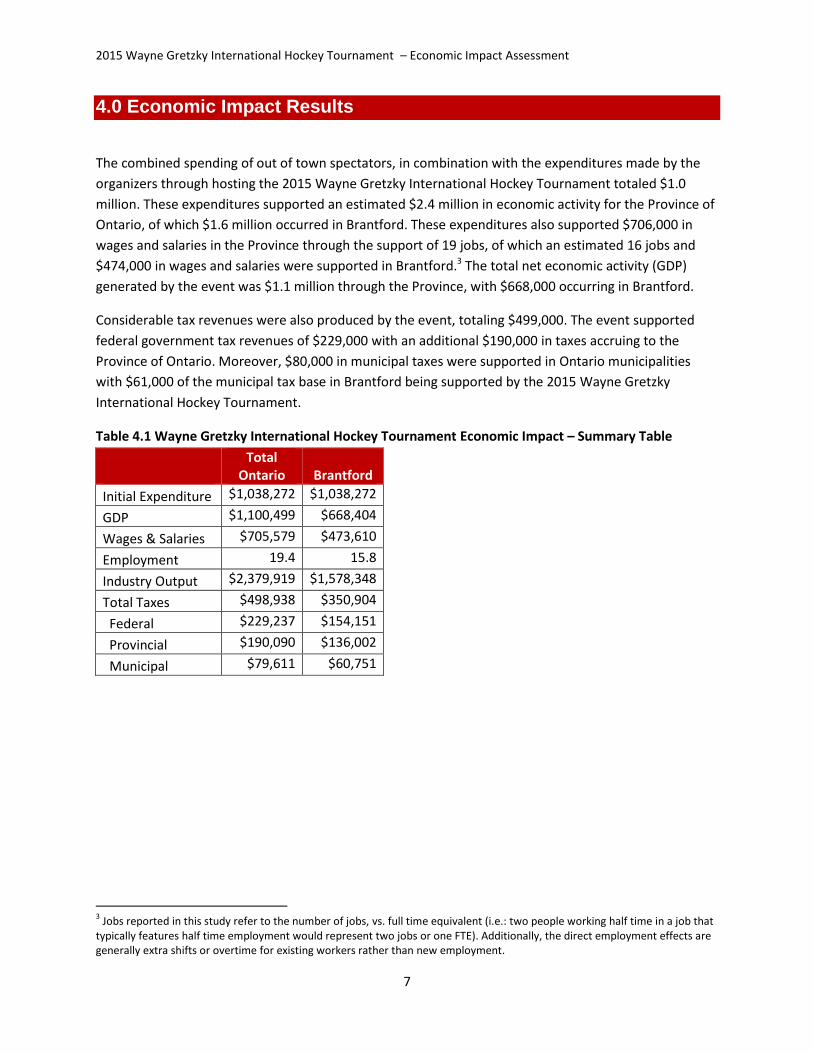
4.0 Economic Impact Results
The combined spending of out of town spectators, in combination with the expenditures made by the
organizers through hosting the 2015 Wayne Gretzky International Hockey Tournament totaled $1.0
million. These expenditures supported an estimated $2.4 million in economic activity for the Province of
Ontario, of which $1.6 million occurred in Brantford. These expenditures also supported $706,000 in
wages and salaries in the Province through the support of 19 jobs, of which an estimated 16 jobs and
$474,000 in wages and salaries were supported in Brantford.3 The total net economic activity (GDP)
generated by the event was $1.1 million through the Province, with $668,000 occurring in Brantford.
Considerable tax revenues were also produced by the event, totaling $499,000. The event supported
federal government tax revenues of $229,000 with an additional $190,000 in taxes accruing to the
Province of Ontario. Moreover, $80,000 in municipal taxes were supported in Ontario municipalities
with $61,000 of the municipal tax base in Brantford being supported by the 2015 Wayne Gretzky
International Hockey Tournament.
Table 4.1 Wayne Gretzky International Hockey Tournament Economic Impact – Summary Table
Total
Ontario Brantford
Initial Expenditure $1,038,272 $1,038,272
GDP $1,100,499 $668,404
Wages & Salaries $705,579 $473,610
Employment 19.4 15.8
Industry Output $2,379,919 $1,578,348
Total Taxes $498,938 $350,904
Federal $229,237 $154,151
Provincial $190,090 $136,002
Municipal $79,611 $60,751
3 Jobs reported in this study refer to the number of jobs, vs. full time equivalent (i.e.: two people working half time in a job that
typically features half time employment would represent two jobs or one FTE). Additionally, the direct employment effects are generally extra shifts or overtime for existing workers rather than new employment.

2015 Wayne Gretzky International Hockey Tournament – Economic Impact Assessment
8
Table 4.2 Total Economic Impact
Total
Ontario
Total
Brantford
Rest of
Ontario
Initial Expenditure $1,038,272 $1,038,272 $0
Gross Domestic Product
Direct Impact $376,906 $376,906 $0
Indirect Impact $435,002 $160,354 $274,648
Induced Impact $288,591 $131,144 $157,447
Total Impact $1,100,499 $668,404 $432,095
Industry Output
Direct & Indirect $1,749,337 $1,291,749 $457,588
Induced Impact $630,582 $286,599 $343,983
Total Impact $2,379,919 $1,578,348 $801,571
Wages & Salaries
Direct Impact $273,220 $273,220 $0
Indirect Impact $254,173 $120,498 $133,675
Induced Impact $178,186 $79,892 $98,294
Total Impact $705,579 $473,610 $231,969
Employment (Full-year jobs)
Direct Impact 4 10.8 10.8 -
Indirect Impact 4.7 2.4 2.2
Induced Impact 3.9 2.6 1.3
Total Impact 19.4 15.8 3.6
Taxes (Total)
Federal $229,237 $154,151 $75,086
Provincial $190,090 $136,002 $54,088
Municipal $79,611 $60,751 $18,860
Total $498,938 $350,904 $148,034
4 Jobs reported in this study refer to the number of jobs, vs. full time equivalent (i.e.: two people working half time in a job that
typically features half time employment would represent two jobs or one FTE). Additionally, the direct employment effects are generally extra shifts or overtime for existing workers rather than new employment.

2015 Wayne Gretzky International Hockey Tournament – Economic Impact Assessment
9
Appendix 1: Economic Impact Methodology – Sport Tourism
Economic Assessment Model
Background
Briefly, the purpose of STEAM is to calculate both the provincial and regional economic impacts of sport
and event based tourism. The economic impacts are calculated on the basis of capital and operating
expenditures on goods, services and employee salaries, and on the basis of tourist spending within a
designated tourism sector. The elements used to measure the economic impacts are Gross Domestic
Product (GDP), Employment, Taxes, Industry Output and Imports. STEAM measures the direct, indirect &
induced effects for each of these elements.
Technical Description of the Impact Methodology used by STEAM
STEAM and many other impact studies are based on input-output techniques. Input-output models
involve the use of coefficients that are based on economic or business linkages. These linkages trace
how tourist expenditures or business operations filter through the economy. In turn, the coefficients
applied are then used to quantify how tourism related activity in a particular region generates
employment, taxes, income, etc. The input-output approach indicates not only the direct and indirect
impact of tourism, but can also indicate the induced effect resulting from the re-spending of wages and
salaries generated.
All impacts generated by the model are given at the direct impact stage (i.e. the "front line" businesses
impacted by tourism expenditures), indirect impact stage (i.e. those industries which supply
commodities and/or services to the "front line" businesses) and the induced impact stage (induced
consumption attributable to the wages and salaries generated from both the direct and indirect impact).
In this sense, the model is closed with respect to wages. Imports are also determined within the model,
so the model is closed with respect to imports. Exports are not endogenized (i.e. additional exports are
not assumed with the induced impact) which consequently generates more conservative impacts.
Another assumption of the model, which leads to more conservative impacts, is that not all commodities
and/or services purchased are assumed to have at least one stage of production within the province.
This assumption is crucial for souvenirs, gasoline and other commodities.

2015 Wayne Gretzky International Hockey Tournament – Economic Impact Assessment
10
Taxes and employment are key economic considerations. However, as these concepts fall outside of the
System of National Account Provincial input/output tables, their impacts must be calculated separately.
Current tax and employment data for each region is used to econometrically estimate a series of
coefficients and rates. These coefficients and/or rates are then applied to measures determined within
the input-output framework of the model, yielding the final tax and employment figures.
Regional (Sub-Provincial) Impact Methodology
The method used to simulate intraprovincial commodity flows and ultimately regional impacts follows
directly from regional economic principles. The principle is referred to as the "gravity model". Basically
the "gravity model" states that the required commodity (& service) inputs will be "recruited" in a
manner that takes into consideration economies of scale (i.e. production costs), transportation costs
and the availability of specific industries. Economies of scale (i.e. lower production costs) are positively
correlated with input demand while greater transportation costs are negatively correlated with input
demand. Fulfilling that demand from other provincial regions is contingent on the fact that the specific
industry does actually exist. An advantage of using the "gravity model" to simulate intraprovincial
commodity flows is that as the industrial composition of the labour force changes, or as new industries
appear for the first time in specific regions, the share of production between the various sub-provincial
regions also changes.
By following this principle of the gravity model, all sub-provincial regions of a province are assigned a
coefficient for their relative economies of scale in each industry (using the latest industry labour force
measures) as well as a coefficient to represent the transportation cost involved to get each industry's
output to the designated market. One variation on the "gravity model" principle involves the estimation
of "relative trade distances" by incorporating different "weights" for different modes of transport. Once
these coefficients are generated for all regions and over all industries, a measure of sensitivity (mostly
relative to price, but in the case of service industries also to a "local preference criteria") is then applied
to all commodities. Another variation on the strict "gravity model" approach is that the measure of
sensitivity is adjusted by varying the distance exponent (which in the basic "gravity model" is 2) based
on the commodity or service required. The variation in distance exponents revolve, principally, around
two research hypotheses: (1) the greater the proportion of total shipments from the largest producer
(or shipper), the lower the exponent, and (2) the greater the proportion of total flow which is local
(intraregional), the higher the exponent.
2015 Wayne Gretzky International Hockey Tournament – Economic Impact Assessment
11
Appendix 2: Glossary of Terms used by STEAM
Initial Expenditure - This figure indicates the amount of initial expenditures or revenue used in the
analysis. This heading indicates not only the total magnitude of the spending but also the region in
which it was spent (thus establishing the "impact" region).
Direct Impact - Relates ONLY to the impact on “front-line” businesses. These are businesses that initially
receive the operating revenue or tourist expenditures for the project under analysis. From a business
perspective, this impact is limited only to that particular business or group of businesses involved. From
a tourist spending perspective, this can include all businesses such as hotels, restaurants, retail stores,
transportation carriers, attraction facilities and so forth.
Indirect Impact - Refers to the impacts resulting from all intermediate rounds of production in the
supply of goods and services to industry sectors identified in the direct impact phase. An example of this
would be the supply and production of bed sheets to a hotel.
Induced Impact - These impacts are generated as a result of spending by employees (in the form of
consumer spending) and businesses (in the form of investment) that benefited either directly or
indirectly from the initial expenditures under analysis. An example of induced consumer spending would
be the impacts generated by hotel employees on typical consumer items such as groceries, shoes,
cameras, etc. An example of induced business investment would be the impacts generated by the
spending of retained earnings, attributable to the expenditures under analysis, on machinery and
equipment.
Gross Domestic Product (GDP) - This figure represents the total value of production of goods and
services in the economy resulting from the initial expenditure under analysis (valued at market prices).
NOTE: The multiplier (A), Total/Initial, represents the total (direct, indirect and induced) impact on GDP
for every dollar of direct GDP. This is a measure of the level of spin-off activity generated as a result of a
particular project. For instance if this multiplier is 1.5 then this implies that for every dollar of GDP
directly generated by “front-line” tourism businesses an additional $0.50 of GDP is generated in spin-off
activity (e.g. suppliers).
The multiplier (B), Total/$ Expenditure, represent the total (direct, indirect and induced) impact on GDP
for every dollar of expenditure (or revenue from a business perspective). This is a measure of how
effective project related expenditures translate into GDP for the province (or region). Depending upon
the level of expenditures, this multiplier ultimately determines the overall level of net economic activity
associated with the project. To take an example, if this multiplier is 1.0, this means that for every dollar
of expenditure, one dollar of total GDP is generated. The magnitude of this multiplier is influenced by
the level of withdrawals, or imports, necessary to sustain both production and final demand
requirements. The less capable a region or province is at fulfilling all necessary production and final
demand requirements, all things being equal, the lower the eventual economic impact will be.
2015 Wayne Gretzky International Hockey Tournament – Economic Impact Assessment
12
GDP (at factor cost) - This figure represents the total value of production of goods and services
produced by industries resulting from the factors of production. The distinction to GDP (at market
prices) is that GDP (at factor cost) is less by the amount of indirect taxes plus subsidies.
Wages & Salaries - This figure represents the amount of wages and salaries generated by the initial
expenditure. This information is broken down by the direct, indirect and induced impacts.
Employment - Depending upon the selection of employment units (person-years or equivalent full-year
jobs) these figures represent the employment generated by the initial expenditure. These figures
distinguish between the direct, indirect and induced impact. “Equivalent Full-Year Jobs”, if selected,
include both part-time and full-time work in ratios consistent with the specific industries.
NOTE: The multiplier (B) is analogous to Multiplier (B) described earlier with the exception being that
employment values are represented per $1,000,000 of spending rather than per dollar of spending. This
is done to alleviate the problem of comparing very small numbers that would be generated using the
traditional notion of a multiplier (i.e. employment per dollar of initial expenditure).
Industry Output - These figures represent the direct & indirect and total impact (including induced
impacts) on industry output generated by the initial tourism expenditure. It should be noted that the
industry output measure represents the sum total of all economic activity that has taken place and
consequently involve double counting on the part of the intermediate production phase. Since the Gross
Domestic Product (GDP) figure includes only the net total of all economic activity (i.e. considers only the
value added), the industry output measure will always exceed or at least equal the value of GDP.
Taxes - These figures represent the amount of taxes contributed to municipal, provincial and federal
levels of government relating to the project under analysis. This information is broken down by the
direct, indirect and induced impacts.
Imports - These figures indicate the direct, indirect and induced final demand and intermediate
production requirements for imports both outside the province and internationally.