Datacenter Workload Analysis & Qualification of SSD Storage … · 2021. 7. 20. · Windows Server...
45
Datacenter Workload Analysis & Qualification of SSD Storage Servers Eden Kim Calypso Systems, Inc.
Transcript of Datacenter Workload Analysis & Qualification of SSD Storage … · 2021. 7. 20. · Windows Server...

2017 Storage Developer Conference. © Calypso Systems, Inc. All Rights Reserved.
Datacenter Workload Analysis &
Qualification of SSD Storage Servers
Eden KimCalypso Systems, Inc.

2017 Storage Developer Conference. © Calypso Systems, Inc. All Rights Reserved.
Datacenter Workloads & Storage Qualification
1. What are Datacenter Real World Storage Workloads?

2017 Storage Developer Conference. © Calypso Systems, Inc. All Rights Reserved.
3

2017 Storage Developer Conference. © Calypso Systems, Inc. All Rights Reserved.

2017 Storage Developer Conference. © Calypso Systems, Inc. All Rights Reserved.
An IO Stream1 is an Input/Output Operation (IO)
that has a unique:
1 Workload IO Stream definitions used here differ from SSD Endurance Streams where similar write operations are associated with a group of associated data
IO Stream Table: 2 Minute Capture Step showing IO Stream Statistics
• Random or Sequential Access
• Block Size or Data Transfer Size
A single IO Stream can occur many times during an IO Capture Step Other Secondary Metrics can be associated with IO Streams
• Read or Write IO
• Queue Depth (QD)

2017 Storage Developer Conference. © Calypso Systems, Inc. All Rights Reserved.
An IO Capture is the tabulation of statistics on IO
Streams that are observed during a capture period
• IO Capture Tools gather statistics and metrics on IO Streams
• An IO Capture is NOT an IO Trace
• No data or private information is collected
• Only binary numeric tables are gathered

2017 Storage Developer Conference. © Calypso Systems, Inc. All Rights Reserved.
IO Capture Tools are OS specific, vary by
the OS(s) supported, capture level and IO
Metrics taken• perfmon is a public tool for Windows
• blktrace is a public tool for Linux
• hiomon by hyperIO is for Windows
• IOProfiler at TestMyWorkload.com (by Calypso) is for Windows, MacOS, Linux & FreeBSD
TestMyWorkload.com is the official SNIA SSSI site for Reference IO Capturesoffering Free Capture tools, Analytics and Reference captures for public and SNIA Technical Works use2

2017 Storage Developer Conference. © Calypso Systems, Inc. All Rights Reserved.
RWSWs are key determinants in storage performance
and have a significant impact on SW and storage
optimizations• Solid State Storage Performance depends, in large part, on RWSWs
• Unlike lab test workloads, RWSWs are comprised of dynamically changing combinations of IO Streams & Demand Intensity
• IO Stream content affects Optimization, Design, Validation & Failure Analysis
• IO Streams change at each layer of software abstraction in the SW Stack

2017 Storage Developer Conference. © Calypso Systems, Inc. All Rights Reserved.
The Software (SW) Stack refers to the layers of
software (OS, APIs, programs, drivers and
abstractions) that exist between User space and
storage
Windows Software Stack
• IO Streams are generated in User space by software applications
• IO Streams traverse the SW Stack to storage and back
• IO Stream composition is different at different levels in the SW Stack

2017 Storage Developer Conference. © Calypso Systems, Inc. All Rights Reserved.
IO Streams are affected (modified) at each layer of Software abstraction.
Examples include:
• Software Applications & OS Kernel activities
• Metadata, Journaling, Caching, Packetization, Tiering
• IO Appending, Coalescing, Fragmentation, Merging
• Virtualization, Encryption, Deduplication, Compression
• Back-up, Cloning, Imaging, Snapshot, Replication
• Storage Architectures, Endurance Algorithms, SSD Optimizations
Meta-DataMerge Coalesce Append FragmentFile System Block IO VMs CloudWrites to cache Virtualization Encryption Data ReductionCompression De-Duplication Snapshot Back-up Clone
SANHyper Converge Scale Out Array LUN Physical NAS JBOF JBOD SSDSDS HBA

2017 Storage Developer Conference. © Calypso Systems, Inc. All Rights Reserved.
Solid State Storage Performance depends on how
well storage responds to constantly changing
combinations of IO Streams and Demand Intensity
RWSW – IOPS & Changing Combinations of IO Streams
RWSW - Throughput & Changing Queue Depths
• RWSWs are constantly changing combinations of IO Streams and QDs whereas Synthetic Lab tests are a fixed and constant workload
• IO Streams will have different Block Sizes, Accesses and Read or Write IOs
• Solid State Storage responds differently to the type of access (RND or SEQ), the Block Size, and whether the IO is a Read or a Write
• The type and combination of RWSW IO Streams and the Demand Intensity determines, in large part, the storage performance that is provided

2017 Storage Developer Conference. © Calypso Systems, Inc. All Rights Reserved.
Datacenter Workloads & Storage Qualification
2. Visualization of IO Capture Workloads
2017 Storage Developer Conference. © Calypso Systems, Inc. All Rights Reserved.
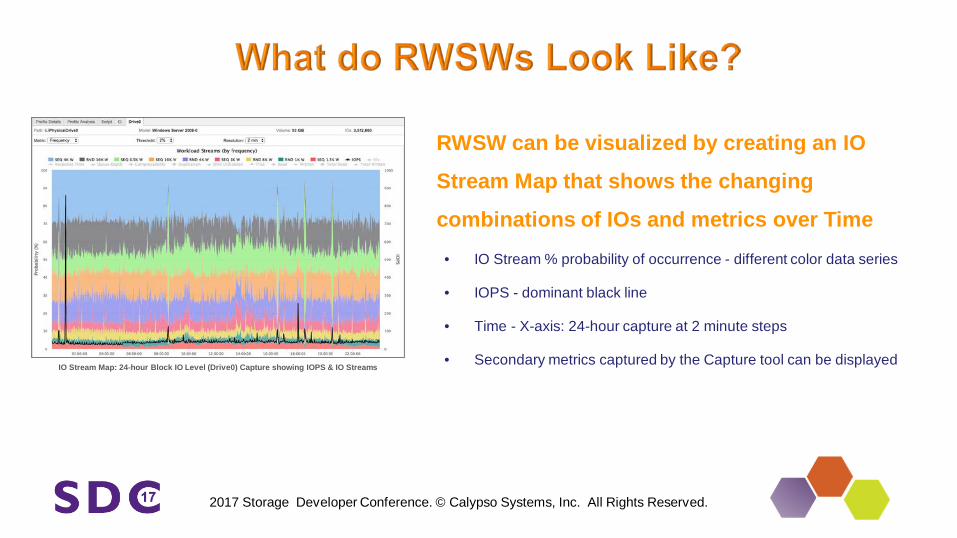
RWSW can be visualized by creating an IO
Stream Map that shows the changing
combinations of IOs and metrics over Time
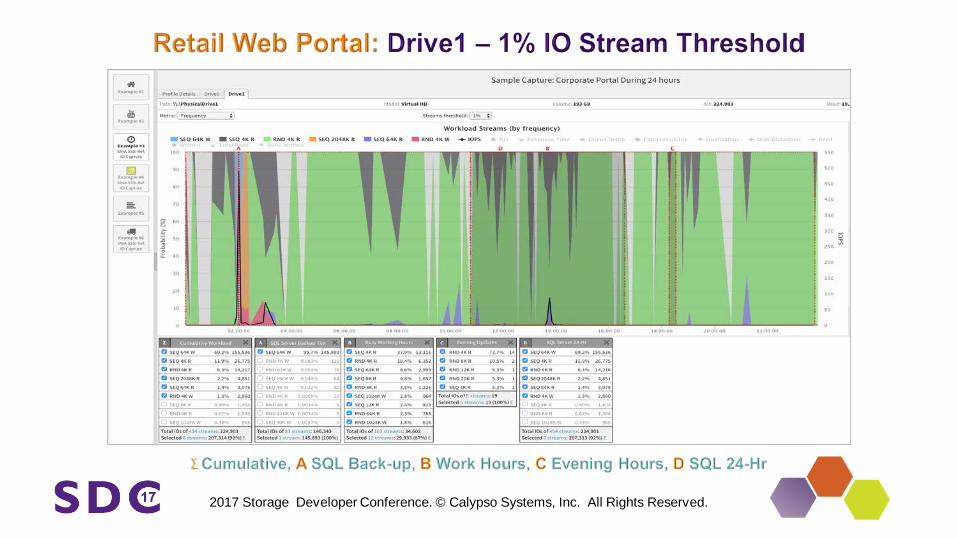
IO Stream Map: 24-hour Block IO Level (Drive0) Capture showing IOPS & IO Streams
• IO Stream % probability of occurrence - different color data series
• IOPS - dominant black line
• Time - X-axis: 24-hour capture at 2 minute steps
• Secondary metrics captured by the Capture tool can be displayed

2017 Storage Developer Conference. © Calypso Systems, Inc. All Rights Reserved.
Secondary IO Metrics captured by the
IO Capture tool can be viewed on an IO
Stream Map
• IO Capture tools can capture various Secondary IO Metrics
• IO Streams can be listed by RND/SEQ access, Block Size & R/W IO
• Average & Maximum Response Times and QDs are shown to the left
• Additional IO Metrics can be shown for IO Count, Duplication Ratio, Compression Ratio, Disk Utilization, Reads, Writes and more
2017 Storage Developer Conference. © Calypso Systems, Inc. All Rights Reserved.
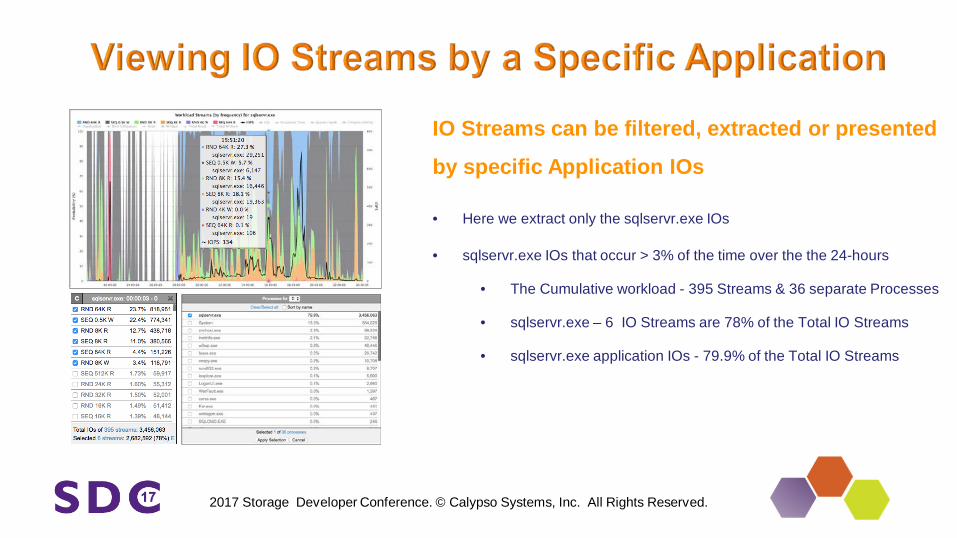
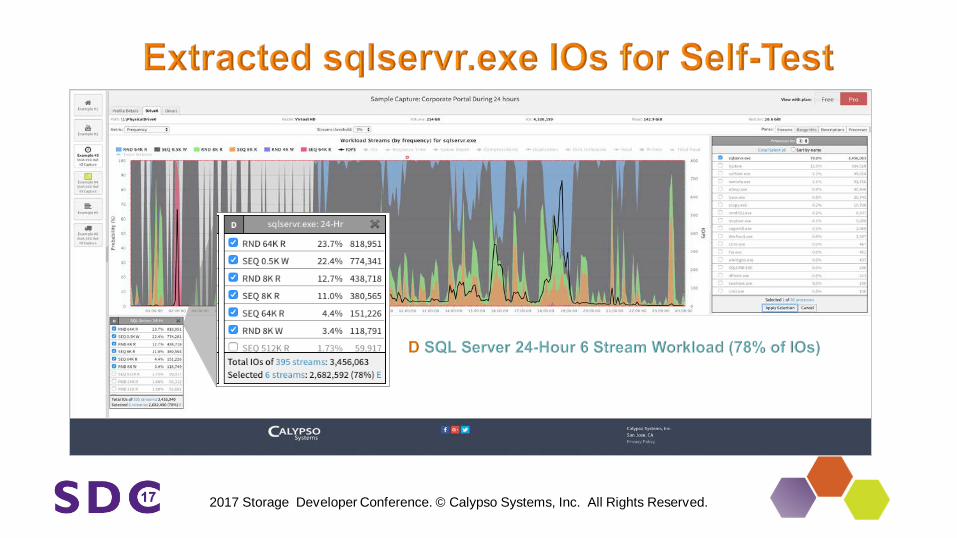
IO Streams can be filtered, extracted or presented
by specific Application IOs
• Here we extract only the sqlservr.exe IOs
• sqlservr.exe IOs that occur > 3% of the time over the the 24-hours
• The Cumulative workload - 395 Streams & 36 separate Processes
• sqlservr.exe – 6 IO Streams are 78% of the Total IO Streams
• sqlservr.exe application IOs - 79.9% of the Total IO Streams

2017 Storage Developer Conference. © Calypso Systems, Inc. All Rights Reserved.
RWSWs let us extract specific application
IOs to analyze the IO Composition, Metrics
and Performance that occur on the target
server during the IO Capture. We can see: IO Stream Composition of Selected Processes Changing Combinations of IO Streams
Application Process Response Times Throughput and Queue Depths v Time
• IO Stream Distribution of the selected Process(es)
• Changing combinations of IO Streams over time
• IO Process Average & Maximum Response Times
• IO Process Throughput and Average & Maximum Queue Depth
• Secondary IO Metrics gathered by the IO Capture tool

2017 Storage Developer Conference. © Calypso Systems, Inc. All Rights Reserved.
Datacenter Workloads & Storage Qualification
3. SNIA SSSI Reference IO Captures

2017 Storage Developer Conference. © Calypso Systems, Inc. All Rights Reserved.

2017 Storage Developer Conference. © Calypso Systems, Inc. All Rights Reserved.
Reference Workloads are Sample IO Captures posted to the
TestMyWorkload.com website
• Samples of recent user activity are posted for community viewing
• Used by SNIA Technical Work Groups for development of Technical Works
• Can be used as Benchmark Test Workloads for Datacenter Storage
• Can be used for general education & research
• 3 Reference IO Captures are currently posted

2017 Storage Developer Conference. © Calypso Systems, Inc. All Rights Reserved.
SNIA SSSI Reference IO Captures:
Example 3. 24-Hr Retail Web Portal Windows Server 2012R2Drive 0 & Drive 1 Block IO Level Captures
Example 4. SNIA Green Storage TWG WorkloadLinux OS - Block IO LevelIO capture of Synthetic Test Workload
Example 6. 24-Hr GPS Navigation PortalWindows Server 2012R2File System & Block IO Level

2017 Storage Developer Conference. © Calypso Systems, Inc. All Rights Reserved.

2017 Storage Developer Conference. © Calypso Systems, Inc. All Rights Reserved.

2017 Storage Developer Conference. © Calypso Systems, Inc. All Rights Reserved.
2017 Storage Developer Conference. © Calypso Systems, Inc. All Rights Reserved.

2017 Storage Developer Conference. © Calypso Systems, Inc. All Rights Reserved.
Datacenter Workloads & Storage Qualification
4. Selecting an IO Capture Workload for Analysis
2017 Storage Developer Conference. © Calypso Systems, Inc. All Rights Reserved.

2017 Storage Developer Conference. © Calypso Systems, Inc. All Rights Reserved.
6 Dominant IO Streams
over 24-Hour Capture
• RND 8K W 4.4%
• SEQ 64K R 5.6%
• SEQ 8K R 14.2%
• RND 8K R 16.4%
• SEQ 0.5K W 28.9%
• RND 64K R 30.5%

2017 Storage Developer Conference. © Calypso Systems, Inc. All Rights Reserved.
IO Streams can be used to analyze in-situ server performance as well as
used as a test workload to evaluate storage
• The 6 SQL IO Streams are used to analyze in-situ server performance
• ‘Self-Test’ presents IO Stream metrics (performance) from the capture
• The same SQL IO Streams can be used to test (and compare) storage
2017 Storage Developer Conference. © Calypso Systems, Inc. All Rights Reserved.29
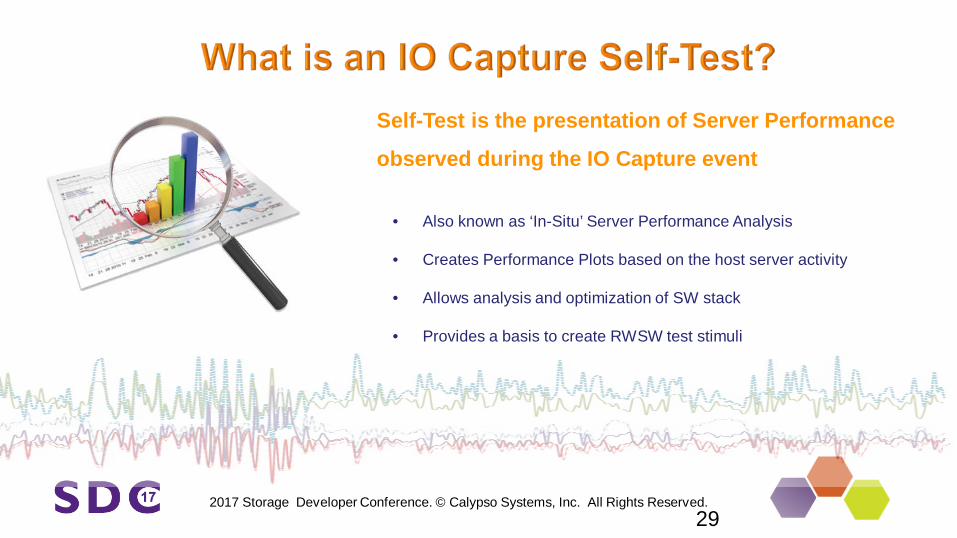
Self-Test is the presentation of Server Performance
observed during the IO Capture event
• Also known as ‘In-Situ’ Server Performance Analysis
• Creates Performance Plots based on the host server activity
• Allows analysis and optimization of SW stack
• Provides a basis to create RWSW test stimuli

2017 Storage Developer Conference. © Calypso Systems, Inc. All Rights Reserved.
24-Hour sqlservr.exe workload
IOPS v Time
• IO Rate Throttled by Server Applications
• Relatively Low Disk Utilization
• Limited Demand Intensity
• HDD based storage

2017 Storage Developer Conference. © Calypso Systems, Inc. All Rights Reserved.
Periods of Differing Demand
Intensity (Queue Depths) and
Throughput
• 2 am Back-up Throughput (TP) Spike
• Low Queue Depths (QD) in Early Morning Hours
• High Queue Depths during Day time
• Varying Average QDs over 24-hour capture
2017 Storage Developer Conference. © Calypso Systems, Inc. All Rights Reserved.
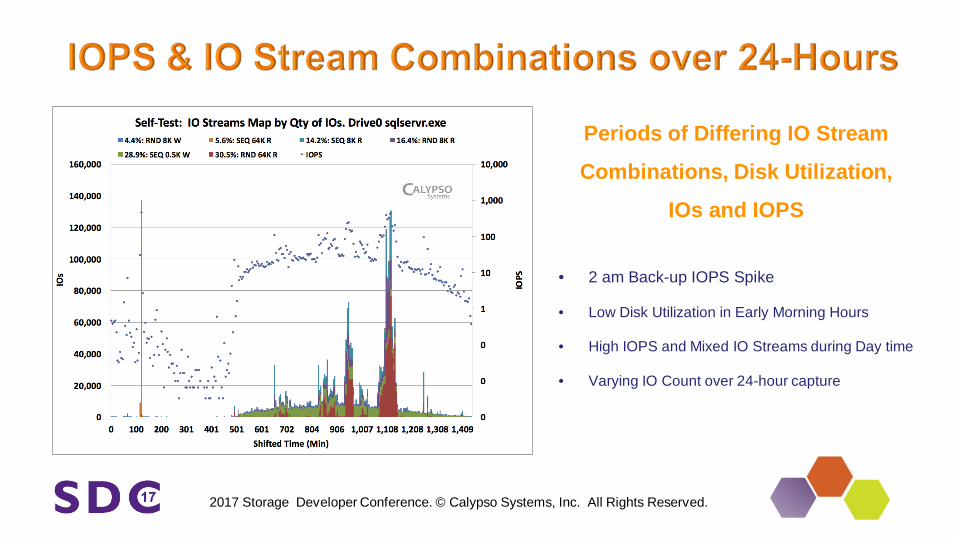
Periods of Differing IO Stream
Combinations, Disk Utilization,
IOs and IOPS
• 2 am Back-up IOPS Spike
• Low Disk Utilization in Early Morning Hours
• High IOPS and Mixed IO Streams during Day time
• Varying IO Count over 24-hour capture

2017 Storage Developer Conference. © Calypso Systems, Inc. All Rights Reserved.
Periods of Differing Average
and Maximum Response
Times over 24-Hours
• Higher Response Times (RTs) with more Users (QD) / Disk Utilization
• Lower Response Times (RTs) with fewer Users (QD) / Disk Utilization
• Response Times reflect total server, application and storage activities

2017 Storage Developer Conference. © Calypso Systems, Inc. All Rights Reserved.34
24-Hour sqlservr.exe workload
Average IOPS &
Average Response Time
• Limited IO Rates from server
• Periods of Low Disk Utilization
• Periods of Low Demand Intensity
• HDD based storage

2017 Storage Developer Conference. © Calypso Systems, Inc. All Rights Reserved.35
24-Hour sqlservr.exe workload
Compression Ratio (CR) &
Duplication Ratios (DR)
• CR & DR analyzes data written to storage
• CR - measures how much MORE data can be compressed
• DR – measures how many written blocks are duplicated
• Compare File system and Block IO level to assess efficacy of Compression & Dedupe

2017 Storage Developer Conference. © Calypso Systems, Inc. All Rights Reserved.
Datacenter Workloads & Storage Qualification

2017 Storage Developer Conference. © Calypso Systems, Inc. All Rights Reserved.
The 24-Hour sqlservr.exe workload is used
to create two RWSW test workloads:
1. Composite 6 IO Streams – 6 IO Streams applied for every test step.
Used for Multi-WSAT, Individual Streams-WSAT & DIRTH tests. i.e.
each test step applies the same combination of 6 IO Streams.
2. 24-Hour Replay – reproduce each capture step combination of IO
Streams. Used for Replay-Native test. i.e. each test step reproduces
the unique combination of IO Streams that occurred in each of the
original IO Capture steps.

2017 Storage Developer Conference. © Calypso Systems, Inc. All Rights Reserved.
1. Multi-WSAT – applies fixed 6 IO Stream composite workload for each test step to Steady State.
2. Individual Streams-WSAT – tests each individual IO Stream as a separate Steady State measurement.
3. DIRTH (Demand Intensity Response time Histogram) - applies fixed 6 IO Stream composite workload across a range of 1 to 1,024 Users to measure IOPS & Response Time saturation.
4. Replay-Native - reproduces each capture step combination of IO Streams, Queue Depths and Idle Times for storage comparison to the original IO Capture server storage
Multi-WSAT Individual Streams-WSAT
DIRTH Replay-Native

2017 Storage Developer Conference. © Calypso Systems, Inc. All Rights Reserved.
The fixed Composite 6 IO
Stream workload is applied to
Steady State
• Samsung SSD has highest performance followed by Seagate and Micron SSDs
• Sandisk SSD and Seagate SAS HDD are lower
• See component IO Stream performance in the following Individual Streams-WSAT results

2017 Storage Developer Conference. © Calypso Systems, Inc. All Rights Reserved.
Each component IO Stream is
applied to Steady State
• Samsung SSD has highest overall performance
• Sandisk SSD has highest RND 8K R
• Micron SSD has highest RND 8K W
• Note the SEQ 0.5K W performance differential
• SEQ 0.5K W are 28.9% of the total workload and explains the difference in overall performance

2017 Storage Developer Conference. © Calypso Systems, Inc. All Rights Reserved.
The Fixed IO Stream composite
workload is applied across a
range of 1 to 1,024 Users
• Samsung SSD has highest overall performance
• Host Server QD Range is Ave QD 5, Max QD 306
• Test Performance at 32 Users is highlighted (red box)
• Note that Ordinal Rank is consistent across Users
Host QD Range

2017 Storage Developer Conference. © Calypso Systems, Inc. All Rights Reserved.42
Reproduces the IO Capture
step IO Stream combinations,
QDs and Idle times for 24-Hrs
• Samsung SSD has highest overall performance
• Seagate SSD is second highest
• Micron SSD is close to the group mean
• Sandisk SSD and Seagate SSD are lower
• Note Self-Test reference baseline (red dotted line)

2017 Storage Developer Conference. © Calypso Systems, Inc. All Rights Reserved.
Datacenter Workloads & Storage Qualification
6. Conclusions

2017 Storage Developer Conference. © Calypso Systems, Inc. All Rights Reserved.
• Understanding Your RWSW is critical for Datacenter, Storage Server and SSD Design and Optimization
• Know what you are optimizing (IO Streams & SW Stack levels)
• Find out what IO Streams are presented to Storage
• Try Demos, Free Captures & Analysis at TestMyWorkload.com
• See SNIA Reference Captures at TestMyWorkload.com
• Download the White Paper at TestMyWorkload.com for full data analysis of the presented tests and sample pool drives
• www.TestMyWorkload.com
2017 Storage Developer Conference. © Calypso Systems, Inc. All Rights Reserved.
www.TestMyWorkload.com