Database Warehouse Environment (COMP10002) -...
48
Database Warehouse Environment (COMP10002) B00221402 14/12/2012
-
Upload
truonglien -
Category
Documents
-
view
222 -
download
2
Transcript of Database Warehouse Environment (COMP10002) -...
Database
Warehouse
Environment
(COMP10002)
B00221402
14/12/2012

Data Warehouse Environment 1 (COMP10002)
Contents
Chapter 1 – Setting the Scene ........................................................................................................... 3
1.1 Introduction .............................................................................................................................. 3
1.2 Overview of the HE Sector ....................................................................................................... 3
1.3 UWS in the HE Sector .............................................................................................................. 4
1.4 UWS Business Processes .......................................................................................................... 5
1.4.1 Admissions and Enrolment ................................................................................................... 5
1.4.2 Human Resources and Payroll .............................................................................................. 5
1.4.3 Finance ................................................................................................................................... 5
1.5 Decision Makers, Business Objectives and KPI in UWS .......................................................... 6
Chapter 2 – The Data Warehouse Environment ............................................................................... 7
2.1 Purpose and Importance of BI ................................................................................................. 7
2.2 Technologies and Products Used to Expose Data .................................................................. 8
2.2.1 ETL (Extract, transform, load) ................................................................................................ 8
2.2.2 OLAP – Online Analytical Processing ................................................................................... 9
2.2.3 Data Mining ......................................................................................................................... 13
2.2.4 Ad Hoc Query and Reporting ............................................................................................. 14
2.2.5 Production Reporting .......................................................................................................... 14
2.2.6 Dashboard/Scorecards........................................................................................................ 15
2.3 Issues with BI tools.................................................................................................................. 16
2.4 New trends ............................................................................................................................. 17
Chapter 3 – The Data Warehouse Environment for UWS .............................................................. 18
3.1 Introduction ............................................................................................................................ 18
3.2 Purpose and importance of BI for UWS ................................................................................ 18
3.3 Technologies and products appropriate for UWS ................................................................ 19
3.3.1 ETL – Extract, Transform and Load ..................................................................................... 20
3.3.2 Online Analytical Processing and Data Mining .................................................................. 20
3.3.3 Ad Hoc Query and Reporting ............................................................................................. 22
3.3.4 Production reporting ........................................................................................................... 23
3.3.4 Dashboards and scorecards ............................................................................................... 23
3.4 Issues particular to UWS ........................................................................................................ 24
3.5 New trends of particular interest to UWS ............................................................................. 25

Data Warehouse Environment 2 (COMP10002)
3.6 To Conclude ........................................................................................................................... 25
4.0 Appendix..................................................................................................................................... 26
Presentation Slide 1 ...................................................................................................................... 26
Presentation Slide 2 ...................................................................................................................... 27
Presentation Slide 3 ...................................................................................................................... 28
Presentation Slide 4 ...................................................................................................................... 29
Presentation Slide 5 ...................................................................................................................... 30
Presentation Slide 6 ...................................................................................................................... 31
Presentation Slide 7 ...................................................................................................................... 32
Presentation Slide 8 ...................................................................................................................... 33
Presentation Slide 9 ...................................................................................................................... 34
Presentation Slide 10 .................................................................................................................... 35
Figure 2.1 ...................................................................................................................................... 36
Figure 2.2 ...................................................................................................................................... 36
Figure 2.3 ...................................................................................................................................... 37
Figure 2.4 ...................................................................................................................................... 37
Figure 2.5 ...................................................................................................................................... 38
Figure 2.6 ...................................................................................................................................... 38
Figure 2.7 ...................................................................................................................................... 39
Figure 2.8 ...................................................................................................................................... 39
Figure 2.9 ...................................................................................................................................... 40
Figure 2.10 .................................................................................................................................... 40
Figure 2.11 .................................................................................................................................... 41
Figure 2.12 .................................................................................................................................... 41
Figure 3.1 ...................................................................................................................................... 42
Figure 3.2 ...................................................................................................................................... 42
Figure 3.3 ...................................................................................................................................... 43
5.0 References .................................................................................................................................. 44

Data Warehouse Environment 3 (COMP10002)
Chapter 1 – Setting the Scene
1.1 Introduction
This chapter aims to set the scene and introduce the role the University of West Scotland
(UWS) plays within Higher Education (HE) in Scotland. Core business processes will be investigated
and identified which help support the running of UWS. Key decision makers, their business
objectives and key performance indicators in UWS will be identified.
1.2 Overview of the HE Sector
According to Universities UK (UUK, 2012) there are 115 universities in the UK and 165 HE
institutions. Within these educational institutions, there are a total number of 2,493,415 students
enrolled on degree programmes. The UK HE sector is one of the most popular destinations for
international students, and the highest percentages of international student enrolments. UKCISA
(2012) states that a total of 428,225 international students are studying in the UK, which
constitutes 17 per cent of the UK HE sector.
The UK HE sector contributes a considerable amount to the British economy – analysis by
HEFCE 2012 (Higher Education Funding Council for England) shows that universities contributed
£3.3 billion to the economy in 2010-11 through the use of business services. However, this figure
is part of a much wider economic impact in the HE sector. A publication produced for Universities
UK (UUK, 2009) named ‘The impact of universities on the UK economy’ states that the HE sector
contributes at least £59 billion to the British economy and generates 2.3 per cent of UK GDP
(Baskerville, MacLeod and Saunders, 2011). As international students constitute 17 per cent of the
student population, the Institute for Public Policy Research (IPPR 2011) calculated that
international students bring almost £4.5 billion annually to the UK from institutional revenue and
off-campus expenditure.
With the financial and competitive pressures in the HE sector, universities within the UK have
taken a greater interest in Business Intelligence (BI). Economics is currently the most influential
reason to adopt BI; adopting BI systems could help universities save money in the long run and
also help assist with their financial information. However, the main focus of universities is it
students. With BI universities can discover ways to track students’ progression, identify issues and
intervene appropriately when necessary. With this aid, more students are likely to pass courses,
increasing the pass rates for universities. This in itself pays off – students researching universities
take notice of pass rates and course feedback – and are more likely to choose the higher rated
university. This drives competition within the HE sector, and universities without these types of BI
systems are not reaping the benefits offered (JISC, 2012).

Data Warehouse Environment 4 (COMP10002)
1.3 UWS in the HE Sector
UWS is fairly unique within the HE sector in Scotland. The university is split into four
campuses throughout Scotland: Paisley; the main campus, Dumfries, Hamilton and Ayr. On
August 2007, the University of Paisley merged with Bell College which was based in Hamilton and
is now the Hamilton campus for UWS (BBC, 2007). This puts UWS at a great advantage compared
to other universities in Scotland. Having four campuses spread throughout the West of Scotland
makes UWS more sustainable and the University better placed to face the challenges and the
competitive nature of the HE sector (BBC, 2007).
The student population in UWS differs greatly from other universities throughout Scotland.
Having four campuses allows UWS to capture a much larger student population compared to
Edinburgh, which can only capture a demographic local to the area. This allows UWS to provide
local access for more than 40% of the population, making it ideally placed to respond to
demographic challenges in the HE sector (BBC, 2007).
UWS also has strong relationship with higher education colleges in Central Scotland.
Students with HND’s (Higher National Diploma) are allowed to enter the third year of a UWS
course that best suits their needs. UWS has the highest proportion of entrance from college,
placing it in a unique situation compared with other Scottish universities especially regarding
student makeup and the use of BI. Allowing students from college to enter the third year skews
the student population and form of the university, and UWS is making efforts to reduce this trend.
To do this, they turn data gathered into intelligence. Management services use this BI to allow
them to determine what type of population they want, and how to maintain a balance that works
for the social mission of the university (Davidson, 2012).
UWS’ Social mission is to:
“Provide distinctive higher education through inspirational teaching and
learning. We'll respond to individual needs and those of the communities we serve to transform people,
communities and organisations, becoming a partner of choice across the West of Scotland, nationally and
internationally” (UWS, 2012)
UWS also has a larger female population compared to other universities in Scotland due
to the popularity of the School of Nursing. Since UWS have more mature students due to direct
entry of students, UWS has the largest numbers of students from deprived postcodes within
Scotland. In terms of funding, UWS receives 70% of its funding’s through public funding
compared to St Andrews which receives around 20%. (Davidson, 2012)
Data Warehouse Environment 5 (COMP10002)
1.4 UWS Business Processes
Like any business, UWS has systems in place to cater for thousands of employees. Systems
must be in place to manage finances, human resources, and employment, and UWS is no
different from other businesses. UWS employs systems to manage their finances, payrolls and
admissions. The following list demonstrates why UWS is comparable to any other business.
1.4.1 Admissions and Enrolment – For admission, UWS employs a system named Banner.
Banner allows UWS to capture data about the student and also enables business processes,
such as student admissions. Once the student has filled in their UCAS application and this is
received by UWS, data is entered into UWS’s Banner system by an admissions officer. Once
the data has been entered, a programme leader can enter the banner system through a web
browser and search for new applications. Information on the system includes students’ grades,
which allows the programme leader to judge whether or not they are suitable for the course.
Once the programme leader has made an offer to the student, a student can then enrol on a
certain date. UWS now uses an online enrolment system which allows student to enter
personal information and their choice of modules for their selected course without physically
being in a UWS campus. After the student has entered their personal details and module
choices, this information is sent to the banner system. Once this process is completed,
programme leaders can view their choices. Additionally, Banner provides vital information for
UWS. It allows staff, such as programme leaders; information about students so they can
understand who the students are, why they have enrolled, the courses applied to, how they
are performing, progression after university, and previous results attained. Using online
enrolment systems increases the probability of accurate information for BI purposes. (Caira,
2012)
1.4.2 Human Resources and Payroll – UWS has a human resources and payroll system. This
system enables a number of business processes within UWS. For example, it enables
workforce planning process to ensure UWS has suitable access to lecturers or other staff
members for departmental success. Additionally, it allows UWS to investigate student to staff
ratios of the individual campuses or the university as a whole. The payroll system in UWS
allows the university to carry out multiple payroll business processes. This system allows UWS
to manage salaries for each individual employee, and keep records of previous payrolls for
future reference. (Davidson, 2012).
1.4.3 Finance – For the finance system in UWS, the Agresso platform is used. This system
allows UWS to manage university finances. For example, it allows inspection of how much
income is brought into the university and how much money is spent. It also holds the costs of
each course within the university. (Davidson, 2012).
Data Warehouse Environment 6 (COMP10002)
1.5 Decision Makers, Business Objectives and KPI in UWS
Professor Seamus McDaid CBE (Principle and Vice Chancellor of UWS) - The UWS Principle
has multiple objectives. Goal setting involves setting goals on yearly basis to help motivate
programme leaders to recruit more students. The UWS Principle also wishes to establish and
maintain relationships with colleges and schools to coordinate education services, some of which
was discussed in section 1.3. Additionally, UWS would also like to improve university development.
The principal’s objective is to motivate staff to make the university accomplish their development
plan aims over a period of years. The Principal would also like to monitor the graduation rate as a
key performance indicator (KPI). The principal monitors the effectiveness of individual schools, or
investigates the graduation rate for each course within each school. Additionally, the principal also
like to monitor the admissions from established relations to check how many students enrol from
each of the schools or colleges that have established relations. Finally, Staff Development would be
a major KPI. This would involve the training of staff, and analysis and evaluation of the impact of
training.
Tom Caira (Programme Leader/Senior Lecturer) - A Programme Leader of UWS should have
multiple business objectives. For recruitment, the Programme Leader visits local schools, arranges
open days to recruit potential students and writes description of their programme for the UWS
prospectus. Another objective is the admission of students - once recruited, the students are
admitted to the course, and then enrolment takes place. Programme viability and success is also
important. Programme Leaders should aim to make the programme viable for students, and also
ensure that industry employs the students produced. Another objective would be programme
management. The Programme leader would manage program on day to day basis, and also look
into the future and change modules based on new technologies, and set personal annual goals to
successfully achieve personal objectives. KPI’s for a Programme Leader would involve the
monitoring of applications to determine how many students are interested in the course. Overall
programme numbers would also be monitored to view the number of students in each year from
when course started. Progression statistics would be monitored to establish the number of
students progressing from first to second year of the programme. The Programme leader could
also monitor graduate employment, which is possibly the most important KPI as it allows the
leader to monitor whether students are employable after the course has been completed. (Caira,
2012)
Dr Carolyn Begg (Lecturer) - A lecturer of UWS would base their decision making objectives
and KPIs on the individual models that they teach. A lecture would set a goal of a pass rate they
hope to achieve within their modules. Furthermore, the viability and success of the module would
also be an objective as the lecture must ensure that the material being used is still viable for
progression into employment. Another objective would be the admission of students within the
courses they teach. For KPIs, the lecture would monitor the pass rate of each individual module
they teach at the end of a semester. The lecture would also monitor the progression of students
who pass to see if they successfully achieve a degree. The lecturer would also monitor attendance
of the students throughout the modules which could be used to identify further issues.

Data Warehouse Environment 7 (COMP10002)
Chapter 2 – The Data Warehouse Environment
2.1 Purpose and Importance of BI
Business Intelligence Tools (BI Tools) are software programs which are specifically
designed for an end-user to query, retrieve, analyse and report data. They allow managers and
business analysts to monitor data stored in the data warehouse and make decisions based on
data trends and relationships (Chaudurt, Umesgwar, and Narasayya 2011). These tools have the
sole purpose of gathering all business knowledge stored in a Data Warehouse (DW) and allowing
end users to generate reports, query data and analyse data specific to their Key Performance
Indicators.
The purpose of BI is to allow end-users to answer a business question or fulfil a business
objective. Some end-users have a number of objectives that they wish to monitor or have data to
help answer, and this can be done with the aid of BI tools. Traditional methods of gathering data
took longer when compared to BI tools, which help instantly generate reports for end-users. This
reduces time to gather data and boosts productivity for the user.
Without BI Tools, the data stored in Data Warehouses is essentially useless. It is important
for businesses that have a data warehouse to own appropriate BI Tools for their business. Without
appropriate BI Tools, businesses would be unable to gain access to data, make decisions or
actions based on the data stored. Howson (2008) states that both IT personnel and business users
agree that the underlying architecture and data quality is an important technical aspect for a
business to successfully use BI. In the next section some of the underlying technologies will be
discussed. To store and access data, Business Intelligence architecture is a necessary component
for BI Tools to fulfil their purpose. There are a broad range of tools and technologies for
gathering, storing and analysing data. These technologies are required for the end user to access
the data available using the BI tool. Howson (2008) states that for BI tools to be fully utilised, ETL
(Extract, transform, and load) tools must be in place to prepare the data from Operational and
Source systems, such as external data systems and operational databases. The technologies and
products required to expose data from a data warehouse are detailed in the next section.
Data Warehouse Environment 8 (COMP10002)
2.2 Technologies and Products Used to Expose Data
In order for BI tools to ‘expose’ the data to the end user in the way they wish to view it, a
range of technologies in different layers of the data warehouse must be in place. As mentioned in
2.1, BI tools are software programs which are specifically designed for an end-user to query,
retrieve, analyse and report data. To view data in the data warehouse, products must also be
purchased for end-users to extract the data they need. There are a range of products available to
suit different end-user needs, and some examples are detailed in this section.
The following technologies are situated within different layers of the warehouse. With each
technology (apart from ETL), some examples of available products are given:
ETL (Extract, transform and load)
OLAP – Online Analytical Processing
Data Mining
Ad Hoc Query and Reporting
Production Reporting
Dashboards/Scorecards
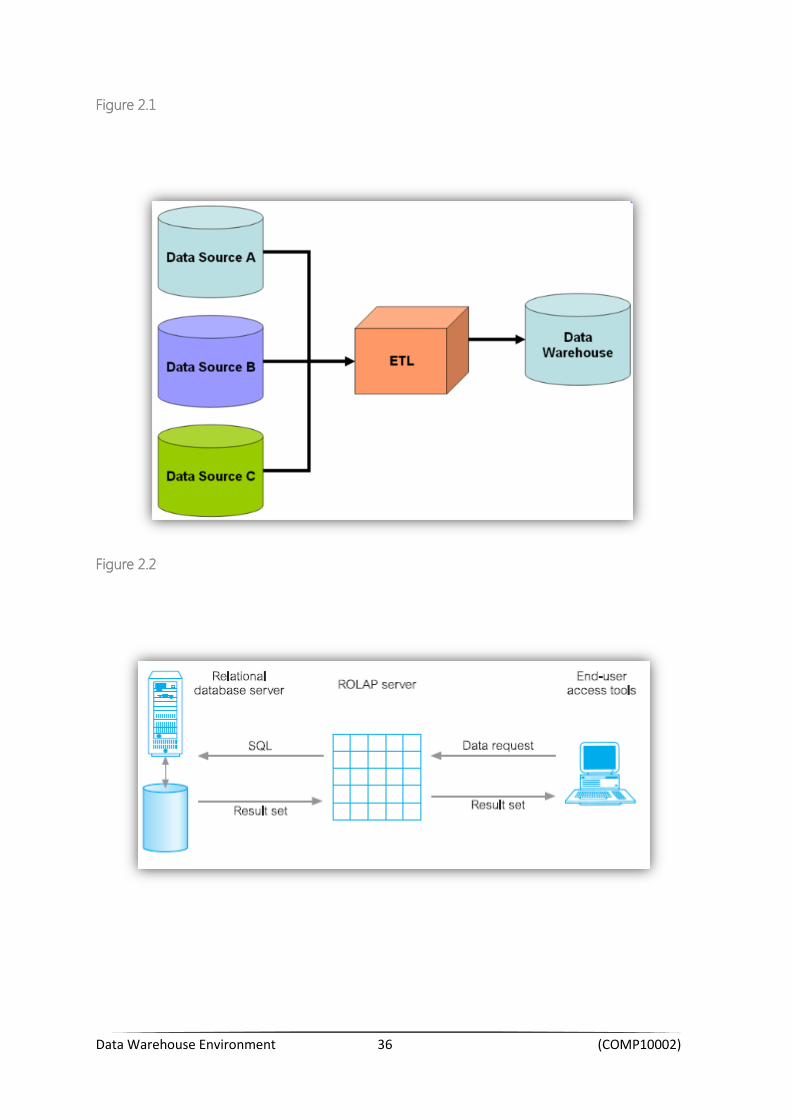
2.2.1 ETL (Extract, transform, load)
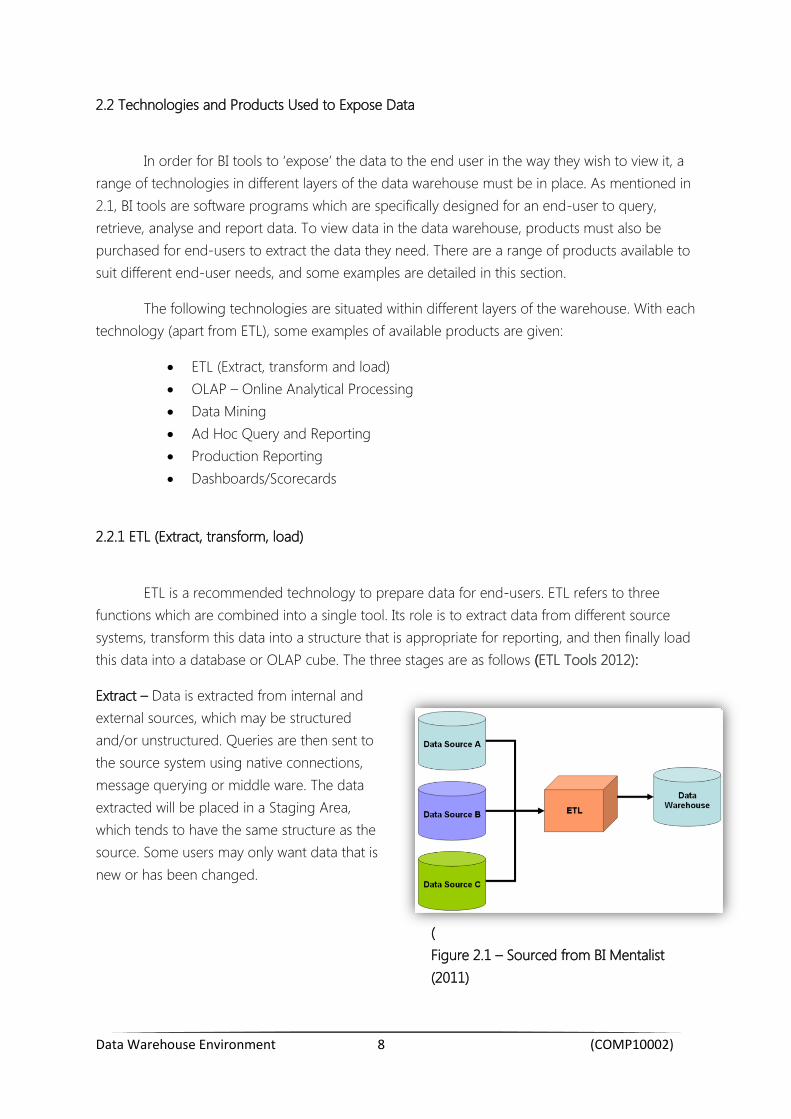
ETL is a recommended technology to prepare data for end-users. ETL refers to three
functions which are combined into a single tool. Its role is to extract data from different source
systems, transform this data into a structure that is appropriate for reporting, and then finally load
this data into a database or OLAP cube. The three stages are as follows (ETL Tools 2012):
Extract – Data is extracted from internal and
external sources, which may be structured
and/or unstructured. Queries are then sent to
the source system using native connections,
message querying or middle ware. The data
extracted will be placed in a Staging Area,
which tends to have the same structure as the
source. Some users may only want data that is
new or has been changed.
(
Figure 2.1 – Sourced from BI Mentalist
(2011)
Data Warehouse Environment 9 (COMP10002)
Transform – Once data is in the Staging Area, the data is available on one platform and on one
database, which allows join and unison tables, filter and sort data using specific attributes and also
pivots to another structure. This step in the process checks data quality and cleans if necessary.
Once data is prepared, slowly changing dimensions can be implemented. This allows keeping
track of reports and analysis when attributes change over time.
Load – Data is loaded into the warehouse and dimension tables. Data can be combined,
aggregated and loaded into OLAP cubes. Once data is loaded querying and reporting is allowed.
For BI tasks to perform, data comes from multiple sources – typically from multiple
operational databases across different departments. However, multiple data sources may contain
data with varying degrees of quality, and often are inconsistent in representing the data at hand.
This causes issues with integrating and standardising data in preparation for completing BI tasks,
which can be rather challenging. To solve this issue, data must be reconciled for efficient data
load, which is imperative for BI (Chaudurt, Umesgwar, and Narasayya 2011). Without ETL, the data
from multiple sources could potentially be inaccurate. ETL is an essential process to ensure that
end-users using BI Tools have clean and accurate data.
2.2.2 OLAP – Online Analytical Processing
OLAP is computer processing which enables users to selectively extract and view data with
ease from a myriad of viewpoints (Rouse 2007). OLAP also allows interactive analysis through the
use of multidimensional structures which store the data and relationships, also known as an OLAP
Cube. Each side of an OLAP Cube is considered a different dimension with different levels of detail
(Howson, 2008) (Stewart, 2008). The OLAP Cube allows end users to transform raw data into
strategic information which could potentially help businesses decisions and operations through
the use of an OLAP Viewer. OLAP can be defined in terms of functional characteristics expressed
by the FASMI acronym – Fast Analysis of Shared Multidimensional Information (Pendse, 2008).
Fast – the system created is to deliver responses to the user within 5 seconds, and routine analysis
should take no more than 1 second. More complex analyses should take no more than 20
seconds. Studies have suggested users can become impatient if data is not delivered within 30
seconds; even if they understand the complexity of the analysis. OLAP Systems must be fast in
order to facilitate users’ needs.
Analysis – This means that the system can cope with demands relevant to the application and
user. Users should also be able to conduct analysis without the help of IT technicians. Ad-hoc
analysis is a requirement for OLAP analysis.
Shared – The system must implement security to ensure confidentiality of the data stored. The
data within the warehouse must also be consistently maintained, and any changes made must
automatically be incorporated into the warehouse.

Data Warehouse Environment 10 (COMP10002)
Multidimensional – This is the most important characteristic for OLAP. The system must facilitate
conceptual viewing of the data on any of the specified dimensions, and the system must support
these specifications.
Information – Information refers to quick and easy access to all the data within the warehouse.
The accuracy and relevance of the information in the decision support role is the most important
measure. Users must receive their queries from the OLAP system in a useful form.
OLAP has a number of platforms used to store data to allow for multidimensional analysis,
which greatly affects what and how users can analyse. Each of these architectures has individual
trade-offs in terms of performance, calculations, the amount of data that can be analysed and the
timeliness of data updates (Howson, 2008). There are four primary architectures in OLAP
(Connolly and Begg, 2005) (Stewart, 2008):
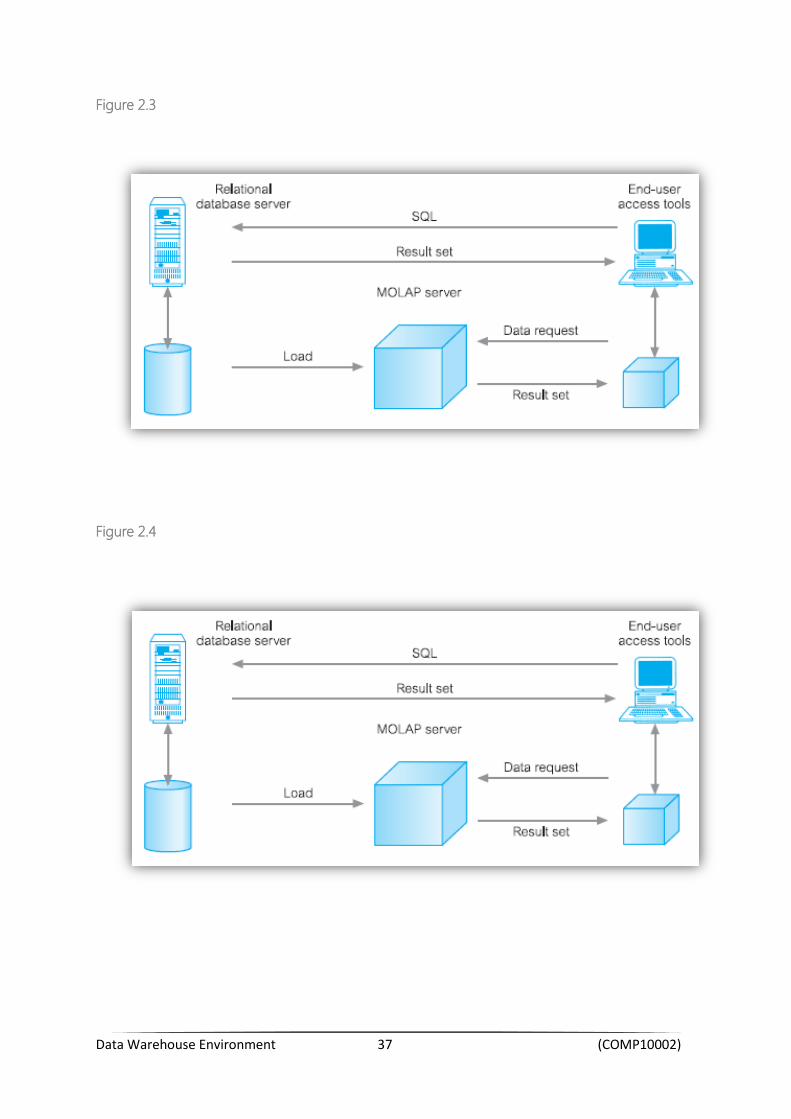
ROLAP (Relational OLAP) – All calculations are
done in relational databases, which causes
large databases to have slow response times
when queried. All calculations within ROLAP
are pre-generated when the ROLAP cube is
populated with data.
(Figure 2.2 – ROLAP. Sourced from Connolly and Begg, 2005)
(Figure x – ROLAP)
MOLAP (Multi-dimensional OLAP) – Uses
specialised structures and multi-
dimensional systems which allow the
organisation, navigation, and analysis of
data. To enhance query performance, it is
aggregated and stored according to
predicted usage.
(Figure 2.3 – MOLAP. Sourced from
Connolly and Begg, 2005)
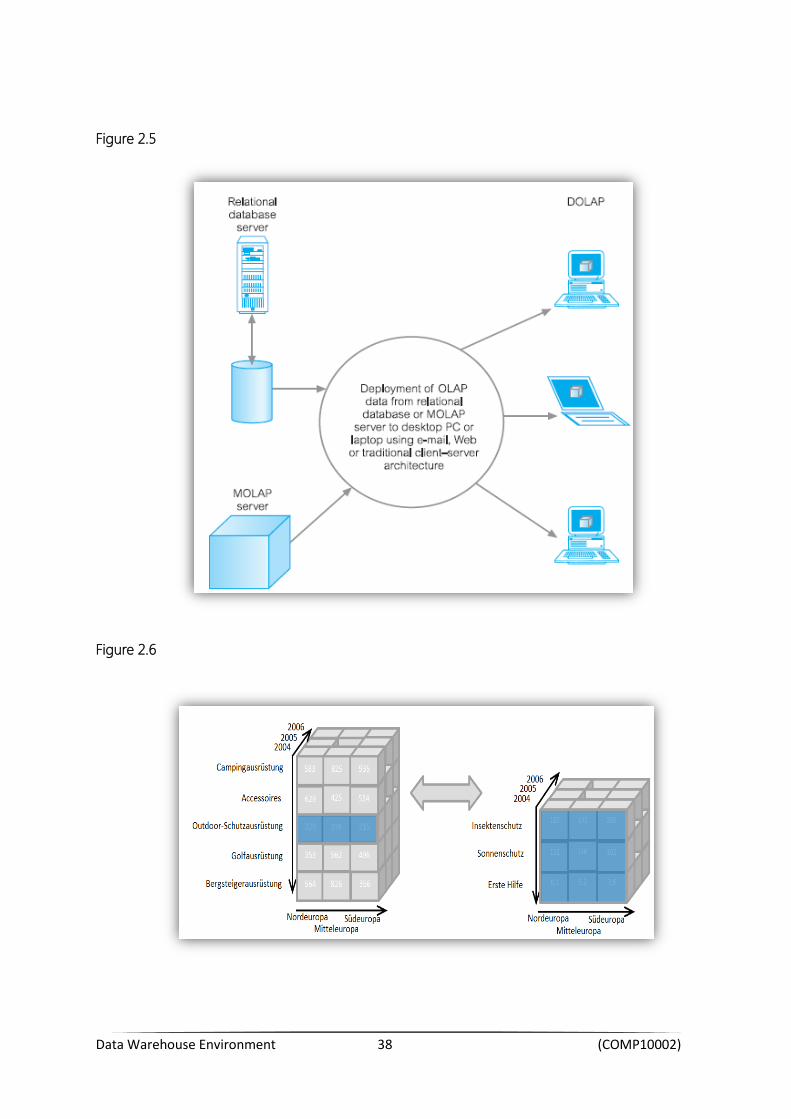
HOLAP (Hybrid OLAP) – Hybrid OLAP
combines ROLAP and MOLAP. HOLAP
delivers data selected from a DBMS or
MOLAP server to desktop as an OLAP
cube. The OLAP cube is stored locally,
where it can be analysed and maintained
(Figure 2.4 – HOLAP. Sourced from Connolly and Begg, 2005)
Data Warehouse Environment 11 (COMP10002)
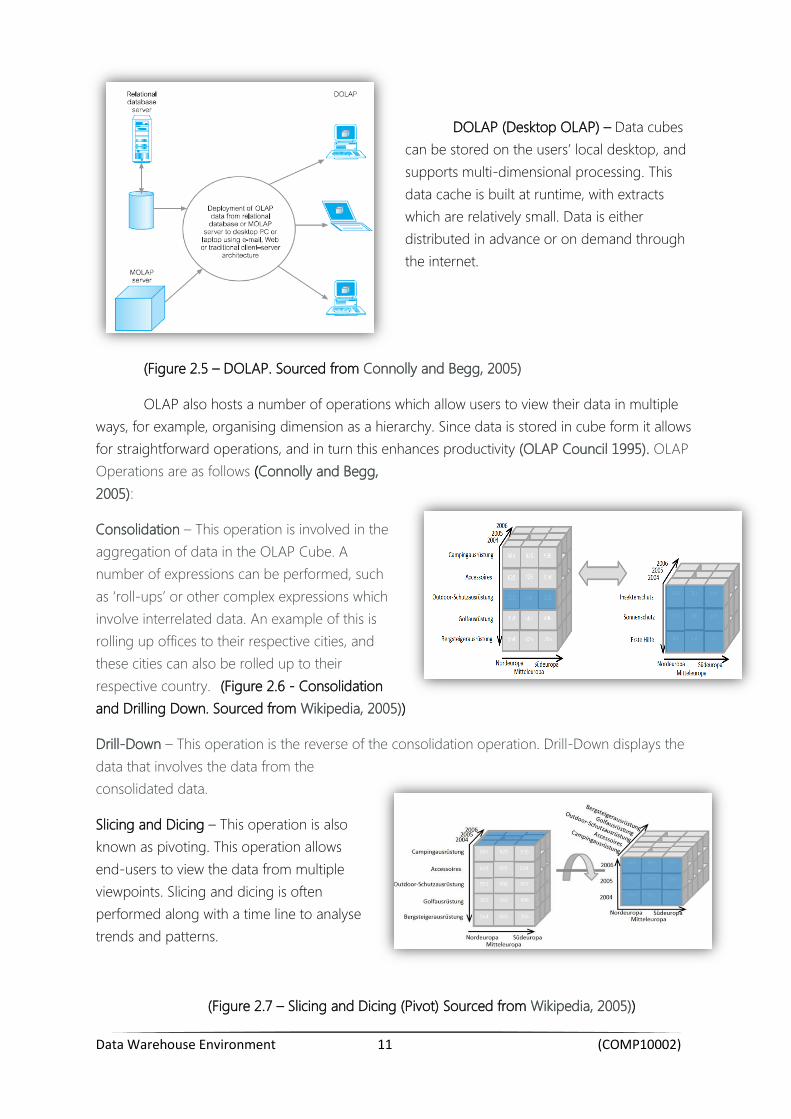
DOLAP (Desktop OLAP) – Data cubes
can be stored on the users’ local desktop, and
supports multi-dimensional processing. This
data cache is built at runtime, with extracts
which are relatively small. Data is either
distributed in advance or on demand through
the internet.
(Figure 2.5 – DOLAP. Sourced from Connolly and Begg, 2005)
OLAP also hosts a number of operations which allow users to view their data in multiple
ways, for example, organising dimension as a hierarchy. Since data is stored in cube form it allows
for straightforward operations, and in turn this enhances productivity (OLAP Council 1995). OLAP
Operations are as follows (Connolly and Begg,
2005):
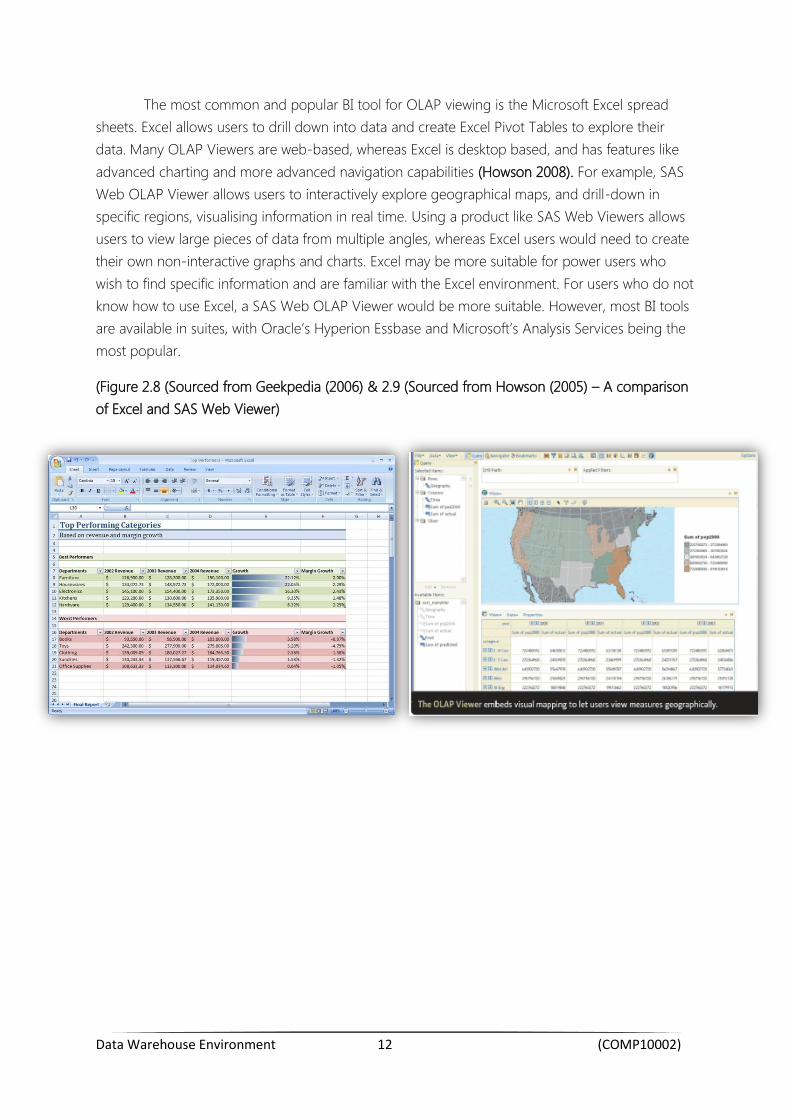
Consolidation – This operation is involved in the
aggregation of data in the OLAP Cube. A
number of expressions can be performed, such
as ‘roll-ups’ or other complex expressions which
involve interrelated data. An example of this is
rolling up offices to their respective cities, and
these cities can also be rolled up to their
respective country. (Figure 2.6 - Consolidation
and Drilling Down. Sourced from Wikipedia, 2005))
Drill-Down – This operation is the reverse of the consolidation operation. Drill-Down displays the
data that involves the data from the
consolidated data.
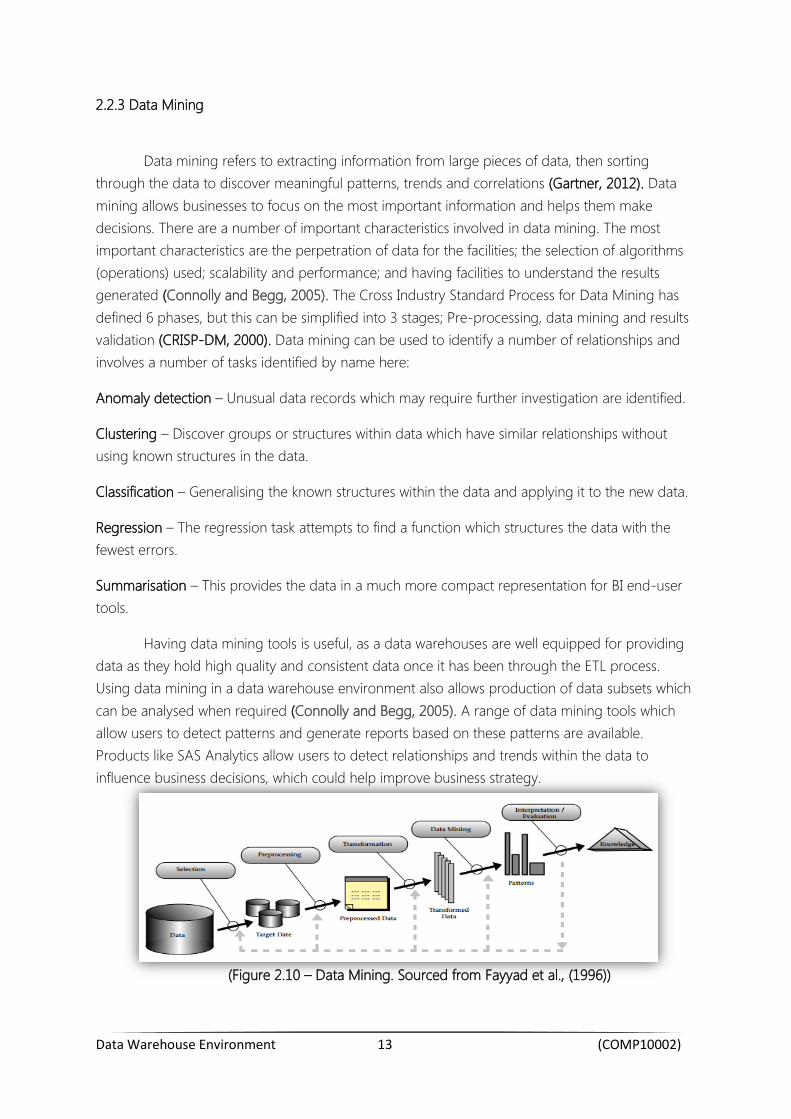
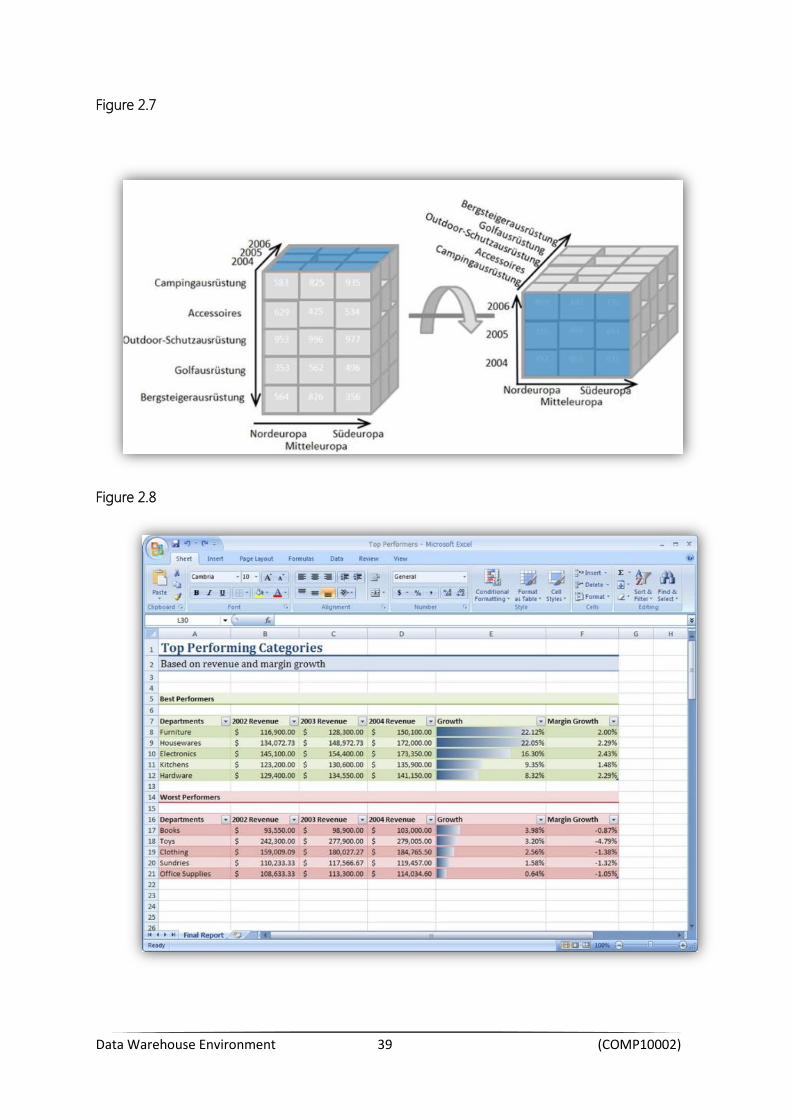
Slicing and Dicing – This operation is also
known as pivoting. This operation allows
end-users to view the data from multiple
viewpoints. Slicing and dicing is often
performed along with a time line to analyse
trends and patterns.
(Figure 2.7 – Slicing and Dicing (Pivot) Sourced from Wikipedia, 2005))
Data Warehouse Environment 12 (COMP10002)
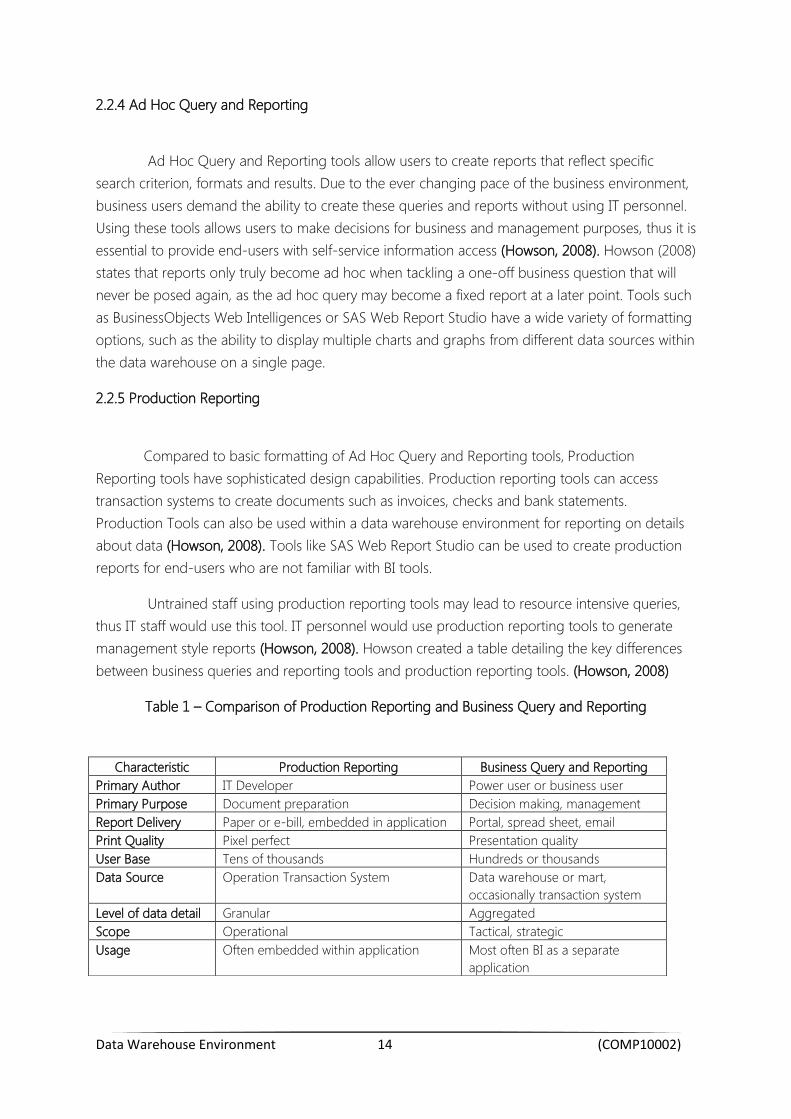
The most common and popular BI tool for OLAP viewing is the Microsoft Excel spread
sheets. Excel allows users to drill down into data and create Excel Pivot Tables to explore their
data. Many OLAP Viewers are web-based, whereas Excel is desktop based, and has features like
advanced charting and more advanced navigation capabilities (Howson 2008). For example, SAS
Web OLAP Viewer allows users to interactively explore geographical maps, and drill-down in
specific regions, visualising information in real time. Using a product like SAS Web Viewers allows
users to view large pieces of data from multiple angles, whereas Excel users would need to create
their own non-interactive graphs and charts. Excel may be more suitable for power users who
wish to find specific information and are familiar with the Excel environment. For users who do not
know how to use Excel, a SAS Web OLAP Viewer would be more suitable. However, most BI tools
are available in suites, with Oracle’s Hyperion Essbase and Microsoft’s Analysis Services being the
most popular.
(Figure 2.8 (Sourced from Geekpedia (2006) & 2.9 (Sourced from Howson (2005) – A comparison
of Excel and SAS Web Viewer)
Data Warehouse Environment 13 (COMP10002)
2.2.3 Data Mining
Data mining refers to extracting information from large pieces of data, then sorting
through the data to discover meaningful patterns, trends and correlations (Gartner, 2012). Data
mining allows businesses to focus on the most important information and helps them make
decisions. There are a number of important characteristics involved in data mining. The most
important characteristics are the perpetration of data for the facilities; the selection of algorithms
(operations) used; scalability and performance; and having facilities to understand the results
generated (Connolly and Begg, 2005). The Cross Industry Standard Process for Data Mining has
defined 6 phases, but this can be simplified into 3 stages; Pre-processing, data mining and results
validation (CRISP-DM, 2000). Data mining can be used to identify a number of relationships and
involves a number of tasks identified by name here:
Anomaly detection – Unusual data records which may require further investigation are identified.
Clustering – Discover groups or structures within data which have similar relationships without
using known structures in the data.
Classification – Generalising the known structures within the data and applying it to the new data.
Regression – The regression task attempts to find a function which structures the data with the
fewest errors.
Summarisation – This provides the data in a much more compact representation for BI end-user
tools.
Having data mining tools is useful, as a data warehouses are well equipped for providing
data as they hold high quality and consistent data once it has been through the ETL process.
Using data mining in a data warehouse environment also allows production of data subsets which
can be analysed when required (Connolly and Begg, 2005). A range of data mining tools which
allow users to detect patterns and generate reports based on these patterns are available.
Products like SAS Analytics allow users to detect relationships and trends within the data to
influence business decisions, which could help improve business strategy.
(Figure 2.10 – Data Mining. Sourced from Fayyad et al., (1996))
Data Warehouse Environment 14 (COMP10002)
2.2.4 Ad Hoc Query and Reporting
Ad Hoc Query and Reporting tools allow users to create reports that reflect specific
search criterion, formats and results. Due to the ever changing pace of the business environment,
business users demand the ability to create these queries and reports without using IT personnel.
Using these tools allows users to make decisions for business and management purposes, thus it is
essential to provide end-users with self-service information access (Howson, 2008). Howson (2008)
states that reports only truly become ad hoc when tackling a one-off business question that will
never be posed again, as the ad hoc query may become a fixed report at a later point. Tools such
as BusinessObjects Web Intelligences or SAS Web Report Studio have a wide variety of formatting
options, such as the ability to display multiple charts and graphs from different data sources within
the data warehouse on a single page.
2.2.5 Production Reporting
Compared to basic formatting of Ad Hoc Query and Reporting tools, Production
Reporting tools have sophisticated design capabilities. Production reporting tools can access
transaction systems to create documents such as invoices, checks and bank statements.
Production Tools can also be used within a data warehouse environment for reporting on details
about data (Howson, 2008). Tools like SAS Web Report Studio can be used to create production
reports for end-users who are not familiar with BI tools.
Untrained staff using production reporting tools may lead to resource intensive queries,
thus IT staff would use this tool. IT personnel would use production reporting tools to generate
management style reports (Howson, 2008). Howson created a table detailing the key differences
between business queries and reporting tools and production reporting tools. (Howson, 2008)
Table 1 – Comparison of Production Reporting and Business Query and Reporting
Characteristic Production Reporting Business Query and Reporting
Primary Author IT Developer Power user or business user
Primary Purpose Document preparation Decision making, management
Report Delivery Paper or e-bill, embedded in application Portal, spread sheet, email
Print Quality Pixel perfect Presentation quality
User Base Tens of thousands Hundreds or thousands
Data Source Operation Transaction System Data warehouse or mart,
occasionally transaction system
Level of data detail Granular Aggregated
Scope Operational Tactical, strategic
Usage Often embedded within application Most often BI as a separate
application
Data Warehouse Environment 15 (COMP10002)
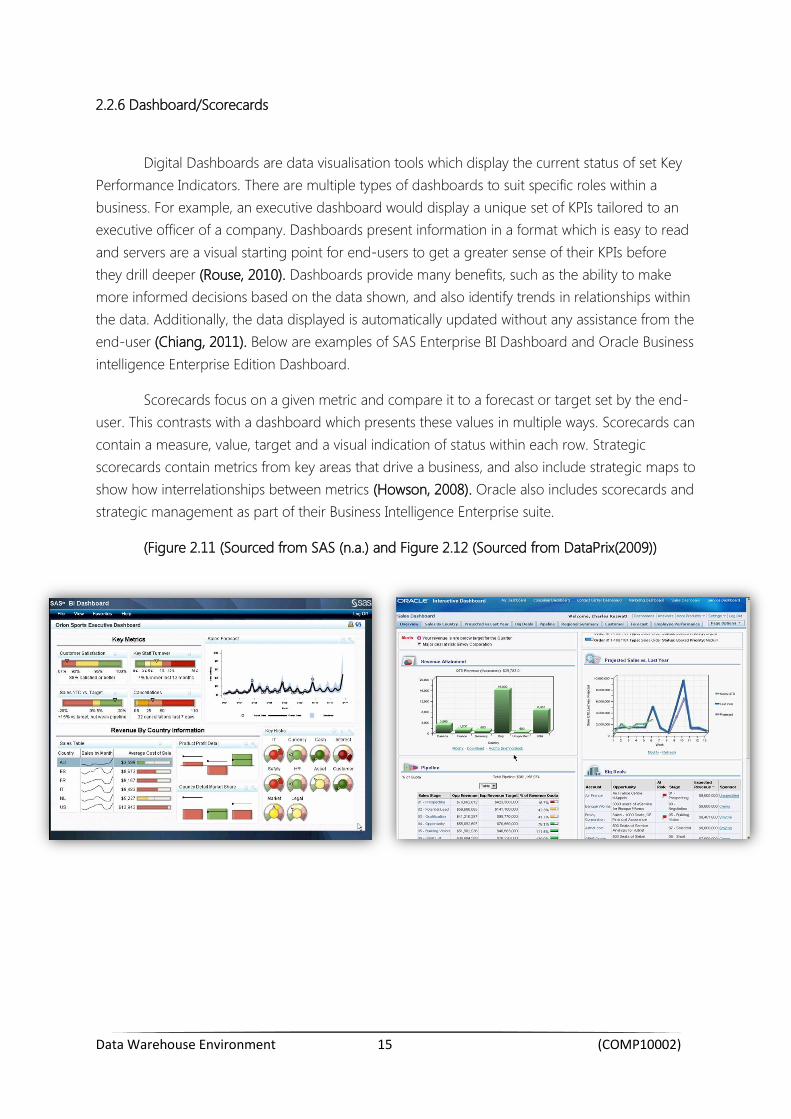
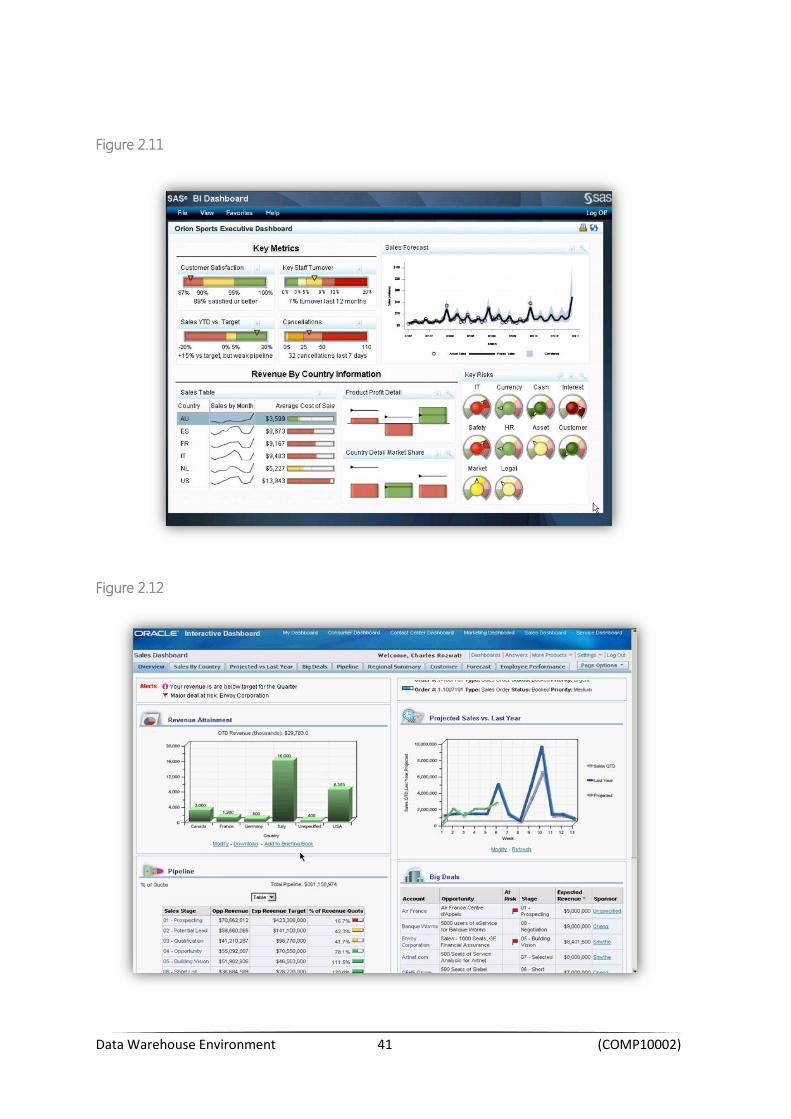
2.2.6 Dashboard/Scorecards
Digital Dashboards are data visualisation tools which display the current status of set Key
Performance Indicators. There are multiple types of dashboards to suit specific roles within a
business. For example, an executive dashboard would display a unique set of KPIs tailored to an
executive officer of a company. Dashboards present information in a format which is easy to read
and servers are a visual starting point for end-users to get a greater sense of their KPIs before
they drill deeper (Rouse, 2010). Dashboards provide many benefits, such as the ability to make
more informed decisions based on the data shown, and also identify trends in relationships within
the data. Additionally, the data displayed is automatically updated without any assistance from the
end-user (Chiang, 2011). Below are examples of SAS Enterprise BI Dashboard and Oracle Business
intelligence Enterprise Edition Dashboard.
Scorecards focus on a given metric and compare it to a forecast or target set by the end-
user. This contrasts with a dashboard which presents these values in multiple ways. Scorecards can
contain a measure, value, target and a visual indication of status within each row. Strategic
scorecards contain metrics from key areas that drive a business, and also include strategic maps to
show how interrelationships between metrics (Howson, 2008). Oracle also includes scorecards and
strategic management as part of their Business Intelligence Enterprise suite.
(Figure 2.11 (Sourced from SAS (n.a.) and Figure 2.12 (Sourced from DataPrix(2009))
Data Warehouse Environment 16 (COMP10002)
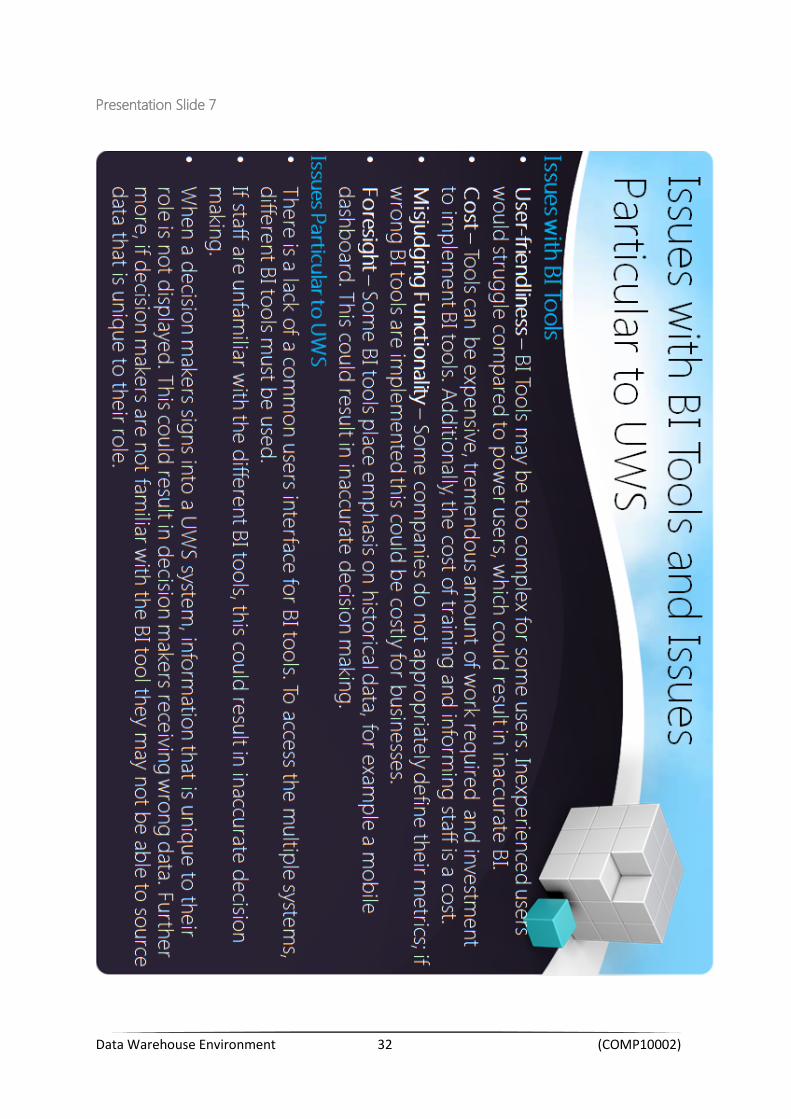
2.3 Issues with BI tools
User-friendliness – One of the main issues with BI tools is user friendliness, or ease of use.
Some BI tools may be too complex for the majority of business users who wish to analyse their
data. End users who have limited experience with BI tools could struggle to use the software. End-
users with this limited experience need BI tools which can prompt or guide them through basic
tasks, as well as a customisable interface. If an end-user with limited BI experience were to use
Microsoft Excel, they would struggle when compared with a power user who wishes to have a
sophisticated set of BI tools to give them the flexibility to analyse data the way they want to
(Horwitt, 2010).
Cost – Implementing BI tools within businesses can be very expensive. To implement these
tools requires a tremendous amount of work and investment before the tools provide their value.
Additionally, once the BI tools have been implemented in the system, the cost of training and
informing staff must also be accounted for. However, many companies such as IBM, Microsoft and
Oracle offer lower level entry products for businesses with smaller budgets (Horwitt, 2010).
Misjudging functionality – An additionally issue isn’t necessarily the tool, but the user.
Implementing BI tools into a business requires a lot of domain expertise. It is important for
companies to appropriately define the metrics they need, where to get the data and how to
present it. If the wrong BI tool is implemented, time and money is wasted, which can be costly for
a business. Additionally, BI tools tend to have a hard-coded architecture which leaves no room to
adapt the software for different environments (Preston, 2012).
Foresight – Some BI tools place a lot of emphasis on old data, known as historical data.
For example, if a user is using a mobile dashboard it could display out-of-date sales figures for
their products. This out-of-date data could potentially cause issues, especially for mobile users
who use mobile BI products. Additionally, query and reporting tools generate reports which are
then turned into hard copies for employees. This hard copy displays data which may have
changed since the hard copy was created (Preston, 2012).
Data Warehouse Environment 17 (COMP10002)
2.4 New trends
With the rise of popularity in Cloud Computing and mobile devices, it is no surprise this
trend would also apply to BI. According to a survey by BI Leadership, over a third of organisations
use a BI tool situated in the Cloud. Also, 65% of organisations have plans to increase their usage
of BI Cloud tools in the next year (Klipfolio, 2012). This may be due to the advantages offered by
using cloud based BI tools. Firstly, deploying a tool in the Cloud is relatively simple and
convenient. The tools are also easier to scale, providing access to KPI no matter what devices is
used (Klipfolio, 2012).
The Cloud and mobile devices are obviously a natural fit, and research suggests that by
2013 one third of all BI tools will be on mobile devices (Klipfolio, 2012). It may be changing
workplace dynamics that is fuelling mobile BI adoption, as mobile BI tools give end-users the
ability to manage their decision making and KPI monitoring effectively at any location. Businesses
have obviously noticed the potential, and a survey found over 30% of the correspondents had
plans to deploy a mobile BI tool for their business (Klipfolio, 2012).
Another trend is big data. With user-generated data from sites such as YouTube, and
social networking sites like Twitter, data is constantly changing and businesses must adopt new
technologies to help reduce the time, effort and cost of integrating this data within a warehouse.
Once the data is integrated, businesses can analyse this data created by users to develop trends
or relationships (Sonderegger, 2012).
Open source tools are another growing trend. Businesses are accepting services like SaaS
and open source software, and adoption of open source tools has grown. Some open-source
tools provide services such as reporting, scorecards and dashboards, adding pressure to large
business such as IBM or Microsoft who provide the same type of software for a higher price
(Sonderegger 2012).
Predictive analytics allows businesses to foresee and prepare for future events. With
predictive analytics, businesses can generate forecasts, real time monitoring on what-if scenarios,
and report and analyse data on a regular basis. Additionally, it helps analyse trends within
operations and allows them to build financial models and accurate forecasts which in turn can
help product planning and buying predictions (Preston, 2011).

Data Warehouse Environment 18 (COMP10002)
Chapter 3 – The Data Warehouse Environment for UWS
3.1 Introduction
The Director of Planning and MIS at UWS wishes to create a data warehouse for the
university. Currently, the systems within UWS work separately and do not connect with each other.
The Director of Planning and MIS wishes to change this by creating a data warehouse so end-
users can access the data without having to use multiple interfaces to interact with each data
source. This report will focus on the technologies required for the front end of the UWS data
warehouse – the BI tools. This report will identify appropriate technologies and products for UWS
to make full use of BI tools, issues that are particular to UWS and new trends which may interest
UWS. The some of the technologies suggested exist within different layers of the data warehouse;
however these technologies are important for UWS to successfully achieve BI through the use of
BI tools.
To provide the necessary details a single UWS business process has been chosen - The
Admissions and Enrolment process, along with a UWS Decision Maker – a Programme Leader. To
provide further details, business objectives and KPIs will be used to illustrate the purpose and
importance of BI.
3.2 Purpose and importance of BI for UWS
UWS does not currently have appropriate technologies to successfully achieve BI. They
have a number of systems which are not connected and do not have common interfaces, which
makes it difficult for a programme leader to make decisions. UWS aims to successfully achieve BI
to allow a programme leader (and other end-users) to successfully answer a business question or
fulfil a business objective through the use of BI tools. A programme leader has a number of
business objectives that they wish to answer or need aid to answer, and this can be achieved with
BI tools by decision maker like a programme leader. For example, a programme leader of UWS
may wish to find information about student admission. The programme leader can use BI tools to
retrieve data about a specific student which could be used to aid a business objective and
decision, like admitting a student to a course. Typically, this type of information is stored on the
source system (in this case, Banner) and data can be analysed with technologies within the data
warehouse like OLAP. Additionally, the program leader can use data to fulfil their Programme
Viability and Success business objectives. The programme leader can review this data and use KPI
to judge whether modules within their programme are successful. Additional KPIs include overall
programme numbers or progression statistics. With BI, programme leaders can review data and
make decisions based on the data produced, essentially fulfilling the purpose of BI.
Data Warehouse Environment 19 (COMP10002)
It is important for UWS to successfully achieve BI for a number of reasons. Traditional data
gathering methods involved manual compiling, analysing and writing reports by users. With BI
and BI tools, a programme leader can pull data from the warehouse and almost instantly create
reports. Examples are a report of how many students have applied for the course or a report of
the overall course numbers. As BI allows the reporting of historical data, overall course numbers
from the current year can be compared with previous years. This process is important for a
programme leader of UWS as it boosts productivity. If the programme leader compiled this data
manually, it would potentially be very time consuming. Using BI tools frees time and resources,
allowing the programme leader to be more productive on other business objectives. BI is also
important for UWS as it allows access to better information, which can potentially be used to
increase its competitiveness within the HE sector. For example, for the Programme Viability and
Success business objective, having access to data is important. The Programme Leader can
evaluate this data and ensure the programme that he or she runs is viable within the specific
industry (e.g. computing). Access to this data allows UWS to be competitive and adjust
programmes based on industry feedback. KPIs from BI also allow for better decision making. BI
allows a programme leader to monitor past and present performance, such as applications,
overall programme number, progression statistics and graduate employment. Furthermore, BI
tools allow a programme leader to keep track of goals that they have set – essentially helping the
programme leader to achieve their aims
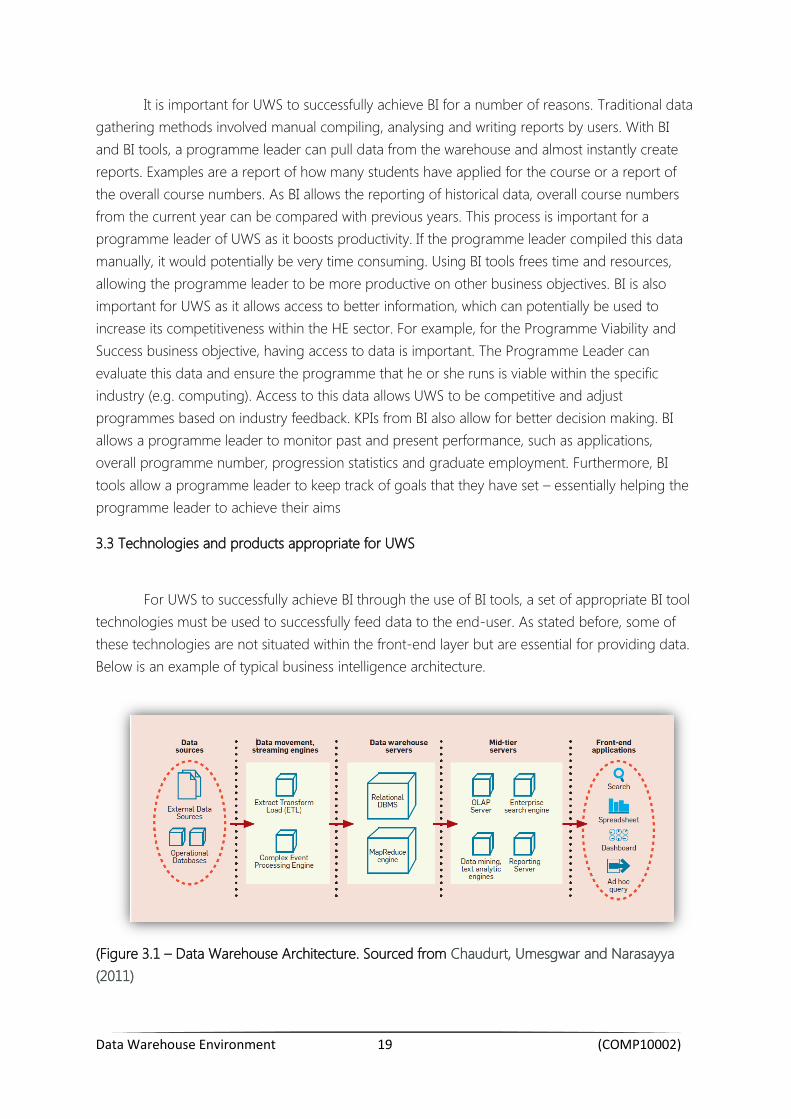
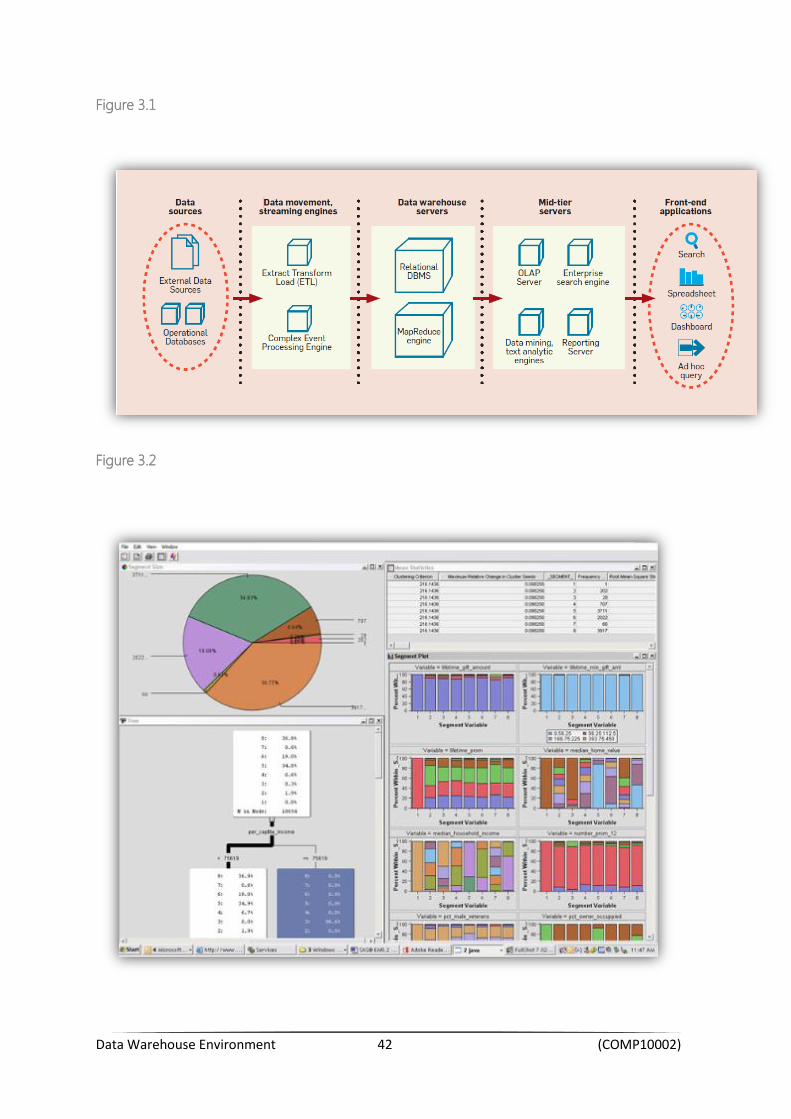
3.3 Technologies and products appropriate for UWS
For UWS to successfully achieve BI through the use of BI tools, a set of appropriate BI tool
technologies must be used to successfully feed data to the end-user. As stated before, some of
these technologies are not situated within the front-end layer but are essential for providing data.
Below is an example of typical business intelligence architecture.
(Figure 3.1 – Data Warehouse Architecture. Sourced from Chaudurt, Umesgwar and Narasayya
(2011)
Data Warehouse Environment 20 (COMP10002)
This section will detail technologies and products appropriate for the UWS data warehouse
environment.
3.3.1 ETL – Extract, Transform and Load
Even though a Programme Leader or a Principle of UWS would never interact with the ETL
process, it is still an essential technology for a data warehouse. End-users want clean and accurate
data to allow business decisions for their business objectives. Without ETL, the data may be
inaccurate and inconsistent, making it harder for end-users to make decisions, and potentially
wasting more time for the decision maker. ETL is an essential process as the data goes through a
data quality check to ensure the data is accurate and clean. Additionally, slowly changing
dimensions are implemented by ETL. This is crucial as it allows end users to track reports they
have created, and also allows analysis of attributes when they are changed, for example though a
dashboard or scorecard. Data from the UWS source systems can be combined, aggregated and
loaded into OLAP cubes.
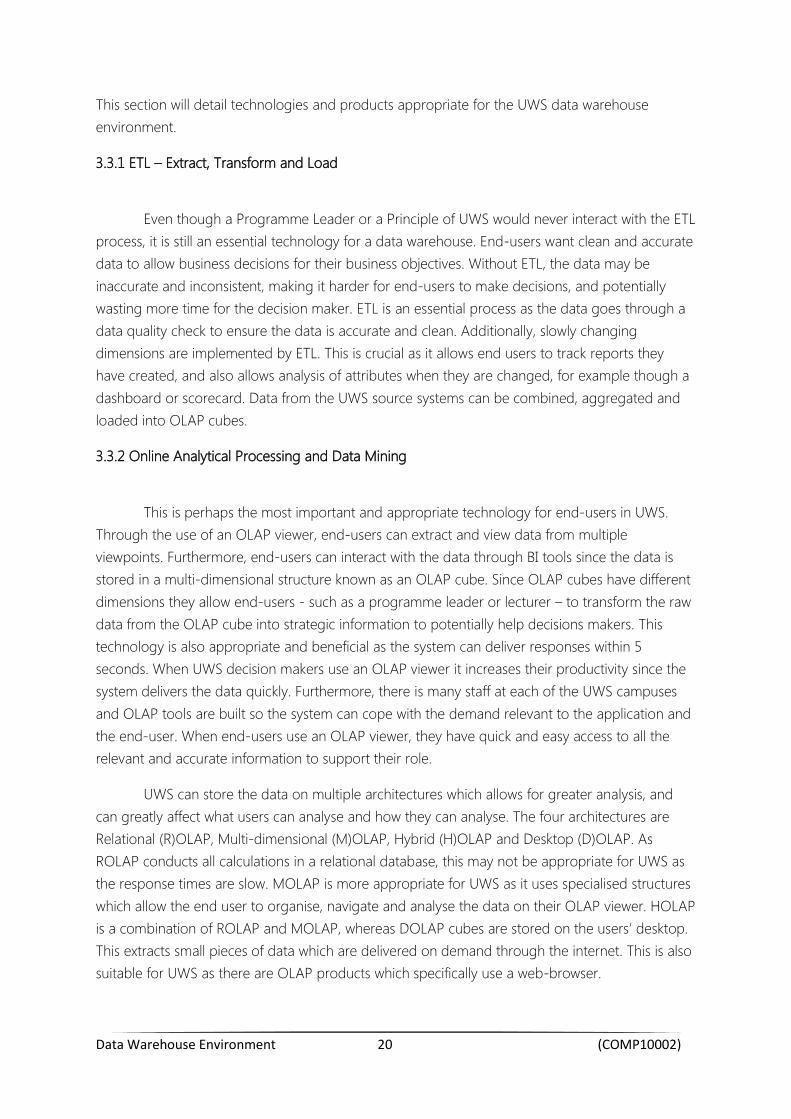
3.3.2 Online Analytical Processing and Data Mining
This is perhaps the most important and appropriate technology for end-users in UWS.
Through the use of an OLAP viewer, end-users can extract and view data from multiple
viewpoints. Furthermore, end-users can interact with the data through BI tools since the data is
stored in a multi-dimensional structure known as an OLAP cube. Since OLAP cubes have different
dimensions they allow end-users - such as a programme leader or lecturer – to transform the raw
data from the OLAP cube into strategic information to potentially help decisions makers. This
technology is also appropriate and beneficial as the system can deliver responses within 5
seconds. When UWS decision makers use an OLAP viewer it increases their productivity since the
system delivers the data quickly. Furthermore, there is many staff at each of the UWS campuses
and OLAP tools are built so the system can cope with the demand relevant to the application and
the end-user. When end-users use an OLAP viewer, they have quick and easy access to all the
relevant and accurate information to support their role.
UWS can store the data on multiple architectures which allows for greater analysis, and
can greatly affect what users can analyse and how they can analyse. The four architectures are
Relational (R)OLAP, Multi-dimensional (M)OLAP, Hybrid (H)OLAP and Desktop (D)OLAP. As
ROLAP conducts all calculations in a relational database, this may not be appropriate for UWS as
the response times are slow. MOLAP is more appropriate for UWS as it uses specialised structures
which allow the end user to organise, navigate and analyse the data on their OLAP viewer. HOLAP
is a combination of ROLAP and MOLAP, whereas DOLAP cubes are stored on the users’ desktop.
This extracts small pieces of data which are delivered on demand through the internet. This is also
suitable for UWS as there are OLAP products which specifically use a web-browser.
Data Warehouse Environment 21 (COMP10002)
OLAP tools let end-users view their data in multiple ways, and typically OLAP operations
provide this function in OLAP Viewers. With the consolidation operation, end-users have the
ability to perform multiple expressions, such as ‘roll-up’ and ‘drill-down’. This functionality would
benefit UWS as it would allow end-users to view different levels of detail. For example, a
programme leader could drill-down into information about a student and display their grades.
They could also roll-up the data by viewing information about their campus, and roll-up further
TO where the student lives. The ‘Slicing and Dicing’ operation would also benefit UWS end-users,
as OLAP tools would allow the end-user to ‘pivot’ the data to view it from different angles. It also
allows end-users to analyse trends and patterns within the data. This is beneficial for UWS as it
allows end-users such as programme leaders to identify patterns in results or progression in each
individual.
An additional suitable technology for UWS is data mining, which refers to extracting
information from large pieces of data, then sorting through the data to discover meaningful
patterns, trends and correlations. Using data mining tools would allow UWS to focus on
information important for a decision maker to make their decisions. For UWS, it may be beneficial
to integrate OLAP and Data Mining capabilities into the server instead of having separate systems.
These can complement each other in multiple ways, for example an OLAP tool could pinpoint
problems with pass rates in a certain module. Using data mining, programme leaders could then
gain insight on the behaviour of individual students and identify patterns within the module.
There are a range of products available for OLAP and data mining tools, but for the sake
of standardisation the recommended products are from the same organisation – SAS.
Furthermore, each product recommended is web based. This is beneficial for UWS since the
software does not need to be installed on multiple computers. SAS Web OLAP Viewer enables
decision makers to view different perspectives of multi-dimensional data through web applications
accessed through a standard web browser. No software needs to be installed. Decision makers
can swap between different presentations of data, for example a bar graph or a table. Decision
makers can also expand the data to compare current and historical data, and track patterns within
the data. Decision makers can also use conditional highlighting to specify if they want figures that
meet certain criteria to stand out, quickly drawing the eye to important information. An example
of this would be monitoring the attendance rates of each class. Decision makers can also focus
their analysis by ‘drilling down’ to another view for more detailed information about specific
classes or students. Filtering features are available for end-users to focus on the most relevant
data for their needs. Furthermore, decision makers can add their own columns and make their
own calculations to help make business decisions. Because the SAS OLAP Viewer is browser
based, decision makers can share data with other decision makers. One feature also allows
decision makers to export data if they wish to use Excel to drill down further.
Data Warehouse Environment 22 (COMP10002)
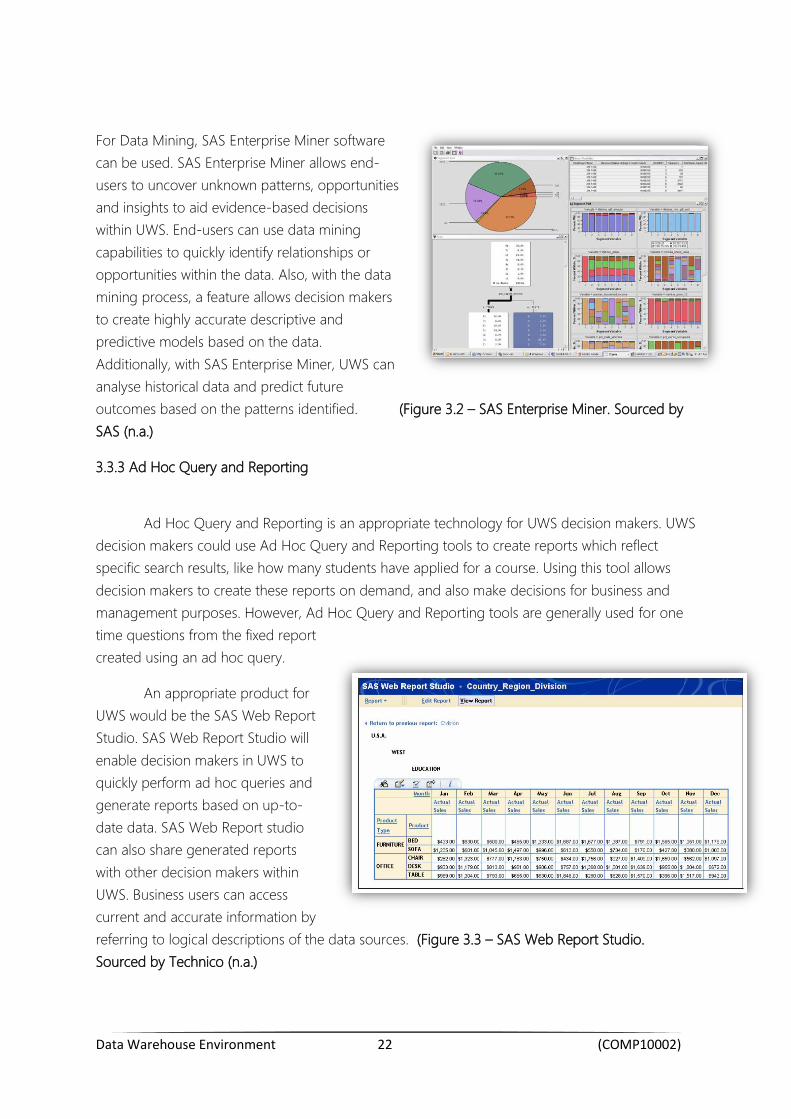
For Data Mining, SAS Enterprise Miner software
can be used. SAS Enterprise Miner allows end-
users to uncover unknown patterns, opportunities
and insights to aid evidence-based decisions
within UWS. End-users can use data mining
capabilities to quickly identify relationships or
opportunities within the data. Also, with the data
mining process, a feature allows decision makers
to create highly accurate descriptive and
predictive models based on the data.
Additionally, with SAS Enterprise Miner, UWS can
analyse historical data and predict future
outcomes based on the patterns identified. (Figure 3.2 – SAS Enterprise Miner. Sourced by
SAS (n.a.)
3.3.3 Ad Hoc Query and Reporting
Ad Hoc Query and Reporting is an appropriate technology for UWS decision makers. UWS
decision makers could use Ad Hoc Query and Reporting tools to create reports which reflect
specific search results, like how many students have applied for a course. Using this tool allows
decision makers to create these reports on demand, and also make decisions for business and
management purposes. However, Ad Hoc Query and Reporting tools are generally used for one
time questions from the fixed report
created using an ad hoc query.
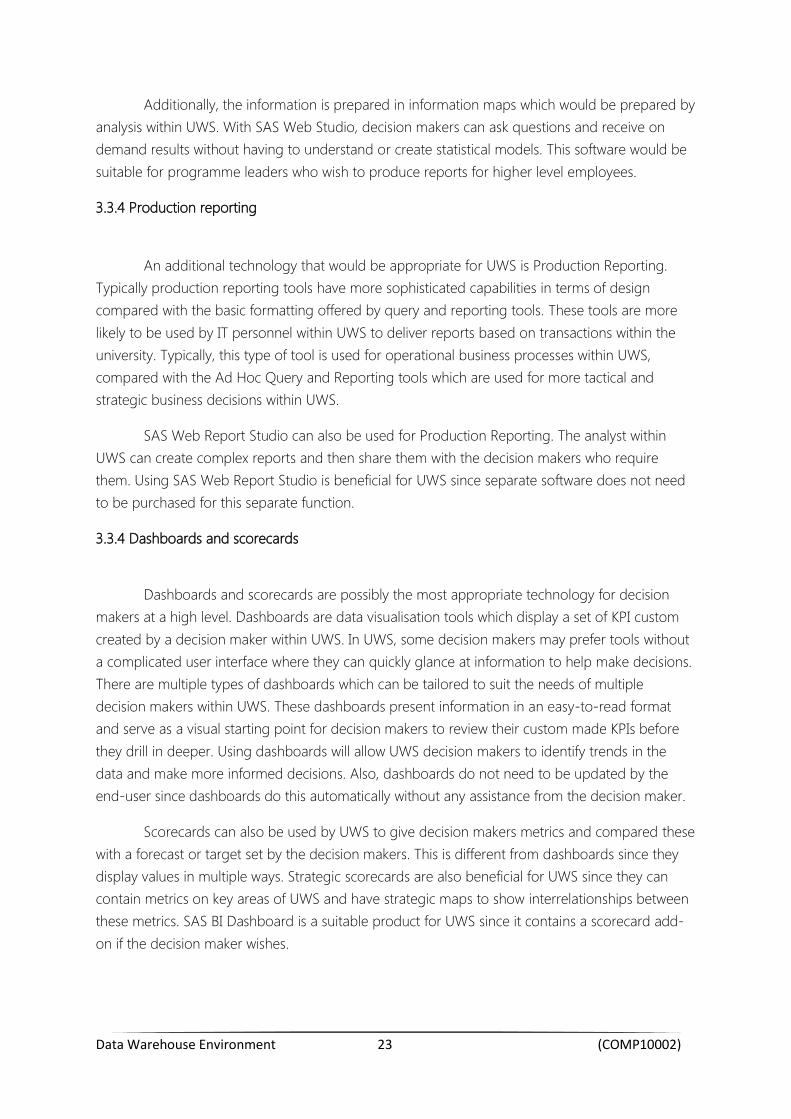
An appropriate product for
UWS would be the SAS Web Report
Studio. SAS Web Report Studio will
enable decision makers in UWS to
quickly perform ad hoc queries and
generate reports based on up-to-
date data. SAS Web Report studio
can also share generated reports
with other decision makers within
UWS. Business users can access
current and accurate information by
referring to logical descriptions of the data sources. (Figure 3.3 – SAS Web Report Studio.
Sourced by Technico (n.a.)
Data Warehouse Environment 23 (COMP10002)
Additionally, the information is prepared in information maps which would be prepared by
analysis within UWS. With SAS Web Studio, decision makers can ask questions and receive on
demand results without having to understand or create statistical models. This software would be
suitable for programme leaders who wish to produce reports for higher level employees.
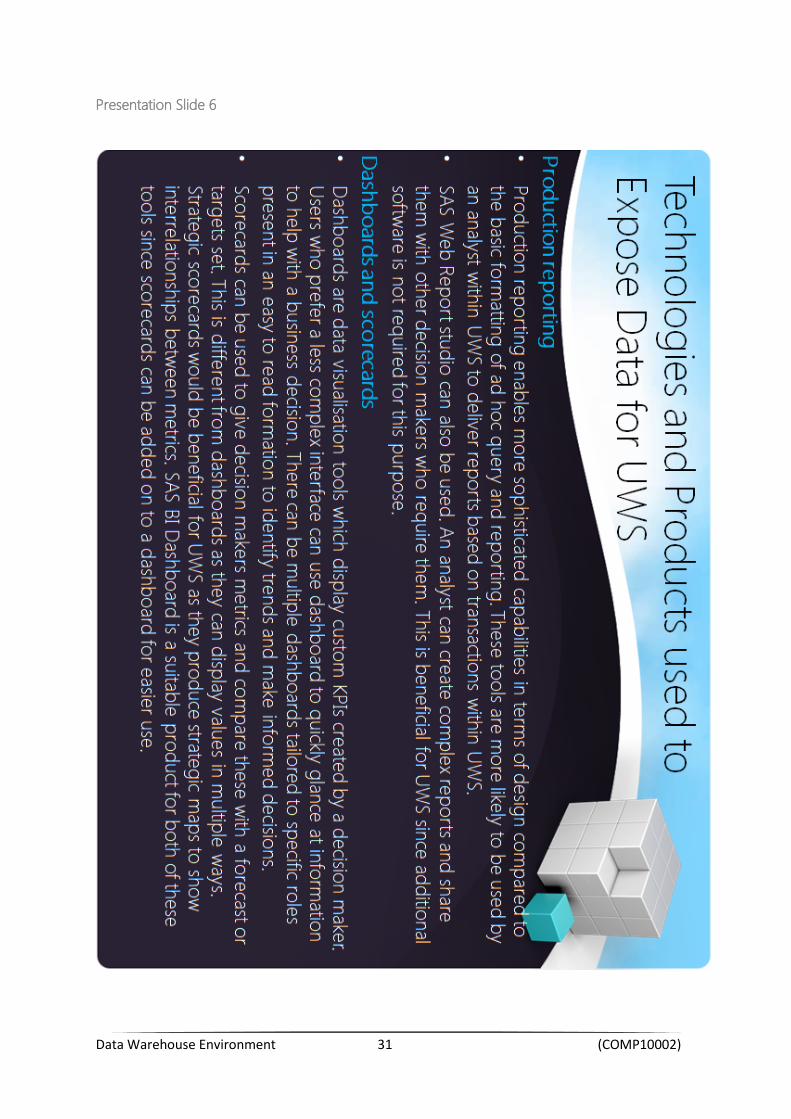
3.3.4 Production reporting
An additional technology that would be appropriate for UWS is Production Reporting.
Typically production reporting tools have more sophisticated capabilities in terms of design
compared with the basic formatting offered by query and reporting tools. These tools are more
likely to be used by IT personnel within UWS to deliver reports based on transactions within the
university. Typically, this type of tool is used for operational business processes within UWS,
compared with the Ad Hoc Query and Reporting tools which are used for more tactical and
strategic business decisions within UWS.
SAS Web Report Studio can also be used for Production Reporting. The analyst within
UWS can create complex reports and then share them with the decision makers who require
them. Using SAS Web Report Studio is beneficial for UWS since separate software does not need
to be purchased for this separate function.
3.3.4 Dashboards and scorecards
Dashboards and scorecards are possibly the most appropriate technology for decision
makers at a high level. Dashboards are data visualisation tools which display a set of KPI custom
created by a decision maker within UWS. In UWS, some decision makers may prefer tools without
a complicated user interface where they can quickly glance at information to help make decisions.
There are multiple types of dashboards which can be tailored to suit the needs of multiple
decision makers within UWS. These dashboards present information in an easy-to-read format
and serve as a visual starting point for decision makers to review their custom made KPIs before
they drill in deeper. Using dashboards will allow UWS decision makers to identify trends in the
data and make more informed decisions. Also, dashboards do not need to be updated by the
end-user since dashboards do this automatically without any assistance from the decision maker.
Scorecards can also be used by UWS to give decision makers metrics and compared these
with a forecast or target set by the decision makers. This is different from dashboards since they
display values in multiple ways. Strategic scorecards are also beneficial for UWS since they can
contain metrics on key areas of UWS and have strategic maps to show interrelationships between
these metrics. SAS BI Dashboard is a suitable product for UWS since it contains a scorecard add-
on if the decision maker wishes.

Data Warehouse Environment 24 (COMP10002)
3.4 Issues particular to UWS
One of the main issues with UWS is the lack of a common user interface for their BI tools.
For users to access the multiple source systems within UWS, different BI tools must be used.
Furthermore, some end-users are using tools they are unfamiliar with and so cannot effectively
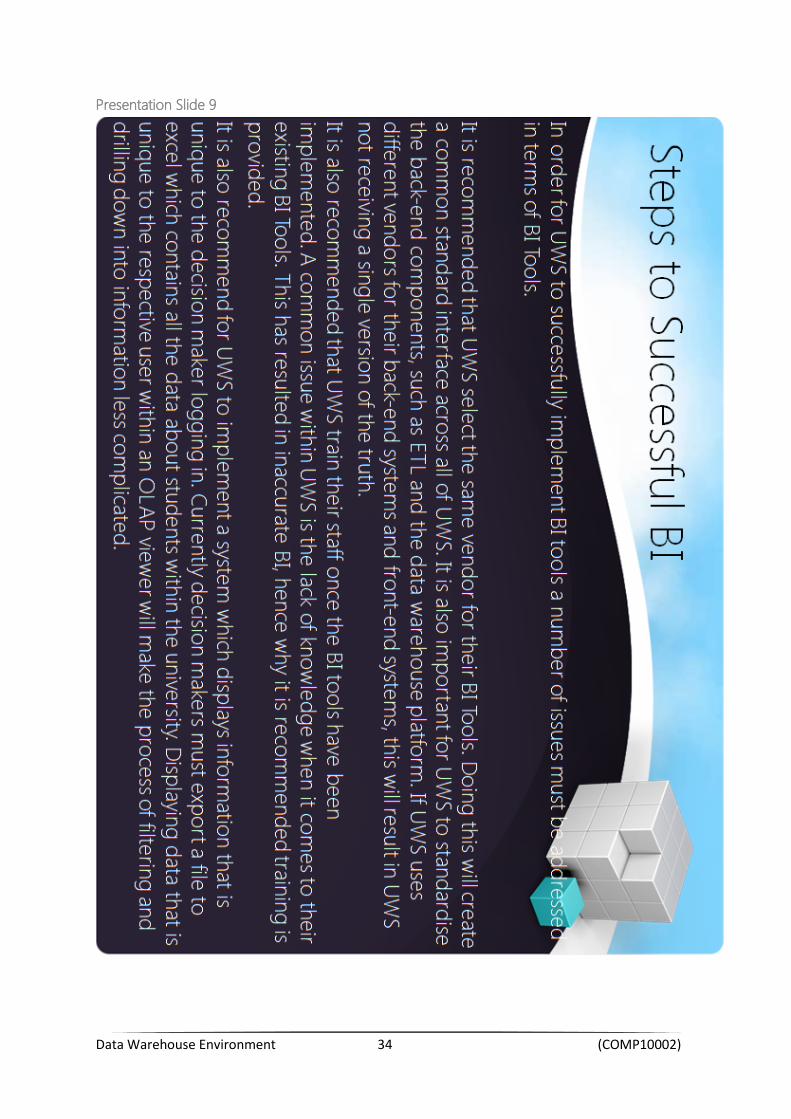
peruse their business objectives. It is important for UWS to not only standardise their BI tools, but
also within the back-end components such as ETL, data quality and the data warehouse platform
(Howson, 2008). Because UWS uses different vendors for their systems and different BI tools to
access their system, they may not be receiving a single version of the truth – which requires a
consistent representation within the BI tools and the data architecture (Howson, 2008).
Because UWS is not using standardised BI tools, issues with decision making may arise as
some staff within UWS is not familiar with the tools available. This means that they cannot
effectively make business decisions or answer business questions, and also means some staff may
be using traditional methods of data gathering to make these decisions. This is perhaps due to a
lack of training on how to operate the multiple systems and multiple interfaces, resulting in
inaccurate BI data. If decision makers are using inaccurate BI data, there could be issues with
outcomes of the decisions made. This is why it is important UWS trains their staff once they have
implemented a set stand of BI tools within their data warehouse environment.
In addition to the lack of a standard interface, when a decision maker signs into a BI tool
within the UWS system, information unique to their role is not displayed. This may result in end-
users receiving the wrong data since the only way to filter and view the data is to export all data to
an Excel spread sheet to do further data analysis. This further defines the issue of lack of training,
as some staff may not be familiar with the process of exporting data and using the Excel software.
This is an additional reason why UWS should pursue a common standard interface to allow
decision makers to effectively answer their business questions.
Data Warehouse Environment 25 (COMP10002)
3.5 New trends of particular interest to UWS
Mobile BI is a new trend which may be of particular interest to UWS, since some decision
makers' travel between the four campuses. Sometimes decision makers of UWS may not be able
to access a desktop version of their BI tools. With mobile BI, decision makers could make business
decisions by using the BI tool software on their mobile device or tablet. This may be more useful
than a static paper report, as the BI tool could display more up-to-date information if the decision
maker has access to an internet connection.
Social media sites can be used to gather information on relationships or trends. With big
data and social media analytics on the rise, UWS could use these technologies to their full
advantage. UWS could collect this type of data to view people's thoughts and opinion about UWS
online. With this data they could make improvements based on the feedback gathered.
The products suggested throughout this report are web based with access systems within
the UWS institution. However, there is a growing trend for businesses to store data in the cloud.
Storing data in the cloud could potentially save money on maintaining the UWS systems since the
vendor hosting the data would maintain the system hardware. The only expense for UWS is the
monthly or annual bill to use the vendors’ service. Using these types of services may be easier for
decision makers whilst they are at home. If decision makers currently want to access the UWS
system, they must access a VPN to securely enter the UWS system. If data is stored in the cloud,
decision makers need only access the BI tool on the web browser and sign in with their unique log
in to view their data.
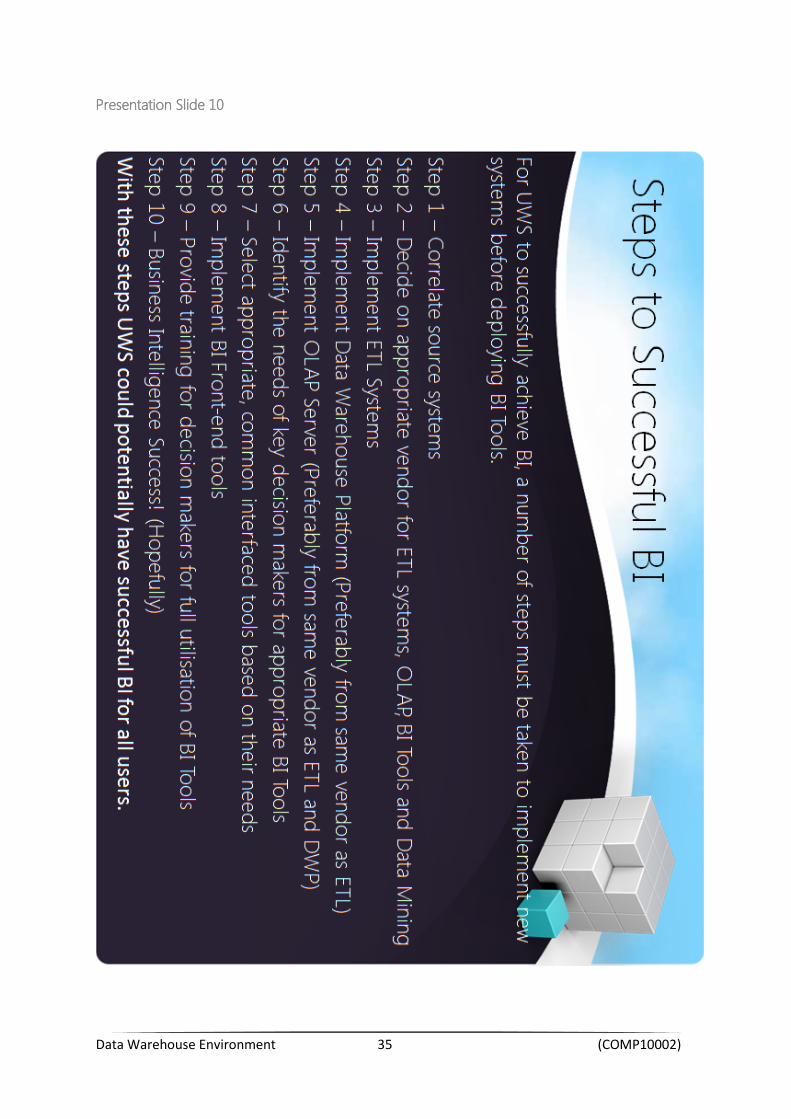
3.6 To Conclude
This report has detailed the purpose and importance of BI for UWS, along with
appropriate technologies and products UWS can use to fully utilise BI. Furthermore, issues of UWS
have been discussed, along with new trends which may be on interest to UWS. The summary if
the main points in the report can be found in the presentation, which will also detail the
recommended approach for UWS to take to successfully achieve BI.

Data Warehouse Environment 26 (COMP10002)
4.0 Appendix
Presentation Slide 1

Data Warehouse Environment 27 (COMP10002)
Presentation Slide 2
Data Warehouse Environment 28 (COMP10002)
Presentation Slide 3
Data Warehouse Environment 29 (COMP10002)
Presentation Slide 4
Data Warehouse Environment 30 (COMP10002)
Presentation Slide 5
Data Warehouse Environment 31 (COMP10002)
Presentation Slide 6
Data Warehouse Environment 32 (COMP10002)
Presentation Slide 7

Data Warehouse Environment 33 (COMP10002)
Presentation Slide 8
Data Warehouse Environment 34 (COMP10002)
Presentation Slide 9
Data Warehouse Environment 35 (COMP10002)
Presentation Slide 10
Data Warehouse Environment 36 (COMP10002)
Figure 2.1
Figure 2.2
Data Warehouse Environment 37 (COMP10002)
Figure 2.3
Figure 2.4
Data Warehouse Environment 38 (COMP10002)
Figure 2.5
Figure 2.6
Data Warehouse Environment 39 (COMP10002)
Figure 2.7
Figure 2.8

Data Warehouse Environment 40 (COMP10002)
Figure 2.9
Figure 2.10
Data Warehouse Environment 41 (COMP10002)
Figure 2.11
Figure 2.12
Data Warehouse Environment 42 (COMP10002)
Figure 3.1
Figure 3.2

Data Warehouse Environment 43 (COMP10002)
Figure 3.3
Data Warehouse Environment 44 (COMP10002)
5.0 References
Baskerville, S., MacLeod, F., Saunders, N. (2011) “A guide to UK Higher Education and Partnerships
for Overseas Universities”
http://www.international.ac.uk/resources/Guide%20to%20UK%20HE%20and%20Partnerships%20E
NGLISH%20FINAL.pdf (Accessed: 28 October 2012)
BBC (2007) Merger firms regional university [Internet] BBC. Available from:
http://news.bbc.co.uk/1/hi/scotland/glasgow_and_west/6923967.stm (Accessed: 28 October 2012)
BI Mentalist (2011) MSBI #3- SSIS # 1- What is SSIS? – (SQL Server Integration Services) BI
Mentalist Available from: http://bimentalist.com/2011/07/26/bi-3-ssis-1-what-is-ssis-sql-server-
integration-services/ (Accessed: 18 November 2012)
Carolyn Davidson Talk Audio File.mp3. (2012) [Internet] Available:
Audio: http://moodle.uws.ac.uk/mod/resource/view.php?id=162563
(Accessed: 28 October 2012)
Chaudurt, S., Umesgwar, D. and Narasayya,V. (2011) “An overview of Business Intelligence”,
Communications of the ACM, Vol. 54 No. 8, August, Pages 88-98
Chiang , A(2011) What is a Dashboard? [Internet] Dashboard Insight. Available From:
http://www.dashboardinsight.com/articles/digital-dashboards/fundamentals/what-is-a-
dashboard.aspx (Accessed November 3rd 2012)
CRISP-DM (2000) The new blueprint for data mining [Internet] CRISP-DM. Available from:
http://www.crisp-dm.org/News/86605.pdf (Accessed 2nd November 2012)
DataPrix(2009) The suites of Oracle Business Intelligence [Internet] Available from:
http://www.dataprix.com/en/suites-oracle-business-intelligence (Accessed 13th December 2012)
ETL Tools (2012) What is ETL? [Internet] ETL Tools. Available from: http://www.etltool.com/what-
is-etl-extract-transform-and-load/ (Accessed 1st November 2012)
Fayyad et al., 1996] U. Fayyad, G. P.-Shapiro, and P. Smyth. From data mining to knowledge
discovery in databases. AI Magazine, 17(3):37-54, Fall
1996. http://citeseer.ist.psu.edu/fayyad96from.html (Accessed 1st November 2012)
Gartner (2012) Data Mining [Internet] Gartner. Available from: http://www.gartner.com/it-
glossary/data-mining/ (Accessed 2nd November 2012)
Geekpedia (2006) Microsoft Excel 2007. Geekpedia. Available from:
http://www.geekpedia.com/Picture84_Microsoft-Excel-2007.html (Accessed 13th December 2012)
Data Warehouse Environment 45 (COMP10002)
HEFCE (2012) UK Universities contribute to economic growth [Internet] Higher Education Funding
Council for England. Available from:
http://www.hefce.ac.uk/news/newsarchive/2012/name,73740,en.html (Accessed: 28 October 2012)
Horwitt , E.(2010) The state of BI Tools [Internet] Computer World. Available from:
http://www.computerworld.com/s/article/9200878/The_state_of_BI_tools
Howson, C (2005) Beyond Statistics: SAS Takes On Mainstream BI [Internet] Information Week.
Available from: http://www.informationweek.com/software/business-intelligence/beyond-statistics-
sas-takes-on-mainstrea/172900695 (Accessed 28th November 2012)
Howson, C. (2008) Successful Business Intelligence Secrets to Making BI a Killer App, New York:
McGraw Hill.
IPPR (2011) Pursuit of artificial immigration targets will cause real damage to UK universities and
colleges [Internet] Institute for Public Policy Research. Available from:
http://www.ippr.org/pressreleases/?id=4355 (Accessed: 28 October 2012)
JISC (2011) Where is Business Intelligence going? [Internet] JISC infoNet. Available from:
http://www.jiscinfonet.ac.uk/infokits/strategy/environment-scanning/where (Accessed 1st
November 2012)
JISC (2011) What do Higher Education Institutions (HEIs) want to know? [Internet] JISC infoNet.
Available from: http://www.jiscinfonet.ac.uk/infokits/strategy/environment-scanning/what-hei
(Accessed 1st November 2012)
Klipfolio (2012) Business Intelligence. Trends for 2012 [Internet] Klipfolio. Available from:
http://www.klipfolio.com/resources/business-intelligence-trends-2012 (Accessed 18th November
2012)
OLAP Council (1995) OLAP and OLAP Server definitions [Internet] OLAP Council. Available from:
http://www.olapcouncil.org/research/glossaryly.htm (Accessed 1st November 2012)
Pendse, N (2008) What is FASMI? [Internet] The BI Verdict. Avaliable from: http://www.bi-
verdict.com/fileadmin/dl_temp/c193204331a81886093415eaf2d47a84/fasmi.htm (Accessed 1st
November 2012)
Preston, V (2011) Where is BI headed? – Unravelling Major Trends [Internet] Fusionops. Available
From: http://www.fusionops.com/blog/2011/12/where-is-bi-headed-%E2%80%93-unravelling-
major-trends/ (Accessed November 28th 2012)
Preston, V (2012) The Next Generation BI Tools – Cloud BI Solution [Internet] EzineArticles.
Available from: http://ezinearticles.com/?The-Next-Generation-BI-Tools---Cloud-BI-
Solutions&id=6848387 (Accessed November 28th 2012)

Data Warehouse Environment 46 (COMP10002)
UKCISA (2012) International students in UK higher education: key statistics [Internet] UK Council
for International Student Affairs. Available from http://www.ukcisa.org.uk/about/statistics_he.php
(Accessed 23rd October 2012)
Universities UK (2012) An overview of the higher education sector [Internet] Universities UK.
Available from: http://www.universitiesuk.ac.uk/UKHESector/Pages/OverviewSector.aspx (Accessed
23rd October 2012)
UUK (2009) The impact of universities on the UK economy [Internet] Universities UK. Available
from: http://www.universitiesuk.ac.uk/Publications/Documents/EconomicImpact4Full.pdf
(Accessed 23rd October 2012)
Note that these figures were cited for 2007/8, which is the last year for which data was available.
UWS (2012) Our Mission and Strategy [Internet] UWS. Available from:
http://www.uws.ac.uk/about-uws/overview/mission-and-strategy/
Rouse, M (2007) OLAP (online analytical processing) [Internet] SearchDataManagement. Available
from: http://searchdatamanagement.techtarget.com/definition/OLAP (Accessed 31st October
2012) (Accessed November 3rd 2012)
Rouse, M (2010) Business Intelligence Dashboard [Internet] Tech Target. Available From:
http://searchbusinessanalytics.techtarget.com/definition/business-intelligence-dashboard
(Accessed November 3rd 2012)
SAS (n.a.) SAS Enterprise BI Server [Internet] SAS. Available from:
http://www.sas.com/technologies/bi/entbiserver/#section=4 (Accessed November 28th 2012)
SAS (n.a.) SAS Enterprise Miner [Internet] SAS. Available from:
http://www.sas.com/technologies/analytics/datamining/miner/#section=4 (Accessed November
28th 2012)
Stewart, S (2008) What is OLAP and OLAP Cube? [Internet] Rapid Business Intelligence Success.
Available From: http://www.rapid-business-intelligence-success.com/what-is-olap.html (Accessed
1st November 2012)
Sonderegger , P. (2012) BI 2012: The Future that has Already Happened [Internet] TDWI. Available
from: http://tdwi.org/articles/2012/01/10/bi-future-has-already-happened.aspx (Accessed
November 28th 2012)
Technico (n.a) SAS Web Report Studio [Internet] Technico. Available from:
http://technico.qnownow.com/files/2012/06/webrep.jpg (Accessed November 28th 2012)
Thomas M. Connolly, Carolyn E. Begg, 2005. Database Systems: A Practical Approach to Design,
Implementation and Management (4th Edition). 4 Edition. Addison Wesley
Tom Caira Guess Talk Audio File.mp3. (2012) [Internet] Available:

Data Warehouse Environment 47 (COMP10002)
Audio: http://moodle.uws.ac.uk/mod/resource/view.php?id=159899 (Accessed: 28
October 2012).