DATABASE MANAGER - Eastern Regional Power...
202
DATABASE MANAGER User Manual
Transcript of DATABASE MANAGER - Eastern Regional Power...
DATABASE MANAGER
Use
r M
anu
al

MiP-PSCT Database Manager User Manual
Power Research and Development Consultants Pvt. Ltd. Page 1
Table of Contents
1 Database Manager ..................................................................................... 7
1.1 Terminology and Definitions ................................................................. 7
1.2 File Menu .............................................................................................. 9
1.2.1 New Database ................................................................................ 9
1.2.2 Open Database ............................................................................ 11
1.2.3 Close Database ............................................................................ 11
1.2.4 Close ............................................................................................ 11
1.2.5 Save As ........................................................................................ 11
1.2.6 Exit ............................................................................................... 11
1.3 View Menu .......................................................................................... 11
1.3.1 General Purpose Toolbar ............................................................. 11
1.3.2 Configure & Contingency Toolbar ................................................ 12
1.3.3 Solve Toolbar ............................................................................... 12
1.3.4 Elements Toolbar ......................................................................... 13
1.3.5 Status Bar .................................................................................... 14
1.3.6 Bus Connections .......................................................................... 14
1.3.7 User Access Level ........................................................................ 15
1.4 Elements Menu .................................................................................. 15
1.4.1 Bus ............................................................................................... 15
1.4.2 Two winding transformer ............................................................. 17
1.4.3 Transmission Line ........................................................................ 22
1.4.4 Series Reactor .............................................................................. 24
1.4.5 Series Capacitor ........................................................................... 24
1.4.6 Bus Coupler.................................................................................. 25
1.4.7 Flexible AC Transmission System (FACTS) ................................. 25
1.4.8 Thyristor Controlled Series Capacitor ........................................... 26
1.4.9 Unified Power Flow Controller ...................................................... 28
1.4.10 Static Phase Shifter................................................................... 29
1.4.11 Reactor ..................................................................................... 30
1.4.12 Capacitor ................................................................................... 30
1.4.13 Generator .................................................................................. 31
1.4.14 Wind Generator Data ................................................................ 35
1.4.15 Solar PV Data .......................................................................... 38

MiP-PSCT Database Manager User Manual
Power Research and Development Consultants Pvt. Ltd. Page 2
1.4.16 Motor ......................................................................................... 42
1.4.17 Load .......................................................................................... 45
1.4.18 Cyclic Load ............................................................................... 46
1.4.19 Filter .......................................................................................... 47
1.4.20 SVC........................................................................................... 47
1.4.21 Shunt FACTS Device ................................................................ 47
1.4.22 Capacitive Voltage Transformer ................................................ 48
1.4.23 Converter .................................................................................. 49
1.4.24 DC Link ..................................................................................... 51
1.4.25 Overcurrent Relay ..................................................................... 52
1.4.26 Distance Relay .......................................................................... 56
1.4.27 Voltage Relay ............................................................................ 59
1.4.28 Frequency Relay ....................................................................... 61
1.4.29 Transformer Differential Relay .................................................. 63
1.4.30 Restricted Earth Fault Relay ..................................................... 67
1.5 High Impedance REF .......................................................................... 68
1.6 Low Impedance REF .......................................................................... 69
1.6.1 Line Pilot Relay ............................................................................ 71
1.6.2 Bus Bar Differential Relay ............................................................ 73
1.6.3 Line Cable Differential Relay ........................................................ 76
1.6.4 Three Winding Transformer ......................................................... 77
1.6.5 Current or Voltage Source ............................................................ 79
1.6.6 Lightning Arrester ......................................................................... 79
1.6.7 Switch ........................................................................................... 79
1.6.8 MOV ............................................................................................. 79
1.6.9 Spark Gap .................................................................................... 80
1.6.10 Shunt Resistor .......................................................................... 80
1.6.11 Current Transformer.................................................................. 81
1.6.12 Ammeter ................................................................................... 82
1.6.13 Voltmeter ................................................................................... 82
1.6.14 Multimeter ................................................................................. 83
1.6.15 Circuit Breaker .......................................................................... 83
1.6.16 Battery ....................................................................................... 83
1.6.17 Battery Charger ......................................................................... 84

MiP-PSCT Database Manager User Manual
Power Research and Development Consultants Pvt. Ltd. Page 3
1.6.18 Measurement Data.................................................................... 84
1.6.19 Low Voltage Power Circuit Breaker .......................................... 85
1.6.20 Mutual Coupling Data................................................................ 86
1.7 Library Menu ....................................................................................... 88
1.7.1 Two Winding Transformer ............................................................ 88
1.7.2 Transmission Line ........................................................................ 91
1.7.3 Reactor ......................................................................................... 91
1.7.4 Capacitor ...................................................................................... 93
1.7.5 Reactor ......................................................................................... 93
1.7.6 Capacitor ...................................................................................... 94
1.7.7 Generator ..................................................................................... 94
1.7.8 Motor ............................................................................................ 98
1.7.9 Cyclic Load ................................................................................. 101
1.7.10 Static VAR Compensator ........................................................ 102
1.7.11 User defined filter .................................................................... 102
1.7.12 Capacitive Voltage Transformer .............................................. 104
1.7.13 Current / Voltage Source ......................................................... 105
1.7.14 Turbine governor ..................................................................... 106
1.7.15 AVR......................................................................................... 107
1.7.16 PSS ......................................................................................... 108
1.7.17 Boiler ....................................................................................... 108
1.7.18 Multiplication factor ................................................................. 109
1.7.19 Reduction Factor ..................................................................... 111
1.7.20 Relay Database ...................................................................... 112
1.7.21 Low Voltage Power Circuit Breaker (LVPCB) ......................... 116
1.7.22 Transformer Differential Relay ................................................ 117
1.7.23 Restricted Earth Fault ............................................................. 118
1.7.24 Line Pilot ................................................................................. 120
1.7.25 Bus Bar Differential Relay ....................................................... 120
1.7.26 Line/Cable Differential Relay ................................................... 121
1.7.27 Three Winding Transformer .................................................... 121
1.7.28 Generator Capability Curve ..................................................... 125
1.7.29 Lightning Arrester .................................................................... 126
1.7.30 Line Harmonic Info .................................................................. 127

MiP-PSCT Database Manager User Manual
Power Research and Development Consultants Pvt. Ltd. Page 4
1.7.31 Motor Load Characteristic data ............................................... 127
1.8 Record Menu .................................................................................... 127
1.8.1 Add ............................................................................................. 128
1.8.2 Delete ......................................................................................... 128
1.8.3 Save Record............................................................................... 128
1.8.4 Cancel Changes ......................................................................... 128
1.8.5 First Record ................................................................................ 128
1.8.6 Previous Record ......................................................................... 128
1.8.7 Next Record ............................................................................... 128
1.8.8 Last Record ................................................................................ 128
1.8.9 View All Records ........................................................................ 129
1.8.10 View In Detail .......................................................................... 129
1.8.11 Clear Fields ............................................................................. 129
1.8.12 Copy ........................................................................................ 129
1.8.13 Paste ....................................................................................... 129
1.9 Options Menu ................................................................................... 129
1.9.1 Configuration .............................................................................. 129
1.9.2 Contingency ............................................................................... 130
1.9.3 Schedule .................................................................................... 131
1.9.4 Configure > Database Description ............................................. 131
1.9.5 Schedule and Contingency ........................................................ 132
1.9.6 Database - Copy Libraries .......................................................... 132
1.9.7 To Network ................................................................................. 133
1.9.8 Update Network .......................................................................... 133
1.9.9 Create Sub Database ................................................................. 133
1.9.10 Area ........................................................................................ 134
1.9.11 Zone ........................................................................................ 134
1.9.12 Owner ..................................................................................... 134
1.9.13 Output configuration ................................................................ 134
1.9.14 Sub Station ............................................................................. 134
1.10 Solve Menu .................................................................................... 134
1.10.1 Load flow analysis ................................................................... 135
1.10.2 Short Circuit Study .................................................................. 142
1.10.3 Overcurrent Relay Co-ordination ............................................ 146

MiP-PSCT Database Manager User Manual
Power Research and Development Consultants Pvt. Ltd. Page 5
1.10.4 Distance Relay Co-ordination ................................................. 148
1.10.5 Transient Stability Analysis ..................................................... 150
1.10.6 Voltage Instability Analysis ...................................................... 157
1.10.7 Dynamic Stability Analysis ...................................................... 158
1.10.8 Sub - Synchronous Resonance .............................................. 159
1.10.9 Harmonic Analysis .................................................................. 160
1.10.10 Network reduction analysis ..................................................... 161
1.10.11 Electromagnetic transient analysis .......................................... 163
1.10.12 Three Phase Load flow Analysis ............................................. 166
1.10.13 Reliability Indices .................................................................... 167
1.10.14 Observability Analysis ............................................................. 169
1.10.15 State Estimation ...................................................................... 170
1.10.16 Arc Flash Analysis .................................................................. 172
1.11 Tools Menu .................................................................................... 172
1.11.1 Present worth Analysis ............................................................ 172
1.11.2 Cost Analysis .......................................................................... 174
1.11.3 Management Information System (MIS).................................. 176
1.11.4 Batch Mode ............................................................................. 177
1.11.5 Batch Mode Contingency Creation ......................................... 178
1.11.6 Batch Mode for Load Curves .................................................. 179
1.11.7 Advanced Contingency Creation ............................................. 181
1.11.8 Distribution Analysis ................................................................ 182
1.11.9 Energy Loss Computation ....................................................... 183
1.11.10 Update Breaker Ratings .......................................................... 183
1.11.11 Update De-rated MVA Rating ................................................. 183
1.11.12 Update Real Time Data ........................................................... 184
1.11.13 Transformer Check ................................................................. 185
1.11.14 View – Delete Log ................................................................... 186
1.11.15 Edit Bus Data .......................................................................... 186
1.11.16 Report Writer ........................................................................... 186
1.11.17 Line Outage Distribution Factor .............................................. 190
1.11.18 Generation Shift Factor ........................................................... 192
1.11.19 Generation Scheduling ............................................................ 193
1.11.20 Automatic Normal opening Point Creation .............................. 194

MiP-PSCT Database Manager User Manual
Power Research and Development Consultants Pvt. Ltd. Page 6
1.11.21 Update NOP ............................................................................ 194
1.11.22 GPS Data ................................................................................ 194
1.12 Unit Protection Menu .................................................................... 194
1.13 Import Menu .................................................................................. 199
1.14 Window Menu ................................................................................ 199

MiP-PSCT Database Manager User Manual
Power Research and Development Consultants Pvt. Ltd. Page 7
1 Database Manager
MiP-PSCT Database Manager is designed to accept power system equipment details and conduct power system analysis of the system. The database is maintained using MS Access®. MiP-PSCT Database Manager is highly interactive and user friendly.
MiP-PSCT Database Manager offers following menus:
File Menu
View Menu
Elements Menu
Library Menu
Record Menu
Options Menu
Solve Menu
Tools Menu
Unit Protection Menu
Import Menu
Window Menu
Help Menu
1.1 Terminology and Definitions
Element (Field) Information
The data related to power system equipment, field placement is to be entered in “Elements". Connectivity information and operational data like tap setting, scheduled power, specified voltage, no of circuits are entered here. Before entering element data, library data availability is a must, as element data consists of a link to library.
Library (Manufacturer) Information
“Libraries" contain the information related to equipment rating, impedance and winding connections if any as per the name plate details or as per technical data. As the library information covers the nameplate details, different field elements can refer to same library, thereby avoiding the duplication of data. Depending on the p.u status, this data is read.
Reference Number
Reference number is the field to specify the serial number of either element or library record. This is a user-defined non-zero positive integer. This number need not be continuous. On adding a record, it is incremented automatically with reference to the largest reference number in the data.
Manufacturer/ Element name
This field is used to specify the name of either element or library. This is user-defined alphanumeric string with no space character. On adding a record, default names are generated. This name can be changed at any instant.
Manufacturer Reference Number
This field is used to specify the link between element and library. All libraries of particular element are listed in the list box with number and name format. To create the link, select from the list.
Viewing the referred library
To view the library referred, click on the library button. This operation will open the corresponding library.
Fetch

MiP-PSCT Database Manager User Manual
Power Research and Development Consultants Pvt. Ltd. Page 8
This option is used to view desired record. On selecting this option, a dialog box is popped up listing the records present in that particular data. Select the desired reference number and click OK to pop up the selected record.
Breaker Rating
This field is updated automatically in add mode on selection of the bus depending on the voltage level of the bus. This can be changed at any instant.
No. of units/circuits in parallel
This field is used to specify no. of units (shunt elements) or circuits (series elements) in parallel. This data is used for calculating equivalent values while conducting studies.
Per Unit status and parameter consideration
If p.u status is TRUE, then all impedance values are on common MVA base. If it is FALSE, then all impedance values are to be specified on the equipment rating except for transmission line impedances. For transmission line or cable resistance is in ohms/km/ckt, reactance in ohms/km/ckt and susceptance in mho/km/ckt. To configure the p.u status, see the topic Options Menu later in this chapter.
De-Rated MVA
Due to operational constraints sometimes the equipment is not loaded to its rated capacity and the units are de-rated. The equipment impedance values given by the manufacturer are on its rated MVA. In order to compute the actual loading on the equipment with its De-Rated MVA, this field is used. This value is generally the MVA rating given in the corresponding library file. The MVA rating specified in the library referred is used in updating this field on the add mode. User can change this value to desired value. This field value is used only in load flow study to calculate percentage loading.
Contingency Weightage
Contingency weightage is used to increase the severity of given outage for a particular bus or line. Normally the weightage value is unity. However, if a particular bus voltage deviations should not occur for any outage, and even for small deviations, that outage need to be given higher ranking, then the bus weightage number is given greater than unity say, 5. Then the voltage deviation is multiplied by 5 times, and hence the contingency ranking will go high. For 400kV buses and buses connected to neighbouring grid, the weightage can generally be high value. Similarly, for the lines, even for small overloading, if the severity should be increased, then line weightage is given more than unity. For tie lines and important lines in the grid, which should never be overloaded, line weightage can be increased.
Series Elements
Any element connected between two buses is referred as series element.
A. From Bus: This field is used to specify the From bus number to which the series element is connected. This bus can be selected from the list box provided, which displays all the buses present in the database.
B .To Bus: This field is to specify the To bus number to which the series element is connected. This bus can be selected from the list box provided, which displays all the buses present in the database.
Shunt Elements
Any element connected only at one bus is referred as shunt element.
Bus Number:
This field is used to specify the bus number to which the shunt element is connected. This bus can be selected from the list box provided which displays all the buses present in the database.
MVA rating
This field is to specify the MVA rating of the equipment. This MVA rating is used in parameter conversions.
kV rating
This field is used to specify the kV rating of the equipment on which the equipment’s parameters are derived.

MiP-PSCT Database Manager User Manual
Power Research and Development Consultants Pvt. Ltd. Page 9
Positive sequence impedance /resistance / reactance/ Admittance/ conductance / susceptance
Depending upon the context, this field is used to specify either positive sequence impedance or resistance or reactance or Admittance or conductance or susceptance. This value can be p.u on common MVA base or on its own rating depending upon the configuration set.
Zero sequence impedance /resistance / reactance/ admittance/ conductance / susceptance
Depending upon the context, this field is used to specify either zero sequence impedance or resistance or reactance or admittance or conductance or susceptance. This value can be p.u on common MVA base or on its own rating depending up on the configuration set. If the value is specified or as zero, then the positive sequence data is multiplied with the available multiplication factor and substituted as zero sequence data while conducting the short circuit studies.
Back
To view or scroll back the data already entered in the sub-record of the table, click this button.
Next
To view or scroll forward the data already entered in the sub-record of the table, click this button. If it is end of the record then message is popped up that “Add a New record Yes/no”.
Delete
To delete the sub-records, click this button.
Counter
This is a counter, which shows the count of the records entered in to the sub-record.
In Service / Out of Service
In service: Element is considered for the study or analysis.
Out of Service: Element is not considered for the study or analysis.
Existing / Proposed
Existing: This represents that power system element is already commissioned.
Proposed: This represents that power system element is a proposed one and not yet commissioned. After execution of the load flow analysis, in view bus option, the proposed element appears with dotted line.
Year
This gives the year of commissioning of the power system element
Maintenance Data Form
Element details: Select power system Element type and element ID.
Last maintenance Date: Enter the date of maintenance of the equipment and also the maintenance period in days.
Next Maintenance date: It will be the sum of last maintenance date plus Maintenance period. This will be highlighted in red colour if the next maintenance date is exceeding the current date.
Relay: This button will opens the corresponding relay data form.
Attachments: Any detail regarding the power system element can be attached here. With + button, browse for the file. – button to remove the attachment or delete the path of the file.
Remarks: Comments can be stored here.
1.2 File Menu
1.2.1 New Database
Use “File > New Database” option for Database menu or use button on the general-purpose toolbar to open a new database. Use Ctrl + N to perform the operation with

MiP-PSCT Database Manager User Manual
Power Research and Development Consultants Pvt. Ltd. Page 10
keyboard. On using this option, the dialog box shown below is popped up.
Click on New database name button, open dialog appears in that give the database name.
Click on Open button to accept the database name. To cancel the operation click on Cancel button. If Open button is clicked,
the above dialog is closed. Then, click OK button on the New database name dialog to create new database. If file extension is not provided, a default extension of *.mdb is assumed.
Click Voltage level button. Configure system voltages for the power system study. MiP-PSCT provides some standard default voltages. If the required voltage is not available, edit the voltage level else proceed to next step.
Power System Libraries
Click on Electrical & Currency Information button. Enter electrical information about network representation. The options provided by the Database Manager are;
Per unit on a common base MVA: Specify Base MVA and make pu status "ON"
Representation of parameters on its own rating: Specify Base MVA and make p.u. status "OFF".
Currency: Specify the currency which will be considered in optimization and economics calculations
Click on Breaker Ratings to give the default breaker ratings for the specified voltages. Enter the default breaker ratings against each voltage level. Breaker ratings can be updated even at a later stage. Click on Modify all Breaker Ratings to update the breaker ratings of all the elements.

MiP-PSCT Database Manager User Manual
Power Research and Development Consultants Pvt. Ltd. Page 11
Power System Libraries: Standard libraries for line, transformer, and generator are provided in the MiP-PSCT database template. These libraries are loaded with the new database creation if it is selected
Standard Relay Libraries: If this is selected, relay libraries are uploaded with the new database creation
1.2.2 Open Database
Use “File > Open Database” option or click on the General-purpose toolbar to open an existing database file with extension *.mdb. On using this option, Explorer is opened to browse the database file. Use Ctrl + O to perform the operation with Keyboard.
1.2.3 Close Database
Use b option to close the presently opened database file. This command closes all windows opened in the view. Use Ctrl + H to perform the operation with Keyboard.
1.2.4 Close
Use “File > Close” option to close individual forms opened for view. Use menu option “Window> Close All” to close all windows at a time. Use Ctrl + E to perform the operation with Keyboard.
1.2.5 Save As
Use “File > Save As” option to make a copy of a database. On using this option, File Save, as dialog box will be popped up in which the new file name can be given.
1.2.6 Exit
Use “File > Exit” to end Database Manager Session. Close command on the application Control menu can also be used.
Shortcuts
Mouse: Double-click the application's Control menu button.
Keys: ALT+F4
1.3 View Menu
1.3.1 General Purpose Toolbar
Use “View > General Purpose Toolbar” to show or hide the general-purpose toolbar. The toolbar is dockable, i.e., it can be placed at any location on the screen. The commands interfaced to the buttons placed on the toolbar from left to right order are –
New Database Open a new database
Total shunt reactor reactive power injection
Total shunt capacitor real power injection
Open Database Open an existing database
Add Record Adds a record

MiP-PSCT Database Manager User Manual
Power Research and Development Consultants Pvt. Ltd. Page 12
Save Record Saves the current record
Delete Record Deletes the current record
Cancel Changes Cancels the changes made after the previous Save command
Clear Fields Clears the fields in the form
First Record Moves to First record of the table
Previous Record Scrolls to previous record
Next Record Scroll to Next record
Last Record Scroll to Last record
List Records Lists all records in grid format
List related records Copy Paste
Lists current record and its library in a grid format Copy all data present in the form Pastes the copied data
About Displays program information, version number and copyright
Context Sensitive Help Selection for Context sensitive help
1.3.2 Configure & Contingency Toolbar
Use “View> Configure & Contingency Toolbar” to show or hide the configure and contingency toolbar. This option will be either ON/OFF. If this option is ON, the toolbar is shown at the bottom, else the toolbar is hidden. The toolbar is dockable, i.e., it can be placed at any location on the screen. The commands interfaced to the buttons placed on the toolbar from left to right order are –
1.3.3 Solve Toolbar
Use “View->SolveToolbar” to show or hide the solve toolbar. This option will be either ON/OFF. If this option is ON, the toolbar is shown to the right by default. Otherwise the toolbar is hidden. The toolbar is dockable, i.e., it can be placed at any location on the screen. The commands interfaced to the buttons placed on the toolbar from top to bottom order are –
Configure Configures voltage levels, electrical information and Breaker ratings for the network
Contingency
Creates contingency
Select Selects a contingency and schedule
To Network Invokes Network Editor
Schedule Add/Modify/Edit Schedule details
DB Desc
Shows Database Description
On selection of this option the following dialog box appears. Enter the details of the study/database. Click Ok to save the description.
LFA Invokes Load flow analysis solve dialog box

MiP-PSCT Database Manager User Manual
Power Research and Development Consultants Pvt. Ltd. Page 13
1.3.4 Elements Toolbar
Use “View>Elements Toolbar” to show or hide the elements toolbar. This option will be either ON/OFF. If this option is ON, the toolbar is shown at the top by default. Otherwise the toolbar is hidden. The toolbar is dockable, i.e., it can be placed at any location on the screen. The commands interfaced to the buttons placed on the toolbar from left to right order are –
The following forms will be opened on click
SCS Invokes Short circuit analysis solve dialog box
ORCD Invokes Overcurrent relay co-ordination solve dialog box
DRCD Invokes Distance relay co-ordination solve dialog box
TRS Invokes Transient stability analysis solve dialog box
VIA Invokes Voltage Instability analysis solve dialog box
DYS Invokes Dynamic stability analysis solve dialog box
SSR Invokes Sub synchronous resonance analysis solve dialog box
HAR Invokes Harmonic analysis solve dialog box
3PH Invokes Three phase load flow analysis solve dialog box
YBR Invokes Network reduction analysis solve dialog box
ETA Invokes Electromagnetic transient analysis solve dialog box
Drid Invokes Reliability Index dialog box
GS Invokes Generation Scheduling dialog box
OBS Invokes Observability dialog box
SEM Invokes State Estimation dialog box
AFS Invokes Arc Flash Study dialog box
Bus CVT
Two Winding Transformer Switch
Three winding Transformer SVC
Transmission Line Shunt Fact Device
Series Reactor Thyristor Controlled series capacitor
Series Capacitor Static Phase Shifter

MiP-PSCT Database Manager User Manual
Power Research and Development Consultants Pvt. Ltd. Page 14
1.3.5 Status Bar
Use “View->Status bar” to show or hide the status bar. This option will be either ON/OFF. If the option is ON the status bar is shown at the bottom, else the status bar is hidden. The status bar is non-dockable i.e., it can’t be moved. The status bar has 4 panes. The information shown at different panes is -
First pane - If Caps lock is On, Cap is displayed.
Second pane - Current Contingency selection. By default, it is BASECASE.
Third pane - Current Schedule selection. By default, it is schedule-0.
Fourth pane - Current System Time.
1.3.6 Bus Connections
Use “View->Bus Connections” to view all the connections to a bus. The details of the elements connected are also displayed.
Bus connection details box appears. Select the Element on the list box and click on Goto button which opens the selected element data form. User can change the data. Changes will automatically updated and appear in the Bus connections form.
Bus Coupler Unified Power Flow Controller
Generator Over current relay
Wind Generator Distance Relay
Solar Generator Frequency Relay
Shunt Reactor Voltage Relay
Shunt Capacitor Transformer Differential Relay
Motor Restricted Earth Fault Relay
Load Line Pilot Differential Relay
Cyclic load Bus bar Differential Relay
Filter Line / Cable Differential Relay
Mutual Coupling Measurement Data
Convertor Metal Oxide Varistor
DC Link Spark Gap
Current/Voltage Source Shunt Resistor
Lightning Arrester

MiP-PSCT Database Manager User Manual
Power Research and Development Consultants Pvt. Ltd. Page 15
1.3.7 User Access Level
Use “View->User Access Level”to know the access level of the MiP-PSCT user.
1.4 Elements Menu
1.4.1 Bus
BUS Data form is the default form opened by the Database Manager. Whenever the bus data form is closed after all other forms, the database also gets closed.
Bus Description Additional descriptive information of the bus.
Nominal Voltage
Select the desired voltage level from the drop down list. Voltage levels can be configured any time using Configure button on the toolbar.
Area Number
Enter the area to which the bus belongs. This is to differentiate different states having different zones. The area number can also be selected using the Select Area number list box. Here the area number is displayed along with the area description. To configure area numbers and names use options >Area
Zone number
Enter the zone number to which the bus belongs. The different voltage levels can be given different zone numbers. The zone number can also be selected using the Select Zone number list box. Here the zone number is displayed along with the zone description. To configure zone numbers and names use options >Zone
Owner number
Enter the owner number to which the bus belongs. The different buses can be given different owner numbers. The owner number can also be selected using the Select Owner number list box. Here the owner number is displayed along with the owner description. To configure owner numbers and names use options >Owner.
Minimum Voltage
Enter the minimum voltage limit for the bus in kV. This is used in modifying the transformer tap settings, reactive power injection at buses to achieve the desired voltage and for security limit checking. While generating the load flow report file, buses whose voltage magnitude exceeds the minimum limits are marked with distinct attributes. The field is by default 95% of the nominal voltage selected.
Maximum Voltage
Enter the maximum voltage limit for the bus in kV. This information is used in modifying the transformer tap settings, reactive power injection at buses to achieve the desired voltage and for security limit checking. While generating the load flow report file, buses whose voltage magnitude exceeds the maximum limits are marked with distinct attributes. The field is by default 105% of the nominal voltage selected
Global Change
Click on “Global Change “to change globally certain parameters of the bus.
The following dialog box appear

MiP-PSCT Database Manager User Manual
Power Research and Development Consultants Pvt. Ltd. Page 16
The global modification option can be used to
Change the minimum and maximum voltage limits, depending on Voltage level, zone wise or for selected buses.
Change the zone number, depending on Voltage level, zone wise or for selected buses.
Select the options and click on Modify to change the bus data, done to close the dialog box.
Load
Click on this to view the total connected loads on the bus. There may be cases wherein some of the loads are switched off. This provides information regarding the total connected load and the total running loads.
Details
For each bus further details can be given. Click on bus details the following dialog box appears.
Enter the Bus rated current in amperes, bus fault current in amperes and fault with stand time in seconds. This is only for information purpose. These data are optional.
Costlib>>
Enter the Library number, library name and cost in rupees for the bus
Bus Bar Differential: On selection of this opens the Bus Bar Differential relay form.
GPS: Click on this button to open GPS data form
Enter the GPS coordinates, latitude, longitude and altitude as shown in the dialog. If GPS file is there with the following format it can be called from menu option
Tools->GPS Data
Bus No Latitude Longitude Symbol Altitude
41920001 N26°30'23.7'' E092°48'25.2" 1 699.2
51000031 N26°27'41.9'' E092°55'16.5'' 1 679.5
51000032 N25°57'31.4'' E092°31'02.6'' 1 692.3
51000033 N25°58'03.5'' E092°35'49.9'' 1 696.4

MiP-PSCT Database Manager User Manual
Power Research and Development Consultants Pvt. Ltd. Page 17
Arc Flash:
An arc flash is the sudden release of electrical energy through the air when an arcing fault occurs between phase-to-phase, phase-to-neutral, or phase-to-ground conductors. An arc flash gives off thermal radiation (heat) and bright, intense light. Temperatures have been recorded as high as 35,000˚F. This extreme temperature melts and vaporizes metals and can ignite clothing and cause fatal burns as far as 10 feet away. The Arc flash analysis can be performed to find Arcing current, Incident energy, Hazard Risk Category (HRC) and Personal Protective Equipment (PPE) requirements in an electrical system as per the IEEE 1584-2002a and NFPA 70E standards.
Arc Flash – Bus Details
Bus No or Bus ID
This field specifies the bus ID or bus number for which the arc-flash data to be entered.
Equipment Type
This field is to choose the Equipment type. Equipment can be Open air, Switch Gear, MCC & Panels and others. To specify the Equipment enclosure type, select the options provided in Equipment type. In the UI there is a drop down box to select the equipment type and the description for the type is given on UI only.
Bus Gap
This field specifies the bus gap in mm. The user has to enter the value if the user defined field is checked. Otherwise the value will be taken automatically from standard look up tables based upon the bus voltage and equipment type selected.
X-Factor
This field corresponds to working distance factor. The user has to enter the value if the user defined field is checked. Otherwise the value will be taken automatically from standard look up tables based upon the bus voltage and equipment type selected.
Working Distance
This field specifies the working distance in mm. The user has to enter the value if the user defined field is checked. Otherwise the value will be taken automatically from standard look up tables based upon the bus voltage and equipment type selected
Series Elements
1.4.2 Two winding

MiP-PSCT Database Manager User Manual
Power Research and Development Consultants Pvt. Ltd. Page 18
transformer
Use menu option “Elements>Series Elements>Two Winding Transformer” to open the two winding transformer form.
Control Bus Number
Specify the control bus number, where voltage needs to be controlled by changing the tap settings. Select the bus from the list box provided which displays all the buses present in the database. In the transformer library if the tap mode is OLTC and the tap changing should be blocked select bus number as 0. Normally secondary bus is the voltage control bus.
From Breaker
From breaker rating field prompts for the MVA rating of the circuit breaker attached to the From side of the transformer. kA rating of the breaker will automatically update. If kA rating of the breaker is entered then MVA rating of the breaker will automatically computed.
Breaker exist or not exist can be selected and if exist and SLD show breaker option is selected then it appears on From side of the transformer in SLD
To Breaker
To breaker rating field prompts for the MVA rating of the circuit breaker attached to the To side of the transformer. kA rating of the breaker will automatically update. If kA rating of the breaker is entered then MVA rating of the breaker will automatically computed. Breaker exist or not exist can be selected and if exist and SLD show breaker option is selected then it appears on To side of the transformer in SLD
Owner No. : Select owner no for transformer. As per the owner no selction can be made in load flow customised report to get the transmission loss.
OverCurrent Relay: Overcurrent relay present on from side and to side of the transformer is displayed here. Click on relay button to open the selected relay form
Go TO>> button to open selected differential relay data form.
Restricted Earth Fault: Unit protection relay present on the transformer is shown here. Click Go To>> button to open Restricted earth fault relay data form.

MiP-PSCT Database Manager User Manual
Power Research and Development Consultants Pvt. Ltd. Page 19
Zig-zag Transformer: With this selection the two winding transformer is considered as earthing transformer
Set Tap position
Specify the set tap position. This is the tap number at which study is to be carried out. Transformer tap is provided on the From bus side only. The tap position can be determined by using compute. Click on compute select the voltage in pu, and click ok. This field will be updated with the computed tap
Nominal Tap Position
This field is automatically updated by calculating the nominal tap position from the available minimum and maximum tap number in the library referred.
Phase Shift Angle
Select this option to specify the Phase Shift angle in degrees between the primary and secondary voltage of the transformer. This field is used only for phase shifting transformer.
Primary Grounding Resistance
This field specifies the resistance between the star point of the primary coil of the transformer and the ground. If the p.u. value status is false, the resistance value is accepted in ohms. Otherwise the resistance value is in p.u. on the common MVA base. It is used only during zero sequence network calculations. The values are applicable only for star with neutral grounded transformers.
Primary Grounding Reactance
This field specifies the reactance between the star point of the primary coil of the transformer and the ground. If the p.u. value status is false, the reactance value is accepted in ohms. Otherwise the resistance value is in p.u. on the common MVA base. It is used only during zero sequence network
calculations. The values are applicable only for star with neutral grounded transformers.
Secondary Grounding Resistance
This field specifies the resistance between the star point of the secondary coil of the transformer and the ground. If the p.u. value status is false, the resistance value is accepted in ohms. Otherwise the resistance value is in p.u. on the common MVA base. It is used only during zero sequence network calculations. The values are applicable only for star with neutral grounded transformers.
Secondary Grounding Reactance
This field specifies the reactance between the star point of the secondary coil of the transformer and the ground. If the p.u. value status is false, the resistance value is accepted in ohms. Otherwise the resistance value is in p.u. on the common MVA base. It is used only during zero sequence network calculations. The values are applicable only for star with neutral grounded transformers.
Rating I and Rating II
An option to specify two more ratings apart from the nominal rating are provided. The other two ratings can be used to specify say Summer rating, winter rating. While performing load flow analysis user can select to which rating the line flows should be compared.
Compute
If the transformers are grounded through transformer, the impedances can be computed using the compute button Click on Compute, the following dialog box appears. Enter the primary voltage, secondary voltage, grounding resistance and grounding reactance. Click OK, to update the corresponding fields in the transformer form. Similarly, compute the secondary grounding resistance and
MiP-PSCT Database Manager User Manual
Power Research and Development Consultants Pvt. Ltd. Page 20
reactance if the secondary is grounded through earthing transformer.
Global Change
The tap of the transformer can be modified depending on the primary and secondary voltage levels or bus numbers. If voltage level is selected as 0.0 then all the voltage levels are considered for modifications.
Under load tap changer Control Block Name
Specify the control block name. Ensure that this FPB exists before executing transient stability. Under load tap changer controls can be edited in Free programmable blocks editor and can be attached to the transformer in this field.
Transformer Details
Click on Details to give detailed information of the transformer. The information of the transformer includes the following.
Transformer Name
Transformer Make
Serial Number
KVA rating
Year of Manufacture
Primary Voltage
Secondary voltage 1
Secondary Voltage 2
Primary Current
Secondary Current 1
Secondary Current 2
Frequency
Number of phases
Vector Group
Percentage Imp Volts
Insulation Class
Insulation level for HV
Insulation level for LV 1
Insulation level for LV 2
Cooling
Temperature rise over ambient 50 deg C for oil
Temperature rise over ambient 50 deg C for winding
Weight in Kgs (Core and Coil)
Weight in Kgs (oil)
Weight in Kgs (Transport)
Oil quantity in litres
Drawing Number
Customer Reference Number
Current Transformer – winding temperature Indicator
Current Transformer – Neutral current transformer 1
Current Transformer – Neutral Current Transformer 2
MiP-PSCT Database Manager User Manual
Power Research and Development Consultants Pvt. Ltd. Page 21
Winding temperature indicator – Make
Model
Serial Number
Range
Oil temperature indicator –Make
Model
Serial Number
Range
Buchholz – Make
Serial number
CM3
Model
Pipe diameter
Cable sizes – Primary
Secondary 1
Secondary 2
Switchgear feeding from
Switchgear feeding to
Taps – Minimum
Taps – Max
Specification
NGR – Make
NGR- Serial number
Resistance
Volts
Rated Current
Time rating
Temperature rise
Year
Cable
The following form appears. This data is only for information purpose. This is not used in any of the MiP-PSCT Study.

MiP-PSCT Database Manager User Manual
Power Research and Development Consultants Pvt. Ltd. Page 22
1.4.3 Transmission Line
Use menu option “Elements>Series Elements>Transmission Line” to open transmission line/cable form

MiP-PSCT Database Manager User Manual
Power Research and Development Consultants Pvt. Ltd. Page 23
Rating I and Rating II
An option to specify two more ratings apart from the nominal rating are provided. The other two ratings can be used to specify say Summer rating, winter rating. While performing load flow analysis user can select to which rating the line flows should be compared.
Line Length
Specify the length of the line in km. This field value is considered only, if p.u option is False. If p.u is True, this field is used for information purpose only.
From Breaker Rating
This field prompts for the MVA rating of the circuit breaker attached to the From side of the transmission line. kA rating of the breaker will automatically update. If kA rating of the breaker is entered then MVA rating of the breaker will automatically computed. If the breaker is exists and the show breaker SLD option is selected then the breaker will appear on From side of the line
A circuit breaker can be associated with the from side of the line. The circuit breaker can be selected from drop down list. Click on the From Breaker button to open the corresponding circuit breaker details.
To Breaker Rating
This field prompts for the MVA rating of the circuit breaker attached to the To side of the transmission line. kA rating of the breaker will automatically update. If kA rating of the breaker is entered then MVA rating of the breaker will automatically computed. . If the breaker is exists and the show breaker SLD option is selected then the breaker will appear on To side of the line. A circuit breaker can be associated with the To side of the line. The circuit breaker can be selected from drop down list. Click on the To Breaker button to open the corresponding circuit breaker details.
Owner No. : Select owner no for transformer. As per the owner no selction can be made in load flow customised report to get the transmission loss.
Line Protection Relay:
Over Current Relay: This dropdown list box shows over current relays provided on the selected line. Click on GoTo>> button to open the selected over current relay form
Distance Relay: This dropdown list box shows the distance relays present on the selected line... Click on Go To >> button to open the selected distance relay data form
Line Pilot:This dropdown list box shows the line pilot relays present on the selected line. Click on Go To>> button to open the selected line pilot relay data form
Line Differential:This dropdown list box shows the Line Differential protection relays present on the selected line on this line Click on Go To>> button to open the selected Line differential relay data form.
Arc fault details:
These are required for distance relay calculations.
The performance of distance protection for single-phase-to-earth faults is very important, because normally more than 70% of the faults on transmission lines are single phase-to-earth faults. At these faults, the fault resistance is composed of three parts: arc resistance, resistance of a tower construction, and tower-footing resistance.
Frequency of oscillation
Enter the initial Max and consecutive Maximum values. This data is consider in distance relay calculation
From Side Open / To Side Open
User can specify the line opening details by selecting the options fault / maintenance / TNOP/ Other reason. Selected option will display on the SLD on from side or To side of the line. This option is available only when the user selected NOP option of from side or To side.

MiP-PSCT Database Manager User Manual
Power Research and Development Consultants Pvt. Ltd. Page 24
Commission Status
User can give the details of line commissioning year, existing line (Commissioned) or proposed line to be commissioned. These data are not considered for computation.
SLD Notation
Line can be represented in SLD with the following notations
Line
Cable
Breaker
Isolator
Show breaker – SLD
On selection of this option, line in SLD is changed to Breaker.
Feed Data
Feeder Current or Power: Feeder current / power can be specified which will be considered in feed current simulation. Normally station peaks are given in Amperes. This will be useful for the feed current computation.
1.4.4 Series Reactor
Use menu option “Elements>Series Elements>Reactor” to open series reactor form.
1.4.5 Series Capacitor
Use menu option “Elements>Series Elements>Capacitor” to open series capacitors form.

MiP-PSCT Database Manager User Manual
Power Research and Development Consultants Pvt. Ltd. Page 25
1.4.6 Bus Coupler
Use menu option “Elements>Series Elements>Bus Coupler” to open bus coupler form.
CT & CT>>:
Select the current transformer from the drop down list. CT>> button will open the corresponding CT details form. This is required in the electromagnetic transient analysis to study the performance of CT transient response.
VCB :Vacuum circuit breaker Library will open when Go to Library button is clicked. This library provides detailed EMTP model for vacuum circuit breaker. VCB Library data required is shown in the following figure
FACTS
1.4.7 Flexible AC Transmission System (FACTS)

MiP-PSCT Database Manager User Manual
Power Research and Development Consultants Pvt. Ltd. Page 26
The direction of large AC system development is the transmission of large amount of power over long distances by high voltage transmission lines from remote power sources of load centres. Because of growing public impact on environmental policy, the building of new transmission facilities, in general, lags behind the increased needs of power transmission. As a consequence, some transmission lines are more loaded than was planned when they were built. With the increased loading of long transmission lines, the problem of transient stability after a major fault can become a transmission power limiting factor. In these cases, this factor may be considerably lower compared to their limiting factors. Power electronic equipment, including appropriate control, offers effective solution to this problem. Such equipment, including advanced control centres and communication links, is the basis of the FACTS.
There are three major facets of FACTS, they are shunt compensation, series compensation and phase angle regulation. Of these three, the series compensation is received much attention of late. Most of the work in this area has been focused to the study of thyristor controlled series compensator (TCSC).
Use menu options Elements >Series Elements >> FACTS to open FACTS form.
Control Block Name
Specify the control block name. Ensure that this FPB exists before executing transient stability. FACTS controls can be edited in Free programmable blocks editor and can be attached to the facts in this field.
1.4.8 Thyristor Controlled Series Capacitor
Thyristor Controlled Series capacitor (TCSC) is a power electronics based Flexible AC Transmission System (FACTS) device.
TCSCs are used to enhance the power flowing in a line by effectively compensating the reactance of the line. The difference between a conventional series capacitor and a TCSC is that a TCSC can dynamically vary its compensation whereas a conventional series capacitor has a fixed compensation. The basic conceptual TCSC module comprises a conventional fixed series capacitor, C1, a fixed capacitor in parallel, C2, with a thyristor-controlled reactor, L, as shown in Fig 1.1. However, a practical TCSC module also includes protective equipment.
To open this form, use menu option Elements-->Series Elements-->Facts->Thyristor Controlled Series Capacitor

MiP-PSCT Database Manager User Manual
Power Research and Development Consultants Pvt. Ltd. Page 27
TCSC No. – This field prompts for the identification number of the TCSC. This is a user defined number and should be unique for each TCSC. It cannot be 0.
TCSC Name – This field accepts the name of the TCSC for which the number has been specified.
This is a user defined name and should be unique for each TCSC.
kV Rating – Voltage rating of the TCSC.
P Ref – TCSC is generally used to enhance the power flow in transmission lines. This P Ref is the power flow desired through the transmission line in which TCSC is connected. Connecting a TCSC on transmission lines reduces the effective series reactance of the line which enables us to push more power through the line.
Tolerance – Tolerance value to check for TCSC convergence. It checks the TCSC power flows in the present iteration and compares with the flow in previous iteration. If the difference in power flows is less than this tolerance value TCSC power flow is converged.
Capacitive Min – TCSC offers minimum capacitive reactance when the parallel inductor is blocked from service. If the user wants to compute the limits then enter the values of XL, XC1, XC2 and its corresponding MVA ratings and click on compute button. The reactance limits will be automatically computed.
Capacitive Max – TCSC offers maximum capacitance when the parallel inductor reactance is just slightly greater than the parallel capacitor reactance. Generally TCSC is not operated in the region
between Capacitive and Inductive maximum since it will cause parallel resonance. If the user wants to compute the limits then enter the values of XL, XC1, XC2 and its corresponding MVA ratings and click on compute button. The reactance limits will be automatically computed.
Inductive Min – TCSC offers minimum inductive reactance when the parallel inductor is completely in service. If the user wants to compute the limits then enter the values of XL, XC1, XC2 and its corresponding MVA ratings and click on compute button. The reactance limits will be automatically computed.
Inductive Max – TCSC offers maximum inductance when the parallel inductor reactance is just slightly less than the parallel capacitor reactance. Generally TCSC is not operated in the region between Capacitive and Inductive maximum since it will cause parallel resonance. If the user wants to compute the limits then enter the values of XL, XC1, XC2 and its corresponding MVA ratings and click on compute button. The reactance limits will be automatically computed.
XL – This field accepts the value of the parallel inductor’s reactance i.e. when the inductor is fully in service. This value needs to be entered only if user wants to compute the TCSC reactance limits.
XC1 – This field accepts the value of the series capacitor’s reactance. Since it is a fixed capacitance it is always in service. This value needs to be entered only if user wants to compute the TCSC reactance limits
XC2 – This field accepts the value of the parallel capacitor’s reactance. Since it is a fixed
capacitance it is always in service. This value needs to be entered only if user wants to compute the TCSC reactance limits
XL MVA – The MVA rating of the parallel inductor. This value needs to be entered only if user wants to compute the TCSC reactance limits
XC1 MVA – The MVA rating of the series capacitor. This value needs to be entered only if user wants to compute the TCSC reactance limits
XC2 MVA – The MVA rating of the parallel capacitor. This value needs to be entered only if user wants to compute the TCSC reactance limits
Compute – Click this button after entering the values of XL, XC1, XC2, XL MVA, XC1 MVA and XC2 MVA to compute the TCSC Capacitive min. max. and Inductive min. max. limits.
Not Computed – This flag has to be checked if the user does not want to compute the controllable inductive reactance value. When the user does not want to compute the TCSC reactance limits this flag has to be checked.
Computed – This flag has to be checked if the user wants to compute the controllable inductive reactance value and view in the output report. This flag has to be checked only when the user wants

MiP-PSCT Database Manager User Manual
Power Research and Development Consultants Pvt. Ltd. Page 28
to compute the TCSC reactance limits by entering the values of XL, XC1, XC2, XL MVA, XC1 MVA and XC2 MVA.
1.4.9 Unified Power Flow Controller
A unified power flow controller (UPFC) is a combination of a static synchronous compensator (STATCOM) and a static synchronous series compensator (S3C) which are coupled via a common dc link, to allow bidirectional flow of real power between the series output terminals of the S3C and the shunt output terminals of the STATCOM, and are controlled to provide concurrent real and reactive series line compensation without an external electric energy source. The UPFC, by means of angularly unconstrained series voltage injection, is able to control, concurrently or selectively, the transmission line voltage, impedance, and angle or, alternatively, the real and reactive power flow in the line. The UPFC may also provide independently controllable shunt-reactive power compensation.
It consists of two identical voltage-source inverters: one in shunt and the other one in series with the line; the general scheme is illustrated in Figure 3.1. Two inverters, namely shunt inverter and series inverter, which operate via a common DC link with a DC storage capacitor, allow UPFC to independently control active and reactive power flows in the line as well as the bus voltage. Active power can freely flow in either direction between the AC terminals of the two inverters through the DC link. Although, each inverter can generate or absorb reactive power at its own AC output terminal, they cannot internally exchange reactive power through DC link. The VA rating of the
injected voltage source is determined by the product of the maximum injected voltage and the maximum line current at which power flow is still provided.
The shunt inverter provides local bus voltage control when operated by itself as a STATCOM. When operated in conjunction with the series inverter, the shunt inverter has two functions:
To control bus voltage by reactive power injection to the power system
To supply active power to the series inverter via the DC link for series flow control.
The series inverter, on the other hand, provides line power flow control by injecting an AC voltage with controllable magnitude and phase angle at the power frequency, in series with the line via an insertion transformer. This injected series voltage is, in effect, a synchronous series AC voltage source, which provides active series compensation for line voltage control and angle regulation through the transmission line current. The transmission line currents flow through this voltage sources resulting in active and reactive power exchange between the inverter and the AC system. The active power exchanged at the series AC terminal is converted by the inverter into DC power that appears at the DC link as positive or negative active power demand and transfer to the other converter located at the other side of the line.
To open this form, use menu option Elements-->Series Elements-->Facts->Unified Power Flow Controller
MiP-PSCT Database Manager User Manual
Power Research and Development Consultants Pvt. Ltd. Page 29
UPFC No.: This field gives the number of the device.
UPFC Name: This field gives the name of the device.
Tolerance: UPFC tolerance is the maximum real power error in PU on the given MVA base. This is used to check the UPFC device’s convergence. For this device, tolerance is the sum of real power injection in the shunt and series converters. The amount of real power taken from the shunt converter is given to the series converter, assuming no real power losses in the converters. Generally an acceptable value of tolerance is 0.001 PU.
P Ref: The value of MW power to be transferred through the UPFC, and thereby through the line to which the UPFC is connected.
Q Ref: The value of Mvar power to be transferred through the UPFC, and thereby through the line to which the UPFC is connected.
V Ref: The value of voltage in p.u. to be set to the UPFC From bus.
Series Converter Reactance:
The model of UPFC demonstrated here has a series connected converter whose reactance alone is considered. Series converter’s resistance is assumed to be negligible. The reactance value cannot be ‘0’ and its ranges between 0.01-0.2 p.u.
Series Converter Min. Voltage:
The series converter injects or absorbs some voltage in series with the line. The minimum voltage it must inject/absorb is specified in this field.
Series Converter Max. Voltage :
The series converter injects or absorbs some voltage in series with the line. The maximum voltage it must inject/absorb is specified in this field.
Shunt Converter Reactance:
The model of UPFC demonstrated here has a shunt connected converter whose reactance alone is considered. Shunt converter’s resistance is assumed to be negligible. The reactance value cannot be ‘0’ and it ranges between 0.01-0.2 p.u.
Shunt Converter Min. Voltage:
The minimum voltage that the shunt converter must have is specified in this field. It can generally be 0.9 p.u. for 1.0 p.u. of reference voltage.
Shunt Converter Max. Voltage:
The maximum voltage that the shunt converter must have is specified in this field. It can generally go upto 1.1 p.u. for 1.0 p.u. of reference voltage.
UPFC Check-Limit: o If the user does not check this box, the UPFC series and shunt converter’s voltage limits are not
taken into account, and the reference powers ‘P-REF’ and ‘Q-REF’ will flow through the line even if voltage limit violations occur.
o If the user checks this box, the UPFC voltage limits will be taken into account, and the reference powers ‘P-REF’ and ‘Q-REF’ will flow through the line only if there are no voltage limit violations. If there are limit violations the ‘P-REF’ and ‘Q-REF’ will be reset to best possible values, ensuring voltage limit violations are avoided.
1.4.10 Static Phase Shifter
A Static Phase Shifter (SPS) is basically a phase shifting transformer adjusted by thyristor switches to provide a rapidly variable phase angle. In general, phase shifting is obtained by adding a perpendicular voltage vector in series with a phase. This vector, which can be made variable using a number of power electronics topologies, is derived from the other two phases via a shunt connected transformer. Thus by varying the phase angle of the system, power flow through the network can be controlled.
To open this form, use menu option Elements-->Series Elements-->Facts->Static Phase Shifter.

MiP-PSCT Database Manager User Manual
Power Research and Development Consultants Pvt. Ltd. Page 30
SPS No. – This field prompts for the identification number of the SPS. This is a user defined number and should be unique for each SPS. It cannot be 0.
SPS Name – This field accepts the name of the SPS for which the number has been specified. This is a user defined name and should be unique for each SPS
Tolerance – Tolerance value to check for SPS convergence. It checks the SPS power flows in the present iteration and compares with the flow in previous iteration. If the difference in power flows is less than this tolerance value SPS power flow is converged.
Phase shifter reactance – This field accepts the value of the SPS reactance.
Phase Shift Angle Limits - The minimum and the maximum angle limits of SPS in degrees
Shunt Elements
1.4.11 Reactor
Use menu option “Elements>Shunt Elements>Reactor” to open shunt reactor form. Connected to
To specify position where the reactor is placed. Three options are provided
At bus,
At From end of the line
At To end of the line.
Select the Respective device ID from the list box. In the list box, bus numbers are displayed if the selected option is Bus else all line numbers are listed.
1.4.12 Capacitor
Use menu option “Elements>Shunt Elements>Capacitor” to open shunt capacitor form.

MiP-PSCT Database Manager User Manual
Power Research and Development Consultants Pvt. Ltd. Page 31
1.4.13 Generator
Use menu option “Elements>Shunt Elements>Generator” to open the generator from.
Schedule Number
The user defined number to differentiate different generation schedules.
Bus Number
In practice always generator output is fed to generator transformer through bus ducts, so only one generator can be connected to a bus. If any attempt is made to connect more than a generator at a bus, a message box is displayed that generator already exists.
Number of Generators in Parallel
This field is to specify the number of units connected in parallel.
For example if G1, G2 and G3 are of same rating and connected to generator transformer (G.T) of same rating, then mention no. of generators in parallel as 3. And corresponding GT’s in parallel should be 3.
Capability Curve Number
This field is to specify the capability curve number, which has to be referred. This is a cross-reference between the generator and capability curve library. If this field is zero, then the minimum and maximum reactive power limits given in the generator data form are considered. Otherwise the reactive power limits are considered from capability curve data referred.
Specified Voltage
This field is to enter the specified voltage magnitude at the generator bus in kV. This field is updated in add mode to the rated voltage of the bus to which the generator is connected i.e., by default the specified voltage is 1.0 p.u. This can be altered to desired value at any instant of time while conducting studies.
Scheduled Power in MW
This field is used to specify the scheduled real power generation in MW. If this value is less than the real power maximum specified, in load flow scheduled power is considered as maximum real power limit.
Reactive Power Minimum
This field is used to specify the minimum reactive power limit in MVAR. Minimum reactive

MiP-PSCT Database Manager User Manual
Power Research and Development Consultants Pvt. Ltd. Page 32
Co
C2P2
C1P
P
Poperating
Cost in Rs.
power limits on the generator are imposed because of the stability constraints.
Reactive Power - Maximum
This field is used to specify the maximum reactive power limit in MVAR. Maximum reactive power limits on the generator are imposed because of the thermal constraints.
These values are by default given using the corresponding generator library. Using the MW and MVA ratings in the library, power factor is calculated. Then MVA* sin (power factor angle) is taken as reactive power maximum value and placed in this field.
Reactive power limits for generator buses can be taken as:
Qmax = 50% of the active generation
Qmin = -50% of the Qmax
Real Power - Minimum
This field is to specify the minimum scheduled real power for the generator in MW. This value is considered in the load flow studies to apply minimum generation constraints.
Real Power – Maximum
This field is to specify the maximum scheduled real power for the generator in MW. If this value is less than the scheduled power, then generator is allowed to generate up to this limit only.
Cost Coefficient C0
This field is to specify the constant cost coefficient C0 in rupees for the generator. This cost is independent of generation.
Cost Coefficient C1
This field is to specify the cost coefficient C1 in rupees per MW for the generator. This cost is directly proportional to the MW generated.
Cost Coefficient C2
This field is to specify the cost coefficient C2 in rupees per MW for the generator. This cost is directly proportional to the square of the generated MW. The generator cost Cure is as shown in the figure. These cost coefficients are of importance in economic dispatch and hence used in optimal power flow analysis.
Neutral Grounding Resistance
This field is to specify the resistance between the neutral point of the generator and the ground in ohms.
Neutral Grounding Reactance

MiP-PSCT Database Manager User Manual
Power Research and Development Consultants Pvt. Ltd. Page 33
This field is to specify the reactance between the neutral point of the generator and the ground in ohms.
The grounding resistance and reactance are used in the unbalanced fault calculation.
Participation factors
This field is to specify the participation factor for the generator. Total area interchange error is distributed among the generators depending on the participation factor. This generator participation factor is with reference to the generator regulation characteristics. The sum of all participation factors should be 1.This is considered in flat frequency control option during load flow analysis.
Bias Setting
This field is to specify the bias factor setting for automatic generation control regulator, which is a constant for area load - frequency characteristic.
Select
User has a choice to select the element as grid / utility or Generator. If the choice is utility then only the required fields will be activated and user has to provide data in those fields. If it is a generator all the data are required.
Model Type
This field is to specify the modelling type used for the generator. The different generator models that package supports are:
Infinite Bus modelling (model type 1)
Transient modelling (model type 2)
Sub-transient modelling (model type 3)
The user can select any model for the generator depending on which analysis has to be performed.
If it is utility then model type is to be Infinite bus modelling.
AVR number
This field is to specify reference number of the AVR library. This is a cross-reference between the generator data and the AVR library. The AVR libraries present in the database are listed in the list box for easy selection. If no AVR is connected to the generator, select zero from list.
AVR FPB Name
This field is to specify the filename of the AVR FPB model to be used in transient stability study. By default, this field is blank. To connect any AVR drawn using free programmable blocks editor, give the file name with fpd extension as parameter in this field. If this customized AVR is to be connected, then standard AVR is ignored. Program prompts user that it is going to ignore the standard AVR if OK is clicked. Otherwise standard AVR is considered.
Turbine Governor Number
This field is to specify reference number of the Turbine Governor library. This is a cross-reference between the generator data and the Turbine Governor library. The Turbine Governor libraries present in the database are listed in the list box for easy selection. If no Turbine Governor is connected to the generator, select zero from list.
Turbine Governor FPB Name
This field is to specify the filename of the Turbine Governor FPB model to be used in transient stability study. By default, this field is blank. To connect any Turbine Governor drawn using free programmable blocks editor, give the file name with fpd extension as parameter in this field. If this customized Turbine Governor is to be connected then standard Turbine Governor is ignored. Program prompts user that it is going to ignore the standard Turbine Governor if OK is clicked. Otherwise standard Turbine Governor is considered.
Calculate

MiP-PSCT Database Manager User Manual
Power Research and Development Consultants Pvt. Ltd. Page 34
If the generators are grounded through transformer, the impedances can be computed using the calculate button
Click on Calculate, the following dialog box appears.
Enter the primary voltage, secondary voltage, grounding resistance and grounding reactance. Click OK, to update the corresponding fields in the generator form.
Global Change
Click on Global Change, to change the modelling of generator to a different model.
Unit Protection
Generator and generator transformer units are subjected to a number of possible hazards against which protection should be provided. Otherwise, these problems may result in severe damage and long outages for repairs.
Following conditions have to be detected, selectively recognised and quickly cleared by the protection.
Internal faults
Abnormal service conditions
External faults (as back-up protection)
The hazards and problems considered are Internal Faults viz Phase-phase faults in the winding, Phase-ground faults in the winding and ground faults in the rotor and abnormal conditions like loss of excitation, over load, over voltage, under & over frequency, unbalance currents, inadvertent energization, out of step (loss of synchronism) and loss of prime mover (motoring).
Output file
GENERATOR PROTECTION REPORT
--------------------------------------------------------------------
Base MVA : 247.000
Generator Number : 1
Generator Name : Gen1
Generator MVA rating : 247.000
Generator Rated MW : 210.000
Generator rated voltage in kV : 11.000
Power factor : 0.850
Primary CT rating in A : 15000.000
Secondary CT rating in A : 5.000
Primary PT rating in kV : 11.000
Secondary PT rating in V : 110.000
Xd : 2.210
Xd' : 0.266
GT Rating in MVA : 247.000
GT Impedance in pu : 0.140
GT Secondary Voltage in kV : 220.000
Grid 3 phase Fault Level in MVA : 5000.000
Grid SLG Level in MVA : 5000.000
Critical Clearing time in seconds : 0.400
Primary Relay Operating time in seconds : 0.300
----------------------------------------------------------------
Type of Relay Settings
----------------------------------------------------------------
Instantaneous
Voltage Controlled Over Current Relay
----------------------------------------------------------------
Generator Rated Current in A : 12964.138
----------------------------------------------------------------

MiP-PSCT Database Manager User Manual
Power Research and Development Consultants Pvt. Ltd. Page 35
Generator Instantaneous Setting
----------------------------------------------------------------
Fault Current from Generator to Grid fault(A) : 31931.374
Instantaneous Setting I>> referred to secondary (A) :10.644
Inst Setting Multiplier I>> : 3
Inst Setting Time T>> (secs) : 0.300
Instantaneous Setting I>>> referred to secondary (A): 13.837
Inst Setting Multiplier I>>> : 3
Inst Setting Time T>> : Inst
----------------------------------------------------------------
Voltage Controlled Relay Setting
----------------------------------------------------------------
Plug Setting (A) : 14400.00
Plug Setting (A) referred to secondary : 4.800
Plug Setting Multiplier : 0.960
Time Multiplier Setting : 0.42
Voltage in pu : 0.600
1.4.14 Wind Generator Data
Use menu option “Elements>Shunt Elements>Wind Generator” to open the wind generator form.
Wind Turbine Generator is a non-conventional generator. A basic wind turbine generator will have an aerodynamic system to convert wind energy to mechanical energy, and an Electrical System to convert mechanical energy to electrical energy. The entire system includes a turbine, electric machine, aerodynamic-mechanical and electrical control systems, converter-inverter model in some cases. This wind turbine generator is very much different from conventional generators as the stability and controllability characteristics are quite different for a wind turbine generator. The real power generation of a wind turbine will be basically dependent on the site climatic conditions like wind speed, air density, etc. The reactive power generation of a wind turbine is basically dependent on the terminal voltage of the generator, as most of the wind generators are having induction machines. The wind turbine generator cannot be represented as a PV or Vδ bus. It has to be represented as a PQ bus but the effect of other factors like wind speed, site air density, grid bus voltage, etc. The detailed model is developed for the purpose of power system simulation studies with
Figure1.1: Schematic diagram Aerodynamic-mechanical-electric system of a wind turbine generator
Terminology and Definitions in MiP-PSCT
Fields present in Wind Generator Data Window:

MiP-PSCT Database Manager User Manual
Power Research and Development Consultants Pvt. Ltd. Page 36
WT No. – This field prompts for the identification number of the Wind Turbine generator. This is a user defined number and should be unique for each wind turbine generator. It cannot be 0.
WT Name – This field accepts the name of the Wind Turbine generator for which the number has been specified. This is a user defined name and should be unique for each Wind Turbine generator.
Bus No. – The bus number to which the Wind Turbine generator is connected. The bus ID should be present in bus data.
Real Power – The real power generation of the wind turbine. This option will be enabled only if simple model is selected.
Reactive Power – The reactive power generation of the wind turbine. This option will be enabled only if simple model is selected.
Model Type – If the user selects Simple Model Wind Turbine will be of simple power injection model. If the user selects Detailed Model Wind Turbine will be detailed model to calculated power generation from field data.
No. of Turbines – This field specifies the number wind turbines present. If this number is more than 1 it is considered as wind farm/park.
Manufacturer Ref. No. – This field refers to manufacturer reference No.
De-Rated MVA –De-rated MVA rating of the Wind Turbine generator.
Operating Power Factor – This field specifies the operating power factor of the Wind Plant.
Real Power Generation Min –This field specifies the minimum real power generation of individual Wind Turbine.
Real Power Generation Max –This field specifies the maximum real power generation of the Wind Plant/Turbine.
Total Reactive power compensation details
Reactive Power Generation Min –This field specifies the minimum reactive power generation of the Wind Plant
Reactive Power Generation Max –This field specifies the maximum reactive power generation of the Wind Plant
No of steps – This field specifies the No. of steps in which reactive power is controlled.
Average Wind Speed – This field specifies the average wind speed at the plant. Units will be m/s.
Air Density – This field specifies the air density at the plant. Units will be kg/m3.
Fields present in Wind Generator Library Window:

MiP-PSCT Database Manager User Manual
Power Research and Development Consultants Pvt. Ltd. Page 37
Reference No. – This field refers to the reference No. of Wind Turbine model.
Manufacturer Name – This field refers to the particular manufacturer of the Wind Turbine.
MVA Rating – MVA rating of the Wind Turbine generator.
MW Rating – MW rating of the Wind Turbine generator.
kV Rating – Voltage rating of the Wind Turbine generator.
No. of Poles in Generator –This field takes the data of No. of poles in the machine. This cannot be 0 or odd number. The data in this field can be only even number.
Turbine Rated Speed – This field takes the data of Synchronous speed of the machine. If system frequency is greater than the product (Synchronous speed, No. of poles, Gear box ratio)/120 then the data error message will pop up.
Gear Box Ratio – Gear box ratio of the mechanical system need to be entered in this field. This value can be an integer or decimal. But not be 0.
Turbine Diameter – Turbine diameter is to be entered in this field in meters.
WT1 –If user selects this field Wind turbine model 1 will be considered.
WT2 – If user selects this field Wind turbine model 2 will be considered.
WT3 – If user selects this field Wind turbine model 3 will be considered.
WT4 – If user selects this field Wind turbine model 4 will be considered.
Stator Resistance in R1 (p.u) – This field specifies the stator resistance in p.u... This field will be enabled for WT1 to WT3.
Stator Reactance in X1 (p.u) – This field specifies the stator reactance in p.u. This field will be enabled for WT1 to WT3.
Rotor Resistance in R2 (p.u) – This field specifies the rotor resistance in p.u. This field will be enabled for WT1 to WT3.
Rotor Reactance in X2 (p.u) – This field specifies the rotor reactance in p.u. This field will be enabled for WT1 to WT3.
Magnetizing branch Reactance in Xm (p.u) – This field specifies the mutual coupling reactance in p.u. This field will be enabled for WT1 to WT3.
Variable Rotor Resistance in p.u – This field specifies the rotor resistance in p.u. This field will be enabled for WT2.
Cut in Speed – Turbine cut in speed is to be entered in this field.
Cut out Speed – Turbine cut out speed is to be entered in this field.
Power Curve –This field refers to power curve reference No. some reference power curve need to be specified for all four wind turbine models.
Operating Mechanical Power Vs Operating Rotor Speed – This field refers to operating mechanical power Vs operating rotor speed reference No. some reference power curve need to be specified for WT2 and WT3 wind turbine models.
Operating Mechanical Power Vs Operating Wind Speed – This field refers to operating mechanical power Vs operating rotor speed reference No. some reference power curve need to be specified for WT2 and WT3 wind turbine models.
Turbine Inertia (Ht) – Turbine inertia is to be entered in this field.
Generator Inertia (Hg) – Generator inertia is to be entered in this field.
Damping Constant (D) – Damping constant is to be entered in this field.
Stiffness Constant (K) – Stiffness constant is to be entered in this field.
Fields to be present in Wind Generator Curves Library (Window):

MiP-PSCT Database Manager User Manual
Power Research and Development Consultants Pvt. Ltd. Page 38
Library No. – This field refers to the reference No. of Wind Turbine model.
Library Name – This field refers to a library name for reference to a particular Wind Turbine.
Formula 1 – When user selects this button the power curve will be taken in the form of formula type 1. Total 12 variables starting from C0 to a1 will enable. User need to enter data in these fields.
Formula 2 – When user selects this button the power curve will be taken in the form of formula type 2. Total 25 rows will come in the grid. User need to enter data in these fields.
Curve Data – When user selects this button the power curve will be taken in the form of data. Two columns will come in the grid. One wind speed and other mechanical power generation in p.u. user need to enter data in these fields for 20 rows.
Detailed Curve – When user selects this button the file browse option will be enabled.
Mechanical Power Vs Wind Speed – When user selects this button the power curve will be taken in the form of mechanical power Vs wind speed.
Electrical Power Vs Wind Speed – When user selects this button the power curve will be taken in the form of Electrical power Vs wind speed.
Losses (%) – This field refers to losses.
1.4.15 Solar PV Data
Solar Power is the conversion of sunlight into electricity, either directly using Solar Photovoltaic systems or indirectly using Solar Thermal systems (Concentrated solar power)
Solar Power technologies classification:
Solar Thermal
Solar Photovoltaic
This report mainly focuses on Solar Photovoltaic as the Solar Thermal generation is similar to conventional thermal generation.
Solar Thermal
Solar thermal power plants produce electricity by converting the solar radiation into high temperature heat using mirrors and reflectors. The collectors are referred to as the solar-field. This energy is used to heat a working fluid and produce steam. Steam is then used to rotate a turbine or power an engine to drive a generator and produce electricity All Concentrated Solar Plants are based on four basic essential systems which are collector, receiver (absorber), transport/storage and power conversion. Parabolic Trough, Solar towers, Parabolic Dishes and Linear Fresnel Reflectors are the four main technologies that are commercially available today. The details are given below:
i. Parabolic Trough ii. Solar Towers iii. Parabolic Dish iv. Linear Fresnel Reflectors

MiP-PSCT Database Manager User Manual
Power Research and Development Consultants Pvt. Ltd. Page 39
Solar Photovoltaic
Photovoltaics (PV) is a method of converting solar energy into direct current electricity using semiconducting materials that exhibit the photovoltaic effect. A photovoltaic system employs solar panels composed of a number of solar cells to supply usable solar power. Power generation from solar PV has long been seen as a clean sustainable energy technology which draws upon the planet’s most plentiful and widely distributed renewable energy source – the sun. The direct conversion of sunlight to electricity occurs without any moving parts or environmental emissions during operation.
Solar PV is now, after hydro and wind power, the third most important renewable energy source in terms of globally installed capacity. More than 100 countries use solar PV. Installations may be ground-mounted (and sometimes integrated with farming and grazing) or built into the roof or walls of a building (either building-integrated photovoltaics or simply rooftop).
Power system is a complex network of thousands of buses with generators, transformers, transmission lines, compensating devices, and other auxiliary equipment’s required to assure its safe and reliable operation. The overall system thus consists of multiple generating sources and several layers of transmission networks. This provides a high degree of structural redundancy that enables the system to withstand unusual contingencies without service disruption to the consumers. Power system planners and operators require wide-ranging data analysis and computer model simulation to understand; the behavior of complex power system under contingency situations to avoid cascaded outages and; to evaluate the ability of power system to withstand such events. Computer simulation helps system planners and/or operators to develop strategies to mitigate the potential problem. The response obtained from the model simulation studies indicates the vulnerability of the system against the potential power system threats. In general a system model is needed to reasonably represent the actual equipment performance in simulations.
Terminology and Definitions in MiP-PSCT
Number : This field prompts for the identification number of the solar PV plant. This is a user defined number and should be unique for each solar PV plant. It cannot be 0. Name :This field accepts the name of the solar PV plant for which the number has been specified. This is a user defined name and should be unique for each solar PV plant.
Bus No. – The bus number to which the solar PV plant is connected. The bus ID should be present in bus data.
Model Type – If the user selects Simple Model, Solar generator will be of simple power injection voltage controlled type. If the user selects Detailed Model, Solar Generator can be modeled in detail considering the actual field data and it is of PQ type.
Schedule Number : User defined number to differentiate different generation schedules
Plant Rating – This field specifies MVA rating of Solar PV plant if simple model is selected.
P-Specified – This field specifies real power generation of the solar PV plant if simple model is
selected. Reactive Power output is calculated either based on constant power factor or based on voltage control mode. Constant Power factor mode: User specified power factor. Default value is 0.95
Voltage Control mode: Based on voltage control mode, user has to enter V-specified, Qmin and
Qmax. PV plant will be considered as a conventional generator in voltage control mode.

MiP-PSCT Database Manager User Manual
Power Research and Development Consultants Pvt. Ltd. Page 40
Following data is required for the detailed solar PV plant model
Solar irradiance Data: Value of Solar irradiance on tilted plane can be entered directly or it will be
calculated internally. Inputs required for the computation of solar irradiance on horizontal plane are GHI (Global Horizontal Irradiance), DHI (Diffuse Horizontal Irradiance) and DNI (Direct Normal Irradiance) in W/m2.
Mounting Type data:
PV modules must be mounted on a structure, to keep them oriented in the correct direction and to provide them with structural support and protection. Mounting structures may be fixed or tracking.
For fixed mounting systems the PV modules will be at fixed tilt angle (angle from horizontal plane) and fixed orientation angle (angle of PV module relative to south). The tilt angle and orientation is generally optimized for each PV power plant according to location. For Indian sites, the optimum tilt angle is generally between 10
o and 35
o, facing true south. Fixed tilt mounting systems are simpler,
cheaper, and have low maintenance requirements than tracking systems.
Input for this is module tilt angle in degrees and module azimuth angle in degrees.
Time and Location data
For all the solar PV plants present in the database should have same time instant given by the user. This requires data as latitude, longitude, standard meridian in degree and minutes. Time should be in Hour and minute.
Cell Temperature: Measured cell temperature can be entered directly or it can be calculated
internally based on NOCT (Normal Operating Cell Temperature). For the computation of cell temperature based on NOCT required inputs are given in the following table.
Ambient temperature : By default it is 15degre Centigrade.
Cell temperature data based on NOTC
Parameters and Description units
NOCT temperature 0C
NOCT condition – Open Circuit / Max Power No unit
Alpha - product of transmittance and absorption No Unit

MiP-PSCT Database Manager User Manual
Power Research and Development Consultants Pvt. Ltd. Page 41
PV Array Data
Number of modules in a string and no. of strings in an array is to be entered by the user to compute maximum power in an array.
Inverter
Inverter details are to be entered in this section Default data is given in the following table.
Solar PV Library
Based on one diode Model
One Diode Representation of PV cell
Typically a solar cell can be modelled by a current source and an inverted diode connected in parallel to it. It has its own series and parallel resistance. Series resistance is due to hindrance in the path of flow of electrons from n to p junction and parallel resistance is due to the leakage current.
In this model we consider a current source (IL) along with a diode and series resistance (RS) and shunt resistance (Rsh) in parallel as shown in figure1.
Parameters and Description units
D.C side power rating (PDC) MW
A.C side power rating (MVAinv) MVA
A.C side voltage V
Efficiency (efficiencyinv) %
Number of Inverters No unit

MiP-PSCT Database Manager User Manual
Power Research and Development Consultants Pvt. Ltd. Page 42
Figure 1 : One diode model of a PV cell
Based on Name plate details
Inputs required for computation of Maximum power from MPPT nameplate details are tabulated below
Parameters and Description units
PV module rating (Pmax,ref) W
Efficiency of PV module %
Maximum power point voltage (Vmpp) V
Maximum power point current (Impp) A
Temperature co-efficient of power (β) % / º C
Temperature co-efficient of voltage (Ctv) V / º C
1.4.16 Motor
Use menu option “Elements>Shunt Elements>Motor” to open motor form.
The motor load is considered in load flow as shunt impedance. For short circuit studies, motor is modelled as generator with impedance arrived taking unity slip. In the stability study, all the motor data are used.
Winding Type
This field is to specify the winding connection of motor. Three options of winding connections are provided namely, Star connected, Star grounded and Delta. The user can select any of the above winding connection depending upon the motor winding. Generally the motors are delta connected.
Neutral Resistance
This field is to specify the neutral resistance of the motor in ohms. This is applicable for star grounded type winding connection.
Neutral Reactance
This field is to specify the neutral reactance of the motor in Ohms. The neutral resistance and reactance are of importance while considering the fault analysis.

MiP-PSCT Database Manager User Manual
Power Research and Development Consultants Pvt. Ltd. Page 43
Slip
Specify the slip of the motor in this field. Slip is given by the difference between rated speed and operating speed expressed as percentage of rated speed of the motor. The motor starting on no load condition the slip is 1.0. If motor is starting with loaded condition, then the actual value of the slip should be given. For motor starting studies, give motor slip as 1.0 and conduct transient stability studies.
Starting Mode
Auto-Transformer Starting
Resistance Starting
Star-Delta Starting
Direct Online
Auto Tap Value
This is the initial autotransformer tap position in p.u. This field comes into picture only for the motor starting with autotransformer.
Slip
This field is to specify the slip at which auto Tap is cut off.
Time
This field is to specify the time at which the starter is cut off.
R-Start
For star-delta starting mode, the initial resistance in pu.
R-End
For star-delta starting mode, the final resistance in pu.
Formula or Characteristic: If the formula is selected the motor load is considered using the C0,C1, C2 constants otherwise it will be taken as characteristics provided by the user
Motor Torque
Torque Constant
This field is to specify the operating torque of the motor. The Motor torque at any speed is given by the relation:
T = Tc (A + B N + C N2) Where, Tc is the rated torque (power) in MW.
Constant Torque Component (A): Specify the torque constant value, which is independent of the motor speed.
Torque Component Proportional to Speed (B): Specify the torque constant value, which is directly proportional to the motor speed.
Torque Component Proportional to Square of Speed (C): Specify the torque constant value, which is directly proportional to the square of the motor speed.
Sum of all these three constants (A, B, C) should be 1.0.
Motor Load Library
For C1,C2,C3 Constants can be stored for different motors in load library as shown in below. The stored library selection can be selected by the user which updates the constants data.
Motor Details
Click on Details>> to enter detailed information for Motor. This is for information only. This data is not used in any of the MiP-PSCT study. The following form appears

MiP-PSCT Database Manager User Manual
Power Research and Development Consultants Pvt. Ltd. Page 44
The motor details include --
Tag Number
Driven Equipment
Duty
Manufacturer Name
Type
Frame designation Mounting
KW output
Voltage
Full load current in amperes
Full load speed
Enclosure
Mounting
Insulation class
Ambient temperature/temperature rise
Applicable code
Full load Torque
Starting torque as % full load torque
Percentage efficiency at Full Load
Percentage efficiency at ¾ full load
Rotation viewed from NDE
Bearing type/Number
Weight in KG
Lubrication
Coupling pulley
Cable Size
Phase/Connection/No of Terminals
Frequency
Number of poles
Locked rotor current in amperes

MiP-PSCT Database Manager User Manual
Power Research and Development Consultants Pvt. Ltd. Page 45
Stall time HOT (100% Rated Voltage)
Stall time HOT (110% Rated Voltage)
Stall time Cold (100% Rated Voltage)
Stall time Cold (110% Rated Voltage)
Thermal Time constant for Stator
Thermal Time constant for rotor
Power factor at full load
Power factor at ¾ full load
Pull out torque
Pull up torque
Space heater watts/volts
GD sq of load
GD sq of motor
Starting time in sec at 100% rated voltage
Starting time in sec at 80% rated voltage
1.4.17 Load
Use menu option “Elements>Shunt Elements>Load”to open load data form.
Real power in MW
This field is to specify the real power of the load in MW.
Reactive power in MVAR
This field is to specify the reactive power of the load in MVAR.
Power Factor

MiP-PSCT Database Manager User Manual
Power Research and Development Consultants Pvt. Ltd. Page 46
The power factor is computed if the MW and MVAR are given. If the power factor is entered, Mvar for the given MW is computed.
MVAR Compensation
This field is to specify the reactive power compensation provided at the bus. It is the fixed compensation at the bus. (+ve for capacitive and -ve for reactive). For planning studies, fixed compensation can be given. However, if the shunt capacitor value is known, then specify the compensation as shunt capacitor so as to have realistic representation. With shunt capacitor representation, the compensation MVAR value changes with respect to voltage.
Minimum Compensation in MVAR
This field is to specify the minimum reactive power compensation for the load. Reactive power compensation is limited to the minimum values for violating the minimum limits. Compensating MVAR limits are used in reactive power optimization.
Maximum Compensation in MVAR
This field is to specify maximum reactive power compensation for the load. Reactive power compensation is limited to the maximum values for violating the maximum limits. Compensating MVAR limits are used in reactive power optimization.
Compensation Step in MVAR
This field is to specify increment value of reactive power compensation at the bus.
Global Change
The power factor and the load characteristic of the load can be modified. It can be modified based on voltage level, zone wise or area wise.
Power Factor Option: With this option power factor of particular zone loads or particular area loads or loads connected to particular voltage level buses or loads connected to particular voltage level buses in a zone or loads of particular area and zone can be modified. If Zone, Area and Voltage are 0.00 then all loads power factors in that database will be modified.
Load Characteristics Option: Load characteristics of particular zone, particular area and loads connected to particular voltage level buses can be modified. If Zone, Area and Voltage are 0.00 then all loads characteristics will be modified.
Load Type: User has an option to specify the load type as linear or non-linear. Nonlinear loads are
current or voltage sources considered in harmonic analysis
Motor Load percentage: Percentage of Motor load can be specified. This motor contribution will be considered in short circuit analysis.
Load Details
The individual load details can be given here. All the connected loads should be specified here. The loads can be p-q load or motor load. Option is provided to disconnect the loads. Click on Update load to update the main load data form to reflect the changes made to the individual loads
Motor Load Percentage
Specify percentage Motor load. That percentage will be considered in short circuit studies with motor contribution.
1.4.18 Cyclic Load
Use menu option “Elements > Shunt Elements > Cyclic Load” to open cyclic load form.

MiP-PSCT Database Manager User Manual
Power Research and Development Consultants Pvt. Ltd. Page 47
1.4.19 Filter
Use menu option “Elements>Shunt Elements>Filter” to open filter form.
1.4.20 SVC
Use menu option “Elements > Shunt Elements > SVC”to open SVC form.
SVC FPB Name
This field is to specify the filename of the SVC FPB model to be used in transient stability study. By default, this field is blank. To connect any SVC drawn using free programmable blocks editor, give the file name with fpd extension as parameter in this field. If this customized SVC is to be connected, then standard SVC is ignored. Program prompts user that it is going to ignore the standard SVC if OK is clicked. Otherwise standard SVC is considered.
1.4.21 Shunt FACTS Device
Use menu option “Elements > Shunt Elements > Shunt Fact Device” to open SFD form.

MiP-PSCT Database Manager User Manual
Power Research and Development Consultants Pvt. Ltd. Page 48
SFD FPB file name
This field is to specify the filename of the SFD FPB model to be used in transient stability study. By default, this field is blank. To connect any SFD drawn using free programmable blocks editor, give the file name with fpd extension as parameter in this field. If this customized SFD is to be connected, then standard SFD is ignored. Program prompts user that it is going to ignore the standard SFD if OK is clicked. Otherwise standard SFD is considered.
Fact Device Type: User has an option to select SVC or STATCOM.
Voltage Ref.: Target bus voltage in pu.
Slope: SVC/STATCOM characteristic slope in pu.
Tolerance: Voltage tolerance
Max. Inductive MVAR: Maximum reactive power SVC/STATCOM can absorb at rated voltage of the device
Capacitive MVAR: Maximum reactive power SVC/STATCOM can inject at rated voltage of the device.
1.4.22 Capacitive Voltage Transformer
Capacitive Voltage Transformers (CVTs) are the predominant source of the voltage signals for distance relays in High Voltage (HV) and Extra High Voltage (EHV) systems. CVTs provide a cost-efficient way of obtaining secondary voltages for EHV systems. They create however, certain problems for distance relays. During line faults, when the primary voltage collapses and the energy stored in the stack capacitors and the tuning reactor of a CVT needs to be dissipated, the CVT generates severe transients that affect the performance of protective relays. For CVT details refer Library
Arc Fault
Arc fault details are to be entered here. This data is considered in simulating arc fault studies for electromagnetic transient analysis.
Arc length in cm, Arc current (peak) in Amps, Fault time in seconds Circuit breaker opening time, initial conductance in mho are the data required.

MiP-PSCT Database Manager User Manual
Power Research and Development Consultants Pvt. Ltd. Page 49
HVDC Elements
1.4.23 Converter
The HVDC transmission become more popular because of advancement in thyristor valve converters and the ability to rapidly control the transmitted power. The easiest way to interconnect large power systems which are already heavily loaded is to use HVDC links. Therefore, HVDC systems have a significant impact on both steady state and stability of the associated ac power systems. The AC-DC load flow analysis is to be conducted for the interconnected systems which are having HVDC links. This can be performed using unified or sequential approach. In addition to these two terminal dc systems, the multi terminal dc systems may be more attractive in many cases to exploit the economical and technical advantages of HVDC technologies. So the analysis of HVDC systems is very essential for planning and operation of the power systems. The representation of simple monopolar link of a HVDC system is as shown below.
Use menu option “Elements > HVDC Elements > Converter” to open converter form.
Converter type
Converter can be either rectifier or inverter. So, to specify whether the converter is a rectifier or inverter select the options provided in converter type. This should be in sequence
Converter Bus
This field to specify the bus number to which the converter is connected. The bus number can be selected from the list box provided which displays all the buses presented in the database.
Converter DC voltage Vdc
This field is to specify the DC voltage rating of the converter/bridge, Vdc. For example A bipolar HVDC link operates with ±300 kV at inverter side and there are two series connected bridges per pole, then the DC voltage or average DC voltage at each converter bridge is 150 kV.
No. of Bridges (nb)
This field is to specify no. of bridges in series. For six pulse converter number of bridges are one, and for 12 pulse converter, number of bridges in series are 2.
No. of Poles (np)
This field is to specify no. of poles. This field is 1 for monopolor and 2 for bipolar links.
DC line
Rectifier Inverter
3 Ph AC 3 Ph AC

MiP-PSCT Database Manager User Manual
Power Research and Development Consultants Pvt. Ltd. Page 50
Control Type
This field is to specify the control type of the converter. There are three types of the controls namely constant voltage, constant current and constant power control. In a two terminals or multi terminal converter group, at least one converter in the group should have the control type as constant voltage.
Power Order in MW
This field is to enter the specified power in MW for power control. Specified power is positive for rectifier and negative for inverter. Usually it is specified or it can be computed from Pdc=Vdc*Idc
Current Order in Amps
This field corresponds to specified current in Amps. If the control type is constant current, then the value is taken from this field to maintain constant current in the DC link. For example a bipolar HVDC link operates with ±300 kV, 600 MW (rated voltage and power) then the current order is 1000 Amps.
Voltage Order in kV
This field corresponds to specified voltage in kV. If the control type is constant voltage, then the value is taken from this field to maintain desired voltage at the converter side. It is for the entire HVDC system. For example a bipolar HVDC link operates with ±300 kV, then the voltage order is 600 kV.
Converter transformer MVA rating
This field corresponds to transformer rating in MVA. The data is collected from manufacturer or from the name plate details. The rating can be same for both rectifier and inverter or it can be different. Generally it is calculated as MVA rating= (π/3*no load DC Voltage*DC current) MVA
Converter transformer Primary voltages
This field corresponds to the converter transformer primary side voltage in kV. It is the AC bus voltage where the converter transformer primary is connected.
Converter transformer Secondary voltages
This field corresponds to the converter transformer secondary side voltage in kV. It is the converter valve side voltage where the converter bridge is connected to converter transformer. The data is collected from manufacturer or from the name plate details. The voltage can be same for both rectifier and inverter side or it can be different.
Generally it is calculated as -
Converter transformer AC Valve side voltage = No load DC Voltage/1.3505
Example: 230 kV/126.8kV, 345kV/422.84 kV and 230 kV/132 kV
Here 230 kV, 345 kV are Converter transformer primary side voltage or AC bus voltage where it is connected. Here 126.8 kV, 422.84 kV and 132 kV are Converter transformer secondary side voltage or valve side AC voltage
Transformer Impedance
This field corresponds to the converter transformer impedance in p.u. on its own MVA rating. Usually the transformer resistance is neglected. So this field is directly taken as leakage reactance/commutation reactance in p.u. on its own MVA rating. For example the transformer impedance is given as 12% means the value is 0.12 p.u. Commutation resistance (Rc) is calculated using this Xc.
If it is given in ohms means it can be calculated as
Commutation reactance in p.u. = Commutation reactance in ohms*MVA rating/ (converter transformer secondary side kV) 2
Minimum Tap Position Number
This field is to specify the minimum tap position number of the converter transformer.
Minimum Tap Voltage

MiP-PSCT Database Manager User Manual
Power Research and Development Consultants Pvt. Ltd. Page 51
This field corresponding to the minimum voltage with respect to minimum tap value i.e. the tap regulation is given -15% and voltage is 230 kV; the minimum tap voltage is 195.5 kV
Maximum Tap Position Number
This field is to specify the maximum tap position number of the converter transformer. Normally the value is given as odd numbers. For example 17, 21, 29 etc. It decides the precision of the tap step.
Maximum Tap Voltage
This field corresponding to the maximum voltage with respect to maximum tap value i.e. the tap regulation is given +15% and voltage is 230 kV, the maximum tap voltage is 241.5 kV
X to R ratio
This field is to specify the X/R ratio of the converter transformer. If resistance is neglected then X/R ratio should be very high value. In this case only leakage reactance is considered.
Minimum Excitation Angle
If the converter type is inverter, this field is active to specify the minimum excitation angle in degrees. Normally, minimum excitation angle ranges from 15 to 20 degrees.
Minimum firing Angle
If the converter type is rectifier, this field is active to specify the minimum control angle/firing angle in degrees at which the conduction of the converter starts. Normally, minimum-firing angle ranges from 5 to 7 degrees.
Minimum Extinction Angle
If the converter type is inverter, this field is active to specify minimum extinction angle in degrees. Normally minimum extinction angle ranges from 15 to 20 degrees.
Current Margin
This field specifies the current margin of the converter in Amps. Current margin is required to avoid the commutation failure while changing from one mode of operation to another mode of operation. It is not used in LFA studies. Normally, it is 10% the DC current. For example DC current is 200 A; the current margin is 20 A.
Control Block Name
This field specifies the control block name. Ensure that this FPB exists before executing transient stability. HVDC controls can be edited in free programmable blocks editor and can be attached to the converter in this field.
1.4.24 DC Link
To open this form, use menu option “Elements > HVDC Elements > DC Link”. Then the form shown below will appear.
From Converter
This field is to specify the From converter number to which the from side of the DC link is connected. The converters available in the database are listed in the list box from which From converter can be selected.
To Converter
This field is to specify the To converter number to which the To side of the DC link is connected. The converters available in the database are listed in the list box from which To converter can be selected.

MiP-PSCT Database Manager User Manual
Power Research and Development Consultants Pvt. Ltd. Page 52
Length in Kms
This field is to specify the length of the DC link in kilometres.
Resistance
This field is to specify the resistance of the DC link in Ohms for one pole. For bipolar operation, equivalent resistance is computed internally.
Inductance
This field is to specify the inductance of the DC link in Henry for one pole. For bipolar operation, equivalent inductance is computed internally. This data is used in transient stability studies.
Capacitance
This field is to specify the capacitance of the DC link in Farad for one pole. For bipolar operation, equivalent capacitance is computed internally. This data is used in transient stability studies
Relays
1.4.25 Overcurrent Relay
Use menu option “Elements > Relays > Overcurrent Relay” to open the over current relay data form.
Relay Name: Relay name size is 20 Characters
Element Type
Select the element on which the relay is present. The elements displayed are
Two winding Transformer
Three winding Transformer
Transmission Line
Bus Coupler
Series Capacitor

MiP-PSCT Database Manager User Manual
Power Research and Development Consultants Pvt. Ltd. Page 53
Series Reactor
Generator
Load
Motor
Shunt Capacitor
Shunt Reactor
Location
For a relay on the series element, the location of the relay should be selected. The relay is located either from side or to side of the series element. For a transformer, the relay will be located at primary, secondary or tertiary side.
The From and To side is decided by the way in which data is given for the series elements. For example, consider a transmission line, whose from node is specified as 1 and to node as 2. If a relay is connected at node 1, the selection should be FROM SIDE. If in the transmission line data the from node is given as 2 and to node as 1 then for the same connection of the relay the selection should be TO SIDE.
Element ID
Element identification number. The element number on which the relay is present is identified by this Element ID. Select the element on which the relay is present.
Relay Type
The directional feature of the relay should be selected here. It can be either Directional or Non directional relay
Current Transformer Data
Four fields are provided to specify different ratings of current transformer primary. In case of single rating of the CT, all the fields should be given same value. In case of dual rating CT ratio say 400/200/5 amps, the data should be given as 400, 200, 200 and 200 amperes. For fuses, these values are ignored.
One field is provided to give the CT secondary rating
Load Current
The maximum load current in amperes that will be carried by the element on which the relay is located. The plug setting is selected such that it is greater than the maximum load current multiplied by the overload factor.
Discrimination Time
Discrimination time in seconds is the time interval between the operation of this relay and the relay for which this provides backup protection.
Over load factor
The relay should not operate for currents just above the maximum load current. Usually 30% of overload is permitted beyond which the relay should operate. The typical value of overload factor is 1.3. If the element is already loaded to its rated capacitors, then over load factor should be unity.
Unbalance Factor
The earth fault relay should not operate for slight unbalance currents. Hence, certain percentage of load current is given as tolerance. The earth relay plug setting is selected such that it is greater than the maximum load current multiplied by the unbalance factor.
Direction Sense
The relay is looking away or towards the bus to which it is connected is given below. Consider the following samples

MiP-PSCT Database Manager User Manual
Power Research and Development Consultants Pvt. Ltd. Page 54
Example 1: Relay is looking away from the bus if the source is connected to bus 1 side.
Relay is looking towards the bus if the source is connected to bus 2 side.
Example 2: Relay R2 is looking away from the bus
Relay R3 is looking towards the bus
Example 3: Relay R4 and R6 are looking away from the bus
Relay R5 and R7 are looking away the bus
Instantaneous Setting factors
Phase instantaneous setting factor: This value is multiplied by the remote bus fault currents to obtain phase instantaneous setting above, which the phase relay should operate instantaneously.
If the relay is present on the motor, this value corresponds to the starting current of the motor and the instantaneous setting will be done such that the instantaneous setting is above the motor starting current.
Earth instantaneous setting factor: This value is multiplied by the remote earth fault current to obtain the earth instantaneous setting above, which the earth relay should operate instantaneously
If the relay is present on the motor, this value corresponds to the starting time in seconds of the motor. The relay curve selection will be done such that the relay curve will be above this starting time point.
Relay/Fuse Database
This is the relay / fuse manufacturer reference number. This identifies the type and characteristics of the relay. The relay/fuse can be selected from the available relay and fuse manufacturer details.
Append Relay Code
In Relay Database (Relay Library) IEEE Code field is provided. User can enter the relay code in this field. It is to be added or tagged to the relays in Over current Relay Data. Then Click on this button to tag the relay code for the selected relay.
Global Change - Append Relay Code
In Relay Database (Relay Library) IEEE Code field is provided. User can enter the relay code in this field. It is to be added or tagged to the relays in over current Relay Data. Then Click on this button to tag the relay code for all the over current relays present in the database.
Phase Setting Options
R 7
Example 1
Example 2
R 1
2 1
R 3 R 2
1 2
R 5 R 4
1 2 R 6

MiP-PSCT Database Manager User Manual
Power Research and Development Consultants Pvt. Ltd. Page 55
Phase: When this option is selected or checked phase setting fields will be enabled
TMS Setting: User has following three options.
Computed: With this option program will compute the TMS settings
User Defined TMS: User has to enter the TMS value and this will be considered for co-ordination computation
Close in operating time: With this option user can set the operating time for the close in fault.
Phase curve: Selection of curve type for phase relay coordination
User Defined Plug setting:
If this option is selected or checked then user has to specify the plug setting of that relay and this value will be considered for the co-ordination computation
User Defined Instantaneous setting:
If this option is selected or checked, user has to specify instantaneous factor and time. Instantaneous factor multiplied by CT rating will be the instantaneous current setting of the relay.
If this option is not selected or unchecked and instantaneous factor is 1.3 then instantaneous current setting of the relay is 1.3 times the remote bus fault current.
Earth Setting Options
Earth: When this option is selected or checked earth setting fields will be enabled.
TMS Setting: User has following three options.
Computed: With this option program will compute the TMS settings
User Defined TMS: User has to enter the TMS value and this will be considered for co-ordination computation
Close in operating time: With this option user can set the operating time for the close in fault.
Earth curve: Selection of curve type for earth relay coordination
User Defined Plug setting:
If this option is selected or checked then user has to specify the plug setting of that relay and this value will be considered for the co-ordination computation
User Defined Instantaneous setting:
If this option is selected or checked, user has to specify instantaneous factor and time. Instantaneous factor multiplied by CT rating will be the instantaneous current setting of the relay.
If it is unchecked and instantaneous factor is 1.3 then the instantaneous current setting is 1.3 times the remote bus fault current
Relay
User has to specify the type of relay. The options are
Over current
Partial bus bar
Stand by earth fault relay
Partial Bus Bar Relay
Details: Click on this button to open the Partial Bus Bar relay details
The partial differential busbar protection relay is connected to the current transformers of the transformer incoming feeder and the bus coupler and measures the sum of both currents.
In the stable condition, the measured current is the maximum bus section load current. In case of a busbar fault the short circuit current will be measured and if no blocking signal is available from the outgoing feeders

MiP-PSCT Database Manager User Manual
Power Research and Development Consultants Pvt. Ltd. Page 56
present, then the relay will trip the respective incoming transformer and the bus coupler.
In case of fault on outgoing feeders, a blocking signal will be sent to the partial bus bar relay and it will not operate instantaneously for that fault.
Partial bus bar relay is also an over current relay which acts as a backup relay for all the outgoing feeder relays.
Bus No.: Select the bus no from the drop down list.
Incoming Relay: Select the incoming relay from the drop down list.
CT Signal: Signal from one CT or two CTs are to be specified.
Bus Coupler 1 and 2: If CT signal is two then select the respective bus couplers 1 and 2.
Outgoing feeder relays: Select the outgoing feeders from the respective buses.
Relay Status: User has to specify whether the relay is in service or blocked. By default relay is in service. The blocked relays do not appear in the analysis and simulation
Relay trip status: User has to specify whether the relay’s trip is in service or blocked. The blocked relays do not appear in the analysis and simulation.
Stand By Earth Fault Relay
Standby Earth Fault relay is a back-up over current ground protection usually connected on the HV side and its main purpose is to provide local back-up protection in case of a failure of main protections of the LV feeder/line protections. bus protections and the transformer main protections.
The REF and SBEF are two separate protection functions. The REF will protect the transformer winding and the cables to the breaker. SBEF is standby earth fault protection. It is backup protection in case of uncleared faults out on the network, or earth faults outside the REF zone. Itmay also protect the neutral earthing resistor if there is one, and may act as a cheap bus bar protection system by tripping the LV bus section first and the transformer LV C/B second.
Stage 1: User has to select the section to be tripped in stage one.
Stage 1 Section 2: User has to select the second section to be tripped in stage one.
Stage 2 Trip: User has to select the transformer or other section to be tripped in stage two
Settings
The existing settings and computed settings are displayed here. This data will be used in the analysis as well as during protection simulation.
Existing plug setting: Option to enter exeisting plug setting with reference to primar and seconday for both phase and earth settings.
Existing: Existing setting details are displayed in these fields.
Computed: Settings obtained from the program after over current relay co-ordination execution will be displayed in this table.
Computed > > Existing Settings: Click on this button to copy values from computed settings to existing settings.
Existing > > Study Settings: Click on this button to copy values from existing to study settings i.e. phase settings and earth settings fields which are considered for the study
Study Settings > > Existing Settings: Click on this button to copy values from study settings to existing settings table.
CT Connection: CT connection can be set as Star or Delta. Default option is star.
1.4.26 Distance Relay
Use menu option “Elements > Relays > Distance Relay”. To open the distance relay form.
Number: Unique relay number is to be entered
Relay Name: Enter relay name with not more than 20 characters
Transmission Line ID: Select the transmission line and location where the distance relay is placed

MiP-PSCT Database Manager User Manual
Power Research and Development Consultants Pvt. Ltd. Page 57
Zone2: Select zone2 element type and ID. This is user defined element for zone 2. By default the program selects zone 2
Zone3: Select zone3 element type and ID. This is user defined element for zone 3. By default the program selects zone 3.
Zone1 Reach %: Percentage impedance to be considered for zone1 setting. It is around 70% to 80% of the line impedance
Zone3 Reach % : 100% of the zone1 element impedance plus 100% zone2 element impedance plus percentage impedance of the element as entered by the user/selected by program, if zone2 and zone3 elements are different. Otherwise it is 100% zone1 element impedance plus percentage impedance mentioned in the zone3 if zone2 and zone3 elements are same
Zone4 Reach%: Normally zone4 is reverse reach and it is the given percentage impedance of the Zone1 element impedance.
Existing settings:Existing phase and earth settings are to be entered in these fields for zone1, zone2, zone3 and zone4
Computed Settings: After the execution of distance relay co-ordination, these fields are populated by the settings computed by the program.
Computed > > Existing: Click on this button to copy the computed settings to the existing settings..
The current transformer primary rating in amperes associated with the distance relay.
Zone2 Reach %: 100% of the zone1 element impedance plus the percentage impedance of zone2 element as entered by the user/selected by program.
CT Low
The current transformer secondary rating in amperes associated with the distance relay.
PT High
The potential transformer primary rating in kilo volts associated with the distance relay
PT Low
The potential transformer secondary rating in volts associated with the distance relay.
Zone 2 Time Discrimination
Specify the minimum time discrimination of the second zone. Zone2 discrimination time corresponds to the co-ordination interval between Zone1 and Zone2 operating times.
Zone 3 Time Discrimination
Specify the minimum time discrimination of the third zone. Zone3 discrimination time corresponds to the co-ordination interval between Zone2 and Zone3 operating times.
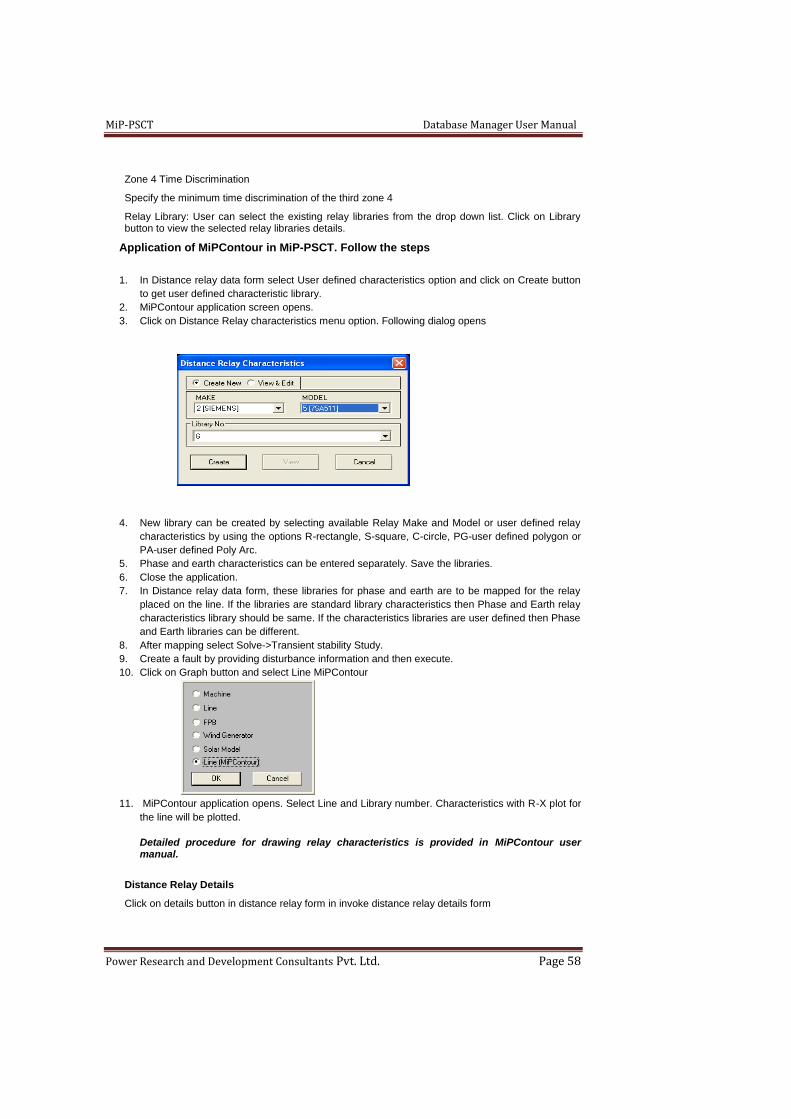
MiP-PSCT Database Manager User Manual
Power Research and Development Consultants Pvt. Ltd. Page 58
Zone 4 Time Discrimination
Specify the minimum time discrimination of the third zone 4
Relay Library: User can select the existing relay libraries from the drop down list. Click on Library button to view the selected relay libraries details.
Application of MiPContour in MiP-PSCT. Follow the steps
1. In Distance relay data form select User defined characteristics option and click on Create button
to get user defined characteristic library.
2. MiPContour application screen opens.
3. Click on Distance Relay characteristics menu option. Following dialog opens
4. New library can be created by selecting available Relay Make and Model or user defined relay
characteristics by using the options R-rectangle, S-square, C-circle, PG-user defined polygon or
PA-user defined Poly Arc.
5. Phase and earth characteristics can be entered separately. Save the libraries.
6. Close the application.
7. In Distance relay data form, these libraries for phase and earth are to be mapped for the relay
placed on the line. If the libraries are standard library characteristics then Phase and Earth relay
characteristics library should be same. If the characteristics libraries are user defined then Phase
and Earth libraries can be different.
8. After mapping select Solve->Transient stability Study.
9. Create a fault by providing disturbance information and then execute.
10. Click on Graph button and select Line MiPContour
11. MiPContour application opens. Select Line and Library number. Characteristics with R-X plot for
the line will be plotted.
Detailed procedure for drawing relay characteristics is provided in MiPContour user manual.
Distance Relay Details
Click on details button in distance relay form in invoke distance relay details form
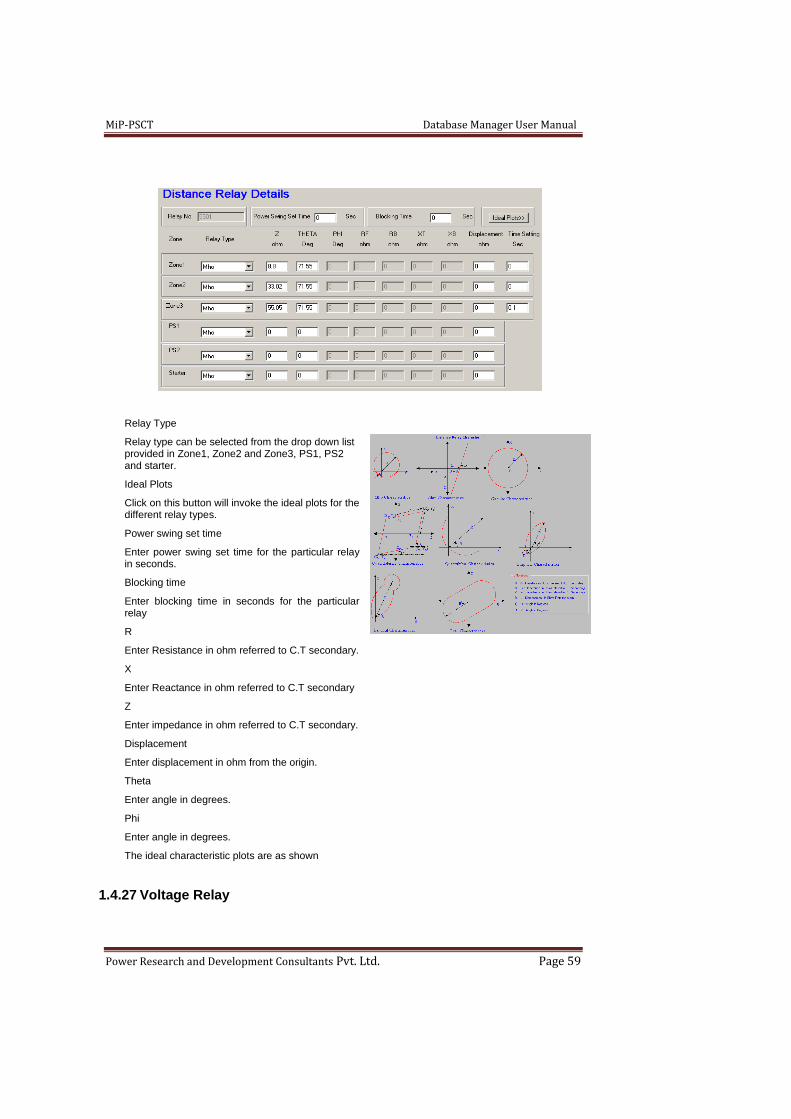
MiP-PSCT Database Manager User Manual
Power Research and Development Consultants Pvt. Ltd. Page 59
Relay Type
Relay type can be selected from the drop down list provided in Zone1, Zone2 and Zone3, PS1, PS2 and starter.
Ideal Plots
Click on this button will invoke the ideal plots for the different relay types.
Power swing set time
Enter power swing set time for the particular relay in seconds.
Blocking time
Enter blocking time in seconds for the particular relay
R
Enter Resistance in ohm referred to C.T secondary.
X
Enter Reactance in ohm referred to C.T secondary
Z
Enter impedance in ohm referred to C.T secondary.
Displacement
Enter displacement in ohm from the origin.
Theta
Enter angle in degrees.
Phi
Enter angle in degrees.
The ideal characteristic plots are as shown
1.4.27 Voltage Relay
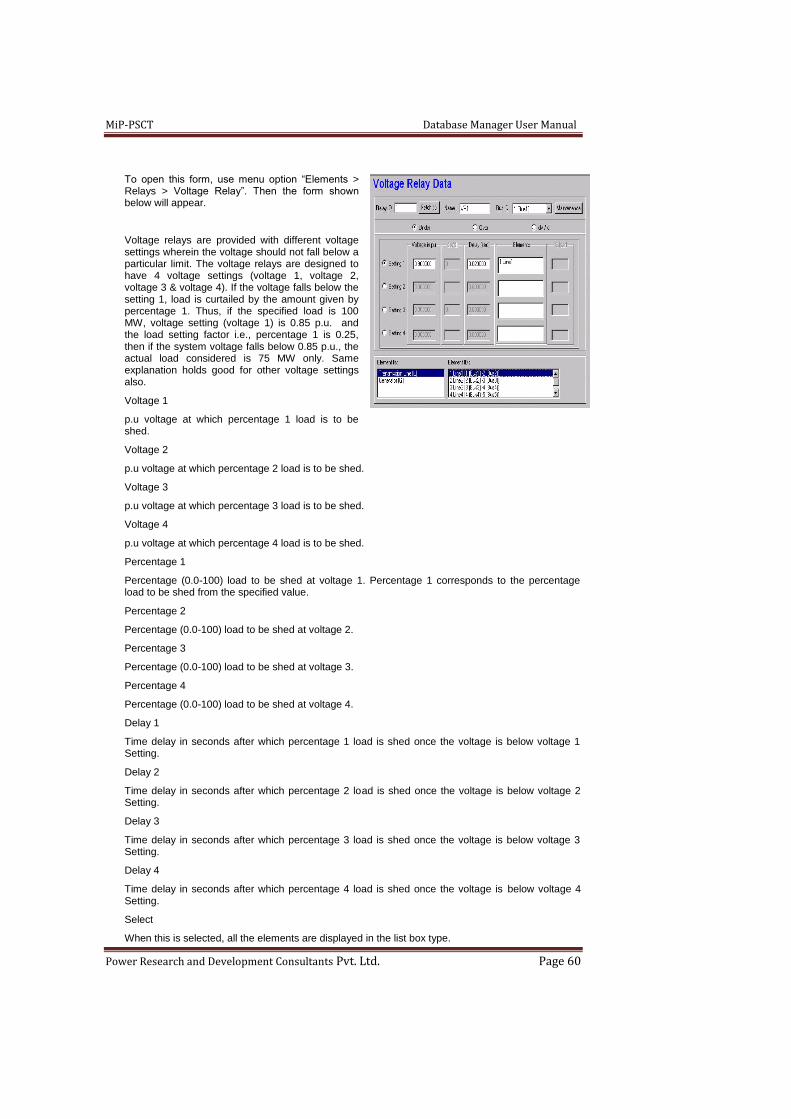
MiP-PSCT Database Manager User Manual
Power Research and Development Consultants Pvt. Ltd. Page 60
To open this form, use menu option “Elements > Relays > Voltage Relay”. Then the form shown below will appear.
Voltage relays are provided with different voltage settings wherein the voltage should not fall below a particular limit. The voltage relays are designed to have 4 voltage settings (voltage 1, voltage 2, voltage 3 & voltage 4). If the voltage falls below the setting 1, load is curtailed by the amount given by percentage 1. Thus, if the specified load is 100 MW, voltage setting (voltage 1) is 0.85 p.u. and the load setting factor i.e., percentage 1 is 0.25, then if the system voltage falls below 0.85 p.u., the actual load considered is 75 MW only. Same explanation holds good for other voltage settings also.
Voltage 1
p.u voltage at which percentage 1 load is to be shed.
Voltage 2
p.u voltage at which percentage 2 load is to be shed.
Voltage 3
p.u voltage at which percentage 3 load is to be shed.
Voltage 4
p.u voltage at which percentage 4 load is to be shed.
Percentage 1
Percentage (0.0-100) load to be shed at voltage 1. Percentage 1 corresponds to the percentage load to be shed from the specified value.
Percentage 2
Percentage (0.0-100) load to be shed at voltage 2.
Percentage 3
Percentage (0.0-100) load to be shed at voltage 3.
Percentage 4
Percentage (0.0-100) load to be shed at voltage 4.
Delay 1
Time delay in seconds after which percentage 1 load is shed once the voltage is below voltage 1 Setting.
Delay 2
Time delay in seconds after which percentage 2 load is shed once the voltage is below voltage 2 Setting.
Delay 3
Time delay in seconds after which percentage 3 load is shed once the voltage is below voltage 3 Setting.
Delay 4
Time delay in seconds after which percentage 4 load is shed once the voltage is below voltage 4 Setting.
Select
When this is selected, all the elements are displayed in the list box type.

MiP-PSCT Database Manager User Manual
Power Research and Development Consultants Pvt. Ltd. Page 61
Element Type
On selecting this option, a list of elements will be displayed, select the appropriate element type.
Double Click on the element to select.
To deselect the selected item double click on the selected element.
Under each section, options are provided for under voltage relay, over voltage relay and dv/dt type of relays. Select the appropriate relay.
1.4.28 Frequency Relay
To open this form, use menu option “Elements > Relays > Frequency Relay”. Then the form shown below will appear.
Frequency 1
Frequency at which percentage 1 load is to be shed. This field corresponds to frequency setting where in the frequency should not fall below a set limit. The relays are modelled to have four frequency settings (Frequency 1, Frequency 2, Frequency 3 and Frequency 4). If the frequency falls below the setting 3, load is curtailed by the amount given by percentage-3. Thus, if the specified load is 100MW, frequency setting-3 is 47 Hz., and the load shedding factor i.e. percentage-3 is 50, then if the system frequency goes below 47 Hz., the actual load considered is 50 MW only. Similar explanation holds good for the other three settings also.
Frequency 2
Frequency at which percentage 2 load is to be shed.
Frequency 3
Frequency at which percentage 3 load is to be shed.
Frequency 4
Frequency at which percentage 4 load is to be shed.
Percentage 1
Percentage (0.0-1.0) load to be shed at Frequency 1. Percentage 1 corresponds to the amount of load to be shed from the specified value.
Percentage 2
Percentage (0.0-1.0) load to be shed at Frequency 2.
Percentage 3
Percentage (0.0-1.0) load to be shed at Frequency 3.
Percentage 4

MiP-PSCT Database Manager User Manual
Power Research and Development Consultants Pvt. Ltd. Page 62
Percentage (0.0-1.0) load to be shed at Frequency 4.
Delay 1
Time delay in sec after which Percentage 1 load is shed once the frequency is below Frequency 1 setting.
Delay 2
Time delay in sec after which Percentage 2 load is shed once the frequency is below Frequency 2.
Delay 3
Time delay in sec after which Percentage 3 load is shed once the frequency is below Frequency 3.
Delay 4
Time delay in sec after which Percentage 4 load is shed once the frequency is below Frequency 4.
Select
When this is selected all the elements are displayed in the list box type.
Element Type
On selecting this option, a list of elements will be displayed. The user has to select the appropriate element type. Under each section, options are provided for under frequency relay, over frequency relay and df/dt. Double Click on the element to select.
The information regarding the type of relay like under, over or df/dt relay can be selected using the radio buttons.
Relay Information
To open this form, use menu option “Elements > Relays > > Relay Information”. Then the form shown below will appear.
This is for relay information only. This data is not used in any of the MiP-PSCT Study
Tag number
Unique number to identify the relay
Sub Station
Name of the substation in which this relay is located.
Function
Relay function can be any one of the following
Relay Type
The relay type should be mentioned here. Ex : IDMT, Pre – trip alarm etc.
DMT
Definite minimum time in seconds
Feeder Number
The feeder number with which this relay is associated
Switch Board Name
The Switch Board Name with which this relay is associated
Serial Number
Relay function CODE
Over current 50/51
Earth fault 50/51 N
Stand by earth fault 51G
Under voltage 27
Restricted earth fault 64
Check synch 25
Motor protection 96
Lock out 86
Timer 2
Trip Circuit 95

MiP-PSCT Database Manager User Manual
Power Research and Development Consultants Pvt. Ltd. Page 63
A unique Serial number of the relay.
Auxiliary volt
Relay auxiliary voltage
CT/PT
Reference number of the Current transformer / potential transformer
Setting ranges Current
Minimum and maximum current setting range
Setting ranges TMS
Minimum and maximum time multiplier setting range
1.4.29 Transformer Differential Relay
To open this form, use menu option Elements > Relays > > Transformer Differential. Then the form shown below will appear. Differential protection is a unit-type protection for a specified zone or piece of equipment. It is
based on the fact that it is only in the case of faults internal to the zone that the differential
current (difference between input and output currents) will be high. However, the differential
current can sometimes be of substantial magnitude even without an internal fault. This is due to
certain characteristics of current transformers (different saturation levels, nonlinearities)
measuring the input and output currents, and of the power transformer being protected. with the
exception of the inrush and over excitation currents, most of the other problems, can be solved
by means of the percentage differential relay, which adds to the normal differential relay two
restraining coils fed by the zone-through current, by proper choice of the resulting percentage
differential characteristic, and by proper connection of the current transformers on each side of
the power transformer.
Percentage restraint differential protective relays have been in service for many years [1]. Fig.
1 shows a typical differential relay connection diagram. Differential elements compare an
operating current with a restraining current. The operating current (also called differential
current), Id, can be obtained from the primary and secondary currents.
𝐼𝑑 = |𝐼𝑤1 − 𝐼𝑤2
| (1)
Figure 2: Typical transformer differential protection scheme
Id is proportional to the fault current for internal faults and approaches zero for any other
operating (ideal) conditions. There are different alternatives for obtaining the restraining
current (IR). The most common ones include the following:
𝐼𝑑 = 𝑘(|𝐼𝑤1 | − |𝐼𝑤2
|) (2)
𝐼𝑅 = 𝑀𝑎𝑥(|𝐼𝑤1 |, |𝐼𝑤2
|) (3)

MiP-PSCT Database Manager User Manual
Power Research and Development Consultants Pvt. Ltd. Page 64
Where, k is a compensation factor, usually it is taken as 1 or 0.5. The differential relay
generates a tripping signal if the differential current (Id) is greater than a percentage of the
restraining current, IR:
𝐼𝑑 > 𝑆𝑙𝑜𝑝𝑒 ∗ 𝐼𝑅 (4)
Differential relays perform well for external faults, as long as the CTs reproduce the primary
currents correctly. When one or both of the CTs saturates at different levels, false operating
current appears in the differential relay and could cause relay mal-operation. Some
differential relays use the harmonics caused by CT saturation for added restraint and to
avoid mal-operations. In addition, the slope characteristic of the percentage differential relay
provides further security for external faults with CT saturation. A variable-percentage or
dual-slope characteristic as shown in Figure 2, further increases relay security for heavy CT
saturation.
Figure 3: Operating Characteristic of a dual-slope Differential Relay
For a reliable and correct operation of the protection relay the current transformers (CT) have to
be carefully chosen and the relay settings have to be calculated and selected with care.
Sources of Differential current Certain phenomena can cause a substantial differential current to flow, when there is no fault,
and these differential currents are generally sufficient to cause a percentage differential relay to
trip. However, in these situations, the differential protection should not disconnect the system
because it is not a transformer internal fault. Such phenomena can be due to the nonlinearities
in the transformer core.
In applying the principles of differential protection to transformers, a variety of considerations
have to be taken into account. These include:
a) Correction for possible phase shift across the transformer windings (phase correction)
b) Effects of the variety of earthing and winding arrangements (filtering of zero sequence
currents)
c) Correction for possible unbalance of signals from current transformers on either side of
the windings (ratio correction)
d) Effect of magnetising inrush during initial energization
e) The possible occurrence of over fluxing
In traditional transformer differential schemes, the requirements for phase and ratio correction
were met by the application of external interposing current transformers (ICT’s), as a secondary
replica of the main winding connections, or by a delta connection of the main CT’s to provide
phase correction only. Digital/numerical relays implement ratio and phase correction in the
relay software instead, thus enabling most combinations of transformer winding arrangements
to be catered for, irrespective of the winding connections of the primary CT’s. This avoids the
additional space and cost requirements of hardware interposing CT’s.

MiP-PSCT Database Manager User Manual
Power Research and Development Consultants Pvt. Ltd. Page 65
Line current Transformer current ratings Line current transformers have primary ratings selected to be approximately equal to the rated
currents of the transformer windings to which they are applied. Primary ratings will usually be
limited to those of available standard ratio CT’s.
Phase Correction Correct operation of transformer differential protection requires that the transformer primary and
secondary currents, as measured by the relay, are in phase. If the transformer is connected
delta/star, balanced three-phase through current suffers a phase change of 30°. If left
uncorrected, this phase difference would lead to the relay seeing through current as an
unbalanced fault current, and result in relay operation. Phase correction must be implemented.
With Dyn11 connection, the secondary voltages and current are displaced by +30 from
primary. Therefore the combination of primary, secondary and phase correction must provide a
phase shift of -30 of secondary quantities relative to primary.
Filtering of zero sequence currents
It is essential to provide some form of zero sequence filtering where a transformer winding can
pass zero sequence current to an external earth fault. This is to ensure that out-of-zone earth
faults are not seen by the transformer protection as an in-zone fault. This is achieved by use of
delta-connected line CTs or interposing CTs for older relays, and hence the winding connection
of the line and/or interposing CTs must take this into account, in addition to any phase
compensation necessary. For digital/numerical relays, the required filtering is applied in the
relay software. Table1 summarises the phase compensation and zero sequence filtering
requirements.
Ratio Correction
Correct operation of the differential element requires that currents in the differential element
balance under load and through fault conditions. As the primary and secondary line CT ratios
may not exactly match the transformer rated winding currents, digital/numerical relays are
provided with ratio correction factors for each of the CT inputs. The correction factors may be
calculated automatically by the relay from knowledge of the line CT ratios and the transformer
MVA rating. If the transformer is fitted with a tap changer, line CT ratios and correction factors
are normally chosen to achieve current balance at the mid tap of the transformer. It is
necessary to ensure that current mismatch due to off-nominal tap operation will not cause
spurious operation.
Select the type of transformer 2winding or 3 winding
Element Number: Select the element ID on which the transformer differential protection is provided
Relay Manufacturer: Select the differential relay library reference number from the drop down list box.
Slope: It is a bias slope. Normally its range is 20% to 50%.
Current Transformers: Enter primary and secondary CT and ICT (Inter posing current transformer)
Amps. If it is a 3 winding transformer then tertiary CT and ICT data in Amps is to be entered.
If the transformer is a numerical relay, the ICT’s are disabled.

MiP-PSCT Database Manager User Manual
Power Research and Development Consultants Pvt. Ltd. Page 66
Primary CT: Location of primary CT like element, Element no., From side or To side are to be specified. By default the primary CT is on the primary side of the transformer to be protected.
Secondary CT: Location of secondary CT like element, Element no., from side or To side are to bespecified. By default the secondary CT is on the secondary side of the transformer to be protected.
Existing Settings: Existing setting details are to be entered
Computed: Program will give Transformer differential settings by considering the above data that will be computed automatically.
Operating Time: This is the time taken by the differential relay to operate if a fault is within the zone.
CT Error : This is the sum of transformer primary side and secondary side CT Errors.
Drain Current : By default it is zero. User can define its own value
Equipment Error : It is relay accuracy. By default it is 5% .
Above three values are used to compute slope1 setting for computed setting.
For existing setting user has to define the slope1 settings.
High set Factor: It is used to calculate high set or instantaneous current. By default it is 8pu.
Sample Report
TRANSFORMER DIFFERENTIAL PROTECTION
--------------------------------------------------------------------------
PROTECTION : TRANSFORMER DIFFERENTIAL PROTECTION
TRANSFORMER NUMBER : 5
TRANSFORMER NAME : 2T5
RELAY TYPE : 7UT63
RELAY MAKE : SIEMENS
RELAY NUMBER : 6
RELAY NAME : DIFFRL1
--------------------------------------------------------------------------
INPUT DATA
TRANSFORMER DETAILS
--------------------------------------------------------------------------
TRANSFORMER MVA RATING : 100.000 MVA
PRIMARY VOLTAGE : 220.000 kV
SECONDARY VOLTAGE : 132.000 kV
PRIMARY WINDING : Star-Grounded
SECONDARY WINDING : Star-Grounded
IMPEDANCE : 0.080 PU
NUMBER OF TAPS : 17
MAXIMUM VOLTAGE : 5.000 %
MINIMUM VOLTAGE : -15.000 %
------------------------------------------------------------------------------
CT DETAILS
------------------------------------------------------------------------------
PRIMARY CT RATIO : 300//1
SECONDARY CT RATIO : 400//1
------------------------------------------------------------------------------
RELAY DETAILS
------------------------------------------------------------------------------
NUMERICAL RELAY
------------------------------------------------------------------------------
SCHEME : 1
OPERATING TIME : 0.01000 S
Idmin : 0.10000 PU
------------------------------------------------------------------------------
SETTING DETAILS
------------------------------------------------------------------------------
MID TAP VOLTAGE : -5.0000 %
PRIMARY CURRENT AT MID TAP VOLTAGE : 0.92 A
SECONDARY SIDE FULL LOAD CURRENT : 437.38657 A
SECONDARY SIDE FULL LOAD CURRENT
ON CT SECONDARY : 1.09347 A
PRIMARY SIDE FULL LOAD CURRENT
AT MAX TAP : 249.93518 A
PRIMARY SIDE FULL LOAD CURRENT
AT MAX TAP ON CT SECONDARY : 0.83312 A

MiP-PSCT Database Manager User Manual
Power Research and Development Consultants Pvt. Ltd. Page 67
PRIMARY SIDE FULL LOAD CURRENT AT
MIN TAP : 308.74346 A
PRIMARY SIDE FULL LOAD CURRENT
AT MIN TAP ON CT SECONDARY : 1.02914 A
DIFFERENTIAL CURRENY AT MIN TAP : 0.11765 A
DIFFERENTIAL CURRENY AT MAX TAP : 0.09524 A
BIAS CURRENT AT MIN TAP : 0.95238 A
BIAS CURRENT AT MAX TAP : 1.05882 A
SETTING ERROR AT MIN TAP : 11.11111 %
SETTING ERROR AT MAX TAP : 10.00000 %
MAXIMUM SETTING ERROR : 11.11111 %
------------------------------------------------------------------------------
PROGRAM COMPUTED RESULTS
------------------------------------------------------------------------------
PHASE ANGLE COMPENSATION : 0 Degress
PRIMARY SIDE RATIO COMPENSATION : 1.09
SECONDARY SIDE RATIO COMPENSATION : 0.91
ZERO SEQUENCE COMPENSATION : Primary and Secondary
------------------------------------------------------------------------------
DESCRIPTION COMPUTED EXISTING
------------------------------------------------------------------------------
DIFFERENTIAL CURRENT 0.23 A 0.20 A
HIGH SET CURRENT 5.00 A 3.00 A
2nd HARMONIC RESTRAINT 15.00 % 50.00 %
5th HARMONIC RESTRAINT 30.00 % 25.00 %
SLOPE-1 START (M) 0.50 A 0.00 A
SLOPE-1(ALPHA) 25.00 % 0.00 %
SLOPE-2 START (N) 2.00 A 0.00 A
SLOPE-2(BETA) 75.00 % 0.00 %
------------------------------------------------------------------------------
1.4.30 Restricted Earth Fault Relay
To open this form, use menu option Elements > Relays > > Restricted Earth Fault. Then the form shown below will appear.
Restricted Earth Fault (REF) relay is used to protect transformer windings against earth faults. The REF scheme protects one winding so two separate REF relays are required if both windings are to be protected. The principal of operation of REF is shown in Figure 4 and Figure 5Error! Reference source not found.The difference in the distribution of fault current for external and internal faults is shown in Figure 4 and Figure 5 .This principle is made use of to isolate the transformers in case of internal faults while leaving them uninterrupted for external faults.

MiP-PSCT Database Manager User Manual
Power Research and Development Consultants Pvt. Ltd. Page 68
Figure 4. Current Distribution for an Internal Fault through Low Impedance REF
As the current sensed by the neutral and phase CTs are different in case of external and internal
faults, the REF protection utilizes this to provide selectivity. The current sensed along the neutral
terminal provides much more sensitive protection as compared to the transformer phase terminals.
The same is illustrated in Figure 5.
Figure 5 Comparison of Neutral and Phase Currents for a Transformer Internal Fault
From Figure 5, it can be concluded that by monitoring the neutral of the transformer,
the insensitivity of the differential protection to faults close to the neutral can be overcome using REF
protection. The coverage offered by the differential protection depends on the bias settings. The
exact coverage offered by differential relays can be calculated using [2]:
𝑃𝑟𝑜𝑡𝑒𝑐𝑡𝑒𝑑 𝑊𝑖𝑛𝑑𝑖𝑛𝑔% = 100% ∗ √𝑅𝑒𝑙𝑎𝑦 𝑆𝑒𝑛𝑠𝑖𝑡𝑖𝑣𝑖𝑡𝑦 ∗ 𝐶𝑇 𝑅𝑎𝑡𝑖𝑜
𝑀𝑎𝑥. 𝐿𝑖𝑛𝑒 − 𝐺𝑟𝑜𝑢𝑛𝑑 𝐹𝑎𝑢𝑙𝑡 𝐶𝑢𝑟𝑟𝑒𝑛𝑡
Keeping in mind that differential relays do not offer complete winding coverage, the REF relays are
used to provide sensitive cover for ground faults.
There are two commonly used REF schemes, High impedance REF and Low impedance REF. The schemes are depicted in Figure 4 and Figure 5 respectively. The advantage of using High Impedance REF scheme is that it is stable for CT
saturation for external fault conditions. As a result, there will be no mal-operation of the relay for
external fault due to unfaithful reproduction of the primary quantities. However, to achieve this all
CTs used in the protection scheme need to be identical. This is avoided in the low impedance
scheme at the cost of secure operation for CT saturation.
1.5 High Impedance REF

MiP-PSCT Database Manager User Manual
Power Research and Development Consultants Pvt. Ltd. Page 69
The High-Impedance REF scheme is depicted in Figure 6. An external resistor is used
which limits the fault current through the relay. This provides stability in case of external faults even if
one CT output is saturated
Figure 6. Stability under CT Saturation for External Faults
The current through relay will be the mismatch between the residual current (sum of phase currents)
and the neutral current. Under normal conditions, this current is zero. When there is an internal fault
in the transformer, a current will flow through the relay causing tripping. The settings to be provided
by the program are:
1. Relay operating current/voltage – REF schemes may have a current or a voltage threshold.
Based on user selection, the appropriate setting is provided or the threshold value. Whenever
the threshold value is exceeded, the relay trips.
2. Value of external resistance – The value of stabilizing resistor to be added is calculated
3. Varistor Requirement – In order to limit the voltage appearing across the relay, varistors are
placed to protect the relays.
1.6 Low Impedance REF

MiP-PSCT Database Manager User Manual
Power Research and Development Consultants Pvt. Ltd. Page 70
Modern numerical relays use low impedance protection for REF. The connections for this scheme
are shown in Figure 7
Figure 7 Low Impedance REF Connection Diagram
As the currents on the neutral and the phase are separately measured, the transformation
ratios of the phase and neutral CTs need not be identical. The measured currents are
compared in order to determine the Operating and Bias Current. The relay trips based on the
tripping characteristic depicted in Figure8[4]
The quantity along the X-axis is the Biasing Current and the Y-axis is the Operating or Differential
Current. The tripping characteristic can be divided into three parts:
I. Unrestrained Portion
II. Slightly Restrained
III. Highly Restrained
The setting computation involves providing the slope and limits for each of the regions. As there is no
standard method for arriving at the settings, three approaches are proposed. The user can select
which approach is to be chosen. Each of the approaches will provide the following settings:
1. Threshold and limit for unrestrained part
2. Limit and slope for the slightly restrained portion
3. Slope for the highly restrained part of the characteristic.
An option is given to the user to choose scheme. Based on this choice, the settings are computed.
Sample REF Report in MiP-PSCT
--------------------------------
TRANSFORMER RESTRICTED EARTH FAULT PROTECTION
--------------------------------------------------------------------------
INPUT DATA-TRANSFORMER DETAILS
--------------------------------------------------------------------------
TRANSFORMER NUMBER : 5
TRANSFORMER NAME : 2T5
TRANSFORMER MVA RATING : 100.00 MVA
PRIMARY VOLTAGE : 220.00 kV
SECONDARY VOLTAGE : 132.00 kV
PROTECTED WINDING : PRIMARY
PRIMARY WINDING : Star-Grounded
SECONDARY WINDING : Star-Grounded
IMPEDANCE : 0.08 pu
NEGATIVE SEQUENCE IMPEDANCE TOLERANCE : 8.00 %
DESIRED PRIMARY OPERATING CURRENT,IP(% of RATED) : 50.00 %
--------------------------------------------------------------------------
INPUT DATA-PROTECTION/RELAY
PROTECTION : RESTRICTED EARTH FAULT
HIGH IMPEDANCE
RELAY LOCATION : PRIMARY
RELAY TYPE : 7SJ61
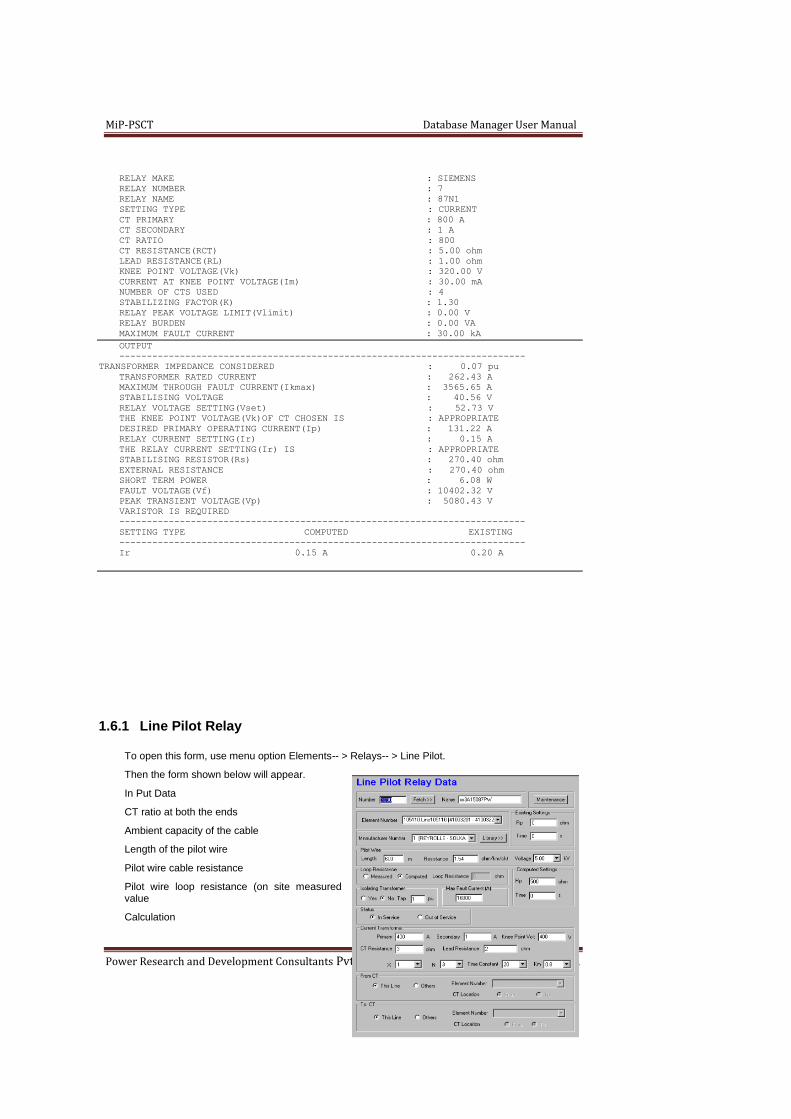
MiP-PSCT Database Manager User Manual
Power Research and Development Consultants Pvt. Ltd. Page 71
RELAY MAKE : SIEMENS
RELAY NUMBER : 7
RELAY NAME : 87N1
SETTING TYPE : CURRENT
CT PRIMARY : 800 A
CT SECONDARY : 1 A
CT RATIO : 800
CT RESISTANCE(RCT) : 5.00 ohm
LEAD RESISTANCE(RL) : 1.00 ohm
KNEE POINT VOLTAGE(Vk) : 320.00 V
CURRENT AT KNEE POINT VOLTAGE(Im) : 30.00 mA
NUMBER OF CTS USED : 4
STABILIZING FACTOR(K) : 1.30
RELAY PEAK VOLTAGE LIMIT(Vlimit) : 0.00 V
RELAY BURDEN : 0.00 VA
MAXIMUM FAULT CURRENT : 30.00 kA
OUTPUT
--------------------------------------------------------------------------
TRANSFORMER IMPEDANCE CONSIDERED : 0.07 pu
TRANSFORMER RATED CURRENT : 262.43 A
MAXIMUM THROUGH FAULT CURRENT(Ikmax) : 3565.65 A
STABILISING VOLTAGE : 40.56 V
RELAY VOLTAGE SETTING(Vset) : 52.73 V
THE KNEE POINT VOLTAGE(Vk)OF CT CHOSEN IS : APPROPRIATE
DESIRED PRIMARY OPERATING CURRENT(Ip) : 131.22 A
RELAY CURRENT SETTING(Ir) : 0.15 A
THE RELAY CURRENT SETTING(Ir) IS : APPROPRIATE
STABILISING RESISTOR(Rs) : 270.40 ohm
EXTERNAL RESISTANCE : 270.40 ohm
SHORT TERM POWER : 6.08 W
FAULT VOLTAGE(Vf) : 10402.32 V
PEAK TRANSIENT VOLTAGE(Vp) : 5080.43 V
VARISTOR IS REQUIRED
--------------------------------------------------------------------------
SETTING TYPE COMPUTED EXISTING
--------------------------------------------------------------------------
Ir 0.15 A 0.20 A
1.6.1 Line Pilot Relay
To open this form, use menu option Elements-- > Relays-- > Line Pilot.
Then the form shown below will appear.
In Put Data
CT ratio at both the ends
Ambient capacity of the cable
Length of the pilot wire
Pilot wire cable resistance
Pilot wire loop resistance (on site measured value
Calculation

MiP-PSCT Database Manager User Manual
Power Research and Development Consultants Pvt. Ltd. Page 72
Pilot wire loop resistance, RP= It is the measured on-site pilot wire resistance.
If Pilot loop resistance value is not given, RP = (Length of the pilot wire) x (pilot wire cable resistance) x 2
Isolating transformer tap position:
If pilot wire resistance is lower than 440 OHM = > TAP T1
If pilot wire resistance is between 440 to 880 OHM = > TAP T2
If pilot wire resistance is between 880 to 1760 OHM = > TAP F2
Isolating transformer tap T
= 1, if no isolating transformer fitted
= 1, for isolating transformer tapped at F2
= 0.5, for isolating transformer tapped at T2
= 0.25, for isolating transformer tapped at T1
Standard resistance value for TAP on transformer, RSV (Based on isolating transformer TAP)
Standard value of Pilot loop resistance
= 1000 (Solker R relay) if no isolating transformer fitted
= 2000 (SolkerRf relay) if no isolating transformer fitted
= 1760 (SolkerRf relay) for isolating transformer tapped at F2
= 880 (SolkerRf relay) for isolating transformer tapped at T2
= 440 (SolkerRf relay) for isolating transformer tapped at T1
Padding resistance = 0.5 X (RSV - RP)/T
Example
11 kV Cable Feeder CT: 300 A - 400 A / 1 A
Assumed cable type: 3 x 1C x 240 mm² Cu XLPE Cable
Assumed ampacity according to site condition = 525 A
Length of the pilot wire = 600 meters
Pilot wire cable resistance = 0.965 Ohm/ km
Pilot wire loop resistance, RP
= (Length of the pilot wire) x (pilot wire cable resistance) x 2
= [600/1000 x 0.965} x 2
= 1.158 Ohm
Standard value of Pilot loop resistance
= 2000 (Solker Rf relay) if no isolating transformer fitted
Isolating transformer tap T
= 1, if no isolating transformer fitted
•• Padding resistance = 0.5 x (RSV - RP)/T
= 0.5 x (2000-1.158)/1
= 999.42 Ohm (Calculated setting based on assumed data for cable)
≈ 990 Ohm (PRESENT SETTING)
Rp – Padding resistance: The purpose of padding resistance at each end is to bring the total pilot loop resistance up to a standard value (Sv) (Note: It needs to be collected from the site.)
Pilot wire length is same as cable length.
Cable resistance is same as pilot wire resistance

MiP-PSCT Database Manager User Manual
Power Research and Development Consultants Pvt. Ltd. Page 73
Voltage: 5 or 15 kV pilot wires
Loop Resistance: For full pilot wire length resistance. = Cable resistance * Length of pilot wire * 2
Measured: from the site
Computed: From the length & cable resistance (approximate values)
Isolating Transformer: It is used to increase the insulation level of the pilot wire
Tap position: Isolating transformer tap position. (Depending on tap position of isolating transformer used Sv is selected)
Maximum Fault current: Max. Fault current of the feeder used to check the CT ratio is appropriate or not.
Knee point voltage: Existing knee point voltage needs to be compared with the calculated knee point voltage using max.fault current, CT primary/secondary ratio, and lead resistance and CT resistance as input.
Note: If the calculated value of Vk is less than the existing value of Vk CT is appropriate Otherwise we need to change the CT.
Sample Line Pilot Protection Report from MiP-PSCT ---------------------------------------------------------------------
PROTECTION : LINE PILOT PROTECTION
SUBSTATION CODE : xx3
SUBSTATION NAME : SS xx3
BAY NO : A150
LINE NUMBER : 105110
LINE NAME :
FROM BUS NO : 41003201
TO BUS NO : 41003225
LINE VOLTAGE : 11.00 kV
RELAY TYPE : SOLKAR R
RELAY MAKE : REYROLLE
RELAY NUMBER : 3030
RELAY NAME : xx3A15087PW
------------------------------------------------------------------------
INPUT DATA
------------------------------------------------------------------------
CT AT BOTH ENDS
CT PRIMARY : 400 A
CT SECONDARY : 1 A
KNEE POINT VOLTAGE : 400.00 V
CT RESISTANCE : 3.00 ohm
LEAD RESISTANCE : 2.00 ohm
PILOT LINE LENGTH : 600.00 m
PILOT WIRE CABLE RESISTANCE : 1.54 ohm/km/ckt
VOLTAGE RATING OF THE CABLE : 5.00 kV
TAP POSITION : 1.00 pu
MAXIMUM FAULT CURRENT : 16000.00 A
------------------------------------------------------------------------
STANDARD VALUE OF RESISTANCE : 1000.00 ohm
COMPUTED LOOP RESISTANCE : 1.85 ohm
MINIMUM KNEE POINT VOLTAGE : 330.00 V
PADDING RESISTOR (COMPUTED) : 499.08 ohm
PADDING RESISTOR : 500.00 ohm
EXISTING CT SATISFIES KNEE POINT VOLTAGE REQUIREMENTS
1.6.2 Bus Bar Differential Relay
To open this form, use menu option Elements-- > Relays-- > Bus Bar Differential. Relay
Bus Bar Protection
The general Principal of high impedance bus differential protection and the calculation for value of stabilizing resistance is mentioned in this section.
General Philosophy:
System protection that includes over current or distance protection will inherently give protection cover to the bus bars. Over current protection will only be applied to relatively simple distribution

MiP-PSCT Database Manager User Manual
Power Research and Development Consultants Pvt. Ltd. Page 74
systems, or as a back-up protection, set to give a considerable time delay. Distance protection will provide cover for bus bar faults with its second and possibly subsequent zones. In both cases the bus bar protection obtained is slow and suitable only for limiting the consequential damage.
Bus bar protection is primarily concerned with speedy isolation of bus bar faults in less time than could be achieved by back-up line protection, with the twin object of maintaining system stability and limitation of consequential damage. Some early bus bar protection schemes used a low impedance differential system having a relatively long operation time, of up to 0.5seconds. The basis of most modern schemes is a differential system using either low impedance biased or high impedance unbiased relays capable of operating in a time of the order of one cycle at a very moderate multiple of fault setting. The application of the high impedance differential relay is based on all of the CT’s is set to the same ratio.
High Impedance (Voltage operated) Differential Relay is applied on the assumption that the CT associated with the faulted feeder (carrying the total fault current in case of through fault, refer fig. 3.1) saturates completely. The relay, which is connected across the junction point of the CT’s has an impedance which is much greater than the total resistance of the CT circuit which is comprised of the CT Resistance plus any lead resistance from the junction point to the relay. The voltage (Vr) across the relay will then be equal to the drop in the resistance resulting from the total fault current flowing through this resistance. Calculations are made for each CT circuit to determine the maximum possible voltage that can be developed across the relay (assuming total saturation in each circuit). The relay is than this voltage by a suitable margin.
Fig.: High Impedance Bus differential protection
Assuming that the fault current I1 flows through the saturated CT, Voltage across the relay is given by the equation Vr=I1 (2.RL+RCT). The Relay circuit impedance is then adjusted so that the necessary voltage to operate the relay is greater than the voltage Vr.
Vs=Is.R
Where,
Vs=Relay circuit voltage setting
I1=Fault current seen by the relay
Is=Relay current setting
R= Relay Branch impedance
RL=Ct lead resistance
RCT=CT secondary winding resistance
In order to avoid relay operation for through faults, Vs > Vr. For this, an additional resistor called stabilizing resistor Rst is used in series with relay coil resistance Rr.
Thus R=Rst+Rr.
To enable faster operation of relay, the CT should have a knee point voltage equal to at least twice the relay setting voltage Vs.

MiP-PSCT Database Manager User Manual
Power Research and Development Consultants Pvt. Ltd. Page 75
Knee point voltage for current transformers Vk ≥ 2 Vs implies Vs ≤ Vk /2.
Further, the secondary effective setting (Is) is the sum of the minimum operating current and the excitation losses in all parallel connected current transformers, whether carrying primary current or not. This summation should strictly be vectorial, but is usually done arithmetically and is expressed as:
Ir=CT ratio [Is +n X Ies]
Where,
Ir=Effective setting
Is= Relay current setting
Ies=CT excitation current at relay setting voltage
N= number of parallel connected CTs
It is desirable that the primary setting Ir should not exceed 30% of the prospective minimum fault current.
Relay Number: Enter serial number of the relay
Relay Name: Enter relay name
Bus No: Select the bus number on which relay is placed from the drop down list.
Manufacturer: Select relay type from the drop down list. If relay type is not available enter a no. in this field and click on Library button to enter the relay details.
Note: Depending on the relay type required fields will be enabled to enter the data
Current Transformer: Bus coupler current transformer Primary and secondary details to be entered
Knee Point Voltage: Existing knee point voltage needs to be compared with the calculated knee point voltage using max. fault current, CT primary/secondary ratio, lead resistance and CT resistance as input.
Note: If the calculated value of Vk is less than the existing value of Vk CT is appropriate Otherwise we need to change the CT.
Fault Current in Amperes:
Variable resistor: Its value is in ohms. Typical value is 3000ohm, 6000 ohm and 9000 ohm
Differential Circuit resistance: It is a fixed quantity represented in ohms. For REB103 its value is 2.2 ohms
Stabilizing circuit resistance: It is a fixed quantity represented in ohms. For REB103 its value is 16 ohms
Load current in Amperes
AuxiliaryCT Ratio Auxiliary CT's are used for ratio correction and also for reducing the 1 amp and 5 amps rated current to 0.5 relay current. It is fixed quantity. For REB103 relay its value is 10
Relay Safety factor:
Computed settings: After the execution of busbar differential computed settings fields are populated by the setting results.
Sample Bus Bar Differential Protection Report from MiP-PSCT
PROTECTION : BUS BAR DIFFERENTIAL PROTECTION
SUBSTATION CODE : xx8
SUBSTATION NAME : SS xx8
BAY NO : B121
BUS NUMBER : 63008401
BUS NAME : AIRPS401
RELAY TYPE : RXIG-22
RELAY NUMBER : 8251
RELAY NAME : xx8B12187B
-------------------------------------------------------------------------
INPUT DATA
-------------------------------------------------------------------------
BUSBAR VOLTAGE : 66.00 kV

MiP-PSCT Database Manager User Manual
Power Research and Development Consultants Pvt. Ltd. Page 76
CT PRIMARY CURRRENT : 2000.00 A
CT SECONDARY CURRENT : 1.00 A
-------------------------------------------------------------------------
OUTPUT
-------------------------------------------------------------------------
MINIMUM PRIMARY OPERATING VALUE : 6000.00
PICK UP TIME : 12100.00 ms
-------------------------------------------------------------------------
1.6.3 Line Cable Differential Relay
To open this form, use menu option Elements > Relays > > Line/Cable Differential. Relay
Line Number: Select the element number from the drop down list of the combo box
Manufacturer Number: Select the line differential relay library from the drop down list
Current Transformer: Primary and secondary ratings of Current transformer in Amps
2nd Harmonic Restraint: To block the transformer charging currents if the line is connected to a transformer. Its range is 20% to 25% of fundamental current.
Proposed settings: From the entered data program will compute the values for the proposed settings.
Existing settings: Existing field data for the line differential relay is to be entered
From CT: Current transformer location like element, element no and from side of the line are to be specified. This data is considered for trip sequence simulation.
To CT: Current transformer location like element, element no and To side of the line are to be specified. This data is considered for trip sequence simulation.
Example:
CALCULATION FOR TYPICAL CABLE:
Line details and CT Details
Input Data:
Voltage level of the transmission Line/Cable.
Frequency of the system.
Length of the Line/Cable.
CT Ratio Connected for the protection.
Shunt capacitance of the line/Cable.
Calculations:
Rated voltage of the line “Un” = 400 kV
Frequency of the system “fn” = 50 Hz.
Line/Cable length “L” = 29.3 Km.
Line/cable Shunt capacitance “C” = 12.6 ηF/km.
CT Ratio “CTr” = 2000/1.
Charging Current “Ic” = 3.63*Un*fn*C
= 24.7163 A
Differential Current “Id” = 2.5*Ic
= 61.7908 A
Differential current at ct secondary = Id/CTr

MiP-PSCT Database Manager User Manual
Power Research and Development Consultants Pvt. Ltd. Page 77
= 0.0308 A
Set value of differential current = Id/CTr + tolerance
= 0.3.
Sample Line Differential Protection Report from MiP-PSCT ----------------------------------------------------------------
PROTECTION : CABLE DIFFERENTIAL PROTECTION
SUBSTATION CODE : xx3
SUBSTATION NAME : SS xx3
BAY NO : B011
LINE NUMBER : 4120
LINE NAME : Line4120
FROM BUS NO : 51001401
TO BUS NO : 41003401
RELAY TYPE : SIEMENS
RELAY MAKE : 7SD5
RELAY NUMBER : 3401
RELAY NAME : xx3B01187C1
----------------------------------------------------------------
INPUT DATA
----------------------------------------------------------------
VOLTAGE LEVEL OF LINE//CABLE : 66.00 kV
SYSTEM FREQUENCY : 50.00 Hz
LENGTH OF LINE/CABLE : 2.19 Kms
SHUNT CAPACITANCE OF LINE//CABLE : 1.8260e-007 F/km
CT RATIO : 400//1 A
----------------------------------------------------------------
OUTPUT
----------------------------------------------------------------
CHARGING CURRENT : 4.7839 A
DIFFERENTIAL CURRENT : 11.9597 A
DIFFERENTIAL CURRENT (SECONDARY) : 0.0299 A
DIFFERENTIAL CURRENT SETTING : 0.23 A
VALUE UNDER SWITCH ON : 0.0718 A
SET VALUE UNDER SWITCH ON : 0.27 A
TOLERANCE : 0.20
1.6.4 Three Winding Transformer
To open this form, use menu option “Elements > Three Winding transformer”. Then the form shown below will appear.
Type: Select the element type as 3 winding transformer or auto transformer.
Voltage Control Bus Number
This field is to specify the control bus number where voltages need to be controlled by the transformer tap. This bus can be selected from the list box provided, which displays all the buses present in the database. If the transformer library has OLTC and tap changing should be blocked then select bus 0 as voltage controlled bus.

MiP-PSCT Database Manager User Manual
Power Research and Development Consultants Pvt. Ltd. Page 78
Nominal Tap position
This field is to specify the nominal tap position. This is the tap number at which study is to be carried out.
Phase Shift Angle
Select this option to specify the Phase Shift angle in degrees between the primary and secondary voltage of the transformer. This field is used only for phase shifting transformer.
In three winding transformers, tap is specified from the HT winding to a dummy node arising because of the equivalent star connection representation. For other two branches (secondary and tertiary) the nominal tap position is at rated kV. For phase shift Transformer, the phase shift being represented in polar form, phase shift magnitude is given in nominal tap position and angle (in degrees) in phase shift angle position.
Primary Grounding Resistance
This field is to specify the resistance between the star point of the primary coil of the transformer and the ground. Primary Grounding Resistance value is given in ohms. It is used only during zero sequence network calculations. The values are applicable only for star with neutral grounded transformers.
Secondary Grounding Resistance
This field is to specify the resistance between the star point of the secondary coil of the transformer and the ground. Secondary Grounding Resistance value is given in ohms. It is used only during zero
sequence network calculations. The values are applicable only for star with neutral grounded transformers.
Tertiary Grounding Resistance
This field is to specify the resistance between the star point of the tertiary coil of the transformer and the ground. Tertiary Grounding Resistance value is given in ohms. It is used only during zero sequence network calculations. The values are applicable only for star with neutral grounded transformers.
Primary Grounding Reactance
This field is to specify the reactance between the star point of the primary coil of the transformer and the ground. Primary Grounding Reactance value is given in ohms. It is used only during zero sequence network calculations. The values are applicable only for star with neutral grounded transformers.
Secondary Grounding Reactance

MiP-PSCT Database Manager User Manual
Power Research and Development Consultants Pvt. Ltd. Page 79
This field is to specify the reactance between the star point of the secondary coil of the transformer and the ground. Secondary Grounding Reactance value is given in ohms. It is used only during zero sequence network calculations. The values are applicable only for star with neutral grounded transformers.
Tertiary Grounding Reactance
This field is to specify the reactance between the star point of the tertiary coil of the transformer and the ground. Tertiary Grounding Reactance value is given in ohms. It is used only during zero sequence network calculations. The values are applicable only for star with neutral grounded transformers.
Use compute (similar to two winding transformer) if the transformer is grounded through earthing transformer.
Earthing Transformer: If it is checked / selected then the transformer is considered as earthing transformer
Tertiary (Auto Tr): If the element type is Auto transformer, the tertiary winding is Drawn out or Fused one can be specified. Selection can be viewed on SLD
Differential Relay: Unit protection differential relay present on the element is shown here. On click of Go TO > > button opens the Differential relay data form
Restricted Earth Fault Relay: Unit protection restricted earth fault relay present on the element is shown here. On click of Go TO > > button opens the restricted earth fault relay data form.
Over current Relay: Over current Relay present on the element is shown here. On click of Relay button opens the Over current relay data form showing the relay details.
1.6.5 Current or Voltage Source
To open this form, use menu option “Elements > Current/Voltage Source”. Then the form shown below will appear.
Source Quantity
Specify the source quantity here. It can be either Current or Voltage source
Source Type
The user also has the option to select nature of the source, namely, RMS source and Instantaneous source.
1.6.6 Lightning Arrester
To open this form, use menu option “Elements > Lightning Arrester”. Then the form shown below will appear.
1.6.7 Switch
To open this form, use menu option “Elements > Switch”. Then the form shown below will appear.
Line Number
This field is to specify the line number to which the switch is connected.
Line end
This specifies the switch position. The switch can be connected either on the From end or To end of the line.
1.6.8 MOV

MiP-PSCT Database Manager User Manual
Power Research and Development Consultants Pvt. Ltd. Page 80
Metal oxide varistor is used very similar to normal surge arresters. However, it is connected between two buses in contrast to phase-to ground connection. The general application of MOV is used to protect the series capacitors in power systems during faults.
To open this form, use menu option “Elements > ETA->MOV”. Then the form shown below will appear.
This form requires the from bus and to bus numbers to which MOV is connected.
1.6.9 Spark Gap
The Spark Gap is very similar to voltage controlled switch, and is connected between two buses. This gap model is normally self-triggered one based on voltage magnitude across the gap. However, for special application to protect the series capacitor during system faults can be externally triggered based on the external signal (for example the energy limit of MOV is used to trigger the Spark gap)
To open this form use menu option “Elements > ETA->Spark Gap”. Then the form shown below will appear.
Spark Gap connection details are to be provided here.
Delay Time : is the time after receiving the command ex; 0.001 s
Damping Inductance : This is the discharge damping circuit inductance in Henry.
Damping Resistance : This is the discharge damping circuit Resistance in ohms
Re-insertion time : Re-insertion time for series capacitor to insert in the circuit after by pass (after fault clearing time.
1.6.10 Shunt Resistor
Shunt resistor is used in EMTP simulations. For a double circuit line if one circuit is open it is grounded through shunt resistor. If the fault occurs on a line carrying current, a

MiP-PSCT Database Manager User Manual
Power Research and Development Consultants Pvt. Ltd. Page 81
large current will flow through the conductor which is out of service due to mutual coupling.
To open this form use menu option “Elements > ETA->Shunt Resistor”. Then the form shown below will appear.
Resistance value (pu on its own rating)in pu is considered for the studies.
1.6.11 Current Transformer
Option to enter entire CT Details – Database manager-CT Screen-Static screen Data entered is not consider for analysis. Presently this is only for information. Rating1,2,3,4 can be specified in Amps User selected rating of CT rating will appear on the SLD.CT Rating (primary and secondary), CT burden, PF burden, R sec in ohms, Xsec in ohms, core loss component values will be considered in EMTP study. Magnetization curve data i. e. rms values of current in Amps and voltage in Volts will appear by default. User has an option to add and delete data with ADD and DELETE button
Potential Transformer
Feeder Number : Feeder number of the feeder on which potential transformer is located
Tag Number : Unique alphanumeric tag number
Switch Board Name
Sub Station : Name of the sub-station to which this PT belongs to

MiP-PSCT Database Manager User Manual
Power Research and Development Consultants Pvt. Ltd. Page 82
1.6.12 Ammeter
1.6.13 Voltmeter
Serial Number : Serial number of the PT
Make : Potential transformer Make
Class : Class of the current transformer
Ratio : PT Ratio
VF
BIL : Basic Insulation Level
Type
Feeder Number : Feeder number of the feeder on which ammeter is located
Tag Number : Unique alphanumeric tag number
Switch Board Name
Sub Station : Name of the sub-station to which this Ammeter belongs to
Serial Number : Serial number of the Ammeter
Make : Ammeter Make
Class : Class of the Ammeter
Range : Range of the ammeter
CTR : Current transformer reference
PTR : Potential transformer reference
Feeder Number : Feeder number of the feeder on which voltmeter is located
Tag Number : Unique alphanumeric tag number
Switch Board Name
Sub Station : Name of the sub-station to which this voltmeter belongs to
Serial Number : Serial number of the voltmeter
Make : Voltmeter Make
Class : Class of the Voltmeter
Range : Range of the Voltmeter
Type
AC/DC voltmeter
PTR : Potential transformer reference

MiP-PSCT Database Manager User Manual
Power Research and Development Consultants Pvt. Ltd. Page 83
1.6.14 Multimeter
1.6.15 Circuit Breaker
1.6.16 Battery
Feeder Name : Feeder number of the feeder on which Multimeter is located
Tag Number : Unique alphanumeric tag number
CT : Associated Current transformer reference number
PT : Associated Potential transformer reference number
Real Power : Real Power in MW
Reactive Power : Reactive power in Mvar
Power Factor : Power factor
Frequency : Frequency
Feeder Number : Feeder number of the feeder on which CB is located
Tag Number : Unique alphanumeric tag number
Switch Board Name :
Sub Station : Name of the sub-station to which this CB belongs to
Serial Number : Serial number of the CB
Make : CB Make
Type CB Type
Medium
Rated Voltage
Breaking Current
Making Current
Weight Weight of the CB
Rated Current
Rated Frequency
STC
Standard
Year Year of Manufacture

MiP-PSCT Database Manager User Manual
Power Research and Development Consultants Pvt. Ltd. Page 84
1.6.17 Battery Charger
1.6.18 Measurement Data
State estimation processes a set of measurements to obtain the best estimate of the current state of the power system according to some criteria. It is a mathematical tool which is based on the network connectivity information, network parameters, the analog measurement which is redundant in nature, estimates the state of the given power system i.e., computes the voltage magnitude and angle at each and every bus. Usually, the process involves imperfect measurements that are redundant and the process of estimating the system states is based on a statistical criterion that estimates the true value of the state variables to minimize or maximize the selected criterion. A commonly used and familiar criterion is that of minimizing the sum of the squares of the differences between the estimated and “true” (i.e, measured) values of a function.
In a power system, the state variables are the voltage magnitudes and relative phase angles at the system nodes/buses. Once the voltage magnitude and angles are known, power flow can be computed.
Measurements are required in order to estimate the system performance in real time for both system security control and constraints on economic dispatch. The inputs to an estimator are imperfect power system measurements of voltages, power, VAR, or ampere-flow quantities. The estimator is designed to produce the “best estimate” of the system voltage and phase angles,
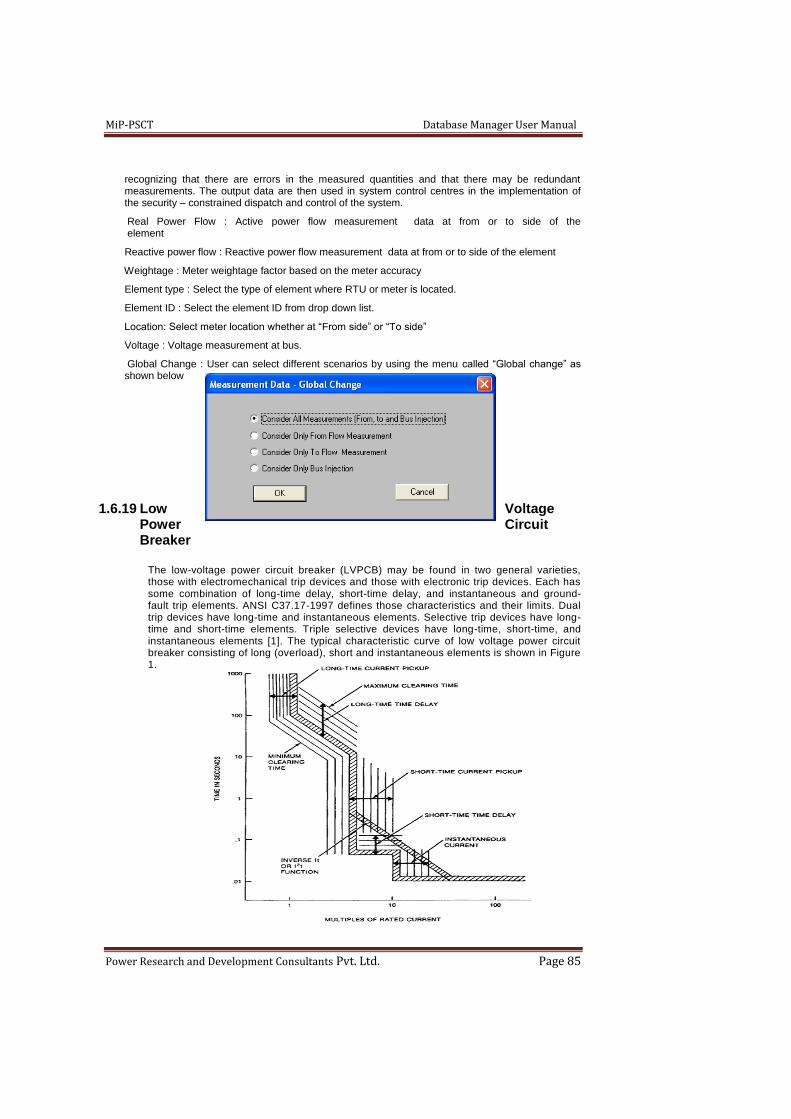
MiP-PSCT Database Manager User Manual
Power Research and Development Consultants Pvt. Ltd. Page 85
recognizing that there are errors in the measured quantities and that there may be redundant measurements. The output data are then used in system control centres in the implementation of the security – constrained dispatch and control of the system.
Real Power Flow : Active power flow measurement data at from or to side of the element
Reactive power flow : Reactive power flow measurement data at from or to side of the element
Weightage : Meter weightage factor based on the meter accuracy
Element type : Select the type of element where RTU or meter is located.
Element ID : Select the element ID from drop down list.
Location: Select meter location whether at “From side” or “To side”
Voltage : Voltage measurement at bus.
Global Change : User can select different scenarios by using the menu called “Global change” as shown below
1.6.19 Low Voltage Power Circuit Breaker
The low-voltage power circuit breaker (LVPCB) may be found in two general varieties, those with electromechanical trip devices and those with electronic trip devices. Each has some combination of long-time delay, short-time delay, and instantaneous and ground-fault trip elements. ANSI C37.17-1997 defines those characteristics and their limits. Dual trip devices have long-time and instantaneous elements. Selective trip devices have long-time and short-time elements. Triple selective devices have long-time, short-time, and instantaneous elements [1]. The typical characteristic curve of low voltage power circuit breaker consisting of long (overload), short and instantaneous elements is shown in Figure 1.
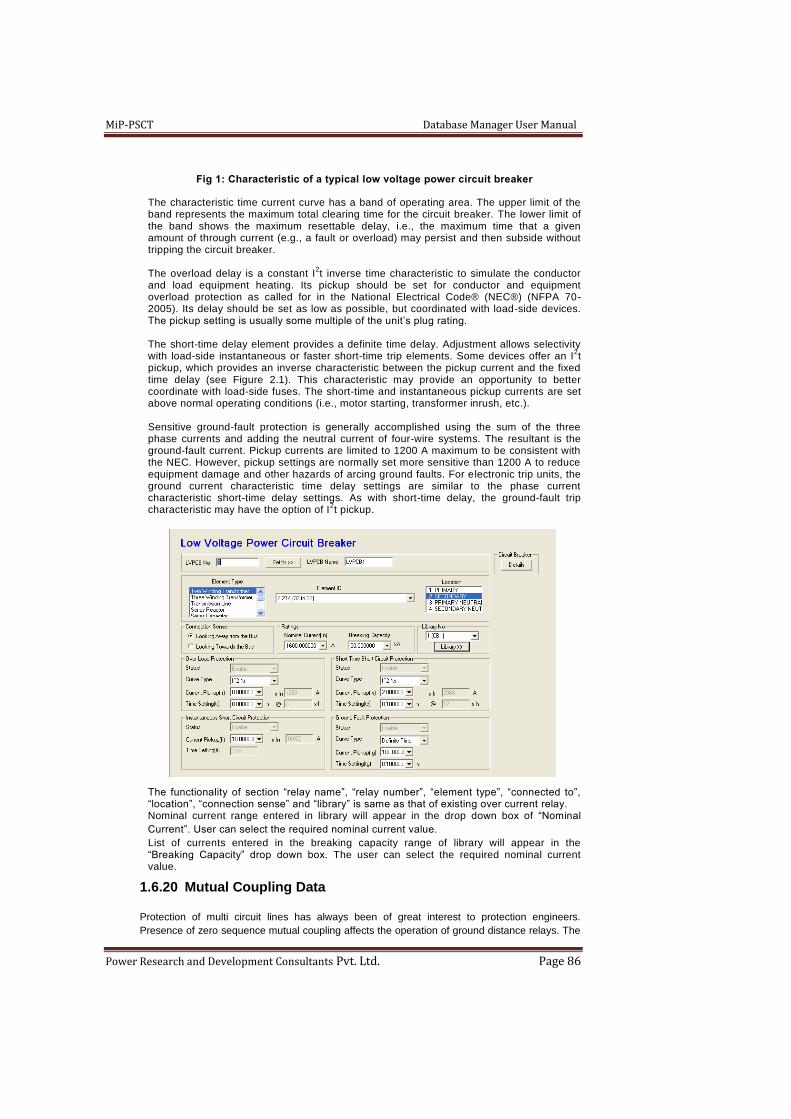
MiP-PSCT Database Manager User Manual
Power Research and Development Consultants Pvt. Ltd. Page 86
Fig 1: Characteristic of a typical low voltage power circuit breaker
The characteristic time current curve has a band of operating area. The upper limit of the band represents the maximum total clearing time for the circuit breaker. The lower limit of the band shows the maximum resettable delay, i.e., the maximum time that a given amount of through current (e.g., a fault or overload) may persist and then subside without tripping the circuit breaker. The overload delay is a constant I
2t inverse time characteristic to simulate the conductor
and load equipment heating. Its pickup should be set for conductor and equipment overload protection as called for in the National Electrical Code® (NEC®) (NFPA 70- 2005). Its delay should be set as low as possible, but coordinated with load-side devices. The pickup setting is usually some multiple of the unit’s plug rating. The short-time delay element provides a definite time delay. Adjustment allows selectivity with load-side instantaneous or faster short-time trip elements. Some devices offer an I
2t
pickup, which provides an inverse characteristic between the pickup current and the fixed time delay (see Figure 2.1). This characteristic may provide an opportunity to better coordinate with load-side fuses. The short-time and instantaneous pickup currents are set above normal operating conditions (i.e., motor starting, transformer inrush, etc.). Sensitive ground-fault protection is generally accomplished using the sum of the three phase currents and adding the neutral current of four-wire systems. The resultant is the ground-fault current. Pickup currents are limited to 1200 A maximum to be consistent with the NEC. However, pickup settings are normally set more sensitive than 1200 A to reduce equipment damage and other hazards of arcing ground faults. For electronic trip units, the ground current characteristic time delay settings are similar to the phase current characteristic short-time delay settings. As with short-time delay, the ground-fault trip characteristic may have the option of I
2t pickup.
The functionality of section “relay name”, “relay number”, “element type”, “connected to”, “location”, “connection sense” and “library” is same as that of existing over current relay. Nominal current range entered in library will appear in the drop down box of “Nominal
Current”. User can select the required nominal current value.
List of currents entered in the breaking capacity range of library will appear in the “Breaking Capacity” drop down box. The user can select the required nominal current value.
1.6.20 Mutual Coupling Data
Protection of multi circuit lines has always been of great interest to protection engineers.
Presence of zero sequence mutual coupling affects the operation of ground distance relays. The

MiP-PSCT Database Manager User Manual
Power Research and Development Consultants Pvt. Ltd. Page 87
voltage, and therefore the current, measured at the relaying end are not only influenced by the
positive and zero sequence impedances of the line itself, but also upon the mutual impedance
between the parallel lines.
The zero sequence impedance is either entered in ohm/km or p.u. as per the PU choice in the
database.
A Go To>> option in Line/ Cable Data is also provided. Also validation is given which will give
warning if the line is deleted when mutual coupling is present.
Valid Topologies
1. Mutual coupling between lines connected to same buses
2. Mutual coupling between lines of different buses
3. Mutual coupling among lines of different voltages

MiP-PSCT Database Manager User Manual
Power Research and Development Consultants Pvt. Ltd. Page 88
4. Multi-Circuits: In cases where parallel lines are modelled using the no of circuits in the
Line/Cable data, it’s the users responsibility to give the compensated zero sequence impedance
in the line library
5. Mutual among Multi-Circuits: In cases where there is a mutual coupling between lines having
more than one circuits, MiP-PSCT will consider it as two equivalent single circuit lines with
mutual coupling between them. If individual contribution is to be seen then the circuits have to be
modelled as independent lines.
6. Different Lengths: In cases where the lines are of different length, the mutual coupling will be
taken with respect to the smallest line.
7. Dot Convention: The mutual coupling convention will be taken with respect to the From and To
buses of the lines.
8. Per-Unitization: Mutual coupling will be Per-Unitized with respect to Line1 voltage and the
smallest line length of the two.
9. Line Earthing: When the line is kept “Out of Service” then the “Maintenance” option, from the To
and From Side open group, will be used to determine whether the line is earthed or not. If other
option of the group is selected, then the line will be treated as open and not earthed.
Double circuit lock: This option is used in EMTP studies for double circuit line simulation and
observe the effect of mutual coupling in different operational scenarios. For this line lengths of double
circuit lines should be same. This considers the susceptance value (B0m/2) of mutual coupling.
1.7 Library Menu
Series Elements
1.7.1 Two Winding Transformer
To open this form, use menu option “Libraries > Series Elements > Two-winding transformer”. Then the form shown below will appear.
Primary Voltage
This field is to specify the Primary side voltage of the transformer in kV.
Secondary Voltage
This field is to specify the Secondary side voltage of the transformer in kV.
Tap
Two options are provided to modify the transformer tap position setting to improve the voltage at the desired bus. Fixed Tap, where in transformer tap is fixed and On Line Tap Change (OLTC) where in the transformer tap can be changed in steps according to the load variation. The user can select any of these options.

MiP-PSCT Database Manager User Manual
Power Research and Development Consultants Pvt. Ltd. Page 89
Minimum Tap Number
This field is to specify the minimum tap number existing on the transformer.
Minimum Tap Voltage
This field is for specifying the voltage in kV corresponding to the minimum tap position.
Maximum Tap Number
This field is for specifying the maximum tap number existing on the transformer.
Maximum Tap Voltage
This field is for specifying the voltage in kV corresponding to the maximum tap position. If a transformer has tap variation from 85% to 105%, with step of 2.5%, then the minimum tap number is 1, maximum tap number is 9. If the primary voltage is 220 kV, the minimum tap voltage is 187 kV and maximum tap voltage is 231 kV.
Positive Sequence X to R Ratio
This field is for specifying the positive sequence X/R ratio of the transformer. Generally, the transformer positive sequence X to R ratio will be 20.
Zero Sequence X to R ratio
This field is for specifying the zero sequence X/R ratio of the transformer. In generally the zero sequence, X to R ratio will be equal to that of Positive sequence X by R ratio.
Winding Configuration
The user has three options for each winding connection. User can select any option according to his requirement. Winding configuration options are Star Connected with isolated neutral, Star connected with grounded neutral and Delta Connected. Phase shift between windings can be mentioned using the option provided.
No load Loss: These are mainly corresponding to core loss and iron loss. This is considered in electromagnetic transient analysis
Copper Loss: These are related to I2 R losses. If no load loss and copper losses are available X to R ratio can be computed.
Magnetization Curve Data:Modelled in Electro Magnetic Transient analysis)
Magnetization curve can be represented on primary or secondary.
On selection of magnetization curve the values appear by default.
Residual Flux: The residual flux for phase A, B and C should be entered in pu. Sum of residual flux in phase A, phase B and phase C is equal to be zero. Ex: Phase A = 0.5 pu, Phase B=--25 and phase C = -0.25 pu.
I-V Characteristics: Non –linear magnetization branch can be represented with piece wise linear approximation with finite number of I-V samples. Current in % of transformer rated current and voltage in pu are to be entered in the list box. Standard data records are available. Additional records can be added by ADD button. Select the record and use Delete button to remove the data.
Thermal Curve:
Transformers may be classified into liquid and dry types based on the cooling methods employed. For liquid type and dry type transformer, the thermal limits are based on IEEE C57.109-1993 [2] and IEEE C57.12.59-2001 [3] respectively. The user has to select “dry type” and “liquid type” as transformer type in transformer library window to differentiate between the two. Liquid type Transformer

MiP-PSCT Database Manager User Manual
Power Research and Development Consultants Pvt. Ltd. Page 90
Liquid type transformers may be divided into Categories I, II, III, and IV based on their rated power as per IEEE standard C57.12.00-2000 [4]. All four categories are modelled in MiP-PSCT Table 1 depicts how the transformers are segregated.
Table 1: Transformer Category as per IEEE C57.12.00-2000
Category Three phase
(kVA)
I 15 to 500
II 501 to 5000
III 5001 to 30000
IV Above 30000
Short-time thermal load capability of oil-immersed transformers is summarized in Table 2.
Table 2: Transformer short-time thermal load capability as per IEEE C57.109-1993
Time (s) Times rated current (pu)
2 25
10 11.3
30 6.3
60 4.75
300 3
1800 2
For Categories I, only thermal curves are sufficient for coordinating the protective relays owing to their small capacities. Category IV transformers mechanical damage considerations are taken into account while designing the withstand curve. For Categories II and III transformers, the mechanical damage curve may be considered or neglected. This depends upon the number of fault occurrences in the transformer’s lifetime and fault currents seen.
Dry type Transformer
The dry-type transformers designated as Category I and Category II in IEEE Std. C57.12.01-1998 [5]. Category III transformers have not been included since these are not commonly manufactured and may require special consideration depending on the manufacturer’s recommendations. Category I and Category II transformers as defined in IEEE Std. C57.12.01-1998 and adopted in Table 3. In MiP-PSCT Category 1 and category 2 are modelled.
Table 3: Transformer Category as per IEEE C57.12.01-1998
Category Three phase (kVA)
I 15 to 500
II 501 to 5000
The short-time thermal load capability of dry type transformers is summarized in Table 4.
Table 4: Transformer short-time thermal load capability as per IEEE C57.12.59-2001
Transformer category Time (sec)
Times rated current (pu)

MiP-PSCT Database Manager User Manual
Power Research and Development Consultants Pvt. Ltd. Page 91
I 2 25
II 2 25
1.7.2 Transmission Line
To open this form, use menu option “Libraries > Series Elements > Transmission Line”. Then the form shown below will appear.
Positive Sequence Half Line Charging Susceptance (B / 2)
This field is for specifying the positive sequence half line charging Susceptance of the transmission line in mho per km length or in p.u according to the configuration.
Zero Sequence Half Line Charging Susceptance
This field is to specify the zero sequence half line charging susceptance of the transmission line in mho per km length or p.u as the case may be according to the configuration.
Thermal Rating
The current carrying capacity of the transmission line in MVA. This is the thermal rating or surge impedance loading depending on the value to be considered. When a study is conducted, loading on individual lines will be displayed according to this rating in the report with different attributes.
Line Harmonic Number
This field is for specifying the library reference, where the line data in 3 phase form for harmonic analysis or 3 phase load flow analysis is specified.
Compute
The thermal rating of the line can be computed. Click on compute the dialog box appears enter current rating and line voltage. Click OK to accept the computed MVA rating.
Surge Impedance: The surge impedance loading is the loading capability of the line. Usually short lines are loaded above SIL and long lines lower than SIL because of the stability limitations. These values are displayed by default depending on the line parameters
1.7.3 Reactor
To open this form, use menu option “Libraries > Series Elements > Reactor”. Then the form shown below will appear

MiP-PSCT Database Manager User Manual
Power Research and Development Consultants Pvt. Ltd. Page 92
Magnetising Curve Data (Used only in Electro Magnetic Transient Analysis)
Knee Point Flux 1
The series reactor knee point flux in p.u volts before saturation.
Knee Point Flux 2
Knee point flux of series reactor in p.u volts after saturation.
Positive Sequence Saturation Data
Resistance R1
Positive sequence resistance of the series reactor in p.u on its own base before saturation in the piece wise linearized saturation curve representation of the magnetizing flux.
Resistance R2
Positive sequence resistance of the series reactor in p.u on its own base after saturation in the piece wise linearized saturation curve representation of the magnetizing flux.
Reactance X1
Positive sequence reactance of the series reactor in p.u on its own base before saturation in the piece wise linearized saturation curve representation of the magnetizing flux.
Reactance X2
Positive sequence reactance of the series reactor in p.u on its own base after saturation in the piece wise linearized saturation curve representation of the magnetizing flux.
Zero Sequence Saturation Data
Resistance R1
Zero sequence resistance of the series reactor in p.u on its own base before saturation in the piece wise linearized saturation curve representation of the magnetizing flux.
Resistance R2
Zero sequence resistance of the series reactor in p.u on its own base after saturation in the piece wise linearized saturation curve representation of the magnetizing flux.
Reactance X1
Zero sequence reactance of the series reactor in p.u on its own base before saturation in the piece wise linearized saturation curve representation of the magnetizing flux.
Reactance X2
Zero sequence reactance of the series reactor in p.u on its own base after saturation in the piece wise linearized saturation curve representation of the magnetizing flux.

MiP-PSCT Database Manager User Manual
Power Research and Development Consultants Pvt. Ltd. Page 93
1.7.4 Capacitor
To open this form, use menu option “Libraries > Series Elements > Capacitor”. Then the form shown below will appear.
Switched Capacitor
Enter capacitor bank details in this for switched capacitor
Shunt Elements
1.7.5 Reactor
To open this form, use menu option “Libraries > Shunt Elements > Reactor”. Then the form shown below will appear.
kV rating
Generally the shunt reactor voltage rating is slightly higher than the nominal base voltage. A 400 kV shunt reactor is rated at 420kV and reactance value is specified corresponding to 420kV.
Magnetizing Curve Data (Used only in Electromagnetic Transient Analysis)
Knee Point Flux 1
The series reactor knee point flux in p.u volts before saturation.
Knee Point Flux 2
Knee point flux of series reactor in p.u volts after saturation.

MiP-PSCT Database Manager User Manual
Power Research and Development Consultants Pvt. Ltd. Page 94
Positive Sequence Saturation Data
Resistance R1
Positive sequence resistance of the series reactor in p.u on its own base before saturation in the piece wise linearized saturation curve representation of the magnetizing flux.
Resistance R2
Positive sequence resistance of the series reactor in p.u on its own base after saturation in the piece wise linearized saturation curve representation of the magnetizing flux.
Reactance X1
Positive sequence reactance of the series reactor in p.u on its own base before saturation in the piece wise linearized saturation curve representation of the magnetizing flux.
Reactance X2
Positive sequence reactance of the series reactor in p.u on its own base after saturation in the piece wise linearized saturation curve representation of the magnetizing flux.
Zero Sequence Saturation Data
Resistance R1
Zero sequence resistance of the series reactor in p.u on its own base before saturation in the piece wise linearized saturation curve representation of the magnetizing flux.
Resistance R2
Zero sequence resistance of the series reactor in p.u on its own base after saturation in the piece wise linearized saturation curve representation of the magnetizing flux.
Reactance X1
Zero sequence reactance of the series reactor in p.u on its own base before saturation in the piece wise linearized saturation curve representation of the magnetizing flux.
Reactance X2
Zero sequence reactance of the series reactor in p.u on its own base after saturation in the piece wise linearized saturation curve representation of the magnetizing flux.
Neutral grounding resistance and reactance
Neutral grounding resistance in pu and reactance in pu on 100 MVA base is required to be entered. This is considered in electromagnetic transient analysis.
1.7.6 Capacitor
To open this form, use menu option “Libraries > Shunt Elements > Capacitor”.
Then the form shown below will appear
kV Rating The 11kV capacitor is generally rated at 12.5kV and
66kV capacitor bank is generally rated at 72kV.
1.7.7 Generator
To open this form, use menu option “Libraries > Shunt Elements > Generator”. Then the form shown below will appear.
MW Rating
Specify the real power rating of the generator in MW in this field.
kV Rating
Specify the voltage rating of the generator in kV in this field.

MiP-PSCT Database Manager User Manual
Power Research and Development Consultants Pvt. Ltd. Page 95
Armature resistance (Ra)
Specify armature resistance of the generator in p.u on its own rating in this field.
Direct axis reactance (Xd)
Specify the steady state direct axis reactance of the generator in p.u in this field.
Quadrature axis reactance (Xq)
Specify the steady state quadrature axis reactance of the generator in p.u on its own rating.
Negative sequence reactance (Xn)
Specify the negative sequence reactance of the generator in p.u in this field. If the negative sequence reactance entries are zero, then the values are computed from the positive sequence values using the multiplication factor.
Zero sequence reactance (X0)
Specify the zero sequence reactance of the generator in p.u in this field. If the zero sequence reactance entries are zero, then the values are computed from the positive sequence values using the multiplication factor.
Potier reactance (Xp)
Specify the potier reactance of the generator in p.u in this field. Potier reactance Xp is sum of the armature reactance and the leakage reactance.
Direct axis transient reactance (Xd’)
Specify the direct axis transient reactance of the generator in p.u in this field.
Quadrature axis transient reactance (Xq’)
Specify the quadrature axis transient reactance of the generator in p.u in this field.
Direct axis sub transient reactance (Xd”)
Specify the direct axis sub transient reactance of the generator in p.u in this field.
Quadrature axis sub transient reactance (Xq”)
Specify the quadrature axis sub transient reactance of the generator in p.u in this field.
Direct axis open circuit transient time constant (Td0’)
Specify the direct axis open circuit transient time constant of the generator in this field.
Quadrature axis open circuit transient time constant (Tq0’)
Specify the quadrature axis open circuit transient time constant of the generator in this field.
Direct axis open circuit sub transient time constant (Td0”)
Specify the direct axis open circuit sub transient time constant of the generator in this field.
Quadrature axis open circuit sub transient time constant (Tq0”)
Specify the quadrature axis open circuit sub transient time constant of the generator in this field. The equations below show how the parameters are used in different modelling.
The infinite bus modelling (model type 1) is done considering the above two equations. This
E V R I X Iqq a q d d
' '( ) 1

MiP-PSCT Database Manager User Manual
Power Research and Development Consultants Pvt. Ltd. Page 96
Model is a constant voltage magnitude behind d-axis transient reactance (Xd’). The phasor diagram is shown below.The transient modelling (Model type 2) is done using the equations 1, 2, 3 &
4 above.This phasor diagram is shown below:
The transient modeling (Model type 2) is done using the equations 1, 2, 3 & 4 above.
This phasor diagram is shown below:
The sub-transient modelling (Model type 3) is done using the equations 3, 4, 5, 6, 7& 8 above.
The phasor diagram for sub-transient modelling is shown below:
E V R I X Idd a d q q
' '( ) 2
)3(//'''''
doqddddOqqTEIXXEfTEEfpE
)4(//'''''
qodqqqqOddTEIXXTEpE
)6(''''
ddqqqIXRaIVE
)5(''''
qqdaddIXIRVE
)7(/''''''''''
dOqdddqqTEIXXEpE
)8(/''''''''''
qOdqqqddTEIXXEpE

MiP-PSCT Database Manager User Manual
Power Research and Development Consultants Pvt. Ltd. Page 97
Inertia in MJ/MVA
Specify the Inertia of the generator in mega Joules/MVA (H) on its own rating in this field.
Winding Connection
There are three options for winding connection namely Star Connected (S) with isolated neutral, Star connected with grounded neutral (G) and Delta Connected (D). Select any option according to the available data.
Mass Details (This data is used particularly in sub-synchronous resonance studies)
Mass Number
Specify the mass number of the generator. This is a user-defined number and should be unique for each generator data.
Inertia in MJ/MVA
Specify Inertia of the generator (M) in this field.
Damping Factor
Specify the damping factor of the generator in pu on its own rating in this field. Damping factor specified here is used in the swing equation.
Stiffness Coefficient
Specify the shaft stiffness constant in p.u.
Thermal Curves : In MiP-PSCT the thermal limit is modelled based on user given data &
standard library based on IEEE standard. For generator rating of 10MVA and above, the
thermal limit would be based on IEEE C50.13-2014 [1]. Below 10MVA generator rating, thermal
limit would be user defined and IEEE C50.13-2014 would be disabled in thermal limit window.
When user selects on IEEE C50.13-2014 the data must be updated with that in Table 1. In
table 1, the current value is given in pu. However, in window the value must be entered in A.
The base current should be the generator rated current obtained from MVA and kV rating in
library.
Table 1: Generator thermal limit as per IEEE C50.13-2014
Current (pu) Current (A) Time (s)
1.15 1.15 pu *rated current 120
1.27 1.27 pu *rated current 60

MiP-PSCT Database Manager User Manual
Power Research and Development Consultants Pvt. Ltd. Page 98
1.50 1.5 pu *rated current 30
2.18 2.18 pu *rated current 10
1.7.8 Motor
To open this form, use menu option “Libraries > Shunt Elements > Motor”. Then the form shown below will appear
MW Rating
Specify the real power rating of the motor in MW in this field.
Stator Resistance
Specify the stator resistance of the motor in p.u on its own rating in this field.
Rotor Resistance at slip = 1
Specify the rotor resistance of the motor in p.u on its own rating in this field.
Stator Reactance
Specify the stator reactance of the motor in PU on its own rating in this field.
Rotor Reactance at slip = 1
Specify the rotor reactance of the motor in PU on its own rating in this field.
Rotor Resistance at slip = 0
Specify the rotor resistance of the motor in p.u on its own rating in this field.
Rotor Reactance at slip = 0
Specify the rotor reactance of the motor in PU on its own rating in this field.
Magnetizing Reactance
Specify the magnetizing reactance of the motor in p.u on its own rating in this field.
Rated Speed
Specify the Rated speed of the motor in rpm in this field. This finds its importance in calculating slip at different intervals and the torque.
Efficiency at Full speed
Specify the efficiency of the motor at full speed in percentage in this field.
Locked Rotor Current
Specify the starting current which is in multiples of rated current in this field. It is usually 6 times the rated current.

MiP-PSCT Database Manager User Manual
Power Research and Development Consultants Pvt. Ltd. Page 99
Inertia Constant
Specify the Inertia constant (KWsec/KVA) of the motor on its own rating in this field.
Model
Parameter model or P-Q characteristic model can be selected. When circuit model is selected the parameters R1, R2, X1, X2 and Xm will be considered for the motor modelling. If characteristics model is to be considered time Vs real and reactive power in pu should be given
Add/Edit Characteristics
Click on Add/Edit Characteristics, the following form appears. Enter Real Power and reactive power in pu against time in seconds.
Compute
Click on compute, to calculate the motor parameters. On click the following dialog box appears. Enter the following –
Rated MVA
Rated Voltage in kV
Synchronous speed in rpm
Motor inertia
DC Test
Vdc in volts
Idc in amperes
For OC Test and SC Test
Voltage
Current
Real Power
Frequency
Click Ok to accept the computed parameters.
Hot/cold Curve
Click on this to enter the hot and cold thermal curve for the motor. Enter the voltage at which the data is given. Enter Hot time and Cold time in seconds against current in amperes. The units can be either Actual or Log-Log
Start motor
Click here to simulate motor starting. On click the following dialog box appears. Enter the following data
Source fault level, source voltage connecting transformer/cable details
Resistance
Reactance

MiP-PSCT Database Manager User Manual
Power Research and Development Consultants Pvt. Ltd. Page 100
Susceptance
Simulation time in secs
Time step in secs
If Starting on load
Torque constant
C1, C2 and C3 constants
Starting Curve :
IEEE Standard C37.96-2012, Guide for AC Motor Protection recommends the use of
overcurrent relays for overload and locked rotor protection. In these applications, setting the
overcurrent inverse time-current characteristic to coordinate with the motor thermal limit curves
provides protection.
The motor’s starting time is also referred to the acceleration time. This time is important
because it determines the length of time the motor must withstand stator current that exceeds
its continuous rating.
NEMA Standard: To find the inrush current as per the NEMA (National Electrical Manufacturers’ Association) standard, the name plate on every motor contains a code letter indicating kVA/HP starting load rating of the motor. A table of these code letters and their meanings in approximate kVA and horse power is shown in the table 1.
Table 2: kVA per HP as per NEMA/IEC standard
Code Letter on motor name plate
kVA per HP with locked rotor
Minimum Maximum
A 0 3.14
B 3.15 3.54
C 3.55 3.99
D 4 4.49
E 4.5 4.99
F 5 5.59
G 5.6 6.29

MiP-PSCT Database Manager User Manual
Power Research and Development Consultants Pvt. Ltd. Page 101
H 6.3 7.09
J 7.1 7.99
K 8 8.99
L 9 9.99
M 10 11.19
N 11.2 12.49
P 12.5 13.99
R 14 15.99
S 16 17.99
T 18 19.99
U 20 22.39
V 22.4 No limit
Using these values, the inrush current for a specific motor can be calculated.
It is required that the time-current accelerating (starting) curve be plotted on the same graph as the thermal limit curves for at least 80% and 110% voltage [8]. If a reduced voltage starting method is used to start the motor, less current will flow during locked rotor condition, less torque will develop, therefore more time should be allowed for acceleration. For example, if the voltage dipped to 90% the torque delivered to the load would be 0.9
2 or 0.81 of the rated voltage. The inrush current for the
motor varies proportionately with the applied voltage.
In the motor starting curve dialog, once the user selects ‘User defined’ radio button, user can
enter values for current and time by clicking on ‘+’ button and can delete using ‘-‘ button. User
can enter the values for 80%, 100% and 110% rated voltage. The fields where user can enter
data at the top are disabled.
When the user selects ‘NEMA’, radio button for curve type, the fields to enter the data for the
fields shown in the top part of motor starting curve data will be enabled and the buttons ‘+’ and
‘-‘ to enter user defined curve data will be disabled. Using Look up table (as shown in table 1),
the user can enter kVA/HP rating of the motor for the code letter. A maximum value is selected
as default value for all codes letters from A to U. User should be able to edit the value also. For
the code letter V, the minimum value is entered.
The motor starting curve showing the acceleration time and the starting current are to be
incorporated in thermal limit curve of motor protection. The overload curve, the locked rotor hot
and cold curves comes above the motor starting current curve.
Report
Click on report to view the motor starting study report
Graph
Click on graph to view the graphical output of the motor starting study.
1.7.9 Cyclic Load
To open this form, use menu option “Libraries > Shunt Elements > Cyclic load”. Then the form shown below will appear.
Time Period
Time period is in seconds, after which the cyclic load pattern repeats. For example, consider a cyclic load at bus say 10, which repeats after every 10 seconds. The cyclic load variation is as follows: The load remains constant at 10 MW in the interval 0.0-4.0 seconds. It remains constant at 20 MW in the interval 4.02-7.0 seconds. It is again 16 MW in the interval 7.02-9.98 seconds. Reactive power demand is 50% of real power demand. For this case, the data is prepared as follows.
Sl.No Time in Sec
P in MW
Q in Mvar

MiP-PSCT Database Manager User Manual
Power Research and Development Consultants Pvt. Ltd. Page 102
1 0.00 10.0 5.0
2 4.00 10.0 5.0
3 4.02 20.0 10.0
4 7.00 20.0 10.0
5 7.02 16.0 8.0
6 9.98 16.0 8.0
Time in sec
Specify the discrete time interval here.
Real Power in MW
The real power load corresponding to the above time period is to specify in this field.
Reactive Power in MVAR
The reactive power load corresponding to the above time period is to be specified in this field.
1.7.10 Static VAR Compensator
To open this form, use menu option “Libraries > Shunt Elements > Static VAR compensator”. Then
the form shown below will appear.
1.7.11 User defined filter
To open this form, use menu option “Libraries > Shunt Elements > User defined filter”. Then the form shown below will appear.

MiP-PSCT Database Manager User Manual
Power Research and Development Consultants Pvt. Ltd. Page 103
Filter Representation
For each filter, the bus number to which the filter is connected and the number of branch elements (Resistance, Inductance, and Capacitor) that constitute the complete filter are given along with their actual values. Filter nodes are numbered in the order considering the reference node (ground) as 0 and the bus to which the filter is connected as 1. From & to filter nodes refer to the node numbers of the filter, between which the different types of basic filter elements are connected.
From node
Specify the From node number of the element in this field.
To node
Specify the To node number of the element in this field.
The user is provided with following options for selecting the filter data (filter elements). The elements given are:
Resistance
Inductance
Capacitance
Element Value
If the selected element is:
Resistance, then the value is entered in Ohms,
Inductance, then the value is entered in Henry,
Capacitance, then the value is entered in Farad
Example for a Filter data
Bus = 8 Filter Branch Elements = 15
Branch From node
To node
Branch element type Active Value
1 1 2 3 000.417e-6
2 2 3 2 000.974
3 3 0 1 037.000
4 1 4 3 000.417e-6
5 4 5 2 000.497
6 5 0 1 026.600
7 1 6 3 000.417e-6
8 6 7 2 000.201
9 7 0 1 016.900
10 1 8 3 000.417e-6
8
1
7
6 4
5 3
1 0 8 2
0
9
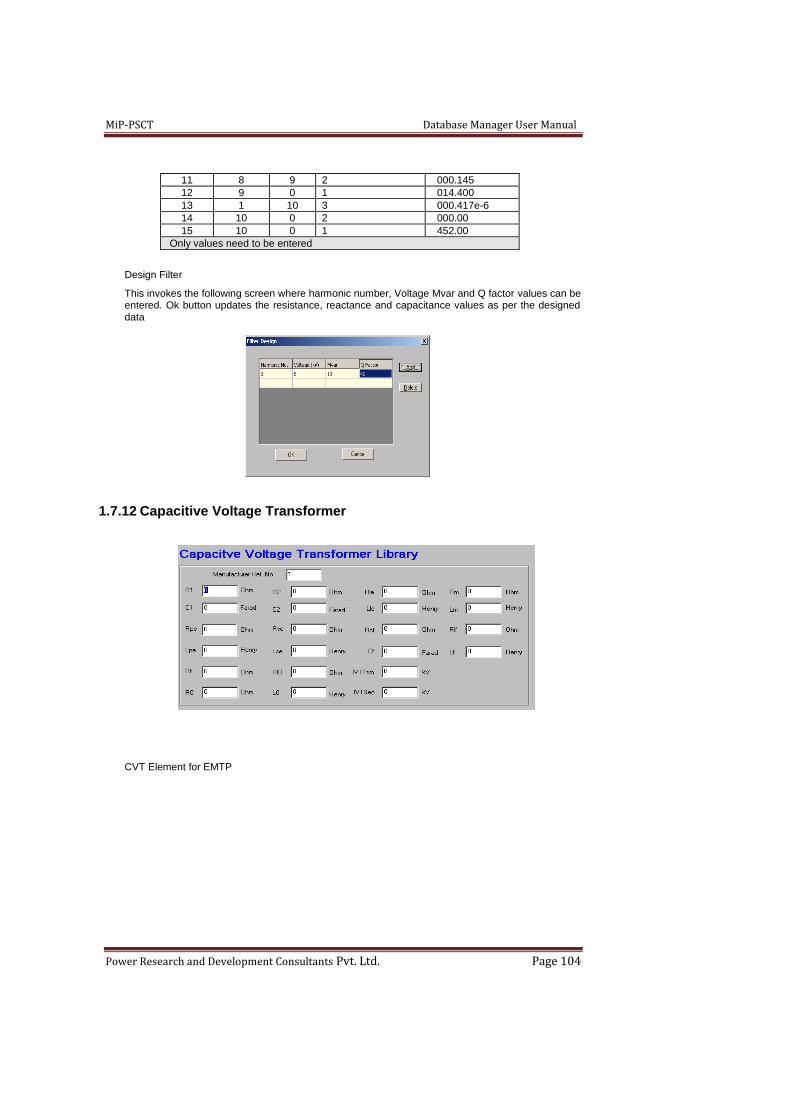
MiP-PSCT Database Manager User Manual
Power Research and Development Consultants Pvt. Ltd. Page 104
11 8 9 2 000.145
12 9 0 1 014.400
13 1 10 3 000.417e-6
14 10 0 2 000.00
15 10 0 1 452.00
Only values need to be entered
Design Filter
This invokes the following screen where harmonic number, Voltage Mvar and Q factor values can be entered. Ok button updates the resistance, reactance and capacitance values as per the designed data
1.7.12 Capacitive Voltage Transformer
CVT Element for EMTP

MiP-PSCT Database Manager User Manual
Power Research and Development Consultants Pvt. Ltd. Page 105
Above Figure shows the detailed model of capacitive voltage transformer where, C1 and C2 are
capacitance potential divider to step down voltage, RLE and LLE are resistance and inductance of tuned reactor, RPE and LPE, RSE and LSE, RM and LM are the resistance and inductance of intermediate potential transformer primary winding, secondary winding and magnetizing branch respectively, RCF,CF, RLF,LF and RF are resistance, inductance and capacitance of Ferro resonance suppression filter components and RO, RLO and LO are resistance and inductance of burden connected across the intermediate voltage transformer.
1.7.13 Current / Voltage Source
RMS Source
To open this form, use menu option “Libraries > current / voltage sources > RMS”. Then the form shown below will appear.
Harmonic number
This corresponds to harmonic order i.e., fundamental/ 2nd/5th/7th etc.
Current: Current can be entered in Ampere or pu or percentage.
Phase A
A - Amp: Magnitude of the A phase current in Amps (RMS value).
A - Angle: Phase angle of the A-phase current in degrees.
Phase B
B - Amp: Magnitude of the B phase current in Amps (RMS value).
B - Angle: Phase angle of the B-phase current in degrees.
Phase C
C - Amp: Magnitude of the C phase current in Amps (RMS value).
C - Angle: Phase angle of the C-phase current in degrees.
Instantaneous Source
To open this form, use menu option “Libraries > current / voltage sources > Instantaneous”. Then the form shown below will appear.
Phase A Amp
Instantaneous value of the A-phase current in Amps.

MiP-PSCT Database Manager User Manual
Power Research and Development Consultants Pvt. Ltd. Page 106
Phase B Amp
Instantaneous value of the B phase current in Amps (Instantaneous value).
Phase C Amp
Instantaneous value of the C phase current in Amps (Instantaneous value).
Generator Accessories
1.7.14 Turbine governor
To open this form, use menu option “Libraries > Generator Accessories > Turbine Governor”. Then the form shown below will appear.
Three types of turbine governors are encapsulated in the package namely steam (Type 1), Hydro (Type 2) and Gas (Type 3).
The form shown is for hydro turbine governor type. The fields are dynamically changed according to the type of the turbine governor and its data requirements.
Control block schematic
This option is to view the control block schematic considered in the package. On clicking this button, a control block schematic is displayed depending upon the type of the turbine governor specified. The data, which is to be entered in the form, are highlighted in different colour.
Turbine Governor Models available in MiP-PSCT
Sl No. Model Type
1 Type 1 Steam
2 Type 2 Hydro
3 Type 3 Gas
4 Type 101 Hydro IEEE 1973
5 Type 102 Hydro
6 Type 103 Hydro IEEE 1992
7 Type 104 Hydro IEEE 1992
8 Type 105 Hydro
9 Type 201 Gas
10 Type 202 Gas
11 Type 203 Gas
12 Type 301 Diesel
13 Type 302 Diesel
14 Type 401 Thermal
15 Type 402 Thermal
16 Type 403 Thermal
17 Type 404 Thermal
18 Type 405 Thermal
19 Type 406 Thermal
20 Type 407Thermal

MiP-PSCT Database Manager User Manual
Power Research and Development Consultants Pvt. Ltd. Page 107
1.7.15 AVR
To open this form, use menu option “Libraries > Generator Accessories > AVR”. Then the form shown below will appear.
All IEEE prescribed AVR types are encapsulated in the package namely IEEE Type 1, IEEE Type 2 and IEEE Type 3, IEEE Type 4 & IEEE Type 5.
The form shown is for IEEE type2. The fields are dynamically changed according to the type of the AVR and its data requirements.
Other available AVR models in MiP-PSCT
Control block schematic
Sl No Model Type
1 Type 101 IEEE 1968 Type 1
2 Type 102 IEEE 1968 Type 1s
3 Type 201 IEEE 1968 Type 2
4 Type 301
5 Type 401
6 Type 402 IEEE 1968 Type 4
7 Type 502 BHEL Digital AVR
8 Type 601 IEEE 1992 Type DC1A
9 Type 602 IEEE 1992 Type DC2A
10 Type 603 IEEE 1992 Type DC3A
11 Type 701 IEEE 1992 Type AC1A
12 Type 702 IEEE 1992 Type AC2A
13 Type 703 IEEE 1992 Type AC3A
14 Type 704 IEEE 1992 Type AC4A
15 Type 705 IEEE 1992 Type AC5A
16 Type 706 IEEE 1992 Type AC6A
17 Type 801 IEEE 1992 Type ST1A
18 Type 802 IEEE 1992 Type ST2A
19 Type 803 IEEE 1992 Type ST3A
20 Type 804 IEEE 1968 Type 3
21 Type 707
22 Type 901
23 Type 902

MiP-PSCT Database Manager User Manual
Power Research and Development Consultants Pvt. Ltd. Page 108
This option is to view the control block schematic considered in the package. On clicking this button, a control block schematic is displayed depending upon the type of the AVR specified. The data, which is to be entered in the form, are highlighted in different color.
1.7.16 PSS
To open this form, use menu option “Libraries > Generator Accessories > PSS”. Then the form shown below will appear.
One PSS is accommodated in the package namely PSS Type 1.
The form shown is for PSS type1. The fields are dynamically changed according to the type of the PSS and its data requirements.
Control block schematic
This option is to view the control block schematic considered in the package. On clicking this button, a control block schematic is displayed depending upon the type of the PSS specified. The data which is to be entered in the form are highlighted in different colour.
Other PSS models available in MiP-PSCT
1.7.17 Boiler
To open this form, use menu option “Libraries > Generator Accessories > Boiler”. Then the form shown below will appear.
One boiler is accommodated in the package namely Boiler Type 1.
The form shown is for Boiler IEEE 1991 type1. The fields are dynamically changed according to the type of the Boiler and its data requirements.
Control block schematic
This option is to view the control block schematic considered in the package. On clicking this button, a control block schematic is displayed depending upon the type of the Boiler specified. The data which is to be entered in the form are highlighted in different colour.
Sl. No Model Type
1 Type 101
2 Type 102
3 Type 103
4 Type 104 IEEE 1992 Type PSS1A
5 Type 105 PSS Type 2A
6 Type 106 BHEL
7 Type 107
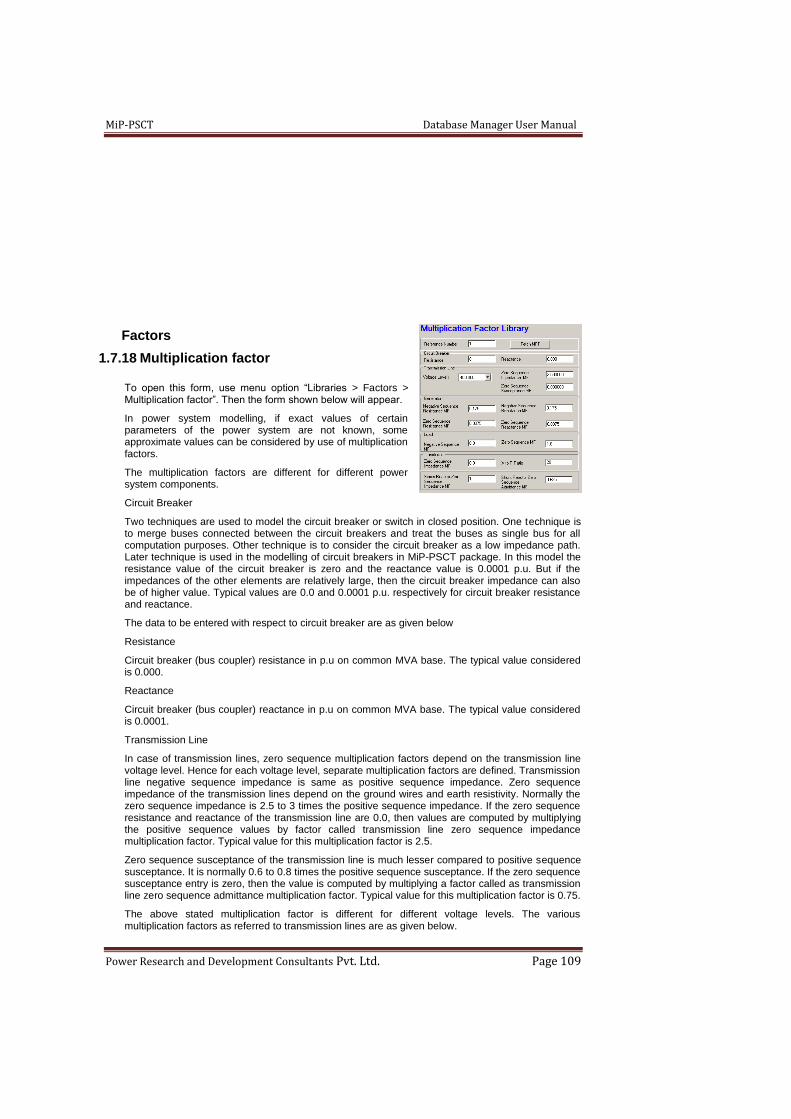
MiP-PSCT Database Manager User Manual
Power Research and Development Consultants Pvt. Ltd. Page 109
Factors
1.7.18 Multiplication factor
To open this form, use menu option “Libraries > Factors > Multiplication factor”. Then the form shown below will appear.
In power system modelling, if exact values of certain parameters of the power system are not known, some approximate values can be considered by use of multiplication factors.
The multiplication factors are different for different power system components.
Circuit Breaker
Two techniques are used to model the circuit breaker or switch in closed position. One technique is to merge buses connected between the circuit breakers and treat the buses as single bus for all computation purposes. Other technique is to consider the circuit breaker as a low impedance path. Later technique is used in the modelling of circuit breakers in MiP-PSCT package. In this model the resistance value of the circuit breaker is zero and the reactance value is 0.0001 p.u. But if the impedances of the other elements are relatively large, then the circuit breaker impedance can also be of higher value. Typical values are 0.0 and 0.0001 p.u. respectively for circuit breaker resistance and reactance.
The data to be entered with respect to circuit breaker are as given below
Resistance
Circuit breaker (bus coupler) resistance in p.u on common MVA base. The typical value considered is 0.000.
Reactance
Circuit breaker (bus coupler) reactance in p.u on common MVA base. The typical value considered is 0.0001.
Transmission Line
In case of transmission lines, zero sequence multiplication factors depend on the transmission line voltage level. Hence for each voltage level, separate multiplication factors are defined. Transmission line negative sequence impedance is same as positive sequence impedance. Zero sequence impedance of the transmission lines depend on the ground wires and earth resistivity. Normally the zero sequence impedance is 2.5 to 3 times the positive sequence impedance. If the zero sequence resistance and reactance of the transmission line are 0.0, then values are computed by multiplying the positive sequence values by factor called transmission line zero sequence impedance multiplication factor. Typical value for this multiplication factor is 2.5.
Zero sequence susceptance of the transmission line is much lesser compared to positive sequence susceptance. It is normally 0.6 to 0.8 times the positive sequence susceptance. If the zero sequence susceptance entry is zero, then the value is computed by multiplying a factor called as transmission line zero sequence admittance multiplication factor. Typical value for this multiplication factor is 0.75.
The above stated multiplication factor is different for different voltage levels. The various multiplication factors as referred to transmission lines are as given below.

MiP-PSCT Database Manager User Manual
Power Research and Development Consultants Pvt. Ltd. Page 110
Voltage levels
On selecting this field, a list of voltage levels will be displayed. Select the required voltage level.
Zero Sequence Impedance MF
Enter Transmission line zero sequence impedance factor. This represents the ratio of zero sequence impedance and positive sequence impedance of the transmission line.
Zero Sequence Susceptance MF
Enter Transmission line zero sequence susceptance factor. This represents the ratio of zero sequence susceptance and positive sequence susceptance of the transmission line.
Generator
In general, for rotating machines, negative sequence reactance differs from the positive sequence reactance. In case of generators, negative sequence reactance is approximately equal to sub-transient reactance. However, negative sequence resistance is same as positive sequence resistance. The multiplication factors namely, generator negative sequence resistance multiplication factor and generator negative sequence reactance multiplication factor are respectively used for computing negative sequence resistance and reactance from the positive sequence values. A typical value for this multiplication factor is 1.0.
Similarly, generator zero sequence resistance factor and generator zero sequence reactance factor are respectively used to compute zero sequence resistance and reactance
values of the generator. A typical value for this multiplication factor is 1.0. The various multiplication factors used with generators are as given below.
Negative Sequence Resistance MF
Generator negative sequence resistance multiplication factor. This represents the ratio of negative sequence resistance and positive sequence resistance of the generator.
Negative Sequence Reactance MF
Generator negative sequence reactance multiplication factor. This represents the ratio of negative sequence reactance and positive sequence reactance of the generator.
Zero Sequence Resistance MF
Generator zero sequence resistance factor. This represents the ratio of zero sequence resistance and positive sequence resistance of the generator.
Zero Sequence Reactance MF
Generator zero sequence reactance factor. This represents the ratio of zero sequence susceptance and positive sequence susceptance of the generator.
Load
Negative Sequence MF
This represents the ratio of the load negative sequence impedance and positive sequence impedance.
Zero Sequence MF
This represents the ratio of the load Zero sequence impedance and positive sequence impedance.
Transformer
Zero Sequence Impedance MF

MiP-PSCT Database Manager User Manual
Power Research and Development Consultants Pvt. Ltd. Page 111
This represents the ratio of transformer zero sequence impedance and positive sequence impedance. This value is normally 1.0.
X to R ratio
Reactance to resistance ratio. The normal value for power transformer is 20.
Series Reactor
Zero Sequence Impedance MF
This represents the ratio of the series reactor zero sequence impedance and positive sequence impedance.
Shunt Reactor
Zero Sequence Admittance MF
This represents the ratio of the shunt reactor zero sequence admittance and positive sequence admittance.
1.7.19 Reduction Factor
To open this form, use menu option “Libraries > Factors > Reduction factor”. Then the form shown below will appear.
The reduction factors are used while executing load flow and transient stability study. If the loads in some of the zones should be reduced or increased the reduction factors can be used.
Zone Number
Enter the zone number for which the reduction factor is to be considered.
Real Power Load RF
Multiplication factor for the real power of the load. The real power of the load will be multiplied by this factor while performing load flow or transient stability
Reactive Power Load RF
Multiplication factor for the reactive power of the load. The reactive power of the load will be multiplied by this factor while performing load flow or transient stability
Real Power Generation RF
Multiplication factor for the real power generation. The real power generation will be multiplied by this factor while performing load flow or transient stability
Reactive Power Generation Load RF
Multiplication factor for the reactive power generation. The real power generation will be multiplied by this factor while performing load flow or transient stability
Shunt Reactor RF
Multiplication factor for the reactance value for the shunt reactor. The reactance of the Shunt reactor will be multiplied by this factor while performing load flow or transient stability
Shunt Capacitor RF
Multiplication factor for the capacitance value for the shunt capacitor. The capacitance of the Shunt capacitor will be multiplied by this factor while performing load flow or transient stability
Compute current and power buttons
In Reduction factor library
The following features are implemented,
Button: Compute Power from Current
Give ampere, voltage and the PF, the real and reactive power can be computed
From the computed power the factors can be updated
Button: Compute Current from Power

MiP-PSCT Database Manager User Manual
Power Research and Development Consultants Pvt. Ltd. Page 112
The other feature is in the selected zone, by giving the Voltage, the ampere will be computed
Protection
1.7.20 Relay Database
To open this form, use menu option “Libraries > Protection > Relay Database”. Then the form shown below will appear.
The relay manufacturer specification details should be given here. This is accessible only to the administrator. The other users can view this but cannot modify any fields. Standard relays are already available as library in the Package.
Setting
Select the variation quantity here. Phase, earth and phase fault option can be selected here. Depending on the selected option following details can be incorporated.
Instantaneous
Phase Instantaneous setting – this selection implies that the minimum, maximum and rated value specified in the adjacent current setting group corresponds to the phase instantaneous setting range
Phase Instantaneous setting time – this selection implies that the minimum, maximum and rated value specified in the adjacent current setting group corresponds to the phase instantaneous operating time range.
Short time pickup – this selection implies that the minimum, maximum and rated value specified in the adjacent current setting group corresponds to the short circuit setting range.
Short time delay – this selection implies that the minimum, maximum and rated value specified in the adjacent current setting group corresponds to the short circuit operating time range.
Time Dial Setting
Selection of this implies that the minimum, maximum and step value specified in the adjacent current setting box corresponds to time dial setting range
An option to specify the units of time is provided. Usually for motor protection relays the units will be in seconds. If the manufacturer specification is given as `X` seconds at 5 times I thermal, then all the X values should be given as discrete step values. While giving the step values note that value 1 (unity) should be given as the first step value even if it is not available in the manufacturer specification. This is to set the discrete steps for the other values.
Current Setting/Time setting
The maximum, minimum and rated/step values of the current or time setting is given here. The type depends on the selection made. It can be any one of the below
Phase idmt setting - Current settings in amperes
Earth idmt setting - Current settings in amperes
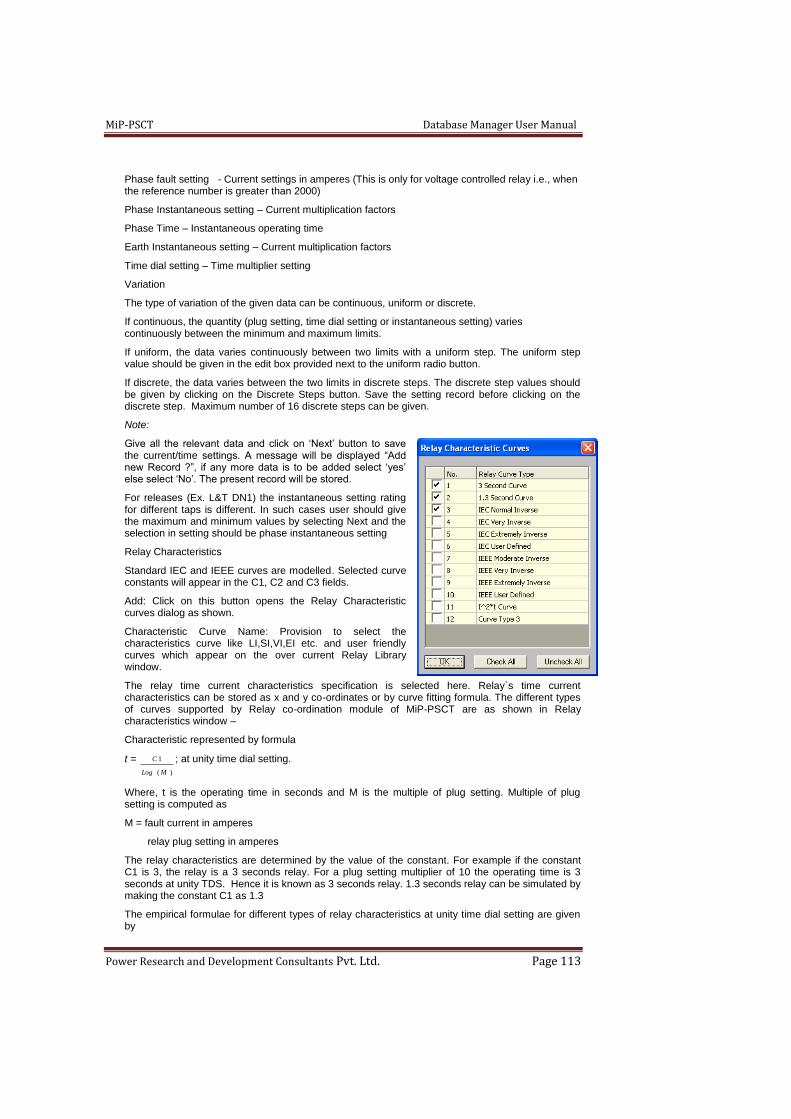
MiP-PSCT Database Manager User Manual
Power Research and Development Consultants Pvt. Ltd. Page 113
Phase fault setting - Current settings in amperes (This is only for voltage controlled relay i.e., when the reference number is greater than 2000)
Phase Instantaneous setting – Current multiplication factors
Phase Time – Instantaneous operating time
Earth Instantaneous setting – Current multiplication factors
Time dial setting – Time multiplier setting
Variation
The type of variation of the given data can be continuous, uniform or discrete.
If continuous, the quantity (plug setting, time dial setting or instantaneous setting) varies continuously between the minimum and maximum limits.
If uniform, the data varies continuously between two limits with a uniform step. The uniform step value should be given in the edit box provided next to the uniform radio button.
If discrete, the data varies between the two limits in discrete steps. The discrete step values should be given by clicking on the Discrete Steps button. Save the setting record before clicking on the discrete step. Maximum number of 16 discrete steps can be given.
Note:
Give all the relevant data and click on ‘Next’ button to save the current/time settings. A message will be displayed “Add new Record ?”, if any more data is to be added select ‘yes’ else select ‘No’. The present record will be stored.
For releases (Ex. L&T DN1) the instantaneous setting rating for different taps is different. In such cases user should give the maximum and minimum values by selecting Next and the selection in setting should be phase instantaneous setting
Relay Characteristics
Standard IEC and IEEE curves are modelled. Selected curve constants will appear in the C1, C2 and C3 fields.
Add: Click on this button opens the Relay Characteristic curves dialog as shown.
Characteristic Curve Name: Provision to select the characteristics curve like LI,SI,VI,EI etc. and user friendly curves which appear on the over current Relay Library window.
The relay time current characteristics specification is selected here. Relay`s time current characteristics can be stored as x and y co-ordinates or by curve fitting formula. The different types of curves supported by Relay co-ordination module of MiP-PSCT are as shown in Relay characteristics window –
Characteristic represented by formula
t =
)(
1
MLog
C ; at unity time dial setting.
Where, t is the operating time in seconds and M is the multiple of plug setting. Multiple of plug setting is computed as
M = fault current in amperes
relay plug setting in amperes
The relay characteristics are determined by the value of the constant. For example if the constant C1 is 3, the relay is a 3 seconds relay. For a plug setting multiplier of 10 the operating time is 3 seconds at unity TDS. Hence it is known as 3 seconds relay. 1.3 seconds relay can be simulated by making the constant C1 as 1.3
The empirical formulae for different types of relay characteristics at unity time dial setting are given by

MiP-PSCT Database Manager User Manual
Power Research and Development Consultants Pvt. Ltd. Page 114
1 - M
0.14 =t
0.02
Where, t is operating time in seconds and M is the multiple of plug setting.
The characteristics which can be simulated with this formula is
Normal inverse characteristic i.e.
Where C1 = 0.14, C2 = 0.02
Very inverse characteristic i.e.
Where C1 = 13.5, C2 = 1.0
Extremely inverse characteristic i.e. 1 - M
80 =t
2
Where C1 = 80, C2 = 2.0
Long-time standby earth fault relay i.e. t = 1 2 0
M - 1
Where C1 = 120, C2 = 1.0
RI-Curve characteristic relay i.e. t = 1
C - 1
C
M
2
Where C1 = 0.339, C2 = 0.236
Where t is operating time in seconds and M is the multiple of plug setting.
Characteristics where the value I2t is constant. This type of characteristic is best suited for fuses.
t = C
I
1
2
Where C1 is the constant I2t
Different types of relay Time – Current characteristics as per the curve data are as given below. Here the user is provided with four options. Anyone can be selected.
This curve type indicates that the relay characteristic is plotted, taking multiples of plug setting along X-axis and time in seconds along Y-axis.
This curve type indicates that the relay characteristic is plotted, taking log of multiples of plug setting (to the base 10) along X-axis and log of time in seconds (to the base 10) along Y-axis.
This curve type indicates that the relay characteristic is plotted, taking current in amperes along X-axis and time in seconds along Y-axis.
This curve type indicates that the relay characteristic is plotted, taking log of current in amperes (to the base 10) along X-axis and log of time in seconds (to the base 10) along Y-axis.
Maximum of 50 X-Y co-ordinate points of the relay characteristic curve can be entered. Further, if any of the above four curve types is selected, plot information (plot points) for the curve should be given.
Plot Info
Click this to specify X-axis and Y-axis co-ordinates. Maximum of 50 co-ordinates can be entered. To enter the next point on the curve click on NEXT button and to trace back the curve, click on the BACK button.
Type of Relay
Select this option to Indicate whether the relay is a motor protection relay or not.
Hot to Cold Ratio
1 - M
C t
2c
1
1 - M
13.5 =t

MiP-PSCT Database Manager User Manual
Power Research and Development Consultants Pvt. Ltd. Page 115
Enter the Relay hot to cold ratio here. While selecting the relay curve for the motor, the relay cold curve will be compared with the motor cold curve and relay hot curve will be compared with the motor hot curve.
Relay thermal Capacity
The relays withstand capacity. Normally 100 times rated current for 1 second is considered.
Provision to select the characteristics curve like LI,SI,VI,EI etc. and user friendly curves which appear on the Relay database window. Depending on the curve selection constants (C1 and C2) will appear.
Fuse
To open this form, use menu option “Libraries > Protection > Fuse”. Then the form shown below will appear.
Fuse Rating
The current rating of the fuse in amperes. Fuse carries this current safely and if the current exceeds this, depending on the fuse time current characteristics, the fuse blows off.
Fuse Characteristic Type
Fuse time Current characteristic can be specified either by curve fitting formula or by taking intermediate X & Y co-ordinates. Select the required curve
Fuse time -Current characteristics as per the curve fitting formula is given by:
t = C
I
1
2
Where the value I2t is constant C1.
If this option is selected then enter the constant C1.
Different types of fuse time-Current characteristics as per the curve data can be selected using the radio buttons in Plotted curve options.
This curve type indicates that the relay characteristic is plotted, taking multiples of plug setting along X-axis and time in seconds along Y-axis.
This curve type indicates that the relay characteristic is plotted, taking log of multiples of plug setting (to the base 10) along X-axis and log of time in seconds (to the base 10) along Y-axis.
This curve type indicates that the relay characteristic is plotted, taking current in amperes along X-axis and time in seconds along Y-axis.
This curve type indicates that the relay characteristic is plotted, taking log of current in amperes (to the base 10) along X-axis and log of time in seconds (to the base 10) along Y-axis.
When fuse characteristics is stored as co-ordinates, maximum of 50 points can be entered. Further, if any of the above four curve types is selected, then plot info for the curve should be given.
Plot Info
Click this to specify X-axis and Y-axis co-ordinates. Maximum of 50 co-ordinates can be entered. To enter the next point on the curve click on NEXT button and to trace back the curve, click on the BACK button.

MiP-PSCT Database Manager User Manual
Power Research and Development Consultants Pvt. Ltd. Page 116
1.7.21 Low Voltage Power Circuit Breaker (LVPCB)
Rating: Rating window is shown below. List of Nominal current ratings and Breaking capacity are to
be entered here.
Over Load Protection: Over load protection window is as shown below.
Current setting data and pick up tolerance are to be entered. User has the choice to enter uniform
and discrete values.
Status ON and OFF will enable and disable the over load protection. Depending on the status
corresponding fields enable and disable in the LVPCB data form.
Inverse characteristic setting ranges and operating time tolerance are to be entered

MiP-PSCT Database Manager User Manual
Power Research and Development Consultants Pvt. Ltd. Page 117
Short Time Protection
Short Time protection window is as shown below.
Current setting data and pick up tolerance are to be entered. User has the choice to enter uniform
and discrete values.
Status ON and OFF will enable and disable the over load protection. Depending on the status
corresponding fields enable and disable in the LVPCB data form.
Inverse characteristics setting ranges and operating time tolerance in % or in sec can be entered.
Instantaneous Short Circuit Protection
Instantaneous protection window is as shown below.
Current setting data and pick up tolerance are to be entered. User has the choice to enter uniform
and discrete values.
Status ON and OFF will enable and disable the over load protection. Depending on the status
corresponding fields enable and disable in the LVPCB data form.
Definite time setting and operating time tolerance in % or in sec can be entered.
Ground Fault Protection
Ground Fault protection window is as shown below.
Current setting data and pick up tolerance are to be entered. User has the choice to enter uniform
and discrete values.
Status ON and OFF will enable and disable the over load protection. Depending on the status
corresponding fields enable and disable in the LVPCB data form.
Inverse characteristic setting ranges and operating time tolerance in % or in sec can be entered.
1.7.22 Transformer Differential Relay
To open this form, use menu option Libraries -> Protection >> Transformer Differential Relay Then the form shown below will appear.
Relay Type: Relay type is to be entered ex: 7UT61X
Code: Enter ANSI / IEC Code for Transformer differential protection Ex:87T
Rated Current: Rated secondary current of CT in Amperes.
Option to specify Numerical / Electro Mechanical

MiP-PSCT Database Manager User Manual
Power Research and Development Consultants Pvt. Ltd. Page 118
There are two schemes for TDR. The relay library is common for both schemes of TDR. This is
shown in Figure. All the setting ranges are to be entered here. Based on the schemes chosen, the
respective fields will be enabled.
1.7.23 Restricted Earth Fault
Modern numerical relays use low impedance protection for REF. The connections for this scheme
are shown in Figure.
Figure RF-1: Low Impedance REF Connection Diagram
As the currents on the neutral and the phase are separately measured, the transformation ratios of
the phase and neutral CTs need not be identical. The measured currents are compared in order to
determine the Operating and Bias Current. The relay trips based on the tripping characteristic
depicted in Figure RF-2

MiP-PSCT Database Manager User Manual
Power Research and Development Consultants Pvt. Ltd. Page 119
Figure RF-2 Tripping Characteristics of a Low Impedance REF Relay
The quantity along the X-axis is the Biasing Current and the Y-axis is the Operating or Differential
Current. The tripping characteristic can be divided into three parts:
Unrestrained Portion
Slightly Restrained
Highly Restrained
The setting computation involves providing the slope and limits for each of the regions. As there is no
standard method for arriving at the settings, three approaches are proposed. The user can select
which approach is to be chosen. Each of the approaches will provide the following settings:
Threshold and limit for unrestrained part
Limit and slope for the slightly restrained portion
Slope for the highly restrained part of the characteristic.
An option is given to the user to choose scheme. Based on this choice, the settings are computed.
To open this form, use menu option Libraries > Protection > > Restricted Earth Fault Then the form shown below will appear.
Screen Details:
Relay number: Serial number of the relay
Manufacturer Name: Enter manufacturer name
Relay Type: Enter relay Type.
Relay Code: Give relay code
High Impedance

MiP-PSCT Database Manager User Manual
Power Research and Development Consultants Pvt. Ltd. Page 120
Relay setting type: user has the choice to select Current or voltage setting
Current setting type: User has to enter the current setting range details like minimum, Maximum and step Sensitive or Normal selection will be from the REF data.
Voltage setting: If the relay setting type is voltage, user can enter the voltage setting details in % or volts. Voltage setting variation option may be continuous, uniform or discrete. If the voltage setting type is % then variation will be continuous or uniform.
Add & Delete: To add and delete voltage setting records.
Low Impedance
Three schemes are provided. User can select any one scheme. Based on the scheme the settings are computed.
1.7.24 Line Pilot
To open this form, use menu option Libraries > Protection > > Line Pilot Then the form shown below will appear.
Relay type: Type of the relay used Ex: Solkar-R, MBCI, etc.
Code: 87PW (87 -differential PW-Pilot wire)
Type 1: 5 kV without any isolating transformer
Type2: 5 / 15 kV with and without isolating Transformer.
Type 3: Standard values for Type 3 MBCI relay
Sv – Standard Value of resistance, (Pilot wire loop resistance)
It is relay specific. Ex: for Solkar relay type:
Sv: Standard Value
= 1000 ohm for Solkar R mode (T=1)
= 2000 ohm for 5kV Solkar Rf mode (without transformers) (T=1)
= 1760 ohm for Solkar Rf with 15kV transformers using tap 1 (T=1)
= 880 ohm for Solkar Rf with 15kV transformers using tap 0.5 (T=0.5)
= 440 ohm for Solkar Rf with 15kV transformers using tap 0.25 (T=0.25)
The pilot resistance is used in conjunction with settable padding resistance to achieve the stability biasing of the relay. The padding resistance must be set in series with the pilot resistance to achieve a standard value.
1.7.25 Bus Bar Differential Relay
To open this form, use menu option Libraries > Protection > > Bus Bar Differential Relay. Then the form shown below will appear.
Relay Number: Give the serial no of the relay library
Relay Name: Enter relay name
Relay Make: Select the relay from the drop down list of the combo box.
Note:
Depending on the relay make respective fields will be enabled
Code: Enter the code

MiP-PSCT Database Manager User Manual
Power Research and Development Consultants Pvt. Ltd. Page 121
Differential Relay Settings: Enter the relay details like max, min and step values. Time and alarm details to be entered
Variable resistor Values: Enter Minimum, Maximum and step values
Pick up Characteristics: Depending on the relay make respective fields will be enabled. Enter the data for minimum, maximum and step details for over current setting in %, Stabilizing factor (selective), stabilizing factor (check zone) and Time in ms.
1.7.26 Line/Cable Differential Relay
To open this form, use menu option Libraries > Protection > > Line/Cable
Differential Relay. Then the form shown below will appear.
Relay Make: Relay Make is to be entered Ex: SIEMENS
Code: Enter ANSI / IEC Code for Line differential protection Ex:87L
Setting Ranges in %: For the line differential relay enter the setting ranges for the
Following fields
Differential Set
Switch on
High Set
2nd Harmonic Restraint
1.7.27 Three Winding Transformer
To open this form, use menu option “Libraries > Three Winding Transformer”. Then the form shown below will appear.
Primary Voltage
This field is to specify the Primary side voltage of the transformer in kV.
Secondary Voltage
This field is to specify the Secondary side voltage of the transformer in kV.
Tertiary Voltage
This field is to specify the Tertiary side voltage of the transformer in kV.
Tap
Two options are provided to modify the transformer tap position setting to improve the voltage at the desired bus. Fixed Tap, where in transformer tap is fixed and On Line Tap Change (OLTC) where in the transformer tap

MiP-PSCT Database Manager User Manual
Power Research and Development Consultants Pvt. Ltd. Page 122
can be changed in steps according to the load variation. The user can select any of these options.
Minimum Tap Number
This field is to specify the minimum tap number existing on the transformer.
Minimum Tap Voltage
This field is for specifying the voltage in kV corresponding to the minimum tap position.
Maximum Tap Number
This field is for specifying the maximum tap number existing on the transformer.
Maximum Tap Voltage
This field is for specifying the voltage in kV corresponding to the maximum tap position.
Positive Sequence X to R Ratio
This field is for specifying the positive sequence X/R ratio of the transformer. Generally for power transformers positive sequence X to R ratio will be 20.
Zero Sequence X to R ratio
This field is for specifying the zero sequence X/R ratio of the transformer. In general the transformer zero sequence X to R ratio will be equal to that of Positive sequence X by R ratio.
Winding Configuration
The user has three options for each winding connection; Primary, Secondary and tertiary. User can select any option according to his requirement. Winding configuration options are Star Connected with isolated neutral, Star connected with grounded neutral and Delta Connected. Phase shift between windings can be mentioned using the option provided. This phase shift is considered in short circuit studies.
Magnetization Curve Data (used only during Electro Magnetic Transient analysis)
Residual Flux: Sum of residual flux in phase A, phase B and phase C is equal to zero
I-V Characteristics: Current in % and voltage in pu are to be entered in the list box. Standard data records are available. Additional records can be added by ADD button. Select the record and use Delete button to remove the data.
Load Characteristics
To open this form, use menu option “Libraries>Load characteristics” Then the form shown below will appear.
Loads are modelled as a constant power load or constant current load or constant impedance load or as a combination of all, including the frequency dependency. Modelling of the load is determined by the load characteristic number. If the load characteristic number is zero, then the loads are modelled as constant power type. At any bus I, the expressions for loads are given by -
where,
PL
i: Actual real power at the bus
i in PU.
QL
i: Actual reactive power at the bus i in PU.
For Load char. Number <= 50 For Load char. Number > 50
P P cp f cp cp V cp V V
Q Q cq f cq cq V cq V V
L
i
L O
i
f
i
p
i
i
i i
z
i i i
L
i
L O
i
f
i
p
i
i
i i
z
i i i
( ) ( )
( ) ( )
1
1
P P cp f cp V
Q Q cq f cq V
L
i
L O
i
f
i
p
i
i
cpi
i
L
i
L O
i
f
i
p
i
i
c qi
i
( * ) ( ( ) )
( * ) ( ( ) )
1
1

MiP-PSCT Database Manager User Manual
Power Research and Development Consultants Pvt. Ltd. Page 123
PL O
i: Scheduled real power at the
bus i in PU.
QL O
i: Scheduled reactive power at the bus i in
PU.
cpf
i:Coeff. of frequency
dependence for P at bus i
cqf
i: Coeff. of frequency dependence for Q at
bus i.
cpp
i: Constant power fraction
for P at bus i.
cqp
i: Constant power fraction for Q at bus i.
c pi
i: Constant current fraction
for P at bus i.
c qi
i: Constant current fraction for Q at bus i.
c pz
i : Constant impedance
fraction for P at bus i.
c qz
i: Constant impedance fraction for Q at bus
i.
Vi
: Magnitude of the voltage at
bus i in p.u.
NOTE :
For Const. P Load - Cp = 1, Ci = 0, Cz = 0
For Const. P Load - Cp = 1, Ci = 0, Cz = Not Used
For Const. I Load - Cp = 0, Ci = 1, Cz = 0
For Const. I Load - Cp = 1, Ci = 1, Cz = Not Used
For Const. Z Load - Cp = 0, Ci = 0, Cz = 1
For Const. Z Load - Cp = 1, Ci = 2, Cz = Not Used
( ) .cp cp cpp
i
i
i
z
i 1 0
( ) .cq cq cqp
i
i
i
z
i 1 0
1 .0
P in P u
V in P u
C o n s t. P
C o n s t. IC o n s t. Z
V a r ia tio n o f R e a l P o w e r w ith V o lta g e
0
In order to get a load characteristic, following procedure is used at the sub-station.
fo
Po
frequency
P o
w e
r
Variation of P with Frequency

MiP-PSCT Database Manager User Manual
Power Research and Development Consultants Pvt. Ltd. Page 124
L o a d L o a d1 1 k V
S w itc h e d
C a p a c ito r
1 3 2 /1 1 0 k V
Vary the tap.
Switch on the capacitor.
Determine the response (change) in load.
Compute the parameters.
P = P0 (CP + CI . V + CZ . V2) ( 1+Kf . f)
P varies with time, voltage and frequency.
P0 varies with time - can be constant at a given time of a day.
CP, CI, CZ &Kf are constants.
V & f are known at any time instant.
P is known from measurements.
Solve the non-linear problem over a set of measurements.
Examples:
Let the load be 10,000 MW. i.e. P0 = 10,000
Let for 1 Hz change in frequency, let the load change be 700 MW.
%7000,10
700700
1
700
1)()(700
0
0
p
f
p
f
p
fo
CnumberpowerCP
HzfffloadindecreaseCfP
C f
p
71 0 0
15 0
3 5.
What it implies:
Initial load 10,000 MW.
Loss of generation 700 MW (Increase in load 700 MW)
Frequency 49 Hz.
For example the following coefficient values denote For example the following coefficient values denote
Cpf = 2.5 Real power changes by 5% for 1 Hz. change in frequency
Cpp = 0.5 50% of the load is constant power
Cpi = 0.3 30% of the load is constant current
Cpz = 0.2 20% of load is constant impedance
NOTE :
If the voltage at a bus goes below the specified value, then the load model for that bus can be switched from the given model to constant impedance model.

MiP-PSCT Database Manager User Manual
Power Research and Development Consultants Pvt. Ltd. Page 125
Voltage at Load Terminals in pu
Frequency in Hz
Scheduled Power in MW
Actual Real Power Load char. <= 50 in MW Cp=0.5, Ci=0.3, Cz=0.2, Cpf = 2.5
Actual Real Power Load char. > 50 in MW Cp=1, Ci=2, Cz= Not Used, Cpf = 2.5
0.8 50 100 86.80 64.00
1.0 50 100 100.00 100.00
1.1 50 100 107.20 121.00
1.0 48 100 90.00 90.00
1.0 52 100 110.00 110.00
Load model Parameters
Component power factor P/V Q/V P/f Q/f
Air conditioner 3 ph central heating
0.90 0.088 2.5 0.98 -1.3
Arc furnace 0.70 2.30 1.6 -1.0 -1.0
Industrial Motors 0.88 0.07 0.5 2.5 1.2
Agri.Pumps 0.85 1.40 1.4 5.0 4.0
Residential
Summer 0.90 1.20 2.9 0.8 -2.2
winter 0.99 1.50 3.2 1.0 -1.5
Commercial
summer 0.85 0.99 3.5 1.2 -1.6
winter 0.90 1.30 3.1 1.5 -1.1
Industrial 0.85 0.18 6.0 2.6 1.6
Power plant 0.80 0.10 1.6 2.9 1.8
1.7.28 Generator Capability Curve
To open this form, use menu option
“Libraries > Capability curve”. Then the
form shown below will appear.
Load model parameters
Measurement based approach
Input: Connected load
Measurement: P,V, f over a period
Out put: Load modelling Parameters
Component based approach
Industrial
Commercial
Residential Agricultural

MiP-PSCT Database Manager User Manual
Power Research and Development Consultants Pvt. Ltd. Page 126
Real power in pu
The real power in pu for the capability curve.
Minimum Reactive Power
Minimum reactive power limit specifies minimum reactive power generation limit in p.u corresponding to the above real power.
Maximum Reactive Power
Maximum reactive power limit specifies maximum reactive power generation limit in p.u corresponding to the above real power.
1.7.29 Lightning Arrester
To open this form, use menu option “Libraries > Lightning Arrester”. Then the form shown below will appear.
The non-linear characteristic of the lightning arrester is divided into three zones as shown below.
Here the Lightning arrester characteristic is modelled as a combination of 3 discrete intervals. Each discrete interval is represented in terms of the following expression -
I(t) = aV(t)b
where,
I(t) is the current drawn by the lightning arrester.
V(t) is the voltage at the bus.
a is the multiplication constant.
b is the power constant.
Represent the constants in all the 3 regions with the voltage limit. Depending on the voltage, characteristic region is selected
For each region voltage, current, multiplication coefficient and the power coefficient are computed.
voltage V(t)
current I(t)
region 3
region 2
region 1

MiP-PSCT Database Manager User Manual
Power Research and Development Consultants Pvt. Ltd. Page 127
For example, for region-1 power coefficient 1, multiplication coefficient 1 and voltage magnitude same constants are computed for other regions also. Depending on the voltage, characteristic region is selected.
Power Coefficient 1of the lightning Arrester characteristic corresponding to region-1
Power Coefficient 2 of the lightning Arrester characteristic corresponding to region-2
Power Coefficient 3 of the lightning Arrester characteristic corresponding to region-3
Multiple Coefficient 1 of the lightning Arrester characteristic corresponding to region-1
Multiple Coefficient 2 of the lightning Arrester characteristic corresponding to region-2
Multiple Coefficient 3 of the lightning Arrester characteristic corresponding to region-3
Voltage Magnitude 1 of the lightning Arrester characteristic corresponding to region-1
Voltage Magnitude 2 of the lightning Arrester characteristic corresponding to region-2
Voltage Magnitude 3 of the lightning Arrester characteristic corresponding to region-3
VI Characteristics: The surge arrester non –linear V-I characteristics should represented with piecewise linear approximation with finite no. of V-I samples. Voltage in pu is based on surge arrester rating and current in actual kA as per the data sheet of surge arresters.
Add: Adds a record in the list box
Delete: Deletes the record from the list box.
1.7.30 Line Harmonic Info
To open this form, use menu option “Libraries > Line harmonic info”. Then the form shown below will appear. When resistance is selected, the resistance part of 3x3 complex impedance matrix is given. When reactance is selected, the reactance part of 3x3 complex impedance matrix is entered. similarly for the line charging admittance, conductance and susceptance values are entered
1.7.31 Motor Load Characteristic data
Enter the values for constants C1, C2 and C3 such that the sum of these three values must be equal to 1.
1.8 Record Menu

MiP-PSCT Database Manager User Manual
Power Research and Development Consultants Pvt. Ltd. Page 128
1.8.1 Add
Use “Record > Add” menu option or click button to add a record in the current opened form. After selecting the required form, to enter new data, select this option. Before
entering, any new data is sure to choose ‘Add’ option for proper updating of data.
If records have already been entered earlier and the user selects this option, all the data except the Identification number and name of add record will be changed. Identification number is generated using the last record number in the particular table. This number is attached to name of the record. This is to simplify the user’s task of entering data. In case the user wants to freshly enter all the fields, 'Clear Fields' option could be used.
1.8.2 Delete
Use “Record > Delete” menu option or click button to delete a record in the currently opened form. The record is permanently deleted from database.
1.8.3 Save Record
Use “Record > Save Record” menu option or click button to save a record in the currently opened form. A record is saved automatically while going to the next record or traversing back to the previous record.
1.8.4 Cancel Changes
Use “Record > Cancel Changes” menu option or click button to cancel changes made to a record in the currently opened form since last save command.
1.8.5 First Record
Use “Record > First Record” menu option or click button to scroll to first record of the currently selected form. The currently selected record is saved automatically.
1.8.6 Previous Record
Use “Record > Previous Record” menu option or click button to scroll to previous record of the currently selected form. The currently selected record is saved automatically
1.8.7 Next Record
Use “Record > Next Record” menu option or click button to scroll to Next record of the currently selected form. The currently selected record is saved automatically.
1.8.8 Last Record
Use “Record > Last Record” menu option or click button to scroll to Last record of the currently selected form. The currently selected record is saved automatically.

MiP-PSCT Database Manager User Manual
Power Research and Development Consultants Pvt. Ltd. Page 129
1.8.9 View All Records
Use “Record > View All Records” menu option or click button to view all the records in the currently opened form in grid format.
1.8.10 View In Detail
Use “Record > View in Detail” menu option or click button to view all the related library records of the currently viewed form. For example, while viewing a transformer field (element) record, view the related transformer library record also.
1.8.11 Clear Fields
Use “Record > Clear Fields” menu option or click button to clear the fields of all edit boxes in the editor to enter data freshly. This is a flag which gets checked and unchecked at each selection. This option if unchecked, allows the user to retain the earlier value.
1.8.12 Copy
Use “Record > Copy Data” menu option or click button to copy the fields of all edit boxes. This copies the data without the selection of bus numbers
1.8.13 Paste
Use “Record > Paste Data” menu option or click button to paste the data of all edit boxes. This pastes the data without pasting of bus numbers
1.9 Options Menu
The Options menu offers following commands
1.9.1 Configuration
Use “Options > Configuration” menu option or Configure button on the Configure & Contingency toolbar. On using this option, the Configuration form is opened to enter relevant data.
Voltage Levels
The user can configure up to 24 voltage levels in MiP-PSCT. The user can edit the twenty four voltage levels using the below dialog box.
Electrical Information
The electrical information includes,
the base MVA to be considered for PU calculations
The nominal frequency of the system.

MiP-PSCT Database Manager User Manual
Power Research and Development Consultants Pvt. Ltd. Page 130
A flag stating whether PU is TRUE or FALSE. If TRUE, the impedance values mentioned are assumed to be on common MVA base. if FALSE, the impedance values are assumed to be given on rated MVA of the equipment. In this case, the transmission line parameters are given in ohms/km.
On clicking OK button, all the changes made are accepted. If Cancel button is chosen, changes are ignored.
Breaker Ratings
Against each voltage level configured, enter the default breaker ratings. Whenever a bus is selected while entering the element data the breaker ratings corresponding to the bus voltages are updated in the breaker rating fields.
1.9.2 Contingency
Use “Options > Contingency” from the menu option or “Contingency” button on the Configure & Contingency toolbar. On selecting this option, a dialog box is popped up in which contingency number and name should be given.
After entering the name and number of the contingency, click
OK to pop up contingency dialog to create contingency.
When the user selects the element type, then all the elements of that type present in the database are listed under “SymbolNos”. If the user wants to include any of these elements in the contingency case, then double click on the element under “SymbolNos”. The selected element appears in “Selected”. To remove an element from the contingency list, double click on the element in “Selected” column. In case of transmission line, user has to mention whether the line has to be opened on FROM side, TO side or both the sides.
User can prepare as many contingency cases as desired. To select a particular contingency case for conducting a study, use “Options > Schedule and Contingency” command. A contingency change is always from the base case. Use base case copy option to copy a particular contingency selection to current contingency.
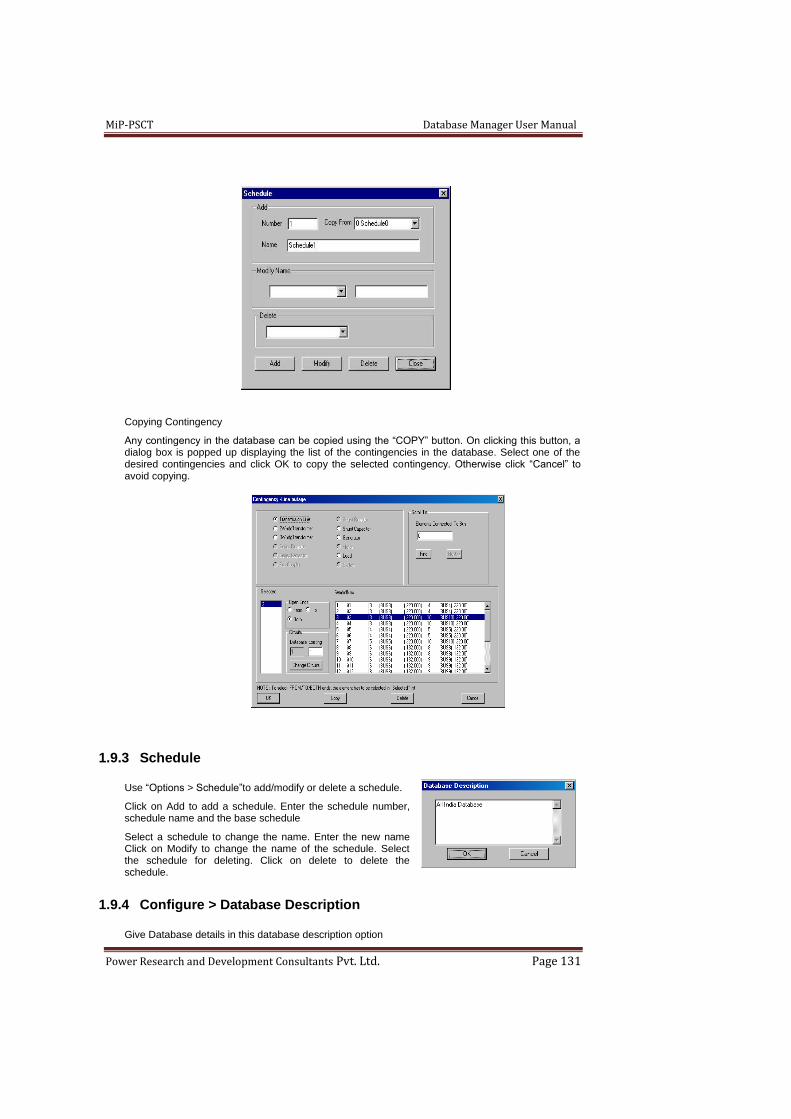
MiP-PSCT Database Manager User Manual
Power Research and Development Consultants Pvt. Ltd. Page 131
Copying Contingency
Any contingency in the database can be copied using the “COPY” button. On clicking this button, a dialog box is popped up displaying the list of the contingencies in the database. Select one of the desired contingencies and click OK to copy the selected contingency. Otherwise click “Cancel” to avoid copying.
1.9.3 Schedule
Use “Options > Schedule”to add/modify or delete a schedule.
Click on Add to add a schedule. Enter the schedule number, schedule name and the base schedule
Select a schedule to change the name. Enter the new name Click on Modify to change the name of the schedule. Select the schedule for deleting. Click on delete to delete the schedule.
1.9.4 Configure > Database Description
Give Database details in this database description option
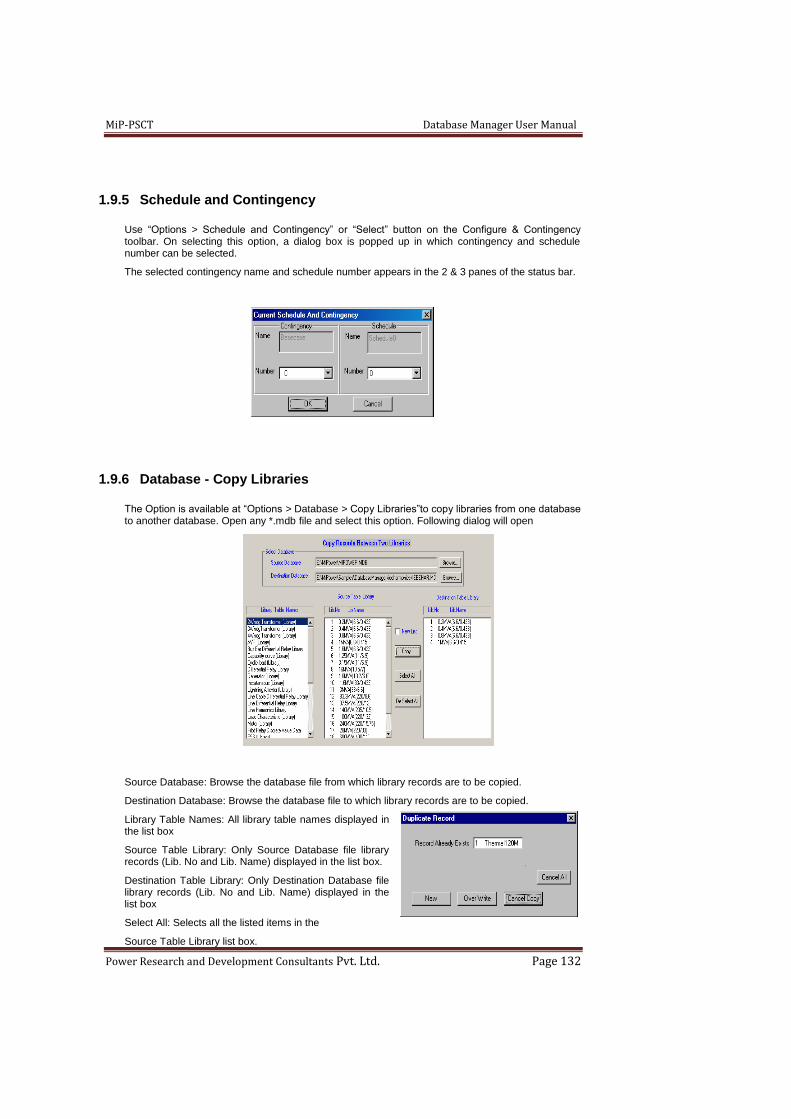
MiP-PSCT Database Manager User Manual
Power Research and Development Consultants Pvt. Ltd. Page 132
1.9.5 Schedule and Contingency
Use “Options > Schedule and Contingency” or “Select” button on the Configure & Contingency toolbar. On selecting this option, a dialog box is popped up in which contingency and schedule number can be selected.
The selected contingency name and schedule number appears in the 2 & 3 panes of the status bar.
1.9.6 Database - Copy Libraries
The Option is available at “Options > Database > Copy Libraries”to copy libraries from one database to another database. Open any *.mdb file and select this option. Following dialog will open
Source Database: Browse the database file from which library records are to be copied.
Destination Database: Browse the database file to which library records are to be copied.
Library Table Names: All library table names displayed in the list box
Source Table Library: Only Source Database file library records (Lib. No and Lib. Name) displayed in the list box.
Destination Table Library: Only Destination Database file library records (Lib. No and Lib. Name) displayed in the list box
Select All: Selects all the listed items in the
Source Table Library list box.

MiP-PSCT Database Manager User Manual
Power Research and Development Consultants Pvt. Ltd. Page 133
De-select All: Deselects all the listed items in the Source Table Library list box.
Copy: This button will copy the selected items of the Source Table Library list box to Destination Table Library list box. Copied records will be displayed in the Destination Table Library list box. If selected library records of source database are already present in the destination database file, then Duplicate Record dialog will pop up.
Over Write: Record already exist will be over write.
New: Opens the Duplicate Record dialog with new record number. User can give new number to that duplicate record and then click OK. Record with user given number will be copied to the destination database.
Cancel Copy: Copying of current record will be cancelled.
Cancel All: Copying of further records will be cancelled.
New List: When copy button is pressed with new list check option then New Library List box dialog will open. Give the new library list starting number
1.9.7 To Network
Click on “To Network” to activate the power system network editor. This is applicable only in the integrated mode.
1.9.8 Update Network
Use “Options > Update Network” to associate an existing network with an existing database or to update the network data in power system network editor.
Rules:
The bus numbers in the single line diagram should be proper. Check the bus numbers associated with each bus.
The elements should be actually connected between the two buses. (There is a possibility that only representation is done without actually connecting it to the buses). If not connected, the element ID will be set to 0.
Steps:
Open the single line diagram
Configure the database, by selecting the existing database. This will automatically connect to the database.
In Database Manager, select Options > Update Network from the main menu. The following dialog box appears. Click on start to update the network, OK to close the dialog box. When updating is completed a message appears. Click Ok. Now check the elements for the element ID’s. All elements ID’s will be updated
1.9.9 Create Sub Database
This option is provided to get the sub database for a sub-network associated with the central (Main) database. This option can be used when user wants to create individual database for each sub-network, which was associated with centralized database.
The database retaining only the specified buses (i.e., the buses available in the network) is generated. Close the database. This database can be used for analysing the sub network.

MiP-PSCT Database Manager User Manual
Power Research and Development Consultants Pvt. Ltd. Page 134
1.9.10 Area
This option is provided view the Name of the Area in the Bus data form. In the Area form enter the area number and Area name.
1.9.11 Zone
This option is provided view the Name of the Zone in the Bus data form. In the zone form enter the zone number and Zone name.
1.9.12 Owner
This option is provided view the Name of the Owner in the Bus data form. In the Owner form enter the Owner number and Owner name.
1.9.13 Output configuration
Use “Options > Output Configuration” to define the format (eg. MS Word, WordPad, notepad …) in which the output report generated by different studies should be opened. On selection the following dialog appears. If “others” option is selected the file path of the exe file used to open the output file must be selected
Make appropriate selection and click Ok. For this database whenever a study is done the output is always opened with the selected application.
1.9.14 Sub Station
This option is provided to enter the substation Name and code. Other details as given in the form can be stored. When unit protection reports are generated the substation code and name appears in the report.
To get substation tag for bus numbers in GUI follow the steps
In GUI create a GUI file and save it with substation name
In database create substation names as shown. Save it.
In GUI select menu option Set > Substation Code
Then draw buses in GUI. Bus numbers will appear with substation code tag.
1.10 Solve Menu
The Solve menu offers following commands
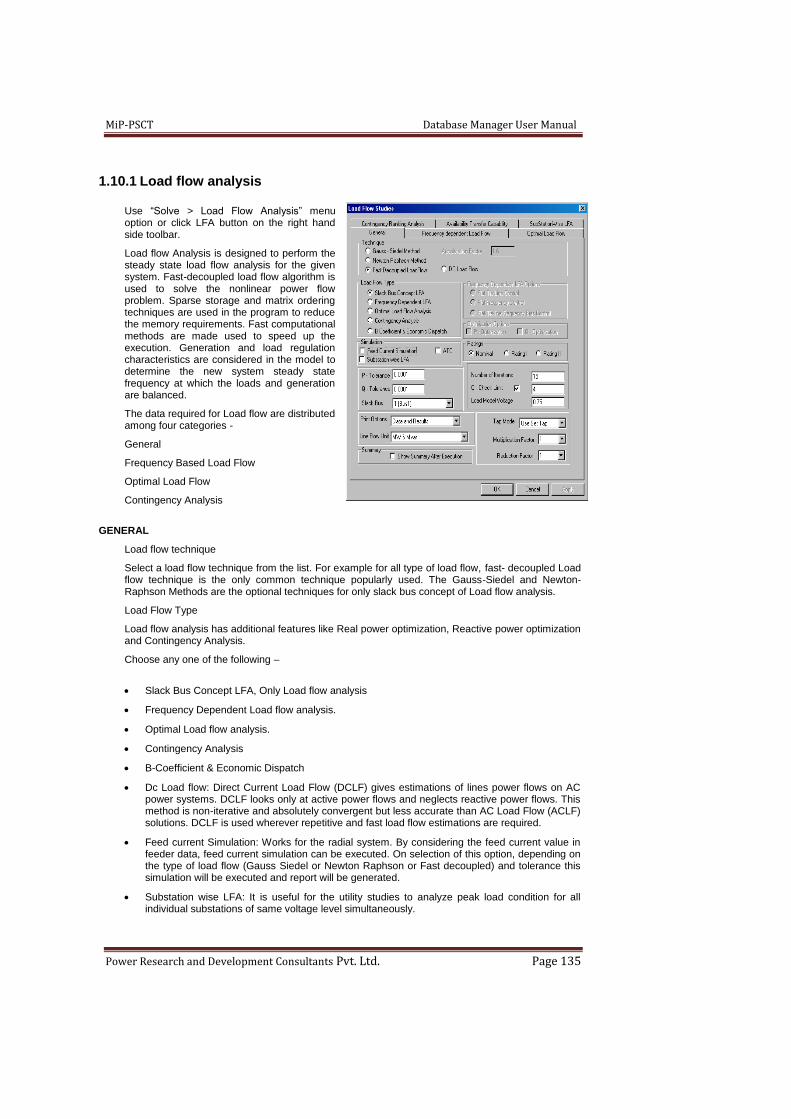
MiP-PSCT Database Manager User Manual
Power Research and Development Consultants Pvt. Ltd. Page 135
1.10.1 Load flow analysis
Use “Solve > Load Flow Analysis” menu option or click LFA button on the right hand side toolbar.
Load flow Analysis is designed to perform the steady state load flow analysis for the given system. Fast-decoupled load flow algorithm is used to solve the nonlinear power flow problem. Sparse storage and matrix ordering techniques are used in the program to reduce the memory requirements. Fast computational methods are made used to speed up the execution. Generation and load regulation characteristics are considered in the model to determine the new system steady state frequency at which the loads and generation are balanced.
The data required for Load flow are distributed among four categories -
General
Frequency Based Load Flow
Optimal Load Flow
Contingency Analysis
GENERAL
Load flow technique
Select a load flow technique from the list. For example for all type of load flow, fast- decoupled Load flow technique is the only common technique popularly used. The Gauss-Siedel and Newton-Raphson Methods are the optional techniques for only slack bus concept of Load flow analysis.
Load Flow Type
Load flow analysis has additional features like Real power optimization, Reactive power optimization and Contingency Analysis.
Choose any one of the following –
Slack Bus Concept LFA, Only Load flow analysis
Frequency Dependent Load flow analysis.
Optimal Load flow analysis.
Contingency Analysis
B-Coefficient & Economic Dispatch
Dc Load flow: Direct Current Load Flow (DCLF) gives estimations of lines power flows on AC power systems. DCLF looks only at active power flows and neglects reactive power flows. This method is non-iterative and absolutely convergent but less accurate than AC Load Flow (ACLF) solutions. DCLF is used wherever repetitive and fast load flow estimations are required.
Feed current Simulation: Works for the radial system. By considering the feed current value in feeder data, feed current simulation can be executed. On selection of this option, depending on the type of load flow (Gauss Siedel or Newton Raphson or Fast decoupled) and tolerance this simulation will be executed and report will be generated.
Substation wise LFA: It is useful for the utility studies to analyze peak load condition for all individual substations of same voltage level simultaneously.

MiP-PSCT Database Manager User Manual
Power Research and Development Consultants Pvt. Ltd. Page 136
Available transfer capability (ATC): To compute available transfer capability between two buses or two areas including transmission reliability margin (TRM) and capacity benefit margin (CBM) considering all (n-1) or specified set of contingencies.
Show summary after execution: With this option Summary window will be opened showing total load, generation and losses.
If Slack Bus Concept LFA Option is selected, only load flow analysis is performed.
In Frequency based load flow type, one of the three options has to be checked.
Flat tie line control
Flat Frequency control.
Flat Tie-line Frequency Bias control.
Optimization Options
In optimal load flow type, either real power or reactive power optimization or both can be checked.If Real Power Optimization Option is selected, load flow with economic analysis is done. In real power optimization, the cost curve for all the generators are calculated based on the cost coefficients as mentioned under Generator Data. The total generation is distributed among all the generators in such a way that the total cost of generation and the real power loss is minimized.
If Reactive Power Optimization Option is selected, load flow with reactive power optimization is done. The program determines the amount of compensation to be provided at low voltage buses based on the minimum and maximum compensation limits as entered in Load Data. The program limits the voltage at all the buses within operating limits as mentioned under bus data by providing compensation in steps iteratively. The maximum number of compensation iterations is equal to the maximum number of load flow iterations as mentioned under Number of Iterations. If compensation is given, then the total cost of providing compensation is mentioned in the detailed report. The savings in cost are also mentioned in the report.
If both Real and Reactive Power Optimization Options are selected, first reactive power optimization and then real power optimization are performed.
Contingency ranking analysis
If contingency ranking analysis option is selected, Contingency Analysis is performed. Load flow analysis performs static security analysis for a given system so that the system is operated defensively. Due to contingency, the system may enter an emergency state, wherein the operator has to take fast actions to restore the system back to normal. Here the status of all the elements selected as contingency cases under Contingency Analysis section are made 0 (i.e. not connected to the system) and outage study is performed. The output of the program alarms the user of any potential overloads or out of limit voltages.
P-Tolerance
It is the Real Power Tolerance in PU on the given base. This is used to check the real power convergence of fast-decoupled load flow. During each iteration of load flow, maximum real power mismatch at all the buses is computed. When real power mismatch is less than the real power tolerance and the maximum reactive power mismatch is less than the reactive power tolerance, convergence is achieved. On a 100 MVA base 0.001 PU is generally an acceptable value for
MiP-PSCT Database Manager User Manual
Power Research and Development Consultants Pvt. Ltd. Page 137
tolerance. This results in 0.1 MW real power error. If the load values are relatively large, then the tolerance value can be as high as 0.1 PU on 100 MVA base.
Q-Tolerance
It is the Reactive Power Tolerance in PU on the given base. This is used to check the reactive power convergence of fast-decoupled load flow. During each iteration of load flow, maximum reactive power mismatch at all the buses is computed. On a 100 MVA base 0.001 PU is generally an acceptable value for tolerance, this results in 0.1 Mvar reactive power error. If the load values are relatively large, then the tolerance value can be as high as 0.1 PU on 100 MVA base.
Load Model Voltage
If the voltage at a particular bus goes below a specified value, the load model is gradually changed from the given type to impedance type (i.e. the impedance factor in the load characteristic is varied linearly from the given value to unity) as the voltage magnitude varies from a specified value to zero. This specified value is the Load model voltage which is entered in PU.
If a load modelled as constant power load and if the voltage at that bus is more than or equal to the load model voltage then, the load characteristic coefficients,
cp = 1 ; ci = cz = 0
If V1 is the load model voltages specified and if the voltage at the load bus goes below V1 (say V2) then at that voltage, the constant power fraction (cp) of load decreases to zero and the constant impedance fraction (cz) increases to unity. At any voltage, the sum of constant impedance fraction, constant current fraction and constant power fraction is unity.
Therefore at V2, the real power load characteristic will be defined by -
P = cp2 + ci2V2 + cz2(V2)
where,
cp2 Constant power fraction at voltage V2.
ci2 Constant current fraction at voltage V2.
cz2 Constant impedance fraction at voltage V2.
Number of Iterations
Maximum number of iterations refers to the iteration number after which the load flow iteration is terminated. It is usually given in the range 15-20. In the case of reactive power optimization, a value of 100 can be entered.
Q Check Limit
It is the iteration number after which the generators are checked for Q-limit violations. Normal value is 4. A value less than 4 usually results in oscillations during solution and a value greater than 4 results in more iteration to get the solution. In order to disable Q checking, this limit should be greater than the maximum number of iterations specified.
Slack Bus Number
Slack bus is the bus selected to supply the additional real and reactive power to accommodate the losses in the network, since these are unknown until the final solution is obtained. The voltage is maintained at specified PU at this bus. In case the user does not select any bus, Load flow analysis will select the maximum generation bus as the slack bus.
Feed Current Simulation: Simulation can be done by using feed current and is used in distribution studies
Show summary after execution: Load flow summery window will appear after execution.
Print Options
The user is provided with six options –
No output : No printing of data and results in the detailed output file
Data only : Printing Data only
Results only : Printing Results only

MiP-PSCT Database Manager User Manual
Power Research and Development Consultants Pvt. Ltd. Page 138
Data and results : Printing Both data and results
Detailed results with data : Printing of data and results with Y-bus details
Bus wise Line flows & losses : The flows are printed in the ascending order of Bus Identification numbers.
Tap Mode
Transformer tap control option.
Use Set Tap: User defined tap setting is considered for analysis
Optimize only OLTC - On load Transformer tap control. If this is selected tap is adjusted during load flow solution to realize the desired voltage at the control bus. The minimum, maximum and step values for tap change are as specified under transformer data.
Optimize all Taps - If this is selected, all taps are adjusted during load flow solution to realize the desired voltage at the control bus. The minimum, maximum and step values for tap change are as specified under transformer data
Use Nominal Tap: With this option, program considers mid tap or nominal taps of all transformers for computation of load flow analysis
Reduction Factor
This is cross-reference between relevant menu and the reduction factor Library. To conduct a study for a particular system by simulating a condition where the load/generation at a particular zone is increased/decreased, do so by giving some factors for load/generation in Reduction factor library. There is no need to change the value of loads and generation in that zone to carry out the study.
Multiplication Factor
This is cross-reference between relevant menu and the multiplication factor Library. The zone wise multiplication factors are specified in the Multiplication factor library.
Feed Current Simulation:With this option feed current simulation can be executed with the available feed data provided in the transmission / Cable data form.
Load flow summary window: With this selection load flow summary window will appear after execution of load flow. This window shows the load flow summary and the violated voltage buses.
Frequency Based Load Flow
The three options available in Frequency Based Load Flow are -
Flat tie line control load flow.
Flat frequency control load flow.
Flat Tie-line frequency bias control
If Flat tie-line control option is selected, tie-line powers are considered to be fixed. Here the difference between actual and scheduled interchanges to zero, or within the Tie line flow tolerance mentioned. Frequency in the area is no longer a constant and the new system frequency is the point at which the load and generation characteristics intersect.
In case Flat frequency control option is selected, the system is operated at the nominal frequency mentioned by the user. Tie-line exchange changes depending on the tie-line participation factor.
Flat tie line frequency bias control is de-activated at present.
Frequency Deviation from Base Frequency
It is possible to obtain the solution at a frequency other than the base frequency in Load flow analysis. Frequency deviation should be entered in Hertz. If the base frequency is 50 Hz. and the frequency is desired at 48 Hz. then a

MiP-PSCT Database Manager User Manual
Power Research and Development Consultants Pvt. Ltd. Page 139
value of -2 should be entered in this field. If study at a frequency of 52 Hz. is desired enter 2 in this field.
Tie-line Zone Number
This is the zone number from which the net tie-line interchange to other areas is specified. In an interconnected system, for load changes in the internal area, generators in that area should act to control the frequency and tie line interchange.
Tie-line Schedule in MW
Net tie-line schedule is the scheduled total real power exchange from the above area to all the other areas. The schedule is given in MW. The schedule power is positive if the above area is exporting power to other areas and it is negative, if the above area is importing power from other areas. If the net tie-line interchange deviates from the schedule, generators participating in the secondary control act to bring the net tie-line interchange to the scheduled value.
Tie-line flow Tolerance
Error tolerance is used to terminate the iterative technique of controlling the tie-line interchange.
Optimal Load Flow
Cost per Mvar in lakhs.
This is required for the reactive power optimization. If compensation is given, then the total cost of providing compensation is mentioned in the detailed report. The savings in cost is also mentioned in the report of Optimal Load flow analysis
%Operation and maintenance charges:
%Interest Charges
Loss load factor
The value usually varies from 0.3 to 0.4.
Life of equipment in Years: This refers to the life of capacitor bank in years.
Energy charges /kWH
Contingency ranking analysis
For the contingency ranking analysis, all the power system elements can be considered. The element whose state is to be altered is selected by radio button. The element identification number is selected from the list box. The selected elements are displayed in the adjacent list box. Any combination of the elements also can be selected for the contingency analysis.
To add different contingencies follow the steps:-
Enter new contingency number in the New edit box and click ADD button to add this number to the contingency number list. Repeat this operation depending on the no. of contingencies required.
Then select the contingency number from the contingency number list and click on the any of the element radio button the corresponding list is filled in the symbol No.s list box.
To select from element list, double click in the symbol No.s, then the number of the element to be outaged under this contingency appears.
Different elements can be outaged under one contingency number.
B Coefficient & Economic Dispatch
By selecting this option, penalty factors and minute-minute generating schedule is worked out to minimize the total cost. Select B-Coefficient & Economic Dispatch from the study information screen of load flow analysis. It needs the values of Co, C1 and C2 in Generator Data Form.
Available Transfer Capability
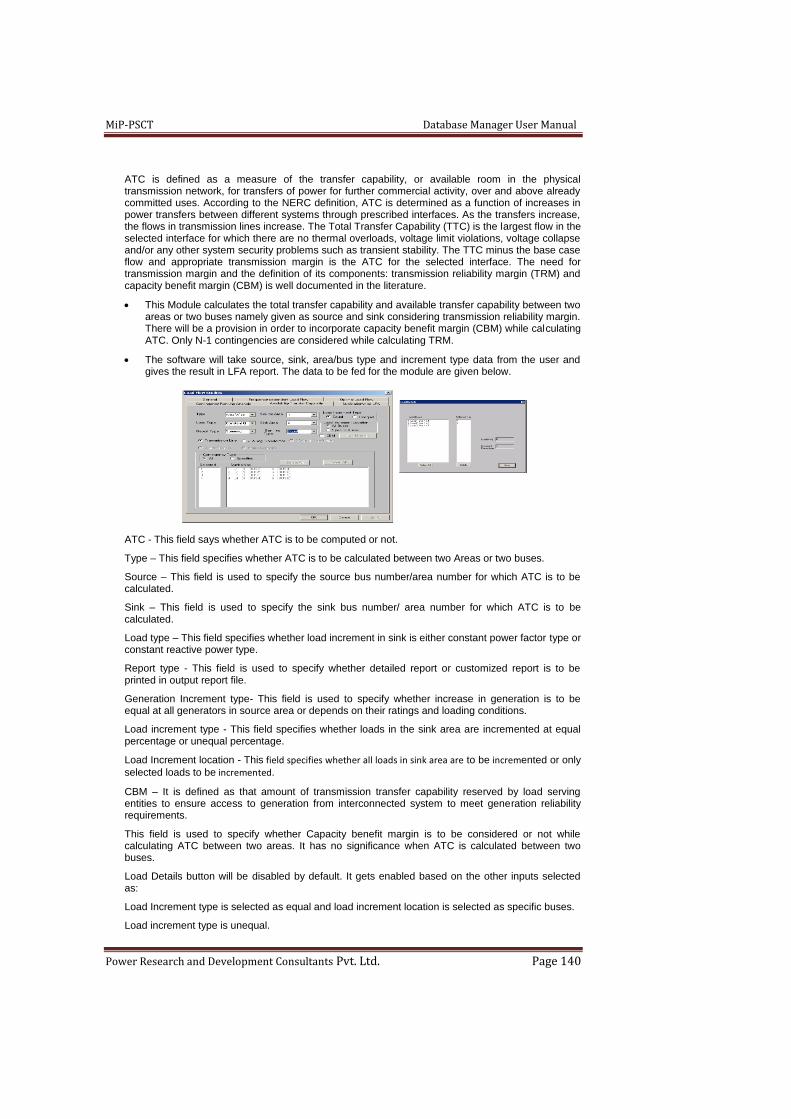
MiP-PSCT Database Manager User Manual
Power Research and Development Consultants Pvt. Ltd. Page 140
ATC is defined as a measure of the transfer capability, or available room in the physical transmission network, for transfers of power for further commercial activity, over and above already committed uses. According to the NERC definition, ATC is determined as a function of increases in power transfers between different systems through prescribed interfaces. As the transfers increase, the flows in transmission lines increase. The Total Transfer Capability (TTC) is the largest flow in the selected interface for which there are no thermal overloads, voltage limit violations, voltage collapse and/or any other system security problems such as transient stability. The TTC minus the base case flow and appropriate transmission margin is the ATC for the selected interface. The need for transmission margin and the definition of its components: transmission reliability margin (TRM) and capacity benefit margin (CBM) is well documented in the literature.
This Module calculates the total transfer capability and available transfer capability between two areas or two buses namely given as source and sink considering transmission reliability margin. There will be a provision in order to incorporate capacity benefit margin (CBM) while calculating ATC. Only N-1 contingencies are considered while calculating TRM.
The software will take source, sink, area/bus type and increment type data from the user and gives the result in LFA report. The data to be fed for the module are given below.
ATC - This field says whether ATC is to be computed or not.
Type – This field specifies whether ATC is to be calculated between two Areas or two buses.
Source – This field is used to specify the source bus number/area number for which ATC is to be calculated.
Sink – This field is used to specify the sink bus number/ area number for which ATC is to be calculated.
Load type – This field specifies whether load increment in sink is either constant power factor type or constant reactive power type.
Report type - This field is used to specify whether detailed report or customized report is to be printed in output report file.
Generation Increment type- This field is used to specify whether increase in generation is to be equal at all generators in source area or depends on their ratings and loading conditions.
Load increment type - This field specifies whether loads in the sink area are incremented at equal percentage or unequal percentage.
Load Increment location - This field specifies whether all loads in sink area are to be incremented or only
selected loads to be incremented.
CBM – It is defined as that amount of transmission transfer capability reserved by load serving entities to ensure access to generation from interconnected system to meet generation reliability requirements.
This field is used to specify whether Capacity benefit margin is to be considered or not while calculating ATC between two areas. It has no significance when ATC is calculated between two buses.
Load Details button will be disabled by default. It gets enabled based on the other inputs selected as:
Load Increment type is selected as equal and load increment location is selected as specific buses.
Load increment type is unequal.

MiP-PSCT Database Manager User Manual
Power Research and Development Consultants Pvt. Ltd. Page 141
Contingency type – This field specifies whether all N-1 contingencies are to be considered or only specified contingencies are to be selected for computation of ATC.
If specified contingencies option in contingency type is selected, then select all and delete all buttons will be enabled.
For the Availability Transfer Capability calculation, contingencies to be considered are to be specified. The element whose state is to be altered is selected by radio button. The element identification number is selected from the list box. The selected elements are displayed in the adjacent left list box. Any combination of the elements also can be selected.
Select all button will select all the elements of the element type which is selected to consider as contingency cases.
Delete all button will delete all the elements of the element type which is selected from the selected list of contingency cases.
To add different contingencies follow the steps:-
Click on the any of the element radio button the corresponding list is filled in the symbol No.s list box.
To select from element list, double click in the symbol No.s, then the number of the element to be outage appears in left box.
Load Buses List box: Displays all load buses in sink area.
Selected No’s: Displays the selected loads for increment during computation of ATC.
Load (MW): Displays the current load at the selected bus in MW.
Increment Percentage: User has to enter the percentage of load to be incremented during computation of ATC for the first step of increment. From the second step onwards, 10 percent increment is considered by default.
Customized Report for Load Flow Studies:
Input file: Specifies the file considered to generate the customized report. The file name depends on the currently active contingency and case.
Output file: Text file into which the report is written.
Bus kV: If the value is zero, all the buses are listed. If the value is other than zero, only specified voltage level buses are listed.
From Bus kV: If the value is zero, all the buses are listed. If the value is other than zero, only specified from bus voltage level buses are listed.
To Bus kV: If the value is zero, all the buses are listed. If the value is other than zero, only specified t bus voltage level buses are listed.
Min Voltage: Minimum voltage in pu for the checking purpose. If both the minimum and the maximum voltage values are zero, then the checking is done with respect to minimum and maximum values defined in the database.
Max Voltage: Maximum voltage in pu for checking purpose.
% Min Loading: Minimum loading limit for checking purpose.
% Max Loading: Maximum loading limit for checking purpose.
Report options: Report is generated only for the checked items. For example, to get the report of buses exceeding minimum voltage limit, lines exceeding maximum loading limit and generators violating reactive power limits, check V<Min, L > Max, Q<Min and Q > Max.
General report options:
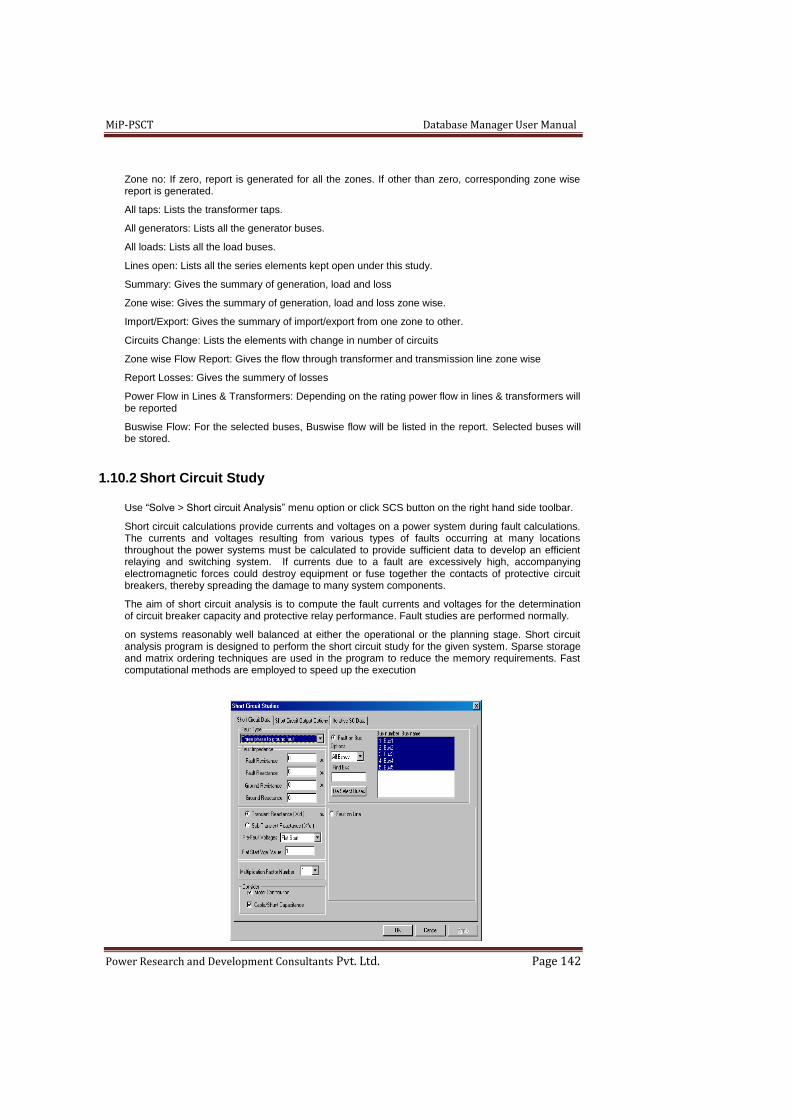
MiP-PSCT Database Manager User Manual
Power Research and Development Consultants Pvt. Ltd. Page 142
Zone no: If zero, report is generated for all the zones. If other than zero, corresponding zone wise report is generated.
All taps: Lists the transformer taps.
All generators: Lists all the generator buses.
All loads: Lists all the load buses.
Lines open: Lists all the series elements kept open under this study.
Summary: Gives the summary of generation, load and loss
Zone wise: Gives the summary of generation, load and loss zone wise.
Import/Export: Gives the summary of import/export from one zone to other.
Circuits Change: Lists the elements with change in number of circuits
Zone wise Flow Report: Gives the flow through transformer and transmission line zone wise
Report Losses: Gives the summery of losses
Power Flow in Lines & Transformers: Depending on the rating power flow in lines & transformers will be reported
Buswise Flow: For the selected buses, Buswise flow will be listed in the report. Selected buses will be stored.
1.10.2 Short Circuit Study
Use “Solve > Short circuit Analysis” menu option or click SCS button on the right hand side toolbar.
Short circuit calculations provide currents and voltages on a power system during fault calculations. The currents and voltages resulting from various types of faults occurring at many locations throughout the power systems must be calculated to provide sufficient data to develop an efficient relaying and switching system. If currents due to a fault are excessively high, accompanying electromagnetic forces could destroy equipment or fuse together the contacts of protective circuit breakers, thereby spreading the damage to many system components.
The aim of short circuit analysis is to compute the fault currents and voltages for the determination of circuit breaker capacity and protective relay performance. Fault studies are performed normally.
on systems reasonably well balanced at either the operational or the planning stage. Short circuit analysis program is designed to perform the short circuit study for the given system. Sparse storage and matrix ordering techniques are used in the program to reduce the memory requirements. Fast computational methods are employed to speed up the execution

MiP-PSCT Database Manager User Manual
Power Research and Development Consultants Pvt. Ltd. Page 143
Study Info
Here the various control options for short circuit analysis are to be entered. It is differentiated as Short Circuit Data and Short Circuit Output Options.
Short Circuit Data
Fault Type
Short circuit study is designed to perform different types of faults that are commonly observed in the power system. Select required fault type for the analysis. The various fault types provided in short circuit study module are –
Three phase to ground fault.
Single line to ground fault at R phase.
Line to line fault between Y and B phase.
Double line (Y and B phase) to ground fault.
Opening in one line (R phase)
Opening in two lines (Y and B phases)
Fault Impedance
Fault impedance values are in PU on a common MVA and voltage base. For fault types involving ground, ground resistance and ground reactance need to be specified in PU. Thus, the information to be provided for different faults is –
Fault Resistance
Fault Reactance
Ground Resistance
Ground Reactance
Fault location option
Fault can be created either on bus or on line. Accordingly, select the option.
Fault on Bus
Fault on Line
Fault on Bus
In short circuit study, it is possible to consider the fault at different buses, one at a time, in single short circuit study execution. For fault on buses, select any one of the following options.
All buses
Select bus
Voltage levels
If “All Buses” option is selected, then all the buses present in the system are displayed in the list box and by default all the buses are selected.
If “Select Bus” option is selected, then all the buses present in the system are displayed in the list box. To select a particular bus, click on the bus of interest. To deselect an already selected bus, double click on the selection.
If “Voltage level” option is selected, then all the voltage levels present in the system are displayed in the list box. With this option, user can consider a fault at buses of specified voltage level. To select a particular voltage level, click on the desired voltage level. To deselect an already selected voltage level, double click on it.
Find Bus: If system is very big with thousands of buses then this option is helpful to select the bus for short circuit studies

MiP-PSCT Database Manager User Manual
Power Research and Development Consultants Pvt. Ltd. Page 144
Find Bus:
Type the required bus no in this field. Selected bus appears in the fault bus number list box.
De-SelectBuses:
This option de selects the buses appear in fault bus numbers list box.
Fault on Line
It is possible to create the fault at specified distance from the sending end of a transmission line. For fault on transmission line, select a line where travelling shunt fault has to be created. Specify the distance at which it is to be created in terms of percentage from sending end (“From end”). If the percentage distance is not within the limits, then this option
is ignored. To consider the travelling shunt fault, it is required to give the data independently for each circuit. Thus if there are three circuits between two nodes, then data for each circuit it to be given distinctly or equivalent data for two circuits are given together and per circuit data for the other line is given separately.
Generator Modeling Type
Use transient or sub transient reactance for the fault calculation. Generally sub transient
reactance is selected.
Pre-Fault Voltage Option
When a fault occurs in a system, the fault current depends on the location of the fault and the pre-fault voltages in the system. In Short circuit study, two options are provided to select the pre-fault voltage option. User can select the desired option.
Flat Voltage Start
Input from Load Flow.
If the user selects the Flat Start Voltage option, then the voltage magnitude considered at all the buses in PU are to be entered. Normally, a value of 1.0 PU is considered. In case the user selects Input from Load Flow, pre-fault voltages are computed by performing load flow analysis for the system under consideration.
Multiplication Factor No
Here the reference number of the multiplication factor record to be considered is to be entered.
Consider:
Motor Contribution: This option is used to select/deselect motor contribution for fault calculation. If the option is selected motor contribution is considered for the fault calculation else motor contribution is not considered.
Cable/shunt Capacitance: This option is used to select/deselect cable/shunt capacitance for fault calculation. If the option is selected cable/shunt capacitance is considered for the fault calculation else cable/shunt capacitance is not considered.
Short Circuit Output Options
The various output options provided in Short circuit study are as given below. User has the choice to select any of the option.
Output print option
Output plot option
Post flow option
Post fault Voltage option
Output print option
Following print options are provided in Short circuit study. User can select the desired option.
No printing of data or results
Data printing only
Results printing only

MiP-PSCT Database Manager User Manual
Power Research and Development Consultants Pvt. Ltd. Page 145
Both data and result printing
Detailed printing of data and results
Data & Results [Polar & Cartesian Coordinates]
Output plot option
Following plot options are provided in Short circuit study. User can select the desired option.
No plot file is generated
Plot file outputs are for phase A, magnitude in amperes and angle in degrees
Plot file outputs are for phase B, magnitude in amperes and angle in degrees
Plot file outputs are for phase C, magnitude in amperes and angle in degrees
Plot file outputs are for positive sequence, magnitude in amperes and angle in degrees
Plot file outputs are for negative sequence, magnitude in amperes and angle in degrees
Plot file outputs are for neutral current, magnitude in amperes and angle in degrees
Plot file outputs are for phase A, magnitude in MVA and angle in degrees
Plot file outputs are for phase B, magnitude in MVA and angle in degrees
Plot file outputs are for phase C, magnitude in MVA and angle in degrees
Plot file outputs are for positive sequence, magnitude in MVA and angle in degrees
Plot file outputs are for negative sequence, magnitude in MVA and angle in degrees
Plot file outputs are for zero sequence, magnitude in MVA and angle in degrees
Post fault flow option
Following post fault flow options are provided in Short circuit study. User can select the desired option.
Fault contributions to faulted bus from lines are not computed
Fault contributions are computed from adjacent buses
Fault contributions are computed from adjacent buses and next adjacent buses
Fault contributions are computed from all buses
Post fault volt option
Following post fault volt options are provided in Short circuit study. User can select the desired option.
Post fault bus voltages are not computed
Post fault bus voltages are computed
Iterative SC Data
This data is required for the short circuit studies with wind generator. Short circuit computation is by iterative method
Note:
Customised report
for Short Circuit studies is shown in the below form.
General Report Options: Bus wise, All generators, All Motors and Fault type options can be selected by the user to get customized report

MiP-PSCT Database Manager User Manual
Power Research and Development Consultants Pvt. Ltd. Page 146
Report Options:
Bus Fault level: For the selected Voltage level, Effective fault level which is obtained by bus fault level multiplied by fault multiplication factor. Effective fault level exceeding the from breaker rating and to breaker rating will be listed in the report.
Net Fault Level: For the selected voltage level, net fault level is the product of from fault level of the series element and the fault multiplication factor. Net fault level exceeding from breaker rating and to breaker rating will be listed in the report.
Save and Quit: Selected options will be saved and closes the dialog
Report: With the selected option report will be opened.
1.10.3 Overcurrent Relay Co-ordination
Use “Solve > Overcurrent Relay co-ordination” menu option or click ORCD button on the right hand side toolbar.
Here the various control options for Over Current Relay Co-ordination analysis are to be entered.
Simulation Option
The different simulation options are -
Only co-ordination and relay setting (Computed): Where fault is created at all the buses one at a time, the time dial setting and plug setting of each relay is determined.
Setting Verification (User given settings): Where the user defined plug setting and time dial setting is used to determine the operating time of all the relays.
Co-ordination and simulation (Computed): Where initially co-ordination of all the relays is done. Fault is created at the user-defined location. The operating time of each relay is determined. Setting verification with simulation (User given settings): Where fault is created at user defined location. Operating time of each relay is determined. The time dial setting and the plug setting are to be given by the user.
Co-ordination, simulation with tripping (Computed): Where co-ordination of all the relays is done to determine the time dial setting and the plug setting. For each selected fault at the user defined location, the operating time of each relay is calculated and the sequence of relay operation is displayed until the fault is completely isolated.
Setting Verification, Simulation with tripping (user given settings): Where for each selected fault at the user defined location, the operating time of all the relays is calculated, where the plug setting and time dial setting are user specified.
The sequence of relay operation is displayed until the fault is completely isolated.
Co-ordination verification (Existing settings): The coordination, verification is with “Existing settings” provided in the database
Setting verification with simulation (Existing settings): The coordination, verification and simulation of fault is with “Existing settings” provided in the database
Fault Type
The types of fault supported by the package are -
Three phase fault.
Single line to ground fault at R phase.
Line to line fault between Y and B phases.
Double line (Y and B phases) to ground fault.

MiP-PSCT Database Manager User Manual
Power Research and Development Consultants Pvt. Ltd. Page 147
Print Option
These options are provided for result file print. The user can select any of the following options –
No Printing of data and results
Data printing only
Results printing only
Both Data and results print
Detailed print of data and results
Fault Impedance
Fault impedance values are in PU on a common MVA and voltage base. Thus, the information to be provided for different faults is
Fault Resistance and Fault Reactance
Ground Resistance and Reactance
A fault can be created either on bus or on the transmission line. Accordingly, select an option.
Fault on Bus
Fault on Line
Bus Numbers
In Overcurrent Relay co-ordination simulation, it is possible to consider the fault at different buses, one at a time, in single execution. All the buses present in the system are displayed in the list box. In order to select the fault bus numbers, click on the bus/buses of interest. To deselect an already selected bus, double click on the selection.
In Overcurrent Relay co-ordination simulation, it is possible to consider the fault at different buses, one at a time, in single execution. All the buses present in the system are displayed in the list box. In order to select the fault bus numbers, click on the bus/buses of interest. To deselect an already selected bus, double click on the selection.
De select Buses
Click this button to de select buses from bus numbers list box
Fault on Line
In Overcurrent Relay co-ordination, it is possible to create the fault at specified distance from the sending end of a transmission line. For fault on line, select a line from Line Numbers list box wheretravelling shunt fault has to be created. Specify the distance at which it is to be created in terms of percentage from sending end (“From end”) in % Distance box. If the percentage distance is not within the limits, then this option is ignored. To consider the travelling shunt fault, it is required to give the data independently for each circuit. Thus if there are three circuits between two nodes, then data for each circuit it to be given distinctly or equivalent data for two circuits are given together and per circuit data for the other line is given separately.
Pre-Fault Voltage Option
When a fault occurs in a system, the fault current depends on the location of the fault and the pre-fault voltages in the system. In Overcurrent Relay co-ordination, two options are provided to select the pre-fault voltage option. User can select the desired option.
Voltage Initialization by Flat Start
Voltage Initialization by Load Flow
If selection is Voltage Initialization by Flat Start option, then the voltage magnitude considered at all the buses in PU are to be entered. Normally, a value of 1.0 PU is considered. In case the selection is Voltage Initialization by Load Flow, pre-fault voltages are computed by performing load flow analysis for the system under consideration.
Generator Modeling
The machine data used for modelling depends on the type of model. To specify which type of modelling is preferred for the study, select any one of the radio buttons.

MiP-PSCT Database Manager User Manual
Power Research and Development Consultants Pvt. Ltd. Page 148
Transient Reactance (Xd’)
Sub Transient Reactance (XD’’)
Multiplication Factor Number
Here the reference number of the multiplication factor record to be considered is to be entered. This is the reference number of the multiplication table data library which is used to write the sequence data of the elements used in the study whose zero sequence data is zero. The zero seq value will be calculated by positive sequence data.
For more details, refer Multiplication Factor
Output Graphs
An option to prepare output graphs. If this box is checked then graph files are generated.
Earth Fault Factor
Normally, as there is unbalance in the system, a fraction of the load current is allowed to pass through the neutral. If this is about 10% of the load current, then the earth fault factor will be 0.1.
Over Load Factor
The CT primary rating is selected such that it is greater than the maximum load current multiplied by a factor namely overload factor, which is usually in the range 1.0 to 1.3.
1.10.4 Distance Relay Co-ordination
Use “Solve > Distance Relay Co-ordination ” menu option or click DRCD button on the right hand side toolbar.
Here the various control options for distance relay co-ordination are to be entered.
Simulation Option
The various simulation options provided are -
Zone1 zone2 zone3 settings by length : Short line for zone2 is selected on length of the line and setting is considered by length
Fault creation and impedance determination (zone2 zone3) : Impedance determination and fault simulation by considering length of the lines
Zone1 zone2 zone3 settings by impedance : short line for zone2 is considered on impedance of the line andsettings calculated by the program on considering impedance of the lines
Fault creation and impedance determination(Zone2 Zone3): Impedance determination and fault simulation by considering impedance of the lines
Zone2 zone3 settings(User selected element): Zone2 zone3 settings by considering the lines selected by the user
Zone2 zone3 user given element and fault simulation : Zone2 zone3 settings and fault simulation by considering the user selected element.
Fault Type
The types of fault supported by the package are -
Three phase fault.
Single line to ground fault at R phase.
Line to line fault between Y and B phases.
Double line (Y and B phases) to ground fault.

MiP-PSCT Database Manager User Manual
Power Research and Development Consultants Pvt. Ltd. Page 149
Print Option
These options are provided for formatting the report file. Select the desired option from the list -
No Printing of data and results
Data printing only.
Results printing only.
Both Data and results print.
Detailed print of data and results.
Fault Impedance
Fault impedance values are in PU on a common MVA base and voltage base. Thus, the information to be provided for different faults is
Fault Resistance
Fault Reactance
Ground Resistance
Ground Reactance
A fault can be created either on bus or on the line. Accordingly, select the desired option.
Fault on Bus
Fault on Line
Fault on bus
In Distance Relay co-ordination, it is possible to consider the fault at different buses, one at a time, in single execution. All the buses present in the system are displayed in the list box. In order to select the fault bus numbers, click on the bus/buses of interest. To deselect an already selected bus, double click on the selection.
De-Select Buses
This button is used to de select the fault bus numbers appear in the bus number list box
Fault on Line
In Distance Relay co-ordination, it is possible to create the fault at specified distance from the sending end of a transmission line. For fault on line, select a line from Line Numbers list box where travelling shunt fault has to be created. Specify the distance at which it is to be created in terms of percentage from sending end (“From end”) in % Distance box. If the percentage distance is not within the limits, then this option is ignored. To consider the travelling shunt fault, it is required to give the data independently for each circuit. Thus if there are three circuits between two nodes, then data for each circuit is to be given distinctly or equivalent data for two circuits are given together and per circuit data for the other line is given separately.
Pre-Fault Voltage Option
When a fault occurs in a system, the fault current depends on the location of the fault and also the pre-fault voltages in the system. In Distance Relay co-ordination, two options are provided to select the pre-fault voltage option. User can select the desired option.
Voltage Initialization by Flat Start
Voltage Initialization by Load Flow
If the user selects the Voltage Initialization by Flat Start option, then the voltage magnitude considered at all the buses in p.u are to be entered. Normally, a value of 1.0 PU is considered. In case the user selects Voltage Initialization by Load Flow, pre-fault voltages are computed by performing load flow analysis for the system under consideration.
Generator Modeling
The machine data used for modelling depends on the type of model. The user has to specify which type of modelling is preferred for the study by selecting the radio button.
Transient Reactance (Xd’)
Sub Transient Reactance (Xd’’)

MiP-PSCT Database Manager User Manual
Power Research and Development Consultants Pvt. Ltd. Page 150
Multiplication Factor Number
Here the reference number of the multiplication factor record to be considered is to be entered. This is the reference number of the multiplication table data library, which is used to write the sequence data of the elements used in the study whose zero sequence data is zero. The zero seq value will be calculated by positive sequence data.
For more details refer Multiplication Factor
Discrimination Time
Discrimination time has to be entered in seconds for co-ordination interval between two distance relays.
1.10.5 Transient Stability Analysis
Use “Solve > Transient Stability Analysis” menu option or click TRS button on the right hand side toolbar to invoke conduct transient stability studies.
POWERTRS is designed to perform the transient stability analysis for the given power system. The transient behaviour of a power system, resulting from major disturbances such as a fault followed by switching operations, sudden rejection of load or generation, etc., is referred as Transient Stability. Transient stability solution is obtained in time domain. Transient stability simulation studies are carried out to study these phenomena and the results enable to plan and coordinate the protection and control schemes efficiently. Critical clearing times of circuit breakers can be computed and protection zones of distance relays during transient swings can be adjusted. Proper restoration / islanding schemes can be suitably designed. Compared to load flow and short circuit studies, transient stability studies are more complex since they involve the electromechanical dynamics of rotating machines and their associated controls viz., excitation and governor systems. The period of investigation varies from fraction of a second. When first swing stability is being determined, to over several seconds when multiple swing stability is to be examined
The program requires the base case load flow solution to establish the initial conditions. The program uses fast-decoupled load flow method for the network solution, and implicit trapezoidal rule of integration method for the solution of differential equation representing the dynamics of machines, controllers, etc.
Study Info
On pressing study info button, a dialog box is displayed with various control options for transient stability analysis.
Load Type
This is type of load modelling during post disturbance. It can be Impedance type of load or as per the load model specified in the load characteristic. For load change disturbances, the loads should be modelled as user defined type.
Swing Bus
This is the generator bus number. The swing of any other generator is calculated with reference to this generator bus.
Multiplication Number
This the reference number of the multiplication table data library, which is used to write the sequence data of the elements, used in stability whose zero sequence data is zero. The zero sequence value will be calculated by positive sequence data.
Simulation Time

MiP-PSCT Database Manager User Manual
Power Research and Development Consultants Pvt. Ltd. Page 151
This is the time duration for transient stability analysis. This is split into 4 zones, each having start time, end time and time step. It is assumed that the end of each time intervals is in the increasing order. Normal value for maximum simulation time is 3 seconds, and the time step is 0.025 seconds.
Currently the starting time and the end of simulation time are active.
Tolerances
The real and reactive power tolerances for both initial and post disturbances are to be specified in Pu on the given base...
These values are used to check the convergence of fast-decoupled load flow. During each iteration, maximum real and reactive power mismatch at all buses are computed. When maximum real power mismatch is less than the real power tolerance and the maximum reactive power mismatch is less than the reactive power tolerance, convergence is achieved. On 100 MVA base 0.001 PU is generally an acceptable value for tolerance, which results in 0.1 MW real power error. If all the load values are relatively large, then tolerance value can be as high as 0.1 PU on 100 MVA base. Tolerance values for pre-disturbance and post disturbance are given separately. The values can be same for both the cases.
V-I-Z-Bus data
Bus numbers corresponding to V-I-Z-S (Voltage-Current-Impedance-Power) print are selected from this list box. The graph information of the corresponding buses is prepared while executing transient stability.
Load Flow Case
For the selected load flow case transient stability can be executed.
Print Step Option
Specify the print step for V-I-Z-S plot information.
Load flow print Option
This is to have the option as whether to print the load flow results in the report or not. If the checkbox is selected, the same will be printed otherwise not.
Data Print option
If the data print option is checked, then the input data will be printed to the output file otherwise it will not.
Voltage and Current Option
If this checkbox is selected, then voltage at bus, current in a line, and impedance seen by the distance relay are written to the transient stability output file.
Disturbances
Following are the disturbances, which can be simulated, in the transient stability.
Disturbances
Change in transformer parameters
Change in transmission line parameters
Change in shunt impedance
Change in real and reactive power of loads
Three Phase to ground fault creation at a bus
Change in number of generator sets at a bus
Total generation outage at a bus
Simulation of single line to ground fault
Loss of excitation at a generator
Change in Load Model

MiP-PSCT Database Manager User Manual
Power Research and Development Consultants Pvt. Ltd. Page 152
Motor Start / Stop
Loss of Turbine input
Change in AVR Voltage Reference
For each of these faults except change in shunt impedance, Disturbance information has to be entered in a separate popup.
Disturbances
Change in transformer parameters
Selecting this disturbance type to open or close transformer. After selecting this option, click on the Disturbance Information button.
The following dialog is popped-up.
Transformer Number
The identification number of the transformer should be selected from the list box for which parameter has to be changed.
Disturbance Starting Time
Disturbance time is the time at which the disturbance is applied. The time is measured from the start of the simulation time i.e., 0.0 seconds. If no disturbance is to be considered, then this time should be larger than the maximum simulation time.
Positive sequence resistance and reactance
The changed value of the positive sequence resistance and reactance has to be given in the edit box.
Zero sequence resistance and reactance
The changed value of the zero sequence resistance and reactance has to be given in the edit box.
New Tap Position
User can change the nominal tap position.
User can change the parameter of any number of transformers. For that NEXT button can be clicked so that another transformer modified data can be given. Each time, number of transformers whose data are changed is recorded in the counter automatically. The BACK button is used to go back to the already edited data.
After editing all the data, click ‘OK ‘ to update the data changes or ‘CANCEL’ to ignore the changes.
Compute: No. of circuits can be changed by using this option. Click ‘OK’ to update parameter calculation or ‘CANCEL’ to ignore the changes.
Change in Line parameters
Selecting this disturbance type to open or close transmission line or cable. After selecting this option, click on the Disturbance Information button. The following dialog is popped-up.
Transmission Line Number
The identification number of the line in which fault has to be initiated. The list box displays the line numbers and line of interest can be selected.
Disturbance Starting Time

MiP-PSCT Database Manager User Manual
Power Research and Development Consultants Pvt. Ltd. Page 153
Disturbance time is the time at which the disturbance is applied. The time is measured from the start of the simulation time i.e., 0.0 seconds. If no disturbance is to be considered, then this time should be larger than the maximum simulation time.
Positive sequence resistance, reactance and susceptance
The changed value of the positive sequence resistance, reactance and susceptance has to be given in the edit box.
Zero sequence resistance, reactance and susceptance
The changed value of the zero sequence resistance, reactance and susceptance (B/2) in pu has to be given in the edit box. Hence to consider the opening of a line, resistance of the line is given as 0.0 PU, reactance as 999.0 PU and susceptance as 0.0 PU for both positive and zero sequence values.
User can change the parameter of any number of lines. For that NEXT button can be clicked so that modified data of another line can be given. Each time, number of lines whose data are changed is recorded in the counter automatically. The
BACK button is used to go back to the already edited data.
After editing all the data, click ‘OK‘ to update the data changes or ‘CANCEL’ to ignore the changes.
Compute: No. of circuits can be changed by using this option. Click ‘OK’ to update parameter calculation or ‘CANCEL’ to ignore the changes.
Change in Shunt Impedance
Select this disturbance type to open or close or change shunt impedance.
Change in Load data
Select this disturbance type to change load at a particular bus. After selecting this option, click on the Disturbance Information button. The dialog is popped-up as shown in figure.
Load Number
The identification number of the load whose values are to be changed is selected from the list box.
Disturbance starting Time
Disturbance time is the time at which the disturbance is applied. The time is measured from the start of the simulation time i.e., 0.0 seconds. If no disturbance is to be considered, then this time should be larger than the maximum simulation time.
New real, reactive and compensation in Mvar
For change in load data, new real power load in MW, new reactive power load in MVAR and new compensating MVAR at the bus are given in corresponding edit boxes.
User can change the parameter of any number of loads. For that, NEXT button can be clicked so that another load’s modified data can be given. Each time number of loads whose data are changed is recorded in the counter automatically. The BACK button is used to go back to the already edited data.
After editing all the data, click ‘OK ‘ to update the
data changes or ‘CANCEL’ to ignore the changes.
Three phase to ground fault
Select this disturbance type to create a three phase fault at a particular bus or line. After selecting this option, click on the Disturbance Information button. The following dialog is popped-up.
Bus Number

MiP-PSCT Database Manager User Manual
Power Research and Development Consultants Pvt. Ltd. Page 154
The bus number at which fault has to be initiated is selected from the list box.
Disturbance starting time
Disturbance time is the time at which the disturbance is applied. The time is measured from the start of the simulation time i.e., 0.0 seconds. If no disturbance is to be considered, then this time should be larger than the maximum simulation time.
Disturbance clearing time
Disturbance clearing time is the time at which the disturbance is taken out. If disturbance clearing is not to be considered, then this time should be larger than the maximum simulation time.
Fault Location
This field is enabled when fault on line is selected. User has the chice to enter location of the fault by giving percentage. If it is 50% then fault on line is created at 50% (Middle) of the line. Program creates a dummy bus at fault location and executes the program..
Pole reclosure option
This option is to specify whether the system should come back to normal position or not. User can select one among the two options
No reclosure
Pole reclosed
In case of pole reclosed after clearing of fault, the pole will be closed to achieve the normal behaviour.
After editing all the data, click ‘OK ‘to update the data changes or ‘CANCEL’ to ignore the changes.
Fault Impedance
The fault can be through impedance. For that the fault resistance and reactance has to be given.
At a time only at one bus, 3 phase fault is simulated.
After editing all the data, click ‘OK ‘to update the data changes or ‘CANCEL’ to ignore the changes.
Change in No. of generator sets
Select this disturbance type to change no. of generator sets at a particular bus. After selecting this option, click on the Disturbance Information button. The following dialog is popped-up.
Generator Number
The identification number of the generator whose number of sets has to be changed is selected from the list box.
Disturbance starting time
Disturbance time is the time at which the disturbance is applied. The time is measured from the start of the simulation time i.e., 0.0 seconds. If no disturbance is to be considered, then this time should be larger than the maximum simulation time.
Number of New sets
As a change in number of generator sets the new number of sets is to be specified in the edit box.
The multiple fault simulation is recorded for each NEXT button click in the counter automatically. The BACK button is used to go back to the already edited data.
After editing all the data, click ‘OK ‘to update the data changes or ‘CANCEL’ to ignore the changes.
Total Generator Outage
Select this disturbance type to create a total generator outage at a particular bus. After selecting this option, click on the Disturbance Information button. The following dialog is popped-up.
Generator Number

MiP-PSCT Database Manager User Manual
Power Research and Development Consultants Pvt. Ltd. Page 155
The identification number of the generator,
which will be outaged, is selected from the list box.
Disturbance starting time
Disturbance time is the time at which the disturbance is applied. The time is measured from the start of the simulation time i.e., 0.0 seconds. If no disturbance is to be considered, then this time should be larger than the maximum simulation time.
After editing all the data, click ‘OK ‘to update the data changes or ‘CANCEL’ to ignore the changes.
Single line to ground fault at a bus
Select this disturbance type to create a single line to ground fault at a particular bus. After selecting this option, click on the Disturbance Information button. The following dialog is popped-up.
Bus Number
The bus number at which fault has to be initiated is selected from the list box.
Disturbance starting time
Disturbance time is the time at which the disturbance is applied. The time is measured from the start of the simulation time i.e., 0.0 seconds. If no disturbance is to be considered, then this time should be larger than the maximum simulation time.
Disturbance clearing time
Disturbance clearing time is the time at which the disturbance is taken out. If disturbance clearing is not to be considered, then this time should be larger than the maximum simulation time.
Location
User has the choice to enter percentage for fault location when the fault is on transmission line
Fault Impedance
The fault can be through impedance. For that the fault resistance and reactance has to be given.
Pole reclosure option
This option is to specify whether the system should come back to normal position or not. User can select one among the two options
No reclosure
Pole reclosure
In case of pole reclosed after clearing of SLG fault, the pole will be closed to achieve the normal behaviour. Only one single line to ground fault is simulated at a time.
After editing all the data, click ‘OK‘ to update the data changes or ‘CANCEL’ to ignore the changes.
Loss of excitation at a generator
Select this disturbance type to remove excitation of a generator at a particular bus. After selecting this option, click on the Disturbance Information button. The following dialog is popped-up.
Generator Number
The identification number of the generator for which excitation will be lost is selected from the list box.
Disturbance starting time

MiP-PSCT Database Manager User Manual
Power Research and Development Consultants Pvt. Ltd. Page 156
Disturbance time is the time at which the disturbance is applied. The time is measured from the start of the simulation time i.e., 0.0 seconds. If no disturbance is to be considered, then this time should be larger than the maximum simulation time.
For multiple disturbance creation, the NEXT button can be clicked. Each time faults count is recorded in the counter automatically. The BACK button is used to go back to the already edited data.
After editing all the data, click ‘OK‘ to update the data changes or ‘CANCEL’ to ignore the changes.
Change in Load Model
Select this disturbance type to change the load characteristic model for loads. After selecting this option, click on the Disturbance Information button. The following dialog is popped-up.
Load Characteristic Number
The identification number of the load characteristic that will be changed is selected from the list box.
Disturbance starting time
Disturbance time is the time at which the disturbance is applied.
Change in Real Power Constants
The constant power, constant current and constant impedance coefficients for the real power should be given here.
Change in Reactive Power Constants
The constant power, constant current and constant impedance coefficients for the reactive power should be given here.
Motor Start/Stop
The motor starting and sequential starting with time even identification can be done.
Disturbance starting time
Disturbance time is the time at which the disturbance is applied.
Type of Disturbance
Select either motor start or stop.
Loss of Turbine Input
Effect of loss of turbine input for a generator can be studied.
Disturbance time is the time at which the disturbance is applied.
Select Generator
Select the generator at which disturbance is applied
Change in AVR Voltage Reference
By changing the avr voltage reference for a generator can be studied.
Generator Number
Select the generator to which the disturbance is applied
Disturbance starting time is the time at which the disturbance is applied.
Change in AVR Voltage reference in percentage is to be given here.

MiP-PSCT Database Manager User Manual
Power Research and Development Consultants Pvt. Ltd. Page 157
1.10.6 Voltage Instability Analysis
Use “Solve > Voltage instability analysis” menu option or click VIA button on the right hand side toolbar to conduct voltage instability analysis.
Due to various techno/ economic reasons, current day power systems are operated in inter connection. It is required to transfer bulk power from generating sources to load points, which are far apart. The consequent higher loading on the transmission network has added to the reactive power demands on the interconnected EHV grids, thereby compounding the difficulties of voltage control. Power system voltage stability is characterized as being capable of maintaining load voltage magnitudes within specified operating limits under steady state conditions.
With the increased loading and exploitation of the power transmission system and with the improved optimized operation of the system, the voltage instability problem arises. The problem of voltage collapse may be explained as the inability of the power system to supply the reactive power or as an excessive absorption of reactive power by the system itself. Hence, it is strongly affected by the load behaviour. The voltage instability program is designed to assess the risk of voltage instability and margin of instability during sudden disturbances, under steady state conditions. The program ranks the load buses based on the L-index value and the highest L-index indicates the system collapse point. The value of L-index is zero at no load and 1 at the verge of collapsing point.
Study Info
On pressing study info button, a dialog box is displayed with various control options for voltage instability analysis.
Load Number
The list of loads present in the network is listed in this field. Select the load on which the load change in power has to be applied.
Change in real power
In the maximum real power in MW field, mention the maximum value of the real power to which load has to be increased. In the minimum real power in MW field mention the
minimum value of the real power from which load variation has to be started. In the Steps in MW field, mention the step of the real power by which load should be varied from minimum value to maximum.
Change in reactive power
In the maximum reactive power in MVAR field, mention the maximum value of the reactive power to which load has to be increased. In the minimum reactive power in MVAR field, mention the minimum value of the reactive power from which load variation has to be started. In the Steps in MVAR field, mention the step of the reactive power by which load should be varied from minimum value to maximum.
Multiplication factor
In this field, mention the multiplication factor library reference number to be referred for this case.
Select Buses of Interest

MiP-PSCT Database Manager User Manual
Power Research and Development Consultants Pvt. Ltd. Page 158
The buses present in the network are listed in this list box to select the plot monitoring buses. The selected buses graphical information is written into the bin file generated by the voltage instability program.
De Select Buses
Use this button to de select buses of interest
After editing all the data, click ‘OK‘ to update the data changes or ‘CANCEL’ to ignore the changes.
1.10.7 Dynamic Stability Analysis
Use “Solve > Dynamic stability analysis” menu option or click DYS button on the right hand side toolbar to invoke and conduct dynamic stability analysis.
This module is designed to perform the dynamic stability analysis for the given power system in both frequency domain (Eigen value analysis) and time domain.
Power system stability studies can be separated into two distinct problems, transient (short-term) problem and the dynamic (long-term) problems. In the transient stability analysis, the performance of the power system when subjected to sudden severe impacts, resulting from disturbances such as a fault followed by switching operations, sudden rejection of load or generation, etc., is studied. The concern is whether the system is able to maintain synchronism during disturbances and following these disturbances. The period of interest is relatively short (a few seconds), with the first swing being of primary importance. The stability depends strongly upon the magnitude and location of the disturbance and to a lesser extent upon the initial state or operating condition of the system. In contrast to transient stability, dynamic stability tends to be a property of the state of the system. Dynamic stability indicates the ability of all machines in a system to adjust to small load changes or impacts. The concern is whether the system has growing oscillation phenomena or damping. As modern power systems become equipped with extremely fast and complicated control system, dynamic stability becomes more important. The stability strongly depends on the initial state or operating condition of the system.
The purpose of a dynamic stability study is -
To reproduce or predict the potential oscillation phenomena of the system through computer simulation, To identify the mode of oscillation and examine the most effective control location, To adjust system control parameters or design compensation equipment to improve system damping,
To install these equipment, at appropriate locations and perform fine tuning.
Study Info
On pressing study info button, a dialog box is displayed with various control options for dynamic stability analysis.
Simulation Time

MiP-PSCT Database Manager User Manual
Power Research and Development Consultants Pvt. Ltd. Page 159
This is the time duration for dynamic stability analysis. Total simulation time in seconds is usually in the range 5 to 10 seconds. Time step for dynamic stability study is usually in the range 0.005 to 0.025 seconds.
Plot Interval
While conducting the study for larger duration, it is not necessary to print or plot the values at each time interval. Hence, facility is given in terms of print interval time step to control the printing. If the simulation time step is 0.005 seconds, and the plot interval time step is 10, then at every 0.05 seconds the printing of results is done.
Print Option
Data output option is interpreted as –
Data &results: Results with Eigen values in the report
Detailed results with data: Eigen values and participation factors in the report
Reference generator number
When basecase load flow is done, one of the generator buses is considered as the reference node. The bus, which is considered as the reference node in the reduced system, is to be selected from the list of the generators displayed in the list box.
Reference generator number
When basecase load flow is done, one of the generator buses is considered as the reference node. The bus, which is considered as the reference node in the reduced system, is to be selected from the list of the generators displayed in the list box.
Disturbance generator number
The generator number is to be selected from the list box, which is to be considered for the disturbance. Disturbance types are as follows
Change of reference angle,
Change of reference Power,
Change of reference Voltage,
Change of SVC reference.
Generators of Interest
The generator numbers for which plotting is required should be selected from the list to analyse the effect of disturbance.
After editing all the data, click ‘OK‘ to update the data changes or ‘CANCEL’ to ignore the changes.
1.10.8 Sub - Synchronous Resonance
Use “Solve > Sub-synchronous resonance” menu option or click SSR button on the right hand side toolbar to invoke and conduct dynamic stability analysis.
This module is designed to perform the sub-synchronous resonance study on the given power system. Frequency response method is used for analysing the stability of sub-synchronous resonance in power systems, as modelled by a number of synchronous machines and an extensive series compensated transmission network. The method allows the simultaneous detailed modelling of all machine shafts and control loops, and hence permits investigation of possible interaction in the sub-synchronous resonance frequency band between machines in different plants.
Series capacitors in power transmission systems give rise to current, voltage and generator torque oscillations at sub-synchronous frequencies. These oscillations can pose major problems in both electrical system and generator mechanical design. There is a strong need for accurate and

MiP-PSCT Database Manager User Manual
Power Research and Development Consultants Pvt. Ltd. Page 160
comprehensive analysis of system dynamic behaviour in the frequency band associated with sub-synchronous frequencies. Sub-synchronous resonance is of electrical origin, although they may be aggravated by the effects of torsional vibrations of generator shafts.
Study Info
On pressing study info button, a dialog box is displayed with various control options for sub-synchronous resonance study.
Generator Bus of Interest
The generators present in the network are shown in the list box. Select from the list the generator bus number on which the frequency variation has to be performed.
Frequency variations
Specify minimum and maximum frequency limits in the respective fields. Variations from minimum to maximum limit are in steps and hence specify the step at which frequency should be varied in the respective boxes provided on the dialog.
1.10.9 Harmonic Analysis
Use “Solve > Harmonic analysis” menu option or click HAR button on the right hand side toolbar to invoke and conduct harmonic analysis.
This module is designed to perform the harmonic study for the given system. The program is capable of performing three-phase harmonic load flow to compute harmonic distortion factors, calculates harmonic transfer and driving point impedances for both transmission and distribution power systems. The algorithm provides facility to model harmonic current and voltage generation sources, power system elements up to a frequency range of 5 kHz. The algorithm also has facility to model low pass, high pass, double tuned and user-defined filters.
Study Info
On pressing study info button, a dialog box is displayed with various control options for harmonic analysis study.
Voltage initialization option from load flow
If the option is checked, the initial condition is considered from the load flow of that particular case.
Harmonic numbers
Select the harmonic numbers for which harmonic analysis are to be done. 1 refer to fundamental component, 2 refers to 2nd harmonic component and so on.
Print option
Following are the print options available. Depending upon the selection, the output file is formatted.
No printing
Data only
Results only
Data and Results
Detailed Print of Data and Results
Plot options:

MiP-PSCT Database Manager User Manual
Power Research and Development Consultants Pvt. Ltd. Page 161
Following are the plot options available. Depending upon the selection, the output graph file is generated.
Plot HDF (Harmonic Distortion Factor) at selected buses.
Plot HDF (Average A phase, B phase, and C phase).
Plot of harmonic voltages for all harmonics.
Plot of harmonic voltages for all harmonics in p.u (Average A phase, B phase, and C phase).
Buses of interest
The buses are present in the network are listed in this list box. Select the plot monitoring buses from this list. The selected buses from this list graphical information are written into the bin file generated by the harmonic analysis program.
De-select Buses
Use this button to de select buses of interest.
Load model option
The following are load model option available. Depending upon the selection, the load modelling is done while conducting the study.
Loads are not considered at harmonic frequencies.
Modeled as parallel combination of resistance and inductive reactance.
Frequency dependent reactance and constant resistance (parallel combination).
By measurements on medium voltage load, using Audio Frequency Ripple Control Generator.
Load impedance at base frequency is constant for all frequencies.
Modeled as series combination of resistance and inductive reactance.
After editing all the data, click ‘OK‘ to update the data changes or ‘CANCEL’ to ignore the changes.
1.10.10 Network reduction analysis
Use “Solve > Network reduction analysis” menu option or click YBR button on the right hand side toolbar to invoke and conduct Network reduction analysis.
Network reduction module is designed to provide the static and dynamic equivalents for the power system. In case of static equivalent, program determines the bus admittance matrix (Ybus) as seen from the desired nodes by eliminating the rest of the nodes. In case of dynamic equivalent, a single machine equivalent circuit is determined. It is often necessary to obtain network equivalents for proper representation in various analyses such as transient and dynamic stability analysis.
The methodology is an extension of the Thevenin theorem to electro-mechanical circuits. Here sparse storage and matrix ordering techniques are used to reduce the memory requirements.
The methodology used for static equivalent, wherein all the generator buses in the system are retained consists of -
Formation of positive sequence sparse Ybus for the given power system.
In the Ybus formation, shunt elements at the buses, which are to be retained, will not be added to the corresponding diagonal elements.
Finding the columns of the positive sequence Zbus for the nodes to be retained.
Assembling the Zbus for the reduced system from the above columns of Zbus.

MiP-PSCT Database Manager User Manual
Power Research and Development Consultants Pvt. Ltd. Page 162
Inverting the Zbus to find the positive sequence Ybus for the reduced system.
Above analysis are done for negative and zero sequence networks.
In case of dynamic equivalent, the procedure involved is -
Internal system is identified. All the buses, which are external to the area of interest, and connected directly to the internal system nodes, are identified. These are the nodes to be retained.
An equivalent generator is considered, connected to the retained nodes in the external system.
Generators in the external system are replaced by the single machine electromechanical circuit.
Study Info
On pressing study info button, a dialog box is displayed with various control options for network reduction study.
Reduction type
Network reduction can be done by either Zone wise or Bus wise.
Zone wise reduction
If Zone wise reduction is selected, following data is required to be entered.
Zone number to be reduced
This list box contains all the zone number present in the network. Select zones to be reduced.
Selected zone generator
The generators present in the selected zone are listed in this list box. Select the generator, which has to be retained and double click on it. If bus wise reduction is selected, following data is required to be entered.
Selected generator
The reference generator in the deduced network is displayed here
Buses to be retained
The buses present in the network are listed in the list box. Select the buses to be retained in the reduced network. This is valid, if the bus wise reduction is checked. If any generator is present at buses, which are not retained, change it as load with negative real and reactive power before executing the network reduction.
Print option
The following are print option available. Depending upon the selection, the output file is formatted.
No printing
Data only
Results only
Data and Results
Detailed Print of Data and Results
Reduced network name
The reduced network is stored as new database file with the specified reduced network name. This database is stored in the directory named YBR, which is created after execution of the network reduction program in the source database directory.
Z Bus print option
If this is selected, the Z-bus is printed in the output file.
Multiplication factor
In this field, mention the multiplication factor library reference number to be referred for this case.
After editing all the data, click ‘OK ‘ to update the data changes or ‘CANCEL’ to ignore the changes.

MiP-PSCT Database Manager User Manual
Power Research and Development Consultants Pvt. Ltd. Page 163
1.10.11 Electromagnetic transient analysis
Use “Solve > Electromagnetic transient analysis” menu option or click ETA button on the right hand side toolbar to invoke and conduct electromagnetic transient analysis.
Electromagnetic analysis study module is designed to perform both transient and dynamic over voltage studies. The objective of the study is to determine the highest discharge currents and energy stresses for the protective equipment and to co-ordinate them with withstand levels of the protected equipment. The program module is able to calculate over voltages, which are caused due to energization of lines, transformers and shunt elements, during fault inception and on clearing of faults.
Study Info
On pressing study info button, a dialog box is displayed with various control options for electromagnetic transient analysis.
The EMTP study menu has data input option for control data and output options. Under control data menu, following information should be given.
Disturbance
The following are the fault types available in the module.
No fault
Phase A to ground fault
Phase B to ground fault
Phase C to ground fault
Phase AB to Ground Fault
Phase BC to Ground Fault
Phase CA to Ground Fault
Phase ABC to Ground Fault
Impulse
Disturbance Info
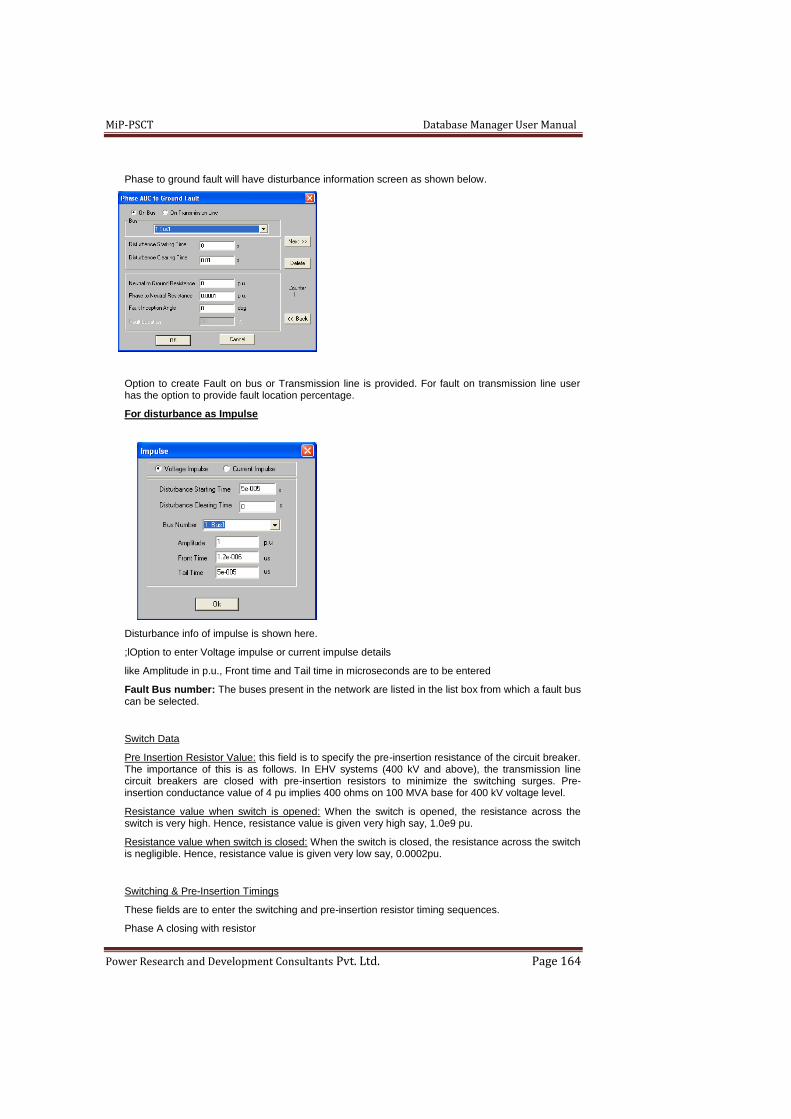
MiP-PSCT Database Manager User Manual
Power Research and Development Consultants Pvt. Ltd. Page 164
Phase to ground fault will have disturbance information screen as shown below.
Option to create Fault on bus or Transmission line is provided. For fault on transmission line user has the option to provide fault location percentage.
For disturbance as Impulse
Disturbance info of impulse is shown here.
;lOption to enter Voltage impulse or current impulse details
like Amplitude in p.u., Front time and Tail time in microseconds are to be entered
Fault Bus number: The buses present in the network are listed in the list box from which a fault bus can be selected.
Switch Data
Pre Insertion Resistor Value: this field is to specify the pre-insertion resistance of the circuit breaker. The importance of this is as follows. In EHV systems (400 kV and above), the transmission line circuit breakers are closed with pre-insertion resistors to minimize the switching surges. Pre-insertion conductance value of 4 pu implies 400 ohms on 100 MVA base for 400 kV voltage level.
Resistance value when switch is opened: When the switch is opened, the resistance across the switch is very high. Hence, resistance value is given very high say, 1.0e9 pu.
Resistance value when switch is closed: When the switch is closed, the resistance across the switch is negligible. Hence, resistance value is given very low say, 0.0002pu.
Switching & Pre-Insertion Timings
These fields are to enter the switching and pre-insertion resistor timing sequences.
Phase A closing with resistor

MiP-PSCT Database Manager User Manual
Power Research and Development Consultants Pvt. Ltd. Page 165
Initially the circuit breaker is in open position, which is equivalent to having a high resistor connected between the two ends of each pole. When the switching is initiated, this field is to specify the time at which pole A should close with resistor after zero crossing of the voltage. This time is usually 0.0 seconds.
Phase B closing with resistor
This field is to specify the time in seconds at which pole B should close with pre-insertion resistor, from the start of closing operation. This time is usually two milliseconds
Phase C closing with resistor
This field is to specify the time in seconds at which pole C should close with pre-insertion resistor, from the start of closing operation. This time is usually four milliseconds.
Phase A pre-insertion resistor shorting
This field is to specify the time in seconds at which pole A pre-insertion should be shorted. This is usually 8 milliseconds from the start of closing operation.
Phase B pre-insertion resistor shorting
This field is to specify the time in seconds at which pole B pre-insertion resistor should be shorted. This is usually 10 milliseconds
Phase C pre-insertion resistor shorting
This field is to specify the time in seconds at which pole C pre-insertion resistor should be shorted. This is usually 12 milliseconds.
Note:
If no pre-insertion resistors are present, then this value should be given same as resistance value when closed.
Switch closing times refer to the moment, at which the switching operation is initiated and not from the beginning of the simulation. For example, simulation starts from 0.0 sec., however switching may be initiated after 0.5 second. Under this condition phase A closing with resistor is 0.002 second, means (0.5+0.002) seconds is the phase A closing time. These timings should be given in sequence and in increasing order.
Switching Info.
This button invokes the following screen. Enter the switching details of the bus coupler.
Time between switching
This field is to specify the time between the selected switching sequences.
Line number
This list box contains list of all series elements present in the network. Select the series element from the list on which switching sequence has to be performed.
Simulation time
This field is to specify the total duration over which simulation has to done. Maximum duration of simulation, normally 1 to 2 seconds will be enough to study the transient behaviour.
Time Step
This field is to specify the time step at which the simulation time has to be increased. The simulation time step is important which depends on the type of

MiP-PSCT Database Manager User Manual
Power Research and Development Consultants Pvt. Ltd. Page 166
study. Usually it will be in terms of microseconds. Typical values are 1 sec, 10 sec and 50 secs.
Fault starting time
Fault initiation time is measured from the beginning of the simulation i.e., t = 0.0 seconds. It is the time at which fault is applied.
Fault clearing time
Fault clearing time is measured from the beginning of the simulation i.e., t = 0.0 seconds. It is the time at which fault is cleared.
Plot steps
This field is to specify the plot steps required in the graph file generated. If the simulation time step is 50Msec and the plot step is 10, then at each 500Msec interval, the results are generated in the graph file.
Plot start time
This field is to specify the plot starting time. From the specified plot start time, the graph file is generated during the study.
Plot end time
This field is to specify the plot end time. From the specified plot end time, the results writing into graph file is terminated.
Plot Buses
The buses present in the network are listed in this list box to select the plot monitoring buses. The selected buses graphical information is written into the bin file generated by the electromagnetic transient program.
After editing all the data, click ‘OK ‘ to update the data changes or ‘CANCEL’ to ignore the changes.
Comtrade output options: With this option EMTP study report will be generated in IEEE standard comtrade format for specified CT and CVT at primary or secondary side. The “.cfg” file will be generated in the executed ETA folder. This cfg file can be opened in comtrade viewer.
1.10.12 Three Phase Load flow Analysis
Use “Solve -> Three phase load flow analysis” menu option or click 3PH button on the right hand
side toolbar to invoke and conduct Three phase unbalanced load flow analysis. This module is designed to perform the unbalanced load flow analysis for the given system. Sparse storage and matrix ordering techniques are used in the program to reduce the memory requirements. Fast computational methods are employed to speed up the execution. Program performs the 3 phase load flow analysis to compute the unbalance in the system.
Study Info
On pressing study info button, a dialog box is displayed with control options for three phase load flow analysis study.
P-Tolerance
It is the Real Power Tolerance in PU on the given base. This is used to check the real power convergence of three phase load flow. During each iteration of load flow, maximum real power mismatch at all the buses is computed. When real power mismatch is less than the real power tolerance and the maximum reactive power mismatch is less than the reactive power tolerance, convergence is achieved. On a 100 MVA base 0.001 PU is generally an acceptable value for tolerance. This results in 0.1 MW real power error. If the load values are relatively large, then the tolerance value can be as high as 0.1 PU on 100 MVA base.

MiP-PSCT Database Manager User Manual
Power Research and Development Consultants Pvt. Ltd. Page 167
Q-Tolerance
It is the Reactive Power Tolerance in PU on the given base. This is used to check the reactive power convergence of fast-decoupled load flow. During each iteration of load flow, maximum reactive power mismatch at all the buses is computed. On a 100 MVA base 0.001 PU is generally an acceptable value for tolerance, this results in 0.1 Mvar reactive power error. If the load values are relatively large, then the tolerance value can be as high as 0.1 PU on 100 MVA base.
Number of Iterations
Maximum number of iterations refers to the iteration number after which the load flow iteration is terminated. It is usually given in the range 15-20. In the case of reactive power optimization, a value of 100 can be entered.
Q Check Limit
It is the iteration number after which the generators are checked for Q-limit violations. Normal value is 4. A value less than 4 usually results in oscillations during solution and a value greater than 4 results in more iteration to get the solution. In order to disable Q checking, this limit should be greater than the maximum number of iterations specified.
Slack Bus Number
Slack bus is the bus selected to supply the additional real and reactive power to accommodate the losses in the network, since these are unknown until the final solution is obtained. The voltage is maintained at specified PU at this bus. In case the user does not select any bus, Load flow analysis will select the maximum generation bus as the slack bus.
Print Options
The user is provided with three options –
Results only : : Printing Results only
Data and results : : Printing Both data and results
Detailed results with data : : Printing of data and results with Y-bus details
Reduction Factor
This is cross-reference between relevant menu and the reduction factor Library. To conduct a study for a particular system by simulating a condition where the load/generation at a particular zone is increased/decreased, do so by giving some factors for load/generation in Reduction factor library. There is no need to change the value of loads and generation in that zone to carry out the study.
Multiplication Factor
This is cross-reference between relevant menu and the multiplication factor Library. The
zone wise multiplication factors are specified in the Multiplication factor library.
1.10.13 Reliability Indices
Use “Solve > Reliability Indices” menu option or click RID button on the right hand side toolbar to invoke and conduct Reliability Indices. This module deals in quantifying the availability of the given system based on the failure rate and repair time of each and every equipment associated.
Interruption: The loss of service to one or more customers or other facilities and is the result of one or more component outages, depending on system configuration.
System interruption frequency index : The average number of interruptions per customer served per unit time.
= (Accumulated number of customer interruptions during the unit time) / (number of customers served)
Customer interruption frequency index : The average number of interruptions experienced per customer affected per unit time.
= (Number of customer interruptions during the unit time) / (number of customers affected)

MiP-PSCT Database Manager User Manual
Power Research and Development Consultants Pvt. Ltd. Page 168
Load interruption index: The average KVA of the connected load interrupted per unit time per unit of connected load served.
= (Annual load interruption) / (Connected load)
Customer curtailment index: The kVA-minutes of connected load interrupted per affected customer per year.
= (Total annual curtailment) / (Number of customers affected per year)
Study Info
On pressing study info button, a dialog box is displayed with control options for Reliability Indices is displaye
Enter Interruption case no, load point affected and Duration of interruption.
ADD: Use this button to add case to the list box
Remove: Use this button to remove a case from the list box
Remove All: use this button to remove all the cases from the list box with single click.
How to conduct a study
Invoke MiP-PSCT by double-clicking the MiP-PSCT icon on the desktop.
On the MiP-PSCT main screen double-click on the icon Database Manager.
Database Manager menu appears.
To create new database please refer topic 3.2.1
To configure the database please refer topic 3.7.1
To add/edit/modify/delete any record please refer topic 3.6
Click OK button to save the entries of the dialog and close the dialog.
Click Cancel to ignore the entries and close the dialog.
Then execute Reliability Indices and the following indices will be listed in the report.
System average interruption frequency index(SAIFI)
1. Select any one of the option
2. If Selected enter all the fields in the dialog box
3. If selected enter on data
corresponding to first group
4. If selected enter data corresponding to this group

MiP-PSCT Database Manager User Manual
Power Research and Development Consultants Pvt. Ltd. Page 169
System average interruption duration index (SAIDI)
Customer average interruption duration index (CAIDI)
Average service availability index (ASAI)
Average service unavailability index (ASUI)
Energy not supplied index (ENS)
Average energy not supplied index (AENS)
Sample Plot for reliability Indices is given below.
1.10.14 Observability Analysis
Use “Solve > Observability Analysis” menu option or click OBS button on the right hand side toolbar to invoke and conduct Obdervability Analysis.
Steps to do the study
1. Configure all measurements in database at all locations
2. Run load flow study. Import load flow results to meter data by using Import option and this will fill all the meters measurements from load flow results
3. User can select different scenarios by using the menu called ‘Global Change’
4. Run observability Analysis and check the report
Sample Report with “All measurements” data

MiP-PSCT Database Manager User Manual
Power Research and Development Consultants Pvt. Ltd. Page 170
From the results it is observed that with provided meter locations, all buses belongs to single island and all line are observable.
1.10.15 State Estimation
Use “Solve > State Estimation” menu option or click SEM button on the right hand side toolbar to invoke and conduct State Estimation Analysis.
Steps to do the study
1. Configure all measurements in database at all locations
2. Run load flow study. Import load flow results to meter data by using Import option and this will fill all the meters measurements from load flow results.
3. User can select different scenarios by using the menu called ‘Global Change’
4. Run State Estimation and check the report

MiP-PSCT Database Manager User Manual
Power Research and Development Consultants Pvt. Ltd. Page 171
Sample Report with “All measurements” data
From the results, it is observed that, the state estimation program has provided the results which are in line with load flow results. Also the voltage angles calculated by state estimation are in line with load flow results.
State estimation with Bad Data detection
Steps to do the study
Inject the bad data at meter locations
Select Solve- > State estimation - > Study info
Change the no. of bad data and tolerance for detecting bad data
Sample report is shown below

MiP-PSCT Database Manager User Manual
Power Research and Development Consultants Pvt. Ltd. Page 172
1.10.16 Arc Flash Analysis
Use “Solve > Arc Flash Analysis” menu option or click AFS button on the right hand side toolbar to invoke and conduct Arc Flash Analysis.
Steps to do the study
5. Enter network data and protective device data in the database manager
6. Enter Arc flash data in Bus details form
7. Enter the required data in study info of Arc Flash.
8. Execute and check the report.
Study Info
Select the type of method as IEEE 1584-2002a and fault type is three phase to ground fault
Select the system grounding is grounded and selects the bus where the Arc Flash Analysis to be done. Click on Ok button to save the control options.
Note: Run the short circuit study for the same bus prior to the arc flash analysis
ExecuteArc Flash Analysis and click on Report
Sample report
ARC FLASH STUDIES RESULT:
------------------------------------------------------------------------------
BUS-ID Nominal-Voltage EquipmentType BUS-GAP Working-Dist X-
FACTOR BUS-BoltedFaultCurrent BUS-ArcCurrent
(kV) (mm) (mm)
(kA) (kA)
PD-ID PD-ArcCurrent PD-OperatingTime
IncidentEnergy ArcFlashBoundary HazardRiskCategory
(kA) (sec)
(Cal/cm2) (feet)
------------------------------------------------------------------------------
3 0.480 1 32.000
610.000 1.473 37.771 19.113
3 19.113 0.371
15.733 11.516 003
1.11 Tools Menu
1.11.1 Present worth Analysis
In the power system analysis viability of any project depends on both technical and commercial feasibility. While tools like load flow analysis decides the technical feasibility, present worth analysis can be used to decide the economic viability of the project. Given the data, present worth analysis is done to determine the feasibility, net cash inflow and Benefit to investment ratio.On selecting this option the following dialog box appears,

MiP-PSCT Database Manager User Manual
Power Research and Development Consultants Pvt. Ltd. Page 173
n
n
ii
ifactorAnnuity
)1(
1)1(
The data required for performing the present worth are as follows –
General Interest rate in percentage overhead and maintenance charges in percentage Project life in years
Investment Capital investment in Rupees
Savings Peak Load power saving in MW, Unit energy charges in Rupees
Loss Load factor
Enter loss load factor otherwise use Cal button to obtain the loss load factor
Click on Compute to check the feasibility. The project feasibility block displays the net present worth, benefit to investment ratio and the feasibility.
Procedure
Cash outflow
Annual Expenses = Investment* (O&M charges/100);
Present worth of annual expenses = Annual expenses * Annuity factor
Where n = number of project life in years
i = interest rate
Present worth of cash out flow = Investment + Present worth of annual expenses;
Cash Inflow (savings)
Load factor = Average power/ Maximum demand
Loss load factor = 0.3*Load factor+0.7*(Load factor)2
Energy Saved = Peak load power saving in MW*1000*8760*Loss Load factor
Cost of Energy saving = Energy Saved * Unit of Energy
Present worth of net cash inflow = Cost of Energy saving * annuity factor
Net Present Worth = Present worth of net cash inflow - Present worth of cash out flow
Net Benefit = ( Net Present worth + Investment )
Benefit to Investment ratio = ( Net Benefit / Investment )
If the net present worth is positive, the project is feasible.
Click on Save and Open to save the present worth analysis feasibility report.
The report consists of
Data
Interest Charges in percentage, O and M Charges in percentage, Project Life in Years, Capital Investment in rupees, Peak Load Power Saving in MW, Loss Load Factor, Unit Charge Rupees/kwh
Output
Annual expenses in rupees
Present worth of annual expenses in rupees
Present worth of cash outflow in rupees
Annual saving in energy in kWh
Cost of energy saving in rupees

MiP-PSCT Database Manager User Manual
Power Research and Development Consultants Pvt. Ltd. Page 174
Present worth of cash Inflow in rupees
Net Present Worth in rupees
Benefit to Investment Ratio
Whether the project is feasible or not
Sample Case study
Present worth analysis feasibility report FEASIBILITY STUDY USING PRESENT WORTH CALCULATION
---------------------------------------------------------
Interest Charges : 12.0 %
O and M Charges : 3.0 %
Project Life : 10 Years
Capital Investment : 900000 Rs
Peak Load Power Saving : 0.050 MW
Loss Load Factor : 0.432
Unit Charge : 2.00 Rs/kwh
----------------------------------------------------------
Annual Expenses : 135000 Rs
Present Worth of Annual Expenses : 762780 Rs
Present Worth of Cash Outflow : 1662780 Rs
Annual Saving in Energy : 189216 kwh
Cost of energy saving : 378432 Rs
Present Worth of Cash Inflow : 2138225 Rs
Net Present Worth : 475445 Rs
Benefit to Investment Ratio : 1.528
Project is Feasible
1.11.2 Cost Analysis
One of the methods to do feasibility study for any equipment to be installed is Cost analysis. Two contingencies can be compared each other by selecting them by Option 1 and Option 2. Different cases and schedules can also be selected here. Option 2 will always be the base case and Option 1 will be any of the contingencies whose feasibility is to be checked.
General: Interest rate in percentage, overhead and maintenance charges in percentage, Project life in years.
Load Factor and Loss Load Factor:
Load factor and Loss load factor can be calculated by using the “Cal” button given in the window. For Load factor enter Energy input, Max generation and Duration in hours and press “OK”, it will calculate Load factor and for Loss load factor enter constant A and programme will calculate Loss load factor. Load factor can be entered directly also. The window for the calculation of LF and LLF are as below.
Load factor (LF) = Energy input/(Max generation*Duration in hours)
Loss load factor = A* LF + (1-A)*LF2

MiP-PSCT Database Manager User Manual
Power Research and Development Consultants Pvt. Ltd. Page 175
Unit Energy Charges: Enter the charges for unit energy in Rupees.
Procedure:
Cash outflow:
Annual Expenses = Investment* (Interest + O&M charges)/100;
Present worth of annual expenses = Annual expenses * Annuity factor
Annuity Factor = [(1+i)^n-1]/(i(1+i)^n);
Where n = number of project life in years
i = interest rate
Present worth of cash out flow = Investment + Present worth of annual expenses;
Cash Inflow (savings)
Energy Saved = Peak load power saving in MW*1000*8760*Loss Load factor
Cost of Energy saving = Energy Saved * Unit of Energy
Present worth of net cash inflow = Cost of Energy saving * Annuity factor.
Net Present Worth = Present worth of net cash inflow - Present worth of cash out flow.
Benefit to Investment ratio = (Net Present Worth)/Investment.
If the Net present worth is positive the project is feasible.
Output:
Annual expenses in rupees
Present worth of annual expenses in rupees
Present worth of cash outflow in rupees
Annual saving in energy in kWhr
Cost of energy saving in rupees
Present worth of cash Inflow in rupees
Net Present Worth in rupees
Benefit to Investment Ratio
Whether the project is feasible or not.
Sample:
Present worth analysis feasibility report
FEASIBILITY STUDY USING PRESENT WORTH CALCULATION ---------------------------------------------------------
Interest Charges : 12.0 %
O and M Charges : 3.0 %
Project Life : 10 Years
Capital Investment : 1572864 Rs
Peak Load Power Saving : 0.760 MW
Loss Load Factor : 0.432
Unit Charge : 2.00 Rs/kwh

MiP-PSCT Database Manager User Manual
Power Research and Development Consultants Pvt. Ltd. Page 176
----------------------------------------------------------
Annual Expenses : 235930 Rs
Present Worth of Annual Expenses : 1333050 Rs
Present Worth of Cash Outflow : 2905920 Rs
Annual Saving in Energy : 2876140 kWh
Cost of energy saving : 5752270 Rs
Present Worth of Cash Inflow : 32501600 Rs
Net Present Worth : 29595700 Rs
Net Benefit : 31168600 Rs
Benefit to Investment Ratio : 19.816
Project is Feasible
1.11.3 Management Information System (MIS)
Select this menu option "Tools > MIS" to obtain a brief summary about the power system under study. On selection, save as dialog box appears. In the File name box, type the text file name. Click OK.
After the process is completed, the text file is opened.
The output file contains the following details
Bus Data
The number lines of output are equal to the different voltage levels used in the system.
Each line consists of voltage in kV and the number of buses with that voltage.
Two Winding Transformer Data
The number lines of output are equal to the number of different Primary/Secondary voltage ratings in the system.
Each line consists of primary voltage, secondary voltage in kV and total installed capacity in MVA
Transmission Line/Cable Data
The number lines of output are equal to the number of different transmission line voltage levels in the system.
Each line consists of transmission line voltage level, total circuit length in kilometers
Generator Data
Total installed generation capacity in MW in the system
Load Data
Total real power and reactive power in the system
Sample Management Information System output file Management Information
-----------------------
Bus Data
--------
Voltage in kV Number of Buses
------------- ---------------
11.000 646
15.750 2
400.000 6
220.000 63
110.000 200
66.000 344
10.500 1
33.000 396
-----------------------------------------------------------------------------
Two Winding Transformer Data
----------------------------
Voltage Rating Total Installed
Primary Secondary Capacity
(kV) (kV) (MVA)
------------------ ----------------
400.000/ 15.750 387.000
400.000/ 220.000 774.000

MiP-PSCT Database Manager User Manual
Power Research and Development Consultants Pvt. Ltd. Page 177
220.000/ 11.000 3483.000
220.000/ 15.750 387.000
220.000/ 110.000 5289.000
220.000/ 66.000 6063.000
220.000/ 10.500 258.000
110.000/ 11.000 28122.000
110.000/ 66.000 1548.000
110.000/ 33.000 16383.000
66.000/ 11.000 59211.000
66.000/ 33.000 1935.000
33.000/ 11.000 44634.000
-----------------------------------------------------------------------------
Transmission Line/Cable Data
-----------------------------
Voltage Total Circuit Length
(kV) (kilometers)
---------- -------------------
400.000 1151.000
220.000 7750.900
110.000 5241.299
66.000 5779.359
33.000 5436.200
-----------------------------------------------------------------------------
Generator Data
--------------
Total Installed Generation Capacity: 6667.000 MW
-----------------------------------------------------------------------------
Load Data
---------
Real Power Reactive Power
(MW) (Mvar)
---------- --------------
3.950 4025.3
1.11.4 Batch Mode
Load flow Analysis for different contingencies can be done at a time by using this option.
Select Tools > Batch Mode
A dialog box appears,
The existing contingencies along with the names appear in the dialog box. Select the contingencies for
which the study is to be done or customised report is to be generated.
Select -
Standard - To generate the standard report
Custom Individual - To generate individual custom report for each selected contingency.
Custom Combined - To generate a combined report for all the selected contingencies. (It appends to a user-defined file). Give the file name in the adjacent edit box.
Click on
Add : To add a contingency to the selected contingency list box
Add All : To add all the contingencies to the selected contingency list box
Remove : To remove a selected contingency.
Remove All : To remove all the contingencies from the selected contingency list box
Custom options: To modify the custom report options
Update Custom Report: This option can be used only after the selected contingency is executedat least once. This option helps to generate customised report for different custom report options.
Execute : To execute and generate the reports for the selected contingencies.

MiP-PSCT Database Manager User Manual
Power Research and Development Consultants Pvt. Ltd. Page 178
Delete Contingency: To delete the selected contingency
Open : To open the combined customised report. The report will be generated in the lfa directory.
Close : To close the dialog box
1.11.5 Batch Mode Contingency Creation
Select this option to create the contingencies. The different options provided by are –
Remove a contingency from the selected contingencies
Add contingency to selected contingency
Create New contingencies by removing/and adding contingency
Create Transmission line outage contingency
Create Transformer outage contingency
Remove Contingency
Select the contingencies from which a contingency has to be removed. Select a contingency from
the combo box to be removed from the selected contingencies. Click on Remove.
Contingency Number = Old Contingency Number
Contingency Name = Old Contingency Name
Contingency Contents = Old Contingency - Remove Base
Old Contingency is the selected contingencies in the selected list box;
Add New Base Contingency
Select the contingencies to which a new base contingency is to be added. Select a contingency from the combo box to be added to the selected contingencies. Click on Add New Base. The new base contingency is added to the selected contingencies.
Contingency Number = Old Contingency Number
Contingency Name = Old Contingency Name
Contingency Contents = Old Contingency + New Base
Old Contingency is the selected contingencies in the selected list box;
Create New contingency
New contingencies can be created by adding or removing contingencies. Select the contingencies from which new contingency is to be created, from the remove base contingency select a contingency to be removed (if nothing is selected no contingency is removed), from the add new base contingency combo box select a contingency to be added. Enter the offset number and the prefix for the newly created contingency. Click on Create New Contingency, the new contingencies will be created with the following details
Contingency Number = Old Contingency Number + Offset
Contingency Name = Prefix + Old Contingency Name

MiP-PSCT Database Manager User Manual
Power Research and Development Consultants Pvt. Ltd. Page 179
Contingency Contents = Old contingency – Remove Base Contingency + Add New Base Contingency
Old Contingency is the selected contingencies in the selected list box;
Create Contingency
Select this option to create single line outage and transformer outage depending on the selected from and/or to Voltage.
Transmission Line Outage
Select Transmission line from the combo box only the From bus is activated. Select the voltage level. If all the lines are to be opened one at a time then select voltage as 0.0. Click on Create Contingency. Contingencies are created in a sequence starting from the number entered in the starting number edit box.
The contingency name is generated depending on the from bus and to bus numbers.
Transformer Outage
Select transformer from the combo box. Select the From voltage and To voltage level. If all the transformers are to be opened one at a time then select from and to voltage as 0.0. Click on Create Contingency. Contingencies are created in a sequence starting from the number entered in the starting number edit box.
The contingency name is generated depending on the from bus and To bus numbers. Three winding transformer outage can also be done.
1.11.6 Batch Mode for Load Curves
Load curve is very useful for financial studies of the stations. The daily load curve shows the load demand during the 24 hours of the day as a plot of load against the time at which it occurs. Throughout the year there is a variation of load demand, from day to day and the daily load curves are not alike. The load curve in summer would be different from that in the winter. There might be development of load during the year, so that demand on the station might increase during the year. To obtain a correct indication of the financial aspects and working of the station, it is necessary to estimate the consumption of energy during the whole year as well as the annual load factor, annual capacity factor and annual use factor.
Maximum Demand: Maximum of all generation
Load Factor: Cumulative Generation / (peak demand x time duration in hrs x 1000)
Loss Load Factor: Total loss / (no. of intervals x peak power loss)
Percentage loss = (Total loss / Total generation) x 100
Select this option to create day or month or annual load curves. Select menu option Tools > Batch Mode for Load Curves.
Duration: Select the duration option
Contingency Number: Select the contingency case for which load curve is to be plotted.
Schedule Number: Select the schedule number for which load curve is to be plotted.
Reduction Factor Start: Select the reduction factor from which case load curve computation is to be started
Reduction Factor End: Select the reduction factor to which case load curve computation is to be ended
Execute: Click this execute button to run the load curve program. During execution, Cumulative loss in kWh, Cumulative generation in kWh, Cumulative load in kWh and percentage loss for each reduction factor (interval) will be displayed.
Report: Click this button to store computed results in a user defined file.
Graph: Click this button to invoke MiGraph. Load curves can be plotted taking Duration as fraction of a Day or Month or Year along X-axis and Real power load in MW, Real power generation in MW, Real power loss in MW, Load in kWh, Generated energy in kWh, Energy loss in KWh along Y-axis.

MiP-PSCT Database Manager User Manual
Power Research and Development Consultants Pvt. Ltd. Page 180
This option can be used to conduct repetitive load flow analysis from the periodic readings available.
File Format: If this button is clicked, it shows the file format. Sample format is as given below.
Load Curve
7
Duration as fraction of a Day
Real Power Load in MW
Real Power Generation in MW
Real Power Loss in MW
Load in kWh
Generated Energy kWh
Energy Loss in kWh
Duration as a fraction of a Day
Power in MW
Power in MW
Power in MW
Energy in kWh
Energy in kWh
Energy in kWh
0.000000 9.08278 9.14000 0.0572200 217987. 219360. 1373.28
1.00000 9.08278 9.14000 0.0572200 217987. 219360. 1373.28
This can be conducted in two methods.
From reduction factor library
Taking data from the data file.
For method one create the reduction factor library by giving real and reactive power reduction factors in reduction factor library, create as many reduction factors as the number of readings consecutively. Select
the starting and ending reduction factor number, select proper duration, schedule, and case number. Select reduction factor library radio button options from get data and click on execute button.
For method two create a text file with .lcd extension in the following format. For example if 3 readings are available per day.
3
1 1.0 20 10
2 1.01 22 11
3 1.02 25 13
Where
First line is the number of readings available.
For each reading serial number, voltage in per unit, real power in MW and reactive power in MVAR are to be entered.
Select input data file radio button and browse the above created file name from browse button option, give tolerance values for real and reactive power and then click on execute button.
The program is going to calculate the reductions factors for each reading by conducting repetitive load flow.
Once execution is completed click on graph button to view load curve graph for duration as a fraction of duration versus
Real power load in MW
Real power generation in MW
Real power loss in MW
Load in Kwh
Generated energy in Kwh
MiP-PSCT Database Manager User Manual
Power Research and Development Consultants Pvt. Ltd. Page 181
Energy loss in Kwh
On click of report button, the program will ask for the location and file name for the report file. Give the proper file name and location. The report file contains
Maximum of all generation in MW
Average generation in MW.
Load factor
Loss load factor
Loss Load Factor from Empirical Formula 0.3*Load Factor+0.7*Load Factor *Load factor
Cumulative Energy Loss
Cumulative Energy Generation
Cumulative Energy Load and
Percentage Energy Loss
Sample Out Put File
Batch Mode Load Flow For Load Curves
---------------------------------------------------
Maximum Generation : 2.71700 MW
Average Generation : 2.71700 MW
Load Factor : 1.00000
Loss Load Factor : 1.00000
L.L.F from Empirical Formula 0.3*L.F+0.7*L.F*L.F : 1.00000
L.L.F from Empirical Formula 0.2*L.F+0.8*L.F*L.F : 1.00000
Cumulative Energy Loss : 7339.58 kWh
Cumulative Energy Generation : 65208.0 kWh
Cumulative Energy Load : 57868.4 kWh
Percentage Energy Loss : 11.2556 %
1.11.7 Advanced Contingency Creation
Load flow analysis for different contingencies & for both lines & transformers can be done by using this option
Base Contingency: Select the contingency from the combo box for base contingency.
Zone No: Select the required zone number
Area number: Select the required area number
Owner number: Select the required owner number
Voltage: Select the required voltage level from the combo box.
Outage: Enter no of outages.
Lines: Select this if only line outage is required. If outage is 1 then program will do analysis for 1 outage. If outage is 2, program performs outages with combinations.
Transformer: Check this if only transformer outage is required. If outage is 1 then program will do analysis for 1 outage. If outage is 2, program performs outages with combinations.
Check both if line & transformer outage is required. If outage is 2 and line and transformer are selected then program will perform load flow analysis with line and transformer outage combinations.

MiP-PSCT Database Manager User Manual
Power Research and Development Consultants Pvt. Ltd. Page 182
Show Records: Displays lines & transformers depending upon the selection of area, zone, owner & voltage.
Custom Options: To modify the custom report options. Use this option before load flow analysis
Load Flow Analysis: Load flow analysis is performed with the contingencies.
Custom Report: Select this button to view the load flow analysis report for the different contingencies with customised options.
1.11.8 Distribution Analysis
This tool can be extensively used for transmission/distribution system analysis .This option can be selected from the main menu Tools > Distribution Analysis. Different options such as Add express feeder, Change line/cable library, Add a source point and Open Line-Cable can be done On selecting this option following dialog appears.
Study Information : In this contingency no and case no have to be selected. If add express feeder check box is checked then Express feeder details have to be given.
Change Line - Cable Library.: If line cable library is to be changed then this option is selected. All lines libraries can be changed or selected cable library can be changed
Add Source Point: To add new source point. Existing buses in the system will be displayed in the window. Double click on the bus to which the new source to be added. Source buses will be displayed in the window Bus with Source Connected.
Express feeder details: These fields were hidden. If express feeder check box is checked then only they will be seen. Select From Bus and To Bus, where the express feeder is to be connected. Give the Line Length in km and library reference number can be given in Lib Num.
Open Line or cable: All the existing line/cable will be displayed in the window Lines-Cables in the System. Double click on the line/cable to be opened. Opened line/cable will be displayed in the window Lines-Cables Opened
Execute: To do the analysis click this button
Done: Click Done to finish the study and to exit from Distribution analysis. To accept the changes made on the database click Yes on the message popping up on the Distribution Analysis window.
If YES is clicked changes made were store in the database. If NO is clicked changes will not be saved

MiP-PSCT Database Manager User Manual
Power Research and Development Consultants Pvt. Ltd. Page 183
1.11.9 Energy Loss Computation
This option is used mainly for distribution system. This option can be selected from the main menu Tools > Energy loss Computation. The selection opens the following form.
If the generation and loss data is from load flow, then the values will be computed for other fields. If the option for generation and loss data is User defined then the fields Generation, no load loss and I*I*R loss will be activated and the user should provide the data. Total energy losses will be computed by the program.
Sample report is given below
---------------------------------------------------
ENERGY LOSS COMPUTATION
CASE NO: 1 CONTINGENCY: 1 SCHEDULE NO: 0
CONTINGENCY NAME: dog
---------------------------------------------------
Maximum generation : 2.71700 MW
Total I^2R loss : 0.305816 MW
Total no load loss : 0.000000 W
Load factor : 0.00153355
Loss load factor from empirical
Formula (0.300000*L.F+0.700000*L.F*L.F):0.000461713
Total I2R energy loss : 3.38878 kWh
Total no load energy loss : 0.000000 kWh
Total energy loss : 3.38878 kWh
Percentage energy loss : 3.38878 %
1.11.10 Update Breaker Ratings
The breaker ratings for the equipment can be modified. For each voltage level change the breaker ratings and select this option to update all the breaker ratings
1.11.11 Update De-rated MVA Rating
Use this option to update the De-rated MVA as MVA rating from corresponding library. Select the element and click modify button to update the MVA ratings in element data from the corresponding library. Then click Close button.

MiP-PSCT Database Manager User Manual
Power Research and Development Consultants Pvt. Ltd. Page 184
1.11.12 Update Real Time Data
The following dialog box appears when a real time data is to be updated in the database manager
Select the real time data file. On OK, the file is read and a contingency with the given number and name is generated. A schedule with the given number and name is generated.
The new contingency and schedule is selected as current contingency and schedule.
The file format for the real time data is as follows. The data should be separated at least by one blank.
System specification data
Number of elements with change in status.
Number of Generators
Number of Loads
Element details
For each element status changed the following data is required
Type of Element
Element Identification number
Status
Sl No Type Description
19 Three Winding transformer
20 Four Winding transformer
21 Two winding transformer
22 Transmission line
23 Series Resistor
24 Series Reactor
25 Series Capacitor
26 Bus Coupler Open
27 Bus Coupler Closed,
28 Vacuum CB Open,
29 Vacuum CB Closed,
30 Isolator Open
31 Isolator Closed
32 Shunt Resistor,
33 Shunt Reactor
34 Shunt Capacitor
35 Generator
36 Motor
37 Load
38 Cyclic Load
39 INST Current Source
40 IMP Current Source
41 RMS Current Source
42 INST Voltage Source
43 IMP Voltage Source
44 RMS Voltage Source
45 Lightning Arrester
46 Static VAR Comp
47 Delta Load
48 Filter
49 HVDC Inverter
50 HVDC Converter
51 DC Link

MiP-PSCT Database Manager User Manual
Power Research and Development Consultants Pvt. Ltd. Page 185
The element identification number is the element ID from the MiP-PSCT - Database.
Status:
0 – open on either side
1 – Open on from side (for transmission lines only)
2 – Open on to side (for transmission lines only)
Generator data:
For each generator,
Generator ID, specified voltage, real power, reactive power limits (Qmin and Qmax) and
Load data:
Load ID, real power, and reactive power
Sample File
// 2 elements open, 2 generators and 4 loads
2 2 4
// Elements
22 1 1
22 2 0
// Generator data
1 1.06 90 0 60
2 1.00 40 30 30
// Load data
1 20 10
2 45 15
3 40 5
4 60 10
1.11.13 Transformer Check
Use “Tools > Transformer Check > > Library” to list the Transformers whose Primary Voltage and the secondary voltage does not match with the associated Library ratings.The file with the listing is opened. It contains the following details.
Element Number
From Bus Number
To Bus Number
From Bus voltage in kV
To Bus voltage in kV
Primary Voltage from Library in kV
Secondary Voltage from Library in kV
Use “Tools > Transformer Check > > Taps” to list the parallel Transformers with different taps. The file with the listing is opened. It contains the following details.
Element Number
From Bus Number
To Bus Number
Comment [A1]: No report format insert snapshot

MiP-PSCT Database Manager User Manual
Power Research and Development Consultants Pvt. Ltd. Page 186
Tap Position
Use “Tools > Transformer Check > > Data” to list if more than one transformer. is connected to same Bus for which the from bus is different. The file contains the following details
Element Number
From Bus Number
From bus voltage
To Bus Number
To Bus Voltage
1.11.14 View – Delete Log
Use “View > Delete log” to open the delete log file. All the elements deleted in the database are logged to a file. The file consists of the following details
Table Name from which the data was deleted
Element Id
Date and time of deletion
1.11.15 Edit Bus Data
To modify the old bus data with new bus data this option is used. Bus data file format is as given below 2 2
1 5 Bus1 Bus5
2 10 Bus2 Bus10
Store this file format and open this file with Edit Bus data option as shown below.
Modify: Changes the old bus no, old bus name with new bus number, new bus name
Ok: Closes the dialog
1.11.16 Report Writer
A.1 Introduction
Report writer module generates the information, formatted and organized according to user defined specification from any Microsoft jet database. The report writer module reads from a database file i.e., from Microsoft jet database .mdb files and displays the tables. only required tables can be selected for the report purpose. Required fields or all fields in the selected tables can be selected. Report can be sorted based on any report field in any order like ascending, descending or original order. Any field can be selected for finding Sum / Avg. / Max / Min / Count. Reports can be displayed based on the query, which is set by the user. Reports format can be specified by the user like, Tabular format or columnar format.
A.2 Features
Developed for Windows 95/98/NT/2000 operating systems
User friendly self - explanatory selection buttons
Optional Tables selection and Field selection
Sorting of the report
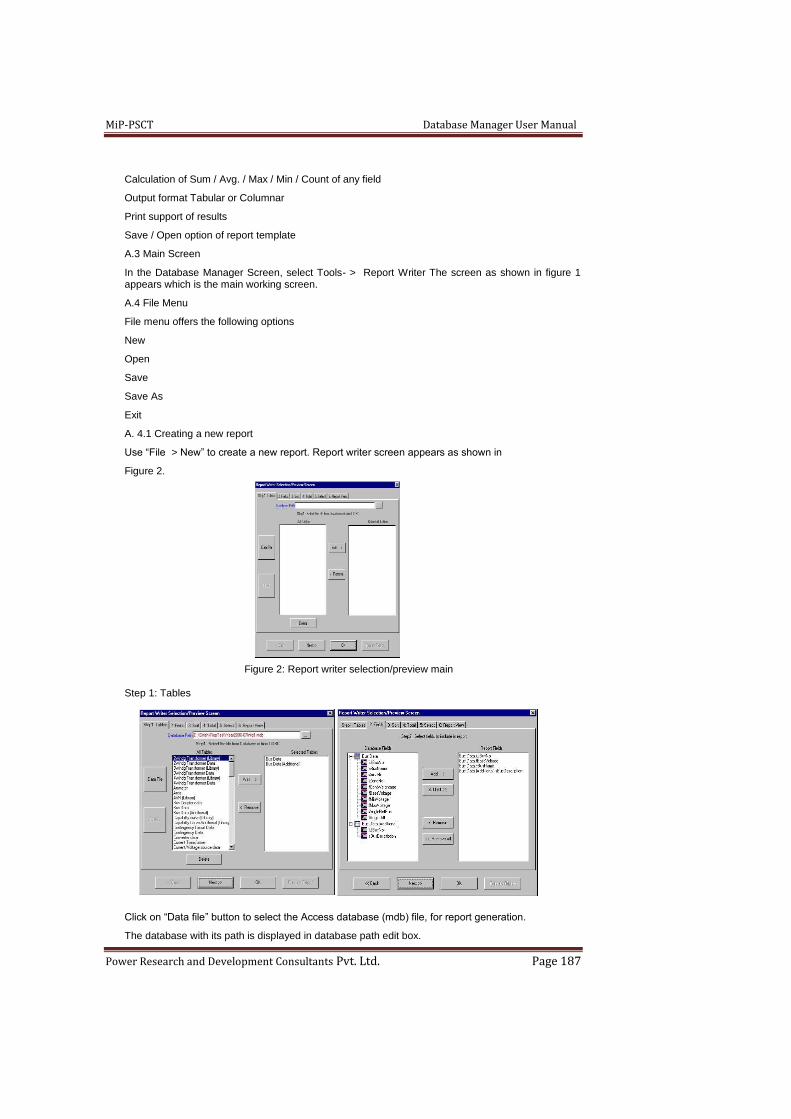
MiP-PSCT Database Manager User Manual
Power Research and Development Consultants Pvt. Ltd. Page 187
Calculation of Sum / Avg. / Max / Min / Count of any field
Output format Tabular or Columnar
Print support of results
Save / Open option of report template
A.3 Main Screen
In the Database Manager Screen, select Tools- > Report Writer The screen as shown in figure 1 appears which is the main working screen.
A.4 File Menu
File menu offers the following options
New
Open
Save
Save As
Exit
A. 4.1 Creating a new report
Use “File > New” to create a new report. Report writer screen appears as shown in
Figure 2.
Step 1: Tables
Click on “Data file” button to select the Access database (mdb) file, for report generation.
The database with its path is displayed in database path edit box.
Figure 2: Report writer selection/preview main screen

MiP-PSCT Database Manager User Manual
Power Research and Development Consultants Pvt. Ltd. Page 188
All the tables in the database are displayed.
Select the required tables for report generation.
Select the table and click on “Add” to add to the selected list box or double click on the required table in the All table list box, refer figure 3.
Click on “Next > > ” button or tab control “Fields” to go to next screen.
Step 2: Fields
Based on the tables selected in Step 1 (refer figure 3), table names with associated fields is displayed in database fields list box. Select required fields for the report generation, by double clicking on the item to be added or by clicking on the item and then click on “Add > > ” button. All fields can be added by clicking on the “Add All > > ” button. Fields selected will be displayed in the Report Fields list box, Refer figure 4. To remove any report field double click the field to be deleted or click on the field and then click on “<< Remove” button. To remove all the fields in the report fields list box, click on “<< Remove All” button”. Click on “Next > > ” button or tab control “Sort” to go to next screen.
Figure 2: Report writer Fields selection screen
Step 3: Sort
Based on the report fields selected in Step 2 (refer figure 4), table name with selected fields will be displayed in the report fields list box. Only selected field/s can be selected for the sorting purpose, double click on the field or click on the field then click “Add > > ” button. Fields to be sorted will be added to Sort fields list box. For each sort field selected order should be set. Supported orders are Ascending, Descending and Original order. To set the order for the selected item, click on the sort field and then select the order to set from the combo box, refer figure 5. To remove any sort field double click on the item or click on the item and then click on “<< Remove” button. Click on “Next > > ” button or tab control “Total” to go to next screen.
Figure 3: Report writer sort selection screen
Step 4: Total
Based on the report fields selected in Step 2 (refer figure 4), table name with selected fields will be displayed in the report fields list box. Only selected field/s can be selected for the sum/max/min etc., double click on the field or click on the field then click “Add > > ” button. Fields to be sum/max/min etc. to be set will be added to Total fields list box. For each field selected sum/max/min etc., should be set. Supported types are sum, max, min, count and avg. To set type for the selected item, click on
the field and then select the required item from the combo box, refer figure 6. To remove any field double click on the item or click on the item and then click on“<< Remove” button. Click on “Next > > ” button or tab control “Select” to go to next screen.
Figure 4: Report writer sort selection screen
Step 5: Select
In this screen user can set the report filter criteria and also set relation between more than one table.
If report is generated for one table no relation setting is required. Only filter condition can be used. To set the condition in the SQL
statement, double click on the field, select the equation in the combo box, and enter the
value depending on the equation set.
To generate report for more than one table,
Table 1: Busdata Table 2: Busdata (Additional)
Fields Fields
1 iUBusNo 1 iUBusNo
2. sBusName 2 sBusDescription
3 iAreaNo
4 iZoneNo
5 fContWeightage
6 fBaseVoltage
7 fMinVoltage
8 fMaxVoltage
9 iAngleRefBus
10 fAngleDiff

MiP-PSCT Database Manager User Manual
Power Research and Development Consultants Pvt. Ltd. Page 189
relation field between tables should be set. Oneor more condition can be set using AND between two conditions.
Figure 5: Report writer select selection screen
Example to set the SQL Statement:
To take report from both the tables the matching field between two tables should be setin this example BusNo is the matching criteria, this field should be equated as below, [Bus Data].iUBusNo = [Bus Data (Additional)].iUBusNo
To add one or more criteria AND condition should be set between two equations as below,
[Bus Data].iUBusNo = [Bus Data (Additional)].iUBusNo AND [Bus Data].iUBusNo > 20 like this OR and BETWEEN also be used in the matching condition.
Step 6: Report View
In this screen, main report title can be entered in report title edit box. By default report field names will be taken as report titles. User can change the names by clicking on the required report title, the same will be enabled under column heading edit box. enter the required title.
Report Type to be generated can be set, depending on the requirement. Supported types are Tabular and Columnar
Figure 6: Report writer Report view selection screen
Click on “Preview Report” button to generate the report.
Click on “OK” button to close the Report writer selection/preview screen.
Open Report
Use “File > Open” menu option, to open an existing rep file. (rep file is the file extension name of the report already saved).
After opening the report file all the tables, fields set will be loaded. User has to select the required database file to query the report.
Save Report
Use “File > Save” to save the report to its current name and directory. When you save the report for the first time, Report writer displays the Save As dialog box so as name your report. If you want to change the name and directory of an existing project before you save it, choose the Save As option.
Save As Report
Use “File > Save As” to save and name the current report or save the copy of the same report. To save a report with its existing name and directory, use Save option.
Exit
Use “File > Exit”, to end your Report writer. Report writer main screen prompts you to save project with unsaved changes.
View Menu
The view menu offers the following options.
Toolbar
Use “View > Toolbar” to show or hide the general-purpose toolbar. This option will be either ON/OFF. If this option is ON, the toolbar is shown at the top by default else the toolbar is hidden. The toolbar is dockable, i.e., it can be placed at any location on the screen. The commands interfaced to the buttons placed on the toolbar from left to right order are
New Opens a New report

MiP-PSCT Database Manager User Manual
Power Research and Development Consultants Pvt. Ltd. Page 190
Open Opens an existing report
Save Save current report
About Shows the about dialog box
Statusbar
Use “View > Status bar” to show or hide the status bar. This option will be either ON/OFF. If the option is ON, the status bar is shown at the bottom by default. Else the status bar is hidden. The status bar is non-dockable, i.e., it can’t be moved. The information shown on the toll bar is Menu options/toolbars status and other status information
Sample Reports
The two types of sample reports are supported and generated in the report writer.
Example of Tabular Report type
Busdata Report
Sl.no Bus No Bus kV Bus Name Bus Description ----- ----- ----------- ------------ --------------------------
1 1 11.000000 SVP--GEN SHARAVATHY GEN
2 2 15.750000 RTP2-GEN RTPS 11/220
3 3 15.750000 RTP4-GEN RTPS 110/400
4 4 11.000000 KALI-GEN KALI
5 5 11.000000 VRHI-GEN VARAHI
----- ----- ----------- ------------ --------------------------
Example of Columnar Report type
Bus data Report ------------------------------------------------------------------------
Bus No 1 2 3 4 5
Bus kV 11.000000 15.750000 15.750000 11.000000 11.000000
BusName SVP--GEN RTP2-GEN RTP4-GEN KALI-GEN
VRHI-GEN
Bus- SHARAVATHY GEN RTPS 11/220 RTPS 110/400 KALI
VARAHI
Description
1.11.17 Line Outage Distribution Factor
LODF: This calculates the impact of opening (outaging) a transmission branch on all the other branches in the case.
Line Outage Distribution Factor = (Change in Flow through the line) / (Base Flow)
Procedure :
Execute load flow for the base case and note down the flows on

MiP-PSCT Database Manager User Manual
Power Research and Development Consultants Pvt. Ltd. Page 191
the lines
Create a contingency case for the system and execute load flow and note down the flow on the lines in the system
Select menu option Tools- > Line outage Distribution Factor
In the following dialog select the contingency case
Execute and open the report
Schedule Number : Lists the number of schedules in the system
Select Case Number :From drop down list box select the case number
Contingency number and Name : List box showing contingency cases present in the database
Selected contingencies: Lists the selected contingency case
Add: Copy the contingency case to selected contingency list box
ADD All : Copy all contingency cases to selected contingency list box
Remove : Deletes / removes the case from selected contingency list box
Remove All: : Deletes / Removes all contingency cases from the selected contingency list box
Execute: Executes Line outage distribution factor program for the selected contingency case.
Report: Opens the report
Close : Closes the dialog
Sample report

MiP-PSCT Database Manager User Manual
Power Research and Development Consultants Pvt. Ltd. Page 192
1.11.18 Generation Shift Factor
It is the ratio of change in power flow for specified line to change in generation
Generator Shift factor = (Change in power flow for specified line) / (Change in Generation)
= (New flow – Base Flow) / (New Generation – Base Generation)
Select Contingency Number : Lists the number of contingencies in the Database and select a contingency
Select Case Number :From drop down list box select the case number
Schedule number and Name : List box showing schedule cases present in the database
Selected schedules: Lists the selected schedule case
Add: Copy the schedule case to selected schedule list box
ADD All : Copy all schedule cases to selected schedule list box
Remove : Deletes / removes the case from selected schedule list box
Remove All: : Deletes / Removes all contingency cases from the selected schedule list box
Execute: Executes Generator shift factor program for the selected schedule case.
Report: Opens the report
Close : Closes the dialog
Sample Report

MiP-PSCT Database Manager User Manual
Power Research and Development Consultants Pvt. Ltd. Page 193
1.11.19 Generation Scheduling
Cluster of buses assigned to a group and display of generation, load and
losses of that group and Slack bus generation and total losses.
Configure Generators
Select Generators to be considered for scheduling in this window.
Generators selected for scheduling appear on the screen as shown above. Generators Bus No. name, Pmin and Pmax are not editable. Pscheduled field can be modified.
Save: Saves generator schedule window values such as Modified group numbers and scheduled powers etc.
Execute: Load flow can be executed with the modified scheduled power.
Standard Report: Load flow report along with data and results.
Custom Report: Customized report for new scheduled power. For details refer section 3.8.1.
View Bus: Bus display with voltages and power flows after lad flow execution.
Bus Grouping: Display of bus numbers with name. Group no is user defined.
Out Put: As per the selected group number, total gen, load and loss of that group, slack bus generation and total losses will be displayed here.
Refresh Output: elect the group number and then click this button which displays the selected group number results.

MiP-PSCT Database Manager User Manual
Power Research and Development Consultants Pvt. Ltd. Page 194
1.11.20 Automatic Normal opening Point Creation
Select this option to create Normal Opening point. Give From bus no, To bus no and on which side NOP to be created is to be given by the user. Click on Create button to generate NOPs in the database
1.11.21 Update NOP
This opens the dialog to select a file (xxx.csv) having line details. File format is as below. On selection of file this updates NOPs
FromBus ToBus Status
1 2 1
2 3 0
Note: 1 > Closed (No NOP)
> Open (NOP present From End)
1.11.22 GPS Data
This option opens the dialog box for GPS file selection. With the file selection GPS data is updated in the database (records updated in Bus- > GPS- > GPS Co-ordinates). Sample GPS file format is given below.
Bus No Latitude Longitude Symbol Altitude
41920001 N26°30'23.7'' E092°48'25.2" 1 699.2
51000031 N26°27'41.9'' E092°55'16.5'' 1 679.5
51000032 N25°57'31.4'' E092°31'02.6'' 1 692.3
51000033 N25°58'03.5'' E092°35'49.9'' 1 696.4
51000034 N27°18'31.2'' E094°05'12.9'' 1 711.7
51001031 N26°45'41.7'' E092°45'37.4'' 1 709.8
51004011 N26°49'21.5'' E092°46'52.3'' 1 706.9
51004012 N26°52'25.7'' E092°46'25.5'' 1 699.2
51004013 N26°16'29.0'' E092°30'20.0'' 1 700.9
51005021 N26°44'20.0'' E093°08'14.5'' 1 694.7
1.12 Unit Protection Menu
Study of following Unit protection reports can be generated:
Transformer differential Protection
Restricted earth fault protection
Line pilot protection
Bus bar differential protection
Line / cable differential protection
Protection Report
On selection of respective study, differential protection window will open. Following is the Transformer Differential protection dialog.
B011: Fourth digit to seventh digit represents location code
Comment [A2]: Not there
Comment [A3]: Not there

MiP-PSCT Database Manager User Manual
Power Research and Development Consultants Pvt. Ltd. Page 195
Depending on Substation code and location code reports will be generated
All: For report generation considers all elements present in the database.
Substation : Substation code is to be entered and report will be generated for that substation
Range : Substation code Range (From code and To Code) is to be entered to get the report.
Detail: Detailed report for existing settings or proposed settings will be generated on selection of the same
Summary: In this only relay settings will be listed out.
Substation wise reports can also be generated by specifying substation code.
Report: To open the unit protection report
Execute: To run the unit protection program
Cancel : Unit protection execution and report generation will be cancelled.
Restricted Earth Fault Protection
In this form Transformer option is provided. User can select the two winding and 3 winding transformers to which REF relay settings are to be computed. Graph : Modern numerical relays use low impedance protection for REF. Tripping
characteristics of low impedance relay can be plotted on the graph. The quantity along the X-
axis is the Biasing Current and the Y-axis is the Operating or Differential Current. The tripping
characteristic can be divided into three parts as shown in the figure:
IV. Unrestrained Portion
V. Slightly Restrained
VI. Highly Restrained
Protection Report
Consolidated report with all unit protection relays
All: Consolidated unit protection report with all substations will be generated.

MiP-PSCT Database Manager User Manual
Power Research and Development Consultants Pvt. Ltd. Page 196
Individual Substation: Consolidated Unit protection Substation wise reports can be generated by specifying substation code.
Range: Substation code Range (From code and To Code) is to be entered to get the report.
Generate report: With user defined selections unit protection report will be generated
View Report: Opens the report
Relays: User has the choice to select differential relays and for those selected relays report can be generated. Distance relay is also considered in this selection
OK: Close the window
Cancel Report: Report generation execution process will be cancelled.
Sample Consolidated Protection report for Substation 701
PHASE OVER CURRENT RELAY SETTINGS FOR SS 701 (701)
------------------------------------------------------------------------------
----------------------------------------------------
Sl. No. RELAY NAME LOCATION CT PRIMARY CT SECONDARY RELAY TYPE CURVE TYPE
EXISTING SETTINGS PROPOSED SETTINGS
Ip > Ip > > Ip > Ip > >
Tp > Tp > > Tp > Tp > >
------- -------------------- -------- ---------- ------------ ---------- ---------- ----
---------- --------------- --------------
1 701A19051OE A190 400 1 REX521 NI Ip
> = 1.00 Ip > > = 0.00 Ip > = 1.00 --
Tp > = 0.37 Tp > > = 0.00 Tp > = 0.40 --
2 701A17051OE A170 400 1 REX521 NI Ip
> = 1.00 Ip > > = 0.00 Ip > = 1.00 --
Tp > = 0.37 Tp > > = 0.00 Tp > = 0.40 --
3 701A15051OE A150 400 1 REX521
----------------------------------------------------------------------------------------
------------------------------------------
EARTH RELAY SETTINGS FOR SS 701 (701)
Sl. No. RELAY NAME LOCATION CT PRIMARY CT SECONDARY RELAY TYPE CURVE TYPE
EXISTING SETTINGS PROPOSED SETTINGS
I0
> I0 > > I0 > I0 > >
T0
> T0 > > T0 > T0 > >
------- -------------------- -------- ---------- ------------ ---------- ---------- ----
---------- --------------- --------------
1 701A19051OE A190 400 1 REX521 NI I0
> = 0.30 I0 > > = 0.00 I0 > = 0.20 --
T0
> = 0.40 T0 > > = 0.00 T0 > = 0.40 --
2 701A17051OE A170 400 1 REX521 NI I0
> = 0.30 I0 > > = 0.00 I0 > = 0.20 --
T0
> = 0.40 T0 > > = 0.00 T0 > = 0.40 --
NI I0 > = 0.00 I0 > > = 0.00 I0 > = 0.19 --
----------------------------------------------------------------
PARTIAL BUS BAR RELAY SETTINGS FOR SS 701 (701)
----------------------------------------------------------------------------------------
------------------------------------------
Sl. No. RELAY NAME LOCATION CT PRIMARY CT SECONDARY RELAY TYPE CURVE TYPE
EXISTING SETTINGS PROPOSED SETTINGS

MiP-PSCT Database Manager User Manual
Power Research and Development Consultants Pvt. Ltd. Page 197
Ip > Ip > > Ie > Ie > > Ip >
Ip > > Ie > Ie > >
Tp
> Tp > > Te > Te > > Tp >
Tp > > Te > Te > >
------- -------------------- -------- ---------- ------------ ---------- ---------- ----
---------- --------------- -------------- --------------- -------------- ---------------
-------------- ---
1 701A018PBBP A018 4000 1 REX521 NI Ip
> = 1.10 Ip > > = 2.10 Ie > = 0.10 Ie > > = 0.10 Ip > = 1.10
Ip > > = 2.11 Ie > = 0.20 Ie > > = 0.09
Tp > = 0.12 Tp > > = 0.10 Te > = 0.46 Te > > = 0.10 Tp > =
0.27 Tp > > = 0.10 Te > = 0.10 Te > > = 0.10
2 701A028PBBP A028 4000 1 REX521 NI Ip
> = 1.10 Ip > > = 2.10 Ie > = 0.10 Ie > > = 0.10 Ip > = 1.10
Ip > > = 2.11 Ie > = 0.20 Ie > > = 0.25
Tp > = 0.12 Tp > > = 0.10 Te > = 0.46 Te > > = 0.10 Tp > =
0.27 Tp > > = 0.10 Te > = 0.10 Te > > = 0.10
----------------------------------------------------------------------------------------
------------------------------------------
SBEF RELAY SETTINGS FOR SS 701 (701)
----------------------------------------------------------------------------------------
------------------------------------------
Sl. No. RELAY NAME LOCATION CT PRIMARY CT SECONDARY RELAY TYPE CURVE TYPE
EXISTING SETTINGS PROPOSED SETTINGS
PSM STAGE 1 STAGE 2 PSM STAGE 1 STAGE 2
OP. TIME OP. TIME OP. TIME OP. TIME
------- -------------------- -------- ---------- ------------ ------------ ---------- --
------ -------- -------- -------- --------
1 701AE1851G AE18 750 1 REX521_SBEF DT
0.20 3.50 4.50 0.20 3.50 4.50
2 701AE2851G AE28 750 1 REX521_SBEF DT
0.20 3.50 4.50 0.20 3.50 4.50
3 701C01851G C018 1500 1 REX521_SBEF DT 0.20
3.50 4.50 0.20 3.50 4.50
4 701C02851G C028 1500 1 REX521_SBEF DT
0.20 3.50 4.50 0.20 3.50 4.50
5 701C03851G C038 1500 1 REX521_SBEF DT
0.20 3.50 4.50 0.20 3.50 4.50
6 701D01851G D018 2000 1 REX521_SBEF DT
0.20 3.50 4.50 0.20 3.50 4.50
7 701D02851G D028 2000 1 REX521_SBEF DT
0.20 3.50 4.50 0.20 3.50 4.50
----------------------------------------------------------------------------------------
------------------------------------------
TRANSFORMER DIFFERENTIAL PROTECTION RELAY SETTINGS FOR SS 701 (701) SUBSTATION
----------------------------------------------------------------------------------------
------------------------------------------
SL.NO. RELAY NAME LOCATION RELAY MAKE RELAY TYPE PRIMARY CT SECONDARY
CT ICT EXISTING SETTING PROPOSED SETTING REMARKS
PRIMARY SECONDARY PRIMARY
SECONDARY PRIMARY SECONDARY ID I > > 2nd 5th ID I > > 2nd 5th
------ -------------------- -------- ---------- ---------- ------- --------- -------- --
------ ------- --------- ----- ----- ----
1 701C01187T1 C011 SIEMENS 7UT61X 400 1 4000
1 0.00/0.00 0.00/0.00 0.00 0.00 0.00 0.00 0.19 4.50 10.00 25.00 NUMERICAL
2 701C01187T2 C011 ABB RET670 400 1 4000
1 0.00/0.00 0.00/0.00 0.20 7.50 15.00 30.00 0.19 5.00 10.00 25.00 NUMERICAL
3 701C02187T1 C021 SIEMENS 7UT61X 400 1 4000
1 0.00/0.00 0.00/0.00 0.00 0.00 0.00 0.00 0.19 4.50 10.00 25.00 NUMERICAL
4 701C02187T2 C021 ABB RET670 400 1 4000
1 0.00/0.00 0.00/0.00 0.20 7.50 15.00 30.00 0.19 5.00 10.00 25.00 NUMERICAL
5 701D01187T1 D011 ABB RET670 1500
----------------------------------------------------------------------------------------
------------------
REF PROTECTION RELAY SETTINGS FOR SS 701 (701) SUBSTATION
-----------------------------------------------------------------
SL.NO. RELAY NAME LOCATION RELAY MAKE RELAY TYPE CT SETTING
REMARKS

MiP-PSCT Database Manager User Manual
Power Research and Development Consultants Pvt. Ltd. Page 198
PRIMARY SECONDARY EXISTING
PROPOSED
(A) (A)
------ -------------------- -------- ---------- ---------- ------
1 701C01187NH C011 ABB SPAJ115 400 1 40
14.00 CURRENT (%)
2 701C02187NH C021 ABB SPAJ115 400 1 40
14.00 CURRENT (%)
3 701A01887NL A018 ABB SPAJ115 4000 1 40
15.00 CURRENT (%)
4 701A02887NL A028 ABB SPAJ115 4000 1 40
15.00 CURRENT (%)
5 701AE1887NH AE18 ABB SPAJ115 100 1 40
19.00 CURRENT (%)
6 701AE2887NH AE28 ABB SPAJ115 100 1 40
19.00 CURRENT (%)
7 701AE1887NL AE18 ABB SPAJ115 2500 1 40
18.00 CURRENT (%)
8 701AE2887NL AE28 ABB SPAJ115 2500 1 40
18.00 CURRENT (%)
-----------------------------------------------------------------
LINE/CABLE PILOT PROTECTION RELAY SETTINGS FOR SS 701 (701) SUBSTATION
-----------------------------------------------------------------
SL.NO. RELAY NAME LOCATION RELAY MAKE RELAY TYPE CT SETTING
REMARKS
PRIMARY SECONDARY EXISTING
PROPOSED
(A) (A) (ohm)
(ohm)
------ -------------------- -------- ---------- ---------- ------
1 701A19087PW A190 REYROLLERf SOLKARRf 400 1 990
890.00
2 701A17087PW A170 REYROLLERf SOLKARRf 400 1 990
890.00
3 701A15087PW A150 REYROLLERf SOLKARRf 400 1 990
890.00
4 701A13087PW A130 REYROLLERf SOLKARRf 400 1 990
890.00
5 701A11087PW A110 REYROLLERf SOLKARRf 400 1 990
890.00
6 701A09087PW A090 REYROLLERf SOLKARRf 400 1 990
890.00
LINE/CABLE DIFFERENTIAL PROTECTION RELAY SETTINGS FOR SS 701 (701) SUBSTATION
----------------------------------------------------------------------------------------
------------------------------------------
SL.NO. RELAY NAME LOCATION RELAY MAKE RELAY TYPE CT
SETTING REMARKS
PRIMARY SECONDARY
EXISTING PROPOSED
DIFF HIGHSET SWON SWON-HIGHSET 2nd HARM. DIFF HIGHSET SWON SWON-HIGHSET 2nd
HARM.
(A) (A) (A)
(A) (%) (A) (A) (%)
------ -------------------- -------- ---------- ---------- ------- --------- -------- --
----- -------- ------------ -------- -----
1 701G09087L1 G090 REL551 ABB 2000 1 0.200
0.000 0.000 0.000 0.000 0.233 0.280 0.000
2 701G09087L2 G090 7SD52 SIEMENS 2000 1 0.200
1.200 0.200 0.200 0.150 0.233 0.280 0.000
3 701G01087L1 G010 REL551 ABB 2000 1 0.200
0.000 0.000 0.000 0.000 0.233 0.280 0.000
4 701G01087L2 G010 7SD52 SIEMENS 2000 1 0.200
1.200 0.200 0.200 0.150 0.233 0.280 0.000
5 701G02087L1 G020 REL551 ABB 2000 1 0.200
0.000 0.000 0.000 0.000 0.233 0.280 0.000
--------------------------------
BUS BAR DIFFERENTIAL PROTECTION RELAY SETTINGS FOR SS 701 (701) SUBSTATION
-----------------------------------------------------------------

MiP-PSCT Database Manager User Manual
Power Research and Development Consultants Pvt. Ltd. Page 199
SL.NO. RELAY NAME LOCATION RELAY MAKE RELAY TYPE CT PICK UP
PICK UP DIFF CUR DIFF TIME STABILISING STABILISING VOLTAGE CURRENT PHASE SLOPE
CIRCUITRY FAULT REMARKS
PRIMARY SECONDARY CUR
TIME FACTOR RESISTOR SLOPE
ALARM
------ -------------------- -------- ---------- ---------- ------- --------- -------- --
------ -------- --------- ------------ ---
1 701G12187B G121 REB500 REB500 4000 1 0.10
5.00 0.70
2 701D12187B D121 REB500 REB500 4000 1 0.10
5.00 0.70
-----------------------------------------------------------------
DISTANCE RELAY SETTINGS FOR SS 701 (701) SUBSTATION
-----------------------------------------------------------------
SL.NO. RELAY NAME LOCATION RELAY MAKE RELAY TYPE CT PT
SETTING
REMARKS
PRIMARY SECONDARY PRIMARY
SECONDARY EXISTING
PROPOSED
(A) (A) (kV) (V) PH ZONE1 PH ZONE 2 PH ZONE 3
PH ZONE 4 ER ZONE1 ER ZONE 2 ER ZONE 3 ER ZONE 4 PH ZONE1
PH ZONE 2 PH ZONE 3 PH ZONE 4 ER ZONE1 ER ZONE 2 ER
ZONE 3 ER ZONE 4
REACH TIME REACH TIME REACH TIME REACH TIME REACH
REACHREACHREACHREACH TIME REACH TIME REACH TIME REACH
TIME REACH REACHREACHREACH
(S) (S) (S) (S)
(S) (S) (S) (S)
------ -------------------- -------- ---------- ---------- ------
1 701G09021M1 G090 RED670 R-X 1500 1 400
110.00 0.00\ 0.00 0.00 0.00\ 0.00 0.40 0.00\ 0.00 0.40 0.00\ 0.00 0.00
0.00\ 0.00 0.00\ 0.00 0.00\ 0.00 0.00\ 0.00 0.00\ 0.00 0.00 0.00\ 0.00
0.50 0.00\ 0.00 0.50 0.00\ 0.00 0.00 0.00\ 0.00 0.00\ 0.00 0.00\ 0.00
0.00\ 0.00
2 701G09021M2 G090 RED670 R-X 1500 1 400
110.00 0.00\ 0.00 0.00 0.00\ 0.00 0.40 0.00\ 0.00 0.40 0.00\ 0.00 0.00
0.00\ 0.00 0.00\ 0.00 0.00\ 0.00 0.00\ 0.00 0.00\ 0.00 0.00 0.00\ 0.00
0.50 0.00\ 0.00 0.50 0.00\ 0.00 0.00 0.00\ 0.00 0.00\ 0.00 0.00\ 0.00
0.00\ 0.00
3 701G01021M1 G010 RED670 R-X 1500
0.00 0.00\ 0.00 0.00 0.00\ 0.00 0.50 0.00\ 0.00 0.50 0.00\ 0.00 0.00 0.00\
0.00 0.00\ 0.00 0.00\ 0.00 0.00\ 0.00
9 701D03021M1 D030 RED670 R-X 1500
1.13 Import Menu
Fault Levels: There are situations where transmission and distribution system study is executed separately. It is required to import fault level from the transmission system to the distribution system at the common points. Then this option can be used.
Execute short circuit studies with Fault at all Buses and Fault type as 3 phase and SLG fault one after another option for a transmission database. XXX.flt file will be generated in SCS folder. This file can be accessed from the distribution database from menu option Import- > Fault level to obtain same impedance at generator of distribution system provided the buses in both the databases should have same bus no.s.
1.14 Window Menu
The Window menu offers the following commands, which enable you to arrange multiple views of multiple documents in the application window:
Cascade command
Use “Window > Cascade” command to arrange multiple opened windows in an overlapped fashion.

MiP-PSCT Database Manager User Manual
Power Research and Development Consultants Pvt. Ltd. Page 200
Tile Horizontal
Use “Window > Tile Horizontal” command to vertically arrange multiple opened windows in a non-overlapped fashion.
Tile Vertical
Use “Window > Tile Vertical” command to arrange multiple opened windows side by side.
Close All
Use this command to close all the windows.
Window 1, 2,
Database Manager displays a list of currently open document windows at the bottom of the Window menu. A check mark appears in front of the document name of the active window. Choose a document from this list to make its window active

© 2016 by Power Research & Development Consultants Pvt. Ltd. All rights reserved.
All information contained in this documentation, as well as the software described in it, is confidential and proprietary to Power Research & Development Consultants Pvt. Ltd. or one of its subsidiaries, is subject to a license agreement, and may be used or copied only in accordance with the terms of such license. Except as permitted by such license, no part of this documentation may be reproduced, stored in a retrieval system, or transmitted in any form or by electronic, mechanical, recording, or any other means, without the prior written permission of Power Research & Development Consultants Pvt. Ltd or one of its subsidiaries. Power Research & Development Consultants Pvt. Ltd. and the PRDC product names are trademarks or registered trademarks of Power Research & Development Consultants Pvt. Ltd., or one of its subsidiaries.
Power Research & Development Consultants Pvt. Ltd.# 5, 11th Cross, 2nd Stage, West of Chord Road, Bengaluru India - 560086.
Tel: +91-80-4245 5555 / 23192209, Fax: +91-80-4245 5556 / 23192210
Email: [email protected] website: www.prdcinfotech.com
x
Y
R
A
+ - x ÷
Power SystemNetwork Editor
Database Manager
Graph Utility
LPC/CPC
Free ProgrammableBlock
COMTRADEViewer