Database-Assisted Frequency Estimation for Power System Measurement · ·...
33
Database-Assisted Frequency Estimation for Power System Measurement Matthias Lechtenberg [email protected] | EPEC 2012 | 12 th October 2012 Prof. Dr.-Ing. Jürgen Götze Information Processing Lab Faculty of Electrical Engineering and Information Technology TU Dortmund University technische universität dortmund DT/IPL DT/IPL DT/IPL Information Processing Lab Matthias Lechtenberg Slide 1/20
Transcript of Database-Assisted Frequency Estimation for Power System Measurement · ·...

Database-Assisted Frequency Estimation forPower SystemMeasurement
Matthias [email protected]
| EPEC 2012 | 12th October 2012
Prof. Dr.-Ing. Jürgen GötzeInformation Processing LabFaculty of Electrical Engineering and Information TechnologyTU Dortmund University
technische universitätdortmund DT/IPLDT/IPLDT/IPL
Information Processing LabMatthias Lechtenberg
Slide
1/20

Overview| EPEC 2012
MotivationIntroductionAn Exemplary Power NetSignal Model
EstimationCommon ApproachesPAST & ESPRIT & DaPTSymmetrical Components Transform
Simulation
Conclusion & Future Work
technische universitätdortmund DT/IPLDT/IPLDT/IPL
Information Processing LabMatthias Lechtenberg
Slide
2/20

Motivation| EPEC 2012
Power SystemMeasurement with PMU
Synchrophasor on basis of 50Hz/60Hz fundamental
Smart and cheap devices could do more
System health monitoring and event detection
Sammler
other PMUs
Collector KlassifikationClassificationrule-based
Actions
Synchrophasor
measuring
DeviceESPRIT etc.
technische universitätdortmund DT/IPLDT/IPLDT/IPL
Information Processing LabMatthias Lechtenberg
Slide
3/20

An Exemplary Power Net| EPEC 2012
39-node New England Test System (aka. NETS)
30
2
1
39 4
5
3
9
8
7
6
1131
12
13
32
34 3336
2320
19
14
15
16
17
18 27
37
25 26 28 29
38
24
21 22
35
10
8
10
1
2
3
5 47
6
9
technische universitätdortmund DT/IPLDT/IPLDT/IPL
Information Processing LabMatthias Lechtenberg
Slide
4/20

An Exemplary Power Net| EPEC 2012
39-node New England Test System (aka. NETS)Scenario: Line-switching (between nodes 22 and 23)
//
30
2
1
39 4
5
3
9
8
7
6
1131
12
13
32
34 3336
2320
19
14
15
16
17
18 27
37
25 26 28 29
38
24
21 22
35
10
8
10
1
2
3
5 47
6
9
technische universitätdortmund DT/IPLDT/IPLDT/IPL
Information Processing LabMatthias Lechtenberg
Slide
4/20

An Exemplary Power Net| EPEC 2012
39-node New England Test System (aka. NETS)Scenario: Line-switching (between nodes 22 and 23)Focused Node: 16 (and 21)
//
30
2
1
39 4
5
3
9
8
7
6
1131
12
13
32
34 3336
2320
19
14
15
16
17
18 27
37
25 26 28 29
38
24
21 22
35
10
8
10
1
2
3
5 47
6
9
technische universitätdortmund DT/IPLDT/IPLDT/IPL
Information Processing LabMatthias Lechtenberg
Slide
4/20

An Exemplary Power Net| EPEC 2012
39-node New England Test System (aka. NETS)Scenario: Line-switching (between nodes 22 and 23)Focused Node: 16 (and 21)Oscillation meshes
//
30
2
1
39 4
5
3
9
8
7
6
1131
12
13
32
34 3336
2320
19
14
15
16
17
18 27
37
25 26 28 29
38
24
21 22
35
10
8
10
1
2
3
5 47
6
9horizon
technische universitätdortmund DT/IPLDT/IPLDT/IPL
Information Processing LabMatthias Lechtenberg
Slide
4/20

LineModeling| EPEC 2012
Line modeling with inductances (L) and capacitances (C)
C/2
L
C/2Pi
Meshes of circuit including both L and C can oscillate
Events like switchings, line faults etc. can excite such mesh
→ Oscillating mesh has characteristic frequency
technische universitätdortmund DT/IPLDT/IPLDT/IPL
Information Processing LabMatthias Lechtenberg
Slide
5/20

Signal Model| EPEC 2012
Signal model of superposed sinusoids
x(n) =p∑
i=1
ai(n)ejnωi+jϕi + wawgn(n) =
p∑
i=1
ci(n)ejnωi + wawgn(n)
Multiple events can be described by sinusoids:
Of course fundamental system frequency (50Hz/60Hz)Harmonics of system’s fundamental (e.g. by power electronics)Characteristic frequencies of oscillation meshesBeat partners by electromagnetic componentsetc.
There are non-linear events that cannot be modeled like this
For convenience, additional white random noise is assumed
technische universitätdortmund DT/IPLDT/IPLDT/IPL
Information Processing LabMatthias Lechtenberg
Slide
6/20

Common Approaches for Frequency Estimation| EPEC 2012
Transforms (DFT/WT/...) Transform-based frequency estimationlike discrete Fourier or Wavelet transform can beaccurate for well-separated frequencies (withinterpolation incorporated), but mask closefrequencies (spectral masking)
technische universitätdortmund DT/IPLDT/IPLDT/IPL
Information Processing LabMatthias Lechtenberg
Slide
7/20

Common Approaches for Frequency Estimation| EPEC 2012
Transforms (DFT/WT/...) Transform-based frequency estimationlike discrete Fourier or Wavelet transform can beaccurate for well-separated frequencies (withinterpolation incorporated), but mask closefrequencies (spectral masking)
Prony’s method Prony’s method estimates the coefficients of apolynomial whose roots lead to the frequencies.Although it is common and useful, literature statesnoise sensibility.
Subspace-based For the autocorrelation of a signal, a space basiscan be derived which can be split in noise and signalsubspace. The basis vectors lead to the frequencies.
technische universitätdortmund DT/IPLDT/IPLDT/IPL
Information Processing LabMatthias Lechtenberg
Slide
7/20

PAST & ESPRIT & DaPT| EPEC 2012
OPAST ESPRIT
LS
samples
subspace basis vectors frequency candidates
rank/number
ampl. + phase
frequenciesDaPT
OPAST From windowed input samples, a specific number(rank) of basis vectors is generated
ESPRIT The one-time-step rotation of these vectors isconnected to the frequencies via an exponentialfunction
DaPT The frequencies are rated and tracked over time toseparate noise vectors and counted for rank
LS The signal model can be used with a Least Squaresapproach for estimating amplitude and phase
technische universitätdortmund DT/IPLDT/IPLDT/IPL
Information Processing LabMatthias Lechtenberg
Slide
8/20

PAST (Subspace Estimation)| EPEC 2012
OPAST ESPRIT
LS
samples
subspace basis vectors frequency candidates
rank/number
ampl. + phase
frequenciesDaPT
Common basis of signal → EVD of autocorrelation matrix
→ Expensive
Not only one basis describing the space
Subspace estimators produce basis usually a lot cheaper (butnot necessarily orthonormal)
technische universitätdortmund DT/IPLDT/IPLDT/IPL
Information Processing LabMatthias Lechtenberg
Slide
9/20

PAST (Subspace Estimation)| EPEC 2012
OPAST ESPRIT
LS
samples
subspace basis vectors frequency candidates
rank/number
ampl. + phase
frequenciesDaPT
Projection Approximation Subspace Tracking (Yang)
Minimizes cost function of minimal distance between samplesand predicted projection
Within, two pseudo correlation matrices are tracked(exponential weighting)
An RLS algorithm approximates an inversion
→ Iteratively produces an orthonormal basis
Variants with more sophisticated properties available
technische universitätdortmund DT/IPLDT/IPLDT/IPL
Information Processing LabMatthias Lechtenberg
Slide
10/20
ESPRIT (Parameter Estimation)| EPEC 2012
OPAST ESPRIT
LS
samples
subspace basis vectors frequency candidates
rank/number
ampl. + phase
frequenciesDaPT
Estimating Signal Param. via Rotational Invariance Techniques
n
n+1
4 8 12 16−0.3
−0.28
−0.26
−0.24
−0.22
−0.2
−0.18
−0.16Wi([1 ... N-1])
Wi([2 ... N])
Rotational Invariance:
1 time-step: Eigenvector differs . . .
FirstN − 1 elements↔ lastN − 1:vectors differ . . .
→ . . . in constant rotation ψi = ej2π·fi/fs
technische universitätdortmund DT/IPLDT/IPLDT/IPL
Information Processing LabMatthias Lechtenberg
Slide
11/20

ESPRIT (Parameter Estimation)| EPEC 2012
OPAST ESPRIT
LS
samples
subspace basis vectors frequency candidates
rank/number
ampl. + phase
frequenciesDaPT
Estimating Signal Param. via Rotational Invariance Techniques
n
n+1
4 8 12 16−0.3
−0.28
−0.26
−0.24
−0.22
−0.2
−0.18
−0.16Wi([1 ... N-1])
Wi([2 ... N])
Rotational Invariance:
1 time-step: Eigenvector differs . . .
FirstN − 1 elements↔ lastN − 1:vectors differ . . .
→ . . . in constant rotation ψi = ej2π·fi/fs
Parameter Estimation
Ψ = minΨ
‖W+ −ΨW−‖2 (W basis vectors)
technische universitätdortmund DT/IPLDT/IPLDT/IPL
Information Processing LabMatthias Lechtenberg
Slide
11/20
DaPT (Parameter Rating)| EPEC 2012
OPAST ESPRIT
LS
samples
subspace basis vectors frequency candidates
rank/number
ampl. + phase
frequenciesDaPT
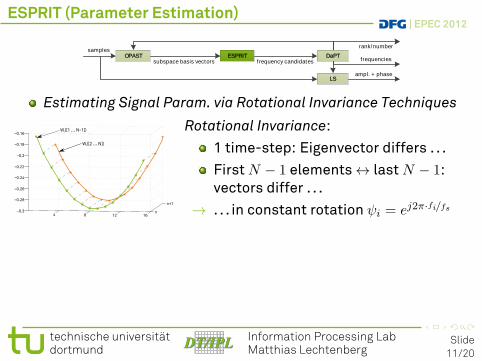
Database-assisted Parameter Estimation
Rule-based post-processing forparameter estimation like ESPRIT
→ Rating temporal presence of aparameter
→ Tracking of dynamic parameters
Assessment of parameters todecide whether signal or noise
start
get estimations from e.g. ESPRIT
if (fdb(i) ϵ [fest])
update db-entry of fdb(i):
≥ inc(qdb(i))≥ upd(ddb(i))
mark current estimation invalid
update db-entry of fdb(i):
≥ dec(qdb(i))
if (qdb(i) = 0)
delete entry of fdb(i)
iterate (i) through
database
iterate (j) through
[fest]
if (valid(j))
create new db-entry for fest(j)
while
yes no
yes no
end
while
yes no
end
technische universitätdortmund DT/IPLDT/IPLDT/IPL
Information Processing LabMatthias Lechtenberg
Slide
12/20

DaPT (Parameter Rating)| EPEC 2012
OPAST ESPRIT
LS
samples
subspace basis vectors frequency candidates
rank/number
ampl. + phase
frequenciesDaPT
Dynamic aspects:
Difference of frequency input to field exponentially weighted
Severity: Endurance of significant difference (signed)
→ Correct frequency field in case of high severityDaPT
Entry 1Entry 2
Entry 3
Frequency
Rating
DriftDrift severityPhase diff.P. diff. sev.
...
technische universitätdortmund DT/IPLDT/IPLDT/IPL
Information Processing LabMatthias Lechtenberg
Slide
13/20

DaPT (Parameter Rating)| EPEC 2012
OPAST ESPRIT
LS
samples
subspace basis vectors frequency candidates
rank/number
ampl. + phase
frequenciesDaPT
Dynamic aspects:
Difference of frequency input to field exponentially weighted
Severity: Endurance of significant difference (signed)
→ Correct frequency field in case of high severity
Difference of subsequent phase estimationsbased on current frequency
Severity: Endurance of significant phase drift(signed)
→ Correct frequency field in case of high severity
DaPTEntry 1Entry 2
Entry 3
Frequency
Rating
DriftDrift severityPhase diff.P. diff. sev.
...
technische universitätdortmund DT/IPLDT/IPLDT/IPL
Information Processing LabMatthias Lechtenberg
Slide
13/20

Symmetrical Components Transform| EPEC 2012
→ To evaluate delay of signal processing
Phases are switched with delay of 120◦ of fundamental cycle
→ In case of event, zero-component not zero
→ Simple threshold indicator
Symmetrical Components Transform, SCT
U+
U−
U0
= 1
3
1 a a2
1 a2 a
1 1 1
UA
UB
UC
with a = ej2π/3
technische universitätdortmund DT/IPLDT/IPLDT/IPL
Information Processing LabMatthias Lechtenberg
Slide
14/20

An Exemplary Power Net| EPEC 2012
39-node New England Test System (aka. NETS)Scenario: Line between 22 & 23 opened after 1s of nominalservice (and closed again 2s later)Focused node for signal processing: 16 (and 21)
//
30
2
1
39 4
5
3
9
8
7
6
1131
12
13
32
34 3336
2320
19
14
15
16
17
18 27
37
25 26 28 29
38
24
21 22
35
10
8
10
1
2
3
5 47
6
9
technische universitätdortmund DT/IPLDT/IPLDT/IPL
Information Processing LabMatthias Lechtenberg
Slide
15/20

Frequency Estimation| EPEC 2012
0
500
012
0.8 1 1.2 1.4 1.6 1.8 [s]
frequency
Csymmetric components negative sequence
[Hz]
[V] B
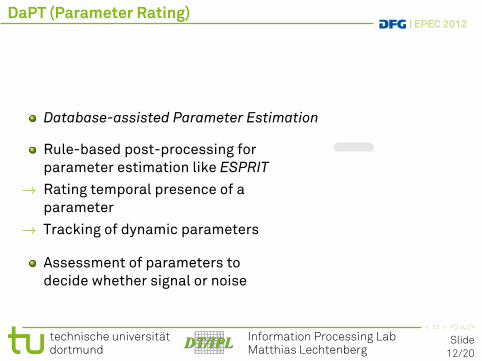
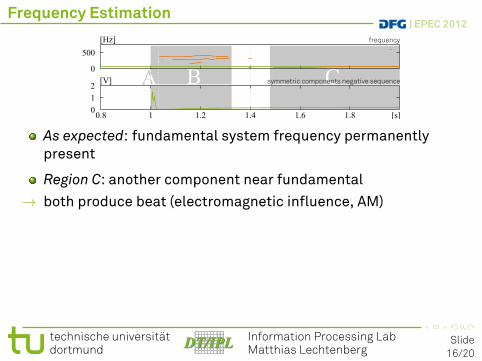
As expected: fundamental system frequency permanentlypresent
technische universitätdortmund DT/IPLDT/IPLDT/IPL
Information Processing LabMatthias Lechtenberg
Slide
16/20
Frequency Estimation| EPEC 2012
0
500
012
0.8 1 1.2 1.4 1.6 1.8 [s]
frequency
Csymmetric components negative sequence
[Hz]
[V] B
As expected: fundamental system frequency permanentlypresent
Region C: another component near fundamental
→ both produce beat (electromagnetic influence, AM)
Region B: Some additional, temporary components afterswitching
technische universitätdortmund DT/IPLDT/IPLDT/IPL
Information Processing LabMatthias Lechtenberg
Slide
16/20

Frequency Estimation| EPEC 2012
0
500
012
0.8 1 1.2 1.4 1.6 1.8 [s]
frequency
Csymmetric components negative sequence
[Hz]
[V] B
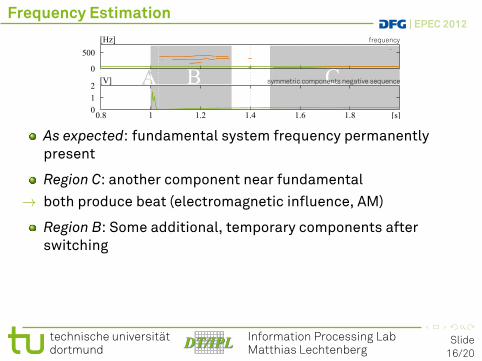
As expected: fundamental system frequency permanentlypresent
Region C: another component near fundamental
→ both produce beat (electromagnetic influence, AM)
Region B: Some additional, temporary components afterswitching
Region A: SCT indicates switching;≈ 0.02s later, DaPT reacts
→ PAST window (128) + exp. window (20) + DaPT thresh. (100) =248 samples (24.8ms) worst-case → consistent
technische universitätdortmund DT/IPLDT/IPLDT/IPL
Information Processing LabMatthias Lechtenberg
Slide
16/20
Amplitude Estimation| EPEC 2012
0
500
0200400
0.8 1 1.2 1.4 1.6 1.8 [s]
frequency
C amplitude
[Hz]
[V] B
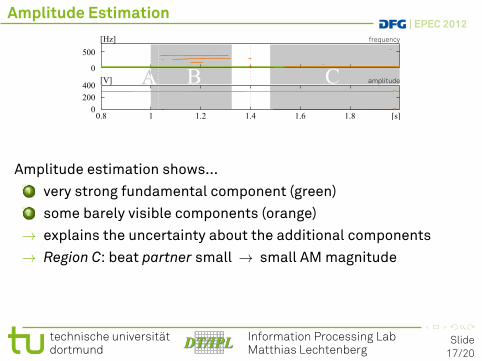
Amplitude estimation shows...
1 very strong fundamental component (green)
2 some barely visible components (orange)
→ explains the uncertainty about the additional components
→ Region C: beat partner small → small AMmagnitude
technische universitätdortmund DT/IPLDT/IPLDT/IPL
Information Processing LabMatthias Lechtenberg
Slide
17/20

Closeness Problem| EPEC 2012
A49.5
50
50.5
B2.2 2.3 2.4 2.5 2.6 2.7 [s]0
500
1k
frequency[Hz]
amplitude[V]
As mentioned, another component close to fundamental
Here, additional (orange) crosses fundamental (green)
Region A: When estimations cross
Region B: Estimations more separated than in true
→ Angle between basis vectors small
→ high matrix condition → inaccuracy
technische universitätdortmund DT/IPLDT/IPLDT/IPL
Information Processing LabMatthias Lechtenberg
Slide
18/20
Conclusion & Future Work| EPEC 2012
Variable-rank parameter estimation helps characterizingtransient processes
Signal model superposed sinusoids provides information onfundamental, harmonics, beats (AM) & oscillation meshes
technische universitätdortmund DT/IPLDT/IPLDT/IPL
Information Processing LabMatthias Lechtenberg
Slide
19/20

Conclusion & Future Work| EPEC 2012
Variable-rank parameter estimation helps characterizingtransient processes
Signal model superposed sinusoids provides information onfundamental, harmonics, beats (AM) & oscillation meshes
However, problems occur for very close parameters
technische universitätdortmund DT/IPLDT/IPLDT/IPL
Information Processing LabMatthias Lechtenberg
Slide
19/20
Conclusion & Future Work| EPEC 2012
Variable-rank parameter estimation helps characterizingtransient processes
Signal model superposed sinusoids provides information onfundamental, harmonics, beats (AM) & oscillation meshes
However, problems occur for very close parameters
In parallel, research associates do theoretical net calculationfor verification
technische universitätdortmund DT/IPLDT/IPLDT/IPL
Information Processing LabMatthias Lechtenberg
Slide
19/20

Conclusion & Future Work| EPEC 2012
Variable-rank parameter estimation helps characterizingtransient processes
Signal model superposed sinusoids provides information onfundamental, harmonics, beats (AM) & oscillation meshes
However, problems occur for very close parameters
In parallel, research associates do theoretical net calculationfor verification
In future, event identification with look-up-table
technische universitätdortmund DT/IPLDT/IPLDT/IPL
Information Processing LabMatthias Lechtenberg
Slide
19/20

Discussion| EPEC 2012
Do you have questions?
Sammler
other PMUs
Collector KlassifikationClassificationrule-based
Actions
Synchrophasor
measuring
DeviceESPRIT etc.
Matthias [email protected]+49 231 755-7017
c© 2012 by M. Lechtenberg, Information Processing Lab, TU Dortmund. Permission to reprint/republish this material foradvertising or promotional purposes or for creating new collective works for resale or redistribution to servers or lists, orto reuse any copyrighted component of this work in other works must be obtained from IPL.This work was supported by (German Research Foundation).
technische universitätdortmund DT/IPLDT/IPLDT/IPL
Information Processing LabMatthias Lechtenberg
Slide
20/20