Data warehouse Concepts and Basics. Session objectives and scope Definition Fundamentals of data...
43
Data warehouse Concepts and Basics
-
Upload
judith-lindsey -
Category
Documents
-
view
216 -
download
1
Transcript of Data warehouse Concepts and Basics. Session objectives and scope Definition Fundamentals of data...

Data warehouse Concepts and Basics
Session objectives and scope
• Definition• Fundamentals of data warehousing, how it works and
what it serves• Basic Elements of Data warehouse and generic
architecture• Models – Star Schema, Snowflake Schema• OLTP v/s OLAP• DW v/s Data Mart• What is ETL• ETL Processes• OLAP – different types

Ground rules
• Interactive • Participation amongst all• Please set your cell phones to vibration mode
Data warehouse : the definition
• A warehouse is place where goods are physically stocked, to facilitate smooth flow of business without any production downtime or crisis.
Ralph Kimball:
• A data warehouse is a structured extensible environment designed for the analysis of non-volatile data, logically and physically transformed from multiple source applications to align with business structure, updated and maintained for a long time period, expressed in simple business terms, and summarized for quick analysis.
In layman’s word:
• A data warehouse is read only database which copies/stores the data from the transactional database.

What is a data warehouse?
• “A warehouse is a subject-oriented, integrated, time-variant and non-volatile collection of data in support of management’s decision making process.”
• English translation:– Subject-oriented data refers to data that provides information about a particular
subject (e.g. customers, transactions, products, vendors, etc.) rather than a company’s ongoing operations.
– Integrated data means that data is gathered from a variety of different sources, linked together, and then aggregated in one location (i.e. the warehouse) to establish a comprehensive dataset.
– Time-variant signifies that the data elements vary over time. For example, customer data in a warehouse should be updated as changes occur to customer accounts.
– Non-volatile implies that the data in the warehouse is “stable.” That is, new data is added to the warehouse but old data isn’t removed. Maintaining old data provides managers with a consistent picture of the business as well as a historical perspective for analyzing trends. (Note: Some data warehouses can be volatile. Based on storage constraints, only a certain number of periods of history are kept in the warehouse.)
• Data warehouse versus data mart?– Data mart refers to a single-subject data warehouse.– Data warehouses are typically enterprise in scope.
Need of data warehouse
• Analysis of data
• Flexibility and broad scope
• Faster retrieval of data
• Subject-oriented information capture
• Future projections and top-level control
Some other terms used in the Data Warehousing world
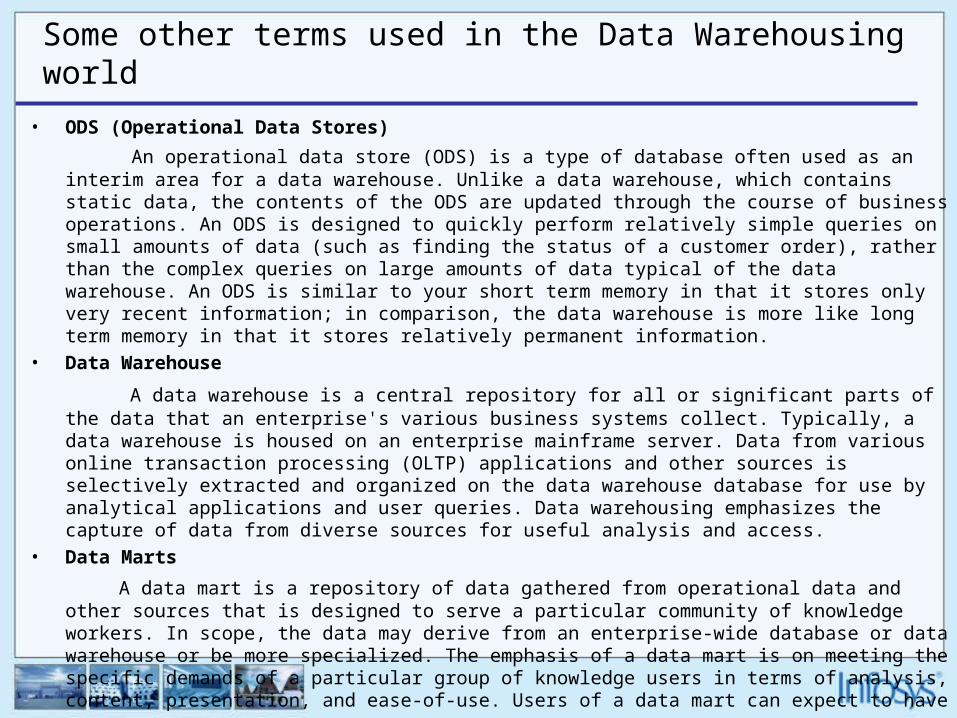
• ODS (Operational Data Stores)
An operational data store (ODS) is a type of database often used as an interim area for a data warehouse. Unlike a data warehouse, which contains static data, the contents of the ODS are updated through the course of business operations. An ODS is designed to quickly perform relatively simple queries on small amounts of data (such as finding the status of a customer order), rather than the complex queries on large amounts of data typical of the data warehouse. An ODS is similar to your short term memory in that it stores only very recent information; in comparison, the data warehouse is more like long term memory in that it stores relatively permanent information.
• Data Warehouse
A data warehouse is a central repository for all or significant parts of the data that an enterprise's various business systems collect. Typically, a data warehouse is housed on an enterprise mainframe server. Data from various online transaction processing (OLTP) applications and other sources is selectively extracted and organized on the data warehouse database for use by analytical applications and user queries. Data warehousing emphasizes the capture of data from diverse sources for useful analysis and access.
• Data Marts
A data mart is a repository of data gathered from operational data and other sources that is designed to serve a particular community of knowledge workers. In scope, the data may derive from an enterprise-wide database or data warehouse or be more specialized. The emphasis of a data mart is on meeting the specific demands of a particular group of knowledge users in terms of analysis, content, presentation, and
ease-of-use. Users of a data mart can expect to have data presented in terms that are familiar.
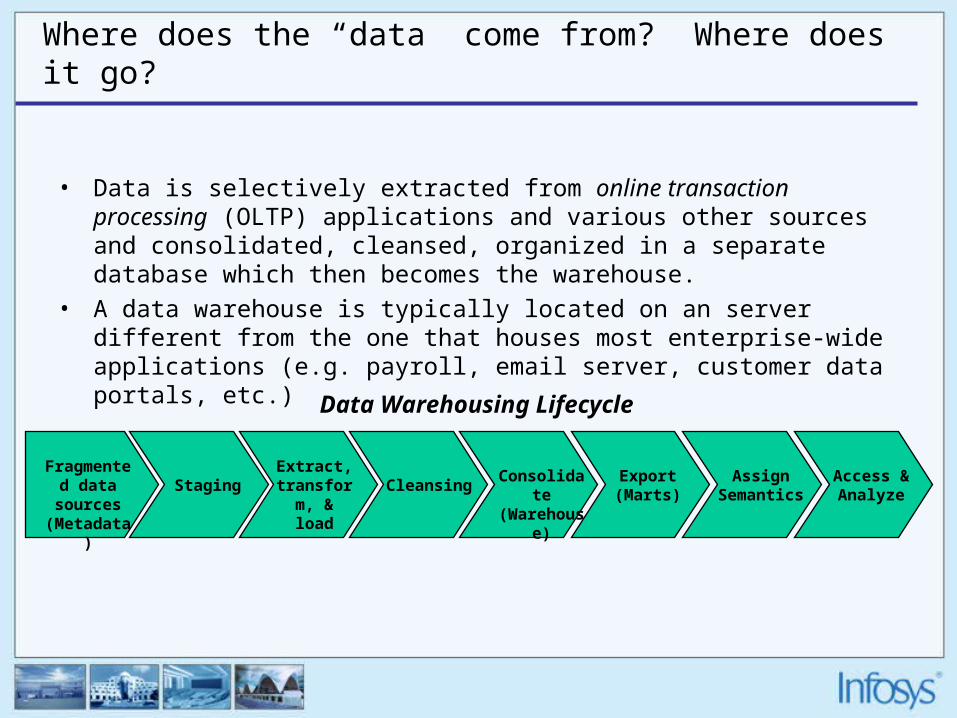
Where does the “data” come from? Where does it go?
• Data is selectively extracted from online transaction processing (OLTP) applications and various other sources and consolidated, cleansed, organized in a separate database which then becomes the warehouse.
• A data warehouse is typically located on an server different from the one that houses most enterprise-wide applications (e.g. payroll, email server, customer data portals, etc.)
Fragmented data sources
(Metadata)
StagingExtract, transfor
m, & load
CleansingConsolida
te (Warehou
se)
Export (Marts)
Assign Semantics
Access & Analyze
Data Warehousing Lifecycle
Hence..
• Data warehouse is a concept/architecture, not a product
• Set of hardware and software components used to analyze huge amount of data
• Intelligent way of managing data
• Data -> Information -> Knowledge -> Decision -> Control

Step-wise break-up of warehousing activity
Data warehouse storage
Source systems
OLAP Server
End user views
Flow of information
Direction of analysis
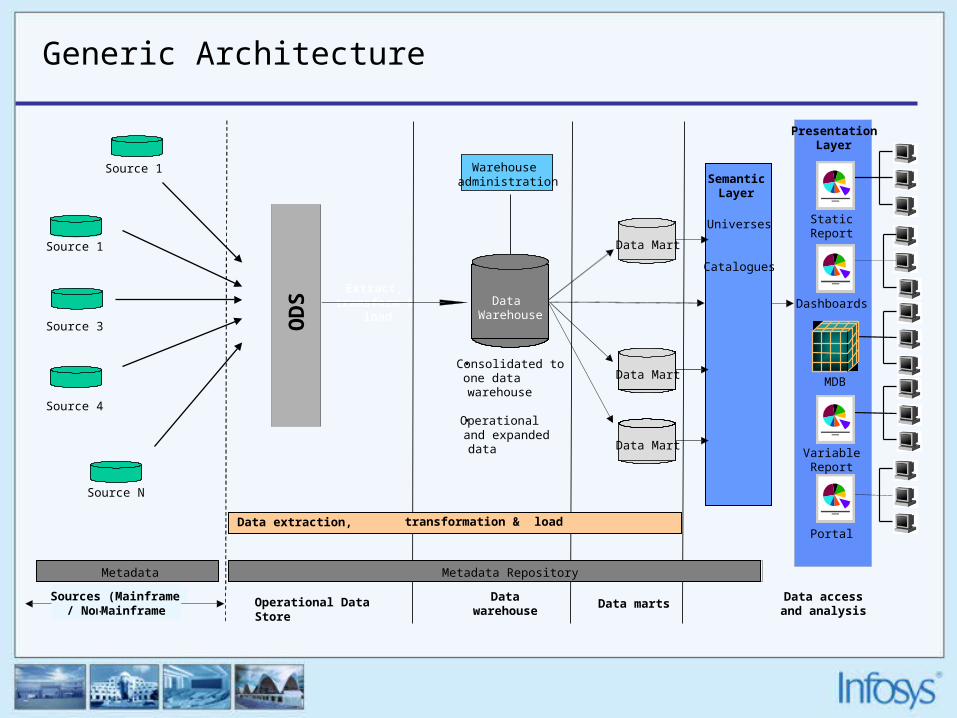
Generic Architecture
Data martsData accessand analysis
MDBMDB
Warehouse administration
Extract, transform &
load
Datawarehouse
Dashboards
StaticReport
PresentationLayer
VariableReport
Metadata
SemanticLayer
Portal
•Consolidated to one data warehouse
•Operational and expanded data
Universes
Catalogues
Source 1
Data Warehouse
MDB
Data Mart
Data Mart
Data Mart
Sources (Mainframe / Non-Mainframe
Source 1
Source 3
Source 4
Source N
Metadata Repository
OD
S
Operational Data Store
Data extraction, transformation & load
Source Systems
• An operational system of record whose function is basically to capture the transactions of the business.
• A source system can be a “legacy system” in a mainframe environment or can be “flat files” or can also be from “multiple RDBMS systems”.
• The main priorities of the source system are uptime and availability.
• Source systems are not queried in the broad and unexpected ways as compared to that of the data warehouses which are typically queried.
Data staging area
• A storage area and set of processes that clean, transform, combine, duplicate, archive, and prepare source data for use in the data warehouse.
• The data staging area is everything in between the source system and the presentation server.
• The staging area is dominated by the simple activities of sorting and sequential processing.
• The data staging area does not need to be based on relational technology.
• Data staging area does not provide query and presentation services.
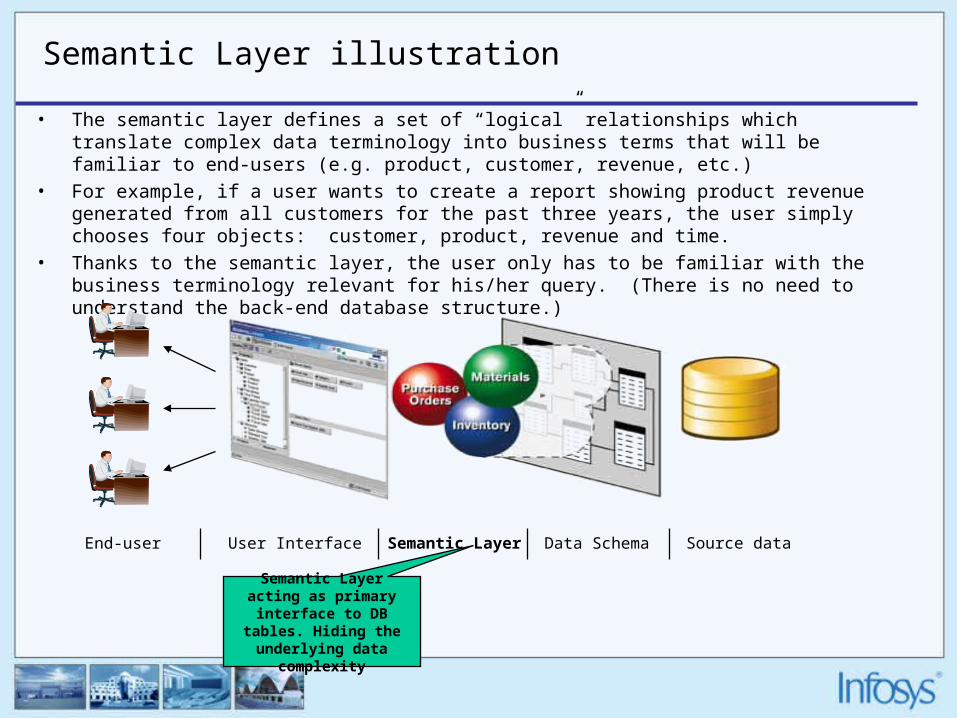
Semantic Layer illustration
• The semantic layer defines a set of “logical” relationships which translate complex data terminology into business terms that will be familiar to end-users (e.g. product, customer, revenue, etc.)
• For example, if a user wants to create a report showing product revenue generated from all customers for the past three years, the user simply chooses four objects: customer, product, revenue and time.
• Thanks to the semantic layer, the user only has to be familiar with the business terminology relevant for his/her query. (There is no need to understand the back-end database structure.)
End-user User Interface Data SchemaSemantic Layer Source data
Semantic Layer acting as primary interface to DB
tables. Hiding the underlying data
complexity

Presentation layer illustration
• The presentation layer enables users to customize the way data (and data analysis) is presented to them.
• Through the presentation layer, users can create custom reports, access standard reports and access “dashboards” with drill-down capabilities as well as alerting functions.
Summary of different layers
• The target physical machine on which the data warehouse data is organized and stored for direct querying by end users, report writers, and other applications.
• To Summarize, three very different systems are required for a data warehouse to function:
– the source system– the data staging area– and the presentation server.
• The source system should be outside the DW.
• The data staging area is described as the initial storage and cleaning system for DW.
• The presentation server presents and stores in a dimensional framework.
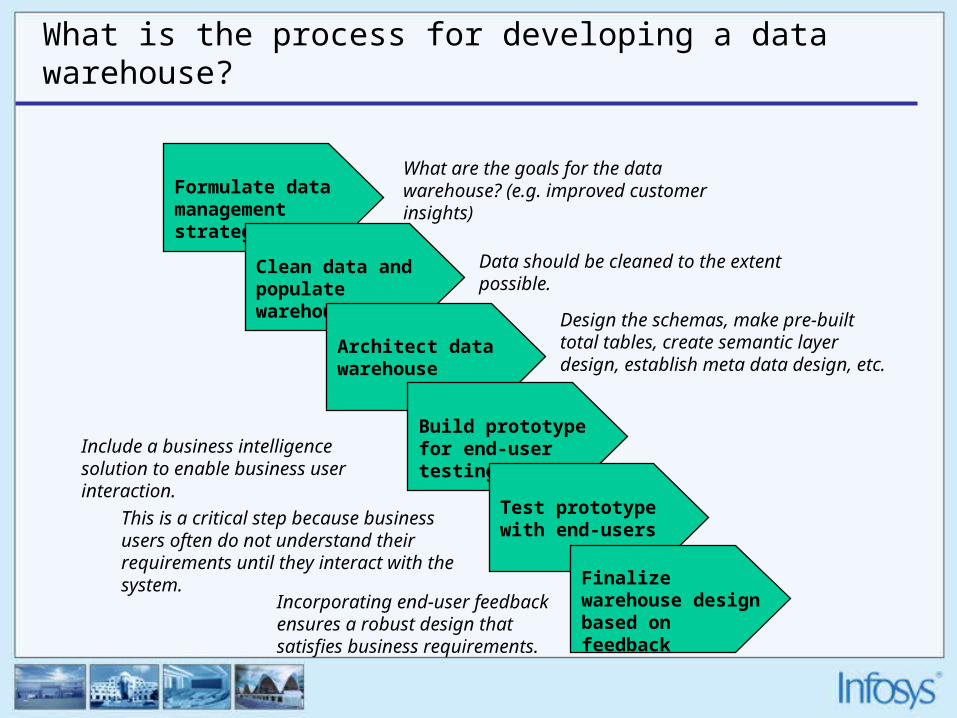
What is the process for developing a data warehouse?
Formulate data management strategy
Clean data and populate warehouse
Architect data warehouse
Build prototype for end-user testing
Test prototype with end-users
Finalize warehouse design based on feedback
What are the goals for the data warehouse? (e.g. improved customer insights)
Data should be cleaned to the extent possible.
Design the schemas, make pre-built total tables, create semantic layer design, establish meta data design, etc.
Include a business intelligence solution to enable business user interaction.
This is a critical step because business users often do not understand their requirements until they interact with the system.
Incorporating end-user feedback ensures a robust design that satisfies business requirements.
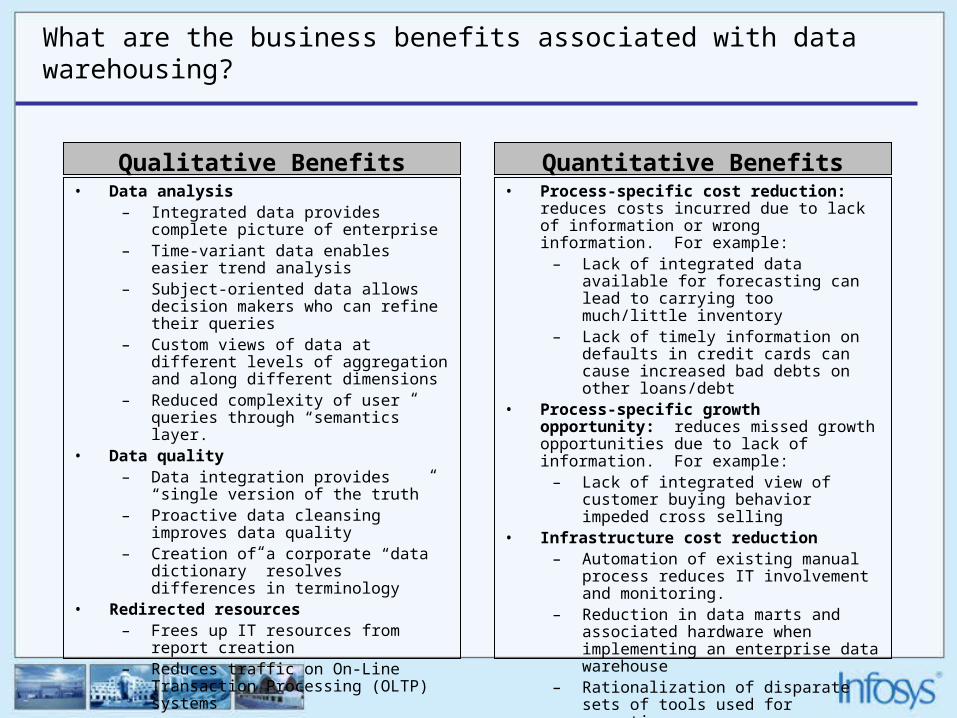
What are the business benefits associated with data warehousing?
• Data analysis– Integrated data provides complete picture
of enterprise – Time-variant data enables easier trend
analysis – Subject-oriented data allows decision
makers who can refine their queries – Custom views of data at different levels of
aggregation and along different dimensions
– Reduced complexity of user queries through “semantics” layer.
• Data quality– Data integration provides “single version
of the truth”– Proactive data cleansing improves data
quality– Creation of a corporate “data dictionary”
resolves differences in terminology• Redirected resources
– Frees up IT resources from report creation
– Reduces traffic on On-Line Transaction Processing (OLTP) systems
• Process-specific cost reduction: reduces costs incurred due to lack of information or wrong information. For example:
– Lack of integrated data available for forecasting can lead to carrying too much/little inventory
– Lack of timely information on defaults in credit cards can cause increased bad debts on other loans/debt
• Process-specific growth opportunity: reduces missed growth opportunities due to lack of information. For example:
– Lack of integrated view of customer buying behavior impeded cross selling
• Infrastructure cost reduction– Automation of existing manual process
reduces IT involvement and monitoring.– Reduction in data marts and associated
hardware when implementing an enterprise data warehouse
– Rationalization of disparate sets of tools used for reporting
Qualitative Benefits Quantitative Benefits

Data warehousing notions and reality…
Notion Reality Check
Data warehouse is a database that stores data
•Although the data for the data warehouse resides in a database (Oracle, DB2, etc.), it should not be confused with an application/transactional database. Any changes to the data should take place in the applications. •The data in the data warehouse is specifically used for querying. It improves the speed of access to information upon which decisions are made.
The data warehouse is going to contain clean data
•Data Warehouse data is as clean as the data it receives from the Source Systems. •A perfectly clean data environment is likely to happen only over a period of time as we make process and systems changes within marketing and across other functional areas within the organization.
The data warehouse is going to contain data from all sources so that they can be used any time if needed in the future
This is also likely to happen over a period of time. The recommendation is to phase in the implementation of the data warehouse to get to this end goal.
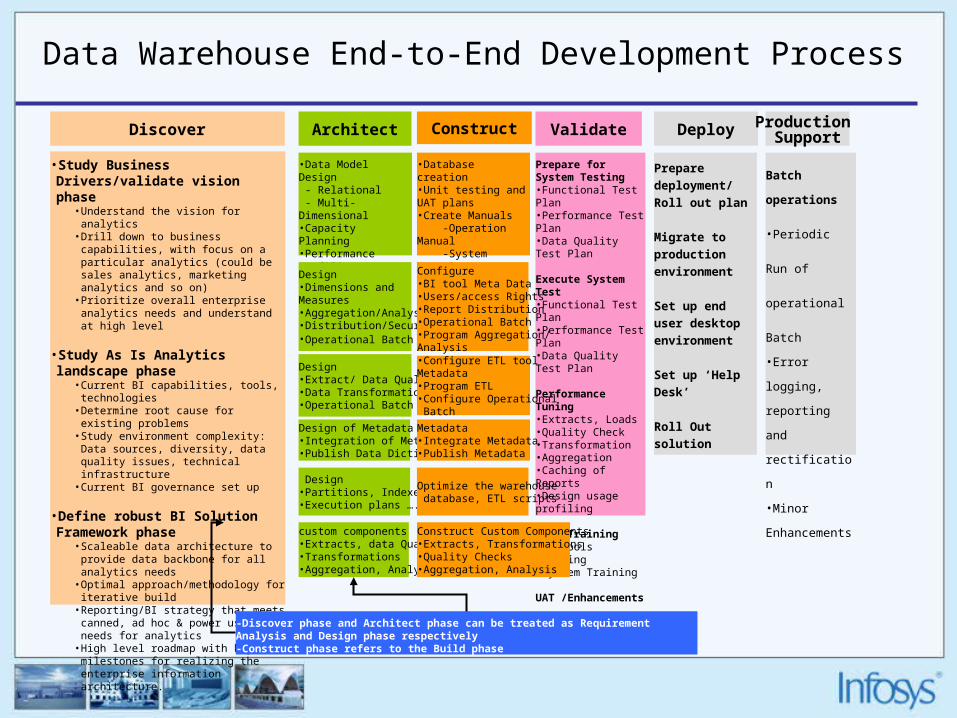
Data Warehouse End-to-End Development Process
Discover Architect Construct Validate Deploy
•Study Business Drivers/validate vision phase
• Understand the vision for analytics• Drill down to business capabilities, with
focus on a particular analytics (could be sales analytics, marketing analytics and so on)
• Prioritize overall enterprise analytics needs and understand at high level
•Study As Is Analytics landscape phase
• Current BI capabilities, tools, technologies• Determine root cause for existing problems• Study environment complexity: Data
sources, diversity, data quality issues, technical infrastructure
• Current BI governance set up
•Define robust BI Solution Framework phase
• Scaleable data architecture to provide data backbone for all analytics needs
• Optimal approach/methodology for iterative build
• Reporting/BI strategy that meets canned, ad hoc & power user needs for analytics
• High level roadmap with key milestones for realizing the enterprise information architecture.
•Data Model Design - Relational - Multi-Dimensional•Capacity Planning•Performance profiling•Detailed Architecture definition•Prototype
•Database creation•Unit testing and UAT plans•Create Manuals -Operation Manual -System Manual -Installation Notes -User Manual
Prepare for System Testing•Functional Test Plan•Performance Test Plan•Data Quality Test Plan
Execute System Test•Functional Test Plan•Performance Test Plan•Data Quality Test Plan
Performance Tuning•Extracts, Loads•Quality Check•Transformation•Aggregation•Caching of Reports•Design usage profiling
User Training•BI Tools Training•System Training
UAT /Enhancements
Prepare
deployment/ Roll
out plan
Migrate to
production
environment
Set up end user
desktop
environment
Set up ‘Help
Desk’
Roll Out solution
-Discover phase and Architect phase can be treated as Requirement Analysis and Design phase respectively-Construct phase refers to the Build phase
Design•Dimensions and Measures•Aggregation/Analysis •Distribution/Security •Operational Batch
Design•Extract/ Data Quality•Data Transformation•Operational Batch
Design of Metadata•Integration of Metadata•Publish Data Dictionary
Design •Partitions, Indexes•Execution plans ….
custom components•Extracts, data Quality•Transformations•Aggregation, Analysis
Configure •BI tool Meta Data•Users/access Rights•Report Distribution•Operational Batch•Program Aggregation/Analysis•Configure ETL tool Metadata•Program ETL •Configure Operational Batch
Metadata•Integrate Metadata •Publish Metadata
Optimize the warehouse database, ETL scripts
Construct Custom Components•Extracts, Transformations•Quality Checks•Aggregation, Analysis
Production Support
Batch
operations
•Periodic Run of
operational
Batch
•Error logging,
reporting and
rectification
•Minor
Enhancements

Architecture Components & Providers
Component Providers
Source Systems - Operational or legacy systems of record whose function it is to capture the transactions of the business. The data in these systems can be in many formats from flat files to hierarchical, and relational databases.
• Infinite possibilities
Data Warehouse Database - The data warehouse database collects and stores integrated sets of historical, non-volatile data from multiple operational systems and feeds them to one or more data marts. It becomes the one source of the truth for all shared data.
• Teradata• SQL Server• Netezza• Oracle• etc
Data Marts - All data marts extract data from the data warehouse. The data marts contain subject specific information supporting the requirements of the end users in individual business units. Data marts can provide rapid response to end-user requests using aggregates stored in the data mart.
• SQL Server• Oracle
Extract Transform Load (ETL) - ETL tools are used to extract data from data sources, cleanse the data, perform data transformations, and load the target data warehouse. The ETL tool is also used to load the data marts. The ETL tool maintains a metadata repository of all source to target transformations, this information is available to end users for research and problem resolution.
• Informatica• SAS• Hummingbird• etc.
Metadata Repository - Offers a way to understand what information is available, where it comes from, where it is stored, the transformation performed on the data. Technical metadata can be generated and maintained by an ETL tool as part of the specification of the extraction, transformation and load process. The repository can also capture the operational statistics during the operation of the ETL process.
• Computer Associates
• Allen Systems Group
Data Modeling Tool - Used to specify logical and physical models for data warehouse tables, and to create meta data for these tables, which can then can be imported to the central meta data.
• Erwin• Embarcadero
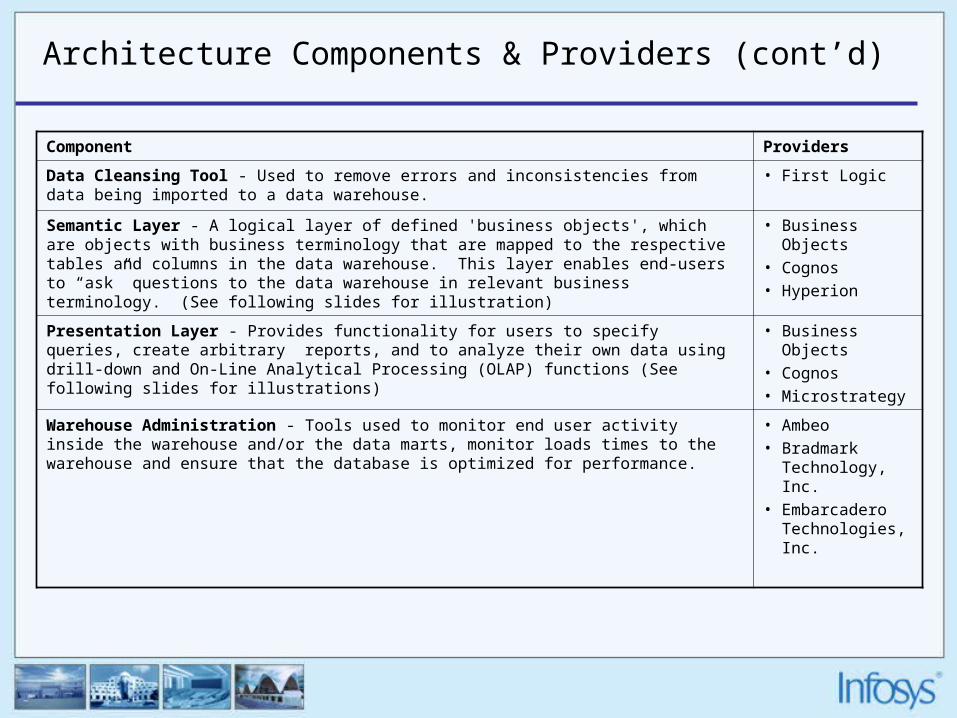
Architecture Components & Providers (cont’d)
Component Providers
Data Cleansing Tool - Used to remove errors and inconsistencies from data being imported to a data warehouse.
• First Logic
Semantic Layer - A logical layer of defined 'business objects', which are objects with business terminology that are mapped to the respective tables and columns in the data warehouse. This layer enables end-users to “ask” questions to the data warehouse in relevant business terminology. (See following slides for illustration)
• Business Objects• Cognos• Hyperion
Presentation Layer - Provides functionality for users to specify queries, create arbitrary reports, and to analyze their own data using drill-down and On-Line Analytical Processing (OLAP) functions (See following slides for illustrations)
• Business Objects• Cognos• Microstrategy
Warehouse Administration - Tools used to monitor end user activity inside the warehouse and/or the data marts, monitor loads times to the warehouse and ensure that the database is optimized for performance.
• Ambeo • Bradmark
Technology, Inc. • Embarcadero
Technologies, Inc.

Dimensional Model
• A specific discipline for modeling data that is an alternative to entity relationship (E/R) modeling.
• Required to make database simple and understandable• Gives user the ability to visualize data• The main components of a dimensional model are fact tables and
dimension tables.– A fact table is the primary table in each dimensional model that is
meant to contain measurements of the business.– A dimension table is one of a set of companion tables to a fact
table. Each dimension is defined by its primary key that serves as the basis for referential integrity with any given fact table to which it is joined.

DW Schema Models
• We have two schema models which are suitable for Data Warehousing in most of the cases.
• Star Schema A star schema is a set of tables comprised of a single, central fact table surrounded by de-normalized dimensions. Each dimension is represented in a single table.
• Snowflake Schema If you normalize the star schema dimensions to separate tables and link them together, you will have a snowflake schema
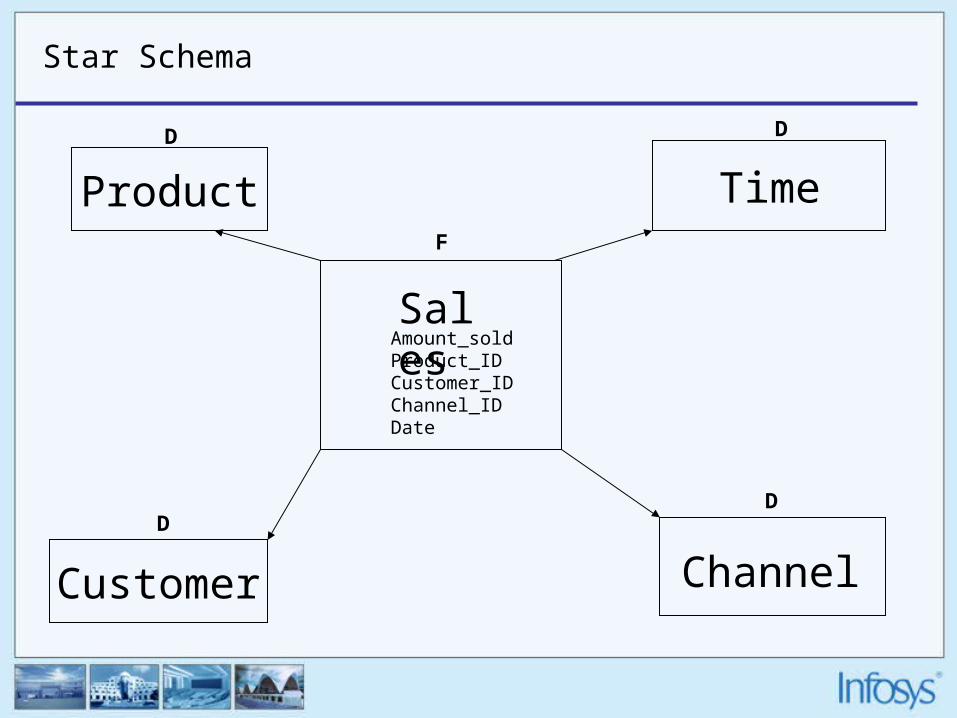
Star Schema
Product
Customer
Amount_soldProduct_IDCustomer_IDChannel_IDDate
Sales
Time
Channel
F
DD
DD
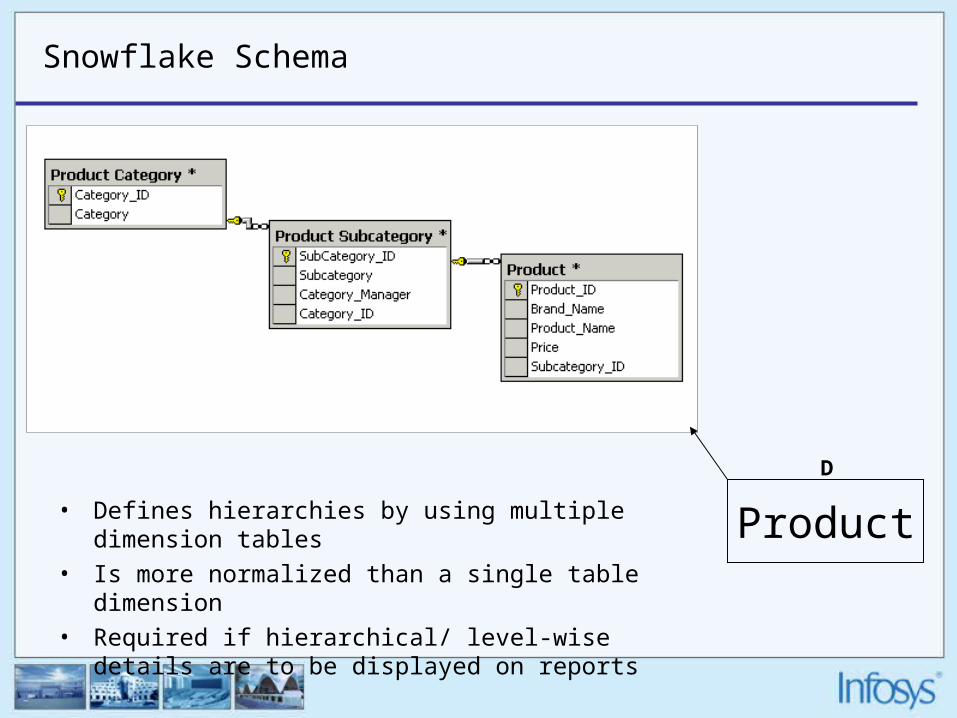
Snowflake Schema
Product
D
• Defines hierarchies by using multiple dimension tables
• Is more normalized than a single table dimension
• Required if hierarchical/ level-wise details are to be displayed on reports
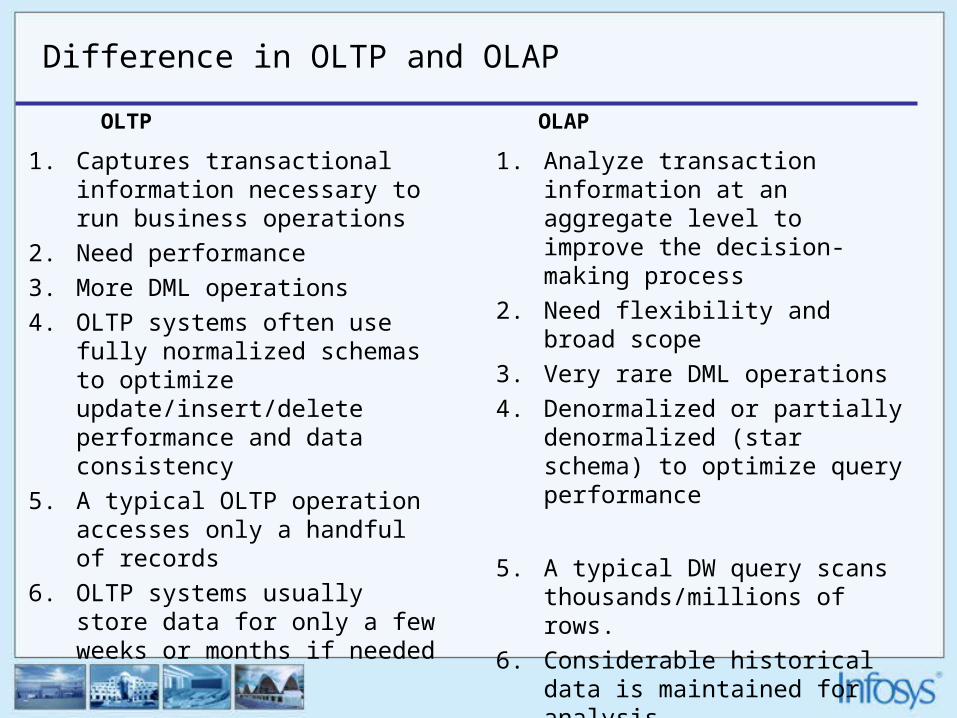
Difference in OLTP and OLAP
1. Captures transactional information necessary to run business operations
2. Need performance
3. More DML operations
4. OLTP systems often use fully normalized schemas to optimize update/insert/delete performance and data consistency
5. A typical OLTP operation accesses only a handful of records
6. OLTP systems usually store data for only a few weeks or months if needed
1. Analyze transaction information at an aggregate level to improve the decision-making process
2. Need flexibility and broad scope
3. Very rare DML operations
4. Denormalized or partially denormalized (star schema) to optimize query performance
5. A typical DW query scans thousands/millions of rows.
6. Considerable historical data is maintained for analysis
OLTP OLAP
Data warehouse v/s Data Mart
• Data mart - A logical subset of the complete data warehouse.
• A data mart is a complete “pie-wedge” of the overall data warehouse pie.
• A data warehouse is made up of the union of all its data marts.
• A data warehouse is fed from the staging area.
• Every data mart must be represented by a dimensional model and, within a single data warehouse, all such data mart must be built from dimensions and facts.

What is ETL ?
• Can also be called as ETVL
• Extraction
• Transformation
• Validation
• Loading
Major ETL Tools
• Informatica
• IBM Datastage
• Ab-initio
• Microsoft DTS package
• Oracle Express
• SAS
• Hummingbird

Few ETL process considerations
• Tracking dimensions – SCDs can be difficult to maintain during incremental/delta updates of the dimension tables.
• Change Data Capture – This is the ability to identify records in source systems which have been modified since last extraction. The source system should capture the change and ETL should use the change captured to extract relevant records
• Artificial keys – generation of keys when inserting records into tables having artificial keys need to be taken care of
• Aggregation of data – This is required for population of aggregation-level fact tables and when more hierarchical representation of data is required at report-level
• Scheduling – Time based and conditional scheduling ease the administration of ETL process
SCDs (Slowly Changing Dimensions)
• It is a concept of extracting recently modified data.
• Generally 3 types
• Type1 : Keep most recent values in the target
• Type2 : Keep full history of changes in the target
2.1 Keep version number in separate column
2.2 Mark the current dimension record with a flag
2.3 Mark the dimension records with their effective date range
• Type3 : Keep the current and previous values in the target

OLAP (OnLine Analytical Processing)
• ROLAP (Relational OLAP)
• MOLAP (Multidimensional OLAP)
• DOLAP (Desktop OLAP)
• HOLAP (Hybrid OLAP)
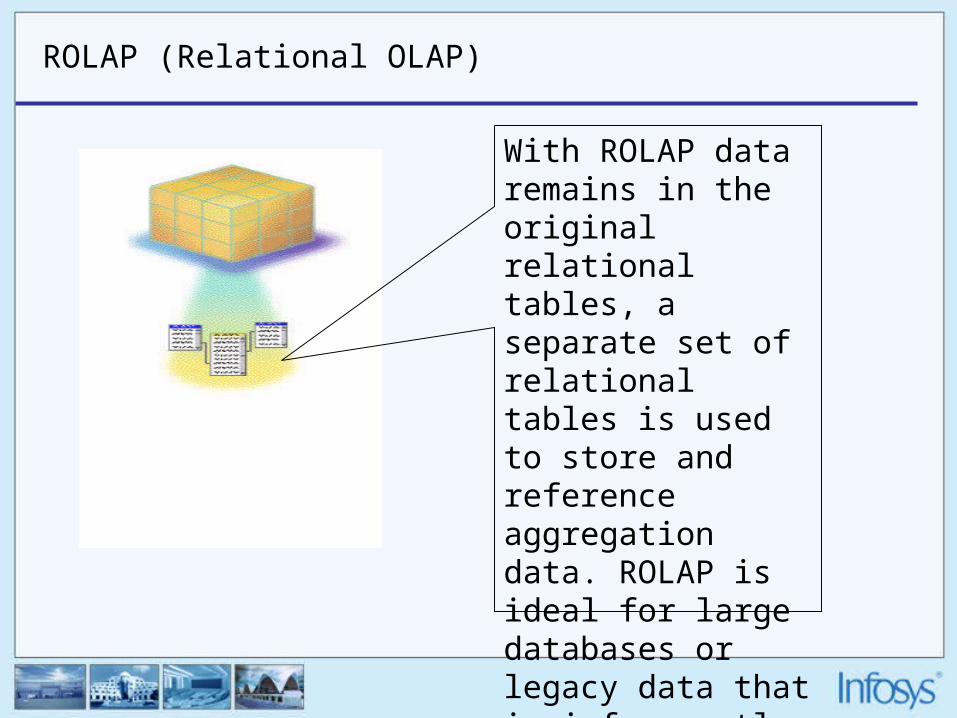
ROLAP (Relational OLAP)
With ROLAP data remains in the original relational tables, a separate set of relational tables is used to store and reference aggregation data. ROLAP is ideal for large databases or legacy data that is infrequently queried.

MOLAP (Multidimensional OLAP)
1. High performance, multidimensional data storage format
2. Data is stored on the OLAP server
3. Gives the best query performance
4. For small to medium-sized data sets

HOLAP (Hybrid OLAP)
HOLAP combines elements from MOLAP and ROLAP. HOLAP keeps the original data in
relational tables but stores aggregations in a multidimensional format.
DOLAP (Desktop OLAP)
• Stores in the form of cubes/micro-cubes on the desktop/client machine
• BusinessObjects typically stores data in this format
Major OLAP/Reporting Tools
• BusinessObjects
• Microstrategy
• Brio
• Cognos
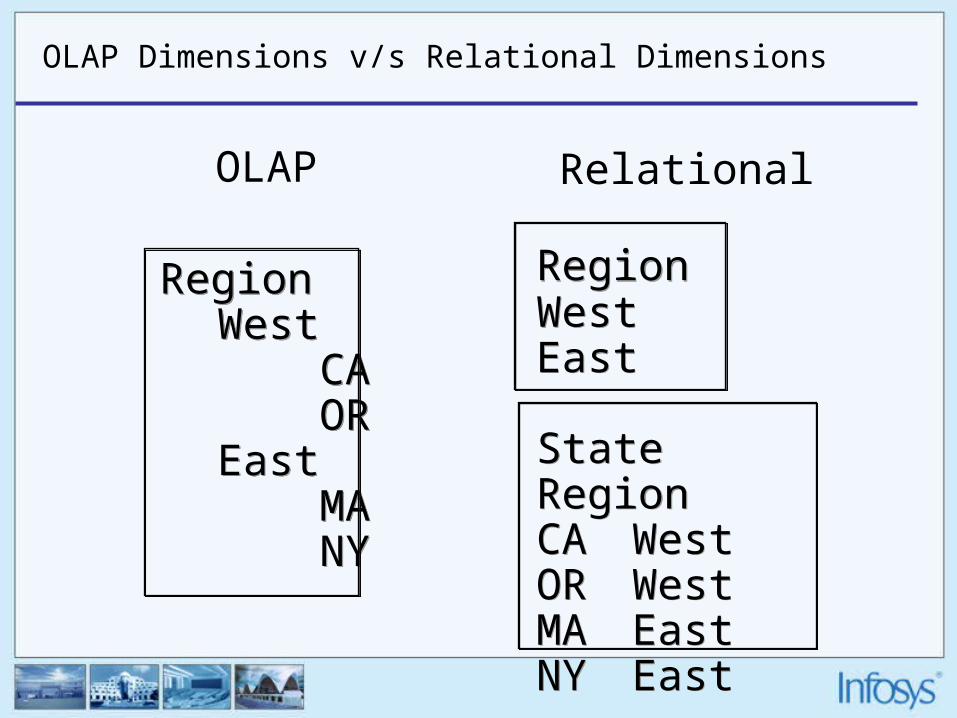
OLAP Dimensions v/s Relational Dimensions
RegionWest CA OREast MA NY
RegionWest CA OREast MA NY
RegionWestEast
StateRegionCA WestOR WestMA EastNY East
RegionWestEast
StateRegionCA WestOR WestMA EastNY East
OLAP Relational
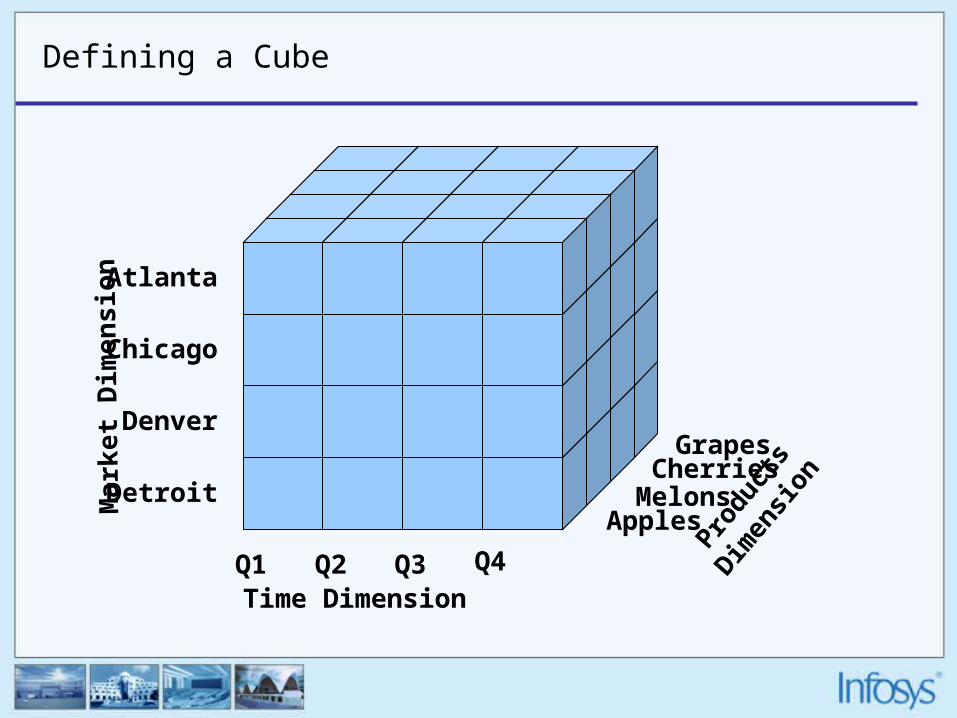
Defining a Cube
Q4Q1 Q2 Q3Time Dimension Pro
ducts
Dim
ensio
n
Detroit
Denver
Chicago
Mar
ket D
imen
sion
Apples
CherriesGrapes
Atlanta
Melons
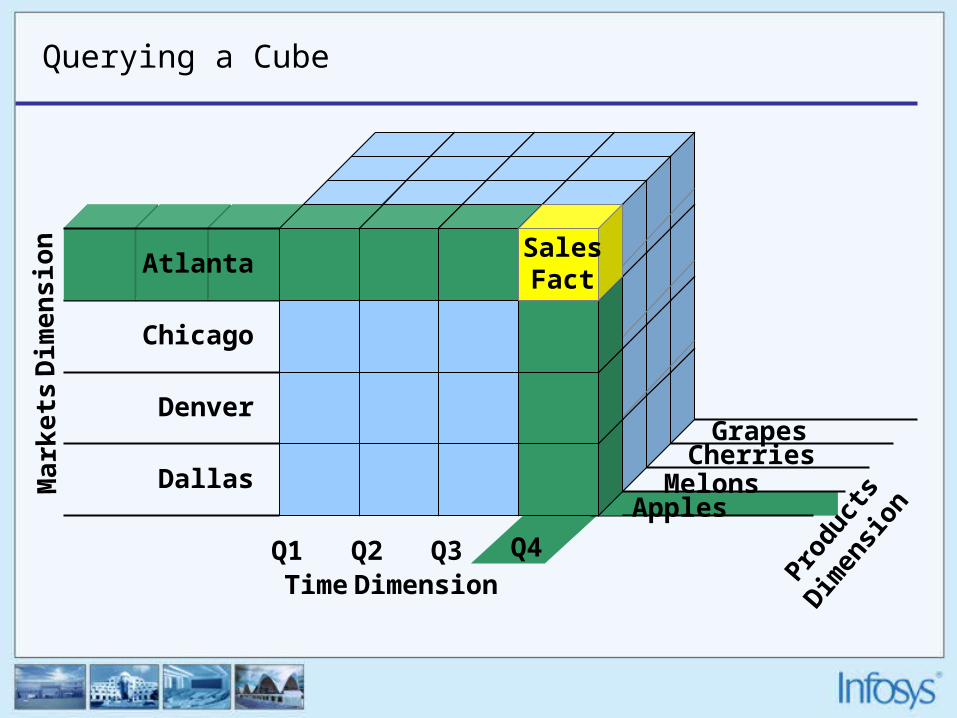
Querying a Cube
Q4Q1 Q2 Q3Time Dimension
Produ
cts D
imen
sionDallas
Denver
Chicago
Mar
kets
Dim
ensi
on
Apples
CherriesGrapes
AtlantaSales Fact
Melons
References
• www.datawarehouse.com
• Building the data warehouse – W.H.Inmon
• White papers published by Informatica and BusinessObjects
• www.dmreview.com
• Infosys Knowledge repository - KShop

Thanks