Data Visualisation A picture is worth a thousand words.
27
Data Visualisation A picture is worth a thousand words
-
Upload
augustus-potter -
Category
Documents
-
view
234 -
download
0
Transcript of Data Visualisation A picture is worth a thousand words.
Data Visualisation
A picture is worth a thousand words
Introducing Visualisation
Maxim 19.1
People are processing tools, too, especially when it comes to processing visual information
Displaying Tabular Data Using HTML
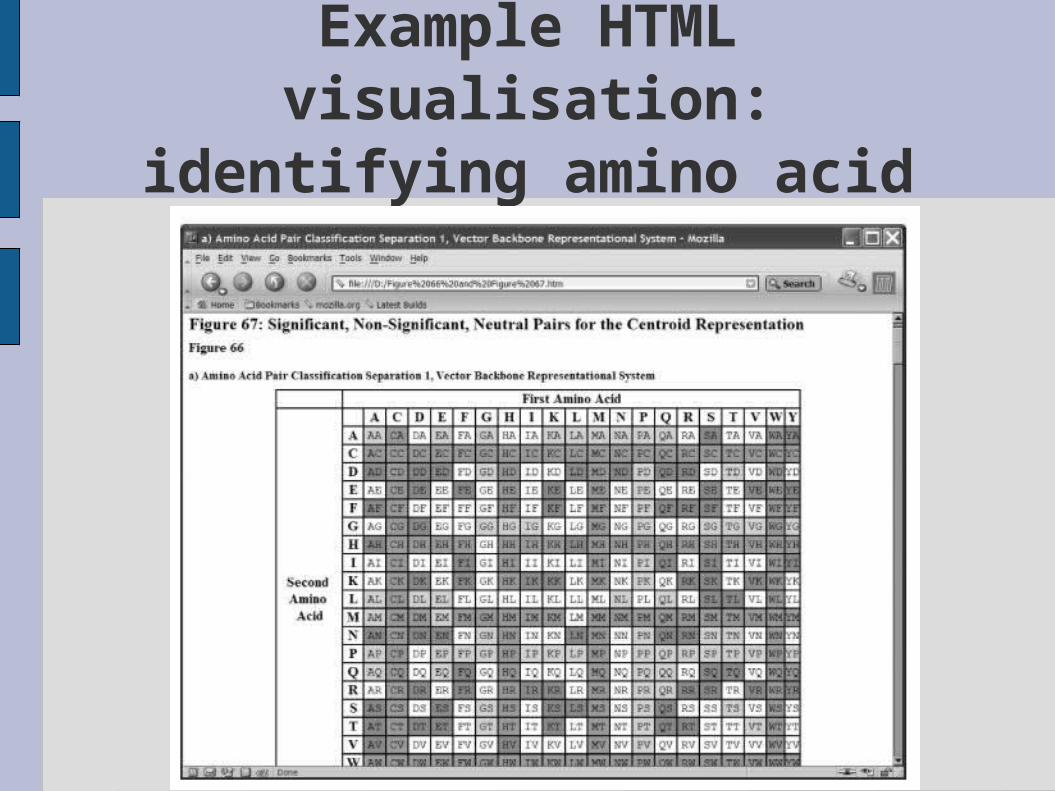
Example HTML visualisation: identifying amino acid states
figMIX1.eps
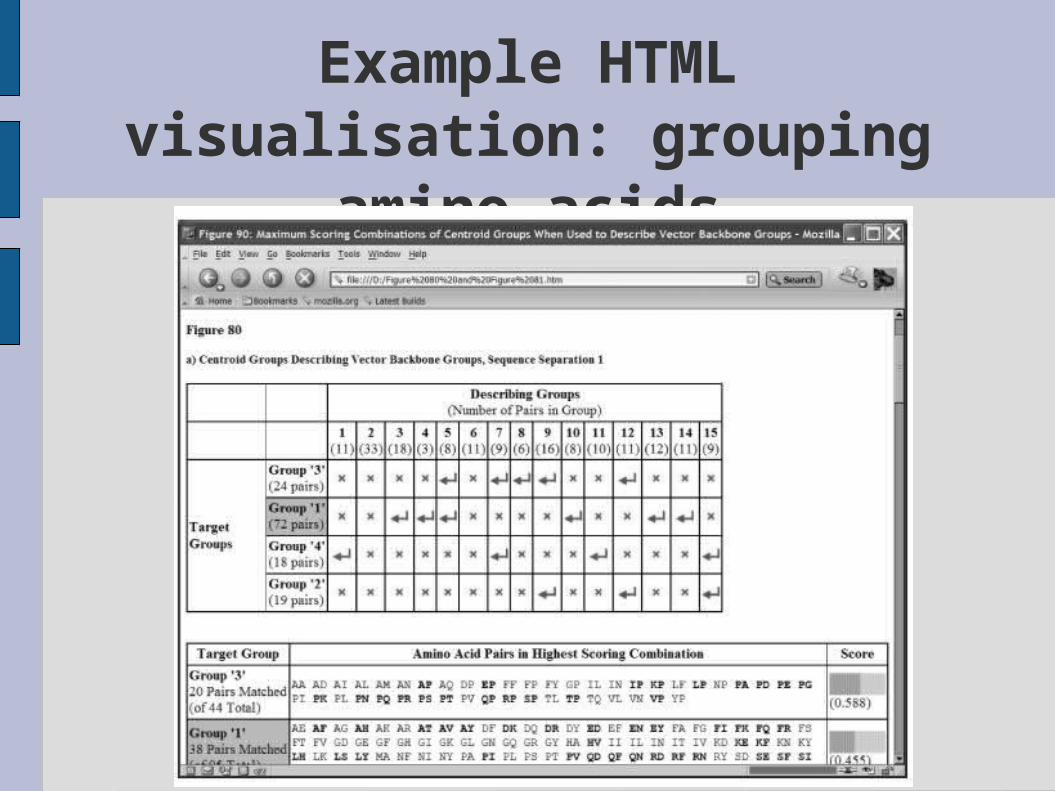
Example HTML visualisation: grouping amino acids
figMIX2.eps
Displaying SWISS-PROT identifiers
sw|Q52109|MERA_ACICA Mercuric reduct ...MTTLKITGMTCDSCAAHVKEALEK ...
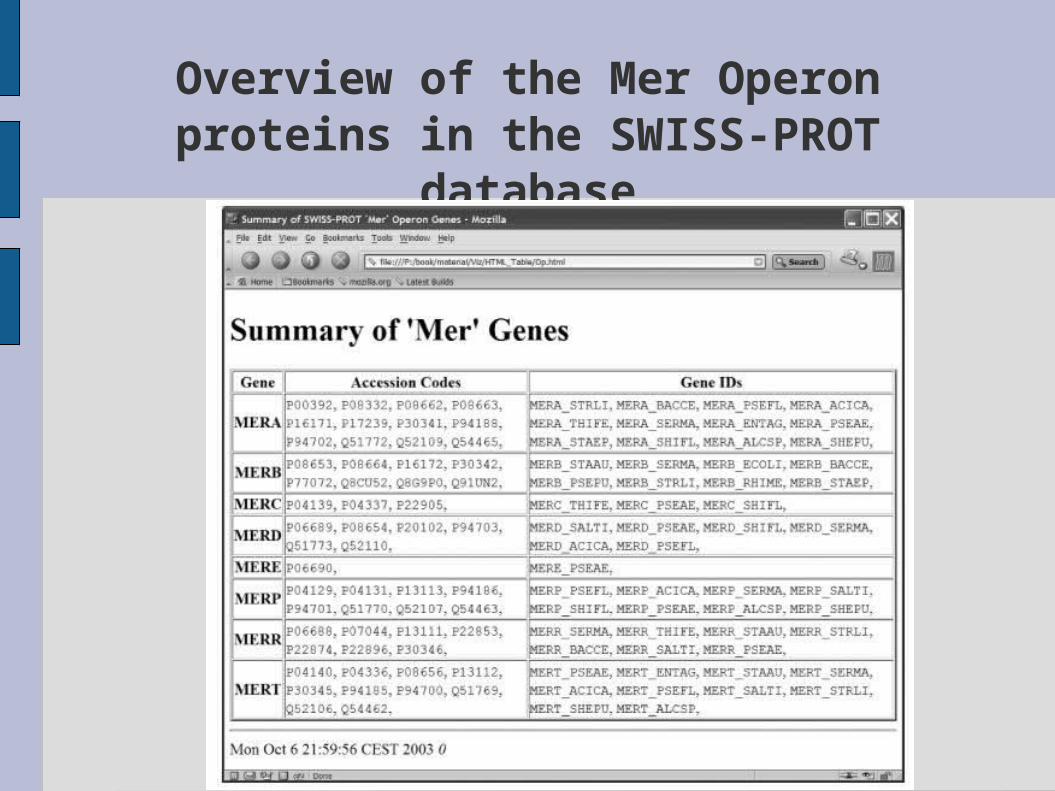
Overview of the Mer Operon proteins in the SWISS-PROT database
figMERTABLEHTML.eps
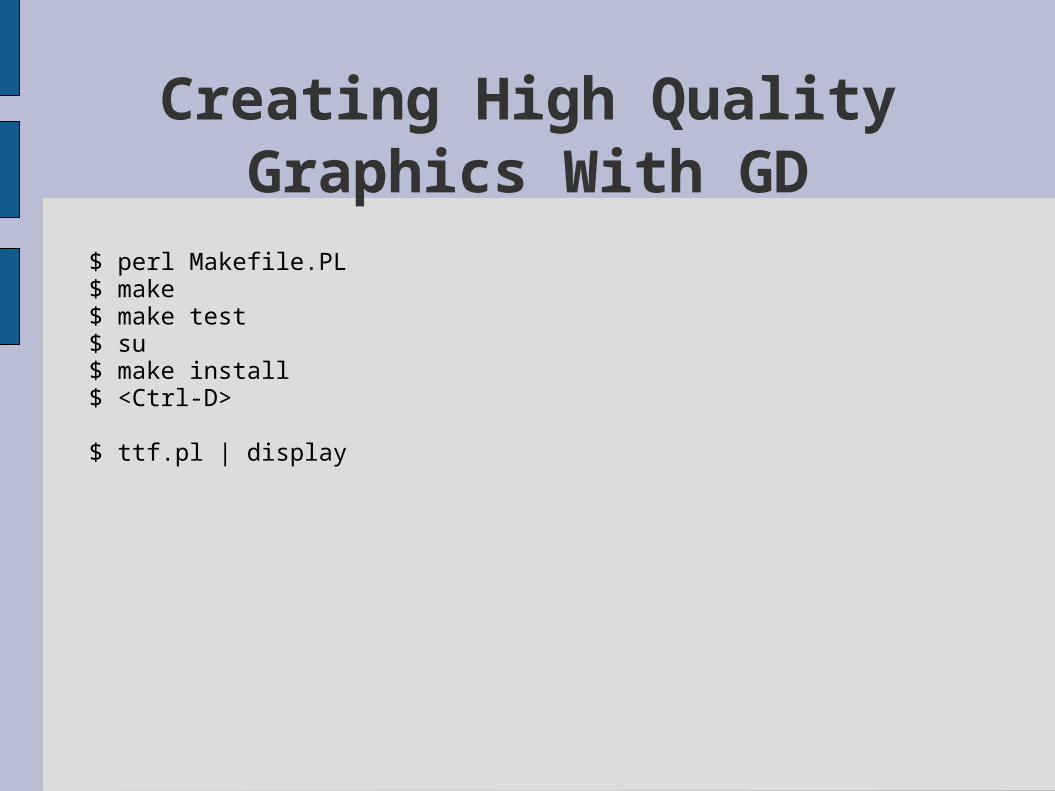
$ perl Makefile.PL$ make$ make test$ su$ make install$ <Ctrl-D>
$ ttf.pl | display
Creating High Quality Graphics With GD
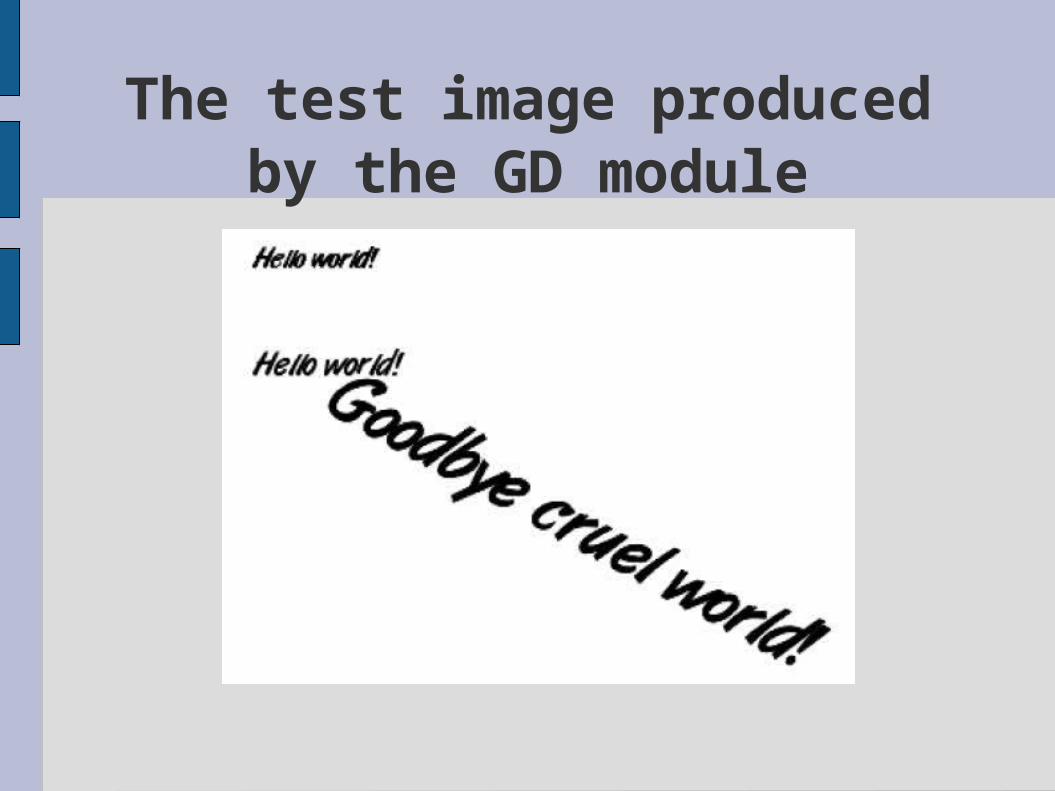
The test image produced by the GD module
figTTF.eps
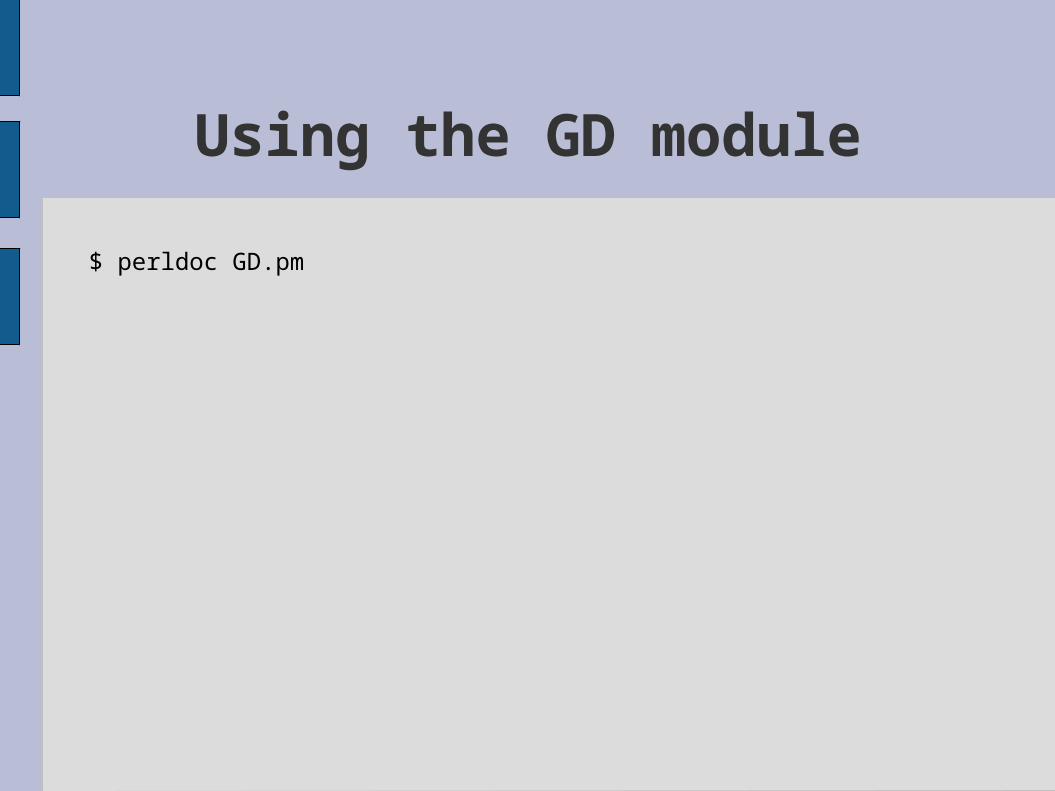
$ perldoc GD.pm
Using the GD module
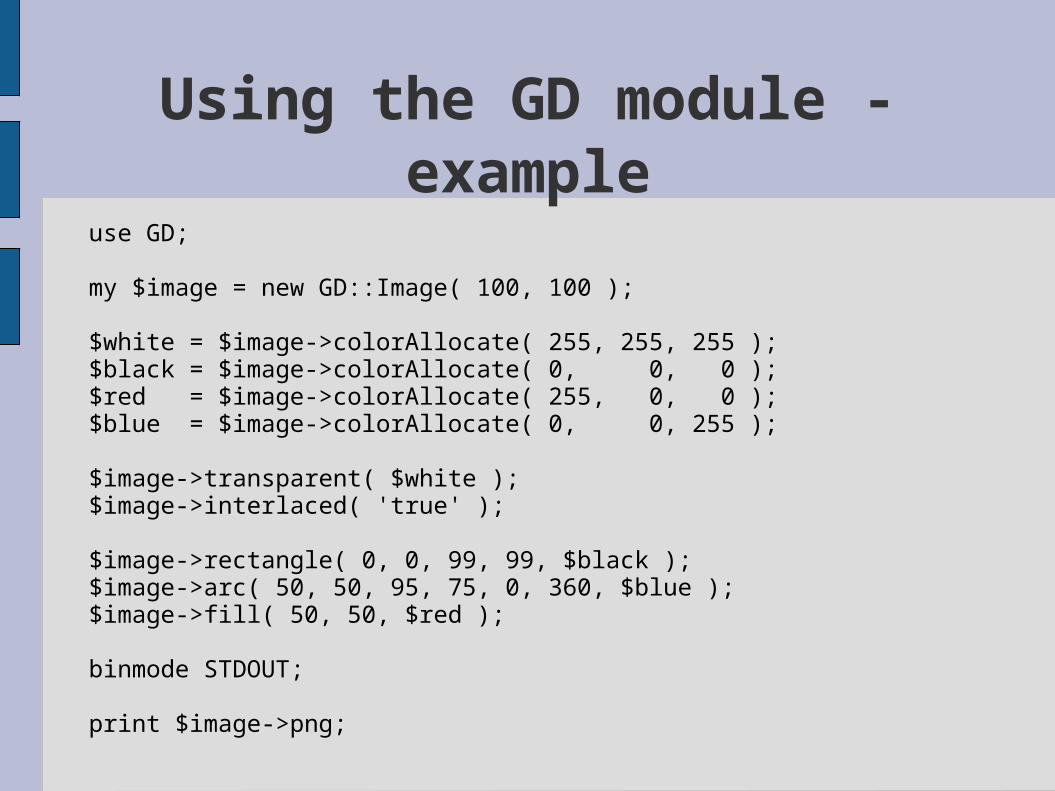
use GD;
my $image = new GD::Image( 100, 100 );
$white = $image->colorAllocate( 255, 255, 255 );$black = $image->colorAllocate( 0, 0, 0 );$red = $image->colorAllocate( 255, 0, 0 );$blue = $image->colorAllocate( 0, 0, 255 );
$image->transparent( $white );$image->interlaced( 'true' );
$image->rectangle( 0, 0, 99, 99, $black );$image->arc( 50, 50, 95, 75, 0, 360, $blue );$image->fill( 50, 50, $red );
binmode STDOUT;
print $image->png;
Using the GD module - example
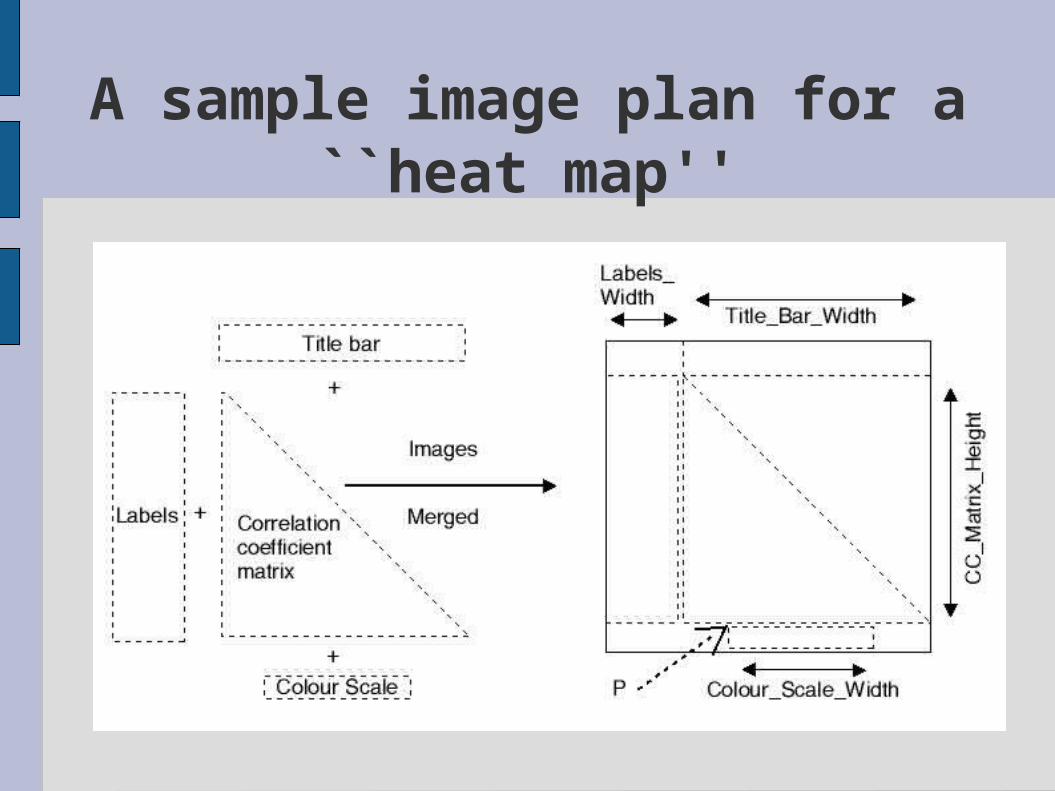
A sample image plan for a ``heat map''
figMIXPLAN.eps
Maxim 19.2
Producing plans avoids problems before problems surface
Displaying genes in EMBL entries
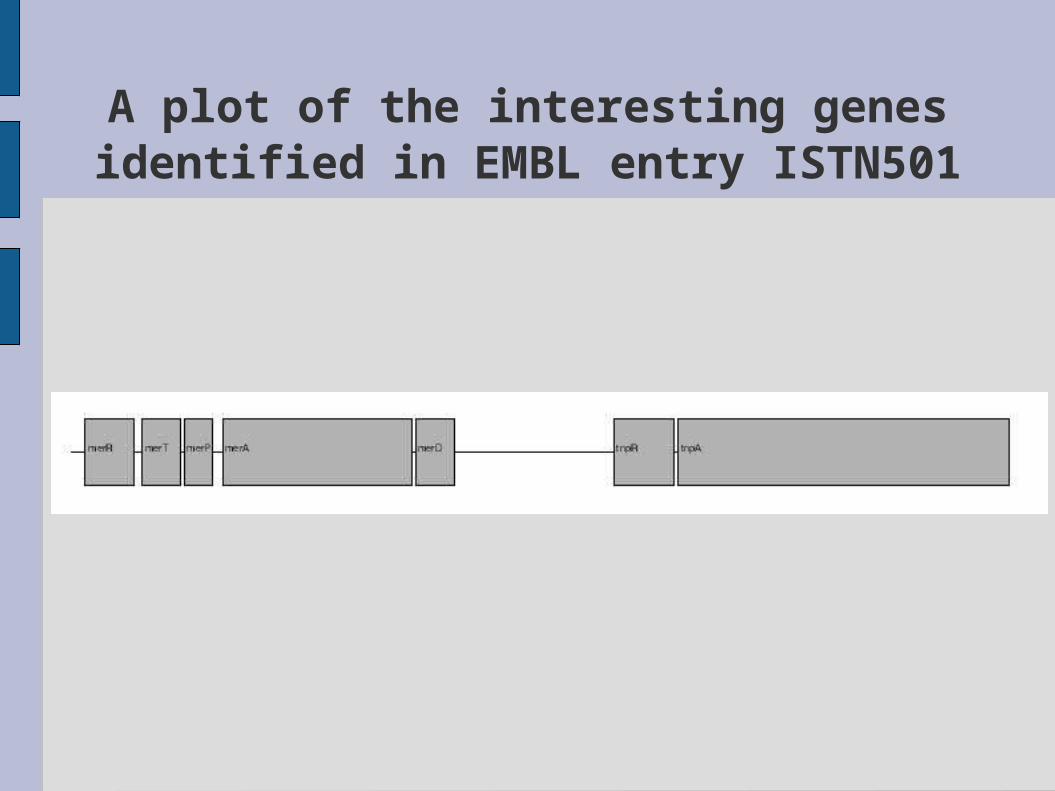
A plot of the interesting genes identified in EMBL entry ISTN501
figEMBLPLOT.eps
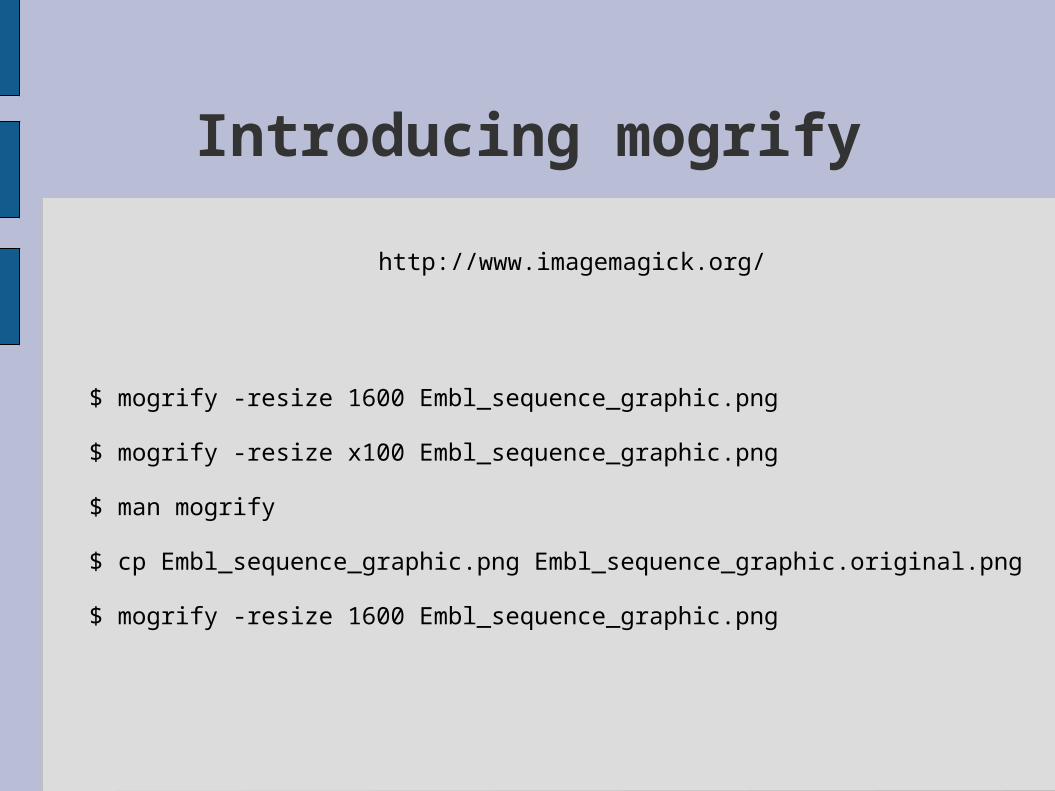
http://www.imagemagick.org/
$ mogrify -resize 1600 Embl_sequence_graphic.png
$ mogrify -resize x100 Embl_sequence_graphic.png
$ man mogrify
$ cp Embl_sequence_graphic.png Embl_sequence_graphic.original.png
$ mogrify -resize 1600 Embl_sequence_graphic.png
Introducing mogrify
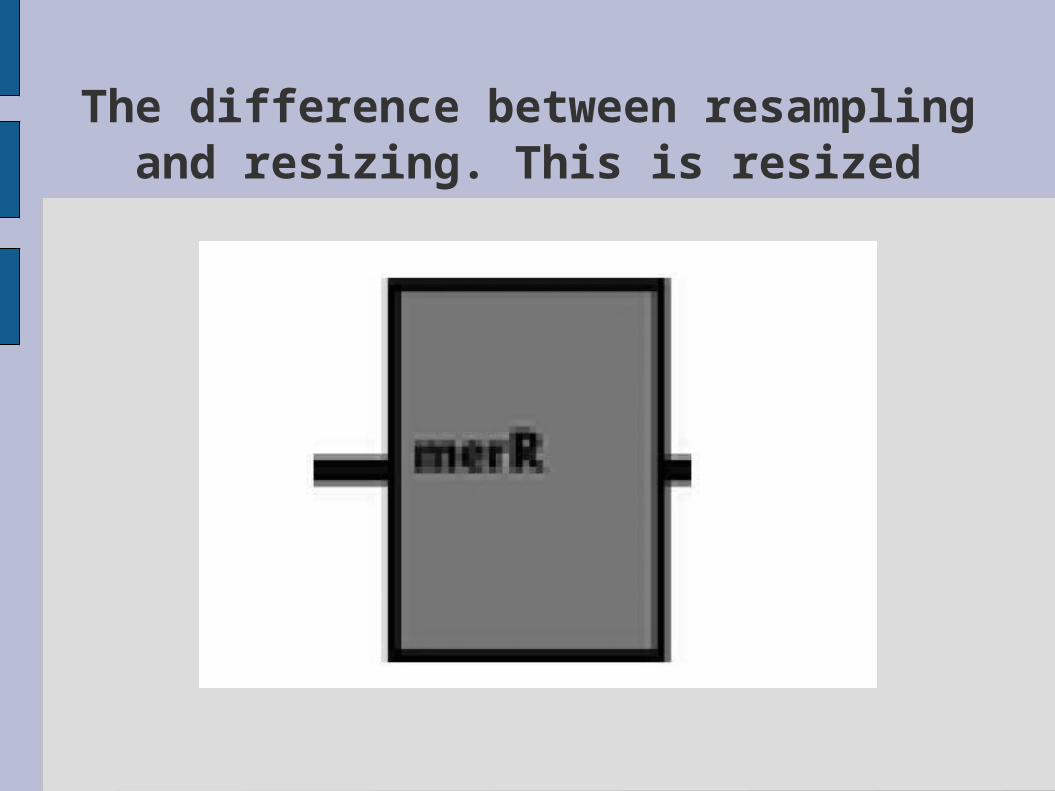
The difference between resampling and resizing. This is resized
figRESIZED.eps
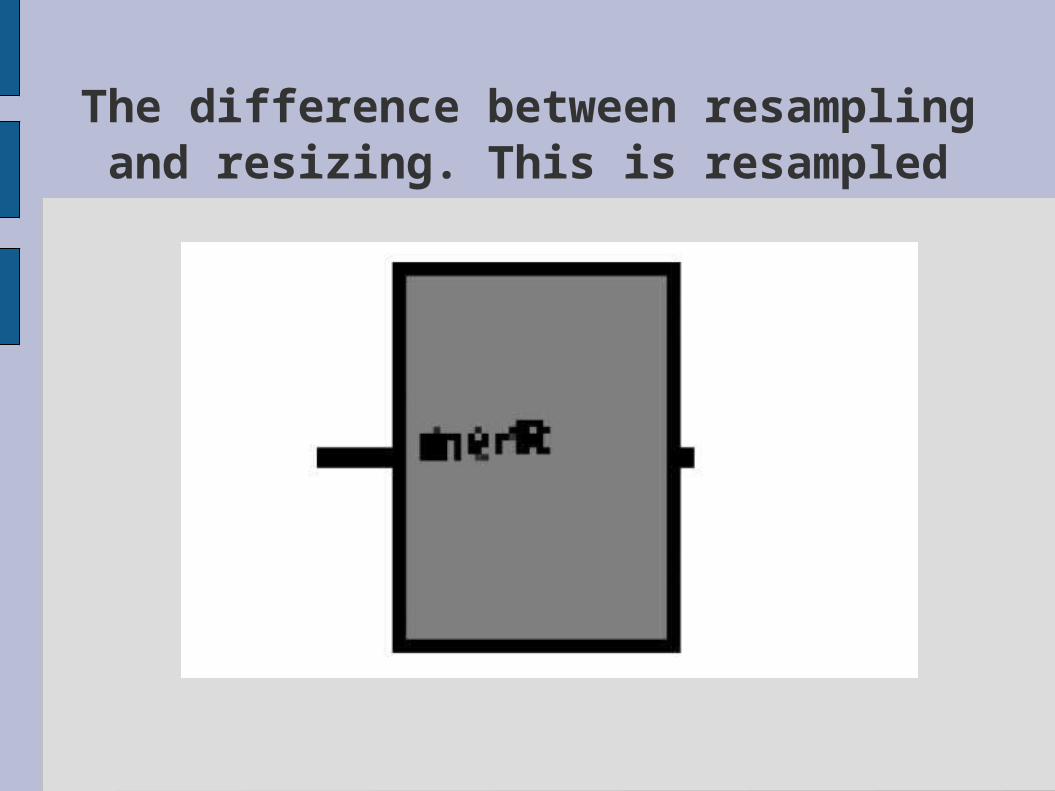
The difference between resampling and resizing. This is resampled
figRESAMPLED.eps
Plotting Graphs
Graph plotting using the GD::Graph modules
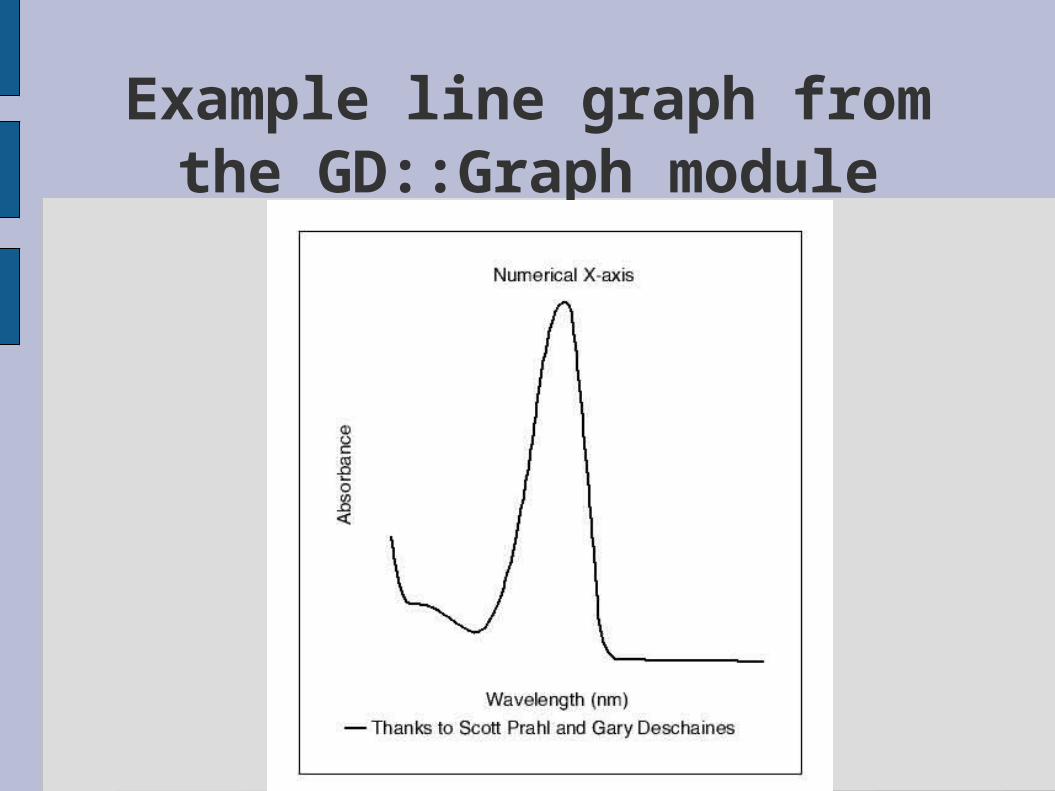
Example line graph from the GD::Graph module
figGRAPHEXAMPLE1.eps
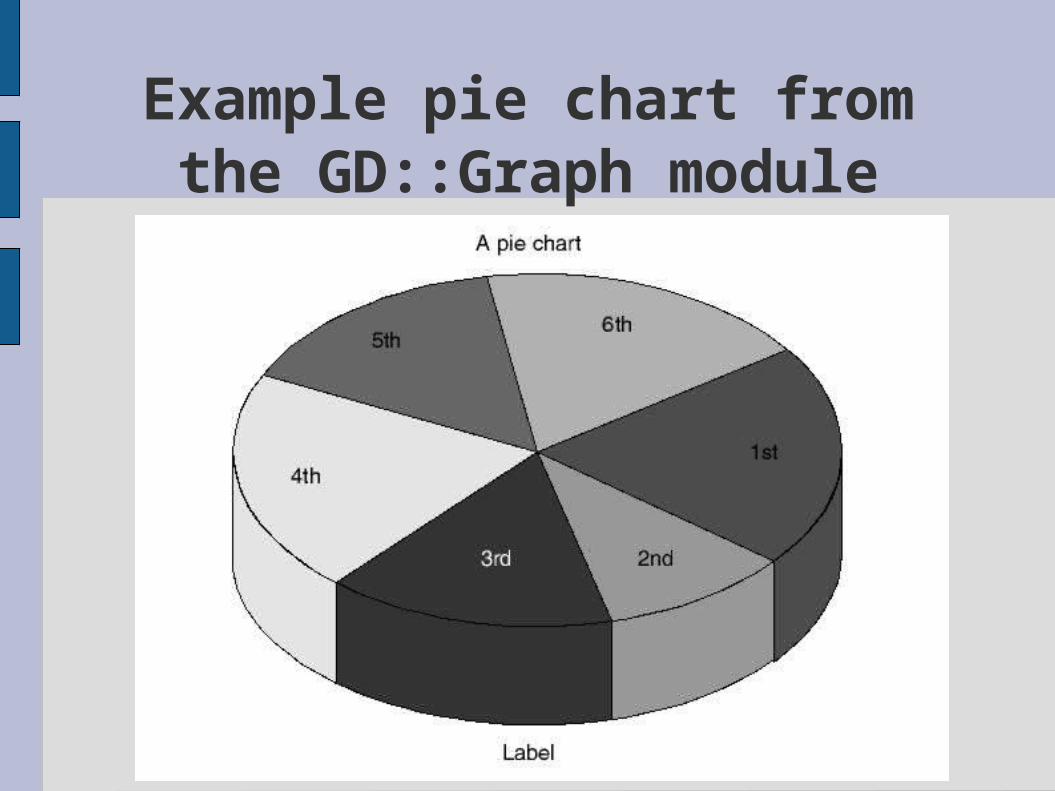
Example pie chart from the GD::Graph module
figGRAPHEXAMPLE2.eps
Graph plotting using Grace
http://plasma-gate.weizmann.ac.il/Grace/
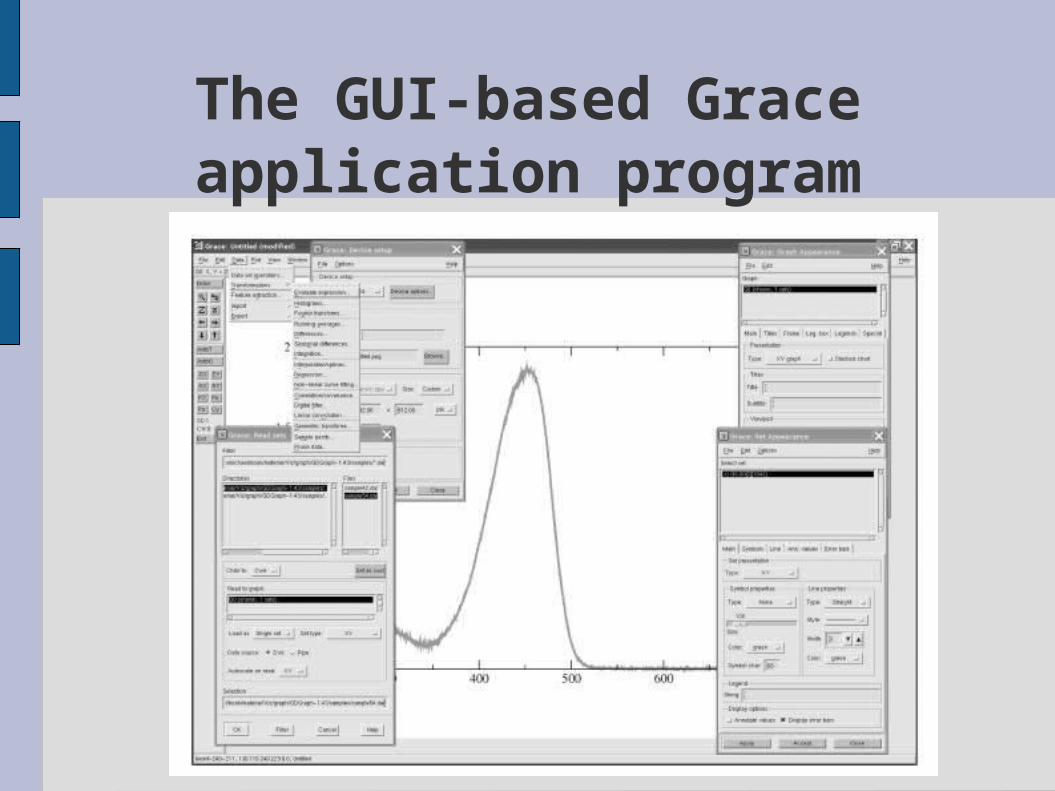
The GUI-based Grace application program
figGRACESHOT.eps
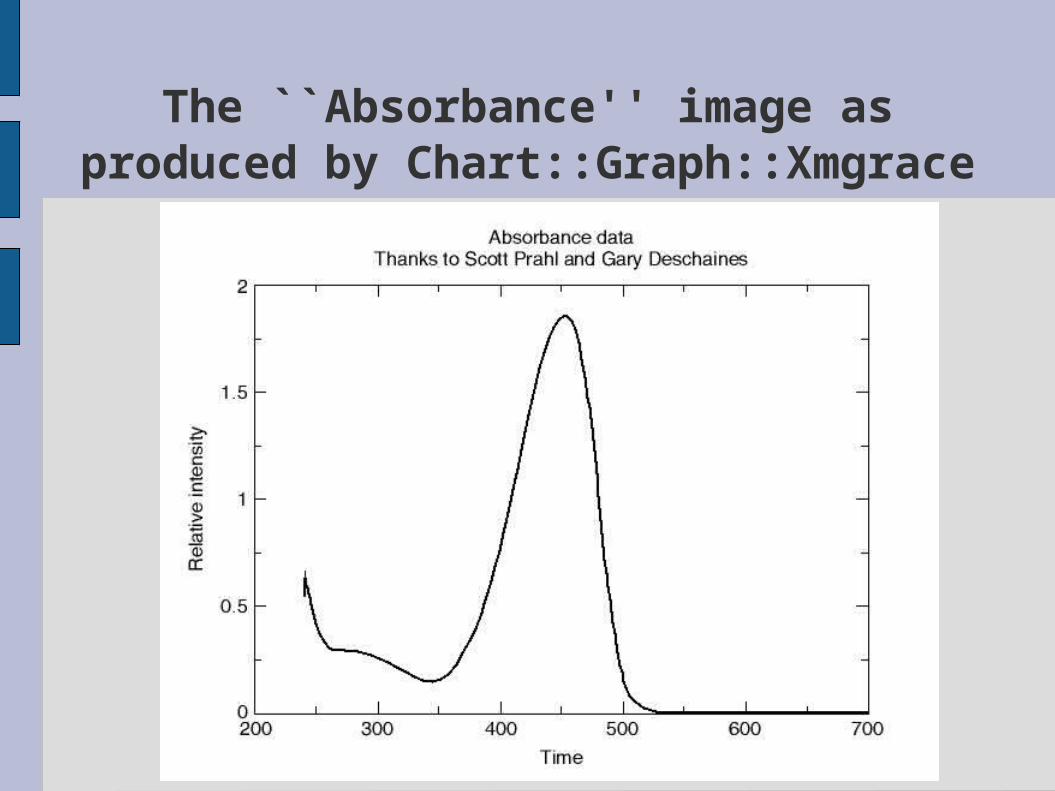
The ``Absorbance'' image as produced by Chart::Graph::Xmgrace
figPERLGRACE.eps
Where To From Here