Data Summary: Stillaguamish River Watershed … D e p a r t m e n t o f E c o l o g y R e p o r t...
73
A D e p a r t m e n t o f E c o l o g y R e p o r t Data Summary: Stillaguamish River Watershed Fecal Coliform, Dissolved Oxygen, pH, Mercury, and Arsenic Total Maximum Daily Load Study Abstract This report provides a summary of the field measurements and laboratory data collected by the Washington State Department of Ecology between August 2000 and November 2001 for the Stillaguamish River Watershed Fecal Coliform, Dissolved Oxygen, pH, Mercury, and Arsenic Total Maximum Daily Load Study. The data included in this report were used to recommend total maximum daily load (TMDL) pollutant limitations for the Stillaguamish River basin (Joy, 2004). August 2004 Waterbody Numbers (see Table 1) Publication No. 04-03-037
Transcript of Data Summary: Stillaguamish River Watershed … D e p a r t m e n t o f E c o l o g y R e p o r t...

A D e p a r t m e n t o f E c o l o g y R e p o r t
Data Summary: Stillaguamish River Watershed Fecal Coliform, Dissolved Oxygen, pH, Mercury, and Arsenic Total Maximum Daily Load Study
Abstract This report provides a summary of the field measurements and laboratory data collected by the Washington State Department of Ecology between August 2000 and November 2001 for the Stillaguamish River Watershed Fecal Coliform, Dissolved Oxygen, pH, Mercury, and Arsenic Total Maximum Daily Load Study. The data included in this report were used to recommend total maximum daily load (TMDL) pollutant limitations for the Stillaguamish River basin (Joy, 2004).
August 2004 Waterbody Numbers (see Table 1) Publication No. 04-03-037
Publication Information
This report is available on the Department of Ecology home page on the World Wide Web at http://www.ecy.wa.gov/biblio/0403037.html For a printed copy of this report, contact the Department of Ecology Publications Distribution Office and ask for publication number 04-03-037.
E-mail: [email protected] Phone: (360) 407-7472 Address: PO Box 47600, Olympia WA 98504-7600
Author: Joe Joy, Sarah Coffler, and Kimberlie Gridley Washington State Department of Ecology Environmental Assessment Program E-mail: [email protected] Phone: (360) 407-6486
Address: PO Box 47600, Olympia WA 98504-7600
The parent publication, Stillaguamish River Watershed Fecal Coliform, Dissolved Oxygen, pH, Mercury, and Arsenic Total Maximum Daily Load Study, is available on the Web at http://www.ecy.wa.gov/biblio/0403017.html. For a printed copy, ask for publication number 04-03-017.
Any use of product or firm names in this publication is for descriptive purposes only and does not imply endorsement by the author or the Department of Ecology.
The Department of Ecology is an equal-opportunity agency and does not discriminate on the basis of race, creed, color, disability, age, religion, national origin, sex, marital status, disabled-veteran’s status, Vietnam-era veteran’s status, or sexual orientation.
If you have special accommodation needs or require this document in alternative format, contact Joan LeTourneau at 360-407-6764 (voice) or 1-800-833-6388 (TTY).
Page 2
Table of Contents
Abstract ....................................................................................................................................... 1 Acronyms.................................................................................................................................... 4 Introduction................................................................................................................................. 5 Study Design............................................................................................................................... 8 Methods .................................................................................................................................... 14 Data Quality .............................................................................................................................. 16 Results....................................................................................................................................... 19 References................................................................................................................................. 20
Appendix A. Class AA and Class A Designation and Water Quality Standards ..................... 21 Appendix B. Data Qualifiers used by Manchester Environmental Laboratory........................ 25 Appendix C. Field and Laboratory Data for the Stillaguamish River Watershed Fecal Coliform, Dissolved Oxygen, pH, Mercury, and Arsenic TMDL ............. 27 Appendix D. Diel Survey Data for the Stillaguamish River Watershed Fecal Coliform, Dissolved Oxygen, pH, Mercury, and Arsenic TMDL....................................... 67
List of Figures Figure 1. A map of the Stillaguamish River basin including Port Susan. ..................................... 6 Figure 2. Stillaguamish River TMDL monitoring sites in the lower river basin including the
Old Channel and mainstem of the Stillaguamish River. .............................................. 11 Figure 3. Stillaguamish River TMDL monitoring sites along the mainstem of the
Stillaguamish River. ..................................................................................................... 12 Figure 4. Stillaguamish River TMDL monitoring sites along the North and South forks of
the Stillaguamish River. ............................................................................................... 13 Figure 5. A comparison of dissolved oxygen field meter readings and associated Winkler
titration results.............................................................................................................. 16 List of Tables Table 1. Waterbodies and parameters on the 1998 Section 303(d) list included in the
Stillaguamish River TMDL field studies. ...................................................................... 7
Table 2: Surveys conducted by Ecology between August 2000 and November 2001 for the Stillaguamish River TMDL study. ................................................................................. 9
Table 4. Streamflow gages used to estimate flows at selected sites included in the Stillaguamish River TMDL study. ............................................................................... 14
Table 5. Methods and data quality objectives used in the Stillaguamish River TMDL study... 15
Table 6. A summary of the field sampling and laboratory precision data for the Stillaguamish River TMDL.......................................................................................... 17
Page 3

Acronyms BOD biochemical oxygen demand ˚C degrees centigrade cfs cubic feet per second cfu colony forming units DO dissolved oxygen DOC dissolved organic carbon FC fecal coliform LCS laboratory control sample MEL Manchester Environmental Laboratory MF membrane filter technique mg/L milligrams per liter mL milliliter MPN most probable number NH3 ammonia nitrogen N-N nitrite-nitrate nitrogen OP orthophosphate phosphorus ppt parts per thousand QA quality assurance RSD relative standard deviation TMDL Total Maximum Daily Load TNVSS total non-volatile suspended solids TOC total organic carbon TP total phosphorus TPN total persulfate nitrogen TSS total suspended solids umhos/cm micromhos per centimeter USEPA United States Environmental Protection Agency USGS United States Geological Survey VOM volatile organic matter WAC Washington State Administrative Code WBID Waterbody Identification WDFW Washington Department of Fish and Wildlife WRIA Water Resource Inventory Area WWTP wastewater treatment plant #/100mL number of colonies per 100 milliliters ug/L micrograms per liter
Page 4

Introduction The Stillaguamish basin of western Washington State drains approximately 684 square miles from the Cascade Range to Port Susan of central Puget Sound (Figure 1). Two major forks, the North and South forks, come together at river mile 17.8 near the city of Arlington. At river mile 2.75, the Stillaguamish River splits into the Old Stillaguamish River Channel and Hatt Slough. Over 70 years ago, flow was redirected from the Old Channel to Hatt Slough following a series of floods and the release of several logjams. Hatt Slough is now the primary channel to Port Susan, and the Old Channel seasonally oscillates between functioning as a tidal slough during the dry season and a conduit for river discharge during the wet season. Granite Falls (population est. 1,737) and Darrington (population est. 1,245) are located in the upper basin. Arlington (population est. 7,275) and Stanwood (population est. 3,345) are located in the lower basin, as is Interstate 5. Land use ranges from managed forest land in the upper basin to residential, business, and agricultural properties in the lower basin.
Page 5

Figure 1. A map of the Stillaguamish River basin including Port Susan.
Page 6

Water Quality Issues Chapter 173-201A of the Washington State Administrative Code (WAC) establishes water quality standards for surface waters in the state. Classifications are assigned based on general characteristics, characteristic uses, and water quality criteria. The mainstem of the Stillaguamish River, Old Stillaguamish Channel, and associated tributaries are designated as Class A waters. The North Fork Stillaguamish River and associated tributaries to Squire Creek at river mile 31.2 are also designated as Class A waters. Above Squire Creek, the North Fork and associated tributaries are designated as Class AA. The South Fork Stillaguamish River and associated tributaries to Canyon Creek at river mile 33.7 are designated as Class A waters. Above Canyon Creek, the South Fork and associated tributaries are designated as Class AA waters. Port Susan is designated as a Class A marine waterbody. In 1996 and 1998 the Washington State Department of Ecology (Ecology) listed several rivers and streams in the Stillaguamish River basin under Section 303(d) of the federal Clean Water Act as not meeting water quality standards for fecal coliform bacteria, dissolved oxygen, pH, arsenic, ammonia, lead, copper, and nickel (Table 1). Water quality criteria associated with Class AA and A waters are outlined in Appendix A. Table 1. Waterbodies and parameters on the 1998 Section 303(d) list included in the Stillaguamish River TMDL field studies.
Old WBID
New WBID Name Parameters
HD76OJ Harvey Ck. Fecal Coliform JU33JU Jim Ck. Fecal Coliform WA-05-1012 GH05SX Jorgenson Slough (Church Ck.) Fecal Coliform IJ55EP Martha Lake Ck. Fecal Coliform QE93BW Old Stillaguamish R. Fecal Coliform, Ammonia, Lead, Copper, Nickel WA-05-1018 VJ74AO Pilchuck Ck. Dissolved Oxygen WA-PS-0020 390KRD Port Susan Fecal Coliform WA-05-1015 OT80TY Portage Ck. Fecal Coliform, Dissolved Oxygen, Turbidity WA-05-1015 YF03BC Portage Ck. Fecal Coliform, Dissolved Oxygen WA-05-1015 QJ28UC Portage Ck. Fecal Coliform, Dissolved Oxygen WA-05-1010 QE93BW Stillaguamish R. Fecal Coliform, Dissolved Oxygen, Arsenic WA-05-1010 ZO73WL Stillaguamish R. (Hatt Slough) Fecal Coliform, Dissolved Oxygen WA-05-1020 WO38N
V North Fork Stillaguamish R. Fecal Coliform
WA-05-1050 SN06ZT South Fork Stillaguamish R. Fecal Coliform, pH, Dissolved Oxygen LU17DC Unnamed Ck. #0456 Fecal Coliform
From 2000 to 2001 the Washington State Department of Ecology conducted a total maximum daily load (TMDL) study in the basin to determine if the Stillaguamish River, its tributaries, and Port Susan were in compliance with water quality standards. Ecology completed surveys in the study area between August 2000 and November 2001. The surveys were coordinated with
Page 7

existing monitoring programs when possible. Data generated by Ecology and credible outside sources were incorporated into the TMDL study. This report will focus on the data from the Ecology TMDL surveys. Information about data from other sources can be found in the following publications or websites: • Continuous stream discharge data collected by Ecology for the TMDL surveys were
reported by C. Springer in: Flow Summary for Gaging Stations on the Stillaguamish River and Selected Tributaries, May through October 2001. Publication No. 03-03-019. http://www.ecy.wa.gov/biblio/0303019.html.
• Continuous discharge data collected by the U.S. Geological Survey is available at their
National Water Information System (NWIS) website http://wa.water.usgs.gov/data/realtime/nwisweb.htm.
• Ecology Freshwater Ambient Monitoring Program data for sites in the Stillaguamish
River basin can be found at http://www.ecy.wa.gov/programs/eap/fw_riv/rv_main.html. • Freshwater water quality monitoring data collected by the Stillaguamish Tribe can be
viewed at http://www.stillaguamish.nsn.us/Water%20Quality%20Data%20Summary.pdf. • Snohomish County Surface Water Management water quality monitoring data were
reported by K. Thornburg and G. Williams in: State of the Waters, 2000: Water Quality in Snohomish County Rivers, Streams and Lakes. The publication is available online at: http://www.co.snohomish.wa.us/publicwk/swm/wq/publications/stateofwater.htm.
• Snohomish County Surface Water Management monitoring data are available online at:
http://198.238.192.103/spw_swhydro/index.asp. • Tulalip Tribes have produced several reports on Stillaguamish basin water quality since
1991. The reports are available from: Tulalip Natural Resources 7615 Totem Beach Rd. Marysville, WA 98271 or at [email protected].
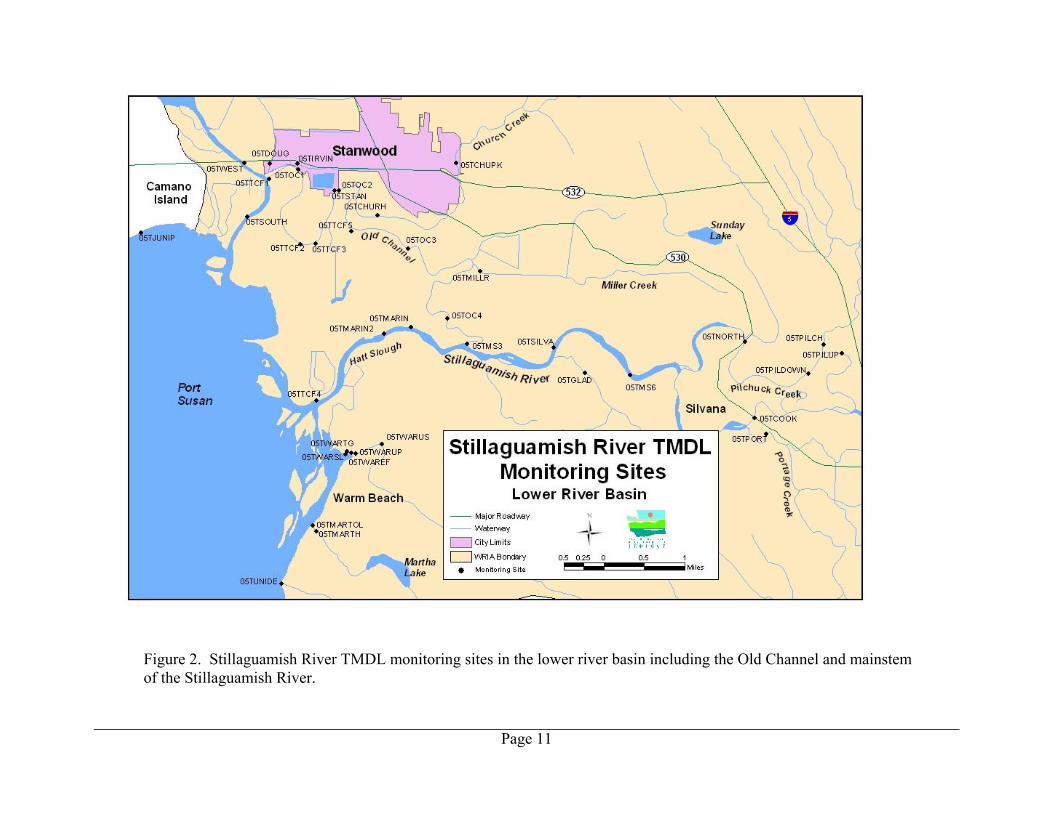
Study Design Fifty-seven TMDL monitoring sites were distributed throughout the Stillaguamish River basin and along Port Susan (Figures 2-4). The primary geographic focus of the surveys was the lower basin along the mainstem Stillaguamish River and the east shore of Port Susan. Field surveys focused on the following subjects: • Diel changes in dissolved oxygen and pH. • The effects of nutrients on aquatic productivity. • Verification of metals concentrations. • Water quality response to storm events and low-flow conditions. • Monthly variability in indicator bacteria at freshwater recreational areas. • Bacteria loads in Port Susan tributaries.
Page 8
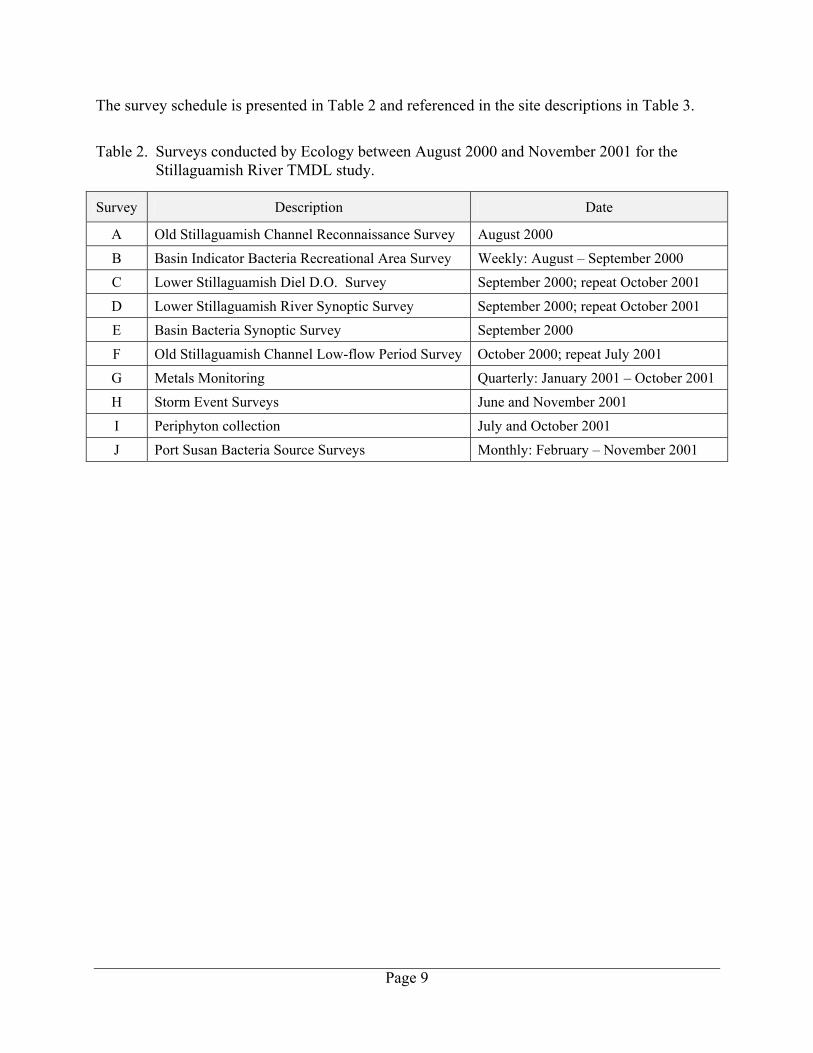
The survey schedule is presented in Table 2 and referenced in the site descriptions in Table 3. Table 2. Surveys conducted by Ecology between August 2000 and November 2001 for the
Stillaguamish River TMDL study.
Survey Description Date
A Old Stillaguamish Channel Reconnaissance Survey August 2000 B Basin Indicator Bacteria Recreational Area Survey Weekly: August – September 2000 C Lower Stillaguamish Diel D.O. Survey September 2000; repeat October 2001 D Lower Stillaguamish River Synoptic Survey September 2000; repeat October 2001 E Basin Bacteria Synoptic Survey September 2000 F Old Stillaguamish Channel Low-flow Period Survey October 2000; repeat July 2001 G Metals Monitoring Quarterly: January 2001 – October 2001 H Storm Event Surveys June and November 2001 I Periphyton collection July and October 2001 J Port Susan Bacteria Source Surveys Monthly: February – November 2001
Page 9

Page 10
Table 3. Stillaguamish River TMDL study site descriptions.
Station I D2 Station Name Latitude Longitude
River Mile
River Kilometer Survey/s
05TARLIN Arlington WWTP effluent 48.2031 122.1279 - - C, D, E, H05TARMST Armstrong Creek at the hatchery gaging station 48.2184 122.1362 1.0 1.6 E, H05TCHUPK Church Creek at the park off Lindstrom Road 48.2413 122.3257 2.1 3.4 B05TCHURH Church Creek/Jorgenson Slough at Marine Drive 48.2312 122.3466 0.5 0.8 A, F, G, H05TCONFL 1 Confluence of North and South forks of the Stillaguamish River at Hwy. 9 48.2037 122.1286 17.8 28.6 C, D, E, I05TCOOK Cook Slough at Hwy. 530 bridge near Silvana 48.1966 122.2438 7.8 12.6 C, D, E, H05TDOUG 4 Douglas Slough south of Hwy. 532 48.2399 122.3759 0.1 0.2 A, F, H05TGLAD Glade Bekken at Silvana Terrace Road 48.2045 122.2902 0.5 0.8 C, D, E, H05THARAR Mouth of Harvey Armstrong Creek 48.2105 122.1511 0.1 0.2 C, D, E05TIRVIN Irvine Slough at dike pump station 48.2406 122.3689 0.1 0.2 A, F, H05TJIMCK Jim Creek at Jordan Road 48.1988 122.0938 0.1 0.2 H05TJUNIP Juniper Beach off Juniper Beach Road on Camano Island 48.2279 122.4082 - - J05TKACK Kackman Creek at 252nd Street NE 48.2246 122.1616 0.9 1.4 E, H05TMAR1 March Creek at Mouth 48.1929 122.1639 0.1 0.2 C, D, E05TMARIN 2 Mainstem Stillaguamish River at Hat Slough off Marine Drive 48.2109 122.3378 1.9 3.1 C, D, E, G, H, I05TMARIN2 Mainstem Stillaguamish River at Hat Slough boat launch 48.2114 122.3391 1.7 2.7 B05TMARSH Mouth of March Creek at 220th Street NE 48.1927 122.1655 0.9 1.4 H05TMARTH Martha Lake Creek at Soundview Drive 48.1743 122.3609 0.1 0.2 I05TMARTO L
4 Martha Lake Creek outlet to Warm Beach 48.1754 122.3622 0.0 0.0 I05TMILLR Miller Creek at Miller Road 48.2216 122.3179 0.2 0.2 A, F, H05TMIXZ O05TMS3
Mainstem Stillaguamish River below Arlington WWTP outfall 48.2030 122.1316 17. 62.8
28. 34.4
C, D, IMainstem Stillaguamish River at Old Channel diversion 48.2087 122.3225 C, D, E
05TMS6 Mainstem Stillaguamish River below Silvana 48.2034 122.2765 5.7 9.2 C, D, E05TMS11 1,
05TMS12 2 Mainstem Stillaguamish River at Interstate 5 bridge 48.1970 122.2107 11.2 17.9 C, D, E, G, H
Mainstem Stillaguamish River at WDFW access 48.1991 122.1931 12.1 19.5 I05TMS13 1 Mainstem Stillaguamish River below March Creek 48.1916 122.1823 12.9 20.8 C, D, E05TMS15 1 Mainstem Stillaguamish River below Armstrong Creek 48.2072 122.1544 14.9 24.0 C, D, E05TMS17 Mainstem Stillaguamish River at Dike Road 48.1999 122.1481 17.0 27.4 C, D, E, H05TNFCIC 2,
3
North Fork Stillaguamish River at Cicero bridge 48.2679 122.0135 9.5 15.3 E, G, H
05TNFCPO 22 North Fork Stillaguamish River at C-Post Bridge 48.2829 121.8304 21.0 33.8 E, H
05TNFTWI Mouth of the North Fork Stillaguamish River at Twin Rivers Park 48.2038 122.1274 0.1 0.2 B, C, D, E, H05TNFWHI 2 North Fork Stillaguamish River at Whitman Road bridge 48.2722 121.8879 17. 6
7.5 28.3 B, E, H
05TNORTH North branch of the mainstem Stillaguamish River at Hwy. 530 bridge 48.2103 122.2470 12. 12.3
C, D, E, H05TOC1 Old Stillaguamish River Channel near Irvine Slough 48.2394 122.3684 1.4 A, F, H05TOC2 Old Stillaguamish River Channel above the Stanwood WWTP outfall 48.2361 122.3564 3.4 5.5 A, F, H05TOC3 Old Stillaguamish River Channel at the Marine Drive bridge 48.2257 122.3382 5.1 8.2 A, F, G, H05TOC4 Old Stillaguamish River Channel at the Norman Road bridge 48.2132 122.3268 7.4 11.9 A, F, H05TPILCH 2 Pilchuck Creek at Jackson Gulch Road 48.2101 122.2255 0.1 0.2 C, D, E, H05TPILDOWN Downstream of the mouth of Pilchuck Creek in North Stillaguamish Slough 48.2049 122.2281 9.3 15.0 D0TPILUP Upstream of the mouth of Pilchuck Creek in North Stillaguamish Slough 48.2085 122.2195 9.5 15.3 D05TPORT 2 Portage Creek at the 212th Street bridge 48.1885 122.2335 1.1 1.8 C, D, E, H05TSFGRA 2 South Fork Stillaguamish below Granite Falls 48.0959 121.9739 33.5 53.9 E, H05TSFJOR 2 South Fork Stillaguamish at Jordan walkway bridge 48.1475 122.0386 26.1 42.0 B, E, H05TSFTW I05TSILVA
2 Mouth of the South Fork Stillaguamish River at Twin Rivers Park 48.2036 122.1273 0.1 0.2 B, C, D, E, G, HMainstem Stillaguamish River below ilvana off Norman Road SSouth Pass at the end of Eide Road
48.2083 122.2835 4.6 7.4 H05TSOUTH
4 48.2261 122.3857 0.5 0.8 A, F, H, I05TSTAN Stanwood WWTP effluent 48.2362 122.3577 - - A, F, H05TTCF1 Twin City Foods Drain # 1 at dike 48.2382 122.3761 0.1 0.2 A, F, H, I05TTCF2 Twin City Foods Drain # 2 on Thomle Road 48.2261 122.3670 0.1 0.2 A, F, H05TTCF3 4 Twin City Foods Drain # 3 on Thomle Road 48.2264 122.3627 0.1 0.2 A, F, H05TTCF4 Twin City Foods Drain # 4 to Hat Slough 48.1983 122.3626 0.1 0.2 C, D, I05TTCF5 Twin City Foods Drain # 5 at footbridge above Thomle Road 48.2289 122.3524 0.2 0.3 A, F, H05TUNIDE Unnamed Creek #0456 at the end of Soundvi w Drivee
Warm Beach WWTP effluent at Wa m Beach 48.1647 122.3691 0.1 0.2 I
05TWAREF rPump pond slough at Warm Beach
48.1885 122.3501 - - I05TWARSL 48.1886 122.3527 0.0 0.0 I05TWARTG Field ditch to pump pond at Warm Beach 48.1889 122.3520 0.1 0.2 I05TWARUP Warm Beach Creek upstream of WWTP outfall 48.1887 122.3496 0.2 0.3 I05TWARU S0 TWEST
Warm Beach Creek above camp stables 48.1901 122.3446 0.5 0.8 I5
1 West pass of Old Stillaguamish River Channel at Hwy. 532 bridge in Stanwood 48.2399 122.3854 1.0 1.6 A, F, HC
2 ontinuously recording probe deployed at these sites for Survey C. E.
3 coli sampled at these sites in addition to fecal coliform and enterococcus. S
4 amples taken at 05TNFTWI on 6/12/2001 and 10/3/2001. Sampled during June 2001 storm event only.
Page 11
Figure 2. Stillaguamish River TMDL monitoring sites in the lower river basin including the Old Channel and mainstem of the Stillaguamish River.
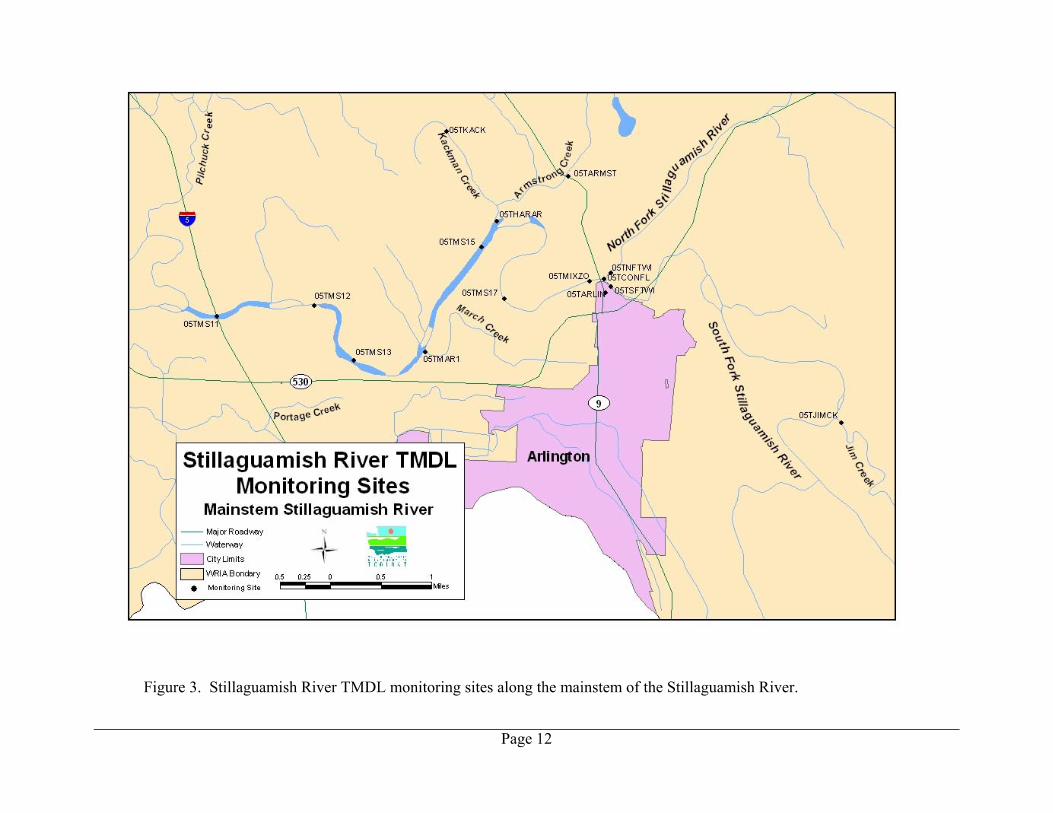
Figure 3. Stillaguamish River TMDL monitoring sites along the mainstem of the Stillaguamish River.
Page 12

Figure 4. Stillaguamish River TMDL monitoring sites along the North and South forks of the Stillaguamish River.
Page 13
Methods Field Streamflow gages were used to estimate flows at four sites. The location and operator of each gage are listed in Table 4. Table 4. Streamflow gages used to estimate flows at selected sites included in the Stillaguamish River TMDL study.
Location Operator South Fork Stillaguamish at River Bend Park Ecology North Fork Stillaguamish at Cicero bridge (05TNFCIC) USGS Mainstem Stillaguamish at Interstate 5 (05TMS11) USGS & Snohomish County Armstrong Creek at hatchery gaging station (05TARMST) Ecology
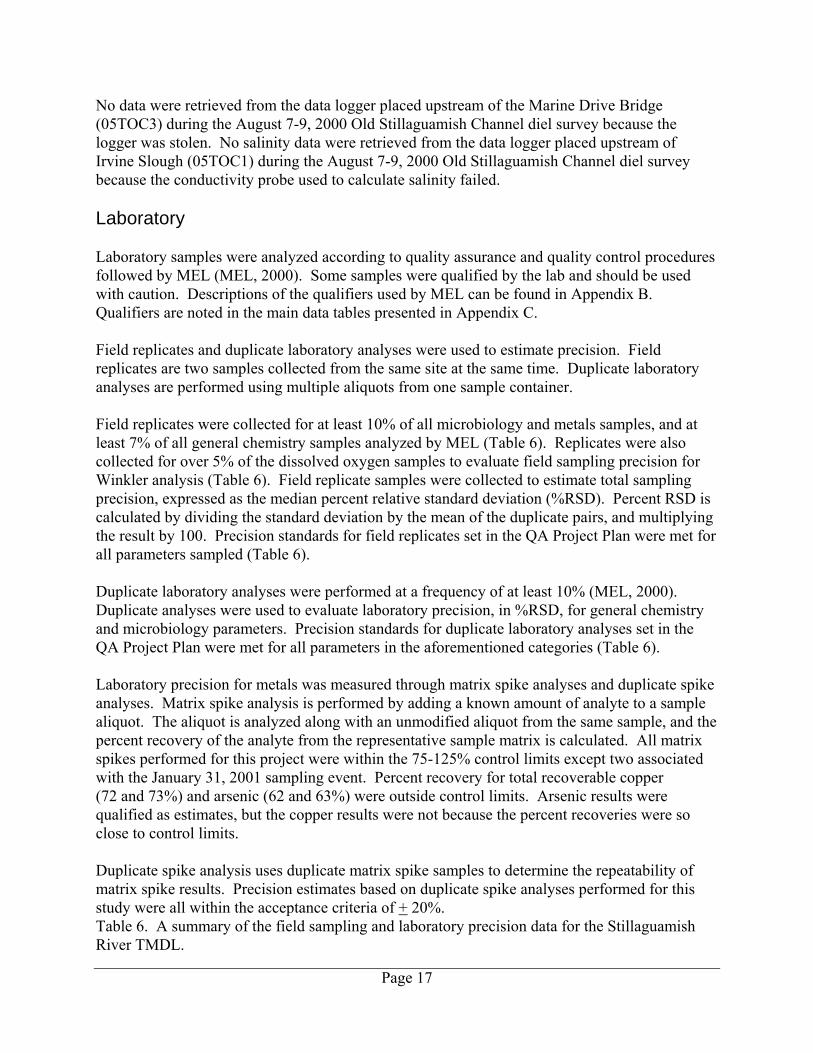
Field measurements, methods, and associated data quality objectives are outlined in Table 5. Further description of the field methods employed in the TMDL can be found in the Quality Assurance (QA) Project Plan (Joy, 2001). Four diel surveys were conducted using multi-probe data loggers. Loggers were anchored in place at three to four sites to monitor temperature, dissolved oxygen, pH, and conductivity every 15 minutes for approximately 48 hours. Two surveys were conducted in the Lower Stillaguamish River in September 2000 and October 2001 to examine the daily ranges of the monitored parameters, with a focus on minimum dissolved oxygen concentrations. Two other surveys were conducted in the Old Channel of the Stillaguamish River in August 2000 and July 2001 to monitor changes in water quality over tidal and daily periods. The results of the surveys are depicted in Appendix D. Laboratory Laboratory analyses, methods, and associated data quality objectives are outlined in Table 5. Manchester Environmental Laboratory (MEL) standard protocols were used for sample collection, preservation, and handling (MEL, 1994). USEPA protocols for sampling ambient water trace metals using two people were followed for metals sample collection and handling (USEPA, 1995). Containers and filters were pre-cleaned and supplied by MEL. All samples were stored in the dark, on ice, and transported to MEL within 24 hours of collection. Chain-of-custody signatures were not required during transport because samples were always within the possession of Ecology personnel or Greyhound Line employees.
Page 14
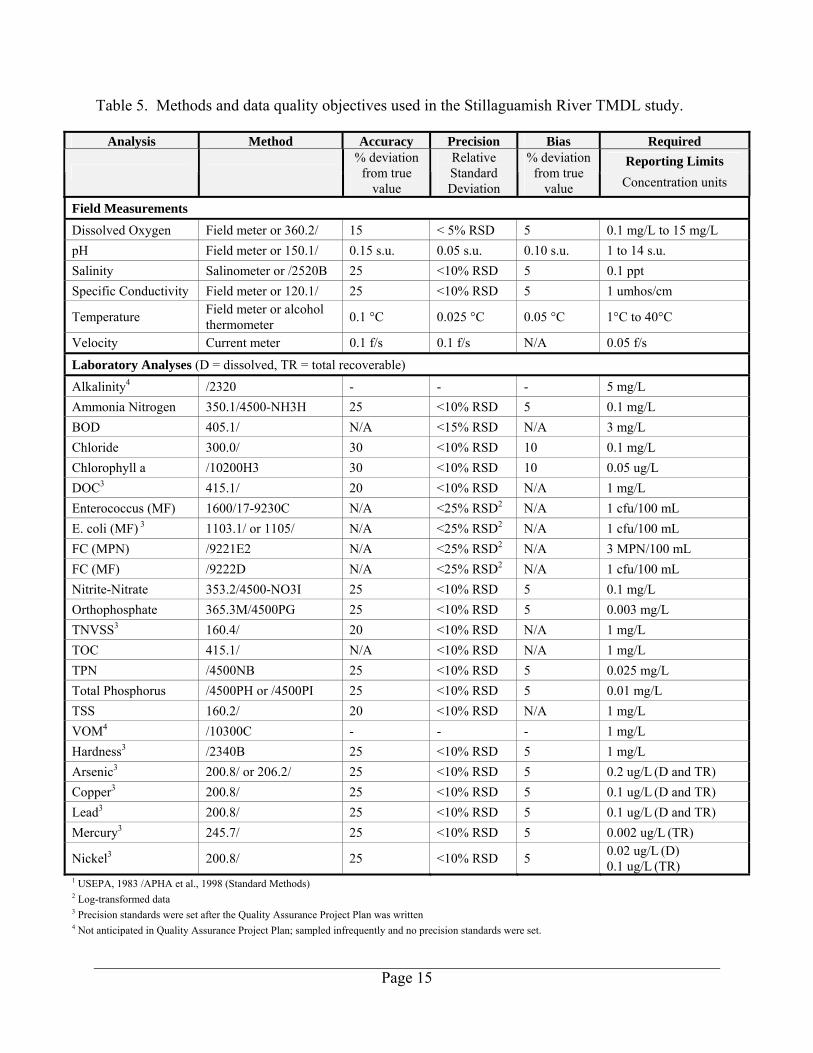
Table 5. Methods and data quality objectives used in the Stillaguamish River TMDL study.
Analysis Method Accuracy Precision Bias Required Reporting Limits
% deviation
from true value
Relative Standard Deviation
% deviation from true
value Concentration units
Field Measurements Dissolved Oxygen Field meter or 360.2/ 15 < 5% RSD 5 0.1 mg/L to 15 mg/L pH Field meter or 150.1/ 0.15 s.u. 0.05 s.u. 0.10 s.u. 1 to 14 s.u. Salinity Salinometer or /2520B 25 <10% RSD 5 0.1 ppt Specific Conductivity Field meter or 120.1/ 25 <10% RSD 5 1 umhos/cm
Temperature Field meter or alcohol thermometer 0.1 °C 0.025 °C 0.05 °C 1°C to 40°C
Velocity Current meter 0.1 f/s 0.1 f/s N/A 0.05 f/s
Laboratory Analyses (D = dissolved, TR = total recoverable) Alkalinity4 /2320 - - - 5 mg/L Ammonia Nitrogen 350.1/4500-NH3H 25 <10% RSD 5 0.1 mg/L BOD 405.1/ N/A <15% RSD N/A 3 mg/L Chloride 300.0/ 30 <10% RSD 10 0.1 mg/L Chlorophyll a /10200H3 30 <10% RSD 10 0.05 ug/L DOC3 415.1/ 20 <10% RSD N/A 1 mg/L Enterococcus (MF) 1600/17-9230C N/A <25% RSD2 N/A 1 cfu/100 mL E. coli (MF) 3 1103.1/ or 1105/ N/A <25% RSD2 N/A 1 cfu/100 mL FC (MPN) /9221E2 N/A <25% RSD2 N/A 3 MPN/100 mL FC (MF) /9222D N/A <25% RSD2 N/A 1 cfu/100 mL Nitrite-Nitrate 353.2/4500-NO3I 25 <10% RSD 5 0.1 mg/L Orthophosphate 365.3M/4500PG 25 <10% RSD 5 0.003 mg/L TNVSS3 160.4/ 20 <10% RSD N/A 1 mg/L TOC 415.1/ N/A <10% RSD N/A 1 mg/L TPN /4500NB 25 <10% RSD 5 0.025 mg/L Total Phosphorus /4500PH or /4500PI 25 <10% RSD 5 0.01 mg/L TSS 160.2/ 20 <10% RSD N/A 1 mg/L VOM4 /10300C - - - 1 mg/L Hardness3 /2340B 25 <10% RSD 5 1 mg/L Arsenic3 200.8/ or 206.2/ 25 <10% RSD 5 0.2 ug/L (D and TR) Copper3 200.8/ 25 <10% RSD 5 0.1 ug/L (D and TR) Lead3 200.8/ 25 <10% RSD 5 0.1 ug/L (D and TR) Mercury3 245.7/ 25 <10% RSD 5 0.002 ug/L (TR)
Nickel3 200.8/ 25 <10% RSD 5 0.02 ug/L (D) 0.1 ug/L (TR)
1 USEPA, 1983 /APHA et al., 1998 (Standard Methods) 2 Log-transformed data
3 Precision standards were set after the Quality Assurance Project Plan was written
4 Not anticipated in Quality Assurance Project Plan; sampled infrequently and no precision standards were set.
Page 15

Data Quality Field Multi-probe meters, data loggers, and flow meters were calibrated according to Ecology’s Environmental Assessment Program protocols and manufacturer instructions (WAS, 1993). Calibration checks were conducted during and after sampling events to monitor multi-probe meter performance. Known pH and conductivity standards, and an alcohol thermometer, were used to assess the accuracy of the pH, conductivity, and temperature probes, respectively. Azide-modified Winkler titrations of randomly collected dissolved oxygen samples were used to assess the accuracy of the dissolved oxygen probe (Figure 5). Field meter data compared favorably to Winkler titration results (Figure 5).
Dissolved Oxygen: Field meter vs. Winkler titration
y = 0.8818x + 0.9757R2 = 0.929
0
2
4
6
8
10
12
14
16
18
20
0 2 4 6 8 10 12 14 16 18 20
Field meter reading (mg/L)
Win
kler
titr
atio
n (m
g/L)
Figure 5. A comparison of dissolved oxygen field meter readings and associated Winkler titration results. Linear regression indicates a coefficient of determination of 0.929.
Field meters were used to evaluate the performance of data loggers. Checks were performed at the beginning, midpoint, and end of logging periods. No pH data were retrieved from the data logger placed near river mile 11 on the mainstem Stillaguamish River (05TMS11) during the October 2-4, 2001 Lower Stillaguamish River diel survey because the pH probe failed.
Page 16
No data were retrieved from the data logger placed upstream of the Marine Drive Bridge (05TOC3) during the August 7-9, 2000 Old Stillaguamish Channel diel survey because the logger was stolen. No salinity data were retrieved from the data logger placed upstream of Irvine Slough (05TOC1) during the August 7-9, 2000 Old Stillaguamish Channel diel survey because the conductivity probe used to calculate salinity failed. Laboratory Laboratory samples were analyzed according to quality assurance and quality control procedures followed by MEL (MEL, 2000). Some samples were qualified by the lab and should be used with caution. Descriptions of the qualifiers used by MEL can be found in Appendix B. Qualifiers are noted in the main data tables presented in Appendix C. Field replicates and duplicate laboratory analyses were used to estimate precision. Field replicates are two samples collected from the same site at the same time. Duplicate laboratory analyses are performed using multiple aliquots from one sample container. Field replicates were collected for at least 10% of all microbiology and metals samples, and at least 7% of all general chemistry samples analyzed by MEL (Table 6). Replicates were also collected for over 5% of the dissolved oxygen samples to evaluate field sampling precision for Winkler analysis (Table 6). Field replicate samples were collected to estimate total sampling precision, expressed as the median percent relative standard deviation (%RSD). Percent RSD is calculated by dividing the standard deviation by the mean of the duplicate pairs, and multiplying the result by 100. Precision standards for field replicates set in the QA Project Plan were met for all parameters sampled (Table 6). Duplicate laboratory analyses were performed at a frequency of at least 10% (MEL, 2000). Duplicate analyses were used to evaluate laboratory precision, in %RSD, for general chemistry and microbiology parameters. Precision standards for duplicate laboratory analyses set in the QA Project Plan were met for all parameters in the aforementioned categories (Table 6). Laboratory precision for metals was measured through matrix spike analyses and duplicate spike analyses. Matrix spike analysis is performed by adding a known amount of analyte to a sample aliquot. The aliquot is analyzed along with an unmodified aliquot from the same sample, and the percent recovery of the analyte from the representative sample matrix is calculated. All matrix spikes performed for this project were within the 75-125% control limits except two associated with the January 31, 2001 sampling event. Percent recovery for total recoverable copper (72 and 73%) and arsenic (62 and 63%) were outside control limits. Arsenic results were qualified as estimates, but the copper results were not because the percent recoveries were so close to control limits. Duplicate spike analysis uses duplicate matrix spike samples to determine the repeatability of matrix spike results. Precision estimates based on duplicate spike analyses performed for this study were all within the acceptance criteria of + 20%. Table 6. A summary of the field sampling and laboratory precision data for the Stillaguamish River TMDL.
Page 17

Parameter n Pairs field
% of Total Field
Median RSD% field
n Pairs lab
Median RSD%
lab
Precision Standard (RSD%)
Alkalinity3 1 9.1 1.13 4 .39 - Ammonia Nitrogen 26 9.6 1.91 18 .17 <10 BOD 9 10.5 0.00 - - <15 Chloride 12 7.1 1.17 19 .56 <10 Chlorophyll a 5 7.7 9.43 11 5.55 <10 Conductivity 1 12.5 0.98 1 0 <10 DO (Winkler titration) 2 12 5.7 0.46 - - - DOC2 2 8.0 3.60 3 3.82 <10 Enterococci (MF) 1 47 12.3 4.09 31 2.89 <25 E. coli (MF)1, 2 15 40.5 3.95 6 1.76 <25 FC (MPN) 1 15 10.8 11.09 0 - <25 FC (MF) 1 47 16.4 2.72 26 3.07 <25 Nitrite-Nitrate 26 9.5 0.71 28 .44 <10 Orthophosphate 25 9.6 2.18 29 0 <10 Salinity 1 9.1 0.00 1 0 <10 TNVSS2 3 9.4 6.43 4 3.21 <10 TOC 13 10.3 1.99 18 3.11 <10 TPN 26 9.5 1.97 30 1.59 <10 Total Phosphorus 26 9.5 4.60 33 2.01 <10 TSS 37 9.4 5.89 39 1.31 <10 VOM3 10 58.8 37.8 2 7.35 - Hardness2 9 12.7 1.78 11 .66 <10 Arsenic (Tot. Rec.) 9 15.5 1.02 - - <10 Arsenic (Dissolved) 9 15.5 0.00 - - <10 Copper (Tot. Rec.) 8 13.8 4.70 - - <10 Copper (Dissolved) 8 13.8 1.97 - - <10 Lead (Tot. Rec.) 8 13.8 0.63 - - <10 Lead (Dissolved) 8 13.8 3.71 - - <10 Mercury (Tot. Rec.) 8 13.8 5.92 8 3.87 <10 Nickel (Tot. Rec.) 8 13.8 4.40 - - <10 Nickel (Dissolved) 8 13.8 3.09 - - <10
1 Log-transformed data 2 Not anticipated in Quality Assurance (QA) Project Plan; precision standards were set after QA Project Plan written. 3 Not anticipated in QA Project Plan; sampled infrequently and no precision standards were set.
Page 18

Metals samples associated with the October 5 and October 17, 2000 sampling events were analyzed during the same time period. MEL used samples from the October 17 sampling event as spikes for the October 5 sampling event. No explanation for the substitution was given. Certified river water reference material for trace metals (SLRS-4, Natural Resource Council of Canada) with values of 0.68 ug/L arsenic, 1.81 ug/L copper, 0.67 ug/L nickel, and 0.086 ug/L lead was used for laboratory control sample (LCS) analyses. One reference material sample was analyzed with each set of metals samples. All LCS recoveries performed for each metal analyzed in this study were within acceptance criteria. Transfer blanks were submitted for each sampling event and analyzed to detect metals contamination arising from sample containers or the filtration process. Bottle blanks were prepared at MEL by filling 500 mL Teflon sample bottles with deionized water. Filter blanks were prepared by filtering half the contents of a bottle blank into a separate sample bottle supplied by the laboratory. Blanks were handled, transported, and analyzed in the same manner as the samples collected during the associated sampling event. No analytically significant levels of the requested metals were detected in the transfer blanks except on two occasions when copper was found in the blanks for total recoverable metals. Blanks associated with the January 31, 2001 sampling event showed detectable levels of copper (0.10 ug/L). All samples associated with the blank had copper levels >10 times the level found in the blank, so no qualification was necessary. Blanks associated with the October 16, 2001 sampling event also indicated copper contamination. Samples were prepared a second time, and copper was still found at 0.10 and 0.15 ug/L. There was insufficient sample for further analyses, so copper results were qualified as estimates. Results Field measurements and laboratory data collected by Ecology for the Stillaguamish River TMDL study are presented in Appendix D under four categories: field data, general chemistry analyses, microbiology analyses, and metals analyses. Graphs depicting the results of the Lower Stillaguamish River diel surveys and the Old Stillaguamish Channel low-flow period diel surveys are found in Appendix D.
Page 19
References APHA et al., 1998. Standard Methods for the Examination of Water and Wastewater. Twentieth edition. American Public Health Association, American Water Works Association, and Water Pollution Control Federation. Washington, D.C. Ecology, 1997. Assessment of Water Quality for the Section 303(d) List. Water Quality Program Policy 1-11, Washington State Department of Ecology, Olympia, WA. Joy, J., 2001. Quality Assurance Project Plan: Stillaguamish River Basin and Port Susan Total Maximum Daily Load Evaluation Update. Washington State Department of Ecology, Olympia, WA. Publication No. 01-03-065. http://www.ecy.wa.gov/biblio/0103065.html Joy, J., 2004. Stillaguamish River Watershed Fecal Coliform, Dissolved Oxygen, pH, Mercury, and Arsenic Total Maximum Daily Load Study. Washington State Department of Ecology, Olympia, WA. Publication No. 04-03-017. http://www.ecy.wa.gov/biblio/0403017.html MEL, 2000. Manchester Environmental Laboratory Users Manual. Fifth Edition. Manchester Laboratory, Washington State Department of Ecology, Manchester, WA. USEPA, 1983. Methods for the Chemical Analysis of Water and Wastes. U.S. Environmental Protection Agency, EPA-600/4-79-020. USEPA Laboratory, Cincinnati, OH. USEPA, 1995. Method 1669: Sampling Ambient Water for Trace Metals at EPA Water Quality Criteria Levels. U.S. Environmental Protection Agency, EPA-821-R-95-034. Office of Water, Washington, D.C. WAS, 1993. Field Sampling and Measurement Protocols for the Watershed Assessments Section. Ecology Manual, Washington State Department of Ecology, Olympia, WA. Publication No. 93-e04. http://www.ecy.wa.gov/biblio/93e04.html
Page 20
Appendix A.
Class AA and Class A Designation and Water Quality Standards
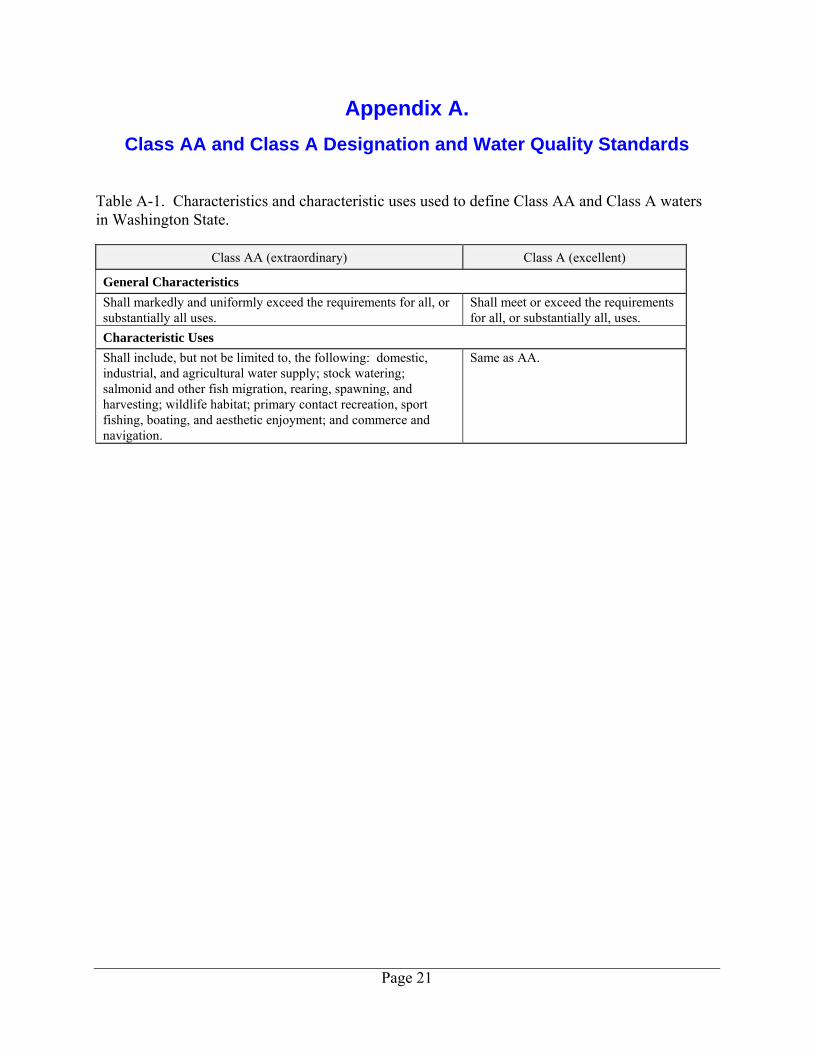
Table A-1. Characteristics and characteristic uses used to define Class AA and Class A waters in Washington State.
Class AA (extraordinary) Class A (excellent)
General Characteristics Shall markedly and uniformly exceed the requirements for all, or substantially all uses.
Shall meet or exceed the requirements for all, or substantially all, uses.
Characteristic Uses Shall include, but not be limited to, the following: domestic, industrial, and agricultural water supply; stock watering; salmonid and other fish migration, rearing, spawning, and harvesting; wildlife habitat; primary contact recreation, sport fishing, boating, and aesthetic enjoyment; and commerce and navigation.
Same as AA.
Page 21

Table A-2. Water quality criteria for Class AA freshwater, Class A freshwater, and Class A marine water in Washington State.
Dissolved Oxygen
Class AA Freshwater Minimum 9.5 mg/L Class A Freshwater Minimum 8.0 mg/L Class A Marine 6.0 mg/L with 95% vertically avg. daily max. salinity > 1 ppt Fecal Coliform
Class AA Freshwater Geometric mean 50 cfu/100 mL 90th percentile value 100 cfu/100 mL* Class A Freshwater Geometric mean 100 cfu/100 mL 90th percentile value 200 cfu/100 mL* Class A Marine Geometric mean 14 cfu/100 mL 90th percentile value 43 cfu/100 mL* Vertically averaged salinity ≥ 10 ppt In Food and Drug Administration (FDA) shellfish harvesting areas Geometric mean 14 MPN/100 mL 90th percentile value 43 MPN/100 mL* pH
Freshwater Maximum 8.5 standard units Minimum 6.5 standard units Marine Maximum 7.0 standard units Minimum 8.5 standard units Ammonia **
Freshwater 4-day average over 3 years 1.35 mg/L as Nitrogen 1-hour average over 3 years 17.9 mg/L as Nitrogen Marine 4-day average over 3 years 0.035 mg/L as Nitrogen 1-hour average over 3 years 0.233 mg/L
Page 22

Table A-2 (cont.)
Dissolved Arsenic
Freshwater Aquatic Toxicity 4-day average over 3 years 190 ug/L 1-hour average over 3 years 360 ug/L Marine Aquatic Toxicity 4-day average over 3 years 36 ug/L; 21 ug/L to prevent non-lethal effects to diatoms 1-hour average over 3 years 69 ug/L; 95% vertically averaged daily maximum salinity >1 ppt Human Health Maximum 0.018 ug/L; consumption of water and organisms Maximum 0.14 ug/L; consumption of organisms only Dissolved Copper
Freshwater Aquatic Toxicity 4-day average over 3 years 2.2 ug/L; at hardness of 15 mg/L as Ca CO3 1-hour average over 3 years 2.8 ug/L; at hardness of 15 mg/L as CaCO3 Marine Aquatic Toxicity 4-day average over 3 years 3.1 ug/L; 95% vertically averaged daily maximum salinity >1 ppt 1-hour average over 3 years 4.8 ug/L; 95% vertically averaged daily maximum salinity >1 ppt Dissolved Lead
Freshwater Aquatic Toxicity 4-day average over 3 years 7.7 ug/L 1-hour average over 3 years 0.3 ug/L Marine Aquatic Toxicity 4-day average over 3 years 8.1 ug/L; 95% vertically averaged daily maximum salinity >1 ppt 1-hour average over 3 years 210 ug/L; 95% vertically averaged daily maximum salinity >1 ppt Mercury
Freshwater Aquatic Toxicity 4-day average over 3 years 0.012 ug/L 1-hour average over 3 years 2.1 ug/L Marine Aquatic Toxicity 4-day average over 3 years 0.025 ug/L; 95% vertically averaged daily maximum salinity > 1 ppt 1-hour average over 3 years 1.8 ug/L; 95% vertically averaged daily maximum salinity > 1 ppt Human Health Maximum 0.14 ug/L; consumption of water and organisms Maximum 0.15 ug/L; consumption of organisms only
Page 23
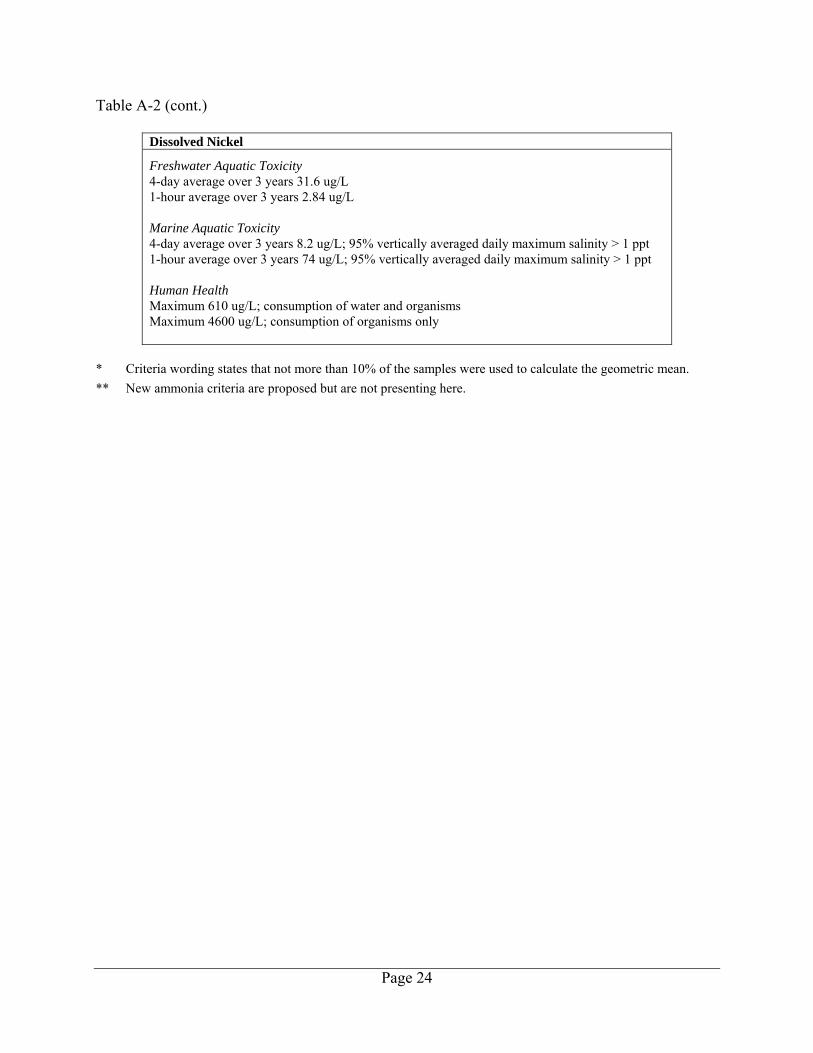
Table A-2 (cont.)
Dissolved Nickel
Freshwater Aquatic Toxicity 4-day average over 3 years 31.6 ug/L 1-hour average over 3 years 2.84 ug/L Marine Aquatic Toxicity 4-day average over 3 years 8.2 ug/L; 95% vertically averaged daily maximum salinity > 1 ppt 1-hour average over 3 years 74 ug/L; 95% vertically averaged daily maximum salinity > 1 ppt Human Health Maximum 610 ug/L; consumption of water and organisms Maximum 4600 ug/L; consumption of organisms only
* Criteria wording states that not more than 10% of the samples were used to calculate the geometric mean. ** New ammonia criteria are proposed but are not presenting here.
Page 24

Appendix B.
Data Qualifiers used by Manchester Environmental Laboratory (adapted from Manchester Environmental Laboratory’s Lab Users Manual, 7th Edition)
Code Definition E Reported result is an estimate because it exceeds the calibration. G Value is greater than result reported; result is a minimum value. J Analyte was positively identified. The associated numerical result is an estimate. N For organic analytes there is evidence the analyte is present in this sample.
For metals analytes the spike sample recovery is not within control limits. NJ There is evidence that the analyte is present. The associated numerical result is an
estimate. NAF Not analyzed for. QNS Quantity not sufficient. REJ Data are unusable for all purposes. U Analyte was not detected at or above the reported result. UJ Analyte was not detected at or above the reported estimated result. Bold Type Analyte was present in the sample. Used as a visual aid to locate detected
compounds on the report sheet.
Page 25

This page is purposely left blank for duplex printing.
Page 26

Appendix C.
Field and Laboratory Data for the Stillaguamish River Watershed Fecal Coliform, Dissolved Oxygen, pH, Mercury, and Arsenic TMDL
Significant figures presented here may vary from recorded values found in Ecology’s Environmental Information Management (EIM) database system.
Page 27
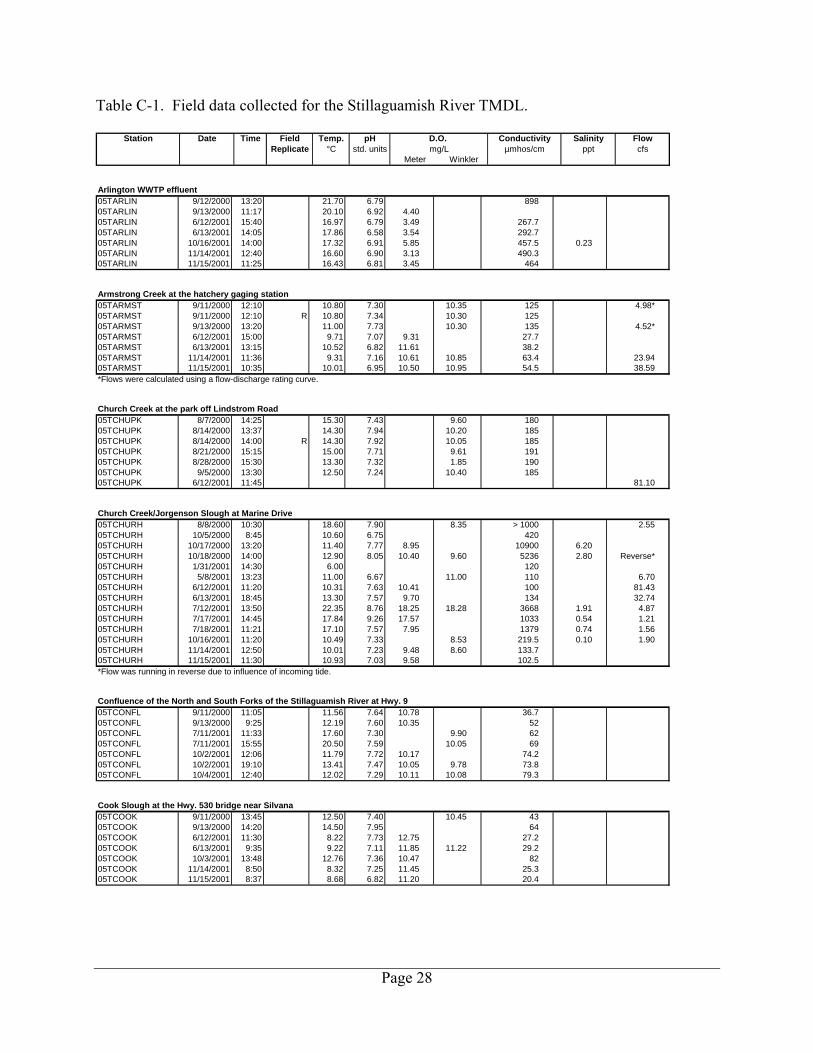
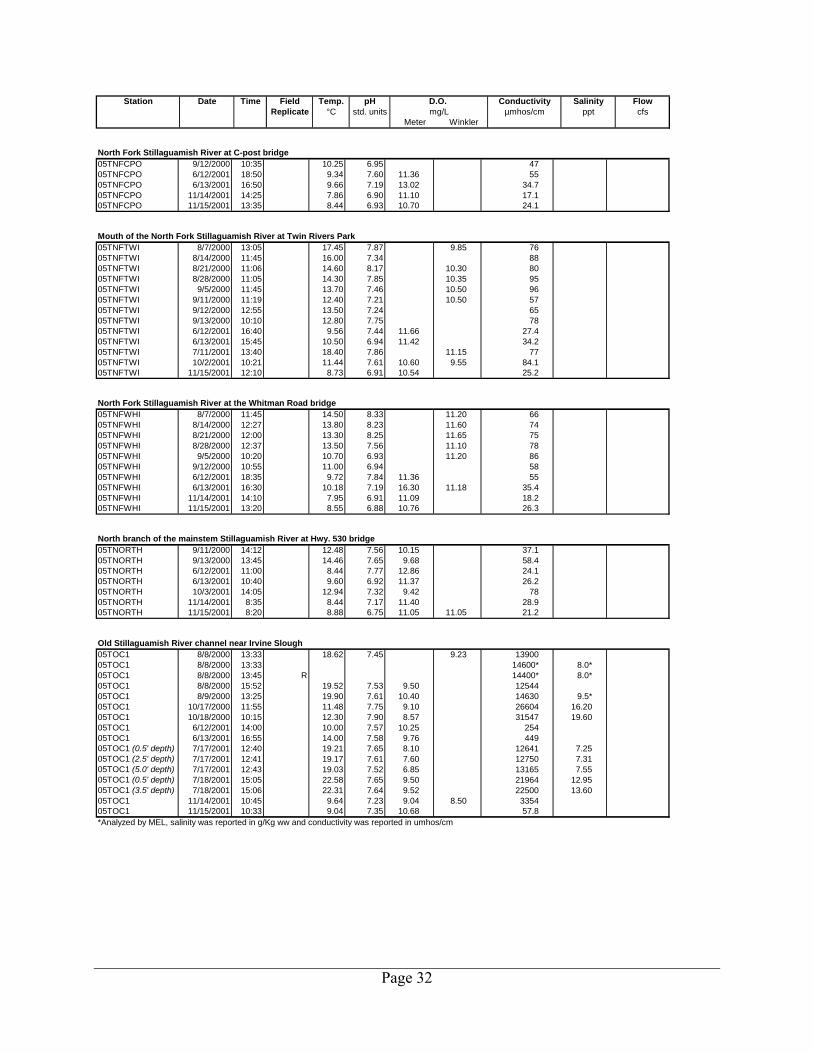
Table C-1. Field data collected for the Stillaguamish River TMDL.
Station Date Time Field Temp. pHReplicate °C std. units
Conductivityµmhos/cm
D.O. mg/L
Meter Winkler
Salinityppt
Flowcfs
Arlington WWTP effluent05TARLIN 9/12/2000 13:20 21.70 6.79 89805TARLIN 9/13/2000 11:17 20.10 6.92 4.4005TARLIN 6/12/2001 15:40 16.97 6.79 3.49 267.705TARLIN 6/13/2001 14:05 17.86 6.58 3.54 292.705TARLIN 10/16/2001 14:00 17.32 6.91 5.85 457.5 0.2305TARLIN 11/14/2001 12:40 16.60 6.90 3.13 490.305TARLIN 11/15/2001 11:25 16.43 6.81 3.45 464 Armstrong Creek at the hatchery gaging station05TARMST 9/11/2000 12:10 10.80 7.30 10.35 125 4.98*05TARMST 9/11/2000 12:10 R 10.80 7.34 10.30 12505TARMST 9/13/2000 13:20 11.00 7.73 10.30 135 4.52*05TARMST 6/12/2001 15:00 9.71 7.07 9.31 27.705TARMST 6/13/2001 13:15 10.52 6.82 11.61 38.205TARMST 11/14/2001 11:36 9.31 7.16 10.61 10.85 63.4 23.9405TARMST 11/15/2001 10:35 10.01 6.95 10.50 10.95 54.5 38.59*Flows were calculated using a flow-discharge rating curve. Church Creek at the park off Lindstrom Road05TCHUPK 8/7/2000 14:25 15.30 7.43 9.60 18005TCHUPK 8/14/2000 13:37 14.30 7.94 10.20 18505TCHUPK 8/14/2000 14:00 R 14.30 7.92 10.05 18505TCHUPK 8/21/2000 15:15 15.00 7.71 9.61 19105TCHUPK 8/28/2000 15:30 13.30 7.32 1.85 19005TCHUPK 9/5/2000 13:30 12.50 7.24 10.40 18505TCHUPK 6/12/2001 11:45 81.10 Church Creek/Jorgenson Slough at Marine Drive05TCHURH 8/8/2000 10:30 18.60 7.90 8.35 > 1000 2.5505TCHURH 10/5/2000 8:45 10.60 6.75 42005TCHURH 10/17/2000 13:20 11.40 7.77 8.95 10900 6.2005TCHURH 10/18/2000 14:00 12.90 8.05 10.40 9.60 5236 2.80 Reverse*05TCHURH 1/31/2001 14:30 6.00 12005TCHURH 5/8/2001 13:23 11.00 6.67 11.00 110 6.7005TCHURH 6/12/2001 11:20 10.31 7.63 10.41 100 81.4305TCHURH 6/13/2001 18:45 13.30 7.57 9.70 134 32.7405TCHURH 7/12/2001 13:50 22.35 8.76 18.25 18.28 3668 1.91 4.8705TCHURH 7/17/2001 14:45 17.84 9.26 17.57 1033 0.54 1.2105TCHURH 7/18/2001 11:21 17.10 7.57 7.95 1379 0.74 1.5605TCHURH 10/16/2001 11:20 10.49 7.33 8.53 219.5 0.10 1.9005TCHURH 11/14/2001 12:50 10.01 7.23 9.48 8.60 133.705TCHURH 11/15/2001 11:30 10.93 7.03 9.58 102.5*Flow was running in reverse due to influence of incoming tide. Confluence of the North and South Forks of the Stillaguamish River at Hwy. 905TCONFL 9/11/2000 11:05 11.56 7.64 10.78 36.705TCONFL 9/13/2000 9:25 12.19 7.60 10.35 5205TCONFL 7/11/2001 11:33 17.60 7.30 9.90 6205TCONFL 7/11/2001 15:55 20.50 7.59 10.05 6905TCONFL 10/2/2001 12:06 11.79 7.72 10.17 74.205TCONFL 10/2/2001 19:10 13.41 7.47 10.05 9.78 73.805TCONFL 10/4/2001 12:40 12.02 7.29 10.11 10.08 79.3 Cook Slough at the Hwy. 530 bridge near Silvana05TCOOK 9/11/2000 13:45 12.50 7.40 10.45 4305TCOOK 9/13/2000 14:20 14.50 7.95 6405TCOOK 6/12/2001 11:30 8.22 7.73 12.75 27.205TCOOK 6/13/2001 9:35 9.22 7.11 11.85 11.22 29.205TCOOK 10/3/2001 13:48 12.76 7.36 10.47 8205TCOOK 11/14/2001 8:50 8.32 7.25 11.45 25.305TCOOK 11/15/2001 8:37 8.68 6.82 11.20 20.4
Page 28

Station Date Time Field Temp. pHReplicate °C std. units
Conductivityµmhos/cm
D.O. mg/L
Meter Winkler
Salinityppt
Flowcfs
Douglas Slough south of Hwy. 53205TDOUG 10/17/2000 12:55 12.40 7.46 4.85 34084 21.3005TDOUG 10/18/2000 12:05 12.80 7.80 3.20 5.40 24220 14.6005TDOUG 6/12/2001 14:20 13.68 7.11 7.90 7.60 7300 0.7505TDOUG 6/12/2001 14:25 R 13.70 7.05 7.85 728005TDOUG 6/13/2001 17:35 19.50 6.79 8.20 10900 6.00 0.1905TDOUG 7/18/2001 10:45 17.85 7.20 6.73 22350 13.40 0.16 Glade Bekken at Silvana Terrace Road05TGLAD 9/11/2000 14:53 13.30 7.59 9.55 17105TGLAD 9/13/2000 14:45 14.30 7.68 9.25 17505TGLAD 6/12/2001 9:30 10.23 7.86 10.70 102 15.2205TGLAD 6/13/2001 11:08 10.93 7.65 10.64 10.25 113 7.3705TGLAD 10/3/2001 15:15 11.77 7.50 9.78 142.105TGLAD 10/4/2001 11:30 0.3505TGLAD 11/14/2001 14:25 9.91 7.29 11.29 9.65 108.2 4.2205TGLAD 11/15/2001 8:20 10.34 7.22 11.30 9.70 101.1 5.13 Mouth of Harvey Armstrong Creek05THARAR 9/11/2000 11:55 11.24 7.49 9.67 12205THARAR 9/13/2000 10:25 10.65 7.44 9.51 129.705THARAR 10/2/2001 13:21 10.04 7.45 10.27 115.8 5.11 Irvine Slough at dike pump station05TIRVIN 8/8/2000 9:55 17.70 6.97 1.60 1000 G05TIRVIN 8/9/2000 14:50 19.72 7.29 3.71 630005TIRVIN 10/17/2000 11:30 11.83 7.86 4.01 1597 0.8005TIRVIN 10/18/2000 10:22 12.70 7.80 2.87 4.40 2800 1.5005TIRVIN 6/12/2001 13:45 11.18 7.31 8.35 242 16.8005TIRVIN 6/13/2001 17:08 16.40 6.60 9.90 78305TIRVIN 7/17/2001 14:20 18.88 6.69 2.10 14100 8.4505TIRVIN 7/18/2001 11:00 18.08 6.77 2.63 2.76 17066 10.00 1.9805TIRVIN 11/14/2001 11:05 10.38 6.73 4.26 163005TIRVIN 11/15/2001 10:20 11.42 6.53 4.79 871 Jim Creek at Jordan Road05TJIMCK 6/12/2001 15:45 10.02 7.38 12.50 10.86 3205TJIMCK 6/13/2001 17:30 11.52 7.20 11.54 38.305TJIMCK 11/14/2001 15:00 8.93 6.94 11.20 26.605TJIMCK 11/15/2001 15:05 9.60 7.08 10.45 39 Juniper Beach off Juniper Beach Road on Camano Island05TJUNIP 3/29/2001 8:40 7.80 10.55 14000 12.5005TJUNIP 4/19/2001 7:15 10.80 8.80 15900 13.2005TJUNIP 5/9/2001 7:45 8.80 9.81 22300 24.9005TJUNIP 6/6/2001 8:50 16.00 8.38 18000 13.8005TJUNIP 6/6/2001 8:55 R 8.4005TJUNIP 7/11/2001 9:40 18.50 8.59 36900 9.1005TJUNIP 8/22/2001 12:00 16.90 8.22 32500 25.0005TJUNIP 9/19/2001 9:00 13.80 6.80 30900 25.1005TJUNIP 10/17/2001 8:50 8.50 8.80 22500 17.2005TJUNIP 11/19/2001 14:15 9.00 10.85 11500 10.00 Kackman Creek on 252nd Street NE05TKACK 9/11/2000 12:43 11.70 6.68 8.90 15205TKACK 9/13/2000 13:35 12.30 7.64 9.00 15805TKACK 6/12/2001 15:15 10.76 6.68 8.23 4305TKACK 6/13/2001 13:25 11.85 6.28 8.08 56.5 4.9805TKACK 11/14/2001 12:10 9.67 6.35 7.54 78.2 2.4605TKACK 11/15/2001 11:00 10.29 6.24 6.55 75.9 3.01 March Creek at mouth05TMAR1 9/11/2000 12:36 13.40 7.21 7.58 18705TMAR1 9/13/2000 11:00 13.57 7.22 7.37 190
Page 29

Station Date Time Field Temp. pHReplicate °C std. units
Conductivityµmhos/cm
D.O. mg/L
Meter Winkler
Salinityppt
Flowcfs
Mainstem Stillaguamish River at Hatt Slough off Marine Drive05TMARIN 9/11/2000 15:27 12.96 7.76 9.98 37.205TMARIN 9/11/2000 15:40 12.90 7.28 10.20 4505TMARIN 9/11/2000 15:40 R 12.90 7.18 10.20 4405TMARIN 9/12/2000 15:40 14.20 7.24 5905TMARIN 9/13/2000 15:15 15.42 7.29 9.47 60.805TMARIN 10/5/2000 10:20 10.10 6.77 6505TMARIN 1/31/2001 13:55 4.50 5405TMARIN 2/27/2001 11:55 5.20 12.75 49 0.0005TMARIN 3/29/2001 11:00 5.90 12.20 3105TMARIN 3/29/2001 11:05 R 12.1005TMARIN 4/19/2001 9:40 7.50 11.60 73 0.0005TMARIN 5/8/2001 13:00 9.80 7.03 11.00 3905TMARIN 5/9/2001 9:25 9.00 7.44 11.11 3805TMARIN 6/6/2001 11:30 11.30 4905TMARIN 6/12/2001 17:20 9.06 7.12 11.39 4905TMARIN 6/13/2001 12:15 9.90 7.64 11.03 5405TMARIN 7/11/2001 11:55 18.70 9.32 63 0.0005TMARIN 7/12/2001 13:25 20.12 9.40 70 0.0005TMARIN 8/22/2001 13:55 16.00 7.31 8.61 200 0.0005TMARIN 8/22/2001 13:55 R 8.9805TMARIN 9/19/2001 8:15 14.50 7.18 8.66 520 0.0205TMARIN 10/3/2001 14:47 13.44 9.87 85.505TMARIN 10/16/2001 10:50 9.18 7.39 11.60 41.3 0.0105TMARIN 10/17/2001 10:25 8.60 6.91 10.95 49 0.0005TMARIN 11/14/2001 8:30 8.57 11.61 11.10 35.605TMARIN 11/15/2001 9:17 8.81 10.81 21.805TMARIN 11/19/2001 12:55 7.10 11.55 150 0.00 Maintstem Stillaguamish River at Hat Slough boat launch05TMARIN2 8/7/2000 14:05 18.20 7.15 8.60 8105TMARIN2 8/14/2000 14:17 18.20 7.16 9.70 9505TMARIN2 8/21/2000 14:37 19.80 7.85 10.70 8005TMARIN2 8/28/2000 13:58 17.40 7.47 9.75 10305TMARIN2 8/28/2000 13:58 R 17.40 7.35 9.75 10305TMARIN2 9/5/2000 14:00 15.80 7.02 9.00 10505TMARIN2 9/5/2000 14:05 R 7.02 8.95 105 Mouth of March Creek at 220th Street NE05TMARSH 6/12/2001 14:25 10.97 6.74 7.95 82.405TMARSH 6/13/2001 12:20 14.40 6.59 4.86 169 4.7305TMARSH 11/14/2001 10:30 10.27 6.63 5.88 165.3 4.3305TMARSH 11/15/2001 10:05 10.84 6.46 4.80 170.2 4.23 Martha Lake Creek at Soundview Drive05TMARTH 2/27/2001 10:35 3.20 12.10 143 0.0005TMARTH 3/29/2001 13:25 8.10 11.15 85 0.3305TMARTH 4/19/2001 11:50 10.50 10.50 115 0.00 0.7605TMARTH 5/9/2001 12:05 10.00 10.54 105 0.1505TMARTH 6/6/2001 13:15 11.90 10.10 162 1 U05TMARTH 7/11/2001 12:15 13.10 9.45 159 0.00 1 U05TMARTH 8/22/2001 10:10 14.00 8.84 185 0.00 0.105TMARTH 9/19/2001 10:20 12.60 10.00 202 0.00 1 U05TMARTH 10/17/2001 12:10 10.90 10.56 190 0.0005TMARTH 11/19/2001 11:11 8.90 9.65 174 0.00 0.05 Martha Lake Creek outlet to Warm Beach05TMARTOL 7/11/2001 12:25 14.80 8.90 690 0.4005TMARTOL 8/22/2001 14:10 15.00 7.40 1250 1.0005TMARTOL 9/19/2001 10:30 13.10 9.16 680 0.02 Miller Creek at Miller Road05TMILLR 8/8/2000 8:55 17.70 E 7.55 E 5.25 E 261 E 2.30 E05TMILLR 10/18/2000 9:00 12.02 7.48 6.87 256 0.1005TMILLR 6/12/2001 10:30 11.60 7.35 5.50 27105TMILLR 6/13/2001 12:39 12.81 6.77 5.54 346 22.8605TMILLR 7/17/2001 15:15 16.70 7.80 10.10 239 0.11 0.8205TMILLR 7/18/2001 11:55 16.27 7.44 7.48 254 0.12 1.56
Page 30

Station Date Time Field Temp. pHReplicate °C std. units
Conductivityµmhos/cm
D.O. mg/L
Meter Winkler
Salinityppt
Flowcfs
Mainstem Stillaguamish River below Arlington WWTP outfall05TMIXZO 9/11/2000 11:23 11.91 7.66 10.58 34.205TMIXZO 9/13/2000 9:50 12.54 7.49 9.81 58.1405TMIXZO 7/11/2001 11:22 17.40 7.15 9.95 7005TMIXZO 7/11/2001 15:20 20.20 7.72 10.25 6805TMIXZO 10/2/2001 12:20 11.85 7.56 9.87 74.1 Mainstem Stillaguamish River at Old Channel diversion 05TMS3 9/11/2000 15:05 13.26 7.51 10.08 37.605TMS3 9/13/2000 14:55 16.85 6.96 5.72 92.4 Mainstem Stillaguamish River below Silvana05TMS6 9/11/2000 14:40 12.63 7.77 10.33 3805TMS6 9/13/2000 14:15 14.90 7.60 9.79 60.7 Mainstem Stillaguamish River at Interstate 5 bridge05TMS11 9/11/2000 13:25 12.30 7.51 10.41 37.805TMS11 9/12/2000 14:50 13.50 7.08 5605TMS11 9/12/2000 14:55 R 13.50 7.12 5605TMS11 9/13/2000 11:50 13.27 7.45 9.92 58.505TMS11 1/31/2001 13:20 4.40 5605TMS11 5/8/2001 15:04 10.00 7.71 11.40 3805TMS11 6/12/2001 12:05 8.28 7.46 11.58 11.56 26.405TMS11 6/13/2001 11:15 9.51 6.96 11.14 29 5150* J05TMS11 7/12/2001 11:20 18.04 7.58 9.43 63.8 0.02 1168* J05TMS11 10/2/2001 16:50 13.29 7.38 9.91 77.505TMS11 10/3/2001 12:59 12.14 7.31 9.85 81.405TMS11 10/4/2001 15:35 13.27 7.27 10.10 10.05 82.605TMS11 10/16/2001 12:15 9.16 7.20 10.95 41.1 0.01 2393* J05TMS11 11/14/2001 9:30 8.33 7.11 11.15 21.8 26108* J05TMS11 11/15/2001 9:10 8.67 6.88 11.26 20.9 20507* J*Flows were calculated using a flow-discharge rating curve. Mainstem Stillaguamish River at WDFWS access point05TMS12 7/11/2001 12:30 18.40 7.51 10.35 7105TMS12 7/11/2001 17:25 20.30 7.99 10.80 7405TMS12 10/2/2001 18:25 13.43 7.42 10.10 9.95 77.2 Mainstem Stillaguamish River below March Creek05TMS13 9/11/2000 12:56 12.05 7.47 10.41 38.205TMS13 9/13/2000 11:20 12.71 7.47 9.71 58.605TMS13 10/2/2001 15:20 13.74 7.34 10.21 78.505TMS13 10/4/2001 14:45 13.80 7.23 10.40 10.55 83.6 Mainstem Stillaguamish River below Armstrong Creek05TMS15 9/11/2000 12:20 12.01 7.47 10.44 38.105TMS15 9/13/2000 10:40 12.55 7.52 9.88 57.605TMS15 10/2/2001 14:10 12.50 7.40 9.81 7605TMS15 10/4/2001 13:38 12.28 7.20 9.98 9.85 80.6 Mainstem Stillaguamish River at Dike Road05TMS17 9/11/2000 11:40 11.81 7.40 10.55 37.505TMS17 9/13/2000 10:05 12.42 7.61 9.91 56.605TMS17 6/12/2001 14:45 8.56 7.35 12.17 26.105TMS17 6/13/2001 12:50 10.35 6.94 12.00 25.705TMS17 10/2/2001 12:10 12.12 7.55 9.81 74.605TMS17 11/14/2001 11:20 8.41 7.22 11.50 17.805TMS17 11/15/2001 10:25 8.66 7.00 11.25 21.4 North Fork Stillaguamish River at Cicero bridge05TNFCIC 9/12/2000 11:15 11.60 7.02 6405TNFCIC 1/31/2001 12:00 4.40 5405TNFCIC 5/8/2001 16:49 9.50 7.27 11.50 3805TNFCIC 6/12/2001 18:15 9.60 7.60 11.40 4905TNFCIC 6/13/2001 16:10 10.33 6.99 12.60 33.605TNFCIC 7/12/2001 9:45 14.78 8.21 10.77 10.74 64.1 0.0205TNFCIC 10/16/2001 15:20 8.98 7.35 10.90 48.1 0.0005TNFCIC 11/14/2001 13:55 8.06 7.01 11.40 17.905TNFCIC 11/15/2001 13:02 8.61 6.97 11.06 25.3
Page 31
Station Date Time Field Temp. pHReplicate °C std. units
Conductivityµmhos/cm
D.O. mg/L
Meter Winkler
Salinityppt
Flowcfs
North Fork Stillaguamish River at C-post bridge05TNFCPO 9/12/2000 10:35 10.25 6.95 4705TNFCPO 6/12/2001 18:50 9.34 7.60 11.36 5505TNFCPO 6/13/2001 16:50 9.66 7.19 13.02 34.705TNFCPO 11/14/2001 14:25 7.86 6.90 11.10 17.105TNFCPO 11/15/2001 13:35 8.44 6.93 10.70 24.1 Mouth of the North Fork Stillaguamish River at Twin Rivers Park05TNFTWI 8/7/2000 13:05 17.45 7.87 9.85 7605TNFTWI 8/14/2000 11:45 16.00 7.34 8805TNFTWI 8/21/2000 11:06 14.60 8.17 10.30 8005TNFTWI 8/28/2000 11:05 14.30 7.85 10.35 9505TNFTWI 9/5/2000 11:45 13.70 7.46 10.50 9605TNFTWI 9/11/2000 11:19 12.40 7.21 10.50 5705TNFTWI 9/12/2000 12:55 13.50 7.24 6505TNFTWI 9/13/2000 10:10 12.80 7.75 7805TNFTWI 6/12/2001 16:40 9.56 7.44 11.66 27.405TNFTWI 6/13/2001 15:45 10.50 6.94 11.42 34.205TNFTWI 7/11/2001 13:40 18.40 7.86 11.15 7705TNFTWI 10/2/2001 10:21 11.44 7.61 10.60 9.55 84.105TNFTWI 11/15/2001 12:10 8.73 6.91 10.54 25.2 North Fork Stillaguamish River at the Whitman Road bridge05TNFWHI 8/7/2000 11:45 14.50 8.33 11.20 6605TNFWHI 8/14/2000 12:27 13.80 8.23 11.60 7405TNFWHI 8/21/2000 12:00 13.30 8.25 11.65 7505TNFWHI 8/28/2000 12:37 13.50 7.56 11.10 7805TNFWHI 9/5/2000 10:20 10.70 6.93 11.20 8605TNFWHI 9/12/2000 10:55 11.00 6.94 5805TNFWHI 6/12/2001 18:35 9.72 7.84 11.36 5505TNFWHI 6/13/2001 16:30 10.18 7.19 16.30 11.18 35.405TNFWHI 11/14/2001 14:10 7.95 6.91 11.09 18.205TNFWHI 11/15/2001 13:20 8.55 6.88 10.76 26.3 North branch of the mainstem Stillaguamish River at Hwy. 530 bridge05TNORTH 9/11/2000 14:12 12.48 7.56 10.15 37.105TNORTH 9/13/2000 13:45 14.46 7.65 9.68 58.405TNORTH 6/12/2001 11:00 8.44 7.77 12.86 24.105TNORTH 6/13/2001 10:40 9.60 6.92 11.37 26.205TNORTH 10/3/2001 14:05 12.94 7.32 9.42 7805TNORTH 11/14/2001 8:35 8.44 7.17 11.40 28.905TNORTH 11/15/2001 8:20 8.88 6.75 11.05 11.05 21.2 Old Stillaguamish River channel near Irvine Slough05TOC1 8/8/2000 13:33 18.62 7.45 9.23 1390005TOC1 8/8/2000 13:33 14600* 8.0*05TOC1 8/8/2000 13:45 R 14400* 8.0*05TOC1 8/8/2000 15:52 19.52 7.53 9.50 1254405TOC1 8/9/2000 13:25 19.90 7.61 10.40 14630 9.5*05TOC1 10/17/2000 11:55 11.48 7.75 9.10 26604 16.2005TOC1 10/18/2000 10:15 12.30 7.90 8.57 31547 19.6005TOC1 6/12/2001 14:00 10.00 7.57 10.25 25405TOC1 6/13/2001 16:55 14.00 7.58 9.76 44905TOC1 (0.5' depth) 7/17/2001 12:40 19.21 7.65 8.10 12641 7.2505TOC1 (2.5' depth) 7/17/2001 12:41 19.17 7.61 7.60 12750 7.3105TOC1 (5.0' depth) 7/17/2001 12:43 19.03 7.52 6.85 13165 7.5505TOC1 (0.5' depth) 7/18/2001 15:05 22.58 7.65 9.50 21964 12.9505TOC1 (3.5' depth) 7/18/2001 15:06 22.31 7.64 9.52 22500 13.6005TOC1 11/14/2001 10:45 9.64 7.23 9.04 8.50 335405TOC1 11/15/2001 10:33 9.04 7.35 10.68 57.8*Analyzed by MEL, salinity was reported in g/Kg ww and conductivity was reported in umhos/cm
Page 32

Station Date Time Field Temp. pHReplicate °C std. units
Conductivityµmhos/cm
D.O. mg/L
Meter Winkler
Salinityppt
Flowcfs
Old Stillaguamish River channel above the Stanwood WWTP outfall05TOC2 8/8/2000 13:55 22.12 7.69 9.41 1210005TOC2 8/8/2000 13:55 14400* 7.5*05TOC2 8/8/2000 15:35 23.04 7.81 10.53 1216005TOC2 8/9/2000 12:52 21.23 7.91 12.15 5879 3.0*05TOC2 10/17/2000 10:40 11.48 7.80 9.02 24624 14.9005TOC2 10/18/2000 9:50 12.20 7.80 8.57 8.30 24176 14.6005TOC2 6/12/2001 13:08 9.49 7.74 10.35 9505TOC2 6/13/2001 14:00 12.50 7.46 9.90 14105TOC2 (0.5' depth) 7/17/2001 11:25 18.45 7.58 9.28 8.93 8076 4.5005TOC2 (2.5' depth) 7/17/2001 11:27 18.43 7.53 8.72 8100 4.5205TOC2 (0.5' dpeth) 7/18/2001 15:35 21.23 7.64 10.50 12635 7.2605TOC2 (3.5' depth) 7/18/2001 15:37 21.23 7.64 10.50 12635 7.2605TOC2 11/14/2001 10:20 8.98 7.10 10.39 13105TOC2 11/15/2001 10:05 9.04 7.03 11.13 36.1*Analyzed by MEL, salinity was reported in g/Kg ww and conductivity was reported in umhos/cm Old Stillaguamish River channel at the Marine Drive bridge05TOC3 8/8/2000 15:08 22.40 7.80 10.66 797005TOC3 8/8/2000 15:08 9380* 5.0*05TOC3 8/8/2000 15:08 R 23.00 7.89 11.48 784005TOC3 8/9/2000 11:28 20.43 7.38 10.90 2555 2* U05TOC3 10/5/2000 9:40 9.80 6.11 1000 G05TOC3 10/5/2000 9:40 7.1*05TOC3 10/17/2000 13:50 11.70 7.72 8.80 6800 3.8005TOC3 10/18/2000 9:15 12.20 7.70 8.38 8756 4.9005TOC3 10/18/2000 13:15 12.40 8.05 8.67 8264 4.6005TOC3 1/31/2001 15:10 5.65 10405TOC3 1/31/2001 15:15 R 5.65 10405TOC3 5/8/2001 11:50 10.20 7.31 7405TOC3 6/12/2001 10:53 8.88 7.65 10.77 6205TOC3 6/13/2001 13:05 11.20 7.23 10.05 8605TOC3 7/12/2001 12:40 22.14 8.00 11.23 4232 2.3205TOC3 (0.5' depth) 7/17/2001 10:05 17.42 7.18 5.80 3262 1.7605TOC3 (2.5' depth) 7/17/2001 10:07 17.42 7.18 5.55 325005TOC3 (0.5' depth) 7/17/2001 10:15 R 1.7605TOC3 7/18/2001 15:55 21.73 7.71 13.60 13.38 5842 3.2105TOC3 10/16/2001 10:00 9.56 7.00 9.68 9.18 270 0.1305TOC3 11/14/2001 9:45 8.80 7.04 10.75 62.905TOC3 11/15/2001 9:45 8.90 6.93 11.73 24.3*Analyzed by MEL, salinity was reported in g/Kg ww and conductivity was reported in umhos/cm Old Stillaguamish River channel at the Norman Road bridge05TOC4 8/8/2000 14:40 22.36 7.96 16.33 3200 2* U05TOC4 8/8/2000 14:40 3530*05TOC4 10/17/2000 10:15 10.80 7.77 10.15 115 0.0005TOC4 10/18/2000 8:40 11.04 7.87 8.18 8.10 103 0.0005TOC4 6/12/2001 10:10 8.54 7.90 11.45 11.25 4905TOC4 6/13/2001 11:48 9.77 7.28 11.03 5305TOC4 7/17/2001 6:10 16.76 6.96 2.62 935.5 0.4905TOC4 7/18/2001 18:15 18.28 7.16 7.43 176 0.0805TOC4 11/14/2001 9:00 8.60 7.25 11.61 36.105TOC4 11/15/2001 9:00 8.84 7.063 11.50 20.1*Analyzed by MEL, salinity was reported in g/Kg ww and conductivity was reported in umhos/cm Pilchuck Creek at Jackson Gulch Road05TPILCH 8/7/2000 13:44 17.50 6.90 9505TPILCH 8/7/2000 13:46 7.9005TPILCH 8/14/2000 14:47 17.40 6.86 8.70 10005TPILCH 8/21/2000 13:09 17.20 8.10 9.30 9405TPILCH 8/28/2000 13:30 15.35 7.20 8.60 9705TPILCH 9/5/2000 14:25 14.40 7.00 9.00 10005TPILCH 9/11/2000 13:11 13.00 7.77 9.70 5005TPILCH 9/12/2000 16:10 14.80 7.17 5905TPILCH 9/13/2000 14:00 15.00 7.70 9.20 7005TPILCH 6/12/2001 10:15 8.52 7.99 11.85 11.20 22.105TPILCH 6/13/2001 9:00 9.41 6.88 12.32 28.705TPILCH 10/3/2001 15:45 12.58 7.13 9.08 5405TPILCH 10/3/2001 15:45 R 9.0705TPILCH 10/3/2001 15:47 9.0705TPILCH 11/14/2001 9:10 9.14 6.85 10.70 25.905TPILCH 11/15/2001 9:35 9.56 6.54 10.31 10.30 28.4
Page 33

Station Date Time Field Temp. pHReplicate °C std. units
Conductivityµmhos/cm
D.O. mg/L
Meter Winkler
Salinityppt
Flowcfs
Downstream of the mouth of Pilchuck Creek in North Stillaguamish Slough05TPILDOWN 9/13/2000 13:15 14.12 7.41 9.82 58.6 Upstream of the mouth of Pilchuck Creek in North Stillaguamish Slough05TPILUP 9/13/2000 13:10 13.95 7.46 9.93 58.5 Portage Creek at the 212th Street bridge05TPORT 9/11/2000 14:12 12.70 6.75 6.15 22205TPORT 9/12/2000 15:05 12.40 7.21 22105TPORT 9/13/2000 16:25 12.50 7.64 6.10 23005TPORT 9/13/2000 16:29 R 5.4505TPORT 6/12/2001 13:30 10.55 6.94 8.56 87.605TPORT 6/13/2001 11:45 11.30 6.70 8.90 7.64 89.505TPORT 10/3/2001 13:25 10.18 7.08 5.81 782.605TPORT 11/14/2001 10:10 8.51 7.09 10.40 10.95 3505TPORT 11/15/2001 8:50 9.82 6.62 7.30 87.7 South Fork Stillaguamish River below Granite Falls05TSFGRA 9/12/2000 11:55 11.20 6.93 3505TSFGRA 6/12/2001 18:35 8.53 7.56 12.71 11.54 19.105TSFGRA 6/13/2001 18:15 9.60 7.27 12.16 25.205TSFGRA 11/14/2001 15:38 8.45 6.44 11.95 11.95 13.705TSFGRA 11/15/2001 14:25 8.95 7.05 11.76 18.2 South Fork Stillaguamish River at the Jordan walkway bridge05TSFJOR 8/7/2000 12:30 17.50 6.55 5405TSFJOR 8/14/2000 10:45 14.50 7.22 10.05 6805TSFJOR 8/21/2000 13:00 16.30 7.95 5905TSFJOR 8/21/2000 16:10 17.90 7.94 10.12 5705TSFJOR 8/21/2000 16:15 R 17.90 8.06 5705TSFJOR 8/28/2000 11:50 13.90 7.60 10.55 6605TSFJOR 9/5/2000 11:10 13.20 6.96 10.75 7605TSFJOR 9/12/2000 12:15 12.25 7.01 3005TSFJOR 6/12/2001 18:15 8.75 7.47 12.51 22.305TSFJOR 6/13/2001 17:50 9.95 7.22 13.24 11.20 25.205TSFJOR 11/14/2001 15:15 8.33 6.92 11.91 14.405TSFJOR 11/15/2001 14:45 8.57 7.08 11.51 11.70 20 Mouth of the South Fork Stillaguamish River at Twin Rivers Park05TSFTWI 8/7/2000 13:00 17.00 7.87 9.75 6005TSFTWI 8/14/2000 11:50 16.80 7.30 6505TSFTWI 8/21/2000 11:08 14.60 8.22 9.60 6405TSFTWI 8/28/2000 11:05 14.50 8.06 10.05 7505TSFTWI 9/5/2000 11:50 14.20 7.49 10.10 7805TSFTWI 9/11/2000 11:24 11.70 7.41 10.70 3705TSFTWI 9/12/2000 12:57 14.40 7.05 4205TSFTWI 9/13/2000 10:20 12.40 7.50 5405TSFTWI 10/5/2000 11:22 9.00 6.46 5505TSFTWI 1/31/2001 11:00 4.10 7.11 5005TSFTWI 5/8/2001 15:53 9.90 8.43 11.30 3005TSFTWI 6/12/2001 16:20 8.98 7.49 11.73 26.405TSFTWI 6/13/2001 15:25 10.60 6.96 12.06 27.505TSFTWI 7/11/2001 13:45 18.90 7.30 10.10 5905TSFTWI 7/12/2001 10:25 17.09 7.74 9.69 49.7 0.0105TSFTWI 10/2/2001 10:27 10.86 7.57 10.50 62.505TSFTWI 10/16/2001 14:30 7.13 9.1 * 33.17 0.0005TSFTWI 11/14/2001 13:30 8.44 6.98 11.68 15605TSFTWI 11/15/2001 11:55 8.71 7.07 10.90 20.6* Questionable reading instrument battery was low. Mainstem Stillaguamish River below Silvana off Norman Road05TSILVA 6/12/2001 9:25 8.56 8.32 13.24 26.205TSILVA 6/13/2001 10:20 9.58 7.07 10.77 28.405TSILVA 10/3/2001 14:25 13.52 7.35 9.90 82.905TSILVA 11/14/2001 8:05 8.53 7.25 11.40 11.05 32.805TSILVA 11/15/2001 8:00 8.79 6.85 11.67 20.1
Page 34

Station Date Time Field Temp. pHReplicate °C std. units
Conductivityµmhos/cm
D.O. mg/L
Meter Winkler
Salinityppt
Flowcfs
South Pass at the end of Eide Road05TSOUTH 8/8/2000 13:18 20.05 7.61 9.19 21800 16.0*05TSOUTH 8/8/2000 13:18 26300*05TSOUTH 10/17/2000 10:00 11.50 8.13 9.08 31379 19.5005TSOUTH 10/18/2000 10:40 12.30 7.81 8.70 30116 18.6005TSOUTH 2/27/2001 13:40 7.00 12.80 8250 7.5005TSOUTH 3/29/2001 9:10 7.80 9.93 14200 13.2005TSOUTH 4/19/2001 7:35 10.10 10.05 9800 8.0005TSOUTH 5/9/2001 8:50 11.90 9.72 16000 13.3005TSOUTH 6/6/2001 9:15 16.20 9.20 13500 8.5005TSOUTH 6/12/2001 15:00 10.54 7.74 10.17 43105TSOUTH 6/13/2001 18:05 14.15 7.90 9.50 65405TSOUTH 7/11/2001 10:15 18.20 7.20 26100 19.0005TSOUTH 7/17/2001 13:00 19.00 7.80 8.41 18700 10.9905TSOUTH 7/18/2001 14:45 22.13 7.59 8.90 24985 15.1205TSOUTH 8/22/2001 12:15 17.00 7.44 28100 21.2005TSOUTH 9/19/2001 8:40 13.50 6.79 27200 22.1005TSOUTH 9/19/2001 8:40 R 6.3105TSOUTH 10/17/2001 9:05 8.90 9.18 17900 24.9005TSOUTH 11/14/2001 11:48 9.94 7.50 9.93 1326705TSOUTH 11/15/2001 11:10 9.21 7.13 10.79 383.505TSOUTH 11/19/2001 14:35 8.50 9.90 10000 8.50*Analyzed by MEL, salinity was reported in g/Kg ww and conductivity was reported in umhos/cm Stanwood WWTP effluent05TSTAN 10/17/2000 10:30 11.80 8.14 3.88 100005TSTAN 6/12/2001 12:55 15.21 7.69 4.06 745 1.55*05TSTAN 6/13/2001 14:40 19.00 7.80 7.20 743 0.84**Reported by Stanwood WWTP in millions of gallons per day (MGD). Twin City Foods drain #1 at dike05TTCF1 2/27/2001 12:25 6.50 7000 6.5005TTCF1 3/29/2001 9:45 7.50 11.20 9000 6.0005TTCF1 4/19/2001 8:10 10.50 12.80 9500 7.3005TTCF1 5/9/2001 9:50 12.00 12.55 9100 7.0005TTCF1 6/6/2001 10:15 16.00 8.97 10300 7.30 1.6005TTCF1 6/12/2001 16:08 14.50 7.21 8.57 7900 3.4205TTCF1 6/13/2001 15:49 18.20 7.12 7.60 6555 3.0705TTCF1 7/11/2001 11:00 21.40 7.64 25500 17.20 0.0005TTCF1 7/18/2001 9:17 17.31 7.23 3.00 3.45 22204 13.30 0.6605TTCF1 8/22/2001 12:50 17.20 4.93 12100 8.70 0.605TTCF1 9/19/2001 9:30 15.60 3.51 13600 10.00 005TTCF1 10/17/2001 9:40 8.30 7.86 7500 6.5005TTCF1 11/14/2001 13:20 11.33 6.83 5.47 530005TTCF1 11/15/2001 11:55 11.41 6.67 7.17 6176 Twin City Foods drain #2 on Thomle Road05TTCF2 6/12/2001 16:40 15.64 7.28 12.70 12.45 750005TTCF2 6/13/2001 16:10 20.60 7.18 15.00 15.45 6950 0.4105TTCF2 7/17/2001 12:05 17.13 7.33 5.80 18200 10.74 0.505TTCF2 7/18/2001 9:40 17.21 7.23 3.80 20170 12.0105TTCF2 11/15/2001 12:15 10.09 6.98 9.18 9.70 359.4 Twin City Foods drain #3 on Thomle Road05TTCF3 6/12/2001 16:35 15.70 6.93 8.50 378005TTCF3 6/13/2001 16:29 19.40 6.90 10.97 4680 1.5805TTCF3 7/17/2001 11:48 17.55 7.44 6.68 20724 12.35 0.5005TTCF3 7/18/2001 10:00 17.76 7.44 5.50 20586 12.27 0.52 Twin City Foods drain #4 to Hatt Slough*05TTCF4 2/27/2001 11:00 8.00 8.40 5700 5.0005TTCF4 3/29/2001 10:25 11.00 8.80 14000 11.9005TTCF4 4/19/2001 9:10 11.00 14000 11.8005TTCF4 5/9/2001 10:25 12.50 8.78 5500 4.3005TTCF4 6/6/2001 11:10 12.10 18.76 12900 5.2005TTCF4 7/11/2001 11:40 14.00 4.15 3600 2.8005TTCF4 8/22/2001 13:40 15.00 11.82 6500 5.0005TTCF4 9/19/2001 10:00 12.00 1.18 5300 4.2005TTCF4 10/17/2001 10:05 10.80 6.34 11100 9.00*Drain was always plugged and never discharging to Hatt Slough during sampling events.
Page 35

Station Date Time Field Temp. pHReplicate °C std. units
Conductivityµmhos/cm
D.O. mg/L
Meter Winkler
Salinityppt
Flowcfs
Twin City Foods drain #5 at footbridge above Thomle Road05TTCF5 8/9/2000 12:25 18.76 7.53 7.89 860005TTCF5 8/9/2000 12:25 10300* 5.5*05TTCF5 2/27/2001 12:55 6.50 13.20 4130 3.8005TTCF5 6/12/2001 15:35 14.07 6.92 6.92 6668 10.39 2.2205TTCF5 6/13/2001 13:29 15.30 6.67 6.19 2900 8.78 4.2305TTCF5 7/17/2001 10:50 17.77 7.38 4.25 17660 105TTCF5 7/18/2001 10:13 18.66 7.64 6.05 15100 2.0705TTCF5 11/14/2001 13:47 9.73 7.15 7.23 372005TTCF5 11/15/2001 12:25 10.38 7.09 8.38 1596*Analyzed by MEL, salinity was reported in g/Kg ww and conductivity was reported in umhos/cm Unnamed Creek #0456 at the end of Soundview Drive05TUNIDE 3/29/2001 13:45 7.90 11.80 118 0.00 0.2205TUNIDE 4/19/2001 12:05 9.80 11.50 142 0.2405TUNIDE 5/9/2001 12:25 10.10 9.55 160 0.0405TUNIDE 5/9/2001 12:30 R 9.6205TUNIDE 6/6/2001 13:30 12.90 8.72 18905TUNIDE 8/22/2001 9:45 15.50 195 0.0005TUNIDE 10/17/2001 11:50 10.40 8.62 179 0.0005TUNIDE 11/19/2001 11:30 9.30 9.50 163 0.00 0.09 Warm Beach WWTP effluent at Warm Beach05TWAREF 2/27/2001 10:05 5.40 4 -0.1005TWAREF 3/29/2001 12:20 9.50 9.80 1005TWAREF 4/19/2001 10:45 12.70 510 0.3005TWAREF 5/9/2001 11:20 13.30 43305TWAREF 6/6/2001 12:15 14.90 6.95 45805TWAREF 7/11/2001 13:15 20.40 8.19 510 0.0005TWAREF 8/22/2001 10:50 14.00 4.50 245 0.0005TWAREF 10/17/2001 11:05 11.10 6.80 202 0.0005TWAREF 11/19/2001 12:00 9.00 7.25 179 0.00 Pump pond slough at Warm Beach05TWARSL 2/27/2001 9:42 5.60 4290 4.1005TWARSL 3/29/2001 12:45 9.00 9.10 3050 2.5005TWARSL 4/19/2001 10:55 11.90 2280 1.9005TWARSL 5/9/2001 11:50 11.00 3200 2.5005TWARSL 6/6/2001 12:30 13.10 5.87 950 0.5005TWARSL 7/11/2001 13:35 16.00 3.03 850 0.5005TWARSL 8/22/2001 11:15 14.00 4.60 580 0.5005TWARSL 9/19/2001 11:40 12.00 4.40 600 0.0205TWARSL 10/17/2001 11:15 10.20 5.61 2050 1.6005TWARSL 11/19/2001 12:17 9.90 6.95 2450 2.00 Field ditch to pump pond at Warm Beach05TWARTG 2/27/2001 9:25 5.40 8.90 1880 1.4005TWARTG 3/29/2001 12:35 9.70 11.10 2090 1.8005TWARTG 4/19/2001 11:05 11.80 11.95 1950 1.5005TWARTG 5/9/2001 11:35 11.80 2420 2.0005TWARTG 6/6/2001 12:35 14.00 2150 1.8005TWARTG 7/11/2001 13:45 18.10 4380 3.0005TWARTG 8/22/2001 11:25 16.00 6.06 3500 2.3005TWARTG 9/19/2001 11:50 13.10 4.13 1400 0.9005TWARTG 10/17/2001 11:25 10.00 5.22 1600 1.1005TWARTG 11/19/2001 12:30 10.00 3500 3.00 Warm Beach Creek upstream of WWTP outfall05TWARUP 2/27/2001 10:10 5.80 141 0.0005TWARUP 3/29/2001 12:15 9.10 158 0.6305TWARUP 4/19/2001 10:35 10.50 8.35 198 0.00 0.4305TWARUP 5/9/2001 11:05 9.00 7.90 155 0.10 U 0.5705TWARUP 6/6/2001 11:50 11.00 6.38 171 0.10 U 0.3505TWARUP 7/11/2001 13:10 12.70 4.69 163 0.00 005TWARUP 8/22/2001 10:45 11.50 3.82 170 0.00 005TWARUP 9/19/2001 10:55 11.00 5.05 176 0.0005TWARUP 10/17/2001 10:55 11.00 3.90 170 0.0005TWARUP 10/17/2001 10:55 R 3.8505TWARUP 11/19/2001 11:55 8.20 160 0.00
Page 36

Station Date Time Field Temp. pHReplicate °C std. units
Conductivityµmhos/cm
D.O. mg/L
Meter Winkler
Salinityppt
Flowcfs
Warm Beach Creek above camp stables05TWARUS 9/19/2001 11:15 11.00 10.62 120 0.00 0.1 West pass of Old Stillaguamish River Channel at Hwy. 532 bridge in Stanwood05TWEST 8/8/2000 13:00 17.93 7.21 9.12 1160005TWEST 8/8/2000 13:00 13700* 7.5*05TWEST 8/9/2000 13:40 18.10 7.44 9.23 1150005TWEST 10/17/2000 9:30 11.43 7.84 8.22 42862 27.6005TWEST 10/18/2000 10:55 12.20 8.00 7.83 41076 26.3005TWEST 6/12/2001 14:48 10.79 7.50 9.84 69505TWEST 6/13/2001 18:26 14.70 7.07 9.30 108005TWEST 7/17/2001 13:20 18.78 7.81 9.10 18100 10.6505TWEST 7/18/2001 14:45 17.55 7.35 8.65 16112 9.4005TWEST 11/14/2001 11:32 9.48 7.28 9.51 475305TWEST 11/15/2001 10:48 9.11 7.05 10.75 177.5*Analyzed by MEL, salinity was reported in g/Kg ww and conductivity was reported in umhos/cm
Page 37

Table C-2. General chemistry analyses data for the Stillaguamish River TMDL. Arlington WWTP effluent
Station Date Time FieldRep.
05TARLIN 9/12/2000 13:20 22105TARLIN 9/13/2000 11:17 152* 3* 3*05TARLIN 6/12/2001 15:40 29.8 7 J 1105TARLIN 6/13/2001 14:05 38.2 805TARLIN 10/2/2001 11:10 93.5 3 U 205TARLIN 10/16/2001 14:00 705TARLIN 11/14/2001 12:40 87.5 2 U 305TARLIN 11/15/2001 11:25 82.7 3
Station Date Time FieldRep.
05TARLIN 9/12/2000 13:20 0.634 0.980 2.79 4.3605TARLIN 9/13/2000 11:17 0.223 2.100 3.47 4.40 7.2 7.005TARLIN 6/12/2001 15:40 0.087 0.631 1.99 2.32 2.4705TARLIN 6/13/2001 14:05 0.101 0.934 1.54 2.41 2.5905TARLIN 10/2/2001 11:10 0.121 J 2.370 3.27 J 3.17 3.36 J 7.105TARLIN 11/14/2001 12:40 0.082 1.510 2.38 2.51 2.7105TARLIN 11/15/2001 11:25 0.074 1.610 2.31 2.66 2.88*24 hour composite sample
Alkalinitymg/L
TNVSSmg/L
BODmg/L
Chloridemg/L
DOCmg/L
Chlorophyll mg/L
water tissue
TSSmg/L
TOCmg/L
TPmg/L
NH3mg/L
N-Nmg/L
OPmg/L
TPNmg/L
Armstrong Creek at the hatchery gaging station
Station Date Time FieldRep.
05TARMST 9/11/2000 12:10 3.7505TARMST 9/11/2000 12:15 R 3.7705TARMST 9/13/2000 13:20 3.7605TARMST 6/12/2001 15:00 1.83 4 UJ 112 J05TARMST 6/13/2001 13:15 2.4 36 J05TARMST 11/14/2001 11:36 3.99 3 U 1305TARMST 11/15/2001 10:35 3.81 10
Station Date Time FieldRep.
05TARMST 9/11/2000 12:10 0.01 U 0.680 0.863 0.018 0.045 3.805TARMST 9/11/2000 12:15 R 0.01 U 0.676 0.881 0.017 0.045 3.805TARMST 9/13/2000 13:20 0.01 U 0.788 0.913 0.018 0.046 2.505TARMST 6/12/2001 15:00 0.011 0.985 1.25 0.009 0.09205TARMST 6/13/2001 13:15 0.01 U 1.19 1.33 0.008 0.03805TARMST 11/14/2001 11:36 0.017 0.456 0.687 0.011 0.04605TARMST 11/15/2001 10:35 0.017 0.845 1.11 0.0091 0.039
TOC DOCmg/L mg/L mg/Lmg/L mg/L mg/L mg/L
water tissue
NH3 N-N TPN OP TP
mg/L mg/LAlkalinity Chloride BOD Chlorophyll TSS TNVSS
mg/L mg/L mg/L mg/L
Page 38

Church Creek/Jorgenson Slough at Marine DriveStation Date Time Field
Rep.
05TCHURH 8/8/2000 10:30 305TCHURH 10/5/2000 8:45 405TCHURH 10/17/2000 13:20 605TCHURH 10/18/2000 14:00 405TCHURH 10/18/2000 14:10 R 505TCHURH 1/31/2001 14:30 1305TCHURH 5/8/2001 13:23 305TCHURH 6/12/2001 11:20 5 16205TCHURH 6/13/2001 18:45 1605TCHURH 7/12/2001 13:50 4305TCHURH 7/17/2001 14:45 4 11 305TCHURH 7/18/2001 11:21 3 U 6 305TCHURH 10/16/2001 11:20 505TCHURH 11/14/2001 12:50 4 U 1405TCHURH 11/15/2001 11:30 10
Station Date Time FieldRep.
05TCHURH 8/8/2000 10:30 0.01 U 0.01 U 0.342 0.027 0.101 7.805TCHURH 10/17/2000 13:20 0.198 0.325 0.662 0.027 0.082 J 6.0 6.005TCHURH 10/18/2000 14:00 0.092 0.331 0.585 0.060 6.205TCHURH 10/18/2000 14:00 R 0.084 0.332 0.614 0.059 6.105TCHURH 6/12/2001 11:20 0.060 0.818 1.31 0.048 0.22405TCHURH 6/13/2001 18:45 0.040 0.879 1.32 0.034 0.10705TCHURH 7/17/2001 14:45 0.01 U 0.128 0.602 0.016 0.094 8.605TCHURH 7/18/2001 11:21 0.024 0.294 0.697 0.018 0.060 7.605TCHURH 11/14/2001 12:50 0.053 0.298 0.801 0.031 0.07805TCHURH 11/15/2001 11:30 0.085 0.784 1.34 0.0424 0.092
mg/Lmg/L mg/L mg/L mg/L
water tissue
NH3 N-N TPN OP TP
mg/L mg/LAlkalinity Chloride
mg/L mg/L mg/L mg/LBOD Chlorophyll TSS TNVSS
TOC DOCmg/Lmg/L
Confluence of the North and South Forks of the Stillaguamish River at Hwy. 9
Station Date Time FieldRep.
05TCONFL 9/11/2000 11:05 0.961 3 U 2.405TCONFL 9/13/2000 9:25 24.8 1.41 3 U 1.305TCONFL 7/11/2001 15:55 188 57 8 705TCONFL 7/11/2001 16:00 R 1060 20005TCONFL 7/11/2001 16:05 R 1630 22005TCONFL 10/2/2001 12:06 37.2 3 U 1.3 9 J 9 J05TCONFL 10/2/2001 19:10 104 20 6 605TCONFL 10/2/2001 19:15 R 45.7 1805TCONFL 10/2/2001 19:20 R 115 33
Station Date Time FieldRep.
05TCONFL 9/11/2000 11:05 4.5 4.405TCONFL 9/13/2000 9:25 0.01 U 0.151 0.195 0.025 2.4 2.305TCONFL 7/11/2001 15:55 0.01 U 0.072 0.106 0.005 U 0.01205TCONFL 10/2/2001 12:06 1.605TCONFL 10/2/2001 19:10 0.053 0.177 0.315 J 0.0071 0.013 J
mg/L mg/L
VOMmg/Ltissue
TNVSSTSSAlkalinity Chloride BOD Chlorophyll mg/L mg/L mg/L mg/L mg/L mg/L
water tissue
NH3 N-N TPN OP TP TOC DOCmg/L mg/L mg/L mg/L mg/L
Cook Slough at the Hwy. 530 bridge near Silvana
Station Date Time FieldRep.
05TCOOK 9/11/2000 13:45 1.0905TCOOK 9/13/2000 14:20 1.6105TCOOK 9/13/2000 14:24 R 1.6505TCOOK 6/12/2001 11:30 1.94 11705TCOOK 6/12/2001 11:40 R 10305TCOOK 6/13/2001 9:35 1.53 4305TCOOK 10/3/2001 13:48 3.08 505TCOOK 11/14/2001 8:50 1.01 160005TCOOK 11/15/2001 8:37 1.05 304 J
Station Date Time FieldRep.
05TCOOK 9/11/2000 13:45 0.012 0.214 0.315 0.005 U 0.045 4.805TCOOK 9/13/2000 14:20 0.01 U 0.166 0.213 0.007 0.028 2.105TCOOK 9/13/2000 14:24 R 0.01 U 0.165 0.214 0.007 0.028 2.105TCOOK 6/12/2001 11:30 0.01 U 0.224 0.328 0.014 0.08805TCOOK 6/13/2001 9:35 0.027 0.255 0.323 0.006 0.04205TCOOK 10/3/2001 13:48 0.06 J 0.202 0.359 J 0.010 0.019 J 2.005TCOOK 11/14/2001 8:50 0.062 0.130 0.261 0.013 1.3605TCOOK 11/15/2001 8:37 0.014 0.239 0.313 0.0062 0.266
TOC
water tissuemg/LTSSChloride BOD Chlorophyll Alkalinity
mg/Lmg/L mg/L mg/L mg/LTNVSS
DOCmg/L mg/L mg/L mg/L mg/L mg/L mg/LNH3 N-N TPTPN OP
Page 39
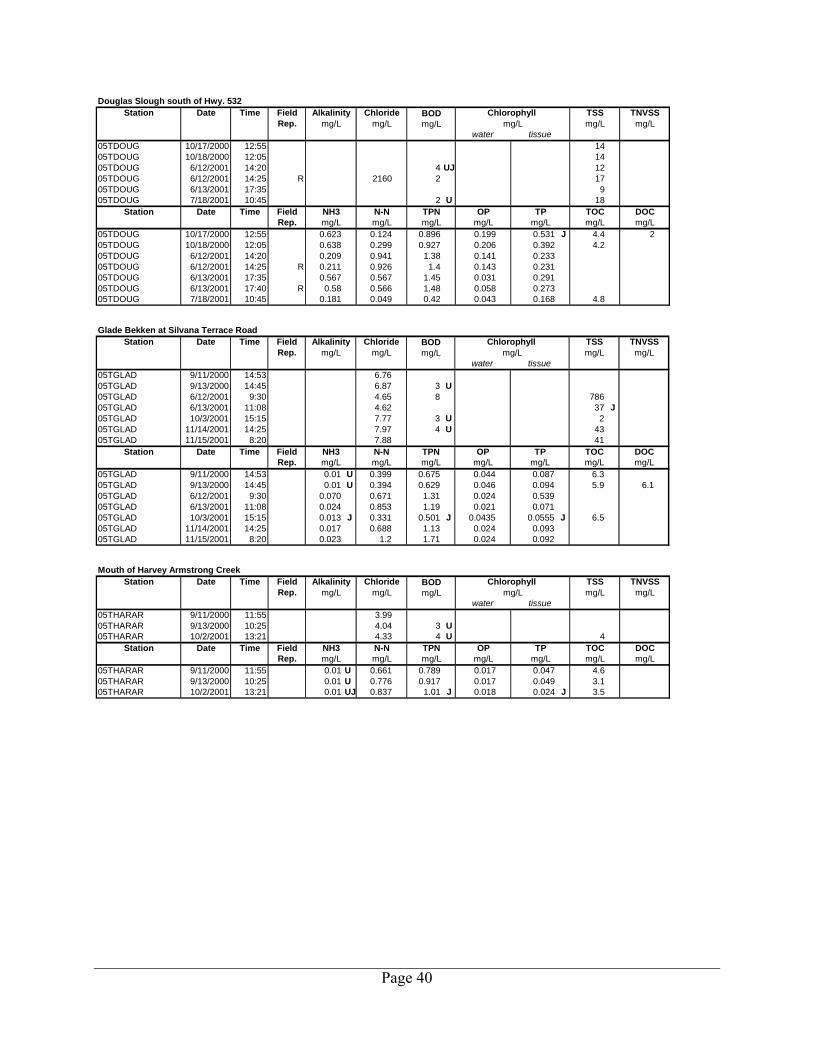
Douglas Slough south of Hwy. 532Station Date Time Field
Rep.
05TDOUG 10/17/2000 12:55 1405TDOUG 10/18/2000 12:05 1405TDOUG 6/12/2001 14:20 4 UJ 1205TDOUG 6/12/2001 14:25 R 2160 2 1705TDOUG 6/13/2001 17:35 905TDOUG 7/18/2001 10:45 2 U 18
Station Date Time FieldRep.
05TDOUG 10/17/2000 12:55 0.623 0.124 0.896 0.199 0.531 J 4.4 205TDOUG 10/18/2000 12:05 0.638 0.299 0.927 0.206 0.392 4.205TDOUG 6/12/2001 14:20 0.209 0.941 1.38 0.141 0.23305TDOUG 6/12/2001 14:25 R 0.211 0.926 1.4 0.143 0.23105TDOUG 6/13/2001 17:35 0.567 0.567 1.45 0.031 0.29105TDOUG 6/13/2001 17:40 R 0.58 0.566 1.48 0.058 0.27305TDOUG 7/18/2001 10:45 0.181 0.049 0.42 0.043 0.168 4.8
TSSBOD Chlorophyll TNVSSmg/L mg/L mg/L mg/L mg/L mg/L
Alkalinity Chloride
water tissue
NH3 N-N TPN OP TPmg/L mg/L mg/L mg/L
DOCmg/L mg/L mg/L
TOC
Glade Bekken at Silvana Terrace Road
Station Date Time FieldRep.
05TGLAD 9/11/2000 14:53 6.7605TGLAD 9/13/2000 14:45 6.87 3 U05TGLAD 6/12/2001 9:30 4.65 8 78605TGLAD 6/13/2001 11:08 4.62 37 J05TGLAD 10/3/2001 15:15 7.77 3 U 205TGLAD 11/14/2001 14:25 7.97 4 U 4305TGLAD 11/15/2001 8:20 7.88 41
Station Date Time FieldRep.
05TGLAD 9/11/2000 14:53 0.01 U 0.399 0.675 0.044 0.087 6.305TGLAD 9/13/2000 14:45 0.01 U 0.394 0.629 0.046 0.094 5.9 6.105TGLAD 6/12/2001 9:30 0.070 0.671 1.31 0.024 0.53905TGLAD 6/13/2001 11:08 0.024 0.853 1.19 0.021 0.07105TGLAD 10/3/2001 15:15 0.013 J 0.331 0.501 J 0.0435 0.0555 J 6.505TGLAD 11/14/2001 14:25 0.017 0.688 1.13 0.024 0.09305TGLAD 11/15/2001 8:20 0.023 1.2 1.71 0.024 0.092
mg/L mg/L mg/Lmg/L mg/L mg/L mg/L
TNVSSmg/L mg/L mg/L mg/L mg/L mg/L
Alkalinity Chlorophyll Chloride BOD
TOC DOCNH3 N-N TPN OP
TSS
water tissue
TP
Mouth of Harvey Armstrong Creek
Station Date Time FieldRep.
05THARAR 9/11/2000 11:55 3.9905THARAR 9/13/2000 10:25 4.04 3 U05THARAR 10/2/2001 13:21 4.33 4 U 4
Station Date Time FieldRep.
05THARAR 9/11/2000 11:55 0.01 U 0.661 0.789 0.017 0.047 4.605THARAR 9/13/2000 10:25 0.01 U 0.776 0.917 0.017 0.049 3.105THARAR 10/2/2001 13:21 0.01 UJ 0.837 1.01 J 0.018 0.024 J 3.5
TOC DOCmg/L mg/L mg/Lmg/L mg/L mg/L mg/L
NH3 N-N TPN OP
mg/LAlkalinity Chloride
water tissuemg/L mg/L mg/L mg/L
BOD TSS TNVSSChlorophyll mg/L
TP
Page 40
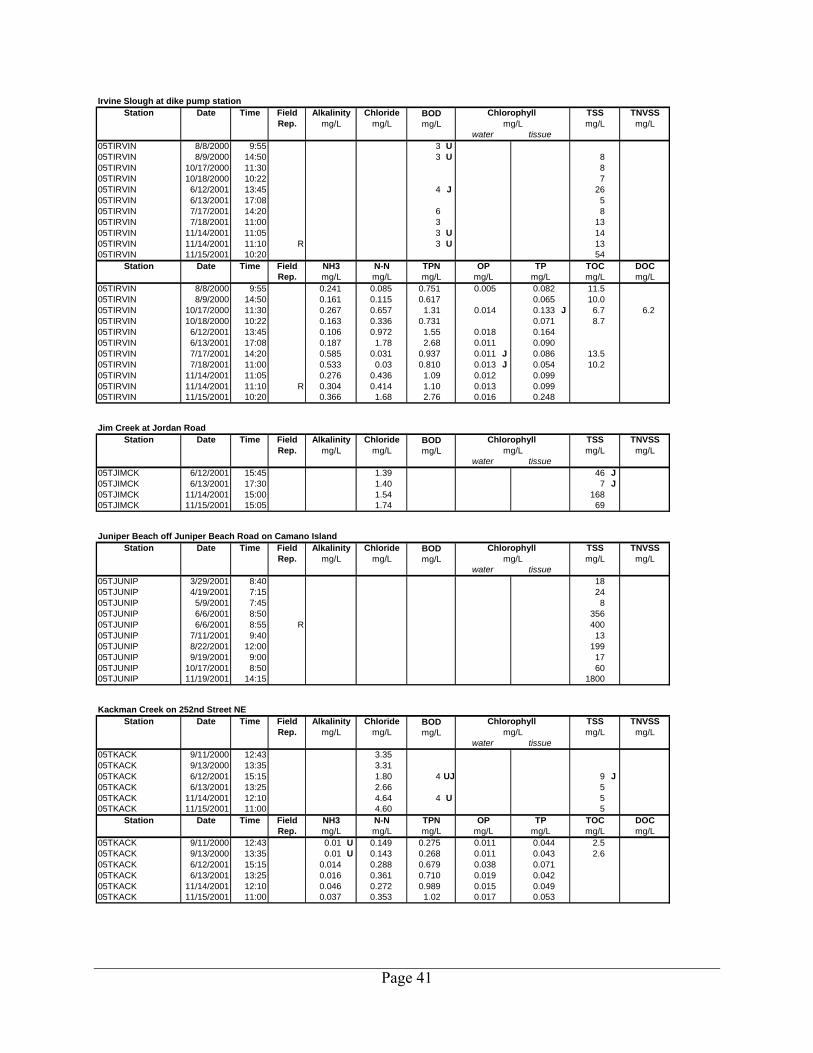
Irvine Slough at dike pump stationStation Date Time Field
Rep.
05TIRVIN 8/8/2000 9:55 3 U05TIRVIN 8/9/2000 14:50 3 U 805TIRVIN 10/17/2000 11:30 805TIRVIN 10/18/2000 10:22 705TIRVIN 6/12/2001 13:45 4 J 2605TIRVIN 6/13/2001 17:08 505TIRVIN 7/17/2001 14:20 6 805TIRVIN 7/18/2001 11:00 3 1305TIRVIN 11/14/2001 11:05 3 U 1405TIRVIN 11/14/2001 11:10 R 3 U 1305TIRVIN 11/15/2001 10:20 54
Station Date Time FieldRep.
05TIRVIN 8/8/2000 9:55 0.241 0.085 0.751 0.005 0.082 11.505TIRVIN 8/9/2000 14:50 0.161 0.115 0.617 0.065 10.005TIRVIN 10/17/2000 11:30 0.267 0.657 1.31 0.014 0.133 J 6.7 6.205TIRVIN 10/18/2000 10:22 0.163 0.336 0.731 0.071 8.705TIRVIN 6/12/2001 13:45 0.106 0.972 1.55 0.018 0.16405TIRVIN 6/13/2001 17:08 0.187 1.78 2.68 0.011 0.09005TIRVIN 7/17/2001 14:20 0.585 0.031 0.937 0.011 J 0.086 13.505TIRVIN 7/18/2001 11:00 0.533 0.03 0.810 0.013 J 0.054 10.205TIRVIN 11/14/2001 11:05 0.276 0.436 1.09 0.012 0.09905TIRVIN 11/14/2001 11:10 R 0.304 0.414 1.10 0.013 0.09905TIRVIN 11/15/2001 10:20 0.366 1.68 2.76 0.016 0.248
TOC DOCmg/L mg/L mg/Lmg/L mg/L mg/L mg/L
water tissue
NH3 N-N TPN OP TP
mg/L mg/LAlkalinity Chloride
mg/L mg/L mg/L mg/LBOD Chlorophyll TSS TNVSS
Jim Creek at Jordan Road
Station Date Time FieldRep.
05TJIMCK 6/12/2001 15:45 1.39 46 J05TJIMCK 6/13/2001 17:30 1.40 7 J05TJIMCK 11/14/2001 15:00 1.54 16805TJIMCK 11/15/2001 15:05 1.74 69
water tissuemg/L mg/L
Alkalinity Chloridemg/L mg/L mg/L mg/L
BOD Chlorophyll TSS TNVSS
Juniper Beach off Juniper Beach Road on Camano Island
Station Date Time FieldRep.
05TJUNIP 3/29/2001 8:40 1805TJUNIP 4/19/2001 7:15 2405TJUNIP 5/9/2001 7:45 805TJUNIP 6/6/2001 8:50 35605TJUNIP 6/6/2001 8:55 R 40005TJUNIP 7/11/2001 9:40 1305TJUNIP 8/22/2001 12:00 19905TJUNIP 9/19/2001 9:00 1705TJUNIP 10/17/2001 8:50 6005TJUNIP 11/19/2001 14:15 1800
water tissue
TSS TNVSSmg/L mg/L mg/L mg/L mg/L mg/L
Alkalinity Chloride BOD Chlorophyll
Kackman Creek on 252nd Street NE
Station Date Time FieldRep.
05TKACK 9/11/2000 12:43 3.3505TKACK 9/13/2000 13:35 3.3105TKACK 6/12/2001 15:15 1.80 4 UJ 9 J05TKACK 6/13/2001 13:25 2.66 505TKACK 11/14/2001 12:10 4.64 4 U 505TKACK 11/15/2001 11:00 4.60 5
Station Date Time FieldRep.
05TKACK 9/11/2000 12:43 0.01 U 0.149 0.275 0.011 0.044 2.505TKACK 9/13/2000 13:35 0.01 U 0.143 0.268 0.011 0.043 2.605TKACK 6/12/2001 15:15 0.014 0.288 0.679 0.038 0.07105TKACK 6/13/2001 13:25 0.016 0.361 0.710 0.019 0.04205TKACK 11/14/2001 12:10 0.046 0.272 0.989 0.015 0.04905TKACK 11/15/2001 11:00 0.037 0.353 1.02 0.017 0.053
TP TOCTPN OP DOCmg/L mg/L mg/L mg/L mg/L mg/L mg/LNH3 N-N
mg/L mg/Lwater tissue
mg/L mg/L mg/L mg/LAlkalinity Chloride BOD Chlorophyll TSS TNVSS
Page 41

March Creek at mouthStation Date Time Field
Rep.
05TMAR1 9/11/2000 12:36 6.1505TMAR1 9/13/2000 11:00 6.17 3 U
Station Date Time FieldRep.
05TMAR1 9/11/2000 12:36 0.01 U 0.113 0.241 0.009 0.051 3.705TMAR1 9/13/2000 11:00 0.01 U 0.072 0.249 0.009 0.050 3.6 3.4
TOC DOCmg/L mg/L mg/Lmg/L mg/L mg/L mg/L
water tissue
NH3 N-N TPN OP TP
TNVSSmg/L mg/L mg/L mg/L mg/L mg/L
Alkalinity Chloride BOD Chlorophyll TSS
Mainstem Stillaguamish at Hatt Slough off Marine Drive
Station Date Time FieldRep.
05TMARIN 9/11/2000 15:40 1.14 3 U 1.7 1505TMARIN 9/11/2000 15:40 R 1.12 3 U 1.4 1505TMARIN 9/12/2000 15:40 1.5005TMARIN 9/13/2000 15:15 1.75 1.5 1105TMARIN 10/5/2000 10:20 405TMARIN 1/31/2001 13:55 16405TMARIN 2/27/2001 11:55 505TMARIN 3/29/2001 11:00 4305TMARIN 3/29/2001 11:05 R 4305TMARIN 4/19/2001 9:40 2105TMARIN 5/8/2001 13:00 905TMARIN 5/9/2001 9:25 805TMARIN 6/6/2001 11:30 505TMARIN 6/12/2001 17:20 1.32 17705TMARIN 6/13/2001 12:15 1.32 4005TMARIN 7/11/2001 11:55 205TMARIN 7/12/2001 13:25 205TMARIN 8/22/2001 13:55 4405TMARIN 8/22/2001 13:56 R 4505TMARIN 9/19/2001 8:15 605TMARIN 10/3/2001 14:47 40.8 1.3 5 505TMARIN 10/16/2001 10:50 1105TMARIN 10/17/2001 10:25 1505TMARIN 11/14/2001 8:30 1.44 53305TMARIN 11/15/2001 9:17 1.11 29105TMARIN 11/15/2001 9:20 R 27905TMARIN 11/19/2001 12:55 67
Station Date Time FieldRep.
05TMARIN 9/11/2000 15:40 0.012 0.238 0.376 0.006 0.040 5.4 4.705TMARIN 9/11/2000 15:45 R 0.018 0.238 0.348 0.005 0.038 5.4 4.805TMARIN 9/13/2000 15:15 0.01 U 0.179 0.285 0.007 0.038 2.505TMARIN 6/12/2001 17:20 0.01 U 0.287 0.446 0.009 0.14405TMARIN 6/13/2001 12:15 0.024 0.319 0.427 0.009 0.05105TMARIN 10/3/2001 14:47 0.058 J 0.212 0.363 J 0.0071 0.016 J 1.805TMARIN 11/14/2001 8:30 0.047 0.193 0.312 0.010 0.39005TMARIN 11/15/2001 9:17 0.014 0.245 0.331 0.0089 0.27605TMARIN 11/15/2001 9:20 R 0.010 0.243 0.345 0.0082 0.314
TOC DOCmg/L mg/L mg/Lmg/L mg/L mg/L mg/L
water tissue
NH3 N-N TPN OP TP
mg/L mg/LAlkalinity Chloride
mg/L mg/L mg/L mg/LBOD Chlorophyll TSS TNVSS
March Creek at 220th Street NE
Station Date Time FieldRep.
05TMARSH 6/12/2001 14:25 4.95 2505TMARSH 6/13/2001 12:20 11.00 1505TMARSH 6/13/2001 12:20 R 122 J05TMARSH 11/14/2001 10:30 9.59 1405TMARSH 11/15/2001 10:05 10.60 805TMARSH 11/15/2001 10:10 R 10.40 8
Station Date Time FieldRep.
05TMARSH 6/12/2001 14:25 0.125 0.401 1.12 0.396 0.51105TMARSH 6/13/2001 12:20 0.968 0.659 2.72 0.318 0.65305TMARSH 11/14/2001 10:30 0.058 0.959 1.78 0.0469 0.14805TMARSH 11/15/2001 10:05 0.122 1.01 2.18 0.314 0.44405TMARSH 11/15/2001 10:05 R 0.122 1.01 2.26 0.325 0.428
TOC DOCmg/L mg/L mg/Lmg/L mg/L mg/L mg/L
water tissue
NH3 N-N TPN OP TP
mg/L mg/LAlkalinity Chloride
mg/L mg/L mg/L mg/LBOD Chlorophyll TSS TNVSS
Page 42

Martha Lake Creek at Soundview DriveStation Date Time Field
Rep.
05TMARTH 2/27/2001 10:35 1 U05TMARTH 3/29/2001 13:25 805TMARTH 4/19/2001 11:50 805TMARTH 5/9/2001 12:05 405TMARTH 6/6/2001 13:15 605TMARTH 7/11/2001 12:15 505TMARTH 8/22/2001 10:10 13 J05TMARTH 9/19/2001 10:20 1005TMARTH 10/17/2001 12:10 205TMARTH 11/19/2001 11:11 7
water tissuemg/L mg/L
Alkalinity Chloridemg/L mg/L mg/L mg/L
BOD Chlorophyll TSS TNVSS
Martha Lake Creek outlet to Warm Beach
Station Date Time FieldRep.
05TMARTOL 7/11/2001 12:25 205TMARTOL 8/22/2001 14:10 605TMARTOL 9/19/2001 10:30 1
water tissue
TSS TNVSSmg/L mg/L mg/L mg/L mg/L mg/L
Alkalinity Chloride BOD Chlorophyll
Miller Creek at Miller Road
Station Date Time FieldRep.
05TMILLR 8/8/2000 8:55 3 U05TMILLR 10/18/2000 9:00 1405TMILLR 6/12/2001 10:30 4 U 1205TMILLR 6/13/2001 12:39 705TMILLR 7/17/2001 15:15 2 U05TMILLR 7/18/2001 11:55 2 U
Station Date Time FieldRep.
05TMILLR 8/8/2000 8:55 0.077 0.048 0.479 0.073 0.278 5.905TMILLR 10/18/2000 9:00 0.059 0.517 1.07 0.208 7.905TMILLR 6/12/2001 10:30 0.151 2.53 3.22 0.080 0.24405TMILLR 6/13/2001 12:39 0.198 6.22 7.17 0.151 0.28005TMILLR 7/17/2001 15:15 0.027 0.014 0.483 0.062 0.177 8.405TMILLR 7/18/2001 11:55 0.023 0.012 0.472 0.050 0.163 8.1
TOC DOCmg/L mg/L mg/Lmg/L mg/L mg/L mg/L
water tissue
NH3 N-N TPN OP TP
TSS TNVSSmg/L mg/L mg/L mg/L mg/L mg/L
Alkalinity Chloride BOD Chlorophyll
Mainstem Stillaguamish River below Arlington WWTP outfall
Station Date Time FieldRep.
05TMIXZO 9/11/2000 11:23 1.0805TMIXZO 9/13/2000 9:50 1.8605TMIXZO 7/11/2001 15:20 27.3 1440 300 6 505TMIXZO 7/11/2001 15:25 R 1050 17005TMIXZO 7/11/2001 15:30 R 700 15705TMIXZO 10/2/2001 12:20 2.49
Station Date Time FieldRep.
05TMIXZO 9/11/2000 11:23 0.015 0.204 0.303 0.007 0.045 4.705TMIXZO 9/13/2000 9:50 0.01 U 0.162 0.207 0.019 0.040 2.105TMIXZO 7/11/2001 15:20 0.01 U 0.063 0.095 0.011 0.02005TMIXZO 10/2/2001 12:20 0.059 J 0.172 0.326 J 0.0081 0.017 J 1.9
TOC DOCmg/L mg/L mg/LTP
mg/L mg/L mg/L mg/LNH3 N-N TPN OP
mg/LAlkalinity Chloride
tissue tissuemg/L mg/L mg/L mg/L
BOD Chlorophyll TSS TNVSSmg/L
VOMmg/L
Mainstem Stillaguamish River at the Old Channel diversion
Station Date Time FieldRep.
05TMS3 9/11/2000 15:05 1.11 4305TMS3 9/13/2000 14:55 4.39 4
Station Date Time FieldRep.
05TMS3 9/11/2000 15:05 0.01 U 0.231 0.317 0.005 0.049 5.105TMS3 9/13/2000 14:55 0.032 0.099 0.197 0.005 U 0.033 2.1
TOC DOCmg/L mg/L mg/Lmg/L mg/L mg/L mg/L
water tissue
NH3 N-N TPN OP TP
mg/L mg/LAlkalinity Chloride
mg/L mg/L mg/L mg/LBOD Chlorophyll TSS TNVSS
Page 43

Mainstem Stillaguamish River below SilvanaStation Date Time Field
Rep.
05TMS6 9/11/2000 14:40 1.09 3.0 3105TMS6 9/13/2000 14:15 1.71 1.2 10
Station Date Time FieldRep.
05TMS6 9/11/2000 14:40 0.01 U 0.233 0.356 0.006 0.046 4.9 4.505TMS6 9/13/2000 14:15 0.012 0.177 0.239 0.008 0.031 2.1
TOC DOCmg/L mg/L mg/Lmg/L mg/L mg/L mg/L
water tissue
NH3 N-N TPN OP TP
mg/L mg/LAlkalinity Chloride
mg/L mg/L mg/L mg/LBOD Chlorophyll TSS TNVSS
Mainstem Stillaguamish River at Interstate 5 bridge
Station Date Time FieldRep.
05TMS11 9/11/2000 13:25 1.09 3 U 1.9 3105TMS11 9/12/2000 14:50 1.3905TMS11 9/12/2000 14:55 R 1.4105TMS11 9/13/2000 11:50 1.60 2 U 1.3 805TMS11 1/31/2001 13:20 18705TMS11 5/8/2001 15:04 905TMS11 6/12/2001 12:05 1.06 4 U 20305TMS11 6/12/2001 12:10 R 1.04 4 U 16005TMS11 6/13/2001 11:15 1.36 4005TMS11 7/12/2001 11:20 405TMS11 10/2/2001 16:50 38.0 2.74 3 U 1.6 7 605TMS11 10/2/2001 16:55 R 37.4 2.69 3 U 1.4 6 505TMS11 10/3/2001 12:59 39.2 3.00 2.1 6 605TMS11 10/16/2001 12:15 1505TMS11 11/14/2001 9:30 0.985 4 UJ 109005TMS11 11/15/2001 9:10 1.02 285
Station Date Time FieldRep.
05TMS11 9/11/2000 13:25 0.011 0.212 0.320 0.005 0.048 4.5 3.905TMS11 9/13/2000 11:50 0.01 U 0.167 0.212 0.007 0.027 2.0 1.905TMS11 6/12/2001 12:05 0.01 U 0.234 0.348 0.006 0.10105TMS11 6/12/2001 12:10 R 0.01 U 0.235 0.348 0.006 0.09405TMS11 6/13/2001 11:15 0.01 U 0.280 0.318 0.005 0.03605TMS11 10/2/2001 16:50 0.06 J 0.201 0.346 J 0.0096 0.021 J 1.905TMS11 10/2/2001 16:55 R 0.059 J 0.196 0.356 J 0.0099 0.019 J 1.905TMS11 10/3/2001 12:59 0.065 J 0.204 0.369 J 0.013 0.021 J 1.705TMS11 11/14/2001 9:30 0.046 0.130 0.247 0.012 0.97305TMS11 11/15/2001 9:10 0.01 U 0.247 0.350 0.0065 0.239
TOC DOCmg/L mg/L mg/Lmg/L mg/L mg/L mg/L
water tissue
NH3 N-N TPN OP TP
mg/L mg/LAlkalinity Chloride
mg/L mg/L mg/L mg/LBOD Chlorophyll TSS TNVSS
Mainstem Stillaguamish River at the WDFWS access point
Station Date Time FieldRep.
05TMS12 7/11/2001 17:10 28.6 1260 315 5 405TMS12 7/11/2001 17:15 R 2320 21005TMS12 7/11/2001 17:20 R 1830 29405TMS12 7/11/2001 17:25 R 28.5 2650 169 4 205TMS12 10/2/2001 18:25 1980 229 5 505TMS12 10/2/2001 18:30 5600 65505TMS12 10/2/2001 18:40 2990 38005TMS12 10/2/2001 18:55 R 5260 630
Station Date Time FieldRep.
05TMS12 7/11/2001 17:10 0.013 0.069 0.175 0.005 U 0.01705TMS12 7/11/2001 17:25 R 0.01 U 0.078 0.109 0.005 U 0.01205TMS12 10/2/2001 18:25 0.055 0.199 0.343 J 0.010 0.016 J
VOMmg/L
TOC DOCmg/L mg/L mg/Lmg/L mg/L mg/L mg/L
tissue
NH3 N-N TPN OP TP
TSSChloride BOD
tissue
Chlorophyll mg/Lmg/L
TNVSSmg/Lmg/L
Alkalinitymg/L mg/L
Mainstem Stillaguamish River below March Creek
Station Date Time FieldRep.
05TMS13 9/11/2000 12:56 1.0805TMS13 9/13/2000 11:20 1.6005TMS13 10/2/2001 15:20 2.79
Station Date Time FieldRep.
05TMS13 9/11/2000 12:56 0.01 U 0.211 0.312 0.006 0.053 4.705TMS13 9/13/2000 11:20 0.01 U 0.171 0.217 0.007 0.026 1.905TMS13 10/2/2001 15:20 0.055 J 0.192 0.339 J 0.010 0.017 J
TOC DOCmg/L mg/L mg/Lmg/L mg/L mg/L mg/L
tissuemg/L
NH3 N-N TPN OP TP
Alkalinitymg/L mg/L mg/L mg/L mg/L
water
TSS TNVSSChlorophyll Chloride BOD
Page 44

Mainstem Stillaguamish River below Armstrong CreekStation Date Time Field
Rep.
05TMS15 9/11/2000 12:20 1.12 3 U 2.2 2805TMS15 9/13/2000 10:40 1.53 805TMS15 10/2/2001 14:10 36.8 2.55 3 U 0.96 5 5
Station Date Time FieldRep.
05TMS15 9/11/2000 12:20 0.016 0.212 0.289 0.006 0.041 4.3 3.605TMS15 9/13/2000 10:40 0.01 U 0.166 0.231 0.007 0.028 1.905TMS15 10/2/2001 14:10 0.062 J 0.195 0.375 J 0.012 0.019 J 2.0
TOC DOCmg/L mg/L mg/L mg/L mg/L mg/L mg/L
water tissue
NH3 N-N TPN OP TP
mg/LAlkalinity Chloride BOD
mg/Lmg/L mg/L mg/L mg/LChlorophyll TSS TNVSS
Mainstem Stillaguamish River at Dike Road
Station Date Time FieldRep.
05TMS17 9/11/2000 11:40 1.0805TMS17 9/13/2000 10:05 1.5605TMS17 6/12/2001 14:45 1.01 29305TMS17 6/13/2001 12:50 1.19 4305TMS17 10/2/2001 12:10 2.64 705TMS17 11/14/2001 11:20 0.90 94105TMS17 11/15/2001 10:25 1.02 208
Station Date Time FieldRep.
05TMS17 9/11/2000 11:40 0.011 0.205 0.358 0.007 0.039 4.705TMS17 9/13/2000 10:05 0.01 U 0.155 0.230 0.008 0.031 2.105TMS17 6/12/2001 14:45 0.01 U 0.168 0.307 0.007 0.25805TMS17 6/13/2001 12:50 0.027 0.214 0.281 0.005 U 0.03705TMS17 10/2/2001 12:10 0.061 J 0.177 0.328 J 0.014 0.022 J05TMS17 11/14/2001 11:20 0.030 0.148 0.289 0.010 0.61905TMS17 11/15/2001 10:25 0.01 U 0.244 0.332 0.0064 0.202
DOCmg/L mg/L mg/L mg/L mg/L mg/L mg/LNH3 N-N TPN OP TP
TSS
TOC
Chlorophyll mg/L
water tissue
TNVSSmg/L mg/L mg/L mg/L mg/L
Alkalinity Chloride BOD
North Fork Stillaguamish River at Cicero bridge
Station Date Time FieldRep.
05TNFCIC 9/12/2000 11:15 1.3505TNFCIC 1/31/2001 12:00 3105TNFCIC 5/8/2001 16:49 505TNFCIC 6/12/2001 18:15 0.987 37 J05TNFCIC 6/13/2001 16:10 1.26 1205TNFCIC 7/12/2001 9:45 205TNFCIC 10/16/2001 15:20 505TNFCIC 10/16/2001 15:30 R 505TNFCIC 11/14/2001 13:55 0.952 41705TNFCIC 11/15/2001 13:02 1.09 128
water tissue
TSS TNVSSmg/L mg/L mg/L mg/L mg/L mg/L
Alkalinity Chloride BOD Chlorophyll
North Fork Stillaguamish River at C-post bridge
Station Date Time FieldRep.
05TNFCPO 9/12/2000 10:35 0.75805TNFCPO 6/12/2001 18:50 0.987 4 J05TNFCPO 6/13/2001 16:50 0.929 205TNFCPO 11/14/2001 14:25 0.789 25905TNFCPO 11/15/2001 13:35 1.05 89
TSS TNVSSmg/L mg/L mg/L mg/L
Alkalinity Chloride BOD Chlorophyll mg/L mg/L
water tissue
Page 45
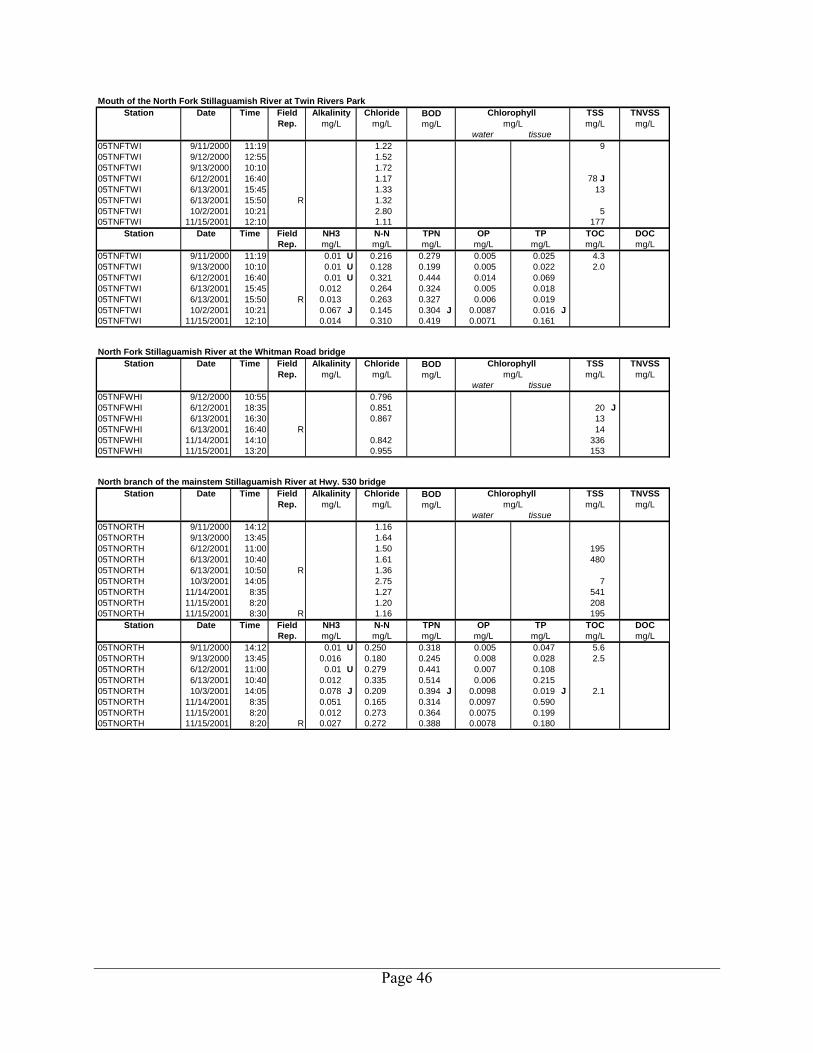
Mouth of the North Fork Stillaguamish River at Twin Rivers ParkStation Date Time Field
Rep.
05TNFTWI 9/11/2000 11:19 1.22 905TNFTWI 9/12/2000 12:55 1.5205TNFTWI 9/13/2000 10:10 1.7205TNFTWI 6/12/2001 16:40 1.17 78 J05TNFTWI 6/13/2001 15:45 1.33 1305TNFTWI 6/13/2001 15:50 R 1.3205TNFTWI 10/2/2001 10:21 2.80 505TNFTWI 11/15/2001 12:10 1.11 177
Station Date Time FieldRep.
05TNFTWI 9/11/2000 11:19 0.01 U 0.216 0.279 0.005 0.025 4.305TNFTWI 9/13/2000 10:10 0.01 U 0.128 0.199 0.005 0.022 2.005TNFTWI 6/12/2001 16:40 0.01 U 0.321 0.444 0.014 0.06905TNFTWI 6/13/2001 15:45 0.012 0.264 0.324 0.005 0.01805TNFTWI 6/13/2001 15:50 R 0.013 0.263 0.327 0.006 0.01905TNFTWI 10/2/2001 10:21 0.067 J 0.145 0.304 J 0.0087 0.016 J05TNFTWI 11/15/2001 12:10 0.014 0.310 0.419 0.0071 0.161
mg/LTPN OPmg/L mg/L mg/L mg/L
TOC
TSS TNVSSmg/L mg/L
DOC
mg/L mg/L mg/L mg/L
NH3 N-N
Alkalinity Chloride BOD Chlorophyll
mg/L mg/L
water tissue
TP
North Fork Stillaguamish River at the Whitman Road bridge
Station Date Time FieldRep.
05TNFWHI 9/12/2000 10:55 0.79605TNFWHI 6/12/2001 18:35 0.851 20 J05TNFWHI 6/13/2001 16:30 0.867 1305TNFWHI 6/13/2001 16:40 R 1405TNFWHI 11/14/2001 14:10 0.842 33605TNFWHI 11/15/2001 13:20 0.955 153
Alkalinity Chloride TSS TNVSSmg/L mg/L mg/L mg/L mg/L mg/L
BOD Chlorophyll
water tissue
North branch of the mainstem Stillaguamish River at Hwy. 530 bridge
Station Date Time FieldRep.
05TNORTH 9/11/2000 14:12 1.1605TNORTH 9/13/2000 13:45 1.6405TNORTH 6/12/2001 11:00 1.50 19505TNORTH 6/13/2001 10:40 1.61 48005TNORTH 6/13/2001 10:50 R 1.3605TNORTH 10/3/2001 14:05 2.75 705TNORTH 11/14/2001 8:35 1.27 54105TNORTH 11/15/2001 8:20 1.20 20805TNORTH 11/15/2001 8:30 R 1.16 195
Station Date Time FieldRep.
05TNORTH 9/11/2000 14:12 0.01 U 0.250 0.318 0.005 0.047 5.605TNORTH 9/13/2000 13:45 0.016 0.180 0.245 0.008 0.028 2.505TNORTH 6/12/2001 11:00 0.01 U 0.279 0.441 0.007 0.10805TNORTH 6/13/2001 10:40 0.012 0.335 0.514 0.006 0.21505TNORTH 10/3/2001 14:05 0.078 J 0.209 0.394 J 0.0098 0.019 J 2.105TNORTH 11/14/2001 8:35 0.051 0.165 0.314 0.0097 0.59005TNORTH 11/15/2001 8:20 0.012 0.273 0.364 0.0075 0.19905TNORTH 11/15/2001 8:20 R 0.027 0.272 0.388 0.0078 0.180
mg/L mg/Lmg/L
mg/Lwater tissue
TP TOC DOC
Alkalinity Chloride BOD Chlorophyll mg/L mg/L mg/L
TPN OPmg/L mg/L mg/L
mg/L
NH3 N-Nmg/L
mg/LTNVSSTSS
Page 46

Old Stillaguamish River channel near Irvine SloughStation Date Time Field
Rep.
05TOC1 8/8/2000 13:33 3 U 5.4 1305TOC1 8/8/2000 13:45 R 3 U 1305TOC1 8/9/2000 13:25 15.2 J 4105TOC1 10/17/2000 11:55 3.4 32 3005TOC1 10/18/2000 10:15 2705TOC1 6/12/2001 14:00 2 13605TOC1 6/13/2001 16:55 5105TOC1 (0.5' depth) 7/17/2001 12:40 3 34.9 15 1205TOC1 (0.5' depth) 7/18/2001 15:05 3 U 12.8 84 7705TOC1 (0.5' depth) 7/18/2001 15:10 R 3 U 11.2 6905TOC1 11/14/2001 10:45 3 U 11405TOC1 11/15/2001 10:33 387
Station Date Time FieldRep.
05TOC1 8/8/2000 13:33 0.039 0.017 0.112 0.028 0.066 1.705TOC1 8/8/2000 13:45 R 0.043 0.018 0.109 0.028 0.068 1.705TOC1 8/9/2000 13:25 0.043 0.014 0.183 0.129 2.705TOC1 10/17/2000 11:55 0.152 0.138 0.212 0.047 0.093 J 1.9 1.405TOC1 10/18/2000 10:15 0.108 0.123 0.121 0.051 0.085 2.205TOC1 6/12/2001 14:00 0.116 0.340 0.669 0.040 0.20405TOC1 6/13/2001 16:55 0.161 1.01 1.42 0.058 0.15405TOC1 (0.5' depth) 7/17/2001 12:40 0.01 U 0.01 U 0.338 0.015 0.105 5.805TOC1 7/17/2001 12:45 R 0.011 0.01 U 0.364 0.015 0.103 5.905TOC1 (0.5' depth) 7/18/2001 15:05 0.074 0.029 0.294 0.053 0.180 3.105TOC1 (0.5' depth) 7/18/2001 15:10 R 0.077 0.031 0.296 0.053 0.184 3.205TOC1 11/14/2001 10:45 0.466 J 0.346 0.479 0.028 0.26605TOC1 11/15/2001 10:33 0.072 0.226 0.387 0.029 0.399
TOC DOCmg/L mg/L mg/L mg/L mg/L mg/L mg/L
water tissue
NH3 N-N TPN OP TP
mg/L mg/L mg/L mg/LAlkalinity Chloride BOD Chlorophyll TSS TNVSS
mg/L mg/L
Old Stillaguamish River channel above the Stanwood WWTP outfall
Station Date Time FieldRep.
05TOC2 8/8/2000 13:55 32.4 3905TOC2 8/9/2000 12:52 45.5 7105TOC2 10/17/2000 10:40 4.9 25 2305TOC2 10/17/2000 10:45 R 5.3 23 2105TOC2 10/18/2000 9:50 11905TOC2 6/12/2001 13:08 25105TOC2 6/12/2001 13:15 R 39505TOC2 6/13/2001 14:00 9505TOC2 6/13/2001 14:10 R 8705TOC2 (0.5' depth) 7/17/2001 11:25 93.9 45 3605TOC2 (0.5' depth) 7/18/2001 15:35 47.9 203 18705TOC2 11/14/2001 10:20 144005TOC2 11/15/2001 10:05 602
Station Date Time FieldRep.
05TOC2 8/8/2000 13:55 0.031 0.01 U 0.248 0.043 0.16805TOC2 8/9/2000 12:52 0.044 0.01 U 0.331 0.329 6.805TOC2 10/17/2000 10:40 0.259 0.232 0.204 0.054 0.097 J 2.2 1.905TOC2 10/17/2000 10:45 R 0.270 0.237 0.378 0.053 0.104 J 2.3 1.905TOC2 10/18/2000 9:50 0.343 0.247 0.608 0.065 0.207 2.405TOC2 6/12/2001 13:08 0.051 0.354 0.682 0.019 0.37805TOC2 6/12/2001 13:15 R 0.051 0.345 0.680 0.019 0.41505TOC2 6/13/2001 14:00 0.050 0.871 1.17 0.020 0.13505TOC2 (0.5' depth) 7/17/2001 11:25 0.029 0.011 0.727 0.029 0.286 7.005TOC2 (0.5' depth) 7/18/2001 15:35 0.056 0.017 0.529 0.023 0.402 6.405TOC2 11/14/2001 10:20 0.132 0.176 1.02 0.025 1.4805TOC2 11/15/2001 10:05 0.083 0.237 0.416 0.011 0.615
TOC DOCmg/L mg/L mg/Lmg/L mg/L mg/L mg/L
water tissue
NH3 N-N TPN OP TP
Chlorophyll TSSAlkalinity Chloride BODmg/L mg/L
TNVSSmg/L mg/L mg/L mg/L
Page 47

Old Stillaguamish River channel at the Marine Drive bridgeStation Date Time Field
Rep.
05TOC3 8/8/2000 15:08 37.605TOC3 8/8/2000 15:10 R 4 2705TOC3 8/9/2000 11:28 10 297 9905TOC3 10/5/2000 9:40 1605TOC3 10/17/2000 13:50 82.1 137 12505TOC3 10/18/2000 9:15 44105TOC3 1/31/2001 15:10 71805TOC3 1/31/2001 15:15 R 49805TOC3 5/8/2001 11:50 9105TOC3 5/8/2001 11:55 R 10805TOC3 6/12/2001 10:53 44805TOC3 6/13/2001 13:05 14005TOC3 7/12/2001 12:40 11205TOC3 7/12/2001 12:40 R 11605TOC3 7/17/2001 10:05 259 J 146 11905TOC3 7/17/2001 10:15 R 7 241 J 136 11305TOC3 7/18/2001 15:55 256 1330 124005TOC3 10/16/2001 10:00 29305TOC3 11/14/2001 9:45 400005TOC3 11/14/2001 9:50 R 355005TOC3 11/15/2001 9:45 733
Station Date Time FieldRep.
05TOC3 8/8/2000 15:10 R 0.029 0.01 U 0.302 0.052 0.190 5.605TOC3 8/9/2000 11:28 0.048 0.01 U 0.404 0.411 10.705TOC3 10/17/2000 13:50 0.378 0.352 0.904 0.027 0.317 5.7 4.005TOC3 10/18/2000 9:15 0.342 0.284 0.915 0.033 0.789 6.205TOC3 6/12/2001 10:53 0.033 0.244 0.463 0.012 0.38205TOC3 6/13/2001 13:05 0.041 0.795 1.05 0.019 0.15005TOC3 7/17/2001 10:05 0.083 0.021 1.05 0.008 0.641 7.905TOC3 7/17/2001 10:15 R 0.085 0.022 1.09 0.008 0.645 7.905TOC3 7/18/2001 15:55 0.012 0.041 0.348 0.024 2.39 11.905TOC3 7/18/2001 16:00 R 0.01 U 0.032 0.297 0.024 1.99 9.905TOC3 11/14/2001 9:45 0.192 0.114 0.480 0.017 3.5205TOC3 11/14/2001 9:50 R 0.190 0.109 0.530 0.015 3.5805TOC3 11/15/2001 9:45 0.081 0.217 0.369 0.011 0.722
TOC DOCmg/L mg/L mg/Lmg/L mg/L mg/L mg/L
water tissue
NH3 N-N TPN OP TP
mg/L mg/LAlkalinity Chloride
mg/L mg/L mg/L mg/LBOD Chlorophyll TSS TNVSS
Old Stillaguamish River channel at the Norman Road bridge
Station Date Time FieldRep.
05TOC4 8/8/2000 14:40 372 25205TOC4 10/17/2000 10:15 5.3 J 11 1105TOC4 10/18/2000 8:40 6705TOC4 6/12/2001 10:10 1.48 4 U 12905TOC4 6/13/2001 11:48 4805TOC4 7/17/2001 6:10 5 105 J 62 5005TOC4 7/18/2001 18:15 3 68.4 84 7405TOC4 11/14/2001 9:00 1.39 4 UJ 47405TOC4 11/15/2001 9:00 1.04 248
Station Date Time FieldRep.
05TOC4 8/8/2000 14:40 0.014 0.01 U 0.385 0.032 0.82205TOC4 10/17/2000 10:15 0.01 U 0.139 0.159 0.007 0.033 J 2.1 1.805TOC4 10/18/2000 8:40 0.115 0.115 0.193 0.013 0.069 2.505TOC4 6/12/2001 10:10 0.01 U 0.236 0.395 0.006 0.11705TOC4 6/13/2001 11:48 0.031 0.339 0.428 0.007 0.04705TOC4 7/17/2001 6:10 0.068 0.018 0.546 0.007 0.327 5.305TOC4 7/18/2001 18:15 0.179 0.055 0.480 0.008 0.276 3.205TOC4 11/14/2001 9:00 0.044 0.197 0.356 0.0096 0.36705TOC4 11/15/2001 9:00 0.017 0.241 0.332 0.0074 0.242
TOC DOCmg/L mg/L mg/Lmg/L mg/L mg/L mg/L
water tissue
NH3 N-N TPN OP TP
mg/L mg/LAlkalinity Chloride
mg/L mg/L mg/L mg/LBOD Chlorophyll TSS TNVSS
Page 48

Pilchuck Creek at Jackson Gulch RoadStation Date Time Field
Rep.
05TPILCH 9/11/2000 13:11 1.8105TPILCH 9/12/2000 16:10 2.0005TPILCH 9/13/2000 14:00 2.13 3 U05TPILCH 6/12/2001 10:15 1.19 4 U 44405TPILCH 6/13/2001 9:00 1.64 28505TPILCH 10/3/2001 15:45 2.37 3 U 205TPILCH 10/3/2001 15:50 R 2.38 305TPILCH 11/14/2001 9:10 1.99 3 U 4105TPILCH 11/15/2001 9:35 2.11 25
Station Date Time FieldRep.
05TPILCH 9/11/2000 13:11 0.01 U 0.550 0.679 0.005 U 0.023 10.505TPILCH 9/12/2000 16:1005TPILCH 9/13/2000 14:00 0.01 U 0.399 0.558 0.005 U 0.016 7.0 6.705TPILCH 6/12/2001 10:15 0.011 0.325 0.509 0.008 0.10305TPILCH 6/13/2001 9:00 0.01 U 0.482 0.699 0.006 0.09805TPILCH 10/3/2001 15:45 0.14 J 0.219 0.524 J 0.0094 0.019 J 3.505TPILCH 10/3/2001 15:50 R 0.14 J 0.219 0.519 J 0.0095 0.018 J 3.605TPILCH 11/14/2001 9:10 0.058 0.257 0.444 0.063 0.03905TPILCH 11/15/2001 9:35 0.034 0.531 0.701 0.0069 0.037
TOC DOCmg/L mg/L mg/Lmg/L mg/L mg/L mg/L
water tissue
NH3 N-N TPN OP TP
mg/L mg/LAlkalinity Chloride
mg/L mg/L mg/L mg/LBOD Chlorophyll TSS TNVSS
Portage Creek at the 212th Street bridge
Station Date Time FieldRep.
05TPORT 9/11/2000 14:12 7.5205TPORT 9/12/2000 15:05 7.4405TPORT 9/13/2000 16:25 7.43 3 U05TPORT 9/13/2000 16:29 R 7.50 3 U05TPORT 6/12/2001 13:30 5.51 4 U 2805TPORT 6/13/2001 11:45 4.77 605TPORT 10/3/2001 13:25 7.33 3 U 1 U05TPORT 11/14/2001 10:00 R 1.38 3 U 14405TPORT 11/14/2001 10:10 1.36 3 U 14705TPORT 11/15/2001 8:50 5.67 25
Station Date Time FieldRep.
05TPORT 9/11/2000 14:12 0.01 U 0.655 0.844 0.029 0.071 3.205TPORT 9/13/2000 16:25 0.01 U 0.661 0.874 0.030 0.078 2.9 2.805TPORT 9/13/2000 16:29 R 0.01 U 0.665 0.924 0.030 0.075 3.0 3.105TPORT 6/12/2001 13:30 0.039 1.03 1.50 0.049 0.14605TPORT 6/13/2001 11:45 0.023 1.18 1.57 0.042 0.10305TPORT 10/3/2001 13:25 0.017 J 0.638 0.898 J 0.0399 0.0682 J 3.805TPORT 11/14/2001 10:00 R 0.149 0.198 0.308 0.012 0.14805TPORT 11/14/2001 10:10 0.160 0.198 0.315 0.013 0.1505TPORT 11/15/2001 8:50 0.031 0.684 1.08 0.0397 0.106
TOC DOCmg/L mg/L mg/Lmg/L mg/L mg/L mg/L
water tissue
NH3 N-N TPN OP TP
mg/L mg/LAlkalinity Chloride
mg/L mg/L mg/L mg/LBOD Chlorophyll TSS TNVSS
South Fork Stillaguamish River below Granite Falls
Station Date Time FieldRep.
05TSFGRA 9/12/2000 11:55 0.68705TSFGRA 6/12/2001 18:35 0.902 1005TSFGRA 6/13/2001 18:15 0.996 1205TSFGRA 11/14/2001 15:38 0.975 10605TSFGRA 11/15/2001 14:25 1.03 86
water tissuemg/L mg/L
Alkalinity Chloridemg/L mg/L mg/L mg/L
BOD Chlorophyll TSS TNVSS
South Fork Stillaguamish River at the Jordan walkway bridge
Station Date Time FieldRep.
05TSJOR 9/12/2000 12:15 0.98705TSJOR 6/12/2001 18:15 0.805 28505TSJOR 6/13/2001 17:50 0.909 4305TSJOR 11/14/2001 15:15 0.848 71405TSJOR 11/15/2001 14:45 0.928 263
water tissue
TSS TNVSSmg/L mg/L mg/L mg/L mg/L mg/L
Alkalinity Chloride BOD Chlorophyll
Page 49

Mouth of the South Fork Stillaguamish River at Twin Rivers ParkStation Date Time Field
Rep.
05TSFTWI 9/11/2000 11:24 0.911 4105TSFTWI 9/12/2000 12:57 0.97805TSFTWI 9/13/2000 10:20 1.1405TSFTWI 10/5/2000 11:22 1405TSFTWI 1/31/2001 11:00 33505TSFTWI 5/8/2001 15:53 1005TSFTWI 6/12/2001 16:20 1.02 52405TSFTWI 6/13/2001 15:25 1.13 53 J05TSFTWI 7/12/2001 10:25 905TSFTWI 10/2/2001 10:27 2.02 1205TSFTWI 10/16/2001 14:30 1805TSFTWI 11/14/2001 13:30 0.895 91005TSFTWI 11/15/2001 11:55 0.977 310 J
Station Date Time FieldRep.
05TSFTWI 9/11/2000 11:24 0.01 U 0.197 0.259 0.005 U 0.049 4.205TSFTWI 9/13/2000 10:20 0.01 U 0.176 0.218 0.005 U 0.032 2.105TSFTWI 6/12/2001 16:20 0.011 0.142 0.281 0.017 0.40605TSFTWI 6/13/2001 15:25 0.025 0.193 0.240 0.008 0.04105TSFTWI 10/2/2001 10:27 0.054 J 0.208 0.343 J 0.007 0.021 J05TSFTWI 11/14/2001 13:30 0.021 0.126 0.227 0.0088 0.91105TSFTWI 11/15/2001 11:55 0.01 U 0.220 0.274 0.005 0.220
TOC DOCmg/L mg/L mg/Lmg/L mg/L mg/L mg/L
water tissue
NH3 N-N TPN OP TP
TSS TNVSSmg/L mg/L mg/L mg/L mg/L mg/L
Alkalinity Chloride BOD Chlorophyll
Mainstem Stillaguamish River below Silvana off Norman Road
Station Date Time FieldRep.
05TSILVA 6/12/2001 9:25 1.69 4 U 12705TSILVA 6/13/2001 10:20 1.92 4905TSILVA 10/3/2001 14:25 40 3.09 3 U 1.7 6 605TSILVA 11/14/2001 8:05 1.35 3 U 56205TSILVA 11/14/2001 8:10 R 1.35 48205TSILVA 11/15/2001 8:00 1.10 300
Station Date Time FieldRep.
05TSILVA 6/12/2001 9:25 0.01 U 0.244 0.38 0.007 0.09605TSILVA 6/13/2001 10:20 0.027 0.332 0.419 0.008 0.04705TSILVA 10/3/2001 14:25 0.066 J 0.216 0.386 J 0.0087 0.021 J 2.005TSILVA 11/14/2001 8:05 0.167 0.189 0.306 0.011 0.41905TSILVA 11/15/2001 8:00 0.012 0.248 0.331 0.0075 0.247
TOC DOCmg/L mg/L mg/Lmg/L mg/L mg/L mg/L
water tissue
NH3 N-N TPN OP TP
mg/L mg/LAlkalinity Chloride
mg/L mg/L mg/L mg/LBOD Chlorophyll TSS TNVSS
Page 50

South Pass at the end of Eide RoadStation Date Time Field
Rep.
05TSOUTH 8/8/2000 13:18 3.3 1805TSOUTH 10/17/2000 10:00 2.1 4505TSOUTH 10/18/2000 10:40 3205TSOUTH 2/27/2001 13:46 1605TSOUTH 3/29/2001 9:10 1605TSOUTH 5/9/2001 8:50 1705TSOUTH 6/6/2001 9:15 2305TSOUTH 6/12/2001 15:00 14905TSOUTH 6/13/2001 18:05 7005TSOUTH 7/11/2001 10:15 1205TSOUTH 7/11/2001 10:15 R 1305TSOUTH 7/17/2001 13:00 15.005TSOUTH 7/18/2001 14:45 15.805TSOUTH 8/22/2001 12:15 3805TSOUTH 9/19/2001 8:40 3005TSOUTH 9/19/2001 8:40 R 3005TSOUTH 10/17/2001 9:05 1805TSOUTH 11/14/2001 11:48 9105TSOUTH 11/15/2001 11:10 19005TSOUTH 11/15/2001 11:13 R 17605TSOUTH 11/19/2001 14:35 47
Station Date Time FieldRep.
05TSOUTH 8/8/2000 13:18 0.032 0.01 U 0.127 0.027 0.06305TSOUTH 10/17/2000 10:00 0.091 0.089 0.125 0.035 0.101 J 2.1 1.505TSOUTH 10/18/2000 10:40 0.093 0.128 0.047 0.039 0.082 2.105TSOUTH 6/12/2001 15:00 0.121 0.322 0.662 0.042 0.22105TSOUTH 6/13/2001 18:05 0.189 1.05 1.48 0.061 0.16805TSOUTH 6/13/2001 18:10 R 0.191 1.07 1.48 0.062 0.17505TSOUTH 7/17/2001 13:00 0.057 0.026 0.307 0.056 0.142 4.305TSOUTH 7/18/2001 14:45 0.067 0.033 0.310 0.050 0.194 3.405TSOUTH 11/14/2001 11:48 0.220 0.347 0.638 0.039 0.18205TSOUTH 11/15/2001 11:10 0.098 0.221 0.404 0.014 0.18805TSOUTH 11/15/2001 11:13 R 0.101 0.222 0.389 0.012 0.245
TOC DOCmg/L mg/L mg/Lmg/L mg/L mg/L mg/L
water tissue
NH3 N-N TPN OP TP
mg/L mg/LAlkalinity Chloride
mg/L mg/L mg/L mg/LBOD Chlorophyll TSS TNVSS
Stanwood WWTP effluent
Station Date Time FieldRep.
05TSTAN 10/17/2000 10:30 505TSTAN 6/12/2001 12:55 6 0.08 505TSTAN 6/13/2001 14:40 0.30 4
Station Date Time FieldRep.
05TSTAN 10/17/2000 10:30 18.8 0.819 19.6 6.19 J 13.5 12.605TSTAN 10/18/2000 14:30 18.2 0.812 19.6 5.71 15.9 J05TSTAN 6/12/2001 12:55 13.4 0.113 14.5 5.82 6.0905TSTAN 6/13/2001 14:40 12.9 0.178 15.0 5.88 6.81*Sample collection and analyses performed by City of Stanwood.
mg/L
TOC
tissuemg/L
TPN OPNH3mg/L mg/L mg/L mg/L
N-N
mg/Lmg/L
DOCmg/L mg/L mg/LTP
mg/L mg/L mg/LChloride BOD TSS TNVSSChlorophyll TRC*Alkalinity
Page 51
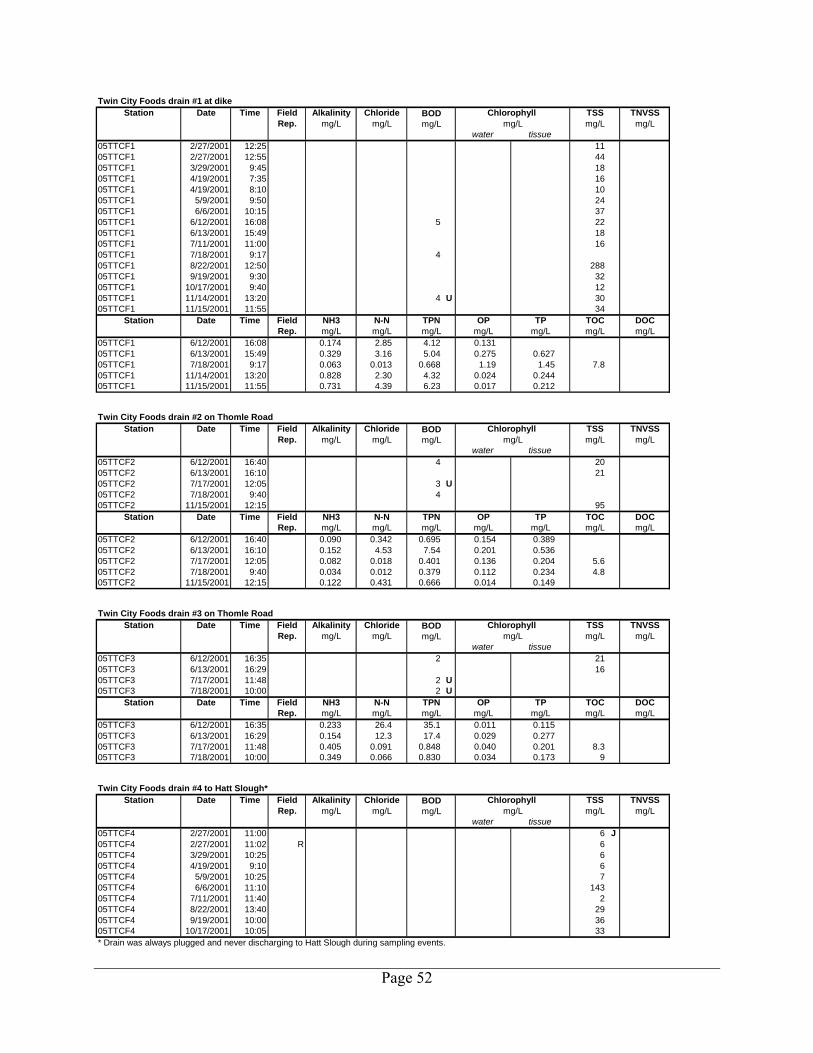
Twin City Foods drain #1 at dikeStation Date Time Field
Rep.
05TTCF1 2/27/2001 12:25 1105TTCF1 2/27/2001 12:55 4405TTCF1 3/29/2001 9:45 1805TTCF1 4/19/2001 7:35 1605TTCF1 4/19/2001 8:10 1005TTCF1 5/9/2001 9:50 2405TTCF1 6/6/2001 10:15 3705TTCF1 6/12/2001 16:08 5 2205TTCF1 6/13/2001 15:49 1805TTCF1 7/11/2001 11:00 1605TTCF1 7/18/2001 9:17 405TTCF1 8/22/2001 12:50 28805TTCF1 9/19/2001 9:30 3205TTCF1 10/17/2001 9:40 1205TTCF1 11/14/2001 13:20 4 U 3005TTCF1 11/15/2001 11:55 34
Station Date Time FieldRep.
05TTCF1 6/12/2001 16:08 0.174 2.85 4.12 0.13105TTCF1 6/13/2001 15:49 0.329 3.16 5.04 0.275 0.62705TTCF1 7/18/2001 9:17 0.063 0.013 0.668 1.19 1.45 7.805TTCF1 11/14/2001 13:20 0.828 2.30 4.32 0.024 0.24405TTCF1 11/15/2001 11:55 0.731 4.39 6.23 0.017 0.212
N-N TPN OP TOC DOCmg/L mg/L mg/L mg/L mg/L mg/L mg/LNH3 TP
mg/L mg/L mg/L mg/Lmg/LAlkalinity Chloride BOD Chlorophyll
water tissue
TSS TNVSSmg/L
Twin City Foods drain #2 on Thomle Road
Station Date Time FieldRep.
05TTCF2 6/12/2001 16:40 4 2005TTCF2 6/13/2001 16:10 2105TTCF2 7/17/2001 12:05 3 U05TTCF2 7/18/2001 9:40 405TTCF2 11/15/2001 12:15 95
Station Date Time FieldRep.
05TTCF2 6/12/2001 16:40 0.090 0.342 0.695 0.154 0.38905TTCF2 6/13/2001 16:10 0.152 4.53 7.54 0.201 0.53605TTCF2 7/17/2001 12:05 0.082 0.018 0.401 0.136 0.204 5.605TTCF2 7/18/2001 9:40 0.034 0.012 0.379 0.112 0.234 4.805TTCF2 11/15/2001 12:15 0.122 0.431 0.666 0.014 0.149
TOC DOCmg/L mg/L mg/Lmg/L mg/L mg/L mg/L
water tissue
NH3 N-N TPN OP TP
TNVSSmg/L mg/L mg/L mg/L mg/L mg/L
Alkalinity Chloride TSSBOD Chlorophyll
Twin City Foods drain #3 on Thomle Road
Station Date Time FieldRep.
05TTCF3 6/12/2001 16:35 2 2105TTCF3 6/13/2001 16:29 1605TTCF3 7/17/2001 11:48 2 U05TTCF3 7/18/2001 10:00 2 U
Station Date Time FieldRep.
05TTCF3 6/12/2001 16:35 0.233 26.4 35.1 0.011 0.11505TTCF3 6/13/2001 16:29 0.154 12.3 17.4 0.029 0.27705TTCF3 7/17/2001 11:48 0.405 0.091 0.848 0.040 0.201 8.305TTCF3 7/18/2001 10:00 0.349 0.066 0.830 0.034 0.173 9
TOC DOCmg/L mg/L mg/Lmg/L mg/L mg/L mg/L
water tissue
NH3 N-N TPN OP TP
mg/L mg/LAlkalinity Chloride
mg/L mg/L mg/L mg/LBOD Chlorophyll TSS TNVSS
Twin City Foods drain #4 to Hatt Slough*
Station Date Time FieldRep.
05TTCF4 2/27/2001 11:00 6 J05TTCF4 2/27/2001 11:02 R 605TTCF4 3/29/2001 10:25 605TTCF4 4/19/2001 9:10 605TTCF4 5/9/2001 10:25 705TTCF4 6/6/2001 11:10 14305TTCF4 7/11/2001 11:40 205TTCF4 8/22/2001 13:40 2905TTCF4 9/19/2001 10:00 3605TTCF4 10/17/2001 10:05 33* Drain was always plugged and never discharging to Hatt Slough during sampling events.
water tissuemg/L mg/L
Alkalinity Chloridemg/L mg/L mg/L mg/L
BOD Chlorophyll TSS TNVSS
Page 52

Twin City Foods drain #5 at footbridge above Thomle RoadStation Date Time Field
Rep.
05TTCF5 8/9/2000 12:25 7 2705TTCF5 6/12/2001 15:35 3 1005TTCF5 6/13/2001 13:29 705TTCF5 7/17/2001 10:50 3 U 10 605TTCF5 7/18/2001 10:13 5 2405TTCF5 11/14/2001 13:47 3 U 12605TTCF5 11/15/2001 12:25 56
Station Date Time FieldRep.
05TTCF5 8/9/2000 12:25 0.032 0.01 U 0.530 3.77 9.905TTCF5 6/12/2001 15:35 0.113 7.47 8.24 0.429 0.69605TTCF5 6/13/2001 13:29 0.123 9.22 10.1 0.195 0.38805TTCF5 7/17/2001 10:50 0.256 0.052 0.833 2.06 3.02 9.805TTCF5 7/18/2001 10:13 0.183 0.049 0.977 2.46 3.03 10.805TTCF5 11/14/2001 13:47 0.473 0.497 1.11 0.0371 0.26905TTCF5 11/15/2001 12:25 0.211 1.46 1.95 0.0727 0.284
TOC DOCmg/L mg/L mg/L mg/L mg/L mg/L mg/L
water tissue
TPNH3 N-N TPN OP
TSS TNVSSmg/L mg/L mg/L mg/L mg/L mg/L
Alkalinity Chloride BOD Chlorophyll
Unnamed Creek #0456 at the end of Soundview Drive
Station Date Time FieldRep.
05TUNIDE 3/29/2001 13:45 405TUNIDE 4/19/2001 12:05 705TUNIDE 5/9/2001 12:25 205TUNIDE 5/9/2001 12:30 R 2005TUNIDE 6/6/2001 13:30 1205TUNIDE 8/22/2001 9:45 1805TUNIDE 10/17/2001 11:50 1505TUNIDE 11/19/2001 11:30 11
mg/L mg/L mg/L mg/L mg/L mg/Lwater tissue
Alkalinity Chloride BOD Chlorophyll TSS TNVSS
Warm Beach WWTP effluent at Warm Beach
Station Date Time FieldRep.
05TWAREF 2/27/2001 10:05 3605TWAREF 3/29/2001 12:20 3305TWAREF 4/19/2001 10:45 905TWAREF 5/9/2001 11:20 1605TWAREF 6/6/2001 12:15 3505TWAREF 7/11/2001 13:15 6905TWAREF 8/22/2001 10:50 305TWAREF 10/17/2001 11:05 805TWAREF 11/19/2001 12:00 13
water tissuemg/L mg/L
Alkalinity Chloridemg/L mg/L mg/L mg/L
BOD Chlorophyll TSS TNVSS
Pump pond slough at Warm Beach
Station Date Time FieldRep.
05TWARSL 2/27/2001 9:42 805TWARSL 3/29/2001 12:45 905TWARSL 4/19/2001 10:55 605TWARSL 4/19/2001 11:00 R 905TWARSL 5/9/2001 11:50 605TWARSL 6/6/2001 12:30 405TWARSL 7/11/2001 13:35 705TWARSL 8/22/2001 11:15 405TWARSL 9/19/2001 11:40 405TWARSL 10/17/2001 11:15 605TWARSL 11/19/2001 12:17 1305TWARSL 11/19/2001 12:20 R 13
water tissue
TSS TNVSSmg/L mg/L mg/L mg/L mg/L mg/L
Alkalinity Chloride BOD Chlorophyll
Page 53

Field ditch to pump pond at Warm BeachStation Date Time Field
Rep.
05TWARTG 2/27/2001 9:25 505TWARTG 3/29/2001 12:35 605TWARTG 4/19/2001 11:05 505TWARTG 5/9/2001 11:35 2005TWARTG 6/6/2001 12:35 1205TWARTG 7/11/2001 13:45 405TWARTG 8/22/2001 11:25 205TWARTG 9/19/2001 11:50 405TWARTG 10/17/2001 11:25 405TWARTG 11/19/2001 12:30 14
water tissue
TSS TNVSSmg/L mg/L mg/L mg/L mg/L mg/L
Alkalinity Chloride BOD Chlorophyll
Warm Beach Creek upstream of WWTP outfall
Station Date Time FieldRep.
05TWARUP 2/27/2001 10:10 705TWARUP 3/29/2001 12:15 805TWARUP 4/19/2001 10:35 1805TWARUP 5/9/2001 11:05 105TWARUP 6/6/2001 11:50 105TWARUP 7/11/2001 13:10 1 U05TWARUP 8/22/2001 10:45 1 U05TWARUP 9/19/2001 10:55 1 U05TWARUP 10/17/2001 10:55 105TWARUP 10/17/2001 10:55 R 205TWARUP 11/19/2001 11:55 7
water tissue
TSS TNVSSmg/L mg/L mg/L mg/L mg/L mg/L
Alkalinity Chloride BOD Chlorophyll
Creek at Warm Beach above camp stables
Station Date Time FieldRep.
05TWARUS 9/19/2001 11:15 8water tissue
TSS TNVSSmg/L mg/L mg/L mg/L mg/L mg/L
Alkalinity Chloride BOD Chlorophyll
West pass of Old Stillaguamish River Channel at Hwy. 532 bridge in Stanwood
Station Date Time FieldRep.
05TWEST 8/8/2000 13:00 4.8 1505TWEST 8/9/2000 13:40 4.7 2505TWEST 10/17/2000 9:30 2205TWEST 10/18/2000 10:55 2005TWEST 6/12/2001 14:48 13205TWEST 6/13/2001 18:26 6705TWEST 6/13/2001 18:30 R 7005TWEST 7/17/2001 13:20 9.905TWEST 7/18/2001 14:45 8.005TWEST 11/14/2001 11:32 8505TWEST 11/15/2001 10:48 756
Station Date Time FieldRep.
05TWEST 8/8/2000 13:00 0.039 0.014 0.122 0.026 0.06805TWEST 8/9/2000 13:40 0.045 0.016 0.129 0.088 1.505TWEST 10/17/2000 9:30 0.053 0.114 0.105 0.059 0.081 J 1.7 1.405TWEST 10/18/2000 10:55 0.035 0.112 0.051 0.061 0.076 1.505TWEST 6/12/2001 14:48 0.130 0.349 0.689 0.041 0.20405TWEST 6/13/2001 18:26 0.210 1.03 1.50 0.063 0.17905TWEST 7/17/2001 13:20 0.031 0.017 0.247 0.039 0.077 4.205TWEST 7/18/2001 14:45 0.055 0.048 0.266 0.055 0.161 2.005TWEST 11/14/2001 11:32 0.419 0.421 1.04 0.0309 0.21705TWEST 11/15/2001 10:48 0.088 0.208 0.396 0.013 0.878
TOC DOCmg/L mg/L mg/L mg/L mg/L mg/L mg/L
water tissue
NH3 N-N TPN OP TP
TSS TNVSSmg/L mg/L mg/L mg/L mg/L mg/L
Alkalinity Chloride BOD Chlorophyll
Page 54

Table C-3. Microbiological analyses data for the Stillaguamish River TMDL.
Station Date Time FieldReplicate
F.C.cfu/100mL
E. colicfu/100mL
Entero.cfu/100mL
Arlington WWTP effluent 05TARLIN 9/12/2000 13:20 900 J 400 960 J05TARLIN 9/13/2000 11:17 29 12005TARLIN 6/12/2001 15:40 34 3605TARLIN 6/13/2001 14:05 23 2605TARLIN 11/14/2001 12:40 100 8005TARLIN 11/15/2001 11:25 270 J 440 J Armstrong Creek at the hatchery gaging station05TARMST 9/13/2000 13:20 7 1005TARMST 6/12/2001 15:00 4000 J 2800 J05TARMST 6/13/2001 13:15 530 J 75 J05TARMST 11/14/2001 11:36 150 17005TARMST 11/15/2001 10:35 120 200 Church Creek at the park off Lindstrom Road05TCHUPK 8/7/2000 14:25 47 19005TCHUPK 8/14/2000 13:37 37 10005TCHUPK 8/14/2000 14:00 R 41 5905TCHUPK 8/21/2000 15:15 59 6405TCHUPK 8/28/2000 15:30 96 15005TCHUPK 9/5/2000 13:30 580 J 57 Church Creek/Jorgenson Slough at Marine Drive05TCHURH 8/8/2000 10:30 11 37005TCHURH 10/17/2000 13:20 23 22005TCHURH 10/18/2000 14:00 160 14005TCHURH 10/18/2000 14:00 R 180 14005TCHURH 6/12/2001 11:20 12000 J 11000 J05TCHURH 6/13/2001 18:45 620 70005TCHURH 7/17/2001 14:45 80 26005TCHURH 7/17/2001 14:50 R 140 28005TCHURH 7/18/2001 11:21 48 74005TCHURH 11/14/2001 12:50 280 17005TCHURH 11/15/2001 11:30 950 740 Confluence of North and South Forks of the Stilliguamish River at Hwy. 905TCONFL 9/11/2000 11:05 74 6305TCONFL 9/13/2000 9:25 45 32 Cook Slough at Hwy. 530 bridge near Silvana05TCOOK 9/13/2000 14:20 37 3305TCOOK 9/13/2000 14:24 R 36 3205TCOOK 6/12/2001 11:30 230 320 J05TCOOK 6/12/2001 11:40 R 380 330 J05TCOOK 6/13/2001 9:35 51 J 23 J05TCOOK 11/14/2001 8:50 300 J 390 J05TCOOK 11/15/2001 8:37 69 43 J Douglas Slough south of Hwy. 53205TDOUG 10/17/2000 12:55 3 U 605TDOUG 10/18/2000 12:05 45 1605TDOUG 6/12/2001 14:20 2900 J 7000 J05TDOUG 6/12/2001 14:25 R 2700 J 2100 J05TDOUG 6/13/2001 17:35 380 33005TDOUG 6/13/2001 17:40 R 300 15005TDOUG 7/18/2001 10:45 240 6100 J
Page 55

Station Date Time FieldReplicate
F.C.cfu/100mL
E. colicfu/100mL
Entero.cfu/100mL
Glade Bekken at Silvana Terrace Road05TGLAD 9/13/2000 14:45 28 2105TGLAD 6/12/2001 9:30 220000 J 52000 J05TGLAD 6/13/2001 11:08 14000 250005TGLAD 11/14/2001 14:25 480 36005TGLAD 11/15/2001 8:20 260 310 J Mouth of Harvey Armstrong Creek05THARAR 9/13/2000 10:25 34 35
Irvine Slough at dike pump station05TIRVIN 8/8/2000 9:55 64005TIRVIN 8/9/2000 14:50 15000 J05TIRVIN 10/17/2000 11:30 2000 610005TIRVIN 10/18/2000 10:22 28000 J 75005TIRVIN 6/12/2001 13:45 15000 J 5000 G05TIRVIN 6/13/2001 17:08 380 43005TIRVIN 7/17/2001 14:20 5400 J 1200 J05TIRVIN 7/18/2001 11:00 4200 2000005TIRVIN 11/14/2001 11:05 460 36005TIRVIN 11/14/2001 11:10 R 670 31005TIRVIN 11/15/2001 10:20 450 320 Jim Creek at Jordan Road05TJIMCK 6/12/2001 15:45 490 320 J05TJIMCK 6/12/2001 15:45 R 540 380 J05TJIMCK 6/13/2001 17:30 69 15005TJIMCK 11/14/2001 15:00 85 160 J05TJIMCK 11/15/2001 15:05 46 20 Juniper Beach off Juniper Beach Road on Camano Island05TJUNIP 3/29/2001 8:40 26 J 1305TJUNIP 4/19/2001 7:15 1 1705TJUNIP 5/9/2001 7:45 1 U 205TJUNIP 6/6/2001 8:50 11 1305TJUNIP 6/6/2001 8:55 R 6 4.505TJUNIP 7/11/2001 9:40 1 U 1.8 U05TJUNIP 8/22/2001 12:00 22 4905TJUNIP 9/19/2001 9:00 18 1105TJUNIP 10/17/2001 8:50 49 4905TJUNIP 11/19/2001 14:15 240 130 Kackman Creek on 252nd Street NE05TKACK 9/11/2000 12:4305TKACK 9/13/2000 13:35 12 3205TKACK 6/12/2001 15:15 2600 1600 J05TKACK 6/13/2001 13:25 75 J 200 J05TKACK 11/14/2001 12:10 130 150 J05TKACK 11/15/2001 11:00 100 84 March Creek at mouth05TMAR1 9/13/2000 11:00 18 48
Page 56

Station Date Time FieldReplicate
F.C.cfu/100mL
E. colicfu/100mL
Entero.cfu/100mL
Mainstem Stillaguamish River at Hatt Slough off Marine Drive05TMARIN 9/11/2000 15:40 130 10005TMARIN 9/11/2000 15:45 R 160 11005TMARIN 9/12/2000 15:40 48 80 5105TMARIN 9/13/2000 15:15 36 2505TMARIN 10/5/2000 10:2005TMARIN 1/31/2001 13:5505TMARIN 2/27/2001 11:55 33 J 70 J05TMARIN 3/29/2001 11:00 41 205TMARIN 3/29/2001 11:05 R 31 1305TMARIN 4/19/2001 9:40 61 1705TMARIN 5/8/2001 13:0005TMARIN 5/9/2001 9:25 59 7.805TMARIN 6/6/2001 11:30 20 2305TMARIN 6/12/2001 17:20 910 680 J05TMARIN 6/12/2001 17:30 R 1100 700 J05TMARIN 6/13/2001 12:15 200 J 130 J05TMARIN 7/11/2001 11:55 7 2205TMARIN 7/12/2001 13:2505TMARIN 8/22/2001 13:55 760 J 54005TMARIN 8/22/2001 13:56 R 860 J 54005TMARIN 9/19/2001 8:15 62 4905TMARIN 10/3/2001 14:4705TMARIN 10/16/2001 10:5005TMARIN 10/17/2001 10:25 77 4905TMARIN 11/14/2001 8:30 320 J 380 J05TMARIN 11/15/2001 9:17 170 J 110 J05TMARIN 11/15/2001 9:20 R 140 88 J05TMARIN 11/19/2001 12:55 150 49 Maintstem Stillaguamish River at Hat Slough boat launch05TMARIN2 8/7/2000 14:05 11 3705TMARIN2 8/14/2000 14:17 6 3005TMARIN2 8/21/2000 14:37 20 7405TMARIN2 8/28/2000 13:58 3 905TMARIN2 8/28/2000 13:59 R 6 605TMARIN2 9/5/2000 14:00 19 2105TMARIN2 9/5/2000 14:05 R 10 27 Mouth of March Creek at 220th Street NE05TMARSH 6/12/2001 14:25 15000 J 18000 J05TMARSH 6/13/2001 12:20 1200 J 3300 J05TMARSH 6/13/2001 12:30 R 1700 J 2000 J05TMARSH 11/14/2001 10:30 620 J 550 J05TMARSH 11/15/2001 10:05 870 900 J05TMARSH 11/15/2001 10:10 R 800 730 J Martha Lake Creek at Soundview Drive05TMARTH 2/27/2001 10:35 61 J 7.8 J05TMARTH 3/29/2001 13:25 870 J 2105TMARTH 4/19/2001 11:50 26 4905TMARTH 5/9/2001 12:05 49 2305TMARTH 6/6/2001 13:15 17 7905TMARTH 7/11/2001 12:15 31 2305TMARTH 8/22/2001 10:10 1900 J 110005TMARTH 9/19/2001 10:20 16000 J 54005TMARTH 10/17/2001 12:10 2200 54005TMARTH 11/19/2001 11:11 2200 130
Page 57

Station Date Time FieldReplicate
F.C.cfu/100mL
E. colicfu/100mL
Entero.cfu/100mL
Martha Lake Creek outlet to Warm Beach 05TMARTOL 7/11/2001 12:25 110 13005TMARTOL 8/22/2001 14:10 1500 J 24005TMARTOL 9/19/2001 10:30 7000 J 540
Miller Creek at Miller Road05TMILLR 8/8/2000 8:55 100 31005TMILLR 10/18/2000 9:00 140 4905TMILLR 6/12/2001 10:30 3600 J 2400 J05TMILLR 6/13/2001 12:39 3000 J 2100 J05TMILLR 7/17/2001 15:15 120 44005TMILLR 7/18/2001 11:55 420 130005TMILLR 7/18/2001 12:05 R 360 1200 Mainstem Stillaguamish River below Silvana05TMS6 9/11/2000 14:40 120 9605TMS6 9/13/2000 14:15 31 31 Mainstem Stillaguamish River at Interstate 5 bridge 05TMS11 9/11/2000 13:25 130 5705TMS11 9/12/2000 14:50 32 43 3905TMS11 9/12/2000 14:50 R 24 49 2705TMS11 9/13/2000 11:50 57 2705TMS11 6/12/2001 12:05 320 J 520 J05TMS11 6/12/2001 12:10 R 380 300 J05TMS11 6/13/2001 11:15 23 J 100 J05TMS11 11/14/2001 9:30 260 J 380 J05TMS11 11/15/2001 9:10 34 34 J Mainstem Stillaguamish River below March Creek 05TMS13 9/13/2000 11:20 47 31 Mainstem Stillaguamish River below Armstrong Creek05TMS15 9/11/2000 12:20 120 6305TMS15 9/13/2000 10:40 33 40 Mainstem Stillaguamish River at Dike Road05TMS17 9/13/2000 10:05 45 3105TMS17 6/12/2001 14:45 700 54005TMS17 6/13/2001 12:50 31 J 38 J05TMS17 11/14/2001 11:20 350 33005TMS17 11/15/2001 10:25 31 37 J North Fork Stillaguamish River at Cicero bridge05TNFCIC 9/12/2000 11:15 15 43 1705TNFCIC 6/12/2001 18:15 8 1405TNFCIC 6/13/2001 16:10 8 U 805TNFCIC 11/14/2001 13:55 110 7705TNFCIC 11/14/2001 14:00 R 80 80 J05TNFCIC 11/15/2001 13:02 19 1705TNFCIC 11/15/2001 13:10 R 19 19 North Fork Stillaguamish River at C-post bridge05TNFCPO 9/12/2000 10:35 4 5 405TNFCPO 6/12/2001 18:50 71 6705TNFCPO 6/13/2001 16:50 1 405TNFCPO 11/14/2001 14:25 51 37 J05TNFCPO 11/15/2001 13:35 17 17
Page 58
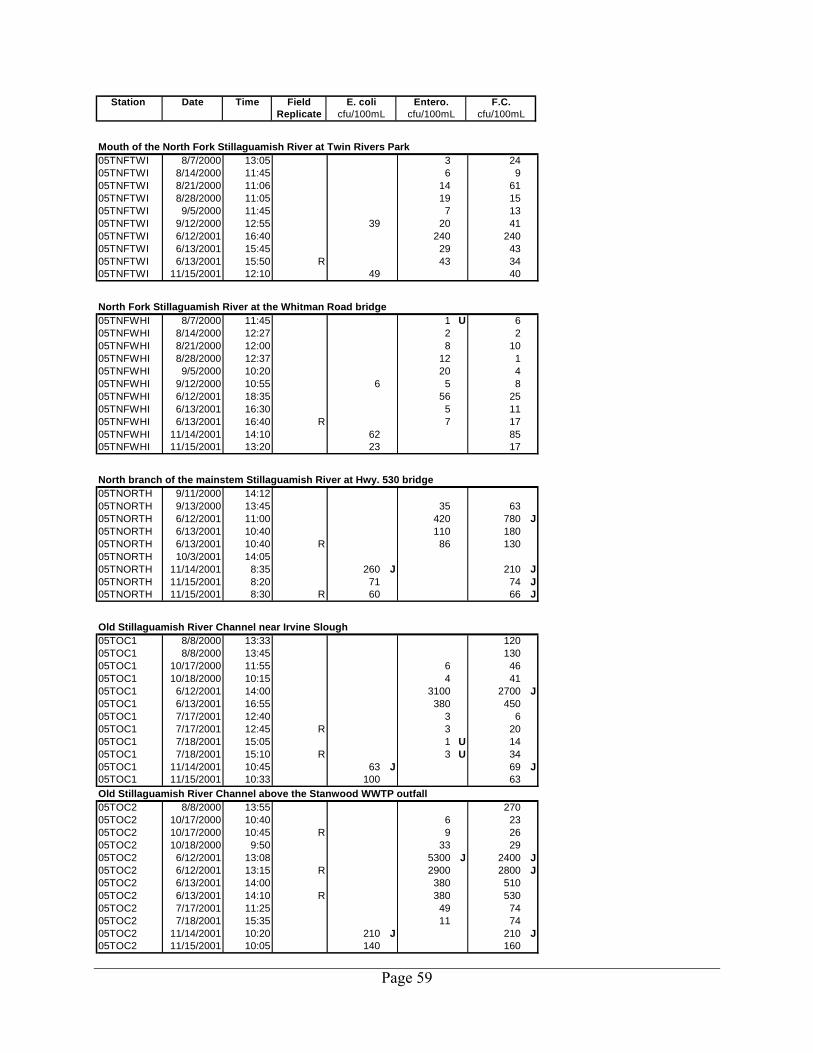
Station Date Time FieldReplicate
F.C.cfu/100mL
E. colicfu/100mL
Entero.cfu/100mL
Mouth of the North Fork Stillaguamish River at Twin Rivers Park05TNFTWI 8/7/2000 13:05 3 2405TNFTWI 8/14/2000 11:45 6 905TNFTWI 8/21/2000 11:06 14 6105TNFTWI 8/28/2000 11:05 19 1505TNFTWI 9/5/2000 11:45 7 1305TNFTWI 9/12/2000 12:55 39 20 4105TNFTWI 6/12/2001 16:40 240 24005TNFTWI 6/13/2001 15:45 29 4305TNFTWI 6/13/2001 15:50 R 43 3405TNFTWI 11/15/2001 12:10 49 40 North Fork Stillaguamish River at the Whitman Road bridge05TNFWHI 8/7/2000 11:45 1 U 605TNFWHI 8/14/2000 12:27 2 205TNFWHI 8/21/2000 12:00 8 1005TNFWHI 8/28/2000 12:37 12 105TNFWHI 9/5/2000 10:20 20 405TNFWHI 9/12/2000 10:55 6 5 805TNFWHI 6/12/2001 18:35 56 2505TNFWHI 6/13/2001 16:30 5 1105TNFWHI 6/13/2001 16:40 R 7 1705TNFWHI 11/14/2001 14:10 62 8505TNFWHI 11/15/2001 13:20 23 17 North branch of the mainstem Stillaguamish River at Hwy. 530 bridge 05TNORTH 9/11/2000 14:1205TNORTH 9/13/2000 13:45 35 6305TNORTH 6/12/2001 11:00 420 780 J05TNORTH 6/13/2001 10:40 110 18005TNORTH 6/13/2001 10:40 R 86 13005TNORTH 10/3/2001 14:0505TNORTH 11/14/2001 8:35 260 J 210 J05TNORTH 11/15/2001 8:20 71 74 J05TNORTH 11/15/2001 8:30 R 60 66 J Old Stillaguamish River Channel near Irvine Slough05TOC1 8/8/2000 13:33 12005TOC1 8/8/2000 13:45 13005TOC1 10/17/2000 11:55 6 4605TOC1 10/18/2000 10:15 4 4105TOC1 6/12/2001 14:00 3100 2700 J05TOC1 6/13/2001 16:55 380 45005TOC1 7/17/2001 12:40 3 605TOC1 7/17/2001 12:45 R 3 2005TOC1 7/18/2001 15:05 1 U 1405TOC1 7/18/2001 15:10 R 3 U 3405TOC1 11/14/2001 10:45 63 J 69 J05TOC1 11/15/2001 10:33 100 63 Old Stillaguamish River Channel above the Stanwood WWTP outfall05TOC2 8/8/2000 13:55 27005TOC2 10/17/2000 10:40 6 2305TOC2 10/17/2000 10:45 R 9 2605TOC2 10/18/2000 9:50 33 2905TOC2 6/12/2001 13:08 5300 J 2400 J05TOC2 6/12/2001 13:15 R 2900 2800 J05TOC2 6/13/2001 14:00 380 51005TOC2 6/13/2001 14:10 R 380 53005TOC2 7/17/2001 11:25 49 7405TOC2 7/18/2001 15:35 11 7405TOC2 11/14/2001 10:20 210 J 210 J05TOC2 11/15/2001 10:05 140 160
Page 59

Station Date Time FieldReplicate
F.C.cfu/100mL
E. colicfu/100mL
Entero.cfu/100mL
Old Stillaguamish River Channel at the Marine Drive bridge05TOC3 8/8/2000 15:08 18005TOC3 10/17/2000 13:50 6 2905TOC3 10/18/2000 9:15 350 J 6405TOC3 6/12/2001 10:53 600 790 J05TOC3 6/13/2001 13:05 520 J 410 J05TOC3 7/17/2001 10:05 60 J 200 J05TOC3 7/17/2001 10:15 R 55 26005TOC3 7/18/2001 15:55 32 20005TOC3 7/18/2001 16:00 R 42 28005TOC3 11/14/2001 9:45 360 J 310 J05TOC3 11/14/2001 9:50 R 310 J 450 J05TOC3 11/15/2001 9:45 63 J 130 J Old Stillaguamish River Channel at the Norman Road bridge05TOC4 8/8/2000 14:4005TOC4 8/8/2000 14:40 16005TOC4 10/17/2000 10:1505TOC4 10/18/2000 8:40 11 8405TOC4 10/18/2000 8:4005TOC4 6/12/2001 10:10 750 42005TOC4 6/12/2001 10:1005TOC4 6/13/2001 11:48 75 J 100 J05TOC4 7/17/2001 6:10 110 J 250 J05TOC4 7/18/2001 18:15 29 39005TOC4 11/14/2001 9:00 260 J 570 J05TOC4 11/15/2001 9:00 57 J 51 J Pilchuck Creek at Jackson Gulch Road05TPILCH 8/7/2000 13:44 1 U 4405TPILCH 8/7/2000 13:46 R 10 4905TPILCH 8/14/2000 14:47 3 4005TPILCH 8/21/2000 13:09 27 28005TPILCH 8/28/2000 13:30 7 4305TPILCH 9/5/2000 14:25 20 20005TPILCH 9/11/2000 13:1105TPILCH 9/12/2000 16:10 64 60 7305TPILCH 9/13/2000 14:00 48 7605TPILCH 6/12/2001 10:15 730 950 J05TPILCH 6/13/2001 9:00 250 J 75 J05TPILCH 10/3/2001 15:4505TPILCH 10/3/2001 15:5005TPILCH 11/14/2001 9:10 170 J 140 J05TPILCH 11/15/2001 9:35 47 43 J Portage Creek at the 212th Street bridge05TPORT 9/11/2000 14:1205TPORT 9/12/2000 15:05 180 J 76 190 J05TPORT 9/13/2000 16:25 130 20005TPORT 9/13/2000 16:29 R 88 24005TPORT 6/12/2001 13:30 3400 J 6300 J05TPORT 6/12/2001 13:40 R 8300 J 7000 J05TPORT 6/13/2001 11:45 1300 J 770 J05TPORT 10/3/2001 13:2505TPORT 11/14/2001 10:00 R 520 J 700 J05TPORT 11/14/2001 10:10 270 J 350 J05TPORT 11/15/2001 8:50 1900 1600 J
Page 60
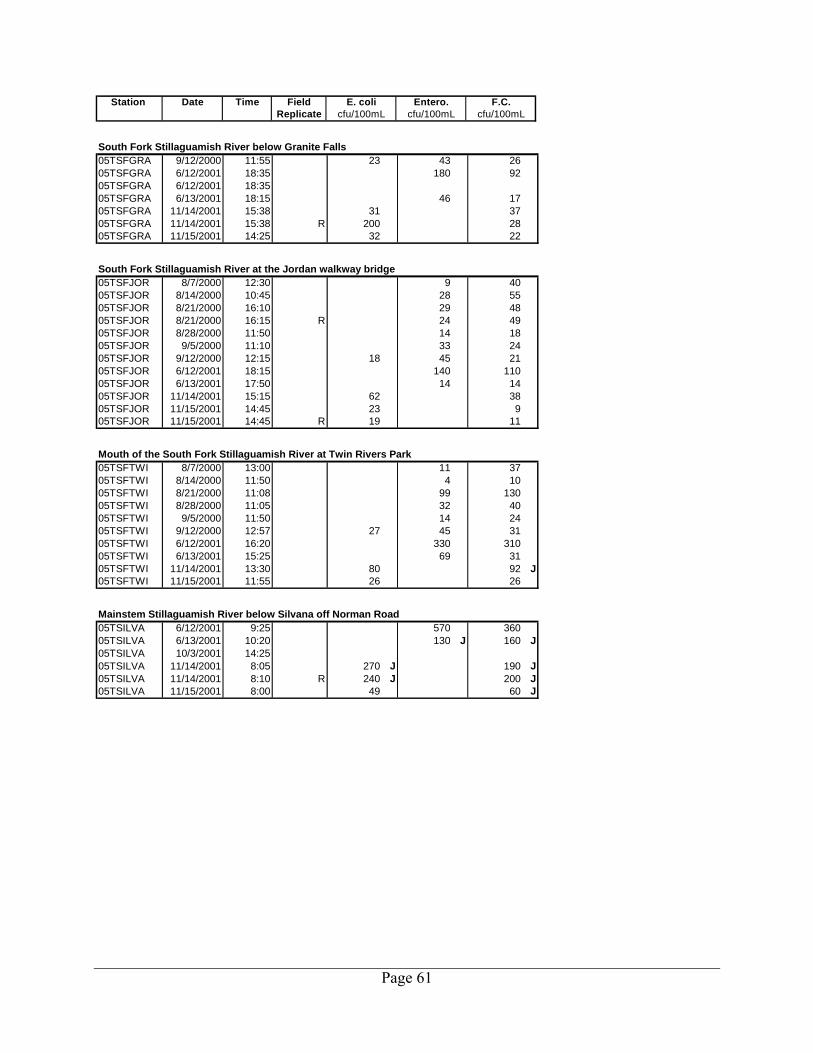
Station Date Time FieldReplicate
F.C.cfu/100mL
E. colicfu/100mL
Entero.cfu/100mL
South Fork Stillaguamish River below Granite Falls05TSFGRA 9/12/2000 11:55 23 43 2605TSFGRA 6/12/2001 18:35 180 9205TSFGRA 6/12/2001 18:3505TSFGRA 6/13/2001 18:15 46 1705TSFGRA 11/14/2001 15:38 31 3705TSFGRA 11/14/2001 15:38 R 200 2805TSFGRA 11/15/2001 14:25 32 22
South Fork Stillaguamish River at the Jordan walkway bridge05TSFJOR 8/7/2000 12:30 9 4005TSFJOR 8/14/2000 10:45 28 5505TSFJOR 8/21/2000 16:10 29 4805TSFJOR 8/21/2000 16:15 R 24 4905TSFJOR 8/28/2000 11:50 14 1805TSFJOR 9/5/2000 11:10 33 2405TSFJOR 9/12/2000 12:15 18 45 2105TSFJOR 6/12/2001 18:15 140 11005TSFJOR 6/13/2001 17:50 14 1405TSFJOR 11/14/2001 15:15 62 3805TSFJOR 11/15/2001 14:45 23 905TSFJOR 11/15/2001 14:45 R 19 11 Mouth of the South Fork Stillaguamish River at Twin Rivers Park05TSFTWI 8/7/2000 13:00 11 3705TSFTWI 8/14/2000 11:50 4 1005TSFTWI 8/21/2000 11:08 99 13005TSFTWI 8/28/2000 11:05 32 4005TSFTWI 9/5/2000 11:50 14 2405TSFTWI 9/12/2000 12:57 27 45 3105TSFTWI 6/12/2001 16:20 330 31005TSFTWI 6/13/2001 15:25 69 3105TSFTWI 11/14/2001 13:30 80 92 J05TSFTWI 11/15/2001 11:55 26 26 Mainstem Stillaguamish River below Silvana off Norman Road05TSILVA 6/12/2001 9:25 570 36005TSILVA 6/13/2001 10:20 130 J 160 J05TSILVA 10/3/2001 14:2505TSILVA 11/14/2001 8:05 270 J 190 J05TSILVA 11/14/2001 8:10 R 240 J 200 J05TSILVA 11/15/2001 8:00 49 60 J
Page 61

Station Date Time FieldReplicate
F.C.cfu/100mL
E. colicfu/100mL
Entero.cfu/100mL
South Pass at the end of Eide Road05TSOUTH 8/8/2000 13:18 2905TSOUTH 10/17/2000 10:00 6 4305TSOUTH 10/18/2000 10:40 11 3505TSOUTH 2/27/2001 13:40 2 4.505TSOUTH 3/29/2001 9:10 60 3305TSOUTH 4/19/2001 7:35 31 2305TSOUTH 5/9/2001 8:50 3 1305TSOUTH 6/6/2001 9:15 160 4905TSOUTH 6/6/2001 9:15 R 110 9505TSOUTH 6/12/2001 15:00 4700 1600 J05TSOUTH 6/13/2001 18:05 850 80005TSOUTH 6/13/2001 18:10 R 440 50005TSOUTH 7/11/2001 10:15 6 2305TSOUTH 7/11/2001 10:20 R 3 1105TSOUTH 7/17/2001 13:00 3 2005TSOUTH 7/18/2001 14:45 1 U 1405TSOUTH 8/22/2001 12:15 88 4905TSOUTH 9/19/2001 8:40 20 7.805TSOUTH 9/19/2001 8:40 R 6 1705TSOUTH 10/17/2001 9:05 120 7905TSOUTH 11/14/2001 11:48 27 3705TSOUTH 11/15/2001 11:10 88 6605TSOUTH 11/15/2001 11:13 R 69 4605TSOUTH 11/19/2001 14:35 140 24005TSOUTH 11/19/2001 14:35 R 190 79 Stanwood WWTP effluent05TSTAN 10/17/2000 10:30 3 U 3 U Twin City Foods drain #1 at dike05TTCF1 2/27/2001 12:25 1 U 1305TTCF1 2/27/2001 12:55 190 4905TTCF1 3/29/2001 9:45 14 24005TTCF1 4/19/2001 7:35 31 2305TTCF1 4/19/2001 8:10 38 54005TTCF1 5/9/2001 9:50 7 70005TTCF1 6/6/2001 10:15 80 92005TTCF1 6/12/2001 16:08 1100 1700 J05TTCF1 6/13/2001 15:49 6100 280005TTCF1 7/11/2001 11:00 87 92005TTCF1 7/18/2001 9:17 260 J 550 J05TTCF1 8/22/2001 12:50 3900 J 350005TTCF1 9/19/2001 9:30 230 54005TTCF1 9/19/2001 9:30 R 230 54005TTCF1 10/17/2001 9:40 5300 J 130005TTCF1 11/14/2001 13:20 2400 180005TTCF1 11/15/2001 11:55 770 400 Twin City Foods drain #2 on Thomle Road05TTCF2 6/12/2001 16:40 2100 J 38000 J05TTCF2 6/13/2001 16:10 2800 2700 J05TTCF2 7/17/2001 12:05 290 1405TTCF2 7/18/2001 9:40 350 J 23 J05TTCF2 11/15/2001 12:15 36 57 Twin City Foods drain #3 on Thomle Road05TTCF3 6/12/2001 16:35 3800 J 9000 J05TTCF3 6/13/2001 16:29 870 2100 J05TTCF3 7/17/2001 11:48 96 25005TTCF3 7/18/2001 10:00 180 J 410 J
Page 62

Station Date Time FieldReplicate
F.C.cfu/100mL
E. colicfu/100mL
Entero.cfu/100mL
Twin City Foods drain #4 to Hatt Slough*05TTCF4 2/27/2001 11:00 6 J 7.8 J05TTCF4 2/27/2001 11:02 R 7 J 2 J05TTCF4 3/29/2001 10:25 62 4905TTCF4 4/19/2001 9:10 13 4905TTCF4 5/9/2001 10:25 6 4605TTCF4 6/6/2001 11:10 80 7905TTCF4 7/11/2001 11:40 140 170005TTCF4 8/22/2001 13:40 77 240005TTCF4 9/19/2001 10:00 47 J 54005TTCF4 10/17/2001 10:05 19 24005TTCF4 10/17/2001 10:10 R 17 240* Drain was always plugged and never discharging to Hatt Slough during sampling events. Twin City Foods drain #5 at footbridge above Thomle Road05TTCF5 8/9/2000 12:2505TTCF5 2/27/2001 12:5505TTCF5 6/12/2001 15:35 1800 J 8000 J05TTCF5 6/13/2001 13:29 1100 J 2500 J05TTCF5 7/17/2001 10:50 400 28005TTCF5 7/18/2001 10:13 180 J 210 J05TTCF5 11/14/2001 13:47 160 16005TTCF5 11/14/2001 13:55 R 190 11005TTCF5 11/15/2001 12:25 120 140 J05TTCF5 11/15/2001 12:30 R 92 100 J Unnamed Creek #0456 at the end of Soundview Drive05TUNIDE 3/29/2001 13:45 1900 J 4605TUNIDE 4/19/2001 12:05 860 J 54005TUNIDE 5/9/2001 12:25 280 4905TUNIDE 5/9/2001 12:30 R 150 7905TUNIDE 6/6/2001 13:30 490 350005TUNIDE 8/22/2001 9:45 10000 J 240005TUNIDE 10/17/2001 11:50 340 7905TUNIDE 11/19/2001 11:30 3000 J 790 Warm Beach WWTP effluent at Warm Beach05TWAREF 2/27/2001 10:05 3 J 7.8 J05TWAREF 3/29/2001 12:20 21 4905TWAREF 4/19/2001 10:45 3 U 4.505TWAREF 5/9/2001 11:20 4000 J 20000 J05TWAREF 6/6/2001 12:15 14 13005TWAREF 7/11/2001 13:15 29 17005TWAREF 8/22/2001 10:50 1800 54005TWAREF 10/17/2001 11:05 76 1105TWAREF 11/19/2001 12:00 190 7.8 Pump pond slough at Warm Beach05TWARSL 2/27/2001 9:42 110 J 33 J05TWARSL 3/29/2001 12:45 31 3305TWARSL 4/19/2001 10:55 65 24005TWARSL 4/19/2001 11:00 R 61 4905TWARSL 5/9/2001 11:50 160 54005TWARSL 6/6/2001 12:30 380 35005TWARSL 7/11/2001 13:35 600 54005TWARSL 8/22/2001 11:15 1900 170005TWARSL 9/19/2001 11:40 380 J 35005TWARSL 10/17/2001 11:15 6700 J 24005TWARSL 11/19/2001 12:17 2000 11005TWARSL 11/19/2001 12:20 R 1600 130
Page 63

Table C-4. Metals analyses data for the Stillaguamish River TMDL.
Station Date Time FieldReplicate
Tot. Rec.
Hardnessmg/L
Dissolved Tot. Rec.
Arsenicµg/L
Dissolved Tot. Rec.
Nickelµg/L
Mercuryµg/L
Tot. Rec.Dissolved Tot. Rec.
Copperµg/L
Leadµg/L
Dissolved Arlington WWTP effluent 05TARLIN 9/13/2000 11:17 62.1*05TARLIN 6/12/2001 15:40 57.0 0.90 0.85 7.05 9.57 0.534 0.82 J 0.0034 2.77 2.9805TARLIN 10/3/2001 12:15 42.7 0.89 0.91 9.35 11.90 0.521 0.630 0.0084 8.92 10.5005TARLIN 10/16/2001 14:00 50.3 0.83 0.83 11.90 17.70 0.423 0.590 0.0096 1.69 2.04*24-hour composite Church Creek/Jorgenson Slough at Marine Drive05TCHURH 10/5/2000 8:45 93.3 1.20 1.40 0.92 2.37 0.053 0.280 0.0029 2.14 3.3205TCHURH 10/17/2000 13:20 703.0 0.82 0.62 1.50 30.10 0.500 U 1.000 U 0.0043 2.00 U 4.1005TCHURH 1/31/2001 14:30 39.5 0.62 0.78 J 1.69 2.90 0.125 0.630 0.0140 2.52 4.8705TCHURH 5/8/2001 13:23 58.0 1.09 1.11 1.23 1.42 0.091 0.200 0.0110 3.98 4.4305TCHURH 6/13/2001 18:45 44.9 0.99 1.27 2.32 3.35 0.190 0.760 J 0.0170 5.55 7.3905TCHURH 7/12/2001 13:50 252.0 2.00 U 2.54 2.11 3.89 0.200 U 0.930 0.0092 2.86 3.9505TCHURH 10/16/2001 11:20 74.2 1.40 1.50 1.18 1.74 0.095 0.180 0.0200 2.04 2.61 Douglas Slough south of Hwy. 53205TDOUG 10/17/2000 12:55 2560.0 0.50 U 0.50 U 8.00 40.90 0.500 U 1.000 U 0.0052 7.90 8.2005TDOUG 6/13/2001 17:35 1120.0 19.50 22.50 4.26 6.87 0.472 0.970 J 0.0110 14.20 16.80 Irvine Slough at dike pump station05TIRVIN 10/17/2000 11:30 179.0 0.50 U 1.10 1.87 3.72 0.160 1.270 0.0039 4.73 6.3205TIRVIN 6/13/2001 17:08 188.0 1.64 2.21 5.27 7.00 0.069 0.510 J 0.0100 73.00 76.70 Mainstem Stillaguamish River at Hatt Slough off Marine Drive05TMARIN 9/11/2000 15:40 19.305TMARIN 9/11/2000 15:45 19.205TMARIN 9/13/2000 15:15 28.805TMARIN 10/5/2000 10:20 26.9 0.50 U 0.50 U 0.68 1.21 0.050 U 0.100 0.0020 U 1.53 2.6605TMARIN 1/31/2001 13:55 26.7 0.41 1.66 J 1.46 10.50 0.056 2.380 0.0216 J 3.49 29.8005TMARIN 5/8/2001 13:00 23.0 0.41 0.47 0.56 1.08 0.022 0.160 0.0046 1.70 3.0505TMARIN 6/13/2001 12:15 18.9 0.45 0.82 1.14 3.19 0.066 0.600 J 0.0100 2.78 8.5505TMARIN 7/12/2001 13:25 30.7 0.65 0.65 0.57 0.72 0.022 0.069 0.0036 1.02 1.2305TMARIN 10/16/2001 10:50 22.4 0.55 0.66 0.882 1.40 J 0.041 0.120 0.0076 1.93 3.30
Page 64

Station Date Time FieldReplicate
Tot. Rec.
Hardnessmg/L
Dissolved Tot. Rec.
Arsenicµg/L
Dissolved Tot. Rec.
Nickelµg/L
Mercuryµg/L
Tot. Rec.Dissolved Tot. Rec.
Copperµg/L
Leadµg/L
Dissolved Mainstem Stillaguamish River below Silvana05TMS6 9/11/2000 14:40 20.205TMS6 9/13/2000 14:15 28.8 Mainstem Stillaguamish River at Interstate 5 bridge 05TMS11 9/11/2000 13:25 19.705TMS11 9/13/2000 11:50 27.805TMS11 1/31/2001 13:20 29.3 0.44 2.40 J 1.38 10.30 0.053 2.160 0.0217 J 2.42 24.6005TMS11 5/8/2001 15:04 21.9 0.37 0.60 0.52 1.09 0.020 U 0.150 0.0030 1.45 2.9405TMS11 6/12/2001 12:05 20.1 0.44 1.40 1.19 6.78 0.053 1.880 0.0190 2.16 16.8005TMS11 6/12/2001 12:10 R 19.6 0.44 1.48 1.25 6.98 0.067 1.980 0.0190 2.20 16.9005TMS11 7/12/2001 11:20 28.6 0.67 0.67 0.48 0.67 0.020 U 0.074 0.0026 0.93 1.1905TMS11 10/3/2001 12:59 55.6 0.81 0.88 0.58 1.08 J 0.024 0.100 U 0.0043 1.67 J 0.9505TMS11 10/3/2001 13:05 R 41.7 0.79 0.89 0.577 1.01 J 0.023 0.100 U 0.0033 1.74 2.5005TMS11 10/16/2001 12:15 22.7 0.56 0.67 0.728 1.44 J 0.020 U 0.140 0.0064 1.42 2.87 North Fork Stillaguamish River at Cicero bridge05TNFCIC 1/31/2001 12:00 22.3 0.38 0.66 J 0.85 2.99 0.042 0.490 0.0063 4.27 12.6005TNFCIC 5/8/2001 16:49 22.2 0.40 0.43 0.47 0.83 0.020 U 0.090 0.0034 1.72 2.6605TNFCIC 7/12/2001 9:45 29.4 0.78 0.75 0.34 0.50 0.020 U 0.054 0.0020 U 0.78 1.1005TNFCIC 10/16/2001 15:20 26.5 0.65 0.70 0.516 0.88 J 0.071 0.100 U 0.0054 1.90 2.8505TNFCIC 10/16/2001 15:25 R 26.5 0.65 0.69 0.584 0.94 0.024 0.100 U 0.0058 1.92 2.64 Mouth of the North Fork Stillaguamish River at Twin Rivers Park05TNFTWI 9/11/2000 11:19 24.205TNFTWI 9/13/2000 10:10 32.405TNFTWI 6/12/2001 16:40 19.9 0.42 1.02 1.04 4.16 0.071 1.160 J 0.0160 3.61 15.5005TNFTWI 10/3/2001 11:22 34.6 0.91 0.96 0.45 0.75 J 0.020 U 0.100 U 0.0032 2.28 2.80 Old Stillaguamish River Channel above the Stanwood WWTP outfall05TOC2 10/17/2000 10:40 2750.0 0.50 U 0.50 U 5.44 8.90 0.500 U 1.000 U 0.0042 6.10 9.7005TOC2 10/17/2000 10:45 R 2530.0 0.50 U 0.50 U 5.60 20.90 0.500 U 1.000 U 0.0040 6.60 11.5005TOC2 6/13/2001 14:00 39.6 0.81 1.65 2.18 7.07 0.099 1.310 J 0.0170 5.49 17.1005TOC2 6/13/2001 14:10 R 38.4 0.83 1.58 2.18 29.40 0.093 2.250 0.0180 5.41 16.30
Page 65

Station Date Time FieldReplicate
Tot. Rec.
Hardnessmg/L
Dissolved Tot. Rec.
Arsenicµg/L
Dissolved Tot. Rec.
Nickelµg/L
Mercuryµg/L
Tot. Rec.Dissolved Tot. Rec.
Copperµg/L
Leadµg/L
Dissolved Old Stillaguamish River Channel at the Marine Drive bridge05TOC3 10/5/2000 9:40 152.0 0.70 1.10 0.84 2.40 0.100 U 0.250 0.0020 U 3.03 6.0405TOC3 10/17/2000 13:50 767.0 0.50 U 3.00 2.40 13.80 0.500 U 1.800 0.0130 4.50 27.4005TOC3 1/31/2001 15:10 43.7 0.77 3.02 J 1.89 18.00 0.056 4.950 0.0556 4.59 48.1005TOC3 1/31/2001 15:15 R 46.7 0.87 3.05 J 1.84 18.10 0.045 4.990 0.0612 5.13 49.1005TOC3 5/8/2001 11:50 38.0 0.60 1.32 0.83 4.83 0.038 1.030 0.0120 2.65 11.7005TOC3 5/8/2001 11:55 R 38.2 0.60 1.10 0.81 4.07 0.038 1.020 0.0140 2.53 7.5805TOC3 6/13/2001 13:05 31.5 0.68 1.55 1.96 7.39 0.082 1.320 J 0.0180 4.18 17.9005TOC3 7/12/2001 12:40 392.0 2.00 U 5.18 1.70 6.07 0.200 U 1.670 0.0150 5.40 14.6005TOC3 7/12/2001 12:40 R 393.0 2.00 U 5.04 1.65 6.13 0.200 U 1.640 0.0190 4.75 14.5405TOC3 10/16/2001 10:00 56.1 1.20 2.78 0.968 10.40 0.100 2.390 0.0423 2.22 18.50 Old Stillaguamish River Channel at the Norman Road bridge05TOC4 10/17/2000 10:15 37.4 0.65 0.60 0.61 1.72 0.050 U 0.210 0.0048 1.65 3.6605TOC4 6/13/2001 11:48 19.0 0.45 0.82 1.17 3.39 0.063 0.620 J 0.0110 2.92 8.74 Portage Creek at the 212th Street bridge05TPORT 6/12/2001 13:30 47.6 1.70 2.73 1.90 3.31 0.140 1.160 J 0.0180 2.91 5.51 Mouth of the South Fork Stillaguamish River at Twin Rivers Park05TSFTWI 9/11/2000 11:24 16.905TSFTWI 9/13/2000 10:20 23.005TSFTWI 10/5/2000 11:22 22.2 0.50 U 0.50 U 0.50 1.92 0.050 U 0.690 0.0021 0.29 3.4305TSFTWI 1/31/2001 11:00 33.7 0.50 2.25 J 1.64 16.20 0.050 3.120 0.0261 J 1.04 31.1005TSFTWI 5/8/2001 15:53 19.6 0.39 0.44 0.51 1.61 0.021 0.170 0.0029 0.64 2.0005TSFTWI 6/12/2001 16:20 29.0 0.55 3.27 2.18 21.80 0.079 4.600 0.0497 1.11 39.6005TSFTWI 7/12/2001 10:25 23.2 0.63 0.68 0.54 1.07 0.021 0.140 0.0025 0.23 1.1905TSFTWI 10/3/2001 11:37 39.5 0.80 0.84 0.598 1.10 J 0.023 0.100 U 0.0029 0.60 1.5005TSFTWI 10/16/2001 14:30 19.2 0.53 0.61 0.712 1.49 J 0.038 0.130 0.0059 0.45 1.59 Stanwood WWTP effluent05TSTAN 6/13/2001 14:40 143.0 3.93 3.84 3.08 3.78 0.300 0.710 J 0.0097 8.02 8.59
Page 66

Appendix D.
Diel Survey Data for the Stillaguamish River Watershed Fecal Coliform, Dissolved Oxygen, pH, Mercury, and Arsenic TMDL
Page 67
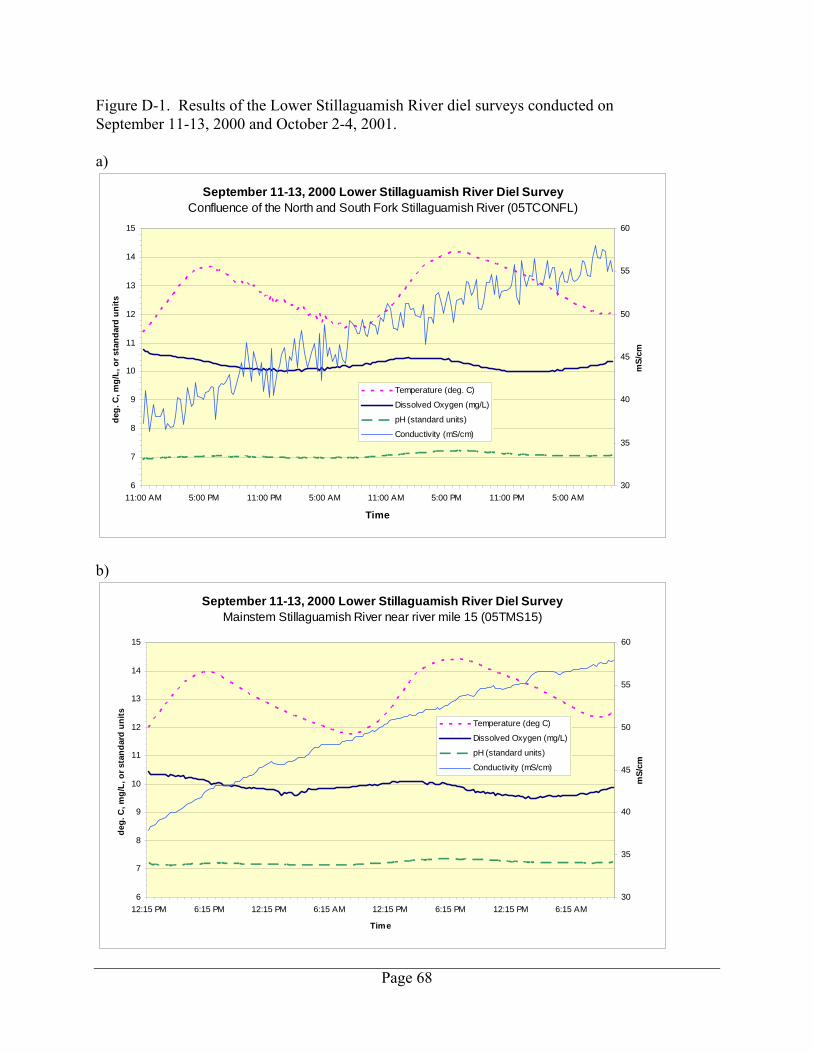
Figure D-1. Results of the Lower Stillaguamish River diel surveys conducted on September 11-13, 2000 and October 2-4, 2001. a)
September 11-13, 2000 Lower Stillaguamish River Diel SurveyConfluence of the North and South Fork Stillaguamish River (05TCONFL)
6
7
8
9
10
11
12
13
14
15
11:00 AM 5:00 PM 11:00 PM 5:00 AM 11:00 AM 5:00 PM 11:00 PM 5:00 AM
Time
deg.
C, m
g/L,
or s
tand
ard
units
30
35
40
45
50
55
60
mS/
cm
Temperature (deg. C)
Dissolved Oxygen (mg/L)
pH (standard units)
Conductivity (mS/cm)
b)
September 11-13, 2000 Lower Stillaguamish River Diel Survey Mainstem Stillaguamish River near river mile 15 (05TMS15)
6
7
8
9
10
11
12
13
14
15
12:15 PM 6:15 PM 12:15 PM 6:15 AM 12:15 PM 6:15 PM 12:15 PM 6:15 AM
Time
deg.
C, m
g/L,
or s
tand
ard
units
30
35
40
45
50
55
60m
S/cm
Temperature (deg C)
Dissolved Oxygen (mg/L)
pH (standard units)
Conductivity (mS/cm)
Page 68

c)
September 11-13, 2000 Lower Stilliguamish River Diel SurveyMainstem Stillaguamish River near river mile 13 (05TMS13)
6
7
8
9
10
11
12
13
14
15
1:00 PM 7:00 PM 1:00 AM 7:00 AM 1:00 PM 7:00 PM 1:00 AM 7:00 AM
Time
deg.
C, m
g/L,
or s
tand
ard
units
30
35
40
45
50
55
60
65
mS/
cm
Temperature (deg. C)
Dissolved Oxygen (mg/L)
pH (standard units)
Conductivity (mS/cm)
d)
October 2-4, 2001 Lower Stillaguamish River Diel SurveyConfluence of the North and South Fork Stillaguamish River (05TCONFL)
6
7
8
9
10
11
12
13
14
15
12:15 PM 6:15 PM 12:15 PM 6:15 AM 12:15 PM 6:15 PM 12:15 PM 6:15 AM 12:15 PM
Time
deg.
C, m
g/L,
or s
tand
ard
units
72
73
74
75
76
77
78
79
80
mS/
cm
Temperature (deg. C)
Dissolved Oxygen (mg/L)
pH (standard units)
Conductivity (mS/cm)
Page 69

e)
October 2-4, 2001 Lower Stillaguamish River Diel SurveyMainstem Stillaguamish River near river mile 15 (05TMS15)
6
7
8
9
10
11
12
13
14
15
2:15 PM 8:15 PM 2:15 AM 8:15 AM 2:15 PM 8:15 PM 2:15 AM 8:15 AM
Time
deg.
C, m
g/L,
or s
tand
ard
units
72
73
74
75
76
77
78
79
mS/
cm
Temperature (deg. C)
Dissolved Oxygen (mg/L)
pH (standard units)
Conductivity (mS/cm)
f)
October 2-4, 2001 Lower Stillaguamish River Diel SurveyMainstem Stillaguamish River near river mile 13 (05TMS13)
6
7
8
9
10
11
12
13
14
15
3:15 PM 9:15 PM 3:15 AM 9:15 AM 3:15 PM 9:15 PM 3:15 AM 9:15 AM
Time
deg.
C, m
g/L,
or s
tand
ard
units
72
74
76
78
80
82
84
86
mS/
cm
Temperature (deg. C)
Dissolved Oxygen (mg/L)
pH (standard units)
Conductivity (mS/cm)
Page 70

g)
October 2-4, 2001 Lower Stillaguamish River Diel SurveyMainstem Stillaguamish River near river mile 11 (05TMS11)- pH probe failed
8
9
10
11
12
13
14
4:45 PM 10:45 PM 4:45 AM 10:45 AM 4:45 PM 10:45 PM 4:45 AM 10:45 AM
Time
deg.
C o
r mg/
L
72
74
76
78
80
82
84
mS/
cm
Temperature (deg. C)
Dissolved Oxygen (mg/L)
Conductivity (mS/cm)
Page 71

Figure D-2. Results of the Old Stillaguamish Channel low-flow period diel surveys conducted on August 7-9, 2000 and July 17-18, 2001. a)
August 7-9, 2000 Old Stillaguamish Channel Low-flow Period Diel SurveyUpstream of Irvine Slough (05TOC1)- salinity probe failed
0
5
10
15
20
25
5:45 PM 11:45 PM 5:45 AM 11:45 AM 5:45 PM 11:45 PM 5:45 AM 11:45 AM
Time
deg.
C, m
g/L,
or s
tand
ard
units
Temperature (deg. C)
Dissolved Oxygen (mg/L)
pH (standard units)
b)
July 17-18, 2001 Old Stillaguamish Channel Low-flow Period Diel SurveyOld Stillaguamish Channel at Stanwood (Between 05TOC3 and 05TOC4)
0
5
10
15
20
25
9:00 AM 3:00 PM 9:00 PM 3:00 AM 9:00 AM 3:00 PM
Time
deg.
C, m
g/L,
or s
tand
ard
units
Temperature (deg. C)
Dissolved Oxygen (mg/L)
pH (standard units)
Salinity (ppt)
Page 72
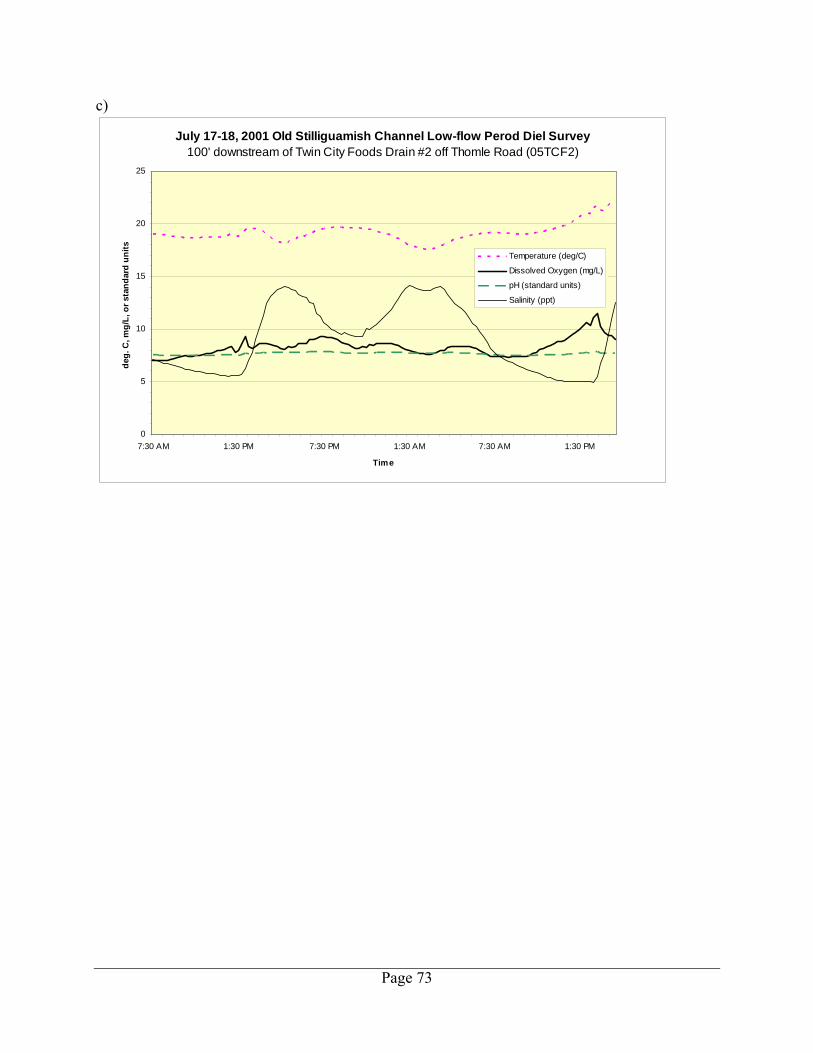
c)
July 17-18, 2001 Old Stilliguamish Channel Low-flow Perod Diel Survey100' downstream of Twin City Foods Drain #2 off Thomle Road (05TCF2)
0
5
10
15
20
25
7:30 AM 1:30 PM 7:30 PM 1:30 AM 7:30 AM 1:30 PM
Time
deg.
C, m
g/L,
or s
tand
ard
units
Temperature (deg/C)
Dissolved Oxygen (mg/L)
pH (standard units)
Salinity (ppt)
Page 73