Data Summ Volume 1: Report - NREL · October 1992 • NREL/TP-431-4988A Data Summ Waste Manage...
216
October 1992 • NRELP-431-4988A Data Summ Waste Manage Volume 1: Report Municipal Solid t Alternatives SRI International Menlo Park, Calornia National Renewable Energy Laboratory 1617 Cole Boulevard Golden, Colorado 80401-3393 Operated by Midwest Research Institute for the U.S. Department of Energy Under Contract No. DE-AC02-83CH10093
Transcript of Data Summ Volume 1: Report - NREL · October 1992 • NREL/TP-431-4988A Data Summ Waste Manage...
October 1992 • NREL/TP-431-4988A
Data Summ Waste Manage
Volume 1: Report
Municipal Solid t Alternatives
SRI International Menlo Park, California
National Renewable Energy Laboratory 1617 Cole Boulevard Golden, Colorado 80401-3393 Operated by Midwest Research Institute for the U.S. Department of Energy Under Contract No. DE-AC02-83CH10093
NOTICE
This report was prepared as an account of work sponsored by an agency of the United States government. Neither the United States government nor any agency thereof, nor any of their employees, makes any warranty, express or implied, or assumes any legal liability or responsibility for the accuracy, completeness, or usefulness of any information, apparatus, product, or process disclosed, or represents that its use would not infringe privately owned rights. Reference herein to any specific commercial product, process, or service by trade name, trademark, manufacturer, or otherwise does not necessarily constitute or imply its endorsement, recommendation, or favoring by the United States government or any agency thereof. The views and opinions of authors expressed herein do not necessarily state or reflect those of the United States government or any agency thereof.
Printed in the United States of America Available from:
National Technical Information Service U.S. Department of Commerce
5285 Port Royal Road Springfield, VA 22161
Price: Microfiche A01 Printed Copy A 1 0
Codes are used for pricing all publications. The code is determined by the number of pages in the publication. Information pertaining to the pricing codes can be found in the current issue of the following publications which are generally available in most libraries: Energy Research Abstracts (ERA); Government Reports Announcements and Index ( GRA and I); Scientific and Technical Abstract Reports (STAR); and publication NTIS-PR-360 available from NTIS at the above address.
! \

NREL!fP-431-4988A • UC Category 249 • D£92016433
Data s_ ......... .. L.a.&-.IL
Waste Managem
Volume 1: Report
Municipal Solid t Alternatives
SRI International Menlo Park, California
NREL Technical Monitors: Bimleshwar Gupta Philip Shepherd
National Renewable Energy Laboratory (formerly the Solar Energy Research Institute) 1617 Cole Boulevard Golden, Colorado 80401-3393 A Division of Midwest Research Institute Operated for the U,S. Department of Energy under Contract No. DE-AC02-83CH10093
Prepared under subcontract no: RF-1-1103
October 1992
Report Organization
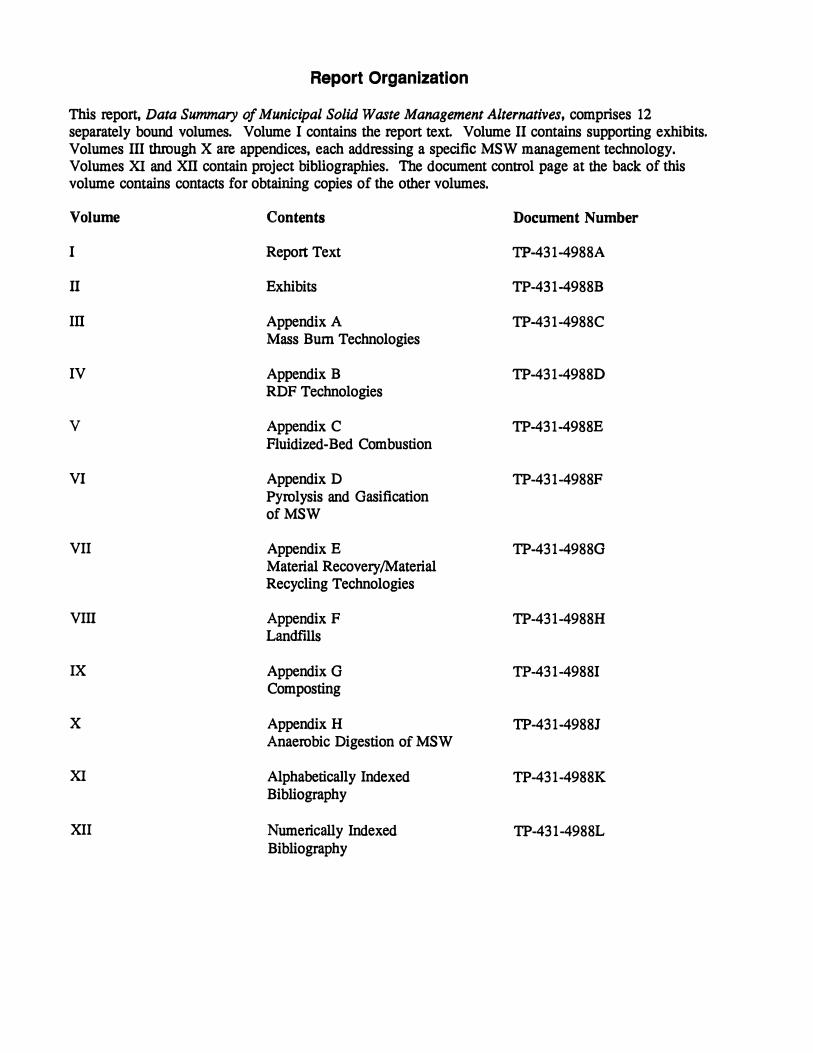
This report, Data Summary of Municipal Solid Waste Management Alternatives, comprises 12 separately bound volumes. Volume I contains the report text. Volume II contains supporting exhibits. Volumes III through X are appendices, each addressing a specific MSW management technology. Volumes XI and XII contain project bibliographies. The document control page at the back of this volume contains contacts for obtaining copies of the other volumes.
Volume
I
II
III
IV
v
VI
VII
VIII
IX
X
XI
XII
Contents
Report Text
Exhibits
Appendix A Mass Bum Technologies
Appendix B RDF Technologies
Appendix C Fluidized-Bed Combustion
Appendix D Pyrolysis and Gasification ofMSW
Appendix E Material Recovery/Material Recycling Technologies
Appendix F Landfills
Appendix G Com posting
Appendix H Anaerobic Digestion of MSW
Alphabetically Indexed Bibliography
Numerically Indexed Bibliography
Document Number
TP-431-4988A
TP-431-4988B
TP-431-4988C
TP-431-49880
TP-431-4988E
TP-431-4988F
TP-431-49880
TP-431-4988H
TP-431-4988I
TP-431-49881
TP-431-4988K
TP-431-4988L

PROJECT OBJECTIVES
The overall objective of the study summarized in this report was to gather data on waste management technologies to allow comparison of various alternatives for managing municipal solid waste (MSW). The specific objectives of the study were to:
1 . Compile detailed data for existing waste management technologies on costs, environmental releases, energy requirements and production, and coproducts such as recycled materials and compost.
2. Identify missing information necessary to make energy, economic, and environmental comparisons of various MSW management technologies, and defme needed research that could enhance the usefulness of the technology.
3. Develop a data base that can be used to identify the technology that best meets specific criteria defined by a user of the data base.
iii

PREFACE
This report provides data for use in evaluating the proven technologies and combinations of technologies that might be considered for managing municipal solid waste (MSW). It covers five major methods for MSW management in common use today:
• Landfilling • Mass combustion for energy recovery • Production of refuse-derived fuel (RDF) • Collection/separation of recyclables • Composting.
It also provides information on three MSW management technologies that are not widely used at present:
• Anaerobic digestion • Co firing of MSW with coal • Gasification/pyrolysis.
To the extent possible with available reliable data, the report presents information for each proven MSW technology on:
• Net energy balances • Environmental releases • Economics.
In addition to data about individual operations, the report presents net energy balances and inventories of environmental releases from selected combined MSW management strategies that use two or more separate operations.
The scope of the report extends from the waste's origin (defined as the point at which the waste is set out for collection), through transportation and processing operations, to its final disposition (e.g., recycling and remanufacturing, combustion, or landfilling operations). Data for all operations are presented on a consistent basis: one (1) ton of municipal (i.e., residential, commercial, and institutional) waste at the collection point. The data provided in tables in this report are also available in a spreadsheet that allows the user to modify the information and to tailor the combination strategies to fit a particular need. In the process of developing the data presented here, one goal was to identify where gaps in the available information exist as a guide to future data collection and research efforts.
Selection of an MSW management plan may be influenced by many factors, in addition to the technical performance and economics of each option. The importance of or emphasis on eac h of these factors is likely to differ for each jurisdiction. The factors below fall into this category, but were excluded from the scope of this report:
• Ecological impacts • Health risks • Social and other values • Specific jurisdictional circumstances.
The MSW technologies covered in this report do not exhaust the plausible components of waste management strategies. For example, many communities have initiated efforts to decrease the amount of waste that must be handled by promoting source reduction and waste minimization, including backyard composting, but data on those programs are not analyzed here.
v


VOLUME!: REPORT TEXT
PROJECT OBJECTIVES
CONTENTS
PREP ACE ................................................................................................................ .
CONTENTS ........................................................................................................... .. .
LIST OF ILLUSTRATIONS ....... ............................................................................ .
LIST OF TABLES ........................................................................... ........................ .
EXECUTIVE SUMMARY ...................................................................................... .
Data Quality ................................................................................... .......................... .
Major Technologies ................................................................ .......................... .
Less Commonly Used Technologies ................................................................ .
Collection and Transportation ........................................................................... .
Cost Data ........................................................................................................... .
Methodology ............................................................................................................ .
Basis for the Comparisons: a Life-Cycle Analysis .......................................... .
Energy and Emissions ................................................................................. .
Costs ........ .............................. ...................................................................... .
Data Formats ............................. .. .... ...... ............................................................ .
Findings .................................................................................................................... .
Overview of MSW Management in the United States ....................................... .
Collection and Transportation ................... ........................................................ .
Status of the Major Waste Management Options ....... .................. .... ................ .
Sanitary Lan dfillin g .................................................................................... .
Combustion with Energy Recovery ................ ............................................ . Curbside Separation and Mixed Waste Separation and
Recycling ................................................................................................. .
Com posting ......................................... ........................................................ .
Status of the Less Common Options ................................................................. .
Cofiring RDF with Coal .......... .. .................................................................. .
Anaerobic Digestion ................................................................................... .
Gasification/Pyrolysis ................................................. ...... ............ .............. .
Life-Cycle Energy and Environmental Releases from Common Integrated Strategies ....................................................... ................................ .
Energy Savings from the Various Options ................................................. .
Air Emissions .................................. .... .... ....... ", ........ .................................... . Water Emissions
vii
IV
v
Vll
XV
xvii
1
2 2 3 3 3
4 4 4 5 5
5 5 6 7 7 8
9 10 10 10 1 1 1 1
1 1 1 1 17 17
Landfill Space .................................................................................................... 19 Cost Data for the Major Waste Management Options ....................................... 2 1
Missing Data and Research Needs ............................................................................ 2 1
Other Project Documentation .................................................................................... 26
1. IN1RODUCTION .............................................................. ....................................... 29
Objectives, Scope, Methodology .............................................................................. 29 Objectives .............................................................. :........................................... 30 Project Scope .. .. ............ .. .... .. .... .............•.. .. .... ........ ...... .............. ........ .. .. .. ...... ... 30 Methodology ...................................................................................................... 31
Life-Cycle Analysis ..................................................................................... 31 Data Consistency ................................................ ........ ................................. 31
Data Quality ..................................................................... .................. .... ................... 34 Major Technologies ........................................................................................... 34 Less Commonly Used Technologies ................................................................. 35 Collection and Transportation ............................................................................ 35 Cost Data ... .. .. .............. .. .. .... .. .. ........ .. ...... .. .... .. .. ...... .. .. .... .. .. .. ...... ...... .. . . .. .. .. .. .. .. . 36
Contents and Organization of the Report and Appendixes ....................................... 36
2. ENERGY CONSIDERATIONS .......................................... ..................................... 39
Bases for Comparisons .............................................................................................. 39
Energy Requirements for Individual Technologies .................................................. 40
Net Energy Balances for Selected Strategies ........................................... ................. 40
3. ENVIRONMENTAL RELEASES ................................................................................... 47
Bases for Comparisons .............................................................................................. 47
Emissions from Major Individual Technologies .................................... :.................. 48
Emissions from Integrated MSW Strategies .......................................................... ... 48 Air Emissions ................................................................................................ ..... 48 Collection and Transportation ............................................................................ 51 Water Emissions ................................................................................................ 52 Landfill Space .................................................................................................... 54
4. DATA SOURCES AND DATA BASE ........................................................................... 57
Purpose of The Data Base
Structure of the Data Base Information Provided Limitations of the Data Base ............................................................................. .
Data Sources and Assumptions ................................................................................ .
viii
57
57 61 61
61

5. COMBUSTION ....... ........................................................................ ......................... 65
Common Issues for Mass Bum and RDF .................................................................. 65 Pollution Control, New Source Performance Standards for
Combustors, and Effects of the Clean Air Act Amendments of 1990 ................................................................................. ............................... 65
Energy Recovery ................................................................................................ 66 Limitations on the Cost Data ............................................................ .. ............... 66
Mass Burning ............................... ............................................................................. 68 Technology Description ..................................................................................... 68 Commercial Status .................................................... . . ............ ........................... 70 Energy Balance ................. .............................................................. .......... ......... 70
Energy Requirements ................................................................................... 70 Energy Production ....................................................................................... 70 Net Energy Balance ..................................................................................... 70
Cost Considerations .... .... .... .. .. ...... .... .... .... .. .... .. .... .. .. .. .. .. .. .. .. .. .. .. .. .. .. .... .. .. .. .. .. .. . 71 Mass Burn: Field Erected ....... .... .. .... .. .. .. .. .. .. .. .. .. .. .. .. .. .. .. .. .. .. .. .. .. .... .. .. .... .. ... 7 1 Mass Bum: Modular ................................................................................... 71
Environmental Releases .............................. ....................................................... 7 5 rx··· Air ···············································································································. 7 5
Water ....... ..................................................................................................... 75 Land ............................................ ................................................................. 75
Integrated Strategy Example: Mass Burning of MSW with Electricity Generation and Ash Disposal in a Monofill ... ............................... 7 5
Other Integrated Strategies Described in the Data Base .................................... 77
Refuse-Derived Fuel .. ........ .. .... .. .... .. ...... .. .... .. ...... .. .. .. .. .. .. .. .. .. .. .. .. .. .. .... .. .. .. .. .. .. .. .. .. .. . 80 Technology Description ..................................................................................... 80
RDF Production ........................................................................................... 80 RDF Combustion .............................................................................. ........... 81
Commercial Status .... .................................. ........................ .... .. ............ ...... ....... 81 Prevalence ... . . ...... .. .... .. .. .. .... .. .... .. .... .... .... .. .. .... .. .... .. .. .. .. .. .. ...... .. .. .. .. .. .. .... .. .. . 81 Applications and Markets ................................. ........................................... 82
Energy Balance ........................................... ............ .................................... ....... 82 Energy Requirements for RDF Preparation .......... .... .... ............ ........ ........... 82 Energy Produced by RDF Combustion ........................................................ 82 Net Energy Balance ..................................................................................... 82
Cost Considerations ........................................ ...... .. .......................... ................. 83 Environmental Releases .......................................... .................................... ....... 83
Air Emissions .................................................................................. ............. 83 Water Emissions ........... .... ........................................................................... 83 Land Use ................................... ................................................ ................... 86
Integrated Strategy Example: RDF Preparation and Combustion with Electricity Generation, Ash Disposal in a Monofill, and Landftlling Organic Rejects ............................. ...... ........ .... ........ .......... ........... 86
Other Integrated Strategies Described in the Data Base 89
ix
Missing Data and Research Needs for Mass Bum and RDF .................................... 90 Technology ........................................................................................................ 90 Emissions .. ...... .... .. ........ .. .... ...... .. ...... .. .... .. .. .. .. ........ .. ............ .. .. .. .......... .. .. ...... ... 90
Air ..............................................•.............. ................................................... 90 Water ............................................................................................................ 9 1 I..and ...... �...................................................................................................... 91
Costs .•................................................................................................................. 91
6 . SANITARY LANDFILLS ........................................................................................ 93
Technology Description ............................................................................................ 93 Design of Sanitary Landfills .............................................................................. 93 Operating Characteristics ................................................................................... 95
Commercial Status ............................................................................. ....................... 96 Prevalence and Closure Rate .... .. .. .. .. .. .. .... .. .. .. .. .. .. .. .. .. .. .... .. .... .. .... .. ...... .. .. .. .. . . .. . 96 Gas Recovery Status .......................................................................................... 96
Energy Balance .......................... .............................. .......... ....................................... 96 Energy Requirements ......................................................................................... 97 Energy Production .......... ................................................................................... 97
Length of Time for Energy Production ........................................................ 97 Energy Potential of All Landfills ................................................................. 98
Net Energy Balance ........................................................................................... 98
Cost Considerations ................................................................................................... 98
Environmental Releases ....... ................ ..................................................................... 101 MSW Landfills .. ........ .. .. .. .. .. ............ .. .... .. .. .. .. ........ .. .. .. .. .. .. .. .. .. .. .. .... .. .. .... .. .. .. ..... 10 1
Air Emissions ........ ................................ .............................. ........ ........ ......... 101 Water Emissions . . . .... . . .. . . . . ...... . . . . .. . . .... .... .... . . . . . . . . .. . . . . . . . . . . . . .. .. . . . . . . . . . . . . . . . . . . . . . . . 1 0 1 Land Use ................................................................................................. ..... 102
Ash Mono fills ... ............................ ........................ .............. ........................ .. ..... 102 Air Emissions ................ .............. .. .................................. .. .. ........ .. .... .. ......... 105 Water Emissions ......................................................................... ................. 105 I..and Use ............................................................................................. ......... 106
Integrated Strategy Example: MSW Collection and Landfill ............. .............. ....... 106
Integrated Strategies Described in the Data Base .......... ........................................... 107
Missing Data and Research Needs ... ......................................................................... 107 Emissions .. .. .. .. .. .. .. .. .. .. .... .. .... .. .... .. .. .. .. .. ...... .. ...... .. .. .. .. .. .. .... .. .. .. .. ...... .. .. .. .. .. . . .. .. . 107
Collection and Processing Equipment ...................... .... ............................... 107 Landfill Air emissions ................... ................................ ........ .............. .... ..... 109 Landfill Water Emissions ..................... ............................ ................ ........... 109 Ash Mono fill Water Emissions . .. .......................... ............................ ........... 109
Energy ............................................................................................................... . 1 10
X
7. MATERIALS COLLECTION, SEPARATION, AND RECYCLING .................... 1 1 1
Technology Description ................................... .......... ................................ ............... 1 12 Collection Options .................................. ........................................................... 1 12 Processing Options ............................................ ................................................. 1 12 Materials Recovered . ...... .. .......... ...... .... .... ........ ...... .. ...... .... ...... ...... .... .. .. .. .... .. ... 1 14
Commercial Status .........•.......................................................................................... 1 15 Regulatory Stimulus for Recycling . . .............................. :................................... 1 15 Prevalence of MRFs ............................................................................ �.............. 1 15 Percentage of Waste Being Recycled ... .... .. .. .... ...... .. .. .. .. .... .. .... .. .. .. .. .. ............ .. . 1 15 Markets and Beneficial Uses .. .. .... .... .... .... .. .. .... .. .. .. .. .. .. .. .... .. .. .... .. .. ...... .. .... .. .. .. . 1 17
Energy Considerations ........................................... .............. .......................... ........... 1 17 Collection .................................................................................. ......................... 1 18 Processing . . . . . .. . . . . .. . . .. .. . . .. . . . . .. .. . . .. .. . . . . . . . . . . .. . . .. . . . . .. .. .. . . . . . . .. .. .. . . . . . . . . . . . . . . . . . . . . . . . . . . . . .. . 1 18
Energy Saved .... .... ................ .. .. .. ...... .. .. .... .. .. .. ...... .. .. .. .. ...... .. ...... .. .. .. .. .. .. .. .. . 1 19 Net Energy Balance for Remanufacturing ................................................... 1 19 Special Issues ...... .. . ..... ........ .. .... .. .. .. .. .. .. .. .... .. .. .. .... .. .. .. . . .. .. .. .. .. .. .. . . .. . . .. .. .. .. .. . 123 Transportation of Separated Materials for Remanufacture .......................... 124
Cost.Considerations ...................... ............................................................................. 125 Costs of Collection and Separation ............................................... ..................... 125 Sources of Income for MRFs ................ .............. .................................... ........... 127
Revenues from Sale of Products .................................................................. 127 Tipping Fees ............................ .................................................................. ... 127
Financial Balance ...... .. .. .. .. .. .. .. .. .... .. .. .... .. .... .. .... .. .. .. .... .. .. .... .. .. .. .. .. .. .. .. .. .. . . .... .. .. . 129
Environmental Releases ............... .......................... .................................... ............... 131 Community Environmental Releases ................................................................. 131 Emissions from Remanufacture ......................................................................... 131
Integrated System Example: Curbside Collection of Recyclable Material, Separation in an MRF, Recycling with Landfill of the Remaining MSW . .. .. .... .. .. .. .. .. .... .... .. .... .. .. .. .. .. .... .. .. .. .. .. .. .... .... .. .. .. .. .. .. .... .. .. .. .. .. .. .. .. . 131
Other Integrated Strategies Described in the Data Base ........................................... 135
Missing or Limited Data and Research Needs ····················································· �· ...
Amounts Collected and Destinations and Applications of Materials ............................................................................................. ........... .
Energy ............................................................................................................... .
Transport/Collection ....................................... ................ .. .......................... .
Processing ................... ................................................................................ .
Recycling/Reuse ......................................................................................... .
Environmental Releases ............................ ........................................................ .
Transportation ............................................................................................. .
Processing ................................................................................................... .
Recycling/Reuse ................................... .................. .................................... .
Costs .................................................................................................. : ............... .
System ·Evaluations
xi
136
136 137 137 137 137 138 138 138 138 138 138
8. COMPOSTING ......................................................................................................... I4I
Technology Description ..... ....................................................................................... I4I Yard Waste Composting .................................................................................... I42 MSW Composting ............................................................................................. I42
Commercial Status .................................................................................................... I43 Prevalence ... .. .. .. .. .......... .. .. .......... ...... .. ...... ...... ........ ........ .... .. .......... .. .. ........ .. .. .. . I4 3 Applications and Markets ............................ �..................................................... I44
Energy Balance ................... .......................................................................... ............. I45 Energy Required for Processing ................................................. ...... ................. I45 Energy Required for Separate Collection of Yard Waste ............................. ..... I45
Cost Considerations ........................................................................................ .... ....... I45 Yard Waste ........................................................................................ ................. I45 MSW Composting ................ ............................................................................. I47
Environmental Releases ......... ................................................................ .......... ......... I49 Air Emissions ...................... ................................................................ ............... I49 Water Emissions ... .. .. .. .. .. .. .. .... ........ .. .. .. .. .. .. .... .. .. ...... .. .. .. .. .. .... .. .. .. .... .... .. . . .. . . . . .. . I4 9 Land Use ......................................... ................................................................... I49
Integrated Strategy Example: Yard Waste Composting with Landfill .................... ISO
Important Integrated Strategies Described in the Data Base ..................................... I 54
Missing Data and Research Needs ............................................... ............................. I 54 Technology ........................................................... ............................................. 154
Municipal Solid Waste ............ .................................... ................................. I 54 Yard Waste .......................................... ......................................................... ISS
Markets ............... .................................................... ...................................... .. .. . I 55 Municipal Solid Waste ...................... .......... ................................ .. ........ ....... I 55 Yard Waste ................................................................ .................................. . IS5
Environmental Releases ........ ................................................................ ............. I 55 Municipal Solid Waste ................................................ ................................. _ I 55 Yard Waste ................................................................................................... I 56
Costs ................................................................................................................... IS6 System Evaluations ............................................................................................ IS6
9. LESS COMMONLY USED TECHNOLOGIES ................... ................................... I 57
Anaerobic Digestion .................................................................................................. IS7 Technology Description ...................................... .......... ..................................... I 57
Preprocessing ................................ ...................................... ........ ...... .... .. ..... 157 Anaerobic digestion ...... ........................................ ....................................... 157 Residue Treatment .................................. ...... ............................................... 158 Final uses . . . . .. .. .. .. . . . . .. .. .. .. .. . . . . .. .. . . . . .. .. .. . . . . . . . . .. .. . . . . .. .. . . .. . . . . . . . . . . . . . . .. . . . . . . . . . . . . . . .. . I 58
Commercial Status .. . . .. .. .. .. .. .. .. .. ...... .. .. .. .. .. .. .. .... .. .... .... .. ...... .. .. .... .. .. . . .... .. . . .. .. . . .. . I 58 Energy Considerations ....................................................................................... 159 Cost Considerations ........................................................ �........................... .... ... 159
xii
Environmental Releases .................................................................................. .. . 160 Missing Data and Research Needs ........................................ ............................. 160
Cofiring RDF with Coal for Power Production ........................................................ 160 Introduction ........................................................................................................ 160 Technology Description ..................................................................................... 160 Commercial Status ............................................................................................. 161 Energy Considerations .. .. .......... ............ ........ ...... .. .. .. .. ........ .. .. .................. .. .. .. .. . 161 Environmental Releases ..................................................................................... 162 Cost Data ............................................................................................................ 162 Missing Data and Research Needs ...... .. ........ .. .... .. .. .. .. .. .. .. .... .. .. .... .. .... ...... .. .. .. .. . 163
Barriers to Widespread Use ......................................................................... 163 Technical Problems ...................................................................................... 163 Emissions .... .... .. .. ...... .. .... .. .. .. .... .... .. .... .. ..... ... .. .. .. .. .. .. .. ...... .. .. .. .. ...... .. .. .. .. .. .. . 164 Costs .......................................................... ...................................... ............. 164
Gasification/pyrolysis ................................................................................................ 164 Introduction ................................................................................................... .. .. . 164 Technical Status ........................................................................................ ......... 164 Commercial Status ............................................................................ ................. 165
. Energy Considerations .... .. .... .... ...... .. .. .. .. .. .. .... .. .. .. .... .. .. .... .. ...... .. .. .. .. .. .......... .. .. . 166 Environmental Releases ................................ ........................ ............................. 166 Cost Considerations ........................................................................................... 167 Missing Data ................................................................................... ................... 167
Integrated Strategies .................................................................................................. 167
10. MISSING DATA AND RESEARCH NEEDS ......................................................... 171
Costs-. All Technologies .......................................................................................... 171
Combustion ............................................................................................................... 171 Technology ....................................................... ............ ..................................... 171 Emissions .......... ............................................ .................. ...... .. ................ .. ......... 172
Air ........................................................... .......................................... ........... 172 Water ..................................•...................... .................... .... ........................... 172
Sanitary Landfills ........................................................................................... ...... ..... 173-Emissions .. ........................................................ ...... .................................. ......... 173
Collection and Processing Equipment ........................ ................ ................. 173 Landfill Air emissions .................................................................................. 173 Landfill Water Emissions ......................... ............................ .................... ... 173 Ash Mono fill Water Emissions ................... .................. ............................... 17 4
Energy .......................... �.............................. ...................... ........................ ...... ... 17 4 Land ................................................................................................................... 174
Materials Collection, Separation, and Recycling ............................. ........ .. ...... ......... 17 5 Amounts Collected and Destinations and Applications of
Materials .. .. .. .. . . .. .. .. .. .. .. .. ...... .. .. .. .. .. .. .. .... .. .. .. . . . . .. .. .. .. .. .. .. .. .. . . .. .. .. .. .. .. . . .. . . .. .. .. .. . 17 5
xiii
Energy ................................................................................................................ 176 Transport/Collection .................................................................................... 17 6 Processing ... ............ .. ........ .. .. .. .... .. ........ .. .... .. .. .......... .... .. .. .. .. .. .. ...... ...... .. ..... 17 6 Recycling/Reuse ......................................................................... ................. 17 6
Environmental Releases ..................................................................................... 17 6 Transportation ... ...... ...... .... .... .. .. ........ .... ...... .... .. ...... .. .. ............ .. .... ............ ... 17 6 Processing ... ................ ...... ...... .•........•..... .... ...... ...... .. .......... .... .. .. .. .... .. .. .... ... 17 6 Recycling/Reuse .......................................................................................... 17 6
System Evaluations ..................................... �...................................................... 176
Composting ............................................................................................................... 177 Technology ··························································································· �············ 177
Municipal Solid Waste ...... �.......................................................................... 177 Yard Waste .. .... .. .. .. .. .. .. .. .... .... .. .. .. ...... .. .. .... .. .... .. .... .. .. .. .... .... .. .. .. .. .. .. .. .. .. .. ..... 177
Markets ............................................................. ................................................. 178 Municipal Solid Waste ................................................................................. 178 Yard Waste ................................................................................................... 178
Environmental Releases .................................. ........ ........................................... 178 Municipal Solid Waste ................................................................................. 178 Yard Waste . ................................................................................................... 178
System Evaluations ............................................................................................ 179
Less Commonly Used Technologies ......................................................................... 179 Anaerobic Digestion ............................. ............................................................. 179 Cofiring RDF with Coal for Power Production ................................................ . 179
Barriers to ·widespread Use ........ ................................................................. 179 Technical Problems ....................................................... .................. .... ......... 179 Emissions .... ................ ................................................................................. 180
Gasification/Pyrolysis ........................................................................................ 180
1 1. REFERENCES ................. ........ .. .......... ............................ .. .. .. .................................... 1 8 1
12. ABBREVIATIONS AND CONVERSION FACTORS ........................................ . .. 191
Government Agencies, Commercial Organizations, Regulations, and Publications ................................... .. ...................... ................ ................ .......... .. ..... 191
Units of Measure and Technical Terms .................................................................... 191
Conversion Factors .................................................................................................... 193
VOLUME II: EXHIBITS
I. PROCESS ECONOMICS OF MUNICIPAL SOLID WASTE MANAGEMENT TECHNOLOGIES ....................................................................... I- I
II. DATA BASE FOR CALCULATING ENERGY BALANCES AND ENVIR.ONMENTAL RELEASES . ............................... .......... ................................... Il- l
xiv

III. ENERGY REQUIREMENTS FOR TRANSPORTATION OF RECYCLABLES TO REMANUFACTURING FACILffiES ................................. 111- 1
IV. BACKGROUND DATA FOR CALCULATIONS OF AIR EMISSIONS FROM MUNICIPAL WASTE COMBUSTORS ............................... IV- 1
V. BACKGROUND DATA FOR ENERGY CONSIDERATIONS AND ENVIRONMENTAL RELEASES FOR LANDFILLING, ANAEROBIC DIGESTION, AND COMPOSTING ................................................ V - 1
VI. TABLES OF CONTENTS FOR APPENDIXES A-J .............................................. VI- 1
VII. ENERGY BALANCE FOR PAPER MANUFACTURING AND RECYCLING ............................................................................................................ VII-1
APPENDIXES
A. MASS BURN TECHNOLOGIES
B. RDF TECHNOLOGIES
C. FLUIDIZED-BED COMBUSTION
D. PYROLYSIS AND GASIFICATION OF MSW
E. MATERIAL RECOVERY/MATERIAL RECYCLING FACILffiES
F. LANDFILLS
G. COMPOSTING
H. ANAEROBIC DIGESTION OF MSW
I. ALPHABETICALLY INDEXED BIBLIOGRAPHY
J. NUMERICALLY INDEXED BffiLIOGRAPHY
XV

Number
ES.1 ES.2 ES.3 ES.4 ES.5
ES.6
ES.7 ES.8
ES.9
1 . 1
2. 1 2.2
3. 1 3.2
4. 1
5.1 5.2
5.3
5.4
5.5
5.6
5.7
ILLUSTRATIONS
Title
Strategies Based on the Five Major Options Energy Analysis for Strategies Based on the Five Major Options ................ .
Net Electrical Energy ........................................................ _ ............................ .
Volume Landfilled ........................................................................................ .
Field Erected Mass Bum Electricity Production Plants: Effect of Plant Capacity on Capital Investment .......................................... .. ............ .
RDF Spreader Stoker-Fired Electricity Production Plants: Effect of Plant Capacity on Capital Investment ....... ..................................... .
Landfill Capital and O&M Costs .................................................................. .
Materials Recycling Facilities (MRF): Effect of Plant Capacity on Capital Investment ......................................................................... ........... .
Com posting of MSW: Effect of Plant Capacity on Capital Investment ...................................................................................................... .
Commonly Used Technology Options for Municipal Solid Waste Management ....................................................................................... .
Energy Analysis for Strategies Based on the Five Major Options ................ .
Net Electrical Energy .................................................................................... .
Volume Landfilled ........................................................................................ .
Weight Landfilled ·:·························································································
Strategies Based on the Five Major Options ................................................. .
Block Diagram for a Typical Mass Bum Facility ......................................... .
Field Erected Mass Bum-Electricity Production Plants: Effect of Plant Capacity on Capital Investment ····························· �············ ...
Field Erected Mass Bum-Electricity Production Plants: Effect of Plant Capacity on O&M Costs ...................................................... ..
Field Erected Mass Bum-Steam/Electricity Production Plants: Effect of Plant Capacity on Capital Investment ....... ...................... ............... .
Field Erected Mass Bum-Steam/Electricity Production Plants: Effect of Plant Capacity on O&M Costs ....................................................... .
Modular Mass Bum-Steam/Electricity Production Plants: Effect of Plant Capacity on Capital Investment ............................................ .
Modular Mass Bum-Steam/Electricity Production Plants: Effect of Plant Capacity on O&M Costs ............................•...........................
xvii
Page
12 15 16 22
23
23 24
24
25
34
43 45
55 56
59
69
72
72
73
73
74
74
Number
5.8 5.9
5.10
6. 1 6.2
6.3 6.4
Title Page
RDF Processing System Design (Hartford, Connecticut) .............................. 8 1 RDF Spreader Stoker-Fired Electricity Production Plants: Effect of Plant Capacity on Capital Investment ............................................. 84 RDF Spreader Stoker-Fired Electricity Production Plants: Effect of Plant Capacity on O&M Costs .......................... .............................. 84
Landfill Design . .. .... .. .... ........ ............ .. .. ...... .. .. ...... .... .... .. .......... .. .... ........ .... .. .. 94 Cross-Section of Composite Liner and Leachate Collection System ............................................................................................................. 94 Range of 1991 U.S. Landfill Tipping Fees by State ...................................... 99 Landfill Capital and O&M Costs ................................................................... 100
7. 1 High-Tech MRF Process Plan (Johnston, Rhode Island) ......................... ...... 1 13 7.2 Aoor Plan for Proposed Mixed Waste MRF (Gaston County,
North Carolina) ............................................................ ................................ ... 1 14 7.3 Energy Aows in MSW Management ............................................................. 120 7.4 Comparison of Recycling and Virgin Manufacture Energy
Aows for Paper .............................................................. .............................. .. 121 7.5 Comparison of Recycling and Virgin Manufacture Energy
Aows for High-Density Polyethylene ............................................................ . 122 7.6 Materials Recycling Facilities: Effect of Plant Capacity on
Capital Investment (Low Technology) ........................................................... 126 7. 7 Materials Recycling Facilities: Effect of Plant Capacity on
Capital Investment (High Technology) ........................................................... 126 7.8 Materials Recycling Facilities: Effect of Plant Capacity on
O&M Costs (Low Technology) ........... .......................................................... 128 7.9 Materials Recycling Facilities: Effect of Plant Capacity on
'O&M Costs (High Technology) ..................................................................... 128 7. 10 Average 1991 Prices Paid to Processors for Various
Recyclables ......................................... ...................................................... ...... 130
8. 1 Process Flowsheet for MSW Composting ............... ....................................... 143 8.2 Com posting of MSW: Effect of Plant Capacity on Capital
Investment .......................................... ................................ .... .......... .. .... .... ..... 148 8.3 Com posting of MSW: Effect of Plant Capacity on O&M Costs .................. 148
xviii

Number
ES.1 ES.2
1 . 1
2. 1
2.2
3. 1
3.2 3.3
4. 1 4.2
5. 1 5.2 5.3
... 5.4
5.5 5.6 5.7
TABLES
Title Page
Air Emissions for Common Strategies ......................... ................................... 18 Effluent for Common Strategies ..................................................................... 20
More Commonly Used Strategies Presented in the Data Base ...................... 32
Qualitative Descriptions of Energy Balances for Major MSW Technologies . . . . . . . . . . . . . . . . . . . . . . . . . . . . . . . . . . . . .. . . . . . . . . . . . . . . . . . . . . . . . . . . . . . . . . . . . . . . . . .. . . . . . . . . . . . . . . . . . . 41 Energy Effects of Common MSW Strategies .......................... ....................... 42
Qualitative Descriptions of Emissions from Major MSW Technologies .................................................................................................. 49 Air Emissions for Common Strategies ............................................................ 50 Effluent for Common Strategies ............ ......................................................... 53
Common Technologies in the Data Base ........................................................ 58 Common Strategies in the Data Base ............................................................. 58
Summary of the Standards for Municipal Waste Combustors ....................... 67 Air Emissions from Mass Bum Facilities ...................................................... 76 Energy and Emissions for Strategy 2: Mass Bum ......................................... 78 Energy and Emissions for Strategy 1: Landfill with Gas Recovery ................................................................................. ........................ 79 Air Emissions from RDF Facilities .............. .................................................. 85 Energy and Emissions for Strategy 4: RDF for Direct Firing ........................ 87 Energy and Emissions for Strategy 1 : Landfill with Gas Recovery ................................................................... .................. ............ ........ 88
, 6.1 Size Distribution of MSW Landfills .............................................. ................ 96 6.2 Amounts of Material Leaching from and MSW Landfill ............................... 103 6.3 Some Constituents of Combined MSW Ash ................................................ ... 104 6.4 Leachate from an Ash Monofill ..................................................................... 106 6.5 Energy and Emissions for Strategy 1 : Landfill with Gas
Recovery ........................... ............................ ................................ .................. 108
xix
Number
7.1 7.2
7.3 7.4
7.5
Title
Energy Requirements for Operating an MRF Comparison of Transportation Energy Requirements for Virgin
Page
1 18
Materials and Secondary Materials Shipped for Recycling ........................... 125 Revenue from Products of MRFs ......................................................... ........... 129 Benefits from Using Recycled Materials in Place of Virgin Materials ... ...... .......... .. ........ .. .... .................... ........ ........ .. .. .. .. .. .. .... ...... .... .. .. ..... 13 2 Energy and Emissions for Strategy 6: Curbside Collection with MRF and Landfill ............. ............ .......................................... ......................... 133
7.6 Energy and Emissions for Strategy 1: Landfill with Gas Recovery . .. .. ...... .... .. .. .. .. .... ...... ...... ........ .. .... .. ...... .. ...... .. .. ........ .... .... ........ .. .. .. .. 134
8. 1 Capital Costs for a Leaf/Grass Composting Facility Processing at Least 13 Tons Per Day ..... .................................. ................ .................... .. .. 146
8.2 Operating Costs for Com posting Programs .................................................... 146 8.3 Composting Cost Components .......... ............. .. .... ........ ................................... 146 8.4 Trace Elements in Soils and MSW Compost ................................................. 150 8.5 Energy and Emissions for Strategy 5: Yard Waste Composting
plus MSW to Landfill . .................................................................................... 152 8.6 Energy and Emissions for Strategy 1: Landfill with Gas
Recovery · · · · · · · · · · · · · · · · · · · · · · · · · · · · · · · · · · · · · · · · · · · · · · · · · · · · · · · · · · · · · · · · · · · · · · · · e · · · · · · · · · · · · · · · · · · · · · · · · · · · · · · · · 153
9.1 Energy Balance for Anaerobic Digestion of MSW ........................................ 159 9.2 Distribution of Costs by Process Unit for the RefCoM Plant ........................ 159 9.3 Less Common Strategies Presented in the Data Base .............................. ...... 168 9.4 Energy Effects of Less Commonly Used MSW Strategies ............................. 169
XX
EXECUTIVE SUMMARY
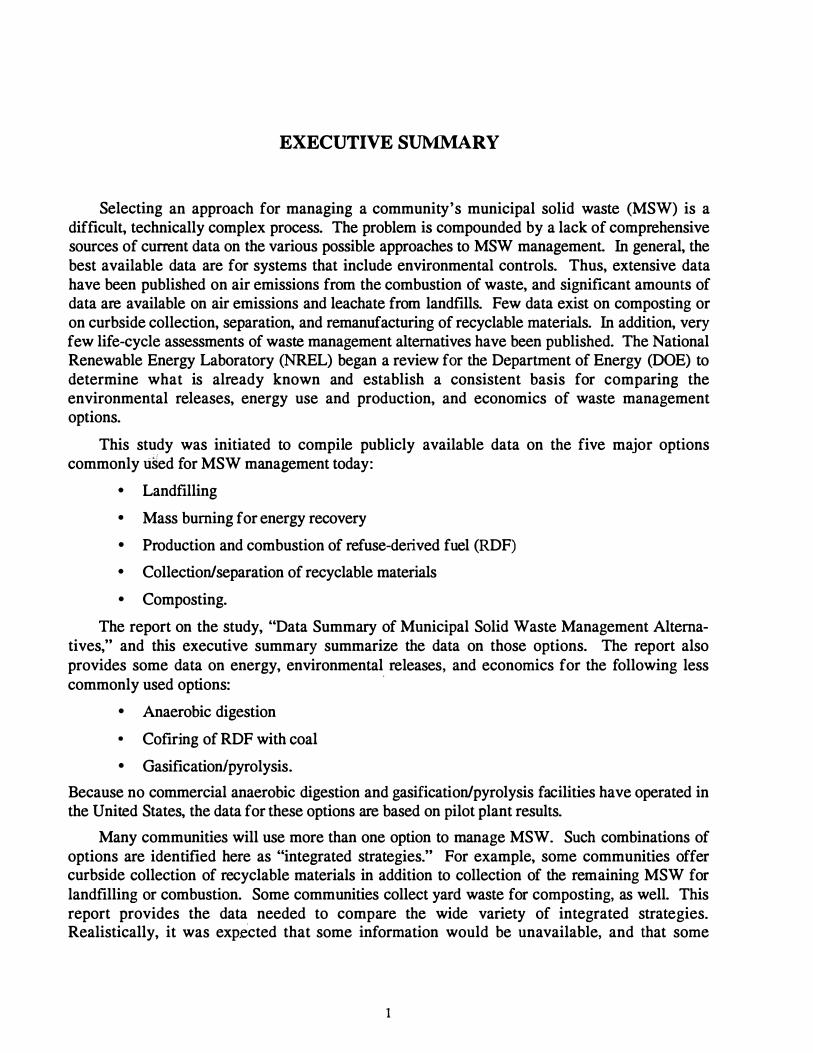
Selecting an approach for managing a community's municipal solid waste (MSW) is a difficult, technically complex process. The problem is compounded by a lack of comprehensive sources of current data on the various possible approaches to MSW management. In general, the best available data are for systems that include environmental controls. Thus, extensive data have been published on air emissions from the combustion of waste, and significant amounts of data are available on air emissions and leachate from landfills. Few data exist on com posting or on curbside collection, separation, and remanufacturing of recyclable materials. In addition, very few life-cycle assessments of waste management alternatives have been published. The National Renewable Energy Laboratory (NREL) began a review for the Department of Energy (DOE) to determine what is already known and establish a consistent basis for comparing the environmental releases, energy use and production, and economics of waste management options.
This study was initiated to compile publicly available data on the five major options commonly used for MSW management today:
• Landfilling
• Mass burning for energy recovery
• Production and combustion of refuse-derived fuel (RDF)
• Collection/separation of recyclable materials
• Composting.
The report on the study, "Data Summary of Municipal Solid Waste Management Alternatives," and this executive summary summarize the data on those options. The report also provides some data on energy, environmental releases, and economics for the following less commonly used options:
·
• Anaerobic digestion
• Cofiring of RDF with coal
• Gasification/pyrolysis.
Because no commercial anaerobic digestion and gasification/pyrolysis facilities have operated in the United States, the data for these options are based on pilot plant results.
Many communities will use more than one option to manage MSW. Such combinations of options are identified here as "integrated strategies." For example, some communities offer curbside collection of recyclable materials in addition to collection of the remaining MSW for landfilling or combustion. Some communities collect yard waste for composting, as well. This report provides the data needed to compare the wide variety of integrated strategies. Realistically, it was expected that some information would be unavailable, and that some
1
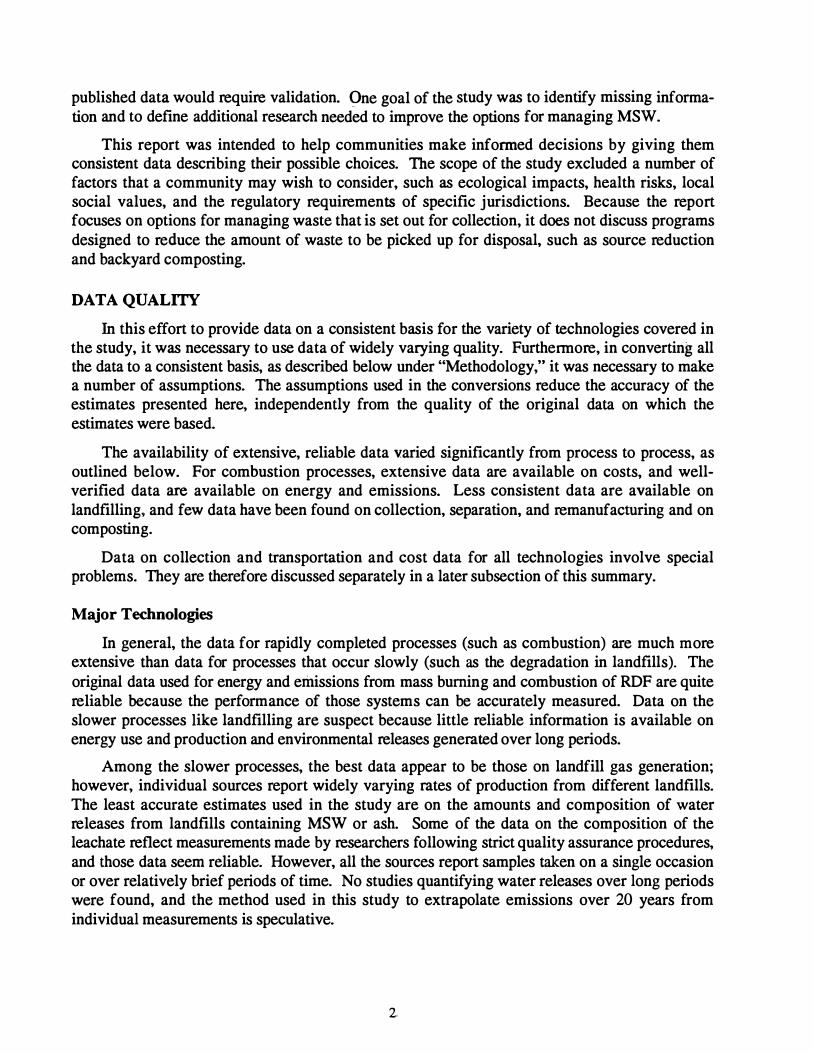
published data would require validation. ()ne goal of the study was to identify missing information and to define additional research needed to improve the options for managing MSW.
This report was intended to help communities make informed decisions by giving them consistent data describing their possible choices. The scope of the study excluded a number of factors that a community may wish to consider, such as ecological impacts, health risks, local social values, and the regulatory requirements of specific jurisdictions. Because the report focuses on options for managing waste that is set out for collection, it does not discuss programs designed to reduce the amount of waste to be picked up for disposal, such as source reduction and backyard composting.
DATA QUALITY
In this effort to provide data on a consistent basis for the variety of technologies covered in the study, it was necessary to use data of widely varying quality. Furthermore, in converting all the data to a consistent basis, as described below under "Methodology," it was necessary to make a number of assumptions. The assumptions used in the conversions reduce the accuracy of the estimates presented here, independently from the quality of the original data on which the estimates were based.
The availability of extensive, reliable data varied significantly from process to process, as outlined below. For combustion processes, extensive data are available on costs, and wellverified data are available on energy and emissions. Less consistent data are available on landfilling, and few data have been found on collection, separation, and remanufacturing and on com posting.
Data on collection and transportation and cost data for all technologies involve special problems. They are therefore discussed separately in a later subsection of this summary.
Major Technologies
In general, the data for rapidly completed processes (such as combustion) are much more extensive than data for processes that occur slowly (such as the degradation in landfills). The original data used for energy and emissions from mass burning and combustion of RDF are quite reliable because the performance of those systems can be accurately measured. Data on the slower processes like landfilling are suspect because little reliable information is available on energy use and production and environmental releases generated over long periods.
Among the slower processes, the best data appear to be those on landfill gas generation; however, individual sources report widely varying rates of production from different landfills. The least accurate estimates used in the study are on the amounts and composition of water releases from landfills containing MSW or ash. Some of the data on the composition of the leachate reflect measurements made by researchers following strict quality assurance procedures, and those data seem reliable. However, all the sources report samples taken on a single occasion or over relatively brief periods of time. No studies quantifying water releases over long periods were found, and the method used in this study to extrapolate emissions over 20 years from individual measurements is speculative.
2.
Composting is a relatively slow process. Data on composting are incomplete, and researchers have neither accurately measured composting emissions, as they have for combustion emissions, nor developed sophisticated models, as they have for landfills.
Recycling of MSW through curbside collection of recyclables or separation of mixed waste is a relatively new and changing approach. Recycling also involves many more processing steps than landfilling or combustion. Collection is a major contributor to the energy and emissions profiles for recycling, and the limitations on the collection and transportation data used in this study outlined below strongly affect the quality of the recycling data as well. There is currently no complete or consistent accounting of the amounts of MSW collected for recycling and the amounts actually recycled. The energy and emissions from the recycling (remanufacturing) processes themselves are not well characterized, and they will vary depending on the products made from the recycled material. Published estimates of the energy required for recycling and manufacture from virgin resources appear to be high-quality data, but they reflect processes in use in the mid- 1970s. Available data comparing emissions from remanufacturing with those from manufacturing virgin materials are so inadequate that they are not included in the report, although the differences may be significant.
Less Commonly Used Technologies
Two of�the less commonly used options-anaerobic digestion and gasification/ pyrolysisare not used .commercially in the United States. The data on those options presented in the report are therefore based on pilot plants. They do not provide an adequate basis for comparisons with other processes.
The third less commonly used option-cofiring of RDF with coal-is a commercial process, although it is used at only a few facilities. Reliable data on energy production are available for cofiring, but few studies of emissions have been made.
Collection and Transportation
The estimates of amounts of material collected and of energy and emissions for collection and transportation used in this study are based on the experience of a single community. In addition, the data provided by the community were not independently verified. Thus, the collection and transportation data in this report are intended to provide a basis for making order-ofmagnitude estimates of the effects of altering the collection procedures used in a community, and for comparing the sources and magnitudes of emissions from collection with those from process steps. The estimates cannot be expected to be representative of other communities. No data were found on energy required for transportation of collected ferrous metals, aluminum, glass, or paper to the point of remanufacture.
Cost Data
The cost estimates are adequate only for making order-of-magnitude comparisons and identifying trends. Although all the data found in the literature were updated to a single year using an appropriate inflation index, many other factors, such as the impact of different technologies, make direct comparisons impossible. Differing accounting systems also make comparative costs difficult to determine. Better estimates of relative capital and operating costs could be developed by designing reference plants for each technology and estimating the costs of those plants on a consistent basis.
3
METHODOLOGY
Basis for the Comparisons: a Life-Cycle Analysis
The best available data have been converted to a consistent basis for comparisons. In compiling data about net energy requirements and environmental releases, a life-cycle assessment approach was used that generally followed a typical life-cycle assessment practice. • As applied to a given MSW management option, a life-cycle assessment is a comprehensive. quantitative description of the energy and materials used and the wastes released in all steps of the option.
The data for each option and strategy are reported on the basis of one ton of MSW, set out for collectien. In the strategies that used curbside collection of recyclables in combination with a disposal technology such as landfilling or combustion, the energy and emissions for both curbside collection and the disposal technology are based on one ton of material left at the curb; that is, for example, if about 14% of total MSW is separately collected for recycling, energy and emissions are reported for the sum of 280 pounds left for curbside collection of recyclables and 1 ,720 pounds left for disposal.
Energy and Emissions
In calculating energy data, a ton of waste is followed through all transportation t and processing operations to its final disposition (e.g., recycling and remanufacturing, combustion with energy recovery, or landfilling operations with gas recovery). Emissions data are presented for all steps except remanufacturing, as discussed above.
The time frame covered by the comparisons is 20 years. · That unusually long period was chosen to permit comparisons of energy recovery from landfill gas collection with that for combustion of MSW in a waste-to-energy facility. Gas forms very slowly in a landfill, and choosing a shorter time frame for the analysis would underestimate the amount of energy that might be recovered from the waste. A period longer than 20 years was not considered because gas production in landfill-gas-to-energy operations may fall to an uneconomic level within that time, and current commercial practice is to close the energy recovery operations when they have operated for 20 years or less.
For consistency, the same 20-year period was used in considering all other emissions from the landfill, including the gas not recovered and the leachate (liquid that leaks from the landfill). The leachate from the ash from combustion processes was therefore also followed for 20 years, although releases to the air during combustion are accounted for when the MSW is burned. Landfill emissions will continue for a period longer �an the 20 years considered in this analysis.
Other factors complicate the life-cycle analysis of materials separation, collection, and recycling. Recycling of suitable components of MSW involves five steps:
"' As described, for example, by the Society of Environmental Toxicology and Chemistry (SET AC).
t Energy consumed in transportation is reported as the fuel consumed. About 15% of the Btu content of crude oil is used in converting it to gasoline or diesel fuel and transporting it to the point of use. That factor is not included in the estimates.
4

• Separating reusable materials from other municipal waste, often at curbside, but sometimes at a central facility
• Transporting and processing (including remanufacturing) the separated ma-terials for use as replacements for virgin materials
• Managing the wastes from separation and recycling
• Returning the materials to commerce, often as parts of other products
• Selling the recycled product to consumers.
The life-cycle analysis methodology requires that all these steps be included; the total estimates of emissions and energy balances can then be compared with those for the original manufacturing process, including the acquisition of raw materials. This report provides energy balances for recycling, but data on environmental releases during manufacturing and remanufacturing are not available.
Costs
Data on capital and operating costs for the individual options were converted to 1991 dollars per ton of daily capacity to provide a consistent basis for cost comparisons. The PEPCOST Index, which was designed to make such conversions for SRI International's Process Economics Program, wa:S�used.
Data Formats
A data base was constructed that includes the energy and emissions data for each waste management option and for each step in a comprehensive MSW management strategy: collection, processing, disposal of residues, and, if appropriate, recycling. Because a community ultimately chooses and implements a strategy that includes at least the first three of these steps and may choose a strategy that incorporates several individual options, the data base combines the energy and emissions for each component in proportion to its contribution to the overall strategy for treatment of the waste.
The data base is available in electronic form for analyzing various possible MSW management strategies. Users can change variables in the data base (e.g., transportation distances, volume of recyclables collected, truck fleet fuel consumption) to reflect a particular community's circumstances.
FINDINGS
Overview of MSW Management in the United States
The United States generated 1 80 million tons of municipal solid waste in 1988.* MSW is estimated to be growing at rates of 0.75% to 1.5% per year-i.e., at the same rate as population growth to twice the rate of population growth.
* This estimate includes residential, commercial, and institutional solid waste, plus some similar types of wastes from industrial sources, in accordance with the U.S . Environmental Protection Agency/s (EPA's) "Characterization ofMSW in the U.S.: 1990 Update."
5
Today, 69-73% of MSW is landfilled, and landfill gas is recovered for energy at about 128 of the nation's larger landfills; 17% of it is burned, 94% of that amount (or almost 16% of total MSW) for energy recovery. Estimates of the percentage of MSW that is recycled vary significantly; the U.S. Environmental Protection Agency (EPA) and the Office of Technology Assessment (OTA) have published estimates of 10-14%. Composting accounts for a small percentage of waste treatment.
The EPA has set a national voluntary goal of reducing the quantity of MSW by 25% through source reduction and recycling by 1992, and at least 2 1 states have adopted laws to mandate or encourage separation of recyclable materials from MSW. The quantity of waste recycled by programs under community control is not well documented.
Collection and Transportation
MSW management includes curbside collection of the waste, transportation of the waste to a landfill or a processing facility (e.g., a combustor or a materials recovery facility), and possibly transportation of the residue from processing to a landfill. Although many models of collection and transportation requirements for various types of collection programs have been developed, it proved difficult to find actual data on energy and emissions for these steps. Accordingly, this study used data on transportation energy requirements supplied by one community. The city had operated a curbside collection program for recyclables for many years, and it initiated a program for curbside collection of yard waste about a year before this study began. It is not necessarily typical of other communities.
The community supplied data on actual tonnages collected by each truck in each of the three separate collection programs; the number of trucks operated and the number of miles traveled by each truck; and the fuel consumption on each route. Fuel use per ton of material picked up on each route was lowest for collecting household and commercial MSW. About 2.5 times more fuel was used to pick up a ton of separated recyclables, and about 600 times more fuel was used to collect a ton of yard waste (because of the small quantities collected on each route in that program).
To develop the estimates presented in this summary, these fuel use rates were converted to energy use per ton of MSW at the curb, and then apportioned according to the amounts set out. The energy and emissions results are extremely sensitive to the amount collected by each truck. Therefore, energy use per ton of material collected increases as additional curbside collection programs are implemented.
No direct emission measurements for MSW collection or curbside collection vehicles have been made during actual operation. Emissions from collection and transportation were therefore estimated on the basis of the actual fuel use by assuming that the emissions per unit of fuel met the maximum permissible emission limits for heavy-duty diesel truck engines operating according to a specified EPA procedure that simulates freeway and city driving. When these engine limits have been compared to actual emissions from vehicles under the same load and speed conditions, the results vary by 20-50% for emissions of different types; for example, the operating vehicles emit larger quantities of hydrocarbons and particulates, but smaller amounts of nitrogen oxides and carbon monoxide than the tested engines. The duty cycle of the MSW packer trucks in these tests is quite different, in terms of stop-start frequency and compactor operation, from the typical duty cycle for the trucks modeled by the EPA. Therefore, in
6
developing emissions estimates for this study, the emissions limits were increased by a factor of four to provide a better approximation of actual emissions.
Status of the Major Waste Management Options
Sanitary Landfilling
Open landfills have been used as a waste management method for centuries. Rules and regulations for construction and operation of solid waste landfills were established by the Resource Conservation and Recovery Act (RCRA) of 1976 as a way to reduce the number of open dumps common at the time. Since then, landfill requirements have become more stringent. Careful enclosure of MSW, by providing liners underneath it, covering the landfill with dirt ("daily cover'') at the end of each day, installing gas collection systems, and capping the landfill when it is filled, permits the collection of between 30% and 85% of the methane, carbon dioxide, and other organic gases generated by the waste. Those gases can be burned for energy recovery if the quantity generated is large enough to justify the expense of the equipment. More than 100 landfills recover landfill gas for energy. The majority produce electricity, but in a few locations, the gas is used for process heat, or it is upgraded to pipeline quality and sold.
Although only about 160 of the nation's approximately 6,000 operating landfills are operating or :pian to operate landfill gas-to-energy plants, the energy and emissions data in this report are baSed on landfill with gas recovery. The largest landfills (about 200 have a capacity of more than 1 ,000 tons per day) are more likely to include the energy recovery facilities, and those landfills now receive more than 40% of all MSW landftlled in the United States. In comparison with facilities that either· collect landfill gas and flare it or allow the gas to escape into the atmosphere, landfill gas-to-energy operations reduce environmental releases of methane while providing an energy benefit.
Most landfills reach capacity because they fill up or reach practical height limits, rather than by reaching a weight limit. Therefore, efforts to reduce the amount of space that MSW occupies can extend the life of a landfill. Combustion and recycling programs can help to reduce waste volume. Other options include:
1 . Shredding or compressing MSW in bales-These processes can significantly increase the density of the MSW. Both approaches are practiced at a few locations in the United States.
2. Stimulating the decomposition of waste-In research programs at a number of U.S. sites, leachate is being recirculated and appropriate nutrients are being added to speed the rate of decomposition. More rapid decomposition generates larger quantities of recoverable gas (up to double normal production) within a shorter time period, reduces the amount of leachate that must be collected and treated, and permits the closed landfill to be returned to unrestricted use sooner or "mined" for reuse, as discussed below. Research on this approach is being conducted at a number of U.S. sites.
3. "Mining" old landfills-Old landfills, particularly those that have been infiltrated by large amounts of rain or need to be remediated to prevent groundwater contamination, can be dug up and processed to separate the dirt and compost fraction for use as compost or landfill cover. The resulting reduction
7

in landfill volume permits reuse of the site, which is already zoned for landfilling.
Combustion with Energy Recovery
Like landfilling, open burning has been used for centuries to dispose of waste. In the United States, combustion of MSW to recover energy in the form of saleable electricity was first practiced in about 1902, in New York City.
Many newer plants now recover energy. In modern plants, energy can be recovered in the form of hot water, steam, and electricity, or in some combination of those three forms. Until the 1970s, MSW combustors included little, if any, air pollution control equipment. The units of the 1950s and 1960s were generally marked by bad odors and smoke. They were primarily operated only to reduce the volume of the waste. Since the early 1970s, increasingly stringent environmental controls have been applied; as a result, today' s combustors produce less air pollution.
Two options commonly used for combustion are:
1 . Mass burning
2. Preparation and combustion of refuse-derived fuel (RDF).
They differ in extent of pretreatment of the MSW before firing, the type of furnace used, and the firing conditions.
In a mass burn facility, pretreatment of the MSW includes inspection and simple separation to remove oversized and noncombustible items and unacceptable components such as obviously hazardous or explosive materials. The MSW is then fed into a combustor, where it is typically supported on a grate or hearth. Air is fed below and above the grate to promote combustion. Mass burn plants can be large facilities, with capacities of 3,000 tons of MSW per day or more; however, they can be scaled down to handle the waste from smaller communities, and modular plants with capacities as low as 25 tons per day have been built.
RDF production begins with inspection of the MSW, removal of bulky or hazardous waste, and shredding of the remaining MSW. Noncombustible materials are often separated as well. The shredded RDF is most frequently burned above a traveling grate. RDF preparation and direct firing cannot be performed economically in small plants, and the minimum size of an RDF plant tends to be large. If RDF is compressed into pellets or cubes, it can be used in existing, conventional furnaces with grates. A few operating facilities now produce such pellets or cubes at one location for sale or use at another.
The energy produced by both mass burning and RDF combustion is generally used for electrical power generation. MSW combustion can thus eliminate the need to mine, burn, and dispose of the residue of some of the coal or oil that would otherwise be used to generate electricity.
Regulatory requirements for control of MSW combustion have grown increasingly stringent since they were first implemented in the 1970s. For both types of options, federal regulations governing all facilities with capacities greater than 250 tons per day set limits on a range of pollutants, including acid gases, metals, and dioxins/furans. The EPA is developing comparable requirements for units with capacities of less than 250 tons per day. State and local requirements may be more stringent and may apply to even smaller combustors. Current regulations for the larger plants are more stringent than those governing fossil fuel plants.
8

The ash from MSW combustion and the residue from the scrubber (used to neutralize acid gases in the gas stream) are disposed of, often in landfills called "ash monofills" that contain only ash. Modem plants using good combustion practices can reduce the volume of MSW by up to 90%. The leachate from ash monofills is normally smaller in volume than that from ordinary landfills, and the constituents of the leachate are also different.
Curbside Separation and Mixed Waste Separation and Recycling
Curbside separation and mixed waste separation and recycling permit a reduction in the amount of waste that must be handled by other MSW options. As outlined previously under "Methodology," the five steps in recycling are: ( 1) separating reusable materials from other waste; (2) transporting and processing (including remanufacturing) the separated materials for use as replacements for virgin materials; (3) managing the wastes from separation and recycling; (4) returning the materials to commerce; (5) selling the recycled products. At present, most recycling efforts focus on the following reusable materials: newsprint, cardboard, glass, aluminum, some tin cans, and some plastics (particularly plastic beverage containers).
Some of the statistics that indicate that recycling now manages 10% or more of the nation's MSW are reporting estimates that include the amounts of material diverted from the local landfill by separate collection of recyclables, bottle deposit laws, and separate collection of yard waste for com posting. Data on the amounts of MSW that are finally remanufactured and returned to commerce have not been found; however, they are clearly lower than the total quantities collected because some of the material is used as fuel, some is lost during remanufacturing, and when market conditions are poor, some may be landfilled.
Communities that wish to include recycling in their MSW management strategies have several options for separating recyclables from other waste. They can offer convenient sites where residents can receive payment for containers (e.g., buy-back centers); provide dropoff centers that may accept a wide range of recyclable and compostable materials; implement curbside collection of recyclable materials separated by residents from other MSW; and/or process mixed waste to separate recyclables.
Either mixed MSW collected in a standard packer truck or recyclables collected separately at curbside can be sent to a materials recovery facility (MRF) for further separation and consolidation of the collected materials. MRFs can be divided into "low-tech" and "high-tech" facilities, depending on the amount of manual labor required. All MRFs rely heavily on manual labor to sort and separate grades of paper and glass bottles by color, and plastic bottles by resin type and color. Nearly all MRFs also use magnets for recovering ferrous metals, and many use balers for paper, crushers for glass, and flatteners for the aluminum cans. High-tech MRFs would generally also use additional shredders, screens, possibly air classifiers for separating heavy materials from lighter ones, and special eddy-current separators that can separate aluminum. Currently operating MRFs have sufficient design capacity to process 1 million tons per year of recyclables. Another 3 million tons of capacity are scheduled to begin operation by 1993. If all the planned facilities actually become operational, they will have the annual capacity to process 2% of all U.S. MSW in 1993.
Many communities conduct curbside collection programs for recyclables but do not operate MRFs. No data on collection rates for those programs were found.
9
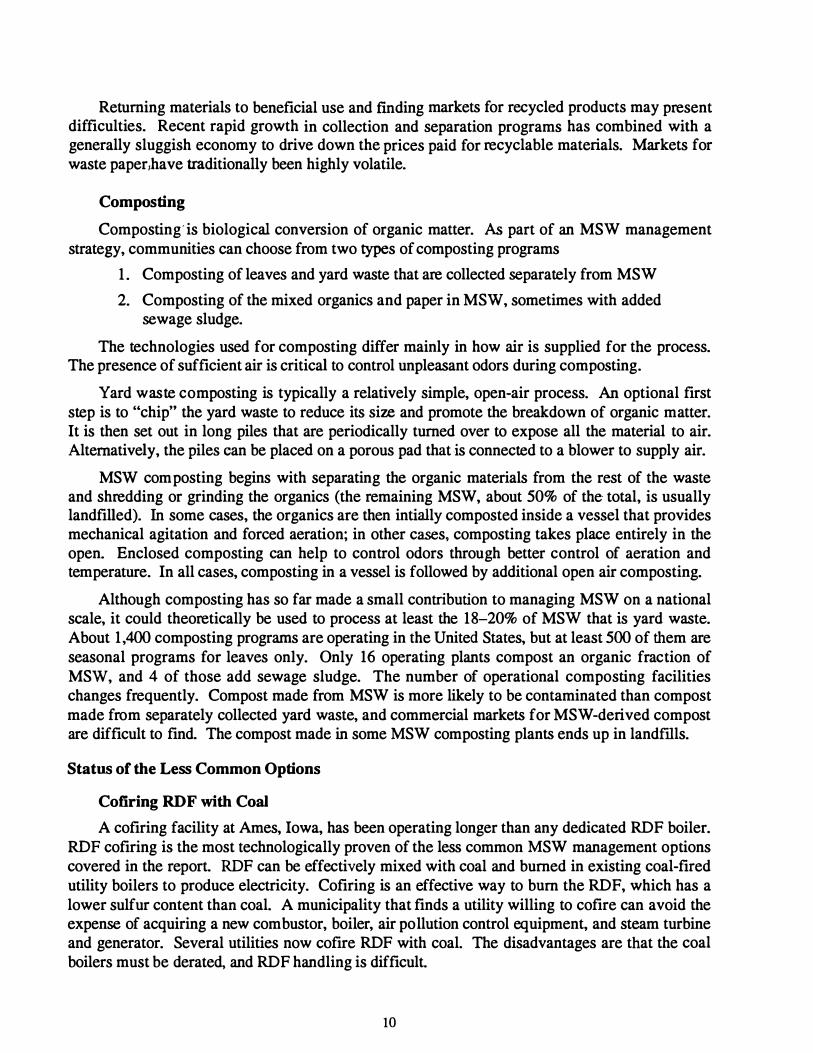
Returning materials to beneficial use and fmding markets for recycled products may present difficulties. Recent rapid growth in collection and separation programs has combined with a generally sluggish economy to drive down the prices paid for recyclable materials. Markets for waste paper1have traditionally been highly volatile.
Composting
Composting· is biological conversion of organic matter. As part of an MSW management strategy, communities can choose from two types of composting programs
1 . Com posting of leaves and yard waste that are collected separately from MSW
2. Com posting of the mixed organics and paper in MSW, sometimes with added sewage sludge.
The technologies used for composting differ mainly in how air is supplied for the process. The presence of sufficient air is critical to control unpleasant odors during composting.
Yard waste com posting is typically a relatively simple, open-air process. An optional first step is to "chip" the yard waste to reduce its size and promote the breakdown of organic matter. It is then set out in long piles that are periodically turned over to expose all the material to air. Alternatively, the piles can be placed on a porous pad that is connected to a blower to supply air.
MSW com posting begins with separating the organic materials from the rest of the waste and shredding or grinding the organics (the remaining MSW, about 50% of the· total, is usually landfilled). In some cases, the organics are then intially composted inside a vessel that provides mechanical agitation and forced aeration; in other cases, composting takes place entirely in the open. Enclosed composting can help to control odors through better control of aeration and temperature. In all cases, com posting in a vessel is followed by additional open air com posting.
Although com posting has so far made a small contribution to managing MSW on a national scale, it could theoretically be used to process at least the 18-20% of MSW that is yard waste. About 1 ,400 com posting programs are operating in the United States, but at least 500 of them are seasonal programs for leaves only. Only 16 operating plants compost an organic fraction of MSW, and 4 of those add sewage sludge. The number of operational composting facilities changes frequently. Compost made from MSW is more likely to be contaminated than compost made from separately collected yard waste, and commercial markets for MSW -derived compost are difficult to find. The compost made in some MSW com posting plants ends up in landiills.
Status of the Less Common Options
Cotiring RDF with Coal
A cofiring facility at Ames, Iowa, has been operating longer than any dedicated RDF boiler. RDF cofiring is the most technologically proven of the less common MSW management options covered in the report. RDF can be effectively mixed with coal and burned in existing coal-fired utility boilers to produce electricity. Cofiring is an effective way to bum the RDF, which has a lower sulfur content than coal. A municipality that finds a utility willing to cofire can avoid the expense of acquiring a new combustor, boiler, air pollution control equipment, and steam turbine and generator. Several utilities now cofire RDF with coal. The disadvantages are that the coal boilers must be derated, and RDF handling is difficult.
10
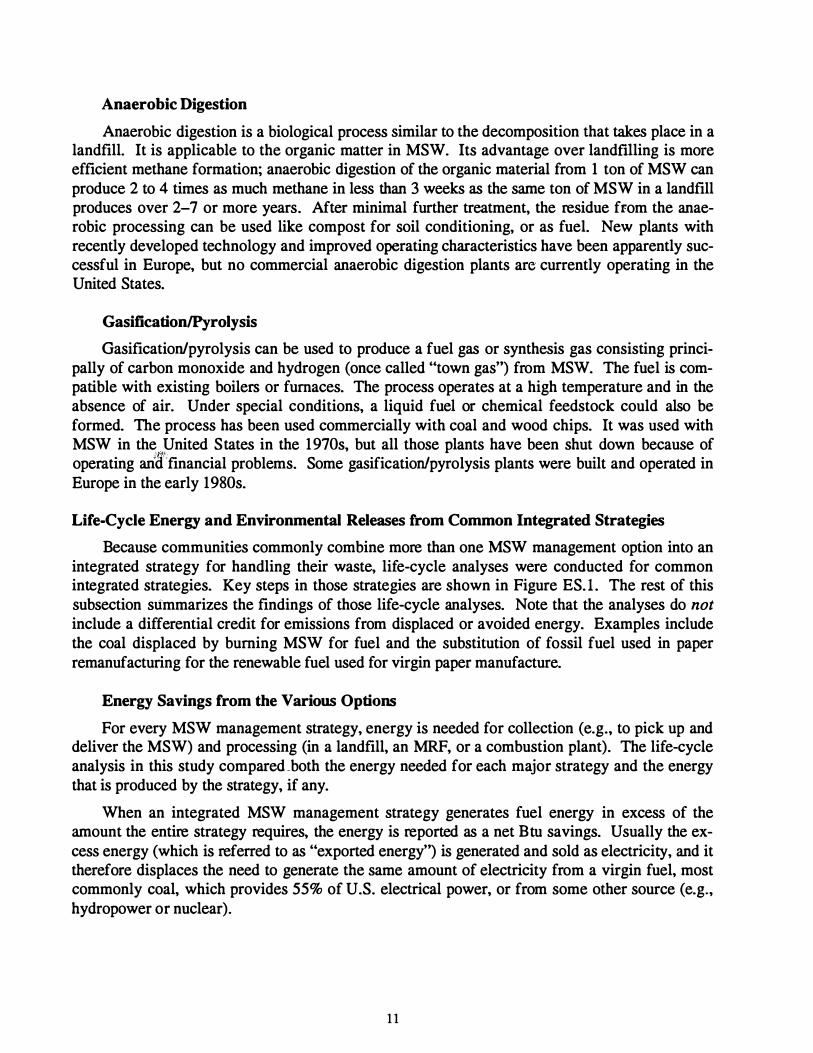
Anaerobic Digestion
Anaerobic digestion is a biological process similar to the decomposition that takes place in a landfill. It is applicable to the organic matter in MSW. Its advantage over landfuling is more efficient methane formation; anaerobic digestion of the organic material from 1 ton of MSW can produce 2 to 4 times as much methane in less than 3 weeks as the same ton of MSW in a landfill produces over 2-7 or more years. After minimal further treatment, the residue from the anaerobic processing can be used like compost for soil conditioning, or as fuel. New plants with recently developed technology and improved operating characteristics have been apparently successful in Europe, but no commercial anaerobic digestion plants are currently operating in the United States.
Gasification/Pyrolysis
Gasification/pyrolysis can be used to produce a fuel gas or synthesis gas consisting principally of carbon monoxide and hydrogen (once called "town gas") from MSW. The fuel is compatible with existing boilers or furnaces. The process operates at a high temperature and in the absence of air. Under special conditions, a liquid fuel or chemical feedstock could also be formed. The process has been used commercially with coal and wood chips. It was used with MSW in the United States in the 1970s, but all those plants have been shut down because of operating arilffinancial problems. Some gasification/pyrolysis plants were built and operated in Europe in the early 1980s.
Life-Cycle Energy and Environmental Releases from Common Integrated Strategies
Because communities commonly combine more than one MSW management option into an integrated strategy for handling their waste, life-cycle analyses were conducted for common integrated strategies. Key steps in those strategies are shown in Figure ES. l . The rest of this subsection summarizes the findings of those life-cycle analyses. Note that the analyses do not include a differential credit for emissions from displaced or avoided energy. Examples include the coal displaced by burning MSW for fuel and the substitution of fossil fuel used in paper remanufacturing for the renewable fuel used for virgin paper manufacture.
Energy Savings from the Various Options
For every MSW management strategy, energy is needed for collection (e.g., to pick up and deliver the MSW) and processing (in a landfill, an MRF, or a combustion plant). The life-cycle analysis in this study compared _both the energy needed for each major strategy and the energy that is produced by the strategy, if any.
When an integrated MSW management strategy generates fuel energy in excess of the amount the entire strategy requires, the energy is reported as a net Btu savings. Usually the excess energy (which is referred to as "exported energy") is generated and sold as electricity, and it therefore displaces the need to generate the same amount of electricity from a virgin fuel, most commonly coal, which provides 55% of U.S. electrical power, or from some other source (e.g., hydropower or nuclear).
1 1
Figure ES.1
STRATEGIES BASED ON THE FIVE MAJOR OPTIONS
m Strategy 1 : MSW to Landfill
� __ M_s_w--t .. �AB1!1!1fiaL ____ ....... _ m. -� rffiln�fiilil £l � � UlJi3:t a Landfill.
_a il\ Community . m =a __ M_s_w_ .. ._�s:;;.
MSW to -. au
:� � �·�ill
· i!. _a _a a MWC £1. 4
Community
Strategy 5: Yard Waste Composting and Landfill
rmn� liliil £l Compost Jl\ Jl\ Jl\ a Ya.
rd Waste c-rfT\ __ _. Facility
4Jl\
_
... � ... �4� � Compost Community
Strategy 6: Curbside Recycling and Landfill � MSW � � lit: .. � JTIL.f:il Landfill r:UrrJuillgffilil £l Recyclables � 1a., � �·�:;.:=.aa ._ Ln .,;.,; -+C ·�RFPL.•_r+-__ s_M_a ____ _.r
Community
aMRF separated materials for processing by industry. These materials include paper, cardboard, glass, metal, plastic
12
Figure ES.1
STRATEGIES BASED ON THE FIVE MAJOR OPTIONS (Concluded)
//
Strategy 8: Curbside Recycling and RDF Com�bustion // RDF Ash
MSW � Prep - • • • • • • � Landfill . . .. �· ... '•· - - - - - - ·
iJi'Vfid .. - �
@llilmill, [!ill� J.1. Recyclables MWC I ' .. M;tals _- � _
a a aa aa .. I •• J-. +-r :RF ,.�sMa ' Z ��
Community
Strategy 10: Curbside Recycling, Yard Waste Composting, and Landfilf� � MSW · � ---------11� � rffihn� [Eilll i!. Recyclables • I "' ef. -+IJ'---:-::;:;:-1f1�M+-�__:._sM_:_a ______ f
Landfill
.£!.1:1..£! .£! Yard Waste � MRF a .£! .. � ·�.Jit ....... Compost
Community � Compost
Facility
Strategy 1 1 : Curbside Recycling, Yard Waste Composting, and Mass�Burn // Ash
Msw - c--JfB-. landfill
� - - · - - - · � .. ---.... ·�� - · - · - - - -
Recyclables MWC
JTIL� r:ffil " • I P', .......c=J ��� SM8 r:lli!]lilillJPilit ; Yard Waste - o.O MRF r ...... Landfill
.LI. .LI. .LI..LI. .£! • � • � ....... Compost
Community Compost
Facility
8MRF separated materials for processing by industry. These materials include paper, cardboard, glass, metal, plastic
13
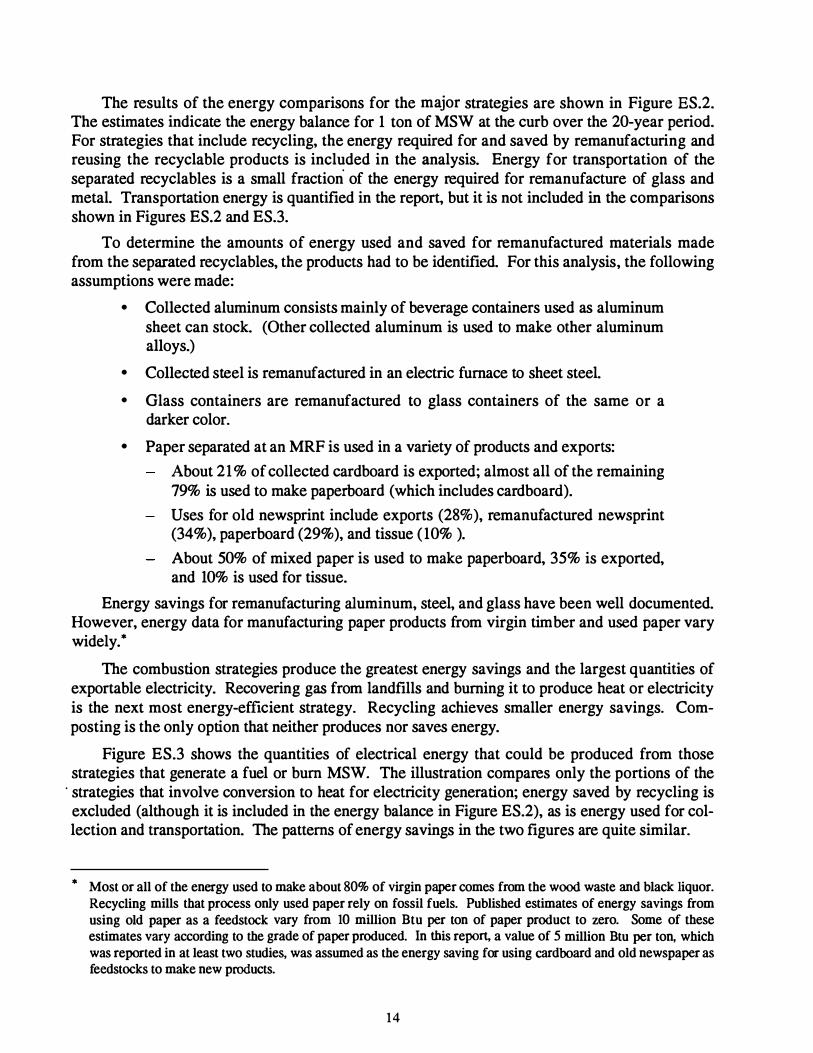
The results of the energy comparisons for the major strategies are shown in Figure ES.2. The estimates indicate the energy balance for 1 ton of MSW at the curb over the 20-year period. For strategies that include recycling, the energy required for and saved by remanufacturing and reusing the recyclable products is included in the analysis. Energy for transportation of the separated recyclables is a small fraction
' of the energy required for remanufacture of glass and
metal. Transportation energy is quantified in the report, but it is not included in the comparisons shown in Figures ES.2 and ES.3.
To determine the amounts of energy used and saved for remanufactured materials made from the separated recyclables, the products had to be identified. For this analysis, the following assumptions were made:
• Collected aluminum consists mainly of beverage containers used as aluminum sheet can stock. (Other collected aluminum is used to make other aluminum alloys.)
• Collected steel is remanufactured in an electric furnace to sheet steel.
• Glass containers are remanufactured to glass containers of the same or a darker color.
• Paper separated at an MRF is used in a variety of products and exports:
About 21% of collected cardboard is exported; almost all of the remaining 79% is used to make paperboard (which includes cardboard).
Uses for old newsprint include exports (28% ), remanufactured newsprint (34%), paperboard (29%), and tissue ( 10% ).
About 50% of mixed paper is used to make paperboard, 35% is exported, and 10% is used for tissue.
Energy savings for remanufacturing aluminum, steel, and glass have been well documented. However, energy data for manufacturing paper products from virgin timber and used paper vary widely.*
The combustion strategies produce the greatest energy savings and the largest quantities of exportable electricity. Recovering gas from landfills and burning it to produce heat or electricity is the next most energy-efficient strategy. Recycling achieves smaller energy savings. Composting is the only option that neither produces nor saves energy.
Figure ES.3 shows the quantities of electrical energy that could be produced from those strategies that generate a fuel or burn MSW. The illustration compares only the portions of the
· strategies that involve conversion to heat for electricity generation; energy saved by recycling is excluded (although it is included in the energy balance in Figure ES.2), as is energy used for collection and transportation. The patterns of energy savings in the two figures are quite similar.
* Most or all of the energy used to make about 80% of virgin paper comes from the wood waste and black liquor.
Recycling mills that process only used paper rely on fossil fuels. Published estimates of energy savings from
using old paper as a feedstock vary from 10 million Btu per ton of paper product to zero. Some of these estimates vary according to the grade of paper produced. In this report. a value of 5 million Btu per ton, which was reported in at least two studies, was assumed as the energy saving for using cardboard and old newspaper as feedstocks to make new products.
14
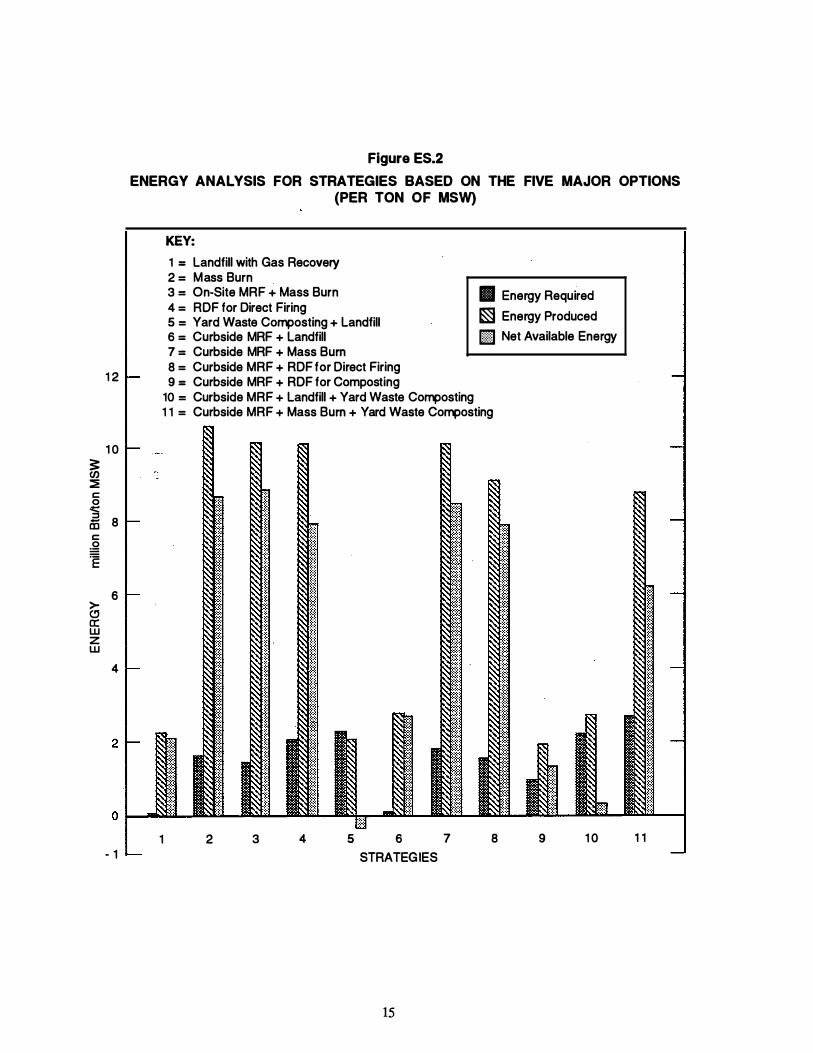
1 2
1 0 :1: en ::E c: 0 .:t::: ::::::1
8 -ID c: � .E
6 >-" a: w z w
4
- 1
Figure ES.2
ENERGY ANALYSIS FOR STRATEGIES BASED ON THE FIVE MAJOR OPTIONS (PER TON OF MSW)
KEY:
1 = Landfill with Gas Recovery 2 = Mass Burn 3 = On-Site MRF + Mass Burn 4 = RDF for Direct Firing 5 = Yard Waste Composting + Landfill 6 = Curbside MRF + Landfill 7 = Curbside MRF + Mass Burn 8 = Curbside MRF + RDF for Direct Firing 9 = Curbside MRF + RDF for Composting
10 = Curbside MRF + Landfill + Yard Waste Composting
Ill Energy Required � Energy Produced IE) Net Available Energy
1 1 = Curbside MRF + Mass Burn + Yard Waste Composting
1 2 3 4 5 6 7 STRATEGIES
15
8 9 1 0 1 1
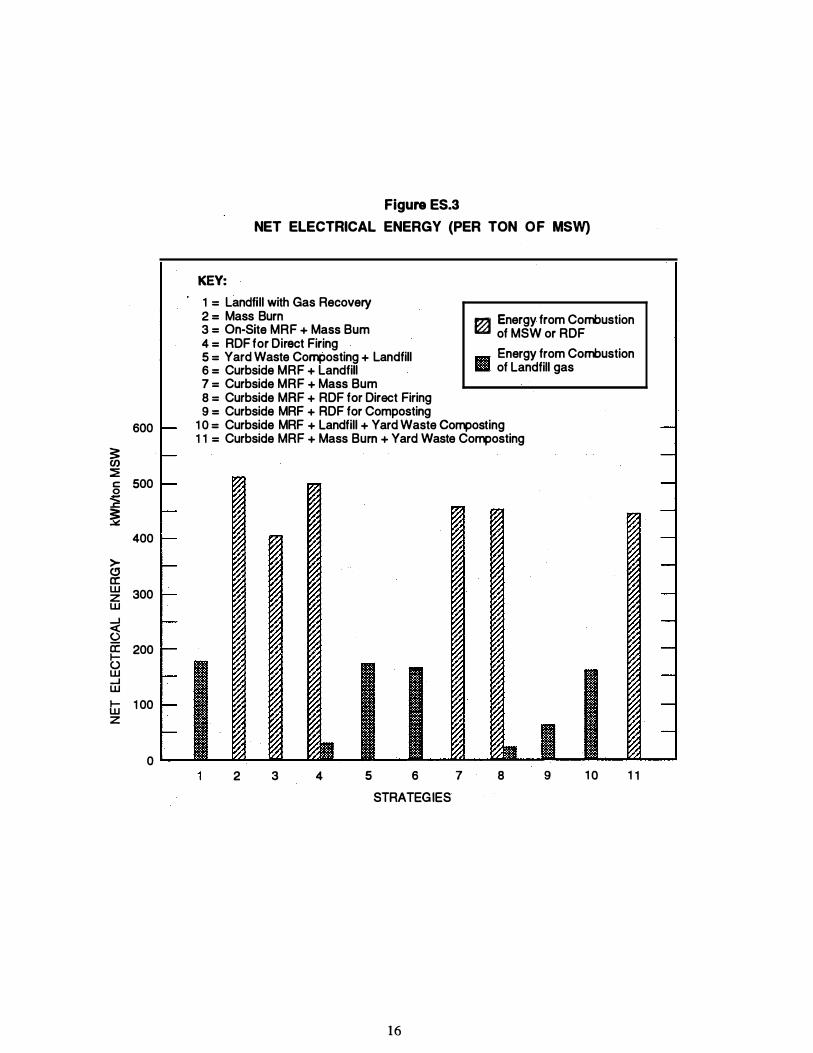
600
3: (/) � c: 0 500
.:!::: ..c:
� 400
>-� a: w 300 z w ....J <( (.) a: 200 I-(.) w ....J w I- 1 00 w z
0
Figure ES.3
NET ELECTRICAL ENERGY (PER TON OF MSW)
KEY: 1 = Landfill with Gas Recovery 2 = Mass Burn 3 = On-Site MRF + Mass Bum 4 = RDF for Direct Firing 5 = Yard Waste Composting + Landfill 6 = Curbside MRF + Landfill 7 = Curbside MRF + Mass Bum 8 = Curbside MRF + RDF for Direct Firing 9 = Curbside MRF + RDF for Composting
� Energy from Combustion of MSW or RDF
1111 Energy from Combustion 1111111111 of Landfill gas
1 0 = Curbside MRF + Landfill + Yard Waste Composting 1 1 = Curbside MRF + Mass Burn + Yard Waste Composting
2 3 4 5 6 7
STRATEGIES
16
8 9 1 0 1 1
Air Emissions
Table ES. l presents air emissions generated by the major integrated waste management strategies (per ton of MSW, over a 20-year period). This table shows releases for each strategy as a whole; Sections 5 through 9 in the report text, Volume I of "Data Summary of Municipal Solid Waste Management Alternatives," break down emissions for key steps.
The releases occur at different rates during the individual steps�ollection/transportation, processing, and final disposal-in each strategy. Transportation releases occur while MSW or recyclable materials are in transit; combustion, MRF processing, and recycling also release . emissions over a short period of time. Composting and landfilling release air emissions over periods ranging from months to the entire 20 years covered in this life-cycle analysis (landfills actually release emissions for periods much longer than 20 years).
The single values that have been derived for this study are not an adequate basis for making fine distinctions between individual options. Every option has a range of performance values that vary with the design, operation, and maintenance of the equipment used and the nature of the MSW being processed when the environmental releases were measured. For example, extensive data on emissions from mass burning and RDF were used for this analysis, but they cannot be used to determine whether one option will be consistently better than the other in actual operation. Large-:scale differences between strategies like landfilling, combustion, or composting, however, can be used to compare the probable results of using one strategy or another.
In general, releases of organic gases to the air are largest for strategies that landfill a large percentage of the MSW. Landfill emissions consist of about 55% methane; about 2% by volume is other organic gases, and the remainder is C02.
In contrast, releases of metals and C02 to the atmosphere are largest for the strategies that include combustion of a large percentage of the MSW. Combustion emissions include almost no organics, but extremely small quantities of dioxins and furans are emitted (as shown in Table ES. l in millionths of pounds per ton of MSW). Landfllling and other organic processes (composting, anaerobic digestion) release extremely small quantities of metals, if any, to the air.
Curbside collection of recyclables increases the emissions from the pick up and transportation step of the MSW management strategy, but reduces the emissions from the disposal step (landfill or combustion) because the smaller amount of material that remains for disposal produces lower releases. As indicated in Table ES. l , comparisons of Strategies 1 and 6, 2 and 7, and 4 and 8 show that some emissions increase and others decrease, but all the changes are relatively small. This study does not cover releases during the remanufacturing step because inadequate data were found.
--
Water Emissions
The water emitted from a landfill is called leachate. Environmental concerns about landfills include the amount of toxic material (metals, organics, dioxins, and other components of MSW) that is released from the landfill by leaching, and the final destination of the leachate. Most new landfills are capped when they are filled, and regulations require them to have a liner and a leachate collection system, and to treat the collected leachate. In spite of these practices, application of a hydrologic model developed by the EPA has shown that about 25% of the rainwater that falls on a landfill can leak in, and 13% of the amount that enters the landfill can escape the collection system and leak out through the liner.
17
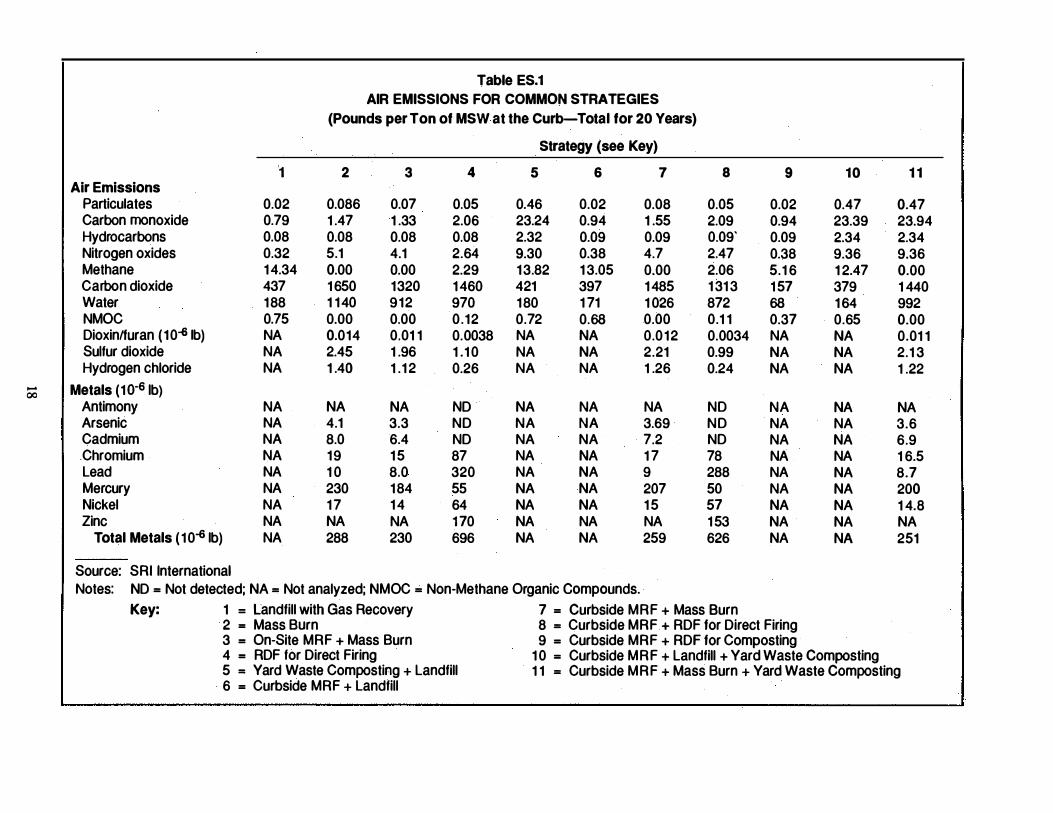
Table ES.1 AIR EMISSIONS FOR COMMON STRATEGIES
(Pounds per Ton of MSW at the Curb-Total for 20 Years)
Strategy (see Key)
'1 2 3 4 5 6 7 8 9 10 1 1 Air Emissions
Particulates 0.02 0.086 0.07 0.05 0.46 0.02 0.08 0.05 0.02 0.47 0.47 Carbon monoxide 0.79 1 .47 1 .33 2.06 23.24 0.94 1 .55 2.09 0.94 23.39 23.94 Hydrocarbons 0.08 0.08 0.08 0.08 2.32 0.09 0.09 0.09' 0.09 2.34 2.34 Nitrogen oxides 0.32 5.1 4.1 2.64 9.30 0.38 4.7 2.47 0.38 9.36 9.36 Methane 1 4.34 0.00 0.00 2.29 1 3.82 1 3.05 0.00 2.06 5.1 6 1 2.47 0.00 Carbon dioxide 437 1 650 1320 1 460 421 397 1 485 1 31 3 1 57 379 1 440 Water 1 88 1 1 40 9 1 2 970 1 80 1 71 1 026 872 68 1 64 992 NMOC 0.75 0.00 0.00 0 . 1 2 0.72 0.68 0.00 0.1 1 0.37 0.65 0.00 Dioxin/furan ( 1 0-6 1b) NA 0.014 0.01 1 0.0038 NA NA 0.0 1 2 0.0034 NA NA 0.01 1 Sulfur dioxide NA 2.45 1 .96 1 .1 0 NA NA 2.21 0.99 NA NA 2.1 3 Hydrogen chloride NA 1 .40 1 . 1 2 0.26 NA NA 1 .26 0.24 NA NA 1 .22
.... 1 Metals (1 o-s lb) 00 Antimony NA NA NA NO NA NA NA NO NA NA NA Arsenic NA 4.1 3.3 NO NA NA 3.69 NO NA NA 3.6 Cadmium NA 8.0 6.4 NO NA NA 7.2 NO NA NA 6.9 Chromium NA 1 9 1 5 87 NA NA 1 7 78 NA NA 1 6.5 Lead NA 1 0 8.0 320 NA NA 9 288 NA NA 8.7 Mercury NA 230 1 84 55 NA NA 207 50 NA NA 200 Nickel NA 1 7 1 4 64 NA NA 1 5 57 NA NA 1 4.8 Zinc NA NA NA 1 70 NA NA NA 1 53 NA NA NA
Total Metals ( 1 0-6 1b) NA 288 230 696 NA NA 259 626 NA NA 251
Source: SRI International Notes: NO = Not detected; NA = Not analyzed; NMOC = Non-Methane Organic Compounds.
Key: 1 = Landfill with Gas Recovery 7 = Curbside MRF + Mass Burn 2 = Mass Burn 8 = Curbside MRF + RDF for Direct Firing 3 = On-Site MRF + Mass Burn 9 = Curbside MRF + RDF for Composting 4 = RDF for Direct Firing 1 0 = Curbside M R F + Landfill + Yard Waste Composting 5 = Yard Waste Composting + Landfill 1 1 = Curbside M R F + Mass Burn + Yard Waste Composting 6 = Curbside MRF + Landfill
Ash from municipal waste combustors (MWCs) is usually landfilled in separate areas called "ash monofills." Ash monofills can generate 8-10 times less leachate than MSW landfills.
Table ES.2 shows the total quantity and some of the constituents of leachate from landfills and ash monofills for the major integrated waste management strategies (per ton of MSW, over a 20-year period). The amounts in the table reflect both the percentage that is captured for treatment and the percentage that leaks through the liner. Because leachate is released slowly and continuously over the 20-year period covered in this report, the concentrations of both organics and metals are quite low.
Organics in leachate from an MSW landfill total about 0. 16 pound per ton of MSW over a 20-year period.* Little organic material is left in ash after combustion, and the leachate from an ash monofill includes only about one ten-thousandth of a pound of organics per ton of MSW. t
Quantities of metals in the leachate are also lower for ash monofills than for MSW landfills. Most metals dissolve more slowly in ash monofills than they do under the more acid conditions in MSW landfills because the ash and excess scrubber lime are not acidic. For example, the concentration of lead in the MSW leachate is 90 J.Lg per liter; lead in leachate from an ash landfill declines to less than 1J.Lg per liter within 2 years. In comparison, a typical drinking water standard for lead permits about 50 J.Lg per liter.
' •"'"
This analysis does not cover leaching that might result from the waste from processes that remanufacture paper, metals, and plastics separated from MSW for recycling. Few data on those potential emissions were found.
Landfill Space
Figure ES.4 compares landfill volumes required by the common MSW management strategies. The maximum capacity of a landfill is normally determined by volume, not weight. The land area consumed for MSW management is largest if all waste is landfilled; landfill requirements may be up to 90% lower if recyclables are removed, the remaining -MSW is burned, and the ash from. combustion is landfilled. Collection and separation of recyclables saves about 14% of the landfill space in communities that have successful curbside collection programs and market the separated products. A strategy with com posting MSW reduces the volume of landfilled material by 50-60% if the compost can be used (recycled). Even if the compost is landfilled, composting saves about 15-25% of the landfill space. The amount of landfill space that can be saved by composting separately collected yard waste has not been documented. In the one community used as an example in this study, the savings from composting yard waste totaled less than 5%. The maximum potential savings would result from curbside collection of all the yard waste in MSW; that could save about 1 7-20% by volume of the total landfill space required.
* Measured as chemical oxygen demand (COD).
t Measured as total organic carbon (TOC).
19

Table ES.2 EFFLUENT FOR COMMON STRATEGIES
(Pounds per Ton of MSW at the Curb-Total for 20 Years)
Strategy (see Key)
1 2 3 4 5 6 7 8 9 1 0 1 1 Effluent
Leachate (gallons) 80 1 0.08 8 .0 1 8 .29 77. 1 2 72.80 9.07 1 6.46 28.8 69.60 8.77 Leachate 667 84 67 1 52 643 607 75.6 1 37 240 580 73 Chloride 1 .1 3 1 .1 7 0.94 0.82 1 .09 1 .03 1 .05 0.74 0.41 0.98 1 .02 Sodium 0.73 0.26 0.21 0.26 0.7 0.66 0.23 0.23 0.26 0.63 0.23 Potassium 0.60 0. 1 4 0. 1 1 0 .1 7 0.58 0.56 0 . 1 2 0.1 5 0.21 0.52 0.1 2 Chemical oxygen demand 0.1 6 NA NA 0 .02 0.1 5 0 .15 NA 0.02 0.056 0.13 NA Total organic carbon NA 0.0003 0.0002 <0.0002 NA <0.0002 0.0002 <0.0002 NA NA 0.0002
Metals (1 0-3 1b) Arsenic 86 NO N O 1 3.8 82.9 78 N D 1 2.4 31 74.8 N O
N I Cadmium 3.0 NO NO 0.48 2.89 2.73 NO 0.43 1 .08 2.61 NO 0 Chromium 1 63 NO NO 26. 1 0 1 57 1 48 N O 23.5 59 1 42 N O
Copper 43 NO NO 6.88 41 .5 39. 1 NO 6. 1 9 1 5 37 N D Nickel 1 08 NO NO 1 7.30 1 04 98 N O 1 5.6 38 94 ND Lead 48 NO NO 7.68 46.3 43 N D 6.91 1 7 42 N D Mercury 6.0 NO NO 0.96 5.78 5.46 ND 0.86 2. 1 6 5.22 NO Zinc NA NO NO ' NA NA NA N O NA NA NA NO
Total Metals (1 0-3 1b) 457 NO NO 73. 1 0 440 41 6 NO 65.8 1 63 270 N O
Source: SRI International Notes: NO = Not detected; NA = Not analyzed.
Key: 1 = Landfill wHh Gas Recovery 7 = Curbside MRF + Mass Burn 2 = Mass Burn 8 = Curbside MRF + RDF for Direct Firing 3 = On-Site MRF + Mass Burn 9 = Curbside MRF + RDF for Composting 4 = RDF for Direct Firing 1 0 = Curbside MRF + Landfill + Yard Waste Composting 5 = Yard Waste Composting + Landfill 1 1 = Curbside MRF + Mass Burn + Yard Waste Composting 6 = Curbside MRF + Landfill
Cost Data for the Major Waste Management Options
Figures ES.5 through ES.9 show published estimates of the capital costs for the five most common MSW management options. (Costs of operating trucks for curbside collection are not included.) The costs reported in the literature are often incomplete, and published sources often do not fully report on which costs are included and which are excluded. Furthermore, the estimates from different sources are based on a wide variety of assumptions; thus, even estimates for the same technology may not be fully comparable. The inadequacies and inconsistencies in the cost data found in the literature make it imprudent to rely on the estimates in Figures ES.5 through ES.9 for detailed comparisons of the costs of the various options, for the reasons outlined under "Missing Data." Until cost estimates for waste management options are built from system components using consistent assumptions, the safest way to compare costs is to rely on site-specific quotations from contractors.
MISSING DATA AND RESEARCH NEEDS
The data gathered for this study vary significantly in quality and consistency. On some topics, no data at all are available. The effects of the limitations on the results of the analysis varied from trivial to major. The 20-year time period chosen for the life-cycle analysis of energy and emissions severely strained the limits of knowledge about many of the options. In addition, the review of the data often indicated the need for research to help to eliminate barriers to the more widespread adoption of certain options. This subsection provides a broad overview of important data gaps and potential research needs.
Cost data in the literature are limited, and the range of capital and operating cost estimates is broad. The capital cost variations reflect inconsistencies in the sources of the estimates rather than predictable variations based on the type of technology or the size of the facility. Some sources fail to report the assumptions on which published cost data are based, and even if the assumptions are known, the bases may be so different that the results are not actually comparable.
For example, the year when a facility was built strongly affects the interest rate paid for the capital, as well as the regulations that apply at the time of construction. Whether a project is privately or publicly funded also affects the interest rates on the capital costs. Location-specific differences, including those in the costs of associated activities such as road improvement, will also affect the comparability of the data. Most of the technologies are typically financed through public bonds in some form, and prospectuses are available for those projects. Even these disclosures may not defme or cover all the costs of the facility, however. Some bond issues include costs unrelated to project costs. Operating costs are also affected by local differences in factors such as labor rates, labor contracts, safety rules, and crew sizes that are rarely reported in the open literature. Accounting systems, especially those used by cities and private owners and operators of landfills, vary widely. Cost data on separation/recycling and com posting are scarce. To facilitate comparisons of the various strategies for managing MSW, costs for all the systems could be built up from system components using a consistent set of assumptions.
The most extensive data are available on the combustion options. Because combustion is a controlled process that is completed within a short period of time, inputs and outputs, especially of energy, can be measured effectively.
21
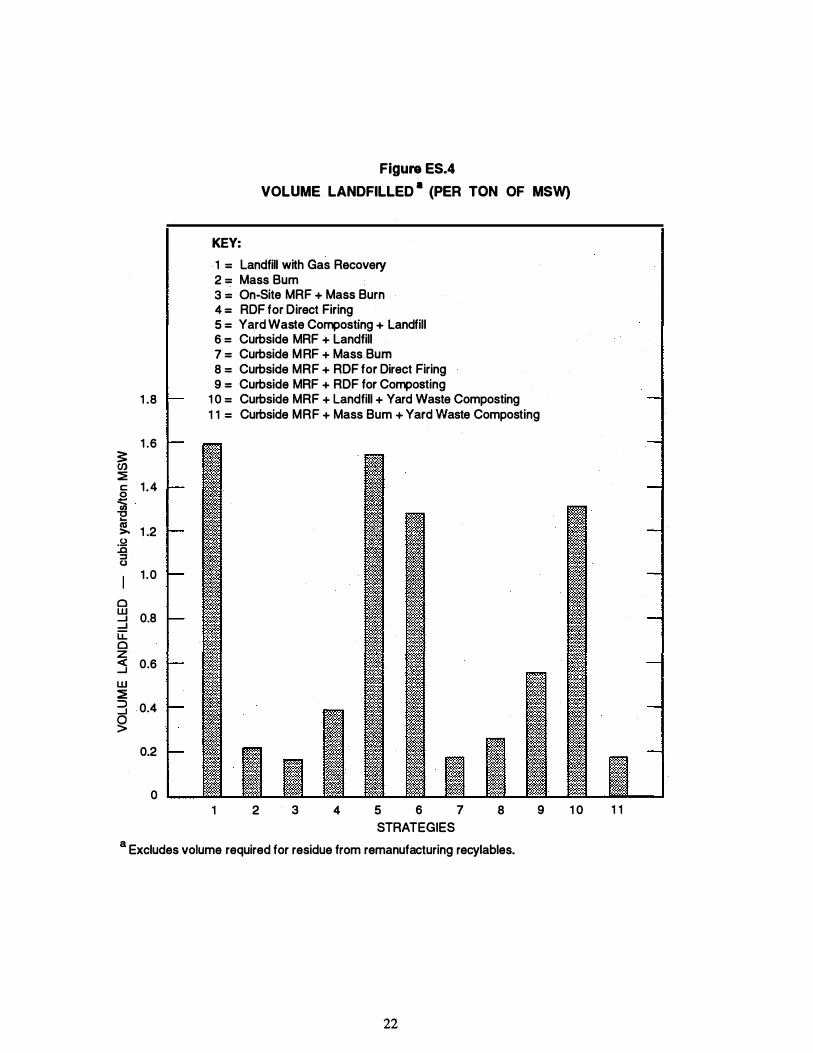
1 .8
1 .6 3: (J) � c: 0 1 .4
� U) "0 .... <a
1 .2 >. .9 .0 :::J u
1 .0
0 w 0.8 ..J ..J u:: 0 z <( 0.6 ..J
w � :::> 0.4 ..J
� 0.2
0
Figure ES.4
VOLUME LANDFILLED a (PER TON OF MSW)
KEY:
1 = Landfill with Gas Recovery 2 = Mass Bum 3 = On-Site MRF + Mass Burn 4 = RDF for Direct Firing 5 = Yard Waste Composting + Landfill 6 = Curbside MRF + Landfill 7 = Curbside MRF + Mass Bum 8 = Curbside MRF + RDF for Direct Firing 9 = Curbside MRF + RDF for Composting
1 0 = Curbside MRF + Landfill + Yard Waste Composting 1 1 = Curbside MRF + Mass Bum + Yard Waste Composting
1 2 3 4 5 6 7 STRATEGIES
8 9 1 0
a Excludes volume required for residue from remanufacturing recylables.
22
1 1
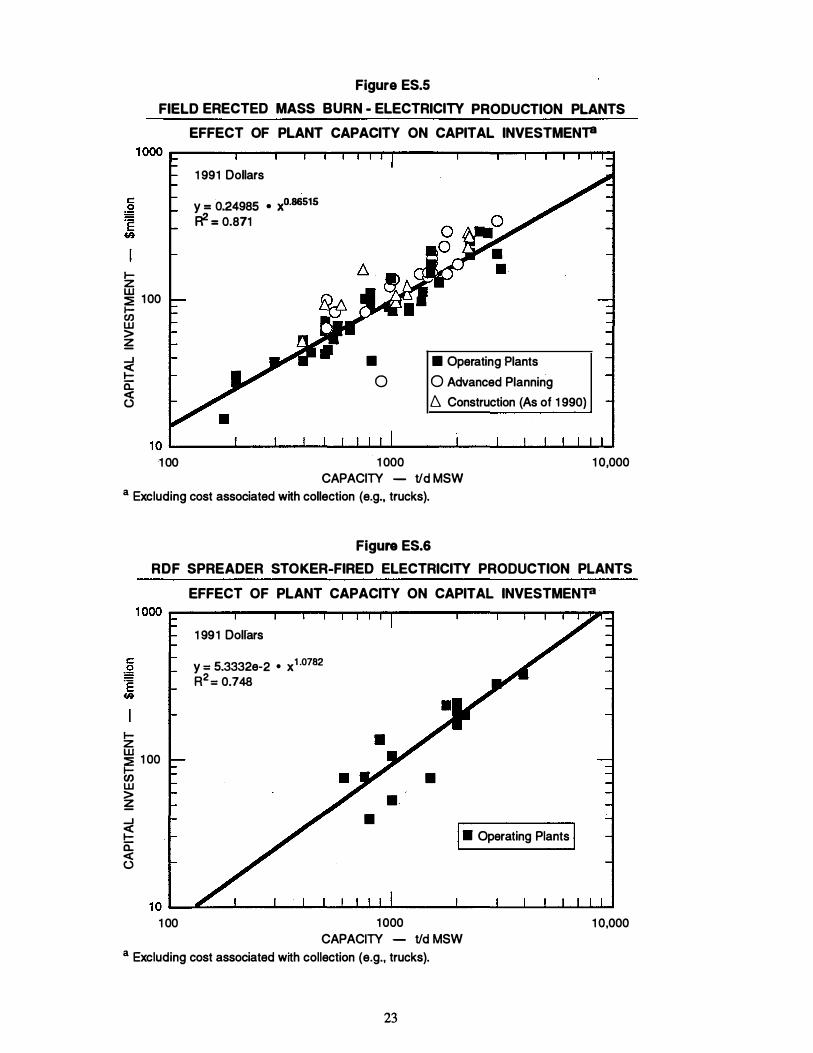
1-z
Figure ES.5
FIELD ERECTED MASS BURN - ELECTRICITY PRODUCTION PLANTS
EFFECT OF PLANT CAPACITY ON CAPITAL INVESTMEN'P
1 991 Dollars
y = 0.24985 • X0.86515 R2 = 0.871
� 1 00 1-C/) w > � � a: C3
• 0
• Operating Plants 0 Advanced Planning 6. Construction (As of 1 990)
1 0 �----�--_.--������----�--_. __ ._���� 1 00 1 000
CAPACITY - tid MSW 1 0,000
a Excluding cost associated with collection (e.g., trucks).
1-z
Figure ES.6
RDF SPREADER STOKER-FIRED ELECTRICITY PRODUCTION PLANTS
EFFECT OF PLANT CAPACITY ON CAPITAL INVESTMEN"P
1 991 Dolrars
y = 5.3332e-2 • x1 ·0782 R2 = 0.748
� 1 00 � • w > � � a: <( (..)
• • I• Operating Plants j
1 0 ��--_. __ _. __ ������----�--�--����� 1 00 1 000
CAPACITY - tid MSW 1 0,000
a Excluding cost associated with collection (e.g., trucks).
23
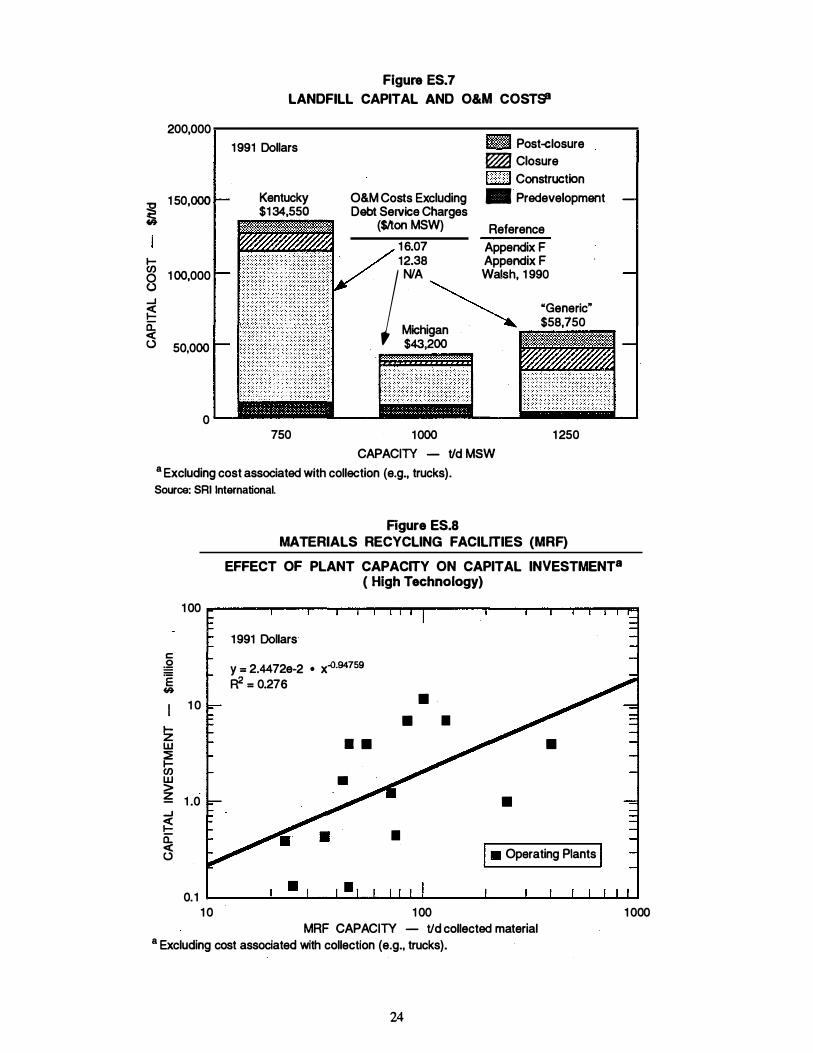
200,000
� �
1 50,000
1-en 1 00,000 0 () ...J
� a: c( () 50,000
0
Figure ES.7
LANDFILL CAPITAL AND O&M COSTSS
1 991 Dollars
Kentucky $1 34,550
O&M Costs Excluding Debt Service Charges
($/ton MSW)
®®$1 Post-closure � Closure 1:::::::: :::1 Construction • Predevelopment
Reference 1 6.07 Appendix F 12.38 Appendix F
J N/A Walsh, 1 990
� "Generic" Michigan � $58,750 $43,200
750 1000 CAPACITY - tid MSW
a Excluding cost associated with collection (e.g., trucks).
1 250
Source: SRI International.
1 00
c: � .E �
I 1 0
!z UJ � 1-en UJ > � 1 .0 ...J
� a: c( (.)
Rgure ES.S MATERIALS RECYCLING FACILITIES (MRF)
EFFECT OF PLANT CAPACITY ON CAPITAL INVESTMENT8 ( High Technology)
1 991 Dollars
y = 2.4472e-2 • x..o·94759 � = 0.276
• • •
• • •
• •
• I • Operating Plants I 0.1 �----_.--�--�_._._.��------._--���._._��
1 0 1 00 MRF CAPACITY - tid collected material a Excluding cost associated with collection (e.g., trucks).
24
1 000
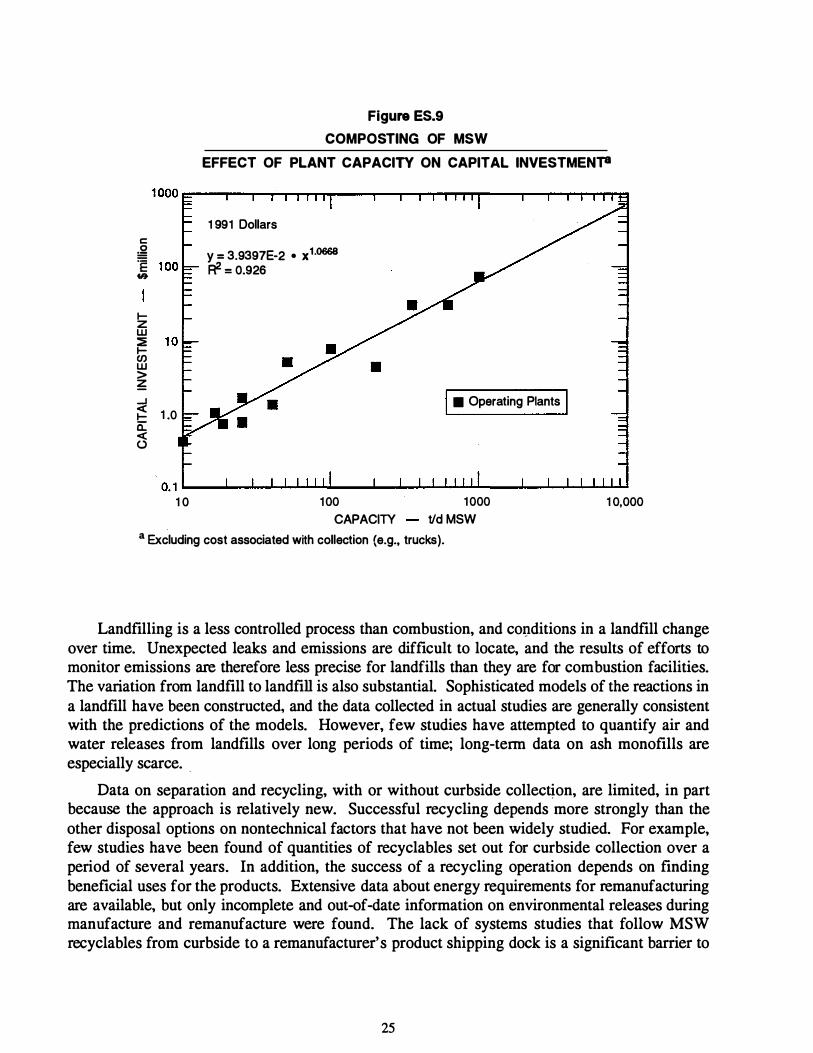
c: ,g e Cit
1-z w ::E 1-en w > � ....I <( 1-a: <( (..)
1 .0
Figure ES.9
COMPOSTING OF MSW
EFFECT OF PLANT CAPACITY ON CAPITAL INVESTMENTS
1 991 Dollars
y = 3.9397E-2 • x1·0668 R2 = 0.926
I • Operating Plants I
0. 1 �--���� .... �--���� .... �--���� .. � 1 0 1 00
CAPACITY 1 000
tid MSW 1 0,000
a Excluding cost associated with collection (e.g., trucks).
Landfilling is a less controlled process than combustion, and co1_1ditions in a landfill change over time. Unexpected leaks and emissions are difficult to locate, and the results of efforts to monitor emissions are therefore less precise for landfills than they are for combustion facilities. The variation from landfill to landfill is also substantial. Sophisticated models of the reactions in a landfill have been constructed, and the data collected in actual studies are generally consistent with the predictions of the models. However, few studies have attempted to quantify air and water releases from landfills over long periods of time; long-term data on ash monofills are especially scarce . .
Data on separation and recycling, with or without curbside collection, are limited, in part because the approach is relatively new. Successful recycling depends more strongly than the other disposal options on nontechnical factors that have not been widely studied. For example, few studies have been found of quantities of recyclables set out for curbside collection over a period of several years. In addition, the success of a recycling operation depends on finding beneficial uses for the products. Extensive data about energy requirements for remanufacturing are available, but only incomplete and out-of-date information on environmental releases during manufacture and remanufacture were found. The lack of systems studies that follow MSW recyclables from curbside to a remanufacturer' s product shipping dock is a significant barrier to
25
conducting a life-cycle analysis that compares recycling with alternative MSW management strategies.
Data on composting of MSW are also limited. Data on emissions during processing are incomplete, and available studies have been less rigorous than analyses of emissions from either landfills or combustors. Data on emissions from the use of the compost are also scarce, and data on energy requirements are incomplete. Technical and marketing difficulties also constitute barriers to successful application. Composting operations may seem attractive as low-cost alternatives to combustion or landfilling, but inexpensively constructed facilities often suffer serious operating · problems. At the other end of the process, at least one large technically successful MSW composting plant has had great difficulty finding markets for the compost product.
Anaerobic digestion is in its infancy in the United States, and no commercial facilities are operating. Adequate data on actual energy use and production, emissions, and composition and use of the compost product cannot be gathered until a commercial plant is constructed and successfully operated.
RDF cofiring is comparatively well characterized. The primary barrier to more widespread use is the difficulty in finding suitable incentives for communities, utilities, and industry to establish mutually beneficial cofiring projects on furnaces with grates.
No commercial gasification or pyrolysis plants are operating in the United States, and the data available on plants operated in the 1970s are out of date. Gasification and pyrolysis of MSW are unproven. At current fossil fuel prices, demand for the gas they produce could be small, and little incentive may exist for additional development of MSW gasification/pyrolysis facilities. If chemical feedstocks can be made by pyrolysis/gasification, the economic considerations may change.
In summary, for combustion processes, extensive data are available on costs, and wellverified data are available on energy and emissions. _Less consistent data are available on landfilling, and few data have been found on collection, separation, and remanufacturing and on com posting.
OTHER PROJECT DOCUMENTATION
The findings of this study are published in a two-volume report and 10 appendixes. The appendixes provide detailed summaries of the literature on the various options, as well as bibliographies of the references cited in the appendixes. In addition to this executive summary, those documents include:
"Data Summary of Municipal Solid Waste Management Alternatives. Volume 1: Report Text." Final Report, June 1992, SRI International. This report describes major findings in detail.
"Data Summary of Municipal Solid Waste Management Alternatives. Volume IT: Exhibits." Final Report, June 1992, SRI International. This volume contains detailed cost summaries, the data base, and other background information.
"Collection and Evaluation of Comparative Data for Waste ManagemeJ:!t Alternatives. Appendixes":
26
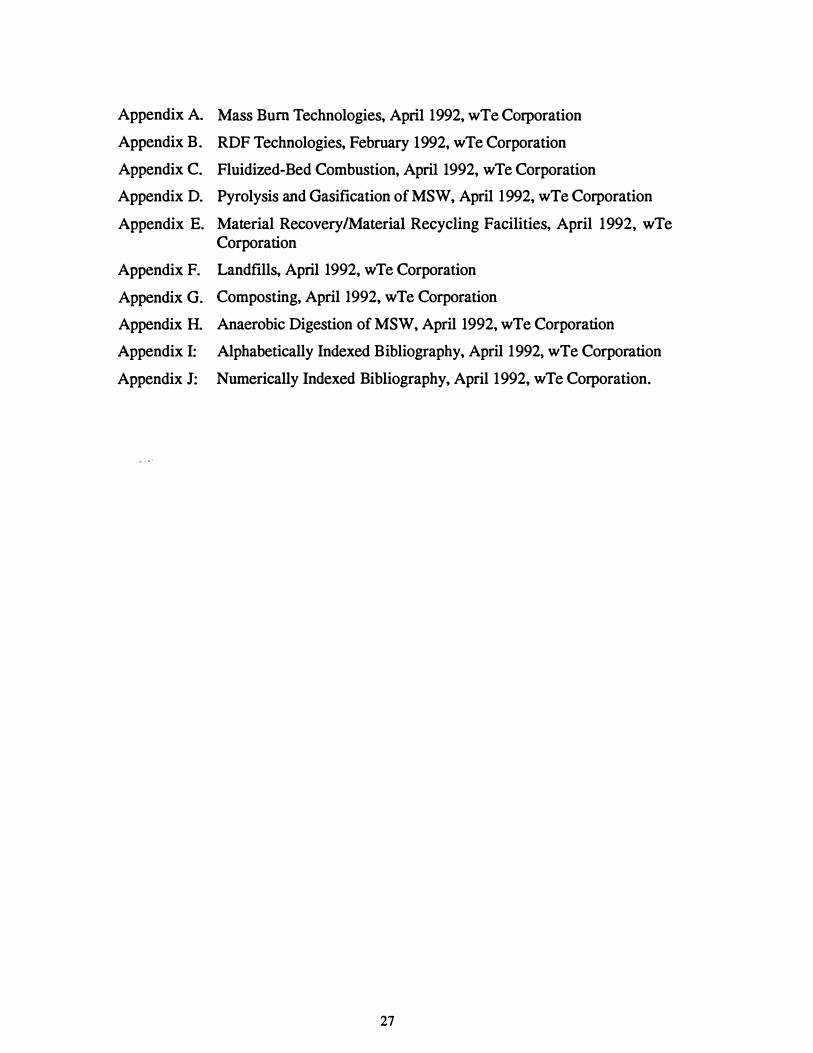
Appendix A. Mass Bum Technologies, Apri1 1992, wTe Corporation
Appendix B. RDF Technologies, February 1992, wTe Corporation
Appendix C. Fluidized-Bed Combustion, Apri1 1992, wTe Corporation
Appendix D. Pyrolysis and Gasification of MSW, Apri1 1992, wTe Corporation
Appendix E. Material Recovery/Material Recycling Facilities, April 1992, wTe Corporation
Appendix F. Landfills, April 1992, wTe Corporation
Appendix G. Composting, April 1992, wTe Corporation
Appendix H. Anaerobic Digestion of MSW, April 1992, wTe Corporation
Appendix I: Alphabetically Indexed Bibliography, April 1992, wTe Corporation
Appendix J: Numerically Indexed Bibliography, April 1992, wTe Corporation .
. , . , '
27


1. INTRODUCTION
Municipalities are responsible for managing the solid waste generated in their jurisdictions. The primary purpose of municipal waste management is to handle waste safely, economically, and in a way that protects human health and the environment. Municipalities have many possible alternatives for municipal (MSW) management. Each community has its own criteria for the technologies it selects, and it needs to compare the various alternatives to choose an appropriate single waste handling technology or an integrated combination of technologies to form a waste management strategy.
The U.S. Department of Energy (DOE), through the National Renewable Energy Laboratory (NREL) recognized the need to provide a foundation for comparing available methods of managing MSW. In response, DOE initiated a study to gather and review publicly available information on various waste management technologies, assess the quality of the data, and convert the data to a consistent basis for ease in comparing alternatives. This report summarizes the results.
The U.S. Environmental Protection Agency (EPA) has estimated that U.S. MSW* totaled 180 million tons in 1988t and will grow over the next decade at a rate of 1 .5% per year, twice the rate of growth in the population (FR, 1991h). Other recent examinations of the estimates used by the EPA indicate that the rate of growth of MSW has been constant over the period 1970--1984 (for which data were analyzed), and that the amount of MSW generated increases directly with population growth, which is currently averaging 0.75% per year (Alter, 1991).
At present, 69-73% of all MSW is landfilled, and 17% is combusted in 176 municipal waste combustors (NSWMA, 1991). Some sources claim that recycling now handles 10--14% of U.S. waste (EPA, 1990). _
OBJECTIVES, SCOPE, METHODOLOGY
This report describes individual waste management methods, such as sanitary landfilling, composting, recycling, or combustion. Those methods are referred to here as "options" or as "technologies." A data base has been constructed to make the data on individual technologies accessible. To determine the effects of combining individual technologies, this report also presents analyses of selected combinations of waste management technologies, together with choices concerning collection and transport of waste. Those combinations are referred to here as "integrated strategies." In addition, the data base allows users to estimate the energy and emissions for strategies consisting of any combination of individual technologies.
* MSW consists of residential solid waste and some commercial, instiwtional, and industrial wastes.
t The EPA's estimate was published in 1990 (EPA, 1990). Other sources report an estimate of 293 million tons per year of solid waste, based on the sum of the quantities of solid waste reported by each state; that estimate, however, may include construction and demolition debris, sewage sludge, and some industrial waste (Glenn and Riggle, 1991). The EPA estimates thati ndustry generated 7 billion tons of solid waste in 1985, and managed 99% of it on site (FR, 1991m).
29
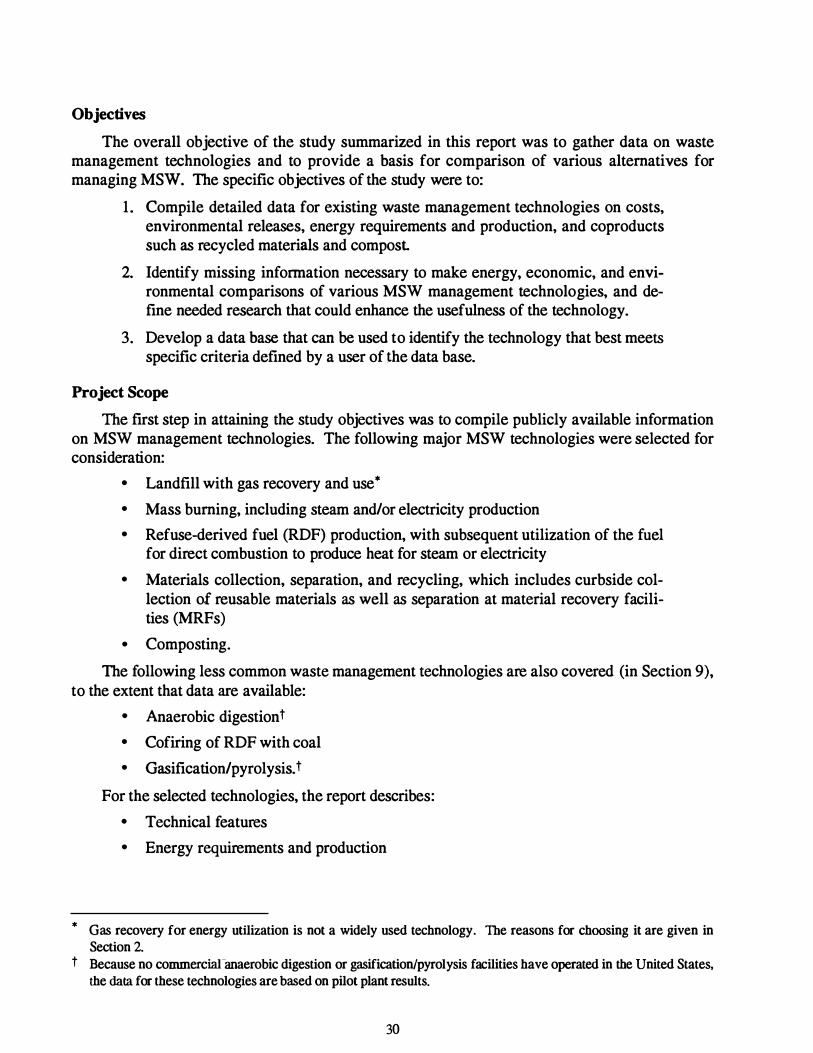
Objectives
The overall objective of the study summarized in this report was to gather data on waste management technologies and to provide a basis for comparison of various alternatives for managing MSW. The specific objectives of the study were to:
1 . Compile detailed data for existing waste management technologies on costs, environmental releases, energy requirements and production, and coproducts such as recycled materials and compost
2. Identify missing information necessary to make energy, economic, and environmental comparisons of various MSW management technologies, and define needed research that could enhance the usefulness of the technology.
3. Develop a data base that can be used to identify the technology that best meets specific criteria defined by a user of the data base.
Project Scope
The first step in attaining the study objectives was to compile publicly available information on MSW management technologies. The following major MSW technologies were selected for consideration:
• Landfill with gas recovery and use*
• Mass burning, including steam and/or electricity production
• Refuse-derived fuel (RDF) production, with subsequent utilization of the fuel for direct combustion to produce heat for steam or electricity
• Materials collection, separation, and recycling, which includes curbside collection of reusable materials as well as separation at material recovery facilities (MRFs)
• Composting.
The following less common waste management technologies are also covered (in Section 9), to the extent that data are available:
*
• Anaerobic digestiont
• Cofiring of RDF with coal
• Gasification/pyrolysis. t
For the selected technologies, the report describes:
• Technical features
• Energy requirements and production
Gas recovery for energy utilization is not a widely used technology. The reasons for choosing it are given in
Section 2. t Because no commerciaranaerobic digestion or gasification/pyrolysis facilities have operated in the United States,
the data for these technologies are based on pilot plant results.
30
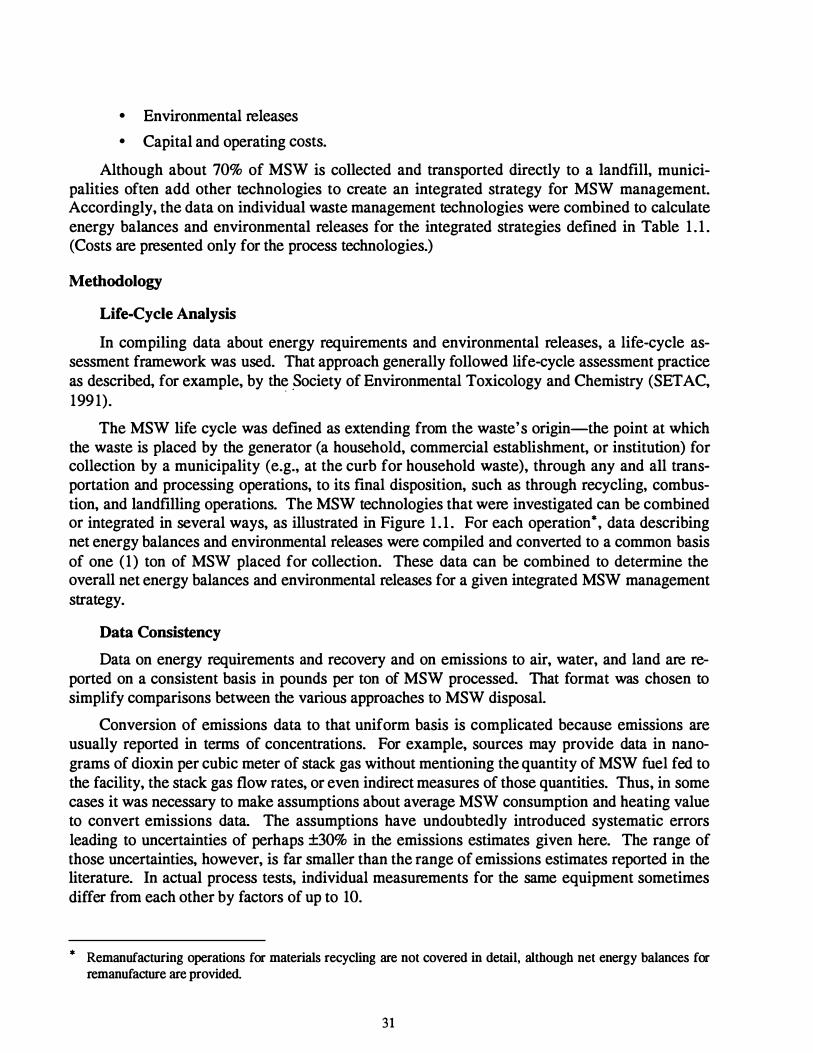
• Environmental releases
• Capital and operating costs.
Although about 70% of MSW is collected and transported directly to a landfill, municipalities often add other technologies to create an integrated strategy for MSW management. Accordingly, the data on individual waste management technologies were combined to calculate energy balances and environmental releases for the integrated strategies defined in Table 1 . 1 . (Costs are presented only for the process technologies.)
Methodology
Life-Cycle Analysis
In compiling data about energy requirements and environmental releases, a life-cycle assessment framework was used. That approach generally followed life-cycle assessment practice as described, for example, by the ,Society of Environmental Toxicology and Chemistry (SETAC, 199 1).
.
The MSW life cycle was defined as extending from the waste's origin-the point at which the waste is placed by the generator (a household, commercial establishment, or institution) for collection by a municipality (e.g., at the curb for household waste), through any and all transportation and processing operations, to its final disposition, such as through recycling, combustion, and landfilling operations. The MSW technologies that were investigated can be combined or integrated in several ways, as illustrated in Figure 1 . 1 . For each operation*, data describing net energy balances and environmental releases were compiled and converted to a common basis of one (1) ton of MSW placed for collection. These data can be combined to determine the overall net energy balances and environmental releases for a given integrated MSW management strategy.
Data Consistency
Data on energy requirements and recovery and on emissions to air, water, and land are reported on a consistent basis in pounds per ton of MSW processed. That format was chosen to simplify comparisons between the various approaches to MSW disposal.
Conversion of emissions data to that uniform basis is complicated because emissions are usually reported in terms of concentrations. For example, sources may provide data in nanograms of dioxin per cubic meter of stack gas without mentioning the quantity of MSW fuel fed to the facility, the stack gas flow rates, or even indirect measures of those quantities. Thus, in some cases it was necessary to make assumptions about average MSW consumption and heating value to convert emissions data. The assumptions have undoubtedly introduced systematic errors leading to uncertainties of perhaps ±30% in the emissions estimates given here. The range of those uncertainties, however, is far smaller than the range of emissions estimates reported in the literature. In actual process tests, individual measurements for the same equipment sometimes differ from each other by factors of up to 10.
* Remanufacturing operations for materials recycling are not covered in detail, although net energy balances for remanufacture are provided.
31
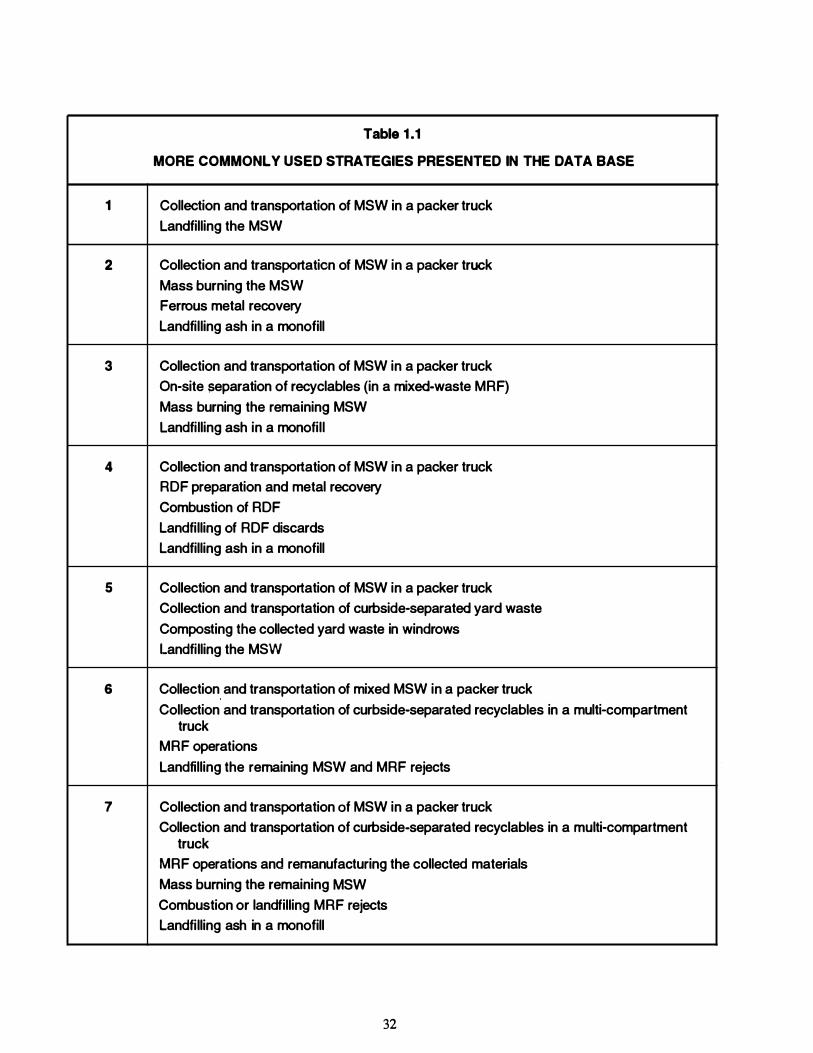
Table 1 .1
MORE COMMONLY USED STRATEGIES PRESENTED IN THE DATA BASE
1 Collection and transportation of MSW in a packer truck landfilling the MSW
2 Collection and transportation of MSW in a packer truck Mass burning the MSW Ferrous metal recovery Landfilling ash in a rnonofill
3 Collection and transportation of MSW in a packer truck On-site separation of recyclables (in a mixed-waste MRF) Mass burning the remaining MSW landfilling ash in a monofill
4 Collection and transportation of MSW in a packer truck RDF preparation and metal recovery Combustion of RDF Landfilling of RDF discards Landfilling ash in a rnonofill
5 Collection and transportation of MSW in a packer truck Collection and transportation of curbside-separated yard waste Composting the collected yard waste in windrows Landfilling the MSW
6 Collection and transportation of mixed MSW in a packer truck Collection and transportation of curbside-separated recyclables in a multi-compartment
truck MRF operations landfilling the remaining MSW and MRF rejects
7 Collection and transportation of MSW in a packer truck Collection and transportation of curbside-separated recyclables in a multi-compartment
truck MRF operations and remanufacturing the collected materials Mass burning the remaining MSW Combustion or landfilling MRF rejects Landfilling ash in a rnonofill
32
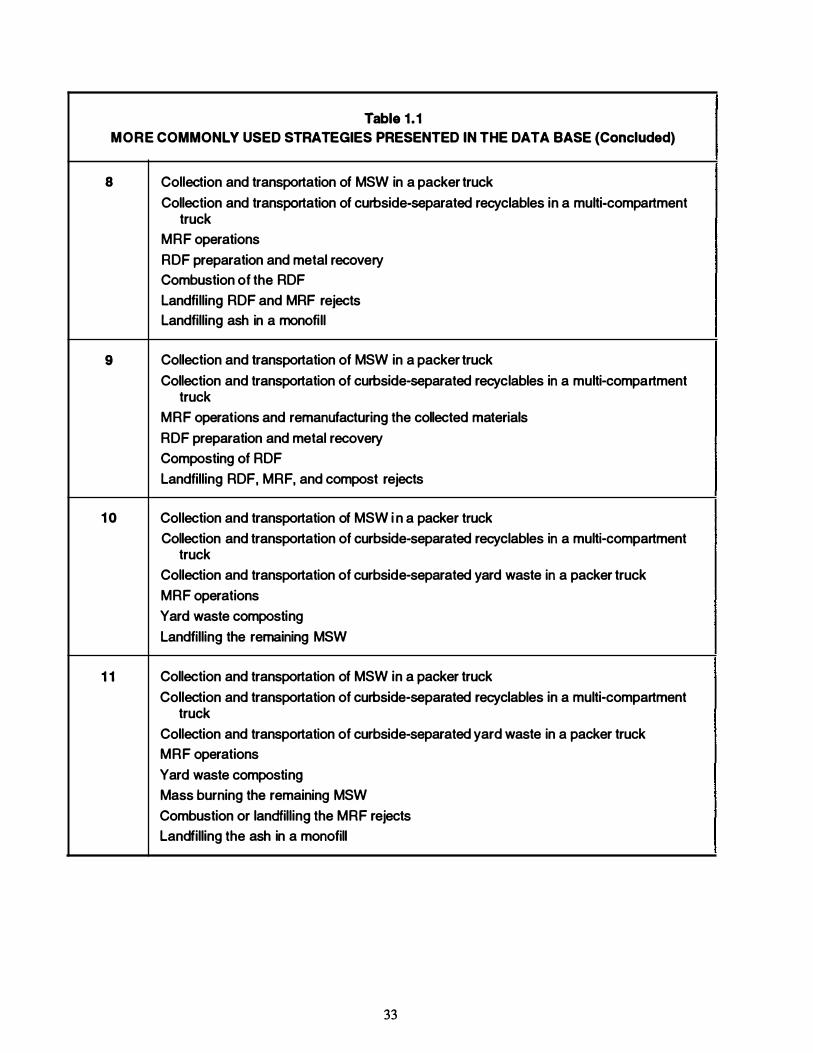
Table 1.1 MORE COMMONLY USED STRATEGIES PRESENTED IN THE DATA BASE (Concluded)
8 Collection and transportation of MSW in a packer truck Collection and transportation of curbside-separated recyclables in a multi-compartment
truck MRF operations RDF preparation and metal recovery Combustion of the RDF Landfilling RDF and MRF rejects Landfilling ash in a monofill
9 Collection and transportation of MSW in a packer truck Collection and transportation of curbside-separated recyclables in a multi-compartment
truck MRF operations and remanufacturing the collected materials RDF preparation and metal recovery Composting of RDF Landfilling RDF, MRF, and compost rejects
1 0 Collection and transportation of MSW i n a packer truck Collection and transportation of curbside-separated recyclables in a multi-compartment
truck Collection and transportation of curbside-separated yard waste in a packer truck MRF operations Yard waste composting Landfilling the remaining MSW
1 1 Collection and transportation of MSW in a packer truck Collection and transportation of curbside-separated recyclables in a multi-compartment
truck Collection and transportation of curbside-separated yard waste in a packer truck MRF operations Yard waste composting Mass burning the remaining MSW Combustion or landfilling the MRF rejects Landfilling the ash in a monofill
33
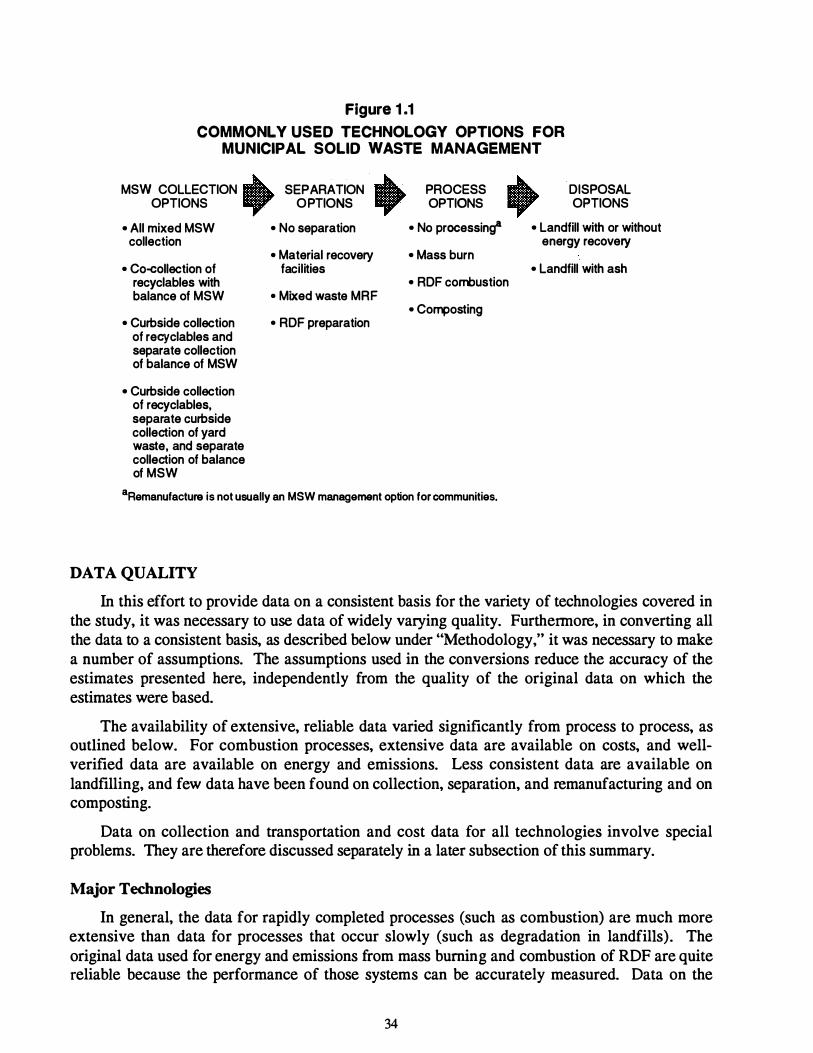
Figure 1 .1 COMMONLY USED TECHNOLOGY OPTIONS FOR
MUNICIPAL SOLID WASTE MANAGEMENT
MSW COLLECTION ... SEPARATION ... PROCESS ... OPTIONS .,. OPTIONS .,. OPTIONS .,. DISPOSAL
OPTIONS • All mixed MSW • No separation • No processing�' • Landfill with or without
collection
• Co-collection of recyclables with balance of MSW
• Curbside collection of recyclables and separate collection of balance of MSW
• Curbside collection of recyclables, separate curbside collection of yard waste, and separate collection of balance of MSW
• Material recovery facilities
• Mixed waste MRF
• RDF preparation
• Mass burn
• RDF combustion
• Composting
8Remanufacture is not usually an MSW management option for communities.
DATA QUALITY
energy recovery
• Landfill with ash
In this effort to provide data on a consistent basis for the variety of technologies covered in the study, it was necessary to use data of widely varying quality. Furthermore, in converting all the data to a consistent basis, as described below under "Methodology," it was necessary to make a number of assumptions. The assumptions used in the conversions reduce the accuracy of the estimates presented here, independently from the quality of the original data on which the estimates were based.
The availability of extensive, reliable data varied significantly from process to process, as outlined below. For combustion processes, extensive data are available on costs, and wellverified data are available on energy and emissions. Less consistent data are available on landfilling, and few data have been found on collection, separation, and remanufacturing and on com posting.
Data on collection and transportation and cost data for all technologies involve special problems. They are therefore discussed separately in a later subsection of this summary.
Major Technologies
In general, the data for rapidly completed processes (such as combustion) are much more extensive than data for processes that occur slowly (such as degradation in landfills). The original data used for energy and emissions from mass burning and combustion of RDF are quite reliable because the performance of those systems can be accurately measured. Data on the
34

slower processes like landfilling are suspect because little reliable information is available on energy use and production and environmental releases generated over long periods.
Among the slower processes, the best data appear to be those on landfill gas generation; however, individual sources report widely varying rates of production from different landfills. The least accurate estimates used in the study are on the amounts and composition of water releases from landfills containing MSW or ash. Some of the data on the composition of the leachate reflect measurements made by researchers following strict quality assurance procedures, and those data seem reliable. However, all the sources report samples taken on a single occasion or over relatively brief periods of time. No studies quantifying water releases over long periods were found, and the method used in this study to extrapolate emissions over 20 years from individual measurements is speculative.
Composting is a relatively slow process. Data on composting are incomplete, and researchers have neither accurately measured composting emissions, as they have for combustion emissions, nor developed sophisticated models, as they have for landfills.
Recycling of MSW through curbside collection of recyclables or separation of mixed. waste is a relatively new and changing approach. Recycling also involves many more processing steps than landfilling or combustion. Collection is a major contributor to the energy and emissions profiles for recycling. The limitations on the collection and transportation data used in this study (as outlined below) strongly affect the quality of the recycling data as well. There is currently no complete or consistent accounting of the amounts of MSW collected for recycling and the amounts actually recycled. The energy and emissions from the recycling (remanufacturing) processes themselves are not well characterized, and they will vary depending on the products made from the recycled material. Published estimates of the energy required for recycling and manufacture from virgin resources appear to be high-quality data, but they reflect processes in use in the mid-1970s. Available data comparing emissions from remanufacturing with those from manufacturing virgin materials are so inadequate that they are not included in the report, although the differences may be significant.
Less Commonly Used Technologies
Two of the less commonly used options-anaerobic digestion and gasification/pyrolysisare not used commercially in the United States. The data on those options presented in the report are therefore based on pilot plants. They do not provide an adequate basis for comparisons with other processes.
The third less commonly used option-cofiring of RDF with coal-is a commercial process, although it is used at only a few facilities. Reliable data on energy production are available for cofiring, but few studies of emissions have been made.
Collection and Transportation
The estimates of amounts of material collected and of energy and emissions for collection and transportation used in this study are based on the experience of a single community. In addition, the data provided by the community were not independently verified. Thus, the collection and transportation data in this report are intended to provide a basis for making order-ofmagnitude estimates of the effects of altering the collection procedures used in a community, and for comparing the sources and magnitudes of emissions from collection with those from process
35
steps. The estimates cannot be expected to be representative of other communities. Data are included on energy required for transportation of collected ferrous metals, aluminum, and glass to the point of remanufacture.
Cost Data
The cost estimates are adequate only for making order-of-magnitude comparisons and identifying trends. Although all the data found in the literature were updated to a single year using an appropriate inflation index, many other factors, such as the impact of different technologies, make direct comparisons impossible. Differing accounting systems also make comparative costs difficult to determine. Better estimates of relative capital and operating costs could be developed by designing reference plants for each technology and estimating the costs of those plants on a consistent basis.
CONTENTS AND ORGANIZATION OF THE REPORT AND APPENDIXES
The results of the study are reported in an executive summary, this data summary (Volume I), the associated exhibits (Volume II), and eight appendixes. The contents of. these volumes are outlined below.
The executive summary briefly reviews the data on energy, emissions, and costs for the MSW technologies considered in this study. It focuses on issues that might be of interest to the general public.
This volume summarizes the results of the study in greater depth. Section 2 provides a broad overview of energy considerations for the commonly used MSW technologies and selected integrated strategies. Energy balances are provided for collection/transportation, as well as for each major technology.
Section 3 provides a similar overview of environmental releases from the more commonly used MSW technologies, as well as releases from transportation and collection of waste. The section covers air emissions, water emissions, and land area requirements for waste or residues destined for landfilling with gas recovery, mass burning, preparation and combustion of RDF, materials collection/separation, and composting. Environmental releases from remanufacturing are covered separately in this section. The section also summarizes environmental releases for some of the more common integrated strategies (e.g., curbside separation with recyclables sent to MRFs, plus mass burning of the remaining waste and landfilling of the ash).
Section 4 summarizes the data sources used in the report and describes the approach used in converting the available data to a consistent basis. It also describes the information included in the computerized data base that was developed as part of this project.
Sections 5 through 8 provide more detailed descriptions of the five major MSW management technologies: landfilling; mass burning; RDF preparation and combustion; separation and processing in an MRF and recycling; and composting. (Because of the many similarities between mass burning and RDF preparation/combustion, particularly in terms of the regulations that govern municipal waste combustion, these two technologies are covered in the same section, entitled "Combustion.") These sections summarize the current state of the technology, describe typical processes, and cover commercial status. They also provide critical data related to energy requirements and production, environmental releases, and capital and operating costs. Each sec-
36
tion also presents an analysis of one integrated waste management stra:tegy that includes the technology covered in the section, and lists other important integrated strategies that are covered in the data base. Each section concludes by itemizing gaps in the data and technical problems that may limit the adoption of the technology.
Section 9 provides similar information for the three less commonly used MSW management technologies: anaerobic digestion, cofiring of RDF with coal, and gasification/pyrolysis. To the extent that data are available, the section reviews technical status, commercial history, energy balances, environmental releases, costs, and data gaps for these technologies.
Section 10 summarizes important missing data for all the technologies and integrated strategies covered in the report. The section identifies instances in which the available data are insufficient to permit quantitative evaluations, at the system level, of the energy, emissions, and costs for the various technologies. Problems with individual technologies that prevent broader use of them are also discussed at the system level.
Section 1 1 lists all references cited in the body of this report. References found in Section 1 1 are cited in text by author's name and date-e.g., (Smith, 199 1).
Section 12 is a glossary. In addition to defining the abbreviations used here, the glossary includes a table of conversion factors for units of measure.
:;L;),�: Exhibits ,J through VII in Volume II provide more detailed data about some of the issues
covered in the data summary and describe the assumptions on which calculations are based. The exhibit volume also includes a printed version of the data base described previously.
Eight appendix volumes (totaling more than 600 pages) provide detailed technology descriptions, data on existing commercial operations, and detailed technical and cost data for the waste management technologies covered in this study. References for the data sources are cited in the respective appendixes. A ninth appendix provides a list of references for all eight appendixes organized alphabetically, and a tenth lists the references in numerical order.
In addition to citations of references provided in Section 1 1 , both this data summary volume and the exhibits cite the detailed descriptions found in the appendixes. Those citations take the form: "see Appendix A." Some references given in the collective bibliography for the appendixes are also cited in this data summary volume; those citations take the form: [667]. The following list summarizes the citations:
• If the citation has the form (Smith, 199 1), the reference will be found in Section 1 1 .
• If the text says (see Appendix A, B ... ), more detailed information on the topic will be found in the separate volume entitled "Appendix A" or B, and so on.
• If the citation is a number in brackets (e.g., [667]), the reference will be found in Appendix J.
37

2. ENERGY CONSIDERATIONS
This section summarizes the results of a life-cycle analysis of energy conducted for the integrated strategies that include each of the five major MSW management technologies discussed in Sections 5 through 9. The objective of the analysis was to determine the energy needed for each major strategy and the energy that is produced by the strategy, if any. The reasons for choosing particular values and appropriate ranges, as well as judgments about the soundness of the data for each strategy, are discussed in those sections and are not repeated here.
BASES FOR COMPARISONS
For analysis of energy balances, the MSW management strategies can be divided into two or three steps. The first is collection, which can include a single collection of MSW, or separate collection of recyclables, or separate collections of both recyclables and yard waste, followed by transportation to the next step. The next step is either landfilling or processing, which might include any of the major or less common technologies included in this report. The last stage is disposal of the residues, usually in a landfill. Energy is always needed for collection (e.g., to pick up the MSW) and transportation, and additional energy is always required for disposal as well as processing (in a landfill, a materials recovery facility, or a combustion plant). The analyses of the integrated strategies presented in Sections 5 through 8 break down energy balances for the individual steps, to indicate the approximate amount required for each one. In this section, however, energy balances are provided for each complete strategy.
The data for each technology and strategy are reported on the basis of one (1) ton of MSW, set out for collection. If recyclable materials were separated before curbside collection, the data are reported in proportion to the percentage of the original ton of unseparated MSW that was separated.
The time frame covered by the comparisons is 20 years. That unusually long period was chosen to permit comparisons of energy recovery from landfill gas collection with that for combustion of MSW in a waste-to-energy facility. Gas forms very slowly in a landfill, and choosing a shorter time frame for the analysis would underestimate the amount of energy that might be recovered from the waste. A period longer than 20 years was not considered because gas production in landfill-gas-to-energy operations may fall to an uneconomic level within that time, and current commercial practice is to close the energy recovery operations when they have operated for 20 years or less (CEC, 1991). The use of a 20-year period underestimates gas production and may underestimate landfill gas recovery, but the available published data are inadequate for extrapolating beyond that time period.
Gas recovery for energy production is not widely practiced. Fewer than 160 of the nation's approximately 6,000 landfills have such facilities. However, gas recovery is a commercially viable, beneficial option that is used as a benchmark for comparison with other technologies.
The elements of transportation considered in this report include the various collection steps (i.e. , energy required for collection of MSW in a packer truck and separate curbside collection of
39
recyclables or yard waste, if included in the integrated strategy), as well as transportation to a processing plant or landfill. The details of the assumptions about distances, truck loadings, and energy requirements for transportation are explained in the data base in Exhibit II. Users of the electronic data base can vary these assumptions to fit local conditions, if they so desire.
Transportation of recyclable materials, such as glass and metals, from an MRF to another facility for remanufacture was included in the study and is covered in this report, but the results of the analysis have been excluded from the electronic data base. Energy requirements for trips to remanufacturing facilities are not provided in the data base because the amounts involved are relatively small compared to the energy requirements for remanufacturing (see Table 7.2 in Section 7). Energy requirements for transportation of waste paper may be significant, however.
Energy savings from remanufacturing curbside-collected glass, metal, and paper are included in the data base. Those estimates are also provided in the summary figures below.
Energy consumed in transportation is reported as fuel consumed. Conversion and transportation to the point of use consume about 19% of the Btu content of crude oil converted to gasoline, or about 1 1 % for diesel fuel (DeLuchi, 199 1). This factor is not considered in the analysis.
ENERGY REQUIREMENTS FOR INDIVIDUAL TECHNOLOGIES
Table 2 . 1 summarizes the types of energy required and recovered or saved by the major MSW management technologies. Elements of the energy balance that are excluded from this analysis are also listed. Energy requirements for collection and for disposal (if relevant) are combined under the heading, ''Transportation."
NET ENERGY BALANCES FOR SELECTED STRATEGIES
Calculating the balance of energy used and energy saved is straightforward for some of the strategies, particularly those that are energy producers, such as municipal waste combustion. Calculating the energy balance becomes complex when the secondary effects of energy recovery by recycling are included; however, this study does analyze primary energy use and recovery achieved by the MSW management strategies that include recycling.
Table 2.2 shows overall energy comparisons for the major MSW management strategies. Figure 2. 1 shows the relationships for the 1 1 common strategies in graphical form. The electronic data base prepared for this study allows users to estimate energy balances for integrated strategies consisting of any combination of the waste management technologies covered in this report (see Section 4).
When an integrated MSW management strategy generates fuel energy in excess of the amount that the entire strategy requires, the energy is reported as a net Btu savings. Usually the excess energy (which is referred to as "exported energy .. ) is generated and sold as electricity, and it therefore displaces the need to generate the same amount of electricity from a virgin fuel or other sources. Energy saved by recycling is not necessarily in the form of electricity. As a result, the comparisons in this subsection are expressed in Btu, with electricity use converted on the basis of 10,000 British thermal units (Btu) per kilowatt-hour (kWh).
40
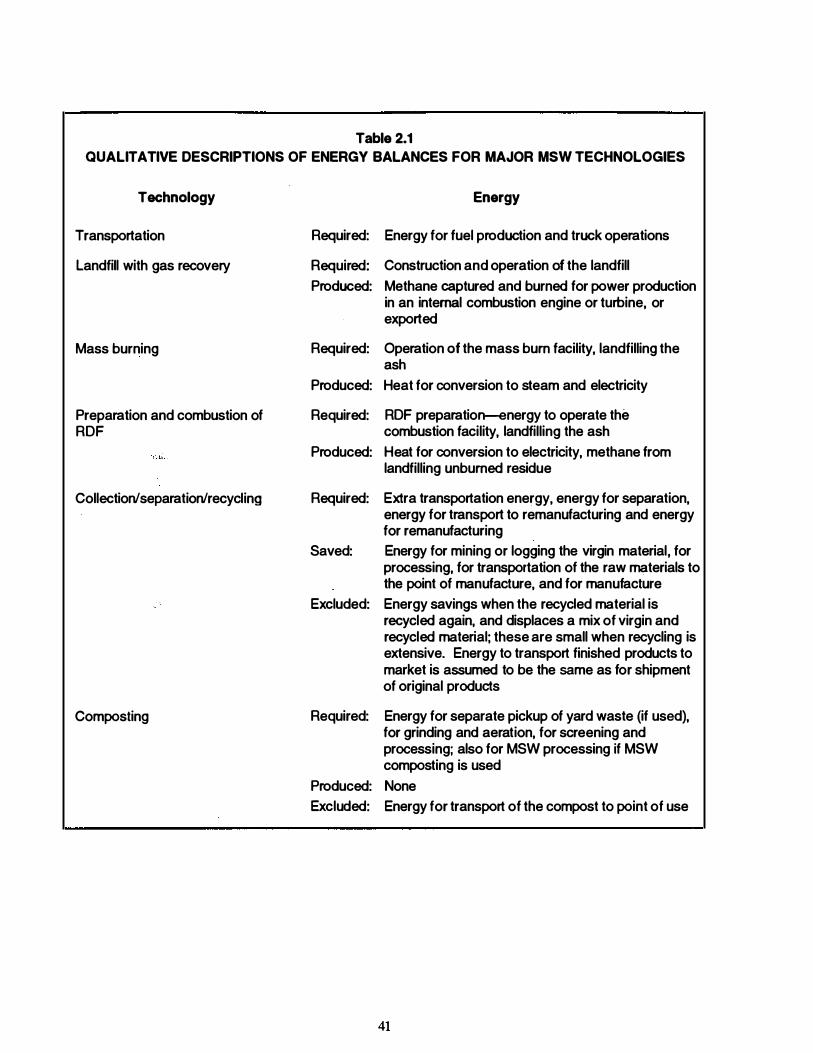
Table 2.1 QUALITATIVE DESCRIPTIONS OF ENERGY BALANCES FOR MAJOR MSW TECHNOLOGIES
Technology
Transportation
Landfill with gas recovery
Mass burning
Preparation and combustion of RDF
Collection/separation/recycling
Composting
Energy
Required: Energy for fuel production and truck operations
Required: Construction and operation of the landfill Produced: Methane captured and burned for power production
in an internal combustion engine or turbine, or exported
Required: Operation of the mass burn facility, landfilling the ash
Produced: Heat for conversion to steam and electricity
Required: RDF preparation-energy to operate the combustion facility, landfilling the ash
Produced: Heat for conversion to electricity, methane from landfilling unburned residue
Required: Extra transportation energy, energy for separation, energy for transport to remanufacturing and energy for remanufacturing
Saved: Energy for mining or logging the virgin material, for processing, for transportation of the raw materials to the point of manufacture, and for manufacture
Excluded: Energy savings when the recycled material is recycled again, and displaces a mix of virgin and recycled material; these are small when recycling is extensive. Energy to transport finished products to market is assumed to be the same as for shipment of original products
Required: Energy for separate pickup of yard waste (if used), for grinding and aeration, for screening and processing; also for MSW processing if MSW composting is used
Produced: None Excluded: Energy for transport of the compost to point of use
41
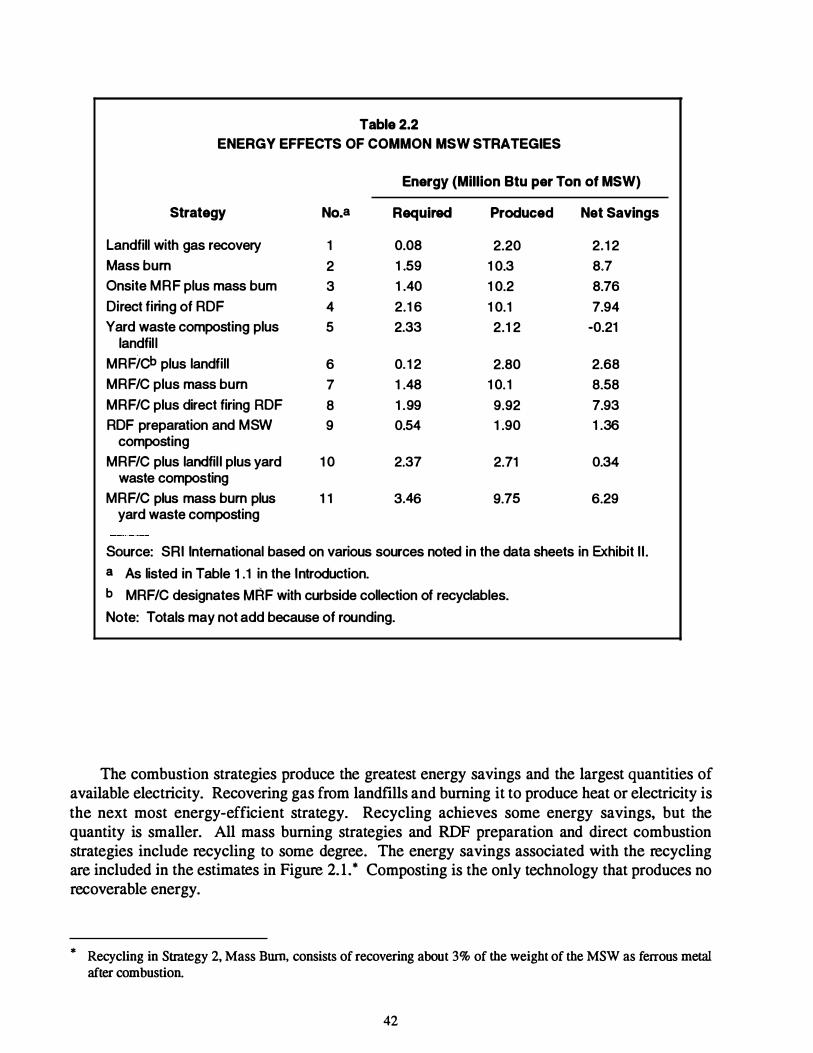
Table 2.2 ENERGY EFFECTS OF COMMON MSW STRATEGIES
Energy (Million Btu per Ton of MSW)
Strategy No.a Required Produced Net Savings
Landfill with gas recovery 1 0.08 2.20 2.1 2 Mass bum 2 1 .59 1 0.3 8.1 Onsite MRF plus mass bum 3 1 .40 1 0.2 8.16 Direct firing of RDF 4 2.1 6 1 0.1 7.94 Yard waste composting plus 5 2.33 2.1 2 -0.21
landfil l MRF/Cb plus landfill 6 0.1 2 2.80 2.68 MRF/C plus mass bum 1 1 .48 1 0.1 8.58 MRF/C plus direct firing RDF 8 1 .99 9.92 7.93 RDF preparation and MSW 9 0.54 1 .90 1 .36
composting MRF/C plus landfil l plus yard 1 0 2.37 2.71 0.34
waste composting MRF/C plus mass bum plus 1 1 3.46 9.75 6.29
yard waste composting
Source: SRI Intemational based on various sources noted in the data sheets in Exhibit I I . a As listed in Table 1 .1 in the Introduction. b MRF/C designates MRF with curbside collection of recyclables.
Note: Totals may not add because of rounding.
The combustion strategies produce the greatest energy savings and the largest quantities of available electricity. Recovering gas from landfills and burning it to produce heat or electricity is the next most energy-efficient strategy. Recycling achieves some energy savings, but the quantity is smaller. All mass burning strategies and RDF preparation and direct combustion strategies include recycling to some degree. The energy savings associated with the recycling are included in the estimates in Figure 2. 1 . * Com posting is the only technology that produces no recoverable energy.
* Recycling in Strategy 2, Mass Burn, consists of recovering about 3% of the weight of the MSW as ferrous metal after combustion.
42

1 2
1 0 3: en � c: 0 � 8 m c: � ·e
6 >-(!' a: w z w 4
- 1
Figure 2.1 ENERGY ANALYSIS FOR STRATEGIES BASED ON THE FIVE MAJOR OPTIONS
(PER TON OF MSW)
KEY: 1 = Landfill with Gas Recovery 2 = Mass Burn 3 = On-Site MRF + Mass Bum 4 = RDF for Direct Firing 5 = Yard Waste Composting + Landfill 6 = Curbside MRF + Landfill 7 = Curbside MRF + Mass Bum 8 = Curbside MRF + RDF for Direct Firing 9 = Curbside MRF + RDF for Composting
1 0 = Curbside MRF + Landfill + Yard Waste Composting
II Energy Required 1§1 Energy Produced lmJ Net Available Energy
1 1 = Curbside MRF + Mass Bum + Yard Waste Composting
1 2 3 4 5 6 7 STRATEGIES
43
8 9 1 0 1 1

Some of the results in Table 2.2 appear unlikely at first glance. In strategies that include two technologies, mass burning and RDF direct firing, the net energy produced is lower when curbside recycling is included. In contrast, adding curbside recycling to landfilling results in a higher energy saving than landfilling alone. The reason is that the Btu value of newsprint is about twice the energy saved by recycling the newsprint. The landfill is inefficient at recovering the energy in the discarded paper, and recycling therefore produces a larger energy savings. In a combustor, the energy released from burning the paper is greater than the energy saved by recycling the paper; therefore, removing the paper leads to a net decrease in energy produced (see Section 7 and Exhibit Vll). The extra energy recovered from burning the paper even exceeds the total energy saved by recycling the aluminum, glass, and steel, as well as the paper.
Although energy production is not the primary goal of any MSW management strategy, the opportunity to recovery materials and energy is an added benefit. Recovering energy from MSW eliminates the need for some other fuel. Because about 55% of the electricity produced in the United States comes from burning coal (DOE, 1992), that is the fuel that is most likely to be displaced by energy generated from MSW.
Figure 2.2 shows the quantities of electrical energy that could be produced from those strategies that generate a fuel or bum MSW in an electrical generating facility. It compares only the portions of the strategies that involve conversion to heat; energy saved by recycling is excluded (although it is included in the energy balances in Table 2.2), as is energy for collection and transportation. The comparison is based on net kilowatt-hours of electricity generated by each method.
Strategies can be net energy consumers, yet still generate electricity. For example, one strategy includes composting MSW, yet the figure shows that energy is generated. Normal aerobic com posting consumes energy for shredding or grinding, aeration, turning, screening, and so on. Com posting itself produces no recoverable energy, and the entire strategy produces no net energy. However, about one-half of the organics in the MSW are removed before composting and are landfilled. The organics that were not composted produce part of the methane collected from the landfill. Figure 2.2 therefore shows that the strategy generates electrical power. For curbside collection of yard waste for composting, a larger amount of MSW goes to the landfill and generates more methane.
44
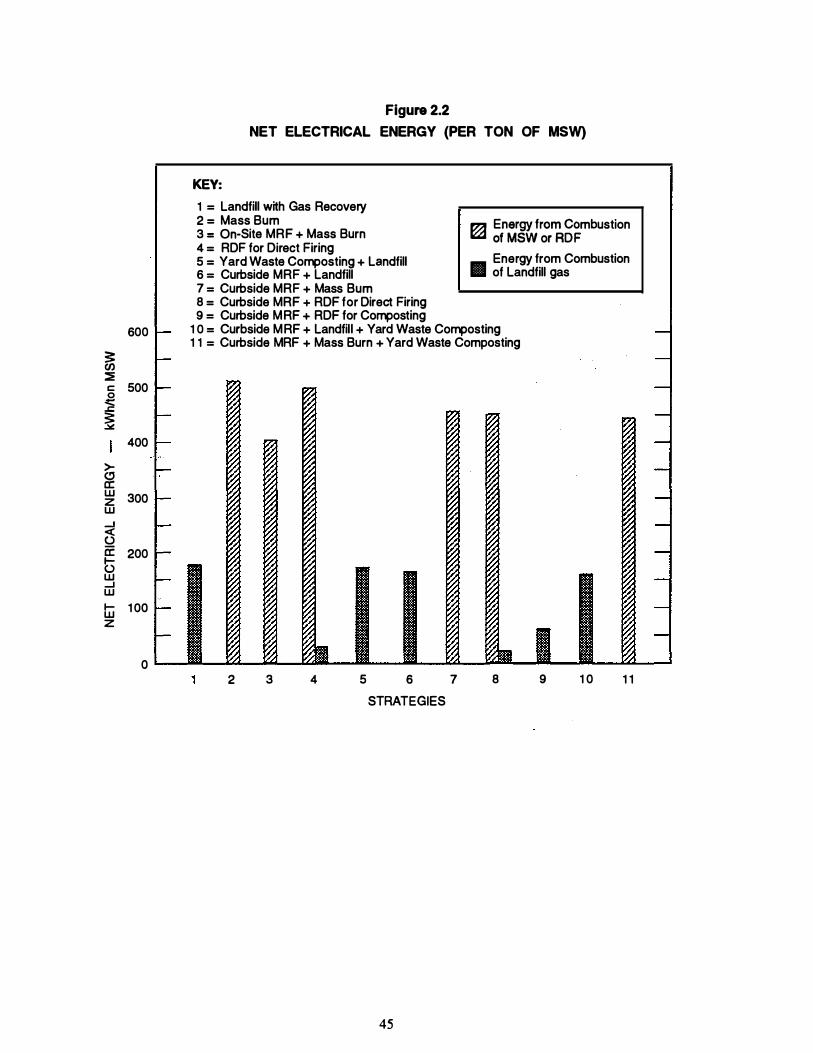
Figure 2.2 NET ELECTRICAL ENERGY (PER TON OF MSW)
KEY:
1 = Landfill with Gas Recovery 2 = Mass Bum E f c b · 3 = On-Site MRF + Mass Burn � 0f�rWw :�
D�m ustlon
4 = RDF for Direct Firing 5 = Yard Waste Composting + Landfill Ill Energy from Combustion 6 = Curbside MRF + Landfill of Landfill gas 7 = Curbside MRF + Mass Bum 8 = Curbside MRF + RDF for Direct Firing 9 = Curbside MRF + RDF for Composting
600 1 0 = Curbside MRF + Landfill + Yard Waste Composting
� :::E c: 500 0 -t:::
� 400
>-CJ a: w 300 z w --' <( (.) 0: 200 t5 w --' w I- 1 00 w z
0
1 1 = Curbside MRF + Mass Burn + Yard Waste Composting
2 3 4 5 6 7 STRATEGIES
45
8 9 1 0 1 1

3. ENVIRONMENTAL RELEASES
This section summarizes the results of a life-cycle analysis of the environmental releases from the major integrated strategies that include each of the five major MSW management technologies discussed in Sections 5 through 8. The reasons for choosing particular values and appropriate ranges, as well as judgments about the soundness of the data for each strategy, are discussed in those sections and are not repeated here.
The single values that have been derived for this study do not provide an adequate basis for making fine distinctions between technologies. Every technology has a range of performance values that vary with the plant design, operations, and maintenance, and with the nature of the MSW, as reported in Sections 5 through 8. However, the large-scale differences between some technologies and strategies in these estimates can be used for making comparisons.
BASES FOR COMPARISONS
For consideration of environmental releases, MSW management can be divided into several steps. The first is collection, which can include a single collection of MSW, or separate collection of recyclables, or separate collections of both recyclables and yard waste. The next stage is processing, which might include any of the major or less · common technologies included in this report. The last stage is disposal of the residues, usually in a landfill. Emissions always result from collection (e.g . • to pick up the MSW), and additional emissions may result from disposal as well as processing (in a landfill, a materials recycling facility, or a combustion plant). The analyses of the integrated strategies presented in Sections 5 through 8 break down emissions for the individual steps, to indicate the approximate percentage required for each one. In this section, however, energy balances are provided for the strategies as a whole.
The data for each technology and strategy are reported on the basis of one ( 1) ton of MSW set out for collection. If recyclable materials were separated before curbside collection, the data are reported in proportion to the percentage of the original ton of unseparated MSW that was separated.
The time frame chosen for the comparisons is 20 years. As described in Section 2, that unusually long period was selected to permit comparisons of energy recovery from landfill gas collection with that for combustion of MSW in a waste-to-energy facility. For consistency, it is necessary to use 20 years as the period for considering all other emissions, although emissions are released at different rates, depending on the technology. Combustion releases particulates and gases as soon as the MSW is burned. Landfilling, on the other hand, can release gases for many years, and leachate perhaps for centuries (FR, 199 1i). Data on releases from sanitary landfills over centuries cannot be obtained because widespread use of these types of landfills did not begin until the 1970s (see Appendix F). The emission rate drops significantly, however, after the first 8-40 years (Augenstein and Pacey, 1991). Because the emissions generally appear to diminish to a low and steady rate within 20 years, monitoring releases over a longer period would be unlikely to affect the estimates presented here by more than a factor of two to five;
47
given the small quantities involved, even a fivefold increase would have a minor effect in absolute terms.
·
The elements of transportation considered in this report include the various collection steps (i.e., for collection of MSW in a packer truck and separate curbside collection of recyclables or yard waste, if included in the integrated strategy), as well as transportation to a processing plant or landfill. The details of the assumptions about distances and emissions from transportation are explained in the data base in Exhibit II. Users of the electronic data base can vary these assumptions to fit local conditions, if they so desire.
Transportation of recyclable materials, such as glass and metals, from an MRF to another facility for remanufacture is excluded. Emissions for those trips are not provided in the data base because the releases involved are relatively small (see Section 7).
EMISSIONS FROM MAJOR INDIVIDUAL TECHNOLOGIES
The emissions from each technology differ in type, as shown in Table 3. 1 . Emissions that have not been quantified for this analysis are also listed. Emissions for collection and disposal operations, such as loaders, are combined under the heading, "Transportation."
EMISSIONS FROM INTEGRA TED MSW STRATEGIES
Although emissions for individual technologies were quantified during this study, data on an isolated technology are not helpful for estimating environmental releases for MSW management in a community. The emissions from any single technology depend on how extensively and how efficiently it is used, and on the nature of any other technologies that are used in conjunction with the first technology. For example, it is not reasonable to look only at the emissions from a material recovery facility (MRF) for separating curbside-collected recyclables without also considering the emissions from the separate collection of those recyclables compared to emissions for collecting all the MSW in one truck. Thus, emissions comparisons should only be performed in the context of an integrated MSW management strategy. In the data base in Exhibit II and the tables of emissions presented in this section, the basis weight for each technology differs, and useful comparisons can only be made for entire strategies.
This section describes emissions for the 1 1 major integrated MSW management strategies for which energy balances were shown in Table 2.2. The electronic data base prepared for this study allows users to estimate energy balances for integrated strategies consisting of any combination of the waste management technologies covered in this report (see Section 4). However, the emissions data available for the less commonly used technologies are so sparse that the results of comparisons of strategies that include those technologies would be highly unreliable. Therefore, coverage of those strategies is excluded from this section.
Air Emissions
Air emissions for an MSW management strategy arise from many sources. The types and amounts of these emissions vary widely, as shown in Table 3.2. The rates of release also vary substantially for different strategies. Transportation releases occur only while the MSW or recyclables are in transit; combustion and MRF processing and recycling also release emissions quickly. Composting and landfilling release emissions for periods ranging from months to the full 20 years covered in this analysis (or more for landfilling).
48
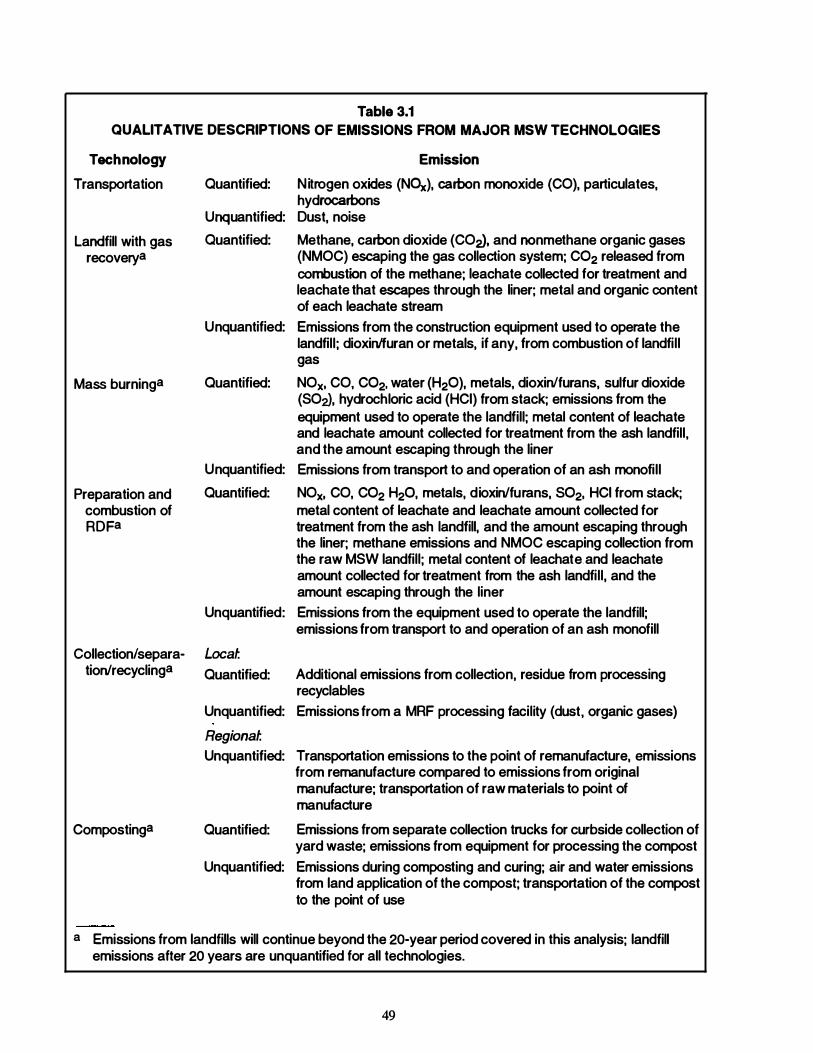
Table 3.1 QUALITATIVE DESCRIPTIONS OF EMISSIONS FROM MAJOR MSW TECHNOLOGIES
Technology
Transportation
Landfill with gas recovery a
Mass burninga
Preparation and combustion of ROFa
Emission
Quantified: Nitrogen oxides (NOx), carbon monoxide (CO), particulates, hydrocarbons
Unquantified: Dust, noise
Quantified: Methane, carbon dioxide (COv. and nonmethane organic gases (NMOC) escaping the gas collection system; C02 released from combustion of the methane; leachate collected for treatment and leachate that escapes through the liner; metal and organic content of each leachate stream
Unquantified: Emissions from the construction equipment used to operate the landfill; dioxinlfuran or metals, if any, from combustion of landfill gas
Quantified: NOx, CO, C02, water (H20), metals, dioxin/furans, sulfur dioxide (SOv. hydrochloric acid (HCI) from stack; emissions from the equipment used to operate the landfill; metal content of leachate and leachate amount collected for treatment from the ash landfill, and the amount escaping through the liner
Unquantified: Emissions from transport to and operation of an ash monofill
Quantified: NOx. CO, C02 H20, metals, dioxinlfurans, 502, HCI from stack; metal content of leachate and leachate amount collected for treatment from the ash landfill, and the amount escaping through the liner; methane emissions and NMOC escaping collection from the raw MSW landfill; metal content of leachate.and leachate amount collected for treatment from the ash landfill, and the amount escaping through the liner
Unquantified: Emissions from the equipment used to operate the landfill; emissions from transport to and operation of an ash monofill
Collection/separa- Locaf. tionlrecyclinga Quantified: Additional emissions from collection, residue from processing
recyclables
Compostinga
Unquantified: Emissions from a MRF processing facility (dust, organic gases)
Regionaf. Unquantified: Transportation emissions to the point of remanufacture, emissions
from remanufacture compared to emissions from original manufacture; transportation of raw materials to point of manufacture
Quantified: Emissions from separate collection trucks for curbside collection of yard waste; emissions from equipment for processing the compost
Unquantified: Emissions during composting and curing; air and water emissions from land application of the compost; transportation of the compost to the point of use
a Emissions from landfills will continue beyond the 20-year period covered in this analysis; landfill emissions after 20 years are unquantified for all technologies.
49
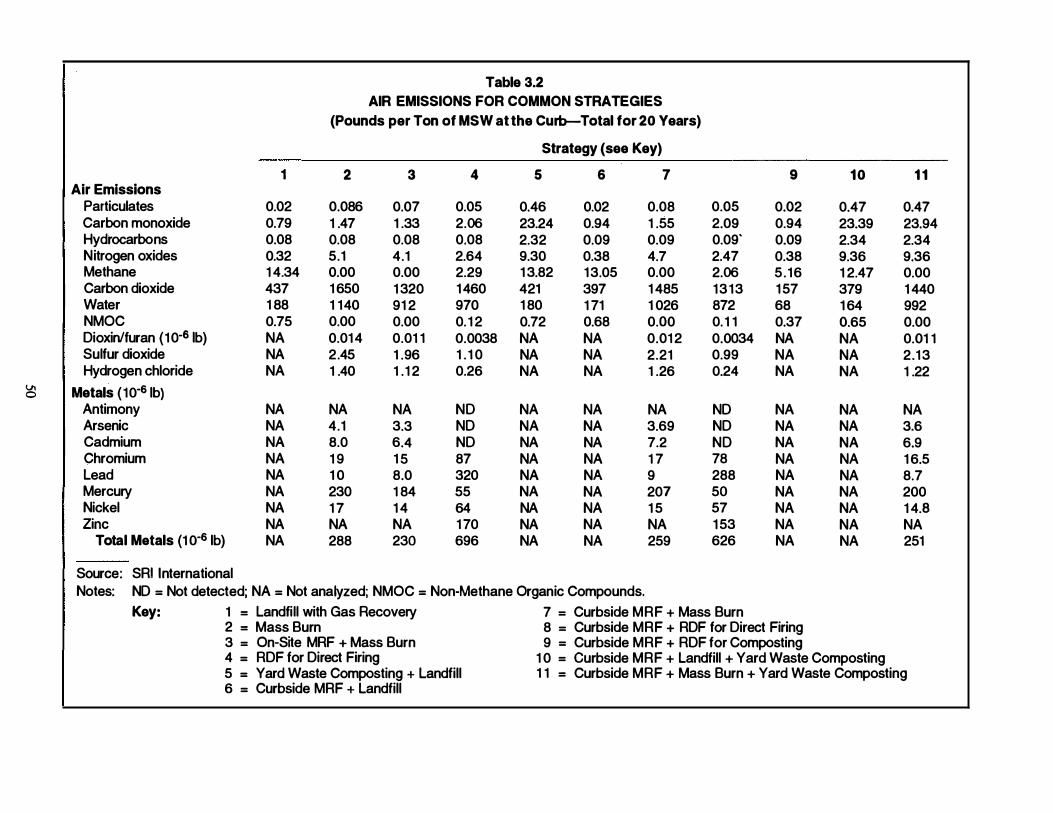
Table 3.2 AIR EMISSIONS FOR COMMON STRATEGIES
(Pounds per Ton of MSW at the Curb-Total for 20 Years)
Strategy (see Key)
1 2 3 4 5 6 7 8 9 10 1 1 Air Emissions
Particulates 0.02 0.086 0.07 0.05 0.46 0.02 0.08 0.05 0.02 0.47 0.47 Carbon monoxide 0.79 1 .47 1 .33 2.06 23.24 0.94 1 .55 2.09 0.94 23.39 23.94 Hydrocarbons 0.08 0.08 0.08 0.08 2.32 0.09 0.09 0.09' 0.09 2.34 2.34 Nitrogen oxides 0.32 5.1 4.1 2.64 9.30 0.38 4.7 2.47 0.38 9.36 9.36 Methane 1 4.34 0.00 0.00 2.29 1 3.82 13.05 0.00 2.06 5.16 1 2.47 0.00 Carbon dioxide 437 1 650 1 320 1460 421 397 1 485 1313 1 57 379 1 440 Water 1 88 1 140 91 2 970 1 80 1 71 1 026 872 68 1 64 992 NMOC 0.75 0.00 0.00 0. 1 2 0.72 0.68 0.00 0. 1 1 0.37 0.65 0.00 Dioxin/furan (10-6 1b) NA 0.014 0.01 1 0.0038 NA NA 0.01 2 0.0034 NA NA 0.01 1 Sulfur dioxide NA 2.45 1 .96 1 . 1 0 NA NA 2.21 0.99 NA NA 2.13 Hydrogen chloride NA 1 .40 1 .1 2 0.26 NA NA 1 .26 0.24 NA NA 1 .22
v. I Metals (1o-s lb) 0 Antimony NA NA NA NO NA NA NA NO NA NA NA Arsenic NA 4.1 3.3 NO NA NA 3.69 NO NA NA 3.6 Cadmium NA 8.0 6.4 NO NA NA 7.2 NO NA NA 6.9 Chromium NA 1 9 1 5 87 NA NA 1 7 78 NA NA 1 6.5 Lead NA 1 0 8.0 320 NA NA 9 288 NA NA 8.7 Mercury NA 230 1 84 55 NA NA 207 50 NA NA 200 Nickel NA 1 7 1 4 64 NA NA 1 5 57 NA NA 1 4.8 Zinc NA NA NA 1 70 NA NA NA 1 53 NA NA NA
Total Metals (1 o-s lb) NA 288 230 696 NA NA 259 626 NA NA 251
Source: SRI International Notes: NO = Not detected; NA = Not analyzed; NMOC = Non-Methane Organic Compounds.
Key: 1 = Landfill with Gas Recovery 7 = Curbside MRF + Mass Burn 2 = Mass Burn 8 = Curbside MRF + RDF for Direct Firing 3 = On-S�e MRF + Mass Burn 9 = Curbside MRF + RDF for Composting 4 = RDF for Direct Firing 1 0 = Curbside MRF + Landfill + Yard Waste Composting 5 = Yard Waste Composting + Landfill 1 1 = Curbside MRF + Mass Burn + Yard Waste Composting 6 = Curbside MRF + Landfill
In general, strategies that handle the largest percentage of the waste by landfilling release the largest quantities of organic gases to the air; those emissions consist mainly of methane, with about 2% of the methane by volume as other organics, including halogenated organics (FR, 199 1b), and accompanying C02 (O'Leary and Walsh, 1991). Landfilling and other organic processes (composting, anaerobic digestion) release extremely small quantities of metals, if any.
In contrast, strategies that make the greatest use of combustion release the largest quantities of C<h and metals to the air. Combustion emissions include almost no organics, but extremely small quantities of dioxins and furans are emitted (as shown in Table 3.2).
Collection and Transportation
MSW management includes curbside collection of the waste, transportation of the waste to a landfill or a processing facility (e.g., a combustor or a materials recovery facility), and possibly transportation of the residue from processing to a landfill. Although many models of collection and transportation requirements for various types of collection programs have been developed, it proved difficult to find actual data on energy and emissions for these steps. Accordingly, this study used data on transportation energy requirements supplied by one community. The city had operated a curbside collection program for recyclables for many years, and it initiated a program for curbside collection of yard waste about a year before this study began. It is not necessarily typical of otli�r communities.
The community supplied data on actual tonnages collected by each truck in each of the three separate collection programs; the number of trucks operated and the number of miles traveled by each truck; and the fuel consumption on each route. Fuel use per ton of material picked up on each route was lowest for collecting household and commercial MSW. About 2.5 times more fuel was used to pick up a ton of separated recyclables, and about 600 times more fuel was used to collect a ton of yard waste (because of the small quantities collected on each route in that program).
To develop the estimates presented in this summary, these fuel use rates were converted to energy use per ton of MSW at the curb, and then apportioned according to the amounts set out. The energy and emissions results are extremely sensitive to the amount collected by each truck. Therefore, energy use per ton of material collected increases as additional curbside collection programs are implemented.
No direct emission measurements for MSW collection or curbside collection vehicles have been made during actual operation. Emissions from collection and transportation were therefore estimated on the basis of the actual fuel use by assuming that the emissions per unit of fuel met the maximum permissible emission limits for heavy-duty diesel truck engines operating according to a specified EPA procedure that simulates freeway and city driving. When these engine limits have been compared to actual emissions from vehicles under the same load and speed conditions, the results vary by 20-50% for emissions of different types; for example, the operating vehicles emit larger quantities of hydrocarbons and particulates, but smaller amounts of nitrogen oxides and carbon monoxide than the tested engines. The duty cycle of the MSW packer trucks in these tests is quite different, in terms of stop-start frequency and compactor operation, from the typical duty cycle for the trucks modeled by the EPA. Therefore, in developing emissions estimates for this study, the emissions limits were increased by a factor of four to provide a better approximation of actual emissions.
51
Water Emissions
Most leachate is formed when rainwater enters a closed landfill. Environmental concerns about landfills include the amount of hazardous material (metals, organics, dioxins, and other .. components of MSW) that is removed from the landfill by leaching, and the fmal destination of the leachate. Table 3.3 shows the effluent estimates for the 1 1 major integrated waste management strategies compared in this section.
Note, however, that this analysis does not cover leachates that might result from the waste from processes that remanufacture paper, metals, and plastics separated from MSW for recycling. Few data were found on those potential emissions.
Most new landfills are capped when they are fllled, and regulations require that all new landfills that receive more than 20 tons per day of MSW have a liner and a leachate collection system, and treat the collected leachate (FR, 1991n). Regulations mandate a collection and treatment period of approximately 30 years, unless the leachate does no harm to human health and the environment. Control can be required for more than 30 years if the leachate is judged a threat to human health and the environment (FR, 1991o). In spite of capping, liners, and leachate collection and treatment, about 25% of the rainwater that falls on a landfill can leak in, and 13% of the amount that enters the landfill can escape the collection system and leak out through the liner (O'Leary and Walsh, 199 1).
Ash from large municipal waste combustors (MWCs) is usually separately landfilled (in areas called "ash monofills"). Because the volume of ash is smaller than that of the original MSW, rain falls on a smaller area in ash monofills, and leachate per ton of MSW is one-eighth to one-tenth as great as leachate from MSW landfills. No data on water that leaks into ash monofills were found; thus, the comparisons in this section are based on the assumption that the percentages of rainwater leaking into and out of a monofill are the same as those for an MSW landfill.
Estimates of both the amounts of metals in the captured leachate and the amounts that escape to the ground under ash monofills are provided in Section 6. Very little organic material remains in the ash after combustion, so organics in leachate from ash monofills are extremely low. About one ten-thousandth of a pound of organics per ton of MSW is leached over the entire 20-year period.* Organics in leachate from an MSW landfill total about 0. 16 pound during that time.t
Because leachate is released continuously over the 20-year period, the concentrations of the metals and organics at any given time are quite low. For example, the concentration of lead in the MSW leachate is 90 �g per liter; lead in leachate from an ash monofill declines to less than 1 �g per liter within 2 years. In comparison, a typical drinking water standard for lead permits about 50 �g per liter (O'Leary and Walsh, 199 1 ; Roffman, 199 1).
* Measured as total organic carbon; estimates were calculated from Roffman (1991). t Measured as chemical oxygen demand.
52
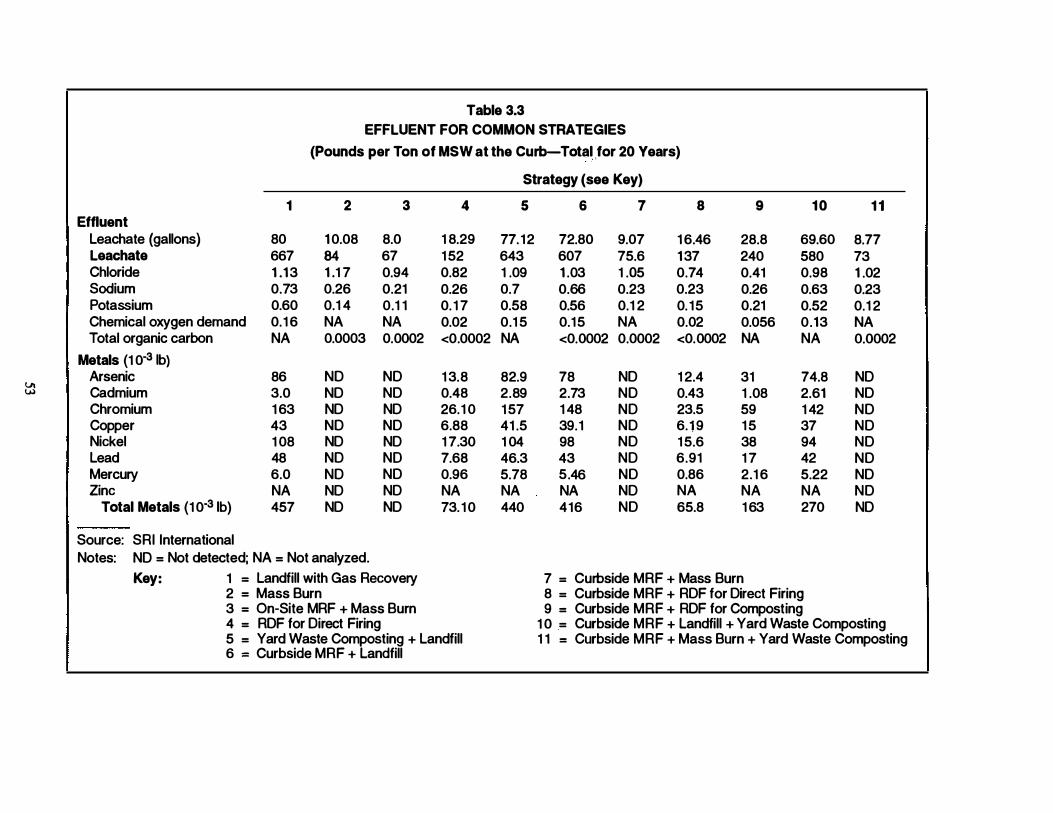
Table 3.3 EFFLUENT FOR COMMON STRATEGIES
(Pounds per Ton of MSW at the Curb-Total ,for 20 Years)
Strategy (see Key)
1 2 3 4 5 6 7 8 9 10 1 1 Effluent
Leachate (gallons) 80 1 0.08 8.0 1 8.29 77. 12 72.80 9.07 1 6.46 28.8 69.60 8.77 Leachate 667 84 67 1 52 643 607 75.6 137 240 580 73 Chloride 1 .13 1 .1 7 0.94 0.82 1 .09 1 .03 1 .05 0.74 0.41 0.98 1 .02 Sodium 0.73 0.26 0.21 0.26 0.7 0.66 0.23 0.23 0.26 0.63 0.23 Potassium 0.60 0.1 4 0.1 1 0. 1 7 0.58 0.56 0.1 2 0. 15 0.21 0.52 0.1 2 Chemical oxygen demand 0.1 6 NA NA 0.02 0.1 5 0.15 NA 0.02 0.056 0.13 NA Total organic carbon NA 0.0003 0.0002 <0.0002 NA <0.0002 0.0002 <0.0002 NA NA 0.0002
Metals (1 o-a lb)
I Arsenic 86 ND ND 1 3.8 82.9 78 ND 1 2.4 31 74.8 ND Vt
Cadmium 3.0 ND ND 0.48 2.89 2.73 ND 0.43 1 .08 2.61 ND w
Chromium 1 63 ND ND 26.1 0 1 57 1 48 ND 23.5 59 1 42 ND Copper 43 ND ND 6.88 41 .5 39.1 ND 6.1 9 1 5 37 ND Nickel 1 08 ND ND 1 7.30 1 04 98 ND 1 5.6 38 94 ND Lead 48 ND ND 7.68 46.3 43 ND 6.91 1 7 42 ND Mercury 6.0 ND ND 0.96 5.78 5.46 ND 0.86 2.1 6 5.22 ND Zinc NA ND ND NA NA NA ND NA NA NA ND
Total Metals (1 o-a lb) 457 ND ND 73. 1 0 440 416 ND 65.8 1 63 270 ND
Source: SRI International Notes: ND = Not detected; NA = Not analyzed.
Key: 1 = Landfill with Gas Recovery 7 = Curbside MRF + Mass Burn 2 = Mass Burn 8 = Curbside MRF + RDF for Direct Firing 3 = On-Site MRF + Mass Burn 9 = Curbside MRF + RDF for Composting 4 = RDF for Direct Firing 1 0 = Curbside MRF + Landfill + Yard Waste Composting 5 = Yard Waste Composting + Landfill 1 1 = Curbside MRF + Mass Burn + Yard Waste Composting 6 = Curbside MRF + Landfill
Landfill Space
The maximum capacity of a landfill is usually determined by volume, not weight. Figure 3. 1 compares landfill volumes required by the 1 1 major MSW management strategies. Figure 3.2 shows the same data in terms of weight (tons of residue to be landfilled for each ton of MSW at the curb processed by the various technologies). The differences among the technologies are less dramatic when they are reported by weight.
In terms of landfill space saved. the various strategies for managing MSW fall into two categories: strategies that involve combustion and those that do not The land area consumed for MSW management is smallest if recoverables are separated, the remaining waste is burned, and the ash from combustion is landfilled; it is largest if all waste is landfilled.
MSW combustion technologies reduce the need for landfill volume by up to 90% (FR, 1991a) because the ash is dense compared to raw or compacted MSW. When separation of metals and glass precedes combustion, the residual volume is further reduced. The combination of mixed waste recycling and mass burning or RDF preparation and combustion requires less landfill space than any other MSW management strategy evaluated in this report. Adding curbside recycling before combustion is almost as effective in reducing landfill space requirements as using mixed waste recycling with combustion of the residue. Some RDF combustion technologies reject material to the landfill before combustion, and those require a larger total landfill volume than is needed when all the MSW is burned.
Collection and separation of recyclables saves about 90% of the landfill space required for the amount collected at the curbside, which currently averages about 16% of the volume of MSW ( 12% by weight) in communities that have successful curbside collection programs and market the separated products; however, landfill or waste disposal space is required for impurities generated during the remanufacturing of the recyclables. An MSW management strategy that involves preparation of RDF and composting of the RDF reduces the volume of landfilled material by 50-60% if the compost can be used (recycled). Even if the compost is landfilled, com posting saves about 15-25% of the landfill space.
The amount of landfill space that can be saved by composting separately collected yard waste is not well known. In the community used as a model for the data on transportation distances and participation rates for composting in this study, separately collected yard waste for com posting had little impact on landfill volume because actual participation rates were low. In general, compacting in a landfill achieves smaller volume reductions for yard waste than for packaging (Franklin Associates 1990a); as a result, the elimination of yard waste from the landfill saves less space than would be expected on the basis of the weight of the yard waste.
54
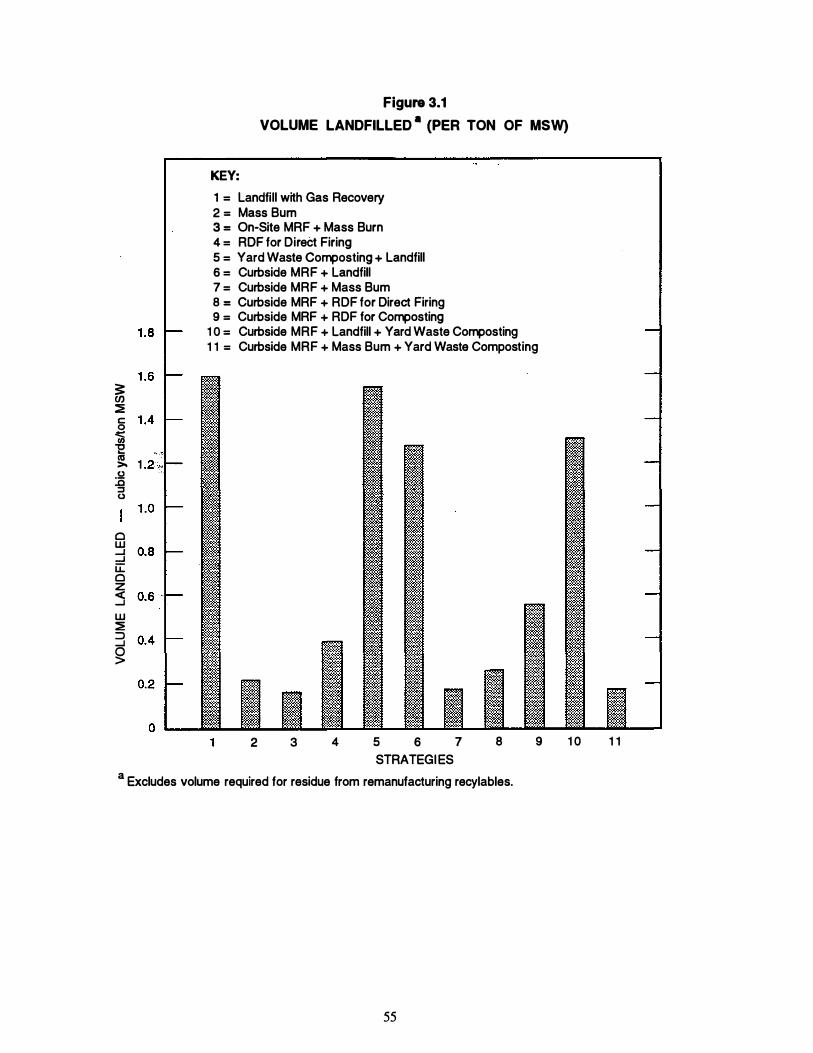
:1: en :::i: c: 0 � "E as 1 >.
.Q ..0 :::1 ()
Cl w ...J ...J u:::: Cl z <( ...J w :::i: :::J ...J �
Figure 3.1
VOLUME LANDFILLED • (PER TON OF MSW)
KEY:
1 = Landfill with Gas Recovery 2 = Mass Bum 3 = On-Site MRF + Mass Burn 4 = RDF for Direct Firing 5 = Yard Waste Composting + Landfill 6 = Curbside MRF + Landfill 7 = Curbside MRF + Mass Bum 8 = Curbside MRF + RDF for Direct Firing 9 = Curbside MRF + RDF for Composting
1 0 = Curbside MRF + Landfill + Yard Waste Composting 1 1 = Curbside MRF + Mass Bum + Yard Waste Composting
2 3 4 5 6 7 STRATEGI ES
8 9
a Excludes volume required for residue from remanufacturing recylables.
55
1 0 1 1
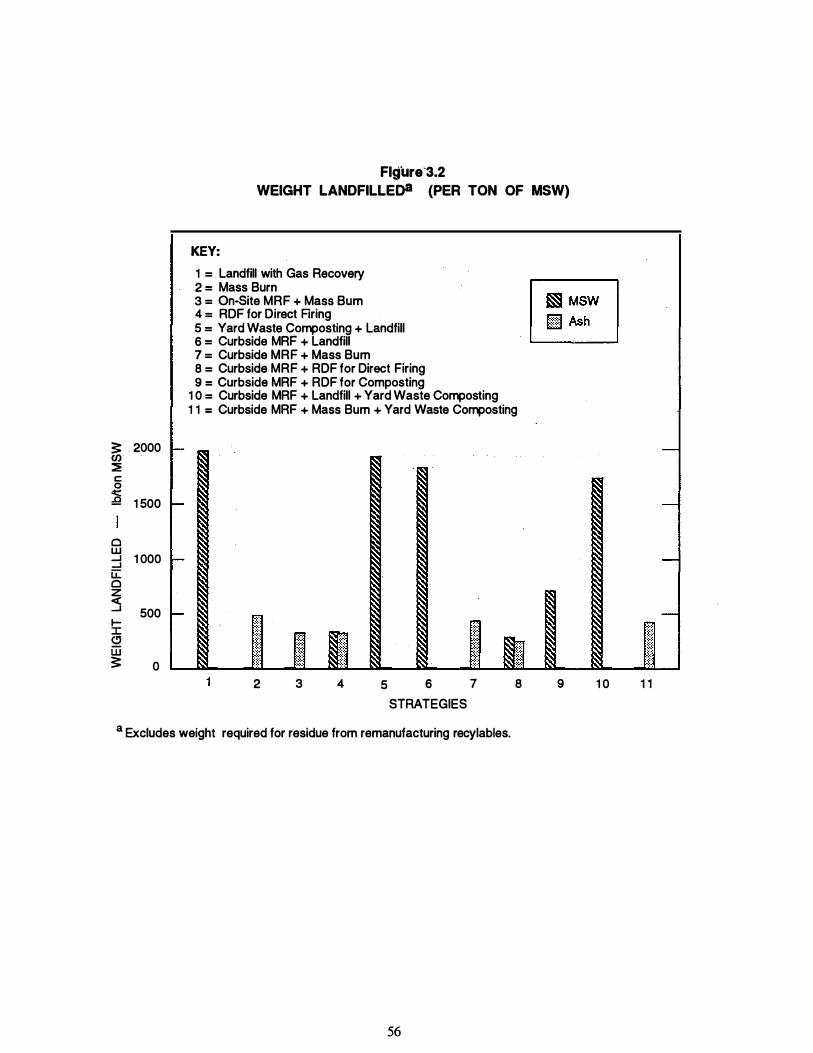
3: 2000 (/) ::::E c: 0 :§ 1 500
Q w ....J 1 000 ....J u::: Q z <( ....J 500 1-:::r: (!) iii 3: 0
Fl!fure·3.2 WEIGHT LANDFILLE08 (PER TON OF MSW)
KEY:
1 = Landfill with Gas Recovery 2 = Mass Burn
� 3 = On-5ite MRF + Mass Bum � MSW 4 = RDF for Direct Rring W Ash 5 = Yard Waste Composting + Landfill � 6 = Curbside MRF + Landfill 7 = Curbside MRF + Mass Bum 8 = Curbside MRF + RDF for Direct Firing 9 = Curbside MRF + RDF for Composting
1 0 = Curbside MRF + Landfill + Yard Waste Composting 1 1 = Curbside MRF + Mass Bum + Yard Waste Composting
2 3 4 5 6 7 8 STRATEGIES
9 1 0
a Excludes weight required for residue from remanufacturing recylables.
56
1 1
4. DATA SOURCES AND DATA BASE
This section describes the data base that has been assembled for this study. It outlines the information the data base contains for the common strategies and the ways in which it can be used. Technical details on operating the data base, understanding the relationships between the worksheets, and changing data base assumptions are presented in the data base user guide in Exhibit IT. The data base was constructed in Lotus 1-2-3, and an electronic version is available that can be customized to suit local conditions or to incorporate different data or assumptions. Exhibit IT also provides a copy of the structure and contents of the data base. The information on the less common strategies that is included in the data base is discussed in Chapter 9.
PURPOSE OF THE DATA BASE
The data base provides quantitative data on the energy and emissions from the individual solid waste management technologies covered in this report; it also offers the option of determining the total energy and emissions for a strategy that incorporates any number of the individual technologies. (In this report, the term "strategy" is used to refer to the combination of technologies that a community uses to manage its MSW.) Because the characteristics of individual communities and regions (e.g., percentages of waste handled through curbside collection of recyclables, proximity of landfill) are often significantly different, the data base allows modifications of key assumptions. Instructions for customizing the data base are included in Exhibit IT.
STRUCTURE OF THE DATA BASE
The data base has two parts. The first presents data on each individual technology. The common technologies covered in the data base are listed in Table 4. 1 .
The second part of the data base combines technologies into strategies. For example, a strategy could include the collection and transportation of MSW from the curb to a landfill, plus landfilling with gas recovery. Another example would be the collection of reusable materials with processing in a materials recovery facility (MRF), plus the collection, transportation, and landfilling of the remaining MSW.
More complex strategies can also be considered. For example, in a community that prepares refuse-derived fuel (RDF) for direct combustion, the strategy could include collection and transportation of mixed MSW, plus RDF preparation with separation of recyclables, plus landfilling a portion of the MSW that is not used as fuel, plus RDF combustion, plus separate landfilling of the ash. The data base combines these technologies in the correct proportions and computes the overall energy requirements and emissions for the strategy as a whole. Table 4.2 lists the terms used in the data base for the strategies for which such calculations have been performed. Figure 4. 1 illustrates the common strategies that use only the five major technologies covered in Sections 5 through 8.
57
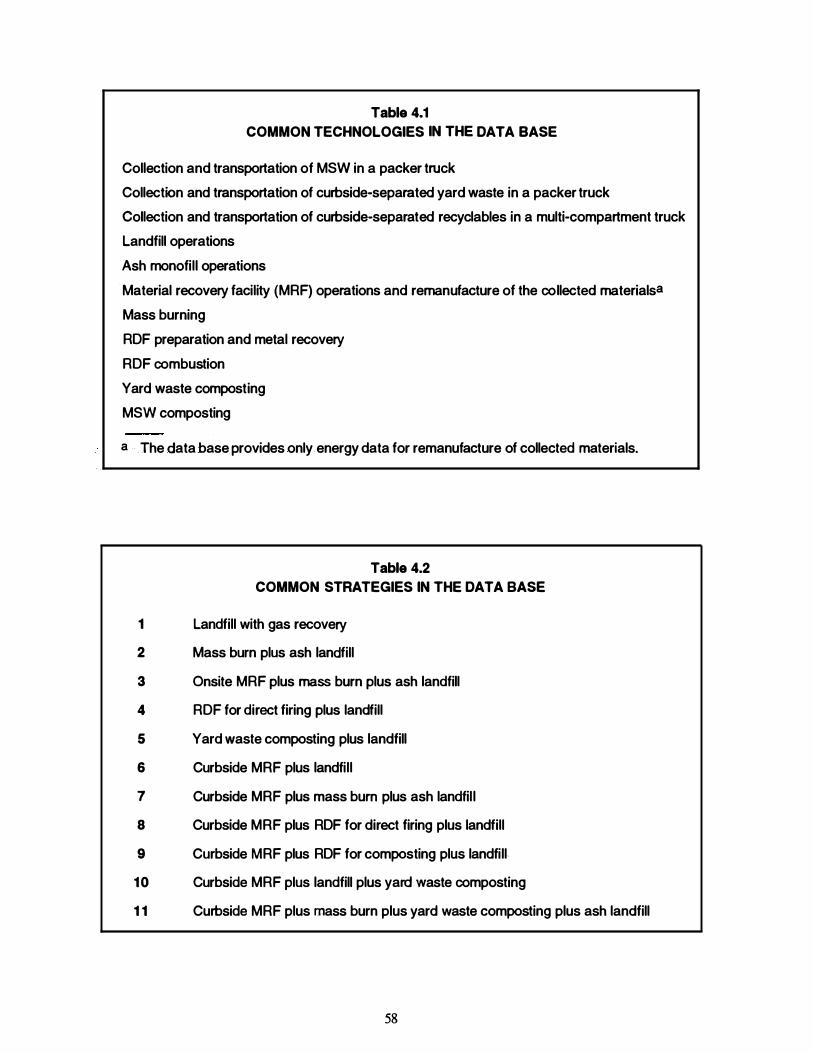
Table 4.1 COMMON TECHNOLOGIES IN THE DATA BASE
Collection and transportation of MSW in a packer truck
Collection and transportation of curbside-separated yard waste in a packer truck
Collection and transportation of curbside-separated recyclables in a multi-compartment truck
Landfill operations
Ash rnonofill operations
Material recovery facility (MRF) operations and remanufacture of the collected materialsa
Mass burning
RDF preparation and metal recovery
RDF combustion
Yard waste composting
MSW composting
a The data base provides only energy data for remanufacture of collected materials.
Table 4.2 COMMON STRATEGIES IN THE DATA BASE
1 Landfill with gas recovery
2 Mass burn plus ash landfill
3 Onsite MRF plus mass burn plus ash landfill
4 RDF for direct firing plus landfill
5 Yard waste composting plus landfill
6 Curbside MRF plus landfill
7 Curbside MRF plus mass burn plus ash landfil l
8 Curbside MRF plus RDF for direct firing plus landfill
9 Curbside MRF plus RDF for composting plus landfill.
10 Curbside MRF plus landfill plus yard waste composting
1 1 Curbside MRF plus mass burn plus yard waste composting plus ash landfill
58

Figure 4.1
STRATEGIES BASED ON THE FIVE MAJOR OPTIONS
� MSW
rilllni@D !-----� .. ·� ___
__. ... �
Strategy 1: MSW to Landfill
aa a4 4 Community
_ffi Strategy 2: MSW to Mass Burn d,..r, Ash � _ _ _ _ _ _ k"5itt Landfill r@nil!illl �
_Ms
_w
...,.._ ·� ._. _ _ _ _ _ _ .. a MWC a aa4 4 Community
Strategy 3: MSW to Mixed MRF and -:�Bum // Ash .
- '� landfill
MSW�
�lf:L lla' Q 8p�l � .. � Mixed MRF MWC
Facility
Strategy 5: Yard Waste Composting and Landfill
MSW ..
� ------4 ... ._ ... �� Landfill
Compost Facility __..,_ .. �4� _____......- Compost
Strategy 6: Curbside Recycling and Landfill � MSW � � ............. __
.IITL.t.i\ Landfill rillrrJ�I!illJ .f!. Recyclables 1 la, � �-==-..::::. il\ � ln--11� _.[ .I ����� SM a J" £!. £!.£ft. JA fA MRF ..._ ______ .....,.
Community
8 M RF separated materials for processing by industry. These materials include paper, cardboard, glass, metal, plastic
59

Figure 4.1
STRATEGIES BASED ON THE FIVE MAJOR OPTIONS (Concluded)
Strategy 10: Curbside Recycling, Yard Waste Composting, and LandfiR:_
Ash � Landfill ...
Landfill
� MSW · � -------__., � rillhJ�pilil .t!. Recyclables ... I R
J'. � t Landfill
.t:l.t:l.t:l £l Yard Waste � MRF
.f.'l. £l ... � ·�Jn � Compost
Community � Compost
Facility
Strategy 1 1 : Curbside Recycling, Yard Waste Composting, and Mass�Burn // Ash MSW S1'T'ii?: . -· .. n. , � ... Landfill
-----... ·� - - - - - - · ·
Recyclables MWC
1ffi_.C:i r::::1 .t!. ... I � -.c:) 9 Jill+' SM a
riliiTJI§u::EJ £ft. Yard Waste 00 0�
MRF ... Landfill
.t:l.t:l.t:l.f.'l. .t.'l ... � �� � Compost
Community Compost Facility
a MRF separated materials for processing by industry. These materials include paper, cardboard, glass, metal, plastic
60
Information Provided
The data base contains separate worksheets that characterize either a specific technology or a combination of technologies. The technologies are. c�aracterized in terms of "Inputs" and "Outputs."
The common inputs include:
• Raw materials (e.g., MSW, feed)
• Water
• Energy required
The common outputs include:
• Energy produced
• Net energy
• Air emissions (quantity of each chemical compound)
• Leachate (quantity of each chemical compound)
• Solid waste (weight, volume)
• Recyclable products (net energy saved).
Limitations of the Data Base
The data base is primarily designed to provide consistent data on individual technologies and to integrate those technologies into strategies; it should not be extended beyond its original intent. For example, the data base is not designed to:
• Predict future growth rates of MSW
• Predict amount or composition of MSW
• Optimize or integrate collection routing for MSW pickup or curbside collection
• Account for energy impacts or raw material impacts when a recycled material is used for applications other than its original use*
• Correlate MSW generation or composition with demographic variables, socioeconomic class, proportion of single-family homes or apartment houses, or any other factor. t
DATA SOURCES AND ASSUMPTIONS
To ensure the inclusion of the best available data, the research for this study included a detailed review of a variety of sources� both primary and secondary. A hierarchical set of criteria were used to select data for inclusion in the data base; the order of preference was as follows:
• For example, use of glass as a sand substitute in an asphalt slurry seal; this limitation is not intended to imply that alternative uses are disadvantageous.
t Tellus Institute has developed a model, called "WastePlan," that can provide such correlations.
61

1. Recent compliance test data were used whenever possible to certify air emissions from combustors; all dioxin/furan estimates are derived in accordance with the U.S. Environmental Protection Agency's (EPA's) requirements for Total PCDD/PCDF measurements; for leachate composition, preference was given to data based on sites that follow appropriate quality assurance/quality control procedures.
2. When only data from secondary sources were available, at least two sources were sought (although not always found); comparing data from different sources proved to be a valuable method for determining which values were representative. Authors of reports were sometimes questioned about ambiguous data.
3. When no published data were found, information was sought through personal communications with current users of the technology (e.g., results of a program for curbside collection of yard waste were provided by a community that operates such a program).
4. When data based on assumptions were used to calculate a given input or output, the "reasonableness" of the assumptions was confirmed by knowledgeable researchers. Those researchers generally favored data from actual operations over data derived from models, although models of landfill performance were generally well regarded.
Estimates that are based on assumptions, limited data, or ambiguous data are printed in italics in the basic worksheets for individual technologies. Data calculated from those original estimates, however, such as the estimates presented for the various integrated strategies, do not appear in italics.
Although specific assumptions and sources of data are identified in the footnotes on the basic worksheets, two important general comments should be noted:
1 . The data base expresses energy for transportation in British thermal units (Btus). The transportation energy estimates are based on the Btu value of the fuel and the mileage for each type of truck. Estimates of transportation emissions are derived from prevailing regulatory standards. However, the regulatory standards are based on operations that involve many fewer stops and starts than are required for collecting MSW, and the standard truck engines use no power to operate rams and lifts. Therefore, emissions four times as large as the regulatory limits were assumed for the study.
2. Estimates of routing miles, truck loadings, and mileage for collection and transport are based on the experience of one community-Palo Alto, California (population 57 ,000). Palo Alto is an affluent community that has had an aggressive curbside recycling program since 1978. A year-round curbside compost collection program was initiated in 1990.
3. Estimates of electricity used in a process are reported in Btus required to generate the electricity in an efficient and up-to-date fossil-fuel-fired plant.
62

The data base is designed to calculate the correct transportation energy requirements and corresponding emissions for the proportions of MSW that are collected as MSW, as curbside recyclables, as separately collected yard waste, and as commercial waste. Each of these collections uses different trucks, different loadings, and different routes. As each hypothetical ton of MSW is apportioned to. the appropriate collection and transportation methods, the overall energy and emissions are adjusted accordingly.
63

5. COMBUSTION
Combustion is the second most widely used MSW technology, as measured by tons of MSW processed. Steam and/or electricity is generated for use by most of the plants. Two different approaches to MSW combustion can be used: mass burning of the MSW and preparation and combustion of refuse-derived fuels. They differ in the extent of pretreatment of the MSW before combustion and in the design and operation of the furnaces.
The rest of this section is divided into four major subsections. The next section discusses issues common to both mass burning and RDF direct firing: regulations and limitations on cost data. The next two subsections discuss each technology individually. The last subsection identifies data gaps and research needs for both technologies.
Modern combustion facilities date from the late 1970s, after the Clean Air Act required effective pollution control equipment on each plant. This section covers units that have begun operation since the Clean Air Act was passed.
The popularity of combustion as part of MSW management strategies also increased as a result of the perceived energy crises of the late 1970s. Both mass burning and RDF combustion produce energy that can replace consumption of fossil fuels. The magnitude of MSW' s potential contribution to the nation's energy supplies is indicated by the following estimate: Conversion of all 1 80 million tons of U.S. MSW to electricity by direct combustion would supply about 3% of annual U.S. electricity needs.* This comparison is made only for a sense of proportion.
Both mass burning and RDF can be effectively combined with various other MSW management approaches. Because preprocessing is minimal in most mass burn plants, the opportunity for separation of materials for possible recycling is smaller than it is in an RDF plant, but it is equal to that with landfilling. Some materials separation occurs when the ash is processed for magnetic metal recovery. Curbside collection of recyclables can be effectively integrated with either mass burning or RDF. An increasing number of mass burn plants are incorporating mixed waste separation steps in which the MSW is processed for materials recovery before combustion. RDF can be densified into pellets before firing or cofiring, and it can be used as feed for anaerobic digestion, MSW composting, and gasification/pyrolysis.
COMMON ISSUES FOR MASS BURN AND RDF
Pollution Control, New Source Performance Standards for Combustors, and Effects of the Clean Air Act Amendments of 1990
A newly constructed mass burning facility will be required to meet New Source Performance Standards (NSPS) for municipal waste combustors (MWCs) that have been published in the Code of Federal Regulations (CFR, 199l a). These requirements specify the maximum emission levels, as shown in Table 5 .1 , for all facilities that process more than 250 tons per day.
* In 1990, the United States burned 726 million tons of coal for electricity generation; that coal supplied about 55% of the nation's electricity needs (DOE, 1991); also see Appendix B, page B-33.
65
Code of Federal Regulations (CFR, 1991a). These requirements specify the maximum emission levels, as shown in Table 5.1 , for all facilities that process more than 250 tons per day.
Guidelines for emission controls for existing facilities are also specified in the Federal Register (FR, 1991a). Because this report covers only new facilities, the guidelines for existing facilities will not be reviewed.
Under Section 129 of the Clean Air Act Amendments passed in 1990, the U.S. Environmental Protection Agency (EPA) will be required by 1993 to issue standards for municipal waste combustion facilities with capacities of 250 tons per day or less, as well as for medical, hospital, and infectious waste incinerators. In 1995, the EPA is required to begin regulating solid waste combustion units burning commercial and industrial waste. Although the EPA currently regulates only particulate emissions from small combustion facilities, a number of states have more restrictive requirements than the federal standards and do not relax those requirements on the basis of size.
Mass burn facilities and RDF facilities use different approaches to control organic emissions. Both approaches effectively destroy a large proportion of organics, including dioxin, in the incoming MSW (Hartman, 1991b), and both are acceptable for meeting the regulations outlined above.
In mass burning, combustion conditions are designed to ensure that a very large percentage of the organics will be consumed. That approach reduces the size needed for pollution control equipment such as scrubbers and baghouses to control the organic emissions, although these devices are needed to control particulates, metals, and acid gases.
RDF facilities use suspension firing, and combustion gases from RDF contain a somewhat higher concentration of organics, as well as some unburned carbon, along with particulates, metals, and acids. These are removed by pollution control equipment similar to that used for mass burn plants, but larger in size.
Energy Recovery
The subsections on energy present the results of a life-cycle analysis of energy inputs and outputs over the 20-year time frame used in this study. The basis is 1 ton of MSW at the curb.
Mass burning and RDF combustion are the most efficient MSW management techniques for energy recovery. Comparisons of performance indicate that differences between the two appear to depend more on the particular waste stream than on differences in design.
Limitations on the Cost Data
The subsections on mass burning and RDF preparation and combustion include data on costs of these facilities. Published cost estimates for individual facilities vary over a wide range, and the data are therefore useful only as order-of-magnitude estimates of the possible costs of new combustion facilities. The variations reflect inconsistencies in the sources of the estimates (the analysis used published data only) rather than predictable variations based on the type of technology or the size of the facility. In many cases, the sources of the estimates fail to provide sufficient information to convert the estimate to a consistent basis or to identify the reasons for the differences.
66
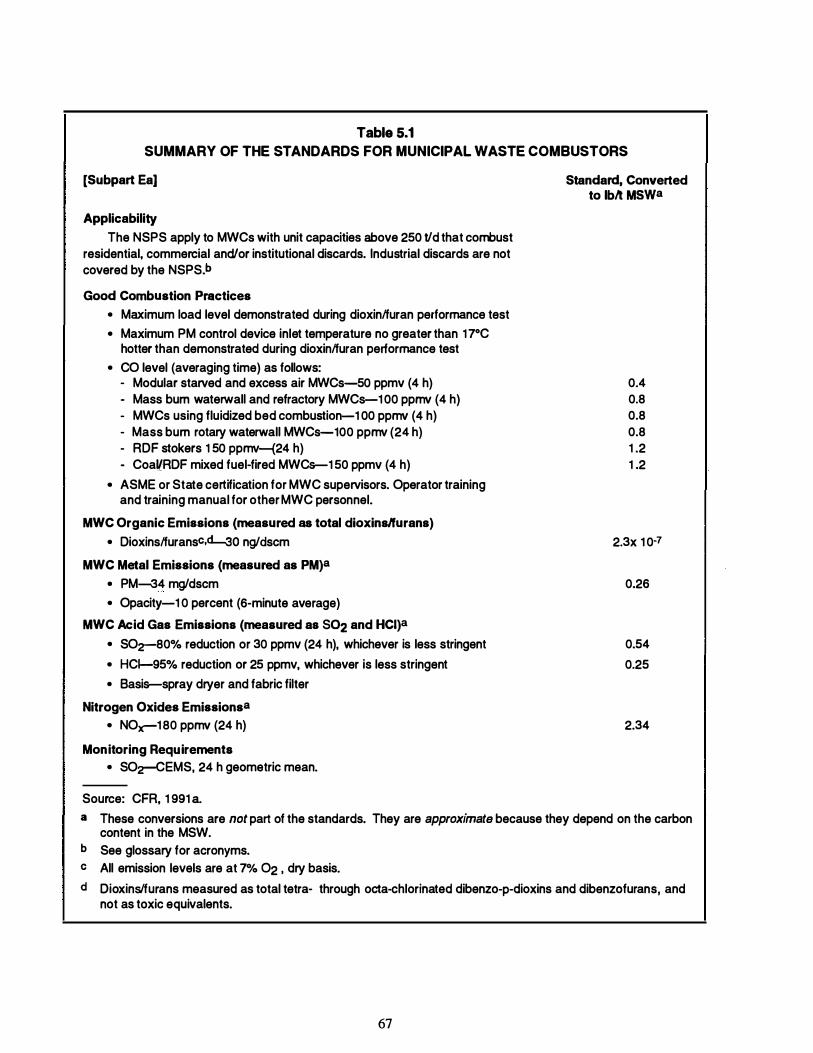
Table 5.1 SUMMARY OF THE STANDARDS FOR MUNICIPAL WASTE COMBUSTORS
[Subpart Ea)
Applicability The NSPS apply to MWCs with unit capacities above 250 t/d that combust
residential, commercial and/or institutional discards. Industrial discards are not covered by the NSPS.b
Good Combustion Practices • Maximum load level demonstrated during dioxinlfuran performance test • Maximum PM control device inlet temperature no greater than 17°C
hotter than demonstrated during dioxinlfuran performance test • CO level (averaging time) as follows:
- Modular starved and excess air MWCs-50 ppmv (4 h) - Mass bum waterwall and refractory MWCs-1 00 pprnv (4 h) - MWCs using fluidized bed combustion-1 00 pprnv (4 h) - Mass bum rotary waterwall MWCs-100 pprnv (24 h) - RDF stokers 1 50 pprnv-(24 h) - CoaVRDF mixed fuel-fired MWCs-1 50 ppmv (4 h)
• ASME or State certification for MWC supervisors. Operator training and training manual for other MWC personnel.
MWC Organic Emissions (measured as total dioxins/furans) • Dioxinslfuransc.d--3o ng/dscm
MWC Metal Emissions (measured as PM)a • PM-34 mg/dscm • Opacity-1 0 percent (6-minute average)
MWC Acid Gas Emissions (measured as S02 and HCI)8 • SOz-80% reduction or 30 ppmv (24 h), whichever is less stringent • HCI--95% reduction or 25 ppmv, whichever is less stringent • Basis-spray dryer and fabric filter
Nitrogen Oxides Emissionsa • NOx-1 80 pprnv (24 h)
Monitoring Requirements • SO:r-CEMS, 24 h geometric mean.
Source: CFR, 1 991 a
Standard, Converted to lblt Mswa
0.4 0.8 0.8 0.8 1 .2 1 .2
2.3x 1 0-7
0.26
0.54 0.25
2.34
a These conversions are not part of the standards. They are approximate because they depend on the carbon content in the MSW.
b See glossary for acronyms. c All emission levels are at 7% 02 , dry basis. d Dioxins/furans measured as total tetra- through octa-chlorinated dibenzo-p-dioxins and dibenzofurans, and
not as toxic equivalents.
67
For example, the finance charge for the capital investment for a given facility would be significantly affected by the interest rate prevalent at the time of project financing, but many sources fail to note that interest rate. Over time, requirements governing the Best Available Control Technologies (BACT), or Best Demonstrated Technology (BOT) tend to become more stringent, and the additional cost of more advanced technologies will increase the capital costs of more recent projects to an unpredictable extent Moreover, capital investment in general would be affected by the type and composition of the wastes and the plant site conditions, but many sources fail to provide data on these matters.
Similarly, the operation and maintenance (O&M) costs are affected by site-specific conditions such as labor rates, labor contracts, safety rules, the size of the crew, and so on. Again, information on these factors is rarely provided in the literature.
MASS BURNING
In mass burning, MSW is directly fed to a furnace. The only required pretreatment of the waste is removal of large objects and potentially dangerous materials. Mass burning is increasingly being preceded by processing to remove materials of value, however; in that sense, the distinction between mass burning and RDF preparation (covered in the next subsection) is starting to blur. Virtually all the organics in MSW are consumed in mass burning, and the volume of material that needs to be landfilled is smaller with mass burning than with RDF combustion.*
Technology Description
Facilities for mass burning include smaller units (25-300 tons per day of MSW) that are fabricated in a shop before installation on site (modular units), as well as larger field-erected plants (200-3,000 tons per day). Figure 5. 1 presents a block diagram of the flows of MSW through both types of facility. A variety of grates, boiler designs, feeding arrangements, and air pollution controls are possible. Individual systems are described in Appendix B. This subsection describes typical units in both size ranges.
In typical large, field-erected facilities, packer trucks empty waste into a large pit in a building. The MSW is retrieved by a crane and dropped into a hopper that feeds the combustor.
Field-erected combustors have a variety of designs to move the waste on grates through the furnace as the MSW bums. The grates move under the waste by reciprocating, rocking, rolling, moving as an endless belt, or rotating as a large tilted cylinder. Air is forced up through the grate to support combustion.
In a typical modular facility, packer trucks unload inside a building on a tipping floor, where front-end loaders are used to move the waste. At some facilities, oversized waste, such as household appliances, and tires are separated for disposal before combustion begins. The frontend loaders will break down some furniture and boxes by driving on them or by using their buckets. The MSW is then pushed onto a conveyor for feed to the combustor.
* "Shred-and-bum" plants are a technical exception to this statement. They are considered RDF plants becaus.e they do shred the MSW before combu�tion; however, like mass bum units, shred-and-bum plants remove almost no combustibles before combustion. Five shred-and-bum plants were operating in the United States in 1991 .
68
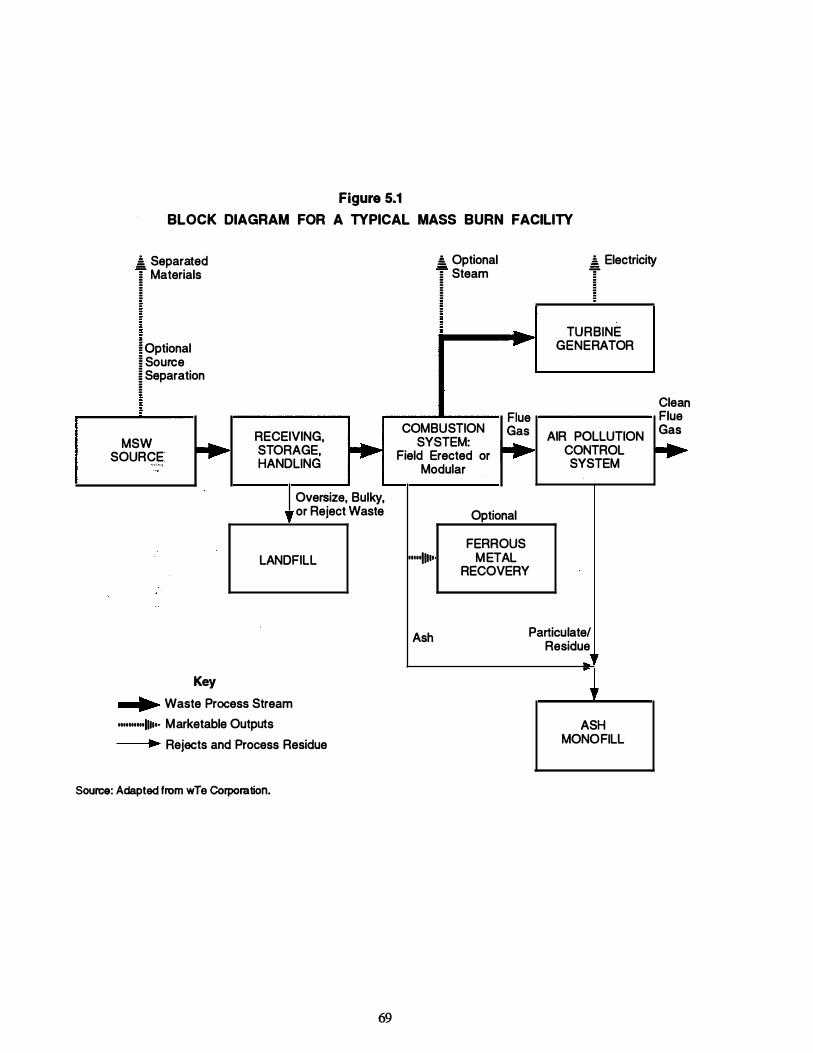
Figure 5.1
BLOCK DIAGRAM FOR A TYPICAL MASS BURN FACILITY
! Separated � Materials .5. Optional � Steam
t Electricity
ioptional � Source � Separation
� RECEIVING, MSW � � SOURCE STORAGE,
·-�'''' HANDLING h
Oversize, Bulky, , or Reject Waste
LANDFILL
Key
.. Waste Process Stream ""'"'"1111•· Marketable Outputs
.., Rejects and Process Residue
Source: Adapted from wTe Corporation.
69
.
5 .. TURBINE .... GENERATOR
Clea n Flue Flue
COMBUSTION Gas AIR POLLUTION Gas SYSTEM: � � Field Erected or CONTROL Modular SYSTEM
Optional
FERROUS mooJJUo METAL RECOVERY
Ash Particulate/ Residue ,,
.. .
,,
ASH MONO FILL

Modular designs create combustion in two chambers. The solid MSW is fed into a starvedair chamber (one that contains too little air for complete combustion) that gasifies part of the waste. The gas is burned in a second chamber with excess air at high temperature for additional heat recovery and organics destruction. Large plants have a single combustion chamber that uses exces.s au.
In both modular and field-erected units, the heat of combustion may be transferred to water or steam in tubes that form the chamber of the combustor or the grate in a rotary combustor. These tubes are called ''water walls," and they are highly efficient at heat recovery. Another variation is to combust the waste in a refractory lined firebox and recover the heat in a waste heat boiler located farther from the point of combustion.
Finally, in both types of units, the exhaust gases are cleaned. Combinations of devices used for cleaning may include:
• A scrubber that uses a lime slurry to remove acid gases and often additional metals and organics as well
• An electrostatic precipitator or baghouse to recover particulates.
Commercial Status
Both mass burning and RDF combustion are mature technologies. The first mass bum plant in the United States that generated electricity for sale was built in New York City in 1902. In addition, combustion plants with capacities greater than 250 tons per day have been evaluated more carefully and completely than any other MSW management alternative.
Direct combustion ranks second to landfilling as an MSW management technique in the United States, accounting for disposal of 17% of all MSW (Kiser, 199 1a). Of the 176 municipal waste combustors (MWCs) operating in the United States in 199 1 , 149 are mass bum plants (Kiser, 199 1a). Of those, 60 are large, field-erected plants and another 50 are smaller, modular plants. The other 39 mass bum plants recover no energy.
Energy Balance
Energy Requirements
Because MSW receives minimal or no preprocessing before mass burning, essentially no energy is required. When mass burning is preceded by separation of recyclables at an MRF, the energy requirements for materials recovery are assigned to the MRF.
Energy Production
The total energy produced by mass burning is higher than that of any other technology except shred-and-bum RDF. Energy production from mass burning is often comparable to that for shred-and-bum RDF, and it may be higher.
Net Energy Balance
For new, larger mass bum facilities, a reasonable estimate of net energy recovery is 525 kilowatt-hours (kWh) per ton of MSW, with a variance of ±75 kWh per ton; that is, 3.8 pounds of MSW generate 1 net kWh (see Appendix A, Attachment 1 1 , page 1 1 -4). Plants that cogenerate steam and electricity have proportionally higher useful energy recovery, but it is more difficult to find an appropriate mix of users for the steam.
70

The efficiency of small, modular plants is only two-thirds as great as that of a large, fielderected plant because the smaller plants use a smaller turbine generator, have lower carbon burnout, have higher radiative heat losses, and operate at lower heat transfer temperatures (see Appendix A , page A-24). The average net electricity production, in kilowatt-hours per ton, is also two-thirds as great for a modular plant as it is for a larger plant (see Appendix A, Attachment 1 1 , pages 1 1-4 and 1 1-5 ; also Berenyi and Gould, 199 1a). Most of the small, modular plants have been designed for steam production only.
Cost· Considerations
Cost data for mass bum facilities are summarized in this subsection. More detailed information is provided in Exhibit I.
Mass Burn: Field Erected
Most field-erected mass bum plants generate electricity only. The average size of the 68 facilities for which useful data are available is 1 ,200 tons per day of design capacity (with a range of 750-3,000 tons per day). Figure 5.2 summarizes the capital cost estimates for the 68 electricity generating plants.* The average capital cost is $ 106,000 per ton per day of design capacity, with a range of $30,000-$210,000.
In some;:�tudies, facilities were not differentiated by the form of energy produced; instead, all field-erected mass bum units were grouped according to the calendar years in which construction began and ended. The capital costs reported in those studies range from $2 1 ,000 to $ 1 14,000 per daily ton of design capacity (Kiser, 1990).
Figure 5.3 shows the O&M cost estimates for the electricity-only mass bum plants for which data are available. The average O&M cost is $26.50 per ton of MSW processed, with a range of $9 to $48 per ton. Figures 5.4 and 5.5 provide estimates of capital and O&M costs for 20 steam/electricity plants. Exhibit I also provides data on plants that produce steam only. Capital costs are lower for those facilities than for electricity-producing plants, but O&M costs are not.
Mass Burn: Modular
Figure 5.6 summarizes the capital cost estimates for 1 1 modular steam and electricity generating plants that have an average capacity of 243 tons per day. The average capital cost is $95,100 per ton of design capacity per day.
Figure 5.7 shows estimated operation and maintenance (O&M) costs for the modular plants for which data are available. The average O&M cost for the facilities is $32 per ton of MSW processed, with a range of $21 to $42 per ton. Exhibit I presents costs for 34 modular mass bum plants that produce steam only, and for 4 plants that produce only electricity. In general, the steam-only plants are smaller in capacity than those that produce electricity. The average capital costs are lower for the steam-only plants, but the O&M costs are not. Tipping fees average $49.79 for the steam/electricity plants, and $25 for the steam-only plants.
* To standardize the presentation of costs, all published estimates have been updated to a mid-1991 time frame using SRI International's PEP Cost Index. Unit capital costs and O&M costs are presented in dollars per ton of MSW as collected. If information on individual cost items was unavailable in the literature, estimates based on reasonable assumptions were used. The bases for the data are described in detail in Exhibit I.
71
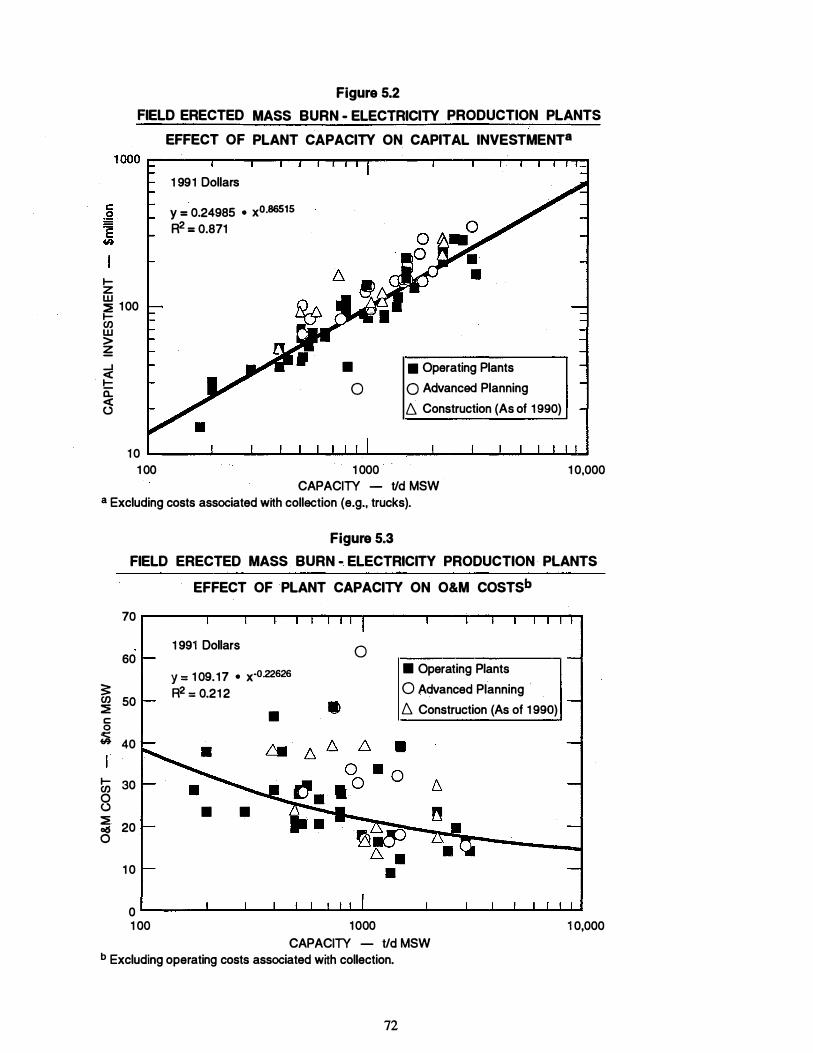
Figure 5.2
FIELD ERECTED MASS BURN - ELECTRICITY PRODUCTION PLANTS
EFFECT OF PLANT CAPACITY ON CAPITAL INVESTMENT8
1-z w :::::;e 1 00 1-(/) w > � � 1-a:: <3
1 991 Dollars
y = 0.24985 • x0·86515 R2 = 0.871
• 0
• Operating Plants 0 Advanced Planning 6. Construction (As of 1 990)
10 �----�--_.--�._���------�--�--�����
1 00 1 000 CAPACITY - tid MSW
a Excluding costs associated with collection (e.g., trucks).
Figure 5.3
1 0,000
FIELD ERECTED MASS BURN - ELECTRICITY PRODUCTION PLANTS
EFFECT OF PLANT CAPACITY ON O&M COSTSb
70
60
� (/) 50 :::::;e c: 0 � 40
1- 30 (/) 0 (.) :::::;e 20 G(l 0
1 0
0
1 991 Dollars
y = 1 09. 17 • x·022626 R2 = 0.21 2
• •
•
0 • Operating Plants 0 Advanced Planning ·
6. Construction (As of 1 990)
1 00 1000 CAPACITY - tid MSW
b Excluding operating costs associated with collection.
72
1 0,000

Figure 5.4
FIELD-ERECTED MASS BURN - STEAM/ELECTRICITY PRODUCTION PLANTS
EFFECT OF PLANT CAPACITY ON CAPITAL INVESTMENTS
1 991 Dollars c � y = 0.66187 • x0·67662 I R2 = 0.630
I 1 00
1-z w ::E l-en w > � 1 0 ...I
� 0: C3
•
• Operating Plants 0 Advanced Planning D. Construction (As of 1 990)
1 �--�_.�� .. ��--.__._.���----._�����
1 0 100 CAPACITY
1 000 tid MSW
a Excluding costs associated with collection (e.g., trucks).
Figure 5.5
10,000
FIELD-ERECTED MASS BURN - STEAM/ELECTRICITY PRODUCTION PLANTS
EFFECT OF PLANT CAPACITY ON O&M COSTSb
3: en ::E c 0 4::::: w
1-en 8 ::E ad 0
60
40
20
1991 Dollars
y = 296.53 • :x-0.40559 R2 = 0.617
•
• Operating Plants 0 Advanced Planning
0 �--�_.�� .. ��--.__._.���----._����� 1 0 1 0Q
CAPACITY 1 000
tid MSW 1 0,000
b Excluding operating costs associated with ·collection.
73
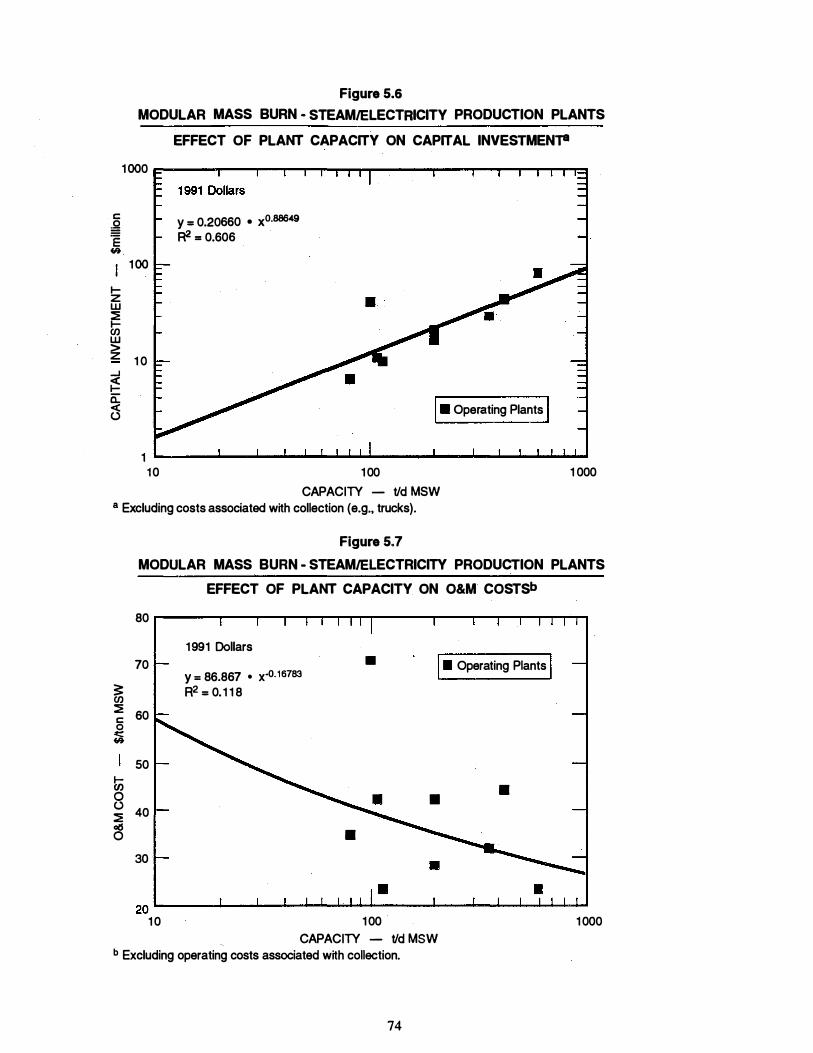
Figure 5.6 MODULAR MASS BURN • STEAM/ELECTRICITY PRODUCTION PLANTS
EFFECT OF PLANT CAPACITY ON CAPITAL INVESTMEN"P
1 000
c y = 0.20660 • x0·88649 � E R2 = 0.606 �
1 00 1-z w � 1-(/) w > z 1 0 ....J
� a: < (.) I • Operating Plants I
1 10 1 00
CAPACITY - t/d MSW a Excluding costs associated with collection (e.g., trucks).
1 000
3: (/) � c 0
� �
� 0 (.) � o(S 0
Figure 5.7 MODULAR MASS BURN - STEAM/ELECTRICITY PRODUCTION PLANTS
EFFECT OF PLANT CAPACITY ON O&M COSTSb
80
1991 Dollars 70 •
y = 86.867 • x-0·16783 I • Operating Plants I
R2 = 0.1 1 8 60
50
• • 40
• 30
20 �----_.--------------�--------------._ ______ �
1 0 1 00 1 000 CAPACITY - t/d MSW b Excluding operating costs associated with collection.
74
Environmental Releases
This subsection presents the results of a life-cycle analysis of emissions. The bases are the same as those used for calculating the energy balance.
Air
Air emissions from selected new mass bum facilities are summarized in Table 5.2. Air emissions from all the steps of an integrated strategy using mass bum are shown in the subsection on integrated strategies.
Water
The largest potential source of water pollution from mass burning is the leachate from the landfilled ash and scrubber solids. These emissions are quantified in the section on landfills. No data on water emissions from the front-end or boiler operations of the mass bum plant were found. Those emissions are sometimes fed into the boiler for combustion or discharged to a treatment plant. For example, SEMASS, a shred-and-bum RDF plant, is a zero-discharge plant because it consumes all the process waste water and sewers only waste water from the bathrooms and showers (see Appendix B).
Land
The residue from mass burning includes:
• A small quantity of oversize objects such as white goods and furniture (accounting for perhaps 4% of the MSW by weight)*
• Ash
• Scrubber waste.
About 24% of the weight of MSW that is mass burned becomes ash for disposal. However, that ash and the scrubber residue combined occupy about 10% of the space that would be needed to dispose of the raw MSW compacted and covered in a landfill (FR, 199 la). When mass burning is used in conjunction with source separation or mixed waste processing, the ash volume is smaller because some of the noncombustible glass and metals are removed. The landspace requirements for landfilling ash are covered in Section 6.
Integrated Strategy Example: Mass Burning of MSW with Electricity Generation and Ash Disposal in a Monofill
To illustrate the application of the data on technologies to the evaluation of options for an integrated MSW management strategy, this section compares the energy balance and air and water emissions for two strategies:
• Collection and transportation of mixed MSW in a packer truck, plus mass burning of the MSW with recycling of some ferrous metal, plus landfilling the ash in a monofill (Strategy 2 in Table 1 . 1)
* Approximately one-half of these products are recyclable as scrap metal (wTe, 1992) .
. 75

Table 5.2 AIR EMISSIONS FROM MASS BURN FACILITIES
(Pounds per Ton of MSW&)
Average, 12 Gloucester NJ Ogden-Martin N. Hempstead
(start up 1990)b,c Plantsd,e (start up 1989)f,g Material Range Mean Mean Range Mean
Water 2084h 2084h 2084h C02 1 142h 1 142h 1 1 42h
co 0. 1 2 0.71 0.48-0.88 0.68
502 0.40 0.65-4.95 2.45 NOx 3.1 6.4 3.92-5.21 4.79
HCI 0.05 0.43-3.64 1 .40
Total PCDD/ PCDP 4.6-5.6 x 1 o-8 4.9 X 1 0-8 7.9 X 1 0-8 0.1 5-1 .7 X 1 0·8 1 .35 X 1 0·8
Particulates 2.4 0.8 0.03-0.07 0.05
Metals
Antimony 9.2 X 1 0·5
Arsenic 3.5 X 1 0-5 2.3-5.1 X 1 0-6 4.1 X 1 0·6
Cadmium 2.3 X 1 0-5 4.2 X 1 0-5 <8 X 1 0-6
Chromium 7.3 X 1 0-5 . 0.6-4 x 1 o-5 1 .9 X 1 0·5
Copper 1 .2 X 1 0·4
Lead 4.6 X 1 0·5 3.0 X 1 0-4 o.9-1 .7 x 1 o-5 1 . 1 X 1 0-5
Mercury o.66-1 .3 x 1 o-4 1 . 1 X 1 0·4 4.4 X 1 0-3 1 ·3 X 1 0-4 2.3 X 1 0·4
Nickel 1 . 1 X 1 0-4 <8-37 X 1 0-6 1 7.5 X 1 0·6
Zinc 7.9 X 1 0·4 ---
a The NSPS regulations are in different units; e.g., the dioxinlfuran limit is 30 ngldscm. An approximate conversion is given in Table 5. 1 . Note that NSPS applies to new plants; existing plants must conform with less stringent regulatory •guidelines. •
b Gloucester County New Jersey, 575 ton per day design. c Sources: Ferraro, 1 991 ; Ferraro, 1 992. d All facilities with semidry scrubber and baghouse. e Source: Bahor (undated). 1 2,050 ton per day design, 1 00% load. 9 Source: Radian, 1 989. Radian Corp. Compliance Test Report Vol 1 , December 1 989. h Based on calculations from carbon, hydrogen, and water content [806].
Dioxins/furans measured as total tetra- through acta-chlorinated dibenzo-p-dioxins and dibenzofurans, and not as toxic equivalents.
76
• Collection and transportation of MSW in a packer truck, plus landfilling of the MSW (Strategy 1 in Table 1 . 1).*
Table 5.3 shows the energy and emissions over a 20-year period for an integrated MSW management strategy that relies on mass burning MSW. The estimates in the table include not only energy and emissions for collection and mass burning, but also the emissions from the leachate from the ash landfill, as well as the contribution of landfilling to the energy and emissions for the strategy as a whole. The results are given separately for transportation, processing
. (mass burning), and disposal (landfilling the ash). Table 5.4 presents the same data for the landfill strategy.
Mass burning produces about four times more energy per ton of MSW than is recovered from a landfill. Air emissions from mass burning include much smaller quantities of organics, but much larger quantities of metals, than air emissions from landfills. Ash monofills produce smaller quantities of leachate than landft.lls, and the leachate has a lower metals content as well. Strategies that include mass burning and shred-and-bum RDF require smaller volumes of landfill space than any other strategy, especially if the combustion strategy also includes separation and recycling.
For the nation as a whole, an average of 2-4% of the weight of incoming refuse is ferrous metals recovered for recycling from the ash. The energy saved by recycling the metal is an additional 0.36 million Btu per ton of MSW, or 4% of the net energy recovered by mass burning (see Exhibit IT). That savings is not included in the data base.
Other Integrated Strategies Described in the Data Base
The computerized data base permits users to integrate RDF production and direct combustion with other MSW technologies to determine the energy and environmental implications of any integrated MSW management strategy. Exhibit II and the computerized data base provide calculations for the following important integrated strategies that include mass burning:
• Col�ection and transportation of MSW in a packer truck, plus on-site separation of recyclables (in a mixed-waste materials recovery facility-MRF), plus mass burning the remaining MSW, plus landfilling ash in a monofill (Strategy 3 in Table 1 . 1)
• Collection and transportation of MSW in a packer truck, plus collection and transportation of curbside-separated recyclables in a multi-compartment truck, plus MRF operations and remanufacture of the collected, separated materials, plus mass burning the remaining MSW, plus landfilling ash in a mono fill (Strategy 7 in Table 1 . 1)
* All the integrated strategy examples in this report compare qther technologies with a strategy of landftlling alone because no strategy can eliminate the need for a landfill; thus, all integrated strategies will involve adding other technologies to landfilling.
77

Table 5.3 ENERGY AND EMISSIONS FOR STRATEGY 2: MASS BURN
Total Collection Processa Disposal Landfill space for residue (assuming a
depth of 50 ft), 1 o-5 acres 0.27 0.27 Solid waste (lb) 545 545 Energy Required (million Btu) 1 .59 0.079 1 .51 0.0003 Energy Produced (million Btu) 1 0.3 0.00 1 0.30 0.00 Net Energy (million Btu) 8.70 -0.079 8.78 0.0003 Air Emissions
Particulates (lb) 0.08 0.02 0.066 Carbon Monoxide (lb) 1 .47 0.79 0.63 Hydrocarbons (lb) 0.079 0.079 NA 0.00 Nitrogen oxides (lb) 5.1 1 0.32 4.79 Carbon dioxide (lb) 1 650 1 650 Water (lb) 1 1 40 1 1 40 Methane (lb) 0 NMOC (lb) 0
Dioxinlfuran ( 1o-6 lb)b 0.014 O.Q 14 502 2.45 2.45 HCI 1.40 1 .40 Antimony (1 0-6 lb) NA NA Arsenic (1 o-6 I b) 4.1 4.1 Cadmium ( 1o-6 lb) 8.0 8.0 Chromium ( 1o-6 lb) 19 1 9 Lead (1 0-6 lb) 1 0 1 0 Mercury (1 o-6 lb) 230 230 Nickel ( 10-s lb) 1 7 1 7 Zinc (1o-6 lb) NA NA
Total Heavy Metals (1 0-6 lb) 288 288
Effluent Leachate (gal) 1 0 1 0 Leachate (lb) 84 84 Chloride (lb) 1 .1 7 1 . 1 7 Sodium (lb) 0.26 0.26 Potassium (lb) 0.1 4 0.1 4 TOC (lb) 0.0003 0.0003 Arsenic (1 o-3 lb) ND ND Cadmium (1 o-3 lb) ND ND Chromium ( 1o-3 1b) ND ND Copper (1 o-3 1b) ND ND Nickel (1 o-3 lb) ND ND Lead (1 o-3 Jb) ND ND Mercury (1 o-3 lb) ND NO Zinc ( 1o-3 lb) NO ND
Total Heavy Metals (1 o-3 lb) NO ND
AOX (gal) ND ND
a Mass burn. b This is total dioxinlfuran as specified by EPA in CFR, 1 991 a.
78
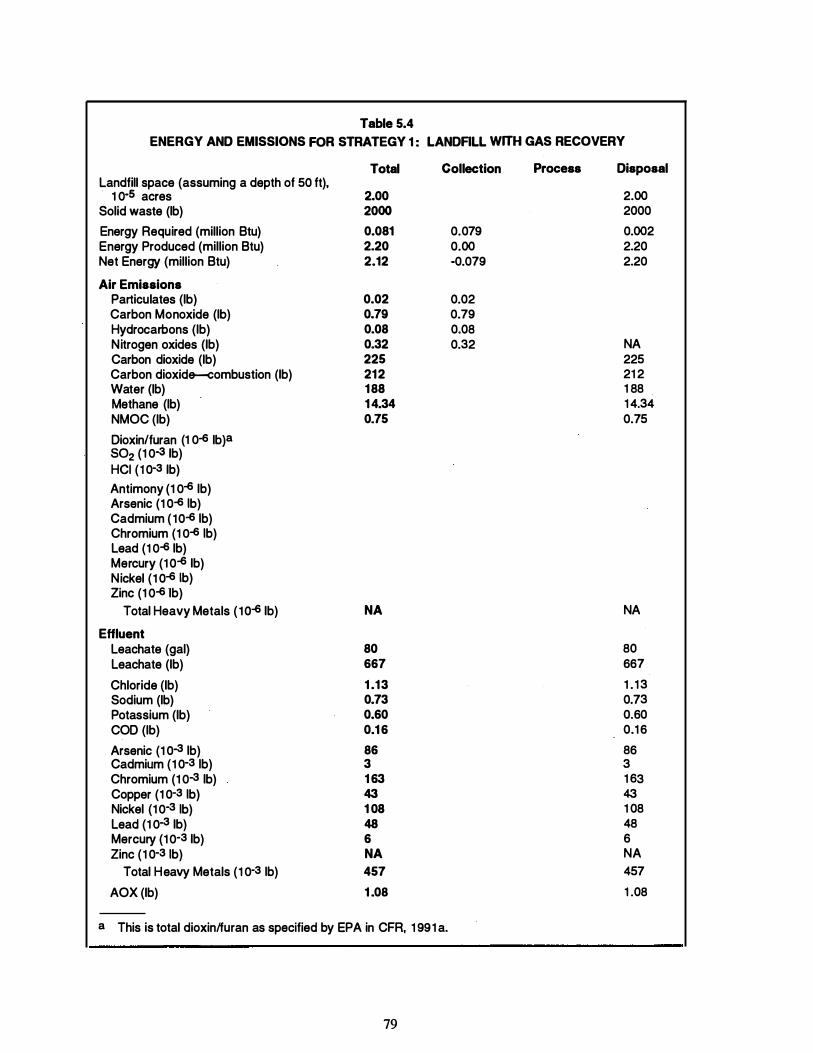
Table 5.4 ENERGY AND EMISSIONS FOR STRATEGY 1 : LANDRLL WITH GAS RECOVERY
Total Collection Landfill space (assuming a depth of 50 ft),
1 o·S acres 2.00 Solid waste (lb) 2000
Energy Required (million Btu) 0.081 Energy Produced (million Btu) 2.20 Net Energy (million Btu) 2.12
Air Emissions Particulates (lb) 0.02 Carbon Monoxide (lb) 0.79 Hydrocarbons (lb) 0.08 Nitrogen oxides (lb) 0.32 Carbon dioxide (lb) 225 Carbon dioxide-combustion (lb) 21 2 Water (lb) 1 88 Methane (lb) 1 4.34 NMOC (lb) 0.75
Dioxinlfuran (1 Q-6 lb )a 502 (1 Q-3 lb) HCI (1 0-3 lb) Antimony (1 Q-6 lb) Arsenic (1 0-6 Jb) Cadmium ( 10-6 1b) Chromium (1 Q-6 Jb) Lead (1 Q-6 lb) Mercury (1 0-6 lb) Nickel (1 0-6 Jb) Zinc (1 Q-6 lb)
Total Heavy Metals ( 10-6 lb) NA
Effluent Leachate (gal) 80 Leachate (lb) 667
Chloride (lb) 1 .1 3 Sodium (lb) 0.73 Potassium (lb) 0.60 COD (lb) 0.1 6
Arsenic (1 0-3 Jb) 86 Cadmium (1 0-3 Jb) 3 Chromium (1 o-a lb) 1 63 Copper (1 0-3 Jb) 43 Nickel (1 Q-3 Jb) 1 08 Lead (1 Q-3 lb) 48 Mercury (1 Q-3 lb) 6 Zinc (1 0-3 Jb) NA
Total Heavy Metals (1 Q-3 Jb) 457
AOX (lb) 1 .08
a This is total dioxinlfuran as specified by EPA in CFR, 1 991 a.
79
0.079 0.00 -0.079
0.02 0.79 0.08 0.32
Process Disposal
2.00 2000 0.002 2.20 2.20
NA 225 21 2 1 88 1 4.34 0.75
NA
80 667 1 . 1 3 0.73 0.60 0.1 6 86 3 1 63 43 1 08 48 6 NA 457 1 .08
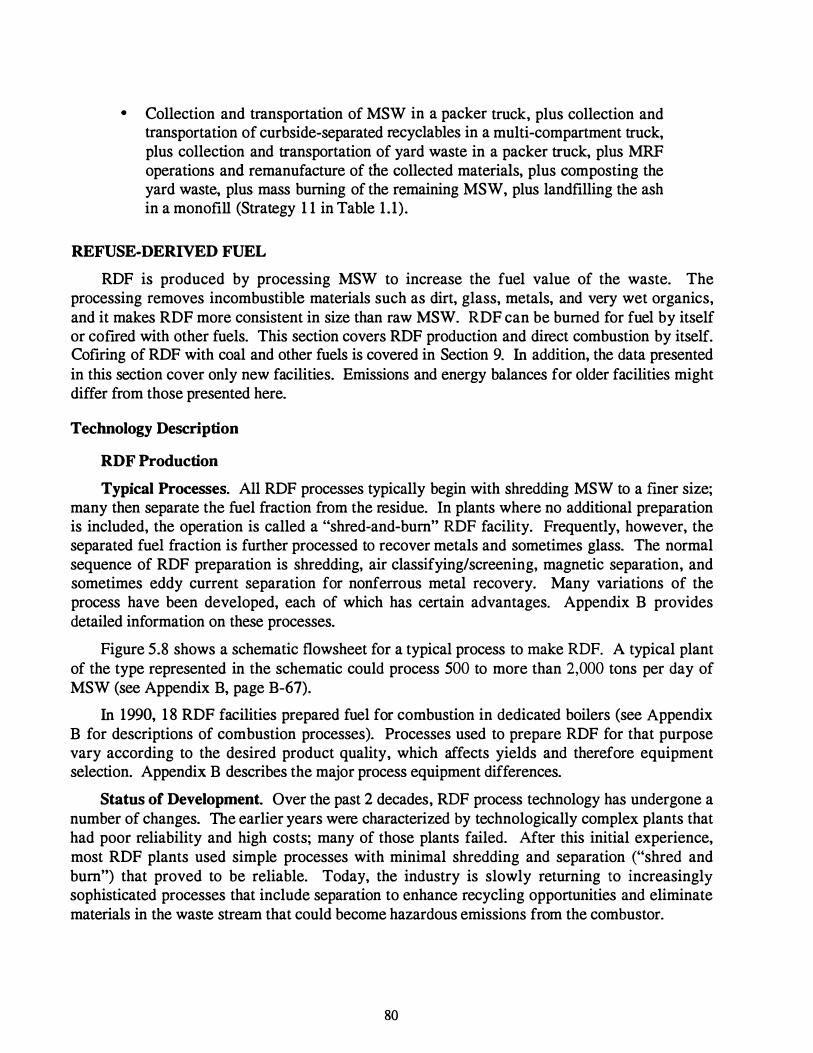
• Collection and transportation of MSW in a packer truck, plus collection and transportation of curbside-separated recyclables in a multi-compartment truck, plus collection and transportation of yard waste in a packer truck, plus MRF operations and remanufacture of the collected materials, plus com posting the yard waste, plus mass burning of the remaining MSW, plus landfilling the ash in a monofill (Strategy 1 1 in Table 1 . 1).
REFUSE-DERIVED FUEL
RDF is produced by processing MSW to increase the fuel value of the waste. The processing removes incombustible materials such as dirt, glass, metals, and very wet organics, and it makes RDF more consistent in size than raw MSW. RDF can be burned for fuel by itself or cofired with other fuels. This section covers RDF production and direct combustion by itself. Cofiring of RDF with coal and other fuels is covered in Section 9. In addition, the data presented in this section cover only new facilities. Emissions and energy balances for older facilities might differ from those presented here.
Technology Description
RDF Production
Typical Processes. All RDF processes typically begin with shredding MSW to a finer size; many then separate the fuel fraction from the residue. In plants where no additional preparation is included, the operation is called a "shred-and-bum" RDF facility. Frequently, however, the separated fuel fraction is further processed to recover metals and sometimes glass. The normal sequence of RDF preparation is shredding, air classifying/screening, magnetic separation, and sometimes eddy current separation for nonferrous metal recovery. Many variations of the process have been developed, each of which has certain advantages. Appendix B provides detailed information on these processes.
Figure 5.8 shows a schematic flowsheet for a typical process to make RDF. A typical plant of the type represented in the schematic could process 500 to more than 2,000 tons per day of MSW (see Appendix B, page B-67).
In 1990, 1 8 RDF facilities prepared fuel for combustion in dedicated boilers (see Appendix B for descriptions of combustion processes). Processes used to prepare RDF for that purpose vary according to the desired product quality, which affects yields and therefore equipment selection. Appendix B describes the major process equipment differences.
Status of Development. Over the past 2 decades, RDF process technology has undergone a number of changes. The earlier years were characterized by technologically complex plants that had poor reliability and high costs; many of those plants failed. After this initial experience, most RDF plants used simple processes with minimal shredding and separation ("shred and bum") that proved to be reliable. Today, the industry is slowly returning to increasingly sophisticated processes that include separation to enhance recycling opportunities and eliminate materials in the waste stream that could become hazardous emissions from the combustor.
80
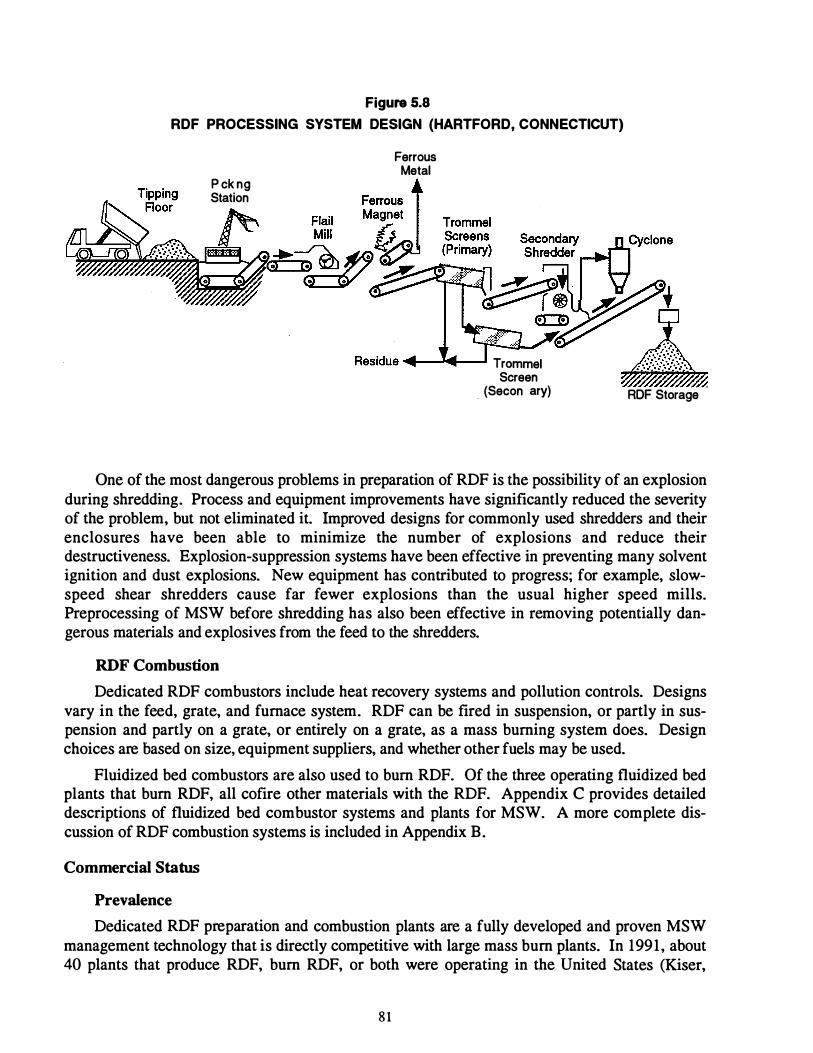
Figure 5.8 RDF PROCESSING SYSTEM DESIGN (HARTFORD, CONNECTICUT)
Picking Station
Ferrous Metal
Residue ..,. _ _.._ .... Trommel Screen
. (Secondary) /;:?. RDF Storage
One of the most dangerous problems in preparation of RDF is the possibility of an explosion during shredding. Process and equipment improvements have significantly reduced the severity of the problem, but not eliminated it. Improved designs for commonly used shredders and their enclosures have been able to minimize the number of explosions and reduce their destructiveness. Explosion-suppression systems have been effective in preventing many solvent ignition and dust explosions. New equipment has contributed to progress; for example, slowspeed shear shredders cause far fewer explosions than the usual higher speed mills. Preprocessing of MSW before shredding has also been effective in removing potentially dangerous materials and explosives from the feed to the shredders.
RDF Combustion
Dedicated RDF combustors include heat recovery systems and pollution controls. Designs vary in the feed, grate, and furnace system. RDF can be fired in suspension, or partly in suspension and partly on a grate, or entirely on a grate, as a mass burning system does. Design choices are based on size, equipment suppliers, and whether other fuels may be used.
Fluidized bed combustors are also used to bum RDF. Of the three operating fluidized bed plants that bum RDF, all cofire other materials with the RDF. Appendix C provides detailed descriptions of fluidized bed combustor systems and plants for MSW. A more complete discussion of RDF combustion systems is included in Appendix B.
Commercial Status
Prevalence
Dedicated RDF preparation and combustion plants are a fully developed and proven MSW management technology that is directly competitive with large mass bum plants. In 1991, about 40 plants that produce RDF, bum RDF, or both were operating in the United States (Kiser,
81

1991b). Of the total of 29,000 tons per day of RDF made in the United States in 1990, an overwhelming majority (89%) was directly fired alone for energy recovery.
Five plants make densified (pelletized, cubed, compressed) RDF, called d-RDF, for use in other facilities, as reported in Appendix B (page B-50). Most of these are small plants that process about 100 tons per day of MSW. d-RDF is expensive to make because of high processing costs and equipment wear.
Applications and Markets
Whenever RDF is prepared in one facility for firing at another, a key commercial consideration is the need for a strong contract or a close financial relationship between the preparers of RDF or d-RDF and the final users. In some instances in which the relationship was loose, the user has refused to continue to accept the RDF, and the result was the failure of RDF as an MSW disposal strategy.
d-RDF is often difficult to market. Unless potential customers are willing to pay the additional cost of the densified material for its special properties, plants have little incentive to make d-RDF. The largest user, Ottertail Power, substitutes d-RDF for coal at about 5% of its heat load (RRR, 1992; Berenyi and Gould, 1991a).
Energy Balance
Energy Requirements for RDF Preparation
The energy required for RDF preparation is about 0.03 1-0.046 million Btu per ton of MSW. Appendix A provides additional details on the estimated energy requirements.
Energy Produced by RDF Combustion
As a fuel, RDF has roughly one-half the Btu value of the same weight of coal. RDF also has a higher ash and chloride content, and a lower sulfur content.
A plant like the one shown previously in Figure 5.8 will typically convert 75-85% of the weight* and 80-90% of the Btu value of the MSW into RDF [107]. The RDF typically contains 10-17% ash arid has a Btu range of 4,800-6,400 Btu per pound. A value of 5,900 Btu per pound was used in the calculations for this study (see Appendix B, pages B-5, B-69, and B-47). When it is used as fuel for electric power production, RDF typically produces 1 kWh for 15,460 Btu (2.6 pounds of RDF).
Net Energy Balance
The thermal efficiency of three new operating RDF plants is about 455 net kWh per ton of MSW, with a range of ±100 kWh per tont [387]. According to studies of actual performance, the electrical efficiency achieved by burning RDF, like the efficiency achieved by mass burning, depends more on the nature of the raw MSW fuel than it does on the combustion plant design.
* Some RDF plants recover less than 50% of MSW as RDF. t These estimates are based on the Dade County Resource Recovery Project in Florida (capacity, 3,000 tons per
day), the Penobscot Energy Recovery Co. in Maine (capacity, 750 tons per day), and the SEMASS facility in Massachusetts (capacity, 1,900 tons per day).
82

Boiler design and operating characteristics greatly affect these efficiencies, and neither mass burning nor RDF direct combustion is consistently more efficient
The "Integrated Strategy Example" later in this section presents the net energy balance for using RDF in an MSW management strategy.
Cost Considerations
Figure 5.9 summarizes the capital cost estimates for 15 operating integrated RDF production/combustion facilities. • The estimates are based on detailed data included in Exhibit I. The average unit capital cost is $98,000 per ton per day of design capacity. A comparison study that gave capital costs for RDF plants completed in different periods provided a range of costs from $75,000 to $ 102,000 per ton per day of design capacity (Kiser, 1990).
Figure 5. 10 shows the O&M cost estimates for the plants for which data are available. The average O&M cost for the facilities is $36 per ton of MSW processed, with a range of $13 to $67 per ton.
Note, however, that these averages are based on wide ranges. Because these ranges are so wide and the number of data points is so small, the data in Figures 5.9 and 5.10, as well as the more detailed cost data provided in Exhibit I, are useful only as order-of-magnitude estimates of the possible costs of new RDF preparation and combustion facilities.
Environmental Releases
Air Emissions
Air pollution control systems are required for direct combustion of RDF, and existing RDF combustion facilities emit smaller quantities of organics, particulates, and metals than the most recent EPA regulations allow. Typical emissions from RDF combustion are summarized in Table 5.5.
Some organics are separated before combustion and landfilled. The landfilled portion of the MSW undergoes anaerobic digestion and produces landfill gas. The amounts released are discussed in the "Integrated Strategy Example" described in the next subsection. Emissions for the entire strategy are shown later.
Water Emissions
The major potential source of water pollution with RDF is from leachate that might escape untreated from a landfill containing the ash. Emissions from ash landfills are discussed in Section 6.
Another potential source of water emissions with RDF is the 10-20% of the MSW that is removed during processing of RDF and is landfilled instead. The air and water emissions for the rejected wastes are similar to the emissions from unprocessed MSW, but adjusted for the smaller volume. These are quantified in the "Integrated Strategy Example" later.
* To standardize the presentation of costs, all published estimates have been updated to mid-1991 using SRI International's PEP Cost Index. Unit capital costs and O&M costs are presented in dollars per ton of MSW as collected. If infonnation on individual cost items was unavailable in the literature, estimates based on reasonable assumptions were used. The bases for the data are described in detail in Exhibit I.
83
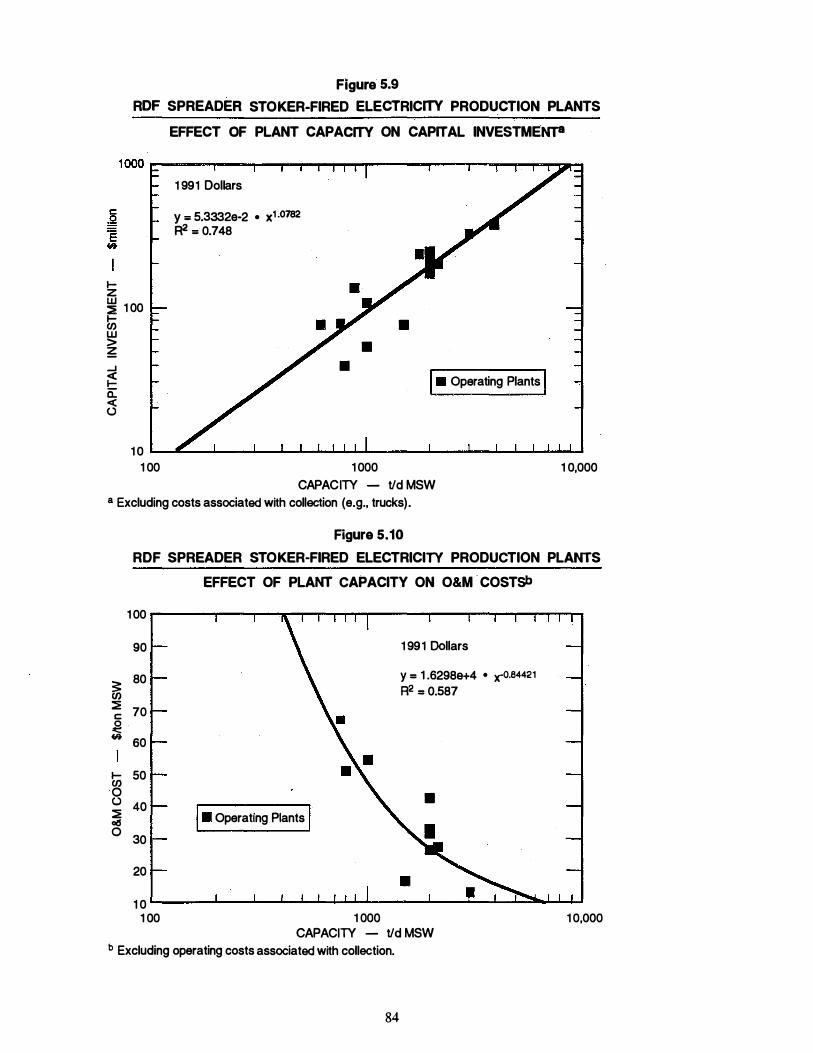
Figure 5.9 RDF SPREADER STOKER-FIRED ELECTRICITY PRODUCTION PLANTS
EFFECT OF PLANT CAPACITY ON CAPITAL INVESTMENTS
1-z � 1 00 � w > � _.
� a: < (.)
1 991 Dollars
y = 5.3332e-2 • x1 .0782 R2 = 0.748
• •
• I• Operating Plants I
1 0 ��--�--�--������----�--�--����� 1 00 1 000
CAPACITY - Vd MSW a Excluding costs associated with collection (e.g., trucks).
Rgure 5.10
1 0,000
RDF SPREADER STOKER-FIRED ELECTRICITY PRODUCTION PLANTS
EFFECT OF PLANT CAPACITY ON O&M COSTSb
1 00
90
� 80
� 70 c ,g � 60
1-en 50 0 (.) 40 � � 0 30
20
1 0
I• Operating Plants I
1 991 Dollars
y = 1 .62989+4 • x-0.84421 R2 = 0.587
•
1 00 1 000 CAPACITY - Vd MSW
b Excluding operating costs associated with collection.
84
1 0,000
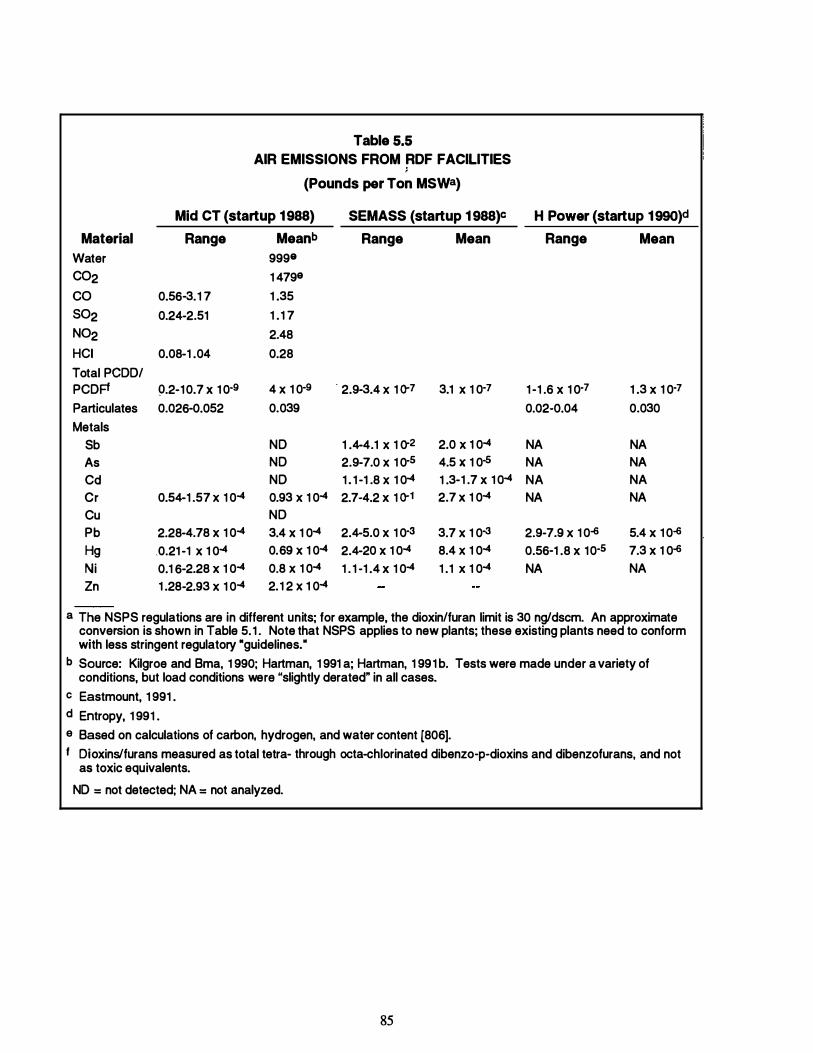
Table 5.5 AIR EMISSIONS FROM RDF FACILITIES
�
(Pounds per Ton MSWa)
Mid CT (startup 1988) SEMASS (startup 1 988)c H Power (startup 1990)d
Material Range Meanb Range Mean Range Mean Water 999& C02 1 4798 co 0.56-3.1 7 1 .35 so2 0.24-2.51 1 . 1 7 N02 2.48 HCI 0.08-1 .04 0.28 Total PCOO/ PCOP !).2-10.7 x 1 0·9 4 X 1 0·9 . 2.9-3.4 X 1 Q-7 3.1 X 1 0·7 1 -1 .6 x 1 Q-7 1 .3 X 1 0·7 Particulates 0.026-Q.052 0.039 0.02-Q.04 0.030 Metals
Sb NO 1 .4-4.1 X 1 Q-2 2.0 X 1 0-4 NA NA As NO 2.9-7.0 X 1 Q-5 4.5 X 1 0·5 NA NA Cd NO 1 . 1 -1 .8 X 1 0-4 1 .3-1 .7 x 1 0-4 NA NA Cr 0.54-1 .57 X 1 0-4 0.93 X 1 0-4 2.7-4.2 x 1 Q-1 2.7 x 1 0-4 NA NA Cu NO Pb 2.28-4.78 X 1 0-4 3.4 X 1 0-4 2.4-5.0 X 1 Q-3 3.7 X 1 0-3 2.9-7.9 X 1 0-6 5.4 X 1 0-6 Hg .0.21 -1 X 1 0-4 0.69 X 1 0-4 2.4-20 X 1 0-4 8.4 X 1 0-4 0.56-1 .8 X 1 0·5 7.3 X 1 0-6 Ni 0.1 6-2.28 X 1 0-4 0.8 X 1 0-4 1 . 1 -1 .4 x 1 0-4 1 .1 X 1 0-4 NA NA Zn 1 .28-2.93 X 1 0-4 2.1 2 X 1 0-4
a The NSPS regulations are in different units; for example, the dioxin/furan limit is 30 ng/dscm. An approximate conversion is shown in Table 5. 1 . Note that NSPS applies to new plants; these existing plants need to conform with less stringent regulatory •guidelines. •
b Source: Kilgroe and Bma, 1 990; Hartman, 1 991 a; Hartman, 1 991 b. Tests were made under a variety of conditions, but load conditions were "slightly derated" in all cases.
c Eastmount, 1 991 . d Entropy, 1 991 . e Based on calculations of carbon, hydrogen, and water content (806]. f Oioxins/furans measured as total tetra- through acta-chlorinated dibenzo-p-dioxins and dibenzofurans, and not
as toxic equivalents. NO = not detected; NA = not analyzed.
85
Land Use
About 10-20% of the MSW is removed during processing of RDF. The rejected material is wet or heavy organics and dirt, with a heating value of only 3,000 Btu per pound, and it is discarded to a landfill. When the vblume of material rejected during RDF preparation is combined with the volume of ash generated from burning, RDF produces a larger volume of landftlled material than mass burning, in spite of the improved recycling that occurs during RDF preparation.
Integrated Strategy Example: RDF Preparation and Combustion with Electricity Generation, Ash Disposal in a Monofill, and Landfilling Organic Rejects
To illustrate the application of the data on technologies to the evaluation of options for an integrated MSW management strategy, this section summarizes the energy balance and air and water emissions for:
• Collection and transportation of MSW in a packer truck, plus on-site RDF preparation and metal recovery, plus RDF combustion, plus landfilling of RDF rejects, plus landfilling of the ash in a monofill (Strategy 4 in Table 1 .1 )
• Collection and transportation of MSW in a packer truck, plus landfilling the MSW (Strategy 1 in Table 1 . 1 ). *
As implied in ''Technology Description," RDF preparation can consist of "shred-and-bum" processing or a more extensive process. The analysis for the integrated strategy covers the more extensive RDF preparation process in which about 20% of the incoming MSW is removed as recyclables and as wet or heavy organic rejects for direct landfilling. The shred-and-bum RDF facilities have energy and emission characteristics quite similar to those of mass bum facilities.
Table 5.6 shows the energy and emissions over a 20-year period from a strategy that includes RDF preparation and combustion. The estimates in the table include energy and emissions for normal collection of MSW, RDF preparation, RDF combustion, landfilling of the ash, and landfilling of the unprocessed RDF, as well as the contribution of landfilling to the energy and emissions for the strategy as a whole. Recovery of materials during preparation is part of the RDF production process, and energy effects and emissions from that recycling are included. Credits for savings in energy for actually recycling the separated materials through remanufacture are included as well. The results are given separately for transportation, processing (preparation and combustion of RDF), and disposal (landfilling the ash in a monofill and landfilling the RDF rejects in an MSW landfill). Table 5. 7 presents the same data for the landfill strategy.
RDF direct combustion, like mass burning, produces substantial electrical energy, about 3.7 times more energy than is recovered from a landfill. Emissions are similar to those for mass burning, except that the organic rejects increase the quantities of MSW sent to a landfill, where they release methane and leachate.
* All the integrated strategy examples in this report compare other technologies with a strategy of landftlling alone because no strategy can eliminate the need for a landftll; thus, all integrated strategies will involve adding other technologies to landftlling.
86
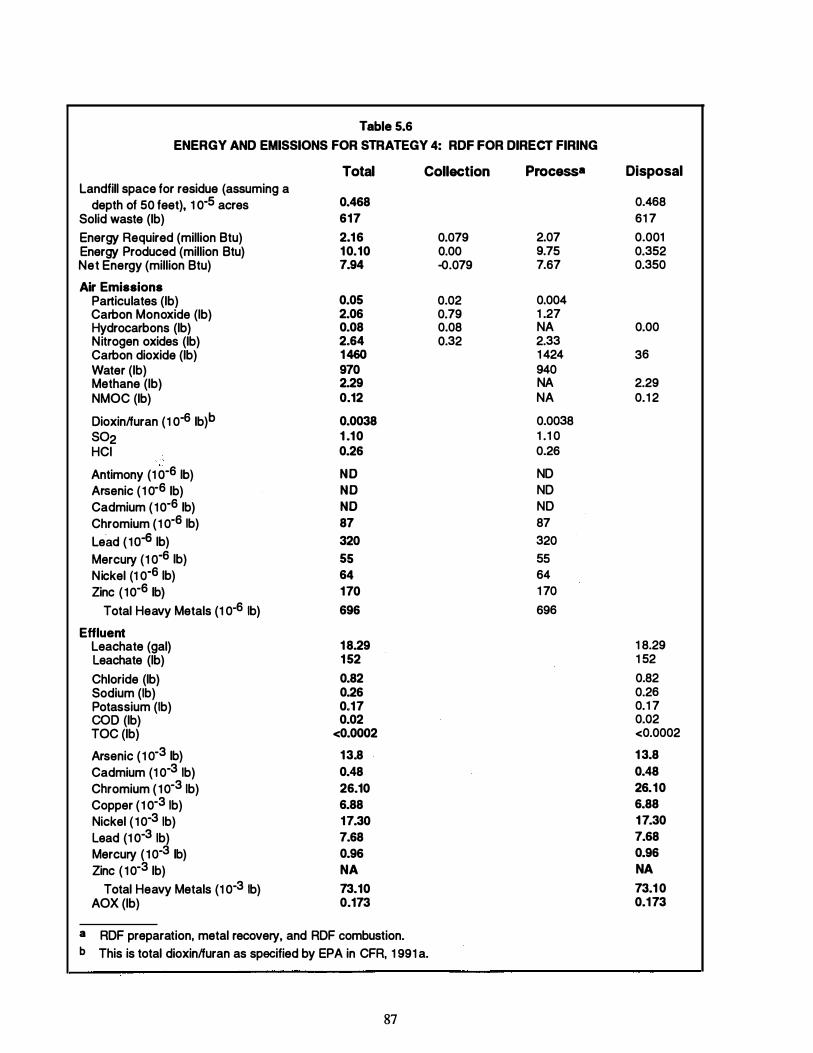
Table 5.6 ENERGY AND EMISSIONS FOR STRATEGY 4: RDF FOR DIRECT FIRING
Total Collection Landfill space for residue (assuming a
depth of 50 feet), 1 o-5 acres 0.468 Solid waste (lb) 617 Energy Required (million Btu) 2.1 6 Energy Produced (million Btu) 1 0.10 Net Energy (million Btu) 7.94
Air Emissions Particulates (lb) 0.05 Carbon Monoxide (lb) 2.06 Hydrocarbons (lb) 0.08 Nitrogen oxides (lb) 2.64 Carbon dioxide (lb) 1 460 Water (lb) 970 Methane (lb) 2.29 NMOC (lb) 0.12
Dioxinlfuran (1 o-6 lb)b 0.0038 so2 1 .1 0 HCI 0.26
Antimony (1 0-6 lb) NO Arsenic ( 1 o-6 lb) NO Cadmium ( 1o-6 lb) NO Chromium (1 o-6 1b) 87 Lead ( 1o-a lb) 320 Mercury (1 0-6 lb) 55 Nickel (1 o-6 lb) 64 Zinc ( 1o-6 lb) 170
Total Heavy Metals (1 o-6 lb) 696
Effluent Leachate (gal) 1 8.29 Leachate (lb) 1 52 Chloride (lb) 0.82 Sodium (lb) 0.26 Potassium (lb) 0.17 COD (lb) 0.02 TOC (lb) <0.0002
Arsenic ( 1 o-3 lb) 1 3.8 Cadmium (1 o-3 1b) 0.48 Chromium ( 1o-3 1b) 26.10 Copper ( 1 o-3 1b) 6.88 Nickel ( 1o-3 1b) 17.30 Lead (1 o-3 1b) 7.68 Mercury ( 10-3 lb) 0.96 Zinc ( 1o-3 lb) NA
Total Heavy Metals (1 o-3 lb) 73.10 AOX (lb) 0.173
a RDF preparation, metal recovery, and RDF combustion. b This is total dioxinlfuran as specified by EPA in CFR, 1 991 a.
87
0.079 0.00 -o.079
0.02 0.79 0.08 0.32
Process•
2.07 9.75 7.67
0.004 1 .27 NA 2.33 1 424 940 NA NA 0.0038 1 .1 0 0.26 ND ND ND 87 320 55 64 1 70 696
Disposal
0.468 61 7 0.001 0.352 0.350
0.00
36
2.29 0.1 2
1 8.29 1 52 0.82 0.26 0.1 7 0.02 <0.0002 1 3.8 0.48 26.10 6.88 1 7.30 7.68 0.96 NA 73.1 0 0.173
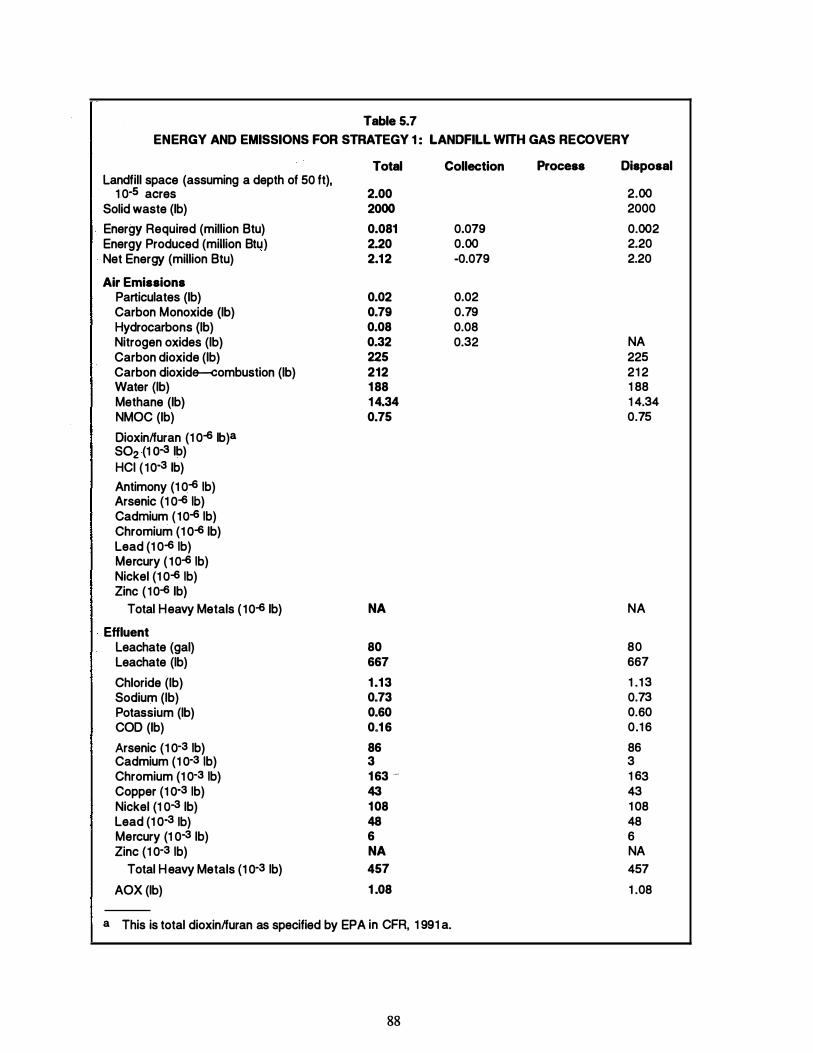
Table 5.7 ENERGY AND EMISSIONS FOR STRATEGY 1 : LANDFILL WITH GAS RECOVERY
Total Collection Landfill space (assuming a depth of 50 ft),
1 0-s acres Solid waste (lb) Energy Required (million Btu) Energy Produced (million Btu) Net Energy (million Btu) Air Emissions
Particulates (lb) Carbon Monoxide (lb) Hydrocarbons {lb) Nitrogen oxides (lb) Carbon dioxide (lb) Carbon dioxide-combustion (lb) Water (lb) Methane (lb) NMOC (lb) Dioxinlfuran (1 0-6 lb )a so2 (1 o-a lb) HCI ( 10-3 lb) Antimony (1 0-6 1b) Arsenic (1 0-6 1b) Cadmium ( 10-6 1b) Chromium (1 Q-6 lb) Lead (1 0-6 1b) Mercury ( 10-6 1b) Nickel (1 0-6 1b) Zinc ( 10-6 lb)
Total Heavy Metals ( 10-6 lb) Effluent
Leachate (gal) Leachate (lb) Chloride (lb) Sodium (lb) Potassium (lb) COD (lb) Arsenic (1 0-3 1b) Cadmium (1 0-3 1b) Chromium (1 0-3 1b) Copper (1 0-3 1b) Nickel (1 0-3 lb) Lead (1 0-3 1b) Mercury (1 0-3 lb) Zinc (1 0-3 1b)
Total Heavy Metals (1 0-3 1b) AOX (lb)
2.00 2000 0.081 2.20 2.1 2
0.02 0.79 0.08 0.32 225 212 1 88 1 4.34 0.75
NA
80 667
1 .1 3 0.73 0.60 0.1 6
86 3 1 63 -43 1 08 48 6 NA 457
1 .08
a This is total dioxinlfuran as specified by EPA in CFR, 1 991 a.
88
0.079 0.00 -0.079
0.02 0.79 0.08 0.32
Process Disposal
2.00 2000 0.002 2.20 2.20
NA 225 21 2 1 88 1 4.34 0.75
NA
80 667 1 . 1 3 0.73 0.60 0.1 6 86 3 1 63 43 1 08 48 6 NA 457 1 .08
OTHER INTEGRATED STRATEGIES DESCRIBED IN THE DATA BASE
The computerized data base permits users to integrate RDF production and direct combustion with other MSW technologies to determine the energy and environmental implications of any integrated MSW management strategy. Exhibit I and the computerized data base include calculations for the following other integrated MSW management strategies that include RDF and one or more of the other major waste management technologies:
• Collection and transportation of MSW in a packer truck, plus collection and transportation of curbside-separated recyclables in a multi-compartment truck, plus MRF operation with remanufacture of the collected materials, plus onsite RDF preparation and metal recovery, plus RDF combustion, plus landfilling of RDF discards, plus landfilling of ash in a monofill (Strategy 8 in Table 1 . 1)
• Collection and transportation of MSW in a packer truck, plus collection and transportation of curbside-separated recyclables in a multi-compartment truck, plus MRF operations with remanufacture of the collected materials, plus onsite RDF preparation and metal recovery, plus RDF composting of the remaining MSW, plus landfilling of RDF rejects (Strategy 9 in Table 1 . 1 ).
RDF is also used as feed for three of the less common MSW management technologies: cofiring with coal, gasification, and anaerobic digestion. Exhibit II and the computerized data base include calculations for the following integrated strategies that use RDF in those applications:
• Collection and transportation of MSW in a packer truck, plus RDF preparation and metal recovery, plus combustion of the RDF (cofiring with coal), plus landfllling RDF rejects, plus landfilling ash in a monofill (Strategy 12 in Table 9.3)
• Collection and transportation of MSW in a packer truck, plus collection and transportation of curbside-separated recyclables in a multi-compartment truck, plus collection and transportation of curbside-separated yard waste in a packer truck, plus MRF operations, plus yard waste composting, plus RDF preparation and metal recovery, plus combustion of the RDF (cofiring with coal), plus landfilling RDF, MRF, and composting rejects, plus landfilling ash in a monoflll (Strategy 15 in Table 9.3)
• Collection and transportation of MSW in a packer truck, plus MSW preparation for gasification, plus gasification of the prepared MSW, plus landfilling ash in a monofill (Strategy 13 in Table 9.3)
• Collection and transportation of MSW in a packer truck, plus collection and transportation of curbside-separated recyclables in a multi-compartment truck, plus MRF operations and remanufacture of the collected materials, plus RDF preparation and metal recovery, plus anaerobic digestion of RDF, plus landfilling of RDF rejects (Strategy 14 in Table 9.3).
89
MISSING DATA AND RESEARCH NEEDS FOR MASS BURN AND RDF Both mass bum and RDF technologies have been studied extensively, and substantial
quantities of data are available on many parameters. During this study, however, gaps in the data about technology, emissions, and costs were identified.
Technology
It was difficult to find data on the quantities of recyclable materials recovered from MSW during RDF operations. A few plants have been well characterized, but no broad data base exists.
Plants that precede mass burning with mixed waste processing are beginning to be operated. However, few data were found on operating results for those plants, on quantity and quality of materials removed, and on the markets for the products.
Emissions
Air
Although regulations on existing operating MSW combustors have become more restrictive (FR, 1987c; FR 1989a; FR 199 1a; and the timetable set by the Clean Air Act Amendments of 1990), periodic evaluations of older plants might show that emissions have been reduced as new guidelines governing older plants have been implemented.
Far less information is available on stack emissions from smaller modular mass bum plants. After 1993, when the new guidelines on plants with capacities of less than 250 tons per day go into effect, assessments of emissions from smaller plants will become more available.
Few data on air emissions from the RDF preparation areas or tipping areas of a mass bum plants have been reported. Some of the air is used for combustion, but some is vented.
Long-term studies may also reflect the changing composition of the waste stream. Technological changes over time influence the nature of the waste that is discarded. Examples of such changes include the recent substantial reductions in the mercury in alkaline cells (from 1 % to less than 0. 1 % ) , the growing popularity of zinc-air cells as replacements for mercury batteries in hearing aids, and the elimination of some metals from inks. In addition, new laws in Europe and California are requiring elimination of lead from the 2 billion wine bottle closures produced each year (Andre and Karpel, 1991).
Some sources have referred to the possibility that free carbon in the flyash portion of the ash might absorb some metals� such as mercury, as well as organics. The role of free carbon-as an adsorbent might be worth investigating.
No data were found to indicate whether significant reductions in emissions can be achieved by removing retrievable, and possibly recyclable, materials from the MSW prior to combustion.
Methods for reducing emissions from smaller modular mass bum units are needed. Better combustion control is needed for smaller modular combustors to allow them to maintain optimized combustion conditions during charging of new MSW.
90
Water
The available data were insufficient to support an evaluation of the water emissions from RDF preparation, if any is discharged. Data on the various blowdown streams from combustion operations were also unavailable, perhaps because those streams are entirely consumed in the ash quench tank.
Land
Few data were found on the amount of bulky waste removed before mass burning. Nor were data available on the amount of bulky material that is sold as scrap or on the fate of bulky materials that have no scrap value.
Engineering estimates that compare typical sizes of ash monofills with those of raw MSW landfills are available; however, comparisons of the actual depth and acreage of existing landfills and monofills were not found. Similarly, no studies provide guidance concerning land use for ash monofills after closure.
Research into beneficial uses of stabilized ash is frequently based on the relatively extensive research on the uses for flyash from coal-fired utilities. Some studies have evaluated use of the ash as a component of bituminous highway material. Other research is under way on uses in masonry block construction materials. Some processes vitrify or melt the ash into a glass that is extremely inert to leaching and can often be used beneficially as aggregate (see Appendix A, page A-80, and DeCesare, 1991). Alternative uses for ash could save landfill space.
Costs
Problems with using historical cost data as predictors of future costs have been discussed. Unless the costs to be compared are built up from consistent base costs using the same assumptions, yalid comparisons of generic technologies and systems cannot be made.
The available data show no consistent variations by region. In addition, local factors will alter the costs of individual technologies greatly, and may overwhelm any suspected regional differences. The range of available data is insufficient for estimating effects of local technologies, however.
91

6. SANITARY LANDFILLS
The major purpose of sanitary landfills, which are the most common waste management technology employed in the United States*, is the storage of MSW in a way that protects human health and the environment. This section reviews two types of landfills:
• MSW landfills, which contain MSW as discarded and the residues that remain after various other MSW management technologies are applied. Although some MSW landfills also receive ash, that ash is increasingly kept in separate monofills.
• Ash landfills, a type of monofill, which are limited to the ash that remains after combustion of waste.
All MSW management technologies addressed in this report require landfills for their residues, and the amount of that residue is affected by the technologies used to extract materials and energy from the waste. Even recycling requires landfills to dispose of: the impurities separated in materials recovery facilities (MRF) or later at smelters (i.e., slag) ; paper sludge containing fiber that is too short for reuse; fillers and inks; or small pieces of mixed-color glass. In general, recycling delays and/or reduces requirements for land disposal rather than eliminating them.
TECHNOLOGY DESCRIPTION
Design of Sanitary Landfills
A new sanitary landfill is subject to many design regulations set by the U.S. Environmental Protection Agency (EPA) under "Guidelines for the Land Disposal of Solid Waste" (CFR, 199lb), by states, and by local communities. All new landfills that accept more than 20 tons of MSW per day are subject to requirements for controlling emissions to groundwater. Because all landfills that contain wet organic material produce methane, the largest of such landfills are likely to have to meet additional existing and proposed requirements for controlling emissions into the air.
State-of-the-art landfills incorporate a liner system, a leachate collection system, a leachate treatment system, a cap system, gas recovery systems to recover energy or to flare the gas, landscaping, security, groundwater monitoring wells� and a groundwater plan. The landfills require about 30 years of postclosure monitoring, care, and planning for eventual community use.
One of the most critical parts of the design is the liner at the bottom of the landfill (CEC, 199 1). Figure 6. 1 illustrates a design that conforms with current regulations. Regulations require that during operations the new MSW must be compacted and covered daily with an inert
• A landf"lll 120 feet deep that occupies only 0.15% of U.S. continental landspace could accommodate the MSW created over the next 1,000 years at current generation rates (Wiseman, 1991). By way of comparison, the United States loses 1 .8 billion tons of cropland topsoil each year from erosion into the Gulf of Mexico and into the oceans (Council on Environmental Quality, 1990).
93
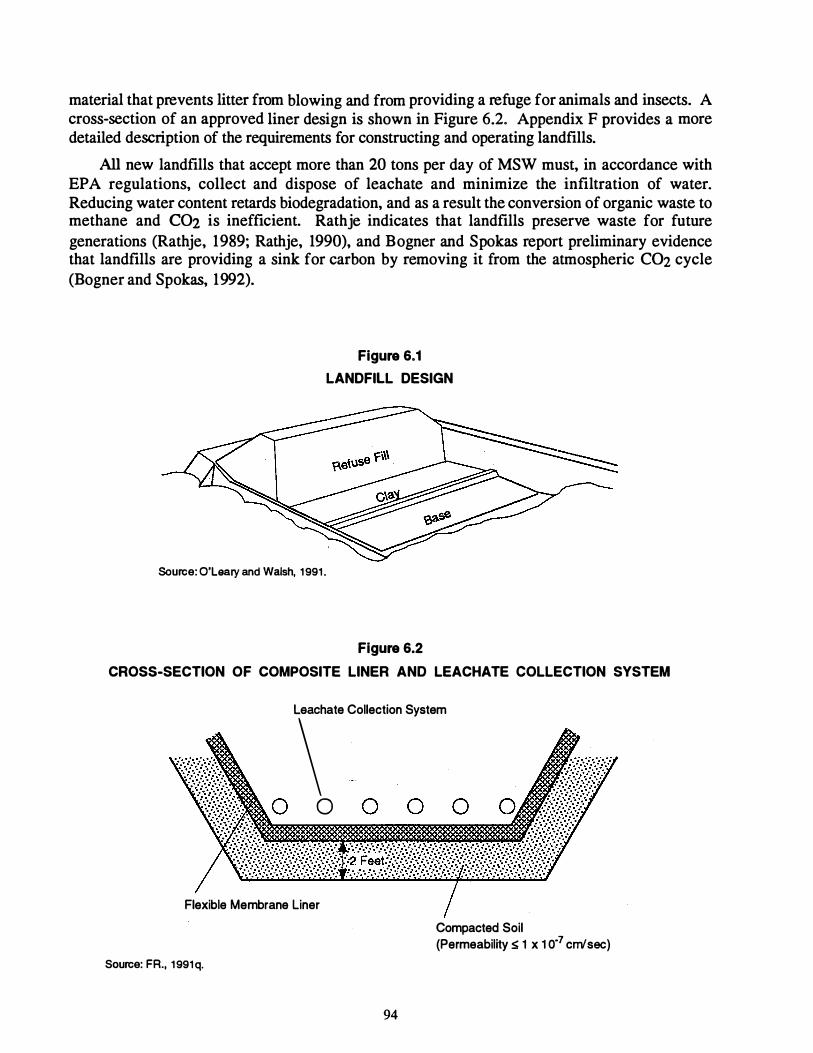
material that prevents litter from blowing and from providing a refuge for animals and insects. A cross-section of an approved liner design is shown in Figure 6.2. Appendix F provides a more detailed description of the requirements for constructing and operating landfills.
All new landfills that accept more than 20 tons per day of MSW must, in accordance with EPA regulations, collect and dispose of leachate and minimize the infiltration of water. Reducing water content retards biodegradation, and as a result the conversion of organic waste to methane and C02 is inefficient. Rathje indicates that landfills preserve waste for future generations (Rathje, 1989; Rathje, 1990), and Bogner and Spokas report preliminary evidence that landfills are providing a sink for carbon by removing it from the atmospheric C02 cycle (Bogner and Spokas, 1992).
Source: O'Leary and Walsh, 1991.
Figure 6.1
LANDFILL DESIGN
Figure 6.2
CROSS-SECTION OF COMPOSITE LINER AND LEACHATE COLLECTION SYSTEM
L\hate Collection System
0
Flexible Membrane Liner Compacted Soil (Permeability � 1 x 1 0"7 cnv'sec)
Source: FR., 1991q.
94
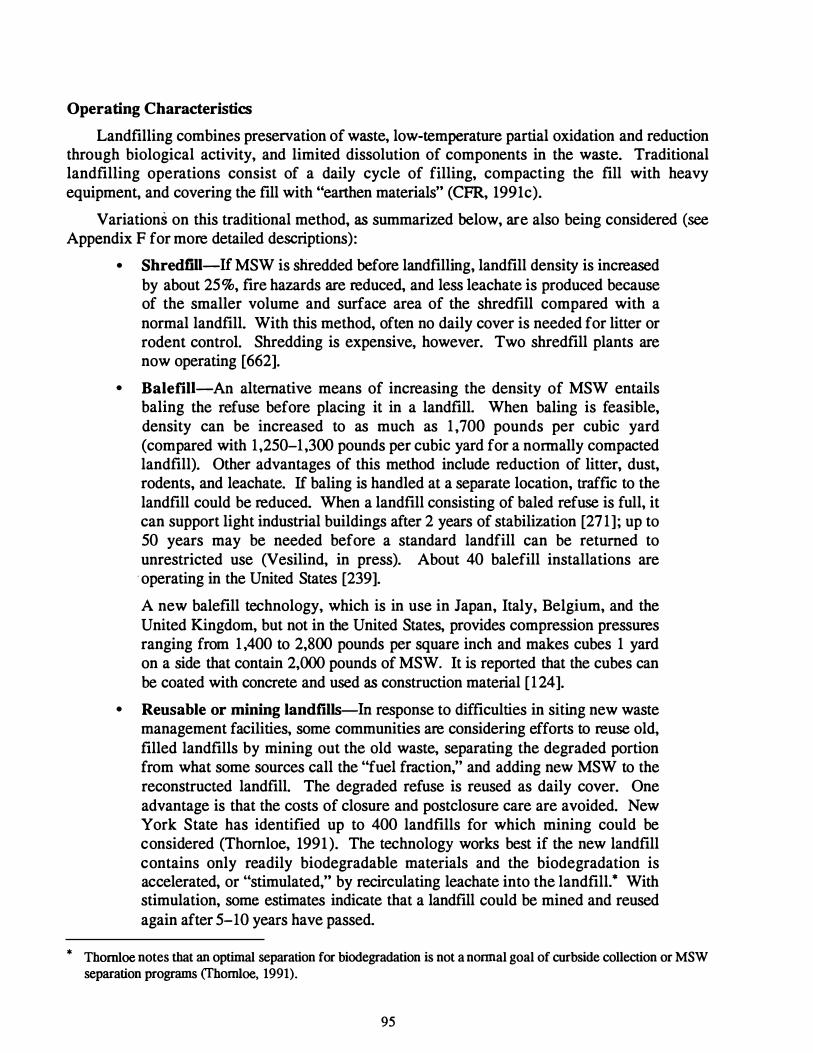
Operating Characteristics
Landfilling combines preservation of waste, low-temperature partial oxidation and reduction through biological activity, and limited dissolution of components in the waste. Traditional landfilling operations consist of a daily cycle of filling, compacting the fill with heavy equipment, and covering the fill with "earthen materials" (CPR, 1991c).
Variations on this traditional method, as summarized below, are also being considered (see Appendix F for more detailed descriptions):
• Shredtiii-If MSW is shredded before landfilling, landfill density is increased by about 25%, fire hazards are reduced, and less leachate is produced because of the smaller volume and surface area of the shredfill compared with a normal landfill. With this method, often no daily cover is needed for litter or rodent control. Shredding is expensive, however. Two shredfill plants are now operating [662].
• Balefili-An alternative means of increasing the density of MSW entails baling the refuse before placing it in a landfill. When baling is feasible, density can be increased to as much as 1 ,700 pounds per cubic yard (compared with 1 ,250-1,300 pounds per cubic yard for a normally compacted landfill). Other advantages of this method include reduction of litter, dust, rodents, and leachate. If baling is handled at a separate location, traffic to the landfill could be reduced. When a landfill consisting of baled refuse is full, it can support light industrial buildings after 2 years of stabilization [27 1]; up to 50 years may be needed before a standard landfill can be returned to unrestricted use (Vesilind, in press). About 40 balefill installations are
· operating in the United States [239].
A new balefill technology, which is in use in Japan, Italy, Belgium, and the United Kingdom, but not in the United States, provides compression pressures ranging from 1 ,400 to 2,800 pounds per square inch and makes cubes 1 yard on a side that contain 2,000 pounds of MSW. It is reported that the cubes can be coated with concrete and used as construction material [ 124].
• Reusable or mining landfills-In response to difficulties in siting new waste management facilities, some communities are considering efforts to reuse old, filled landfills by mining out the old waste, separating the degraded portion from what some sources call the "fuel fraction," and adding new MSW to the reconstructed landfill. The degraded refuse is reused as daily cover. One advantage is that the costs of closure and postclosure care are avoided. New York State has identified up to 400 landfills for which mining could be considered (Thomloe, 1991 ). The technology works best if the new landfill contains only readily biodegradable materials and the biodegradation is accelerated, or "stimulated," by recirculating leachate into the landfill.* With stimulation, some estimates indicate that a landfill could be mined and reused again after 5-10 years have passed.
* Thornloe notes that an optimal separation for biodegradation is not a nmmal goal of curbside collection or MSW separation programs (fhomloe, 1991).
95
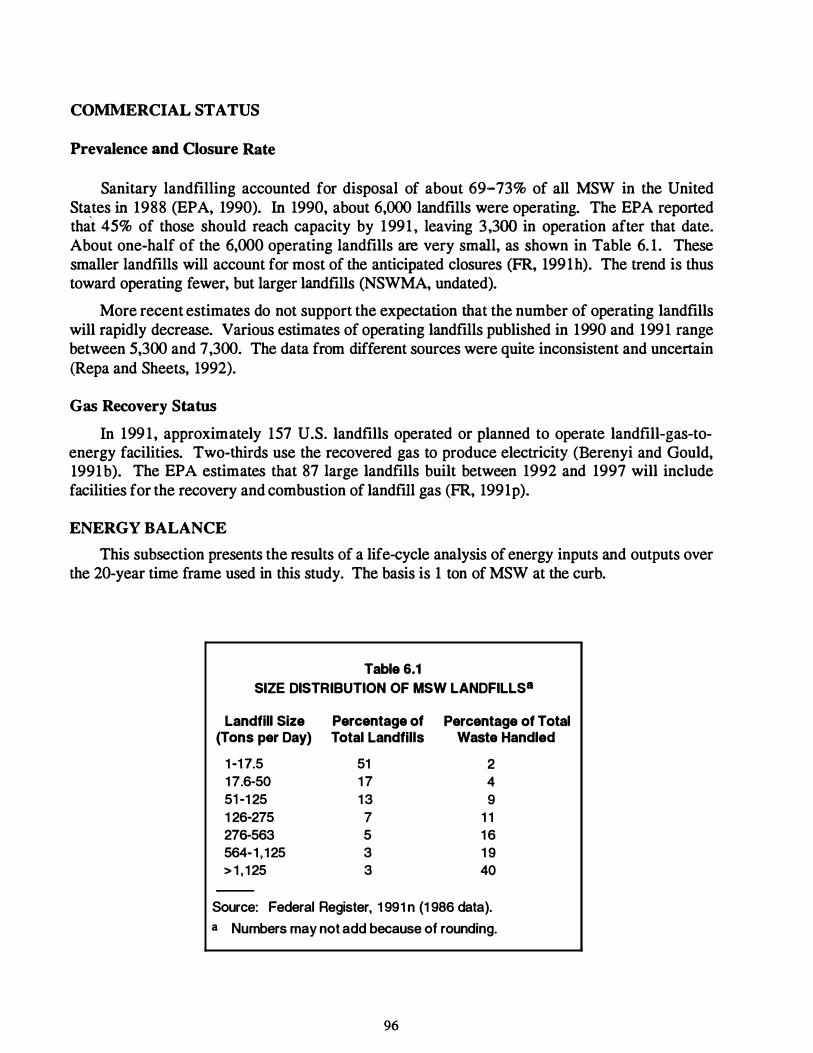
CO�ERCIAL STATUS
Prevalence and Closure Rate
Sanitary landfilling accounted for disposal of about 69-73% of all MSW in the United St�:tes in 1988 (EPA, 1990). In 1990, about 6,000 landfills were operating. The EPA reported that 45% of those should reach capacity by 199 1 , leaving 3,300 in operation after that date. About one-half of the 6,000 operating landfills are very small, as shown in Table 6. 1 . These smaller landfills will account for most of the anticipated closures (FR, 199 1h). The trend is thus toward operating fewer, but larger landfills (NSWMA, undated).
More recent estimates do not support the expectation that the number of operating landfills will rapidly decrease. Various estimates of operating landfills published in 1990 and 199 1 range between 5,300 and 7 ,300. The data from different sources were quite inconsistent and uncertain (Repa and Sheets, 1992).
Gas Recovery Status
In 199 1 , approximately 157 U.S. landfills operated or planned to operate landfill-gas-toenergy facilities. Two-thirds use the recovered gas to produce electricity (Berenyi and Gould, 1991b). The EPA estimates that 87 large landfills built between 1992 and 1997 will include facilities for the recovery and combustion of landfill gas (FR, 1991p).
ENERGY BALANCE
This subsection presents the results of a life-cycle analysis of energy inputs and outputs over the 20-year time frame used in this study. The basis is 1 ton of MSW at the curb.
Table 6.1 SIZE DISTRIBUTION OF MSW LANDFILLS8
Landfill Size Percentage of Percentage of Total (Tons per Day) Total Landfills Waste Handled
1 -1 7.5 51 2 1 7.6-50 1 7 4 51 -1 25 1 3 9 1 26-275 7 1 1 276-563 5 1 6 564-1 , 125 3 1 9 > 1 ' 125 3 40
Source: Federal Register, 1 991 n {1 986 data). a Numbers may not add because of rounding.
96

Energy Requirements
Landfills require energy for construction, compacting, spreading daily landfill cover, collecting and treating leachate, and similar activities. The operation of a landfill uses 0.09-0.28 million Btu per ton of MSW (SRI estimate based on fragmentary data; see Exhibit V).
Energy Production
To complete the energy balance, the amount of energy produced (methane) must be determined, and the fraction that can be collected and used must be estimated. Unlike combustion, in which energy is released very quickly, the conversion of MSW to methane can require a long time. For analysis, a period must also be chosen for the recovery of energy from the landfill. The following discussion presents the data and assumptions used in the energy production portion of the analysis.
Although only 157 of the nation's approximately 6,000 operating landfills are operating or plan to operate landfill gas-to-energy plants, the energy and emissions data in this report are based on landfill with gas recovery. The largest landfills (about 200 have a capacity of more than 1 ,000 tons per day) are more likely to include the energy recovery facilities, and those landfills now receive more than 40% of all MSW landfilled in the United States. In comparison with facilities that either collect landfill gas and flare it or allow the gas to escape into the atmosphere, 'landfill gas-to-energy operations reduce environmental releases of methane while providing an energy benefit.
Modem landfills with gas recovery facilities can ultimately produce 1 to 1.8 standard cubic feet of methane per pound of dry waste (Augenstein and Pacey, 199 1). Variations in the amount of methane generation in a single landfill and from landfill to landfill are at least 100% (Augenstein and Pacey, 199 1). The rate at which methane is generated varies even more widely. The methane production rate is often measured as the time a landfill takes to produce one-half of the total quantity of the gas that it will eventually release-a period that can range from 2 to more than 25 years, with a range of 5-15 years being typical (Augenstein and Pacey, 1991). The higher production rates (i.e., the shorter time periods in the range) require extremely wet conditions.
Length of Time for Energy Production
Proposed EPA regulations call for a minimum of 15 years of active methane extraction from large landfllls. Over a 10- to 20-year period, which is the approximate maximum life of a commercial gas extraction project (CEC, 199 1)*, a landfill can produce about 1 .3 to 2.4 million Btu per ton of wet MSWt; a well-maintained extraction operation can recover 85% of that amount for fuel use (Augenstein and Pacey, 199 1). The energy thus recovered amounts to 1 8% to 24% of the energy that could be recovered through combustion of the same MSW.t For the balance calculated here, 100% gas recovery has been used. The Electric Power Research Institute (EPRI) estimates the fuel value of MSW at 4,500 Btu per pound at 30% moisture (EPRI, 1989).
* Using a 20-year period underestimates gas production and may underestimate landfill gas recovery, but available published data are insufficient to permit extrapolation beyond that time period.
t That estimate is based on a value of 909 Bm per cubic foot (LHV) for methane (Kumar, 1987), or 500 Btu per standard cubic foot of landflll gas, and 1-1.8 standard cubic feet of methane per dry pound ofMSW (Augenstein and Pacey, 1991). A typical heat content of MSW is 4,500 Btu per pound (EPRI, 1989).
97
Energy Potential of All Landfills
According to EPA estimates, all U.S. landfills combined release 12 million tons per year of methane (FR, 1991b). If all that methane could be captured and used to generate electricity, the landfills would provide 5% of the natural gas used in the United States to supply electricity (calculated from FR, 1991b, and DOE, 1991).
Addition of water to a landfill has been shown to approximately double the amount of methane generated-from 20%-25% of the theoretical maximum anaerobic conversion of MSW to methane (Augenstein and Pacey, 199 1 ; Augenstein, 1992) to about 50% (Morelli, 1990). Added water also increases the rate at which the methane is released (Bogner, 1992). "Stimulation" of landfills (i.e., addition of optimal quantities of water and nutrients) could potentially double methane production over the rate for unstimulated landfills (Bogner, 1992). At least five research projects on enhancing landfill gas production were under way in 199 1 ; the EPA allowed those landfills to use leachate recycling (Thornloe, 199 1 ).
Net Energy Balance
The net result over 20 years of active methane extraction and use is the difference between the production of energy (1.3 million to 2.4 million Btu per ton of MSW) and the energy required for landfill-associated operations (0.090 million to 0.280 million Btu per ton of MSW). The range then is 1 million to 2.3 million excess Btu recoverable per ton of MSW placed in a landfill. As noted, the energy is based on landfill operations only; the entire energy balance, consisting of collection, landfilling, and compaction, is discussed under "Integrated Strategy Example."
Given the extreme variability of a relatively uncontrolled process like gas generation in a landfill*, selecting a single value to represent generation or emissions for all landfills is useful only to provide a benchmark for comparisons with other technologies. To provide a sense of the magnitude of these releases and the net energy they could produce, this report presents estimates based on "reasonable" values cited in the literature. Other estimates, perhaps based on conditions at particular sites, can be substituted in the computerized data base to determine the effect of variations on the net energy balance for a given facility.
COST CONSIDERATIONS
Figure 6.3 shows U.S. landfill tipping fees by state. The New England, Great Lakes, and Atlantic and Pacific coastal states have the highest landfill tipping fees, and the Plains and southern states have the lowest fees. By state, landfill costs range from highs of $50-$ 150 per ton in New Jersey to lows of $3-$5 per ton in South Dakota. The higher costs in some states result from the scarcity of suitable landfill sites, dense population concentrations in metropolitan areas, tighter state environmental regulations, fees, and higher transportation and labor costs. Cost variations from state to state and region to region can strongly influence the degree of desirability of choosing alternative strategies for MSW management.
* That is, landfill gas release is uncontrolled by comparison with energy and emissions releases in a combustor, which vary in a predictable fashion with the chosen operating conditions.
98
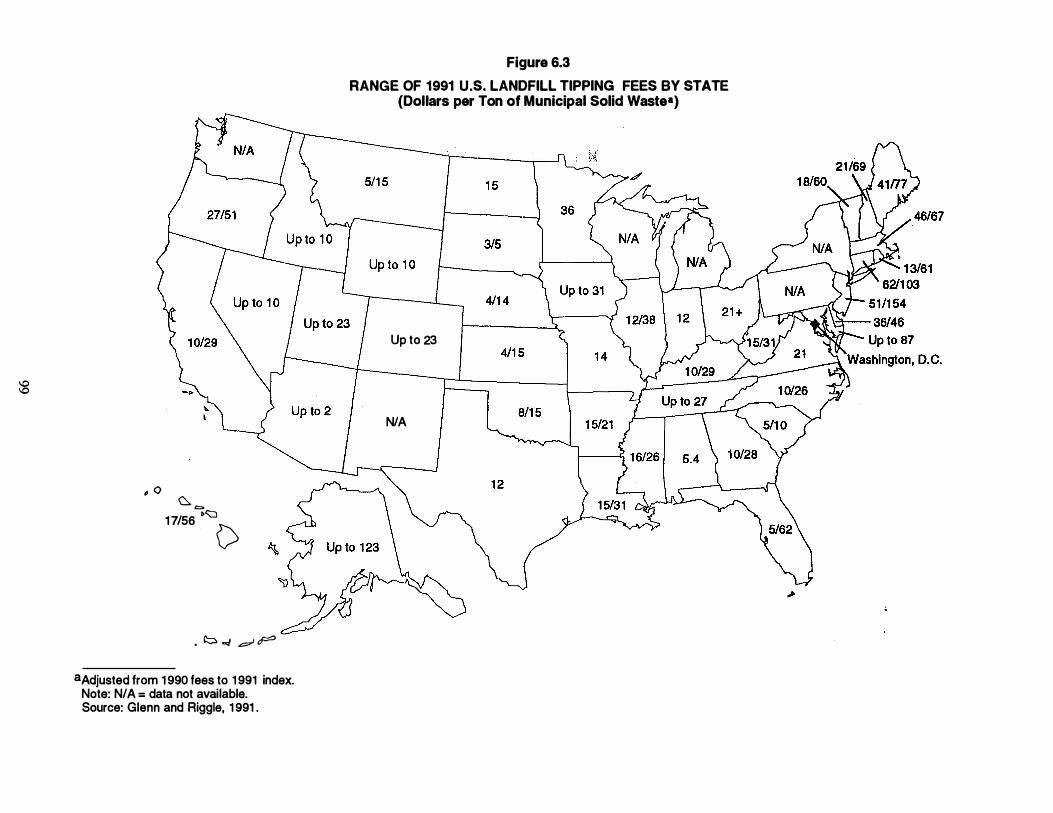
1.0 1.0
� 0 � c::.
�� 1 7/56 0
. � -� � p
a Adjusted from 1 990 fees to 1 991 index. Note: N/A = data not available. Source: Glenn and Riggle, 1 991 .
Figure 6.3
RANGE OF 1991 U.S. LANDFILL TIPPING FEES BY STATE {Dollars per Ton of Municipal Solid Waste•)
Up to 23
N/A
,J>
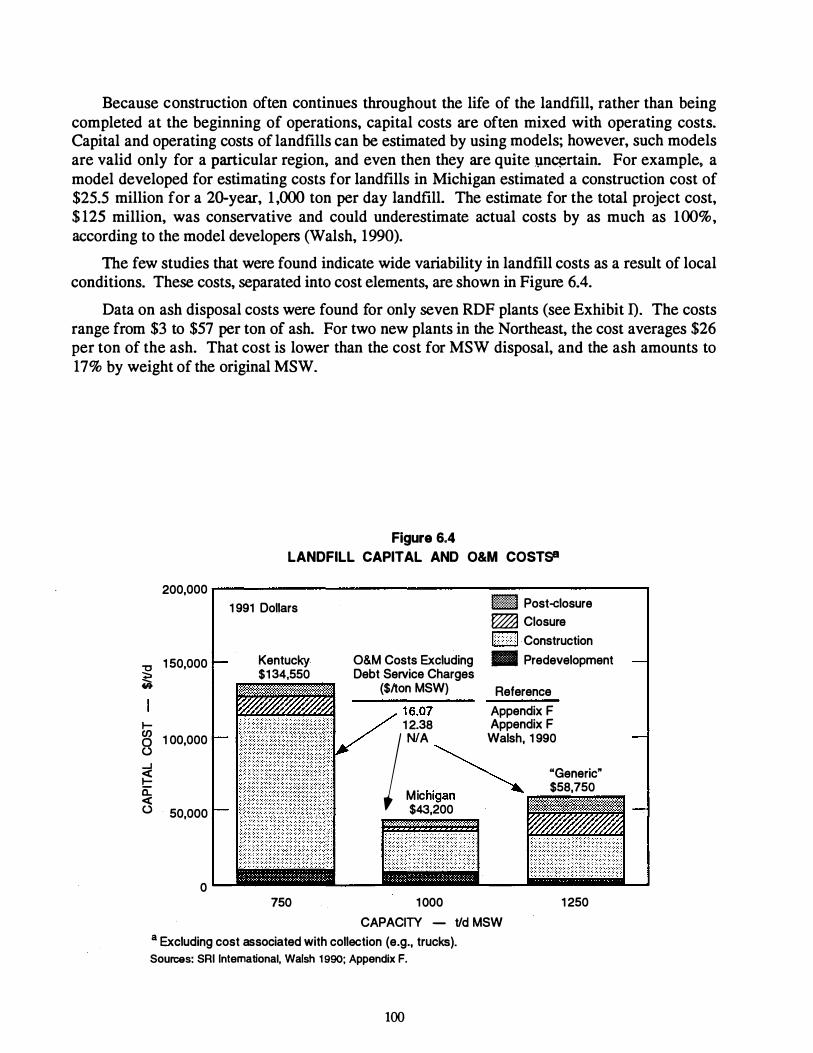
Because construction often continues throughout the life of the landfill, rather than being completed at the beginning of operations, capital costs are often mixed with operating costs. Capital and operating costs of landfills can be estimated by using models; however, such models are valid only for a particular region. and even then they are quite \}n�rtain. For example. a model developed for estimating costs for landfills in Michigan estimated a construction cost of $25.5 million for a 20-year, 1 ,000 ton per day landfill. The estimate for the total project cost, $ 125 million, was conservative and could underestimate actual costs by as much as 100%, according to the model developers (Walsh, 1990).
The few studies that were found indicate wide variability in landfill costs as a result of local conditions. These costs, separated into cost elements, are shown in Figure 6.4.
Data on ash disposal costs were found for only seven RDF plants (see Exhibit n. The costs range from $3 to $57 per ton of ash. For two new plants in the Northeast, the cost averages $26 per ton of the ash. That cost is lower than the cost for MSW disposal, and the ash amounts to 17% by weight of the original MSW.
"C � �
t-en 0 (.) ....J <( t-a: <( (.)
Figure 6.4 LANDFILL CAPITAL AND O&M COSTs&
200,000 r-------------------------, �iii� Post-closure l?'f}l1 Closure
1 991 Dollars
1 50,000 Kentucky $1 34,550
1 00,000
50,000
0
k > I Construction O&M Costs Excluding Ill Predevelopment Debt Service Charges
($/ton MSW) Reference Appendix F
1 2.38 Appendix F
I NIA Walsh, 1 990
� "Generic" M. h'- -- � $58,750 1c 1gan $43,200
750 1 000 CAPACITY - tid MSW
a Excluding cost associated with collection (e.g., trucks). Sources: SRI International, Walsh 1 990; Appendix F.
1 250
100

ENVIRONMENTAL RELEASES
This subsection presents the results of a life-cycle analysis of emissions. The bases are the same as those used for calculating the energy balance.
Air, land, and water all receive emissions from landfills. The time frame for regulatory concern is at least 30 years after the landfill is closed. Air emission rates slow after 8-40 years (Augenstein and Pacey, 199 1), but some air emissions and leachate production can be expected to continue for a century or more.
MSW Landfills
Air Emissions
Approximately 60-1 10 pounds of methane per ton of wet MSW will be formed in the landfill during the first 20 years. About 9-16 pounds of that gas will not be recovered, but will leak because of the limitations of the collection system and the permeability of the cover (FR, 199 1 t) into the atmosphere within that same period with at most a short delay.* The EPA estimates that 12 million tons per year of methane are released from U.S. landfills (FR, 1991b).
Environmental releases from landfills consist of uncaptured emissions of trace amounts of a variety of hazardous gases, as well as larger quantities of methane and of C02, which is generated in the landfill in volumes approximately equal to that for methane. These emissions occur both through leakage and through separation from the captured landfill gases. In addition, the EPA estimates that present landfills release 283,000 tons per year of nonmethane organic compounds (NMOCs)-or about 1% of U.S. stationary source emissions (FR, 199 1b). Table 6.2 presents analyses of landfill gases.
New proposed regulations for air emissions from landfills (FR, 1991t) will increase the number of landfills that actively recover gas. As mentioned, 157 landfills already operate or are planning to operate landfill-gas-to-energy projects, and about 87 of the 930 new landfills that are projected to begin operations between 1992 and 1997 will include gas recovery in response to the new regulations. The EPA predicts that larger landfills expected to remain in operation over the next 10 years will also add gas recovery operations as a result of the regulations (FR, 1991t).
By regulation, leachate must be captured and treated because it can contaminate groundwater. If leachate is treated by spraying or recirculated by spraying it on the working face, some of the volatile organic materials it contains are likely to be released intact to the atmosphere. If the leachate is treated in a sewage treatment plant, the normal first step is to aerate the waste, and many of the organic materials may be volatilized at that point, without being decomposed. No estimates of these releases were found; data on releases derived from leachate treatment are needed.
Water Emissions
For approximately 30 years after closure, leachate must be captured and treated, and nearby groundwater must be monitored. After 30 years, monitoring can stop if measured concentrations
* That estimate is based on the following assumptions: (1) methane generation of 1-1 .8 standard cubic feet per dry pound of MSW, (2) 30% moisture, and (3) 85% capture.
101
of specified pollutants are found to be less than regulated limits (FR, 199 1q). However, leaching caused by the infiltration of rainwater will continue.
The EPA has developed a computer model (Hydrologic Evaluation of Landfill Performance-HELP) to predict the amount of rain that will run off or evaporate from the cover of the landfill. This model also estimates the amount that will enter the landfill, as well as the proportion that will leak through the bottom liner into the ground below (O'Leary and Walsh, 199 1 ).
Table 6.2 shows the amounts of materials that could leach over 20 years (the time span used in this study) into the portion of leachate that is collected for treatment, as well as the portion that would pass through the liner into the ground below. These data are based on concentrations reported by O'Leary and Walsh (1991) and on landfill volume and area requirement data for Will County, lllinois (Patrick Engineering, 1991), together with estimates of average concentrations of leachate from an MSW landfill. The information is based on limited data, particularly on the range of concentrations of metals in the leachate over long periods, and it needs to be supplemented by other studies to provide a realistic range.
Land Use
Typical landfills are 50 feet deep with a density of 50,000 tons per acre. Larger landfills can be as deep as 100 to 250 feet and can have capacities of more than 10 million tons (FR, 199 1p). After a landfill reaches design capacity, it is covered with compacted clay to prevent the infiltration of water. Because federal and state regulations require gas control, such systems are often installed as sections of the landfill are completed. After a landfill is closed, restricted uses of the land over the landfill (e.g., for parks, recreational facilities) can begin almost immediately. Because of settlement and possible gas leakage, some sources have estimated that 30 to 50 years will be needed before unrestricted use of the land (e.g., for housing, industrial and commercial facilities) will be possible (Vesilind et al., in press). In general, closed landfills are most suitable for growing grasses and similar plants with shallow root systems. Special care is required for growing trees. Buildings may be installed in areas where land values are high, but special construction techniques are required (Walsh, 1992).
Ash Monofills
If MSW is burned instead of landfilled, the ash from combustion is normally landfilled. The ash can range from about 17% of the weight of refuse-derived fuel (RDF) that is burned to about 24% of the weight of MSW burned in a mass combustion plant Because the density of the ash is much higher than the density of compacted landfill, the space required for the ash amounts to about 10% of the space the original MSW would require (FR, 199 1 a; also calculated from Patrick Engineering, 1991). Some constituents of the ash are shown in Table 6.3.
Current landfill regulations make no distinction between construction and operation of landfills for MSW or for ash (CFR, 1991c). In practice, ash is often disposed of in landfills that accept ash only (called ash monofills) because the metals in the ash leach more readily under acid conditions, and one phase of a normal landfill decomposition reaction of MSW creates acids. In a monofill, no acids are generated, and metal dissolution is retarded.
102
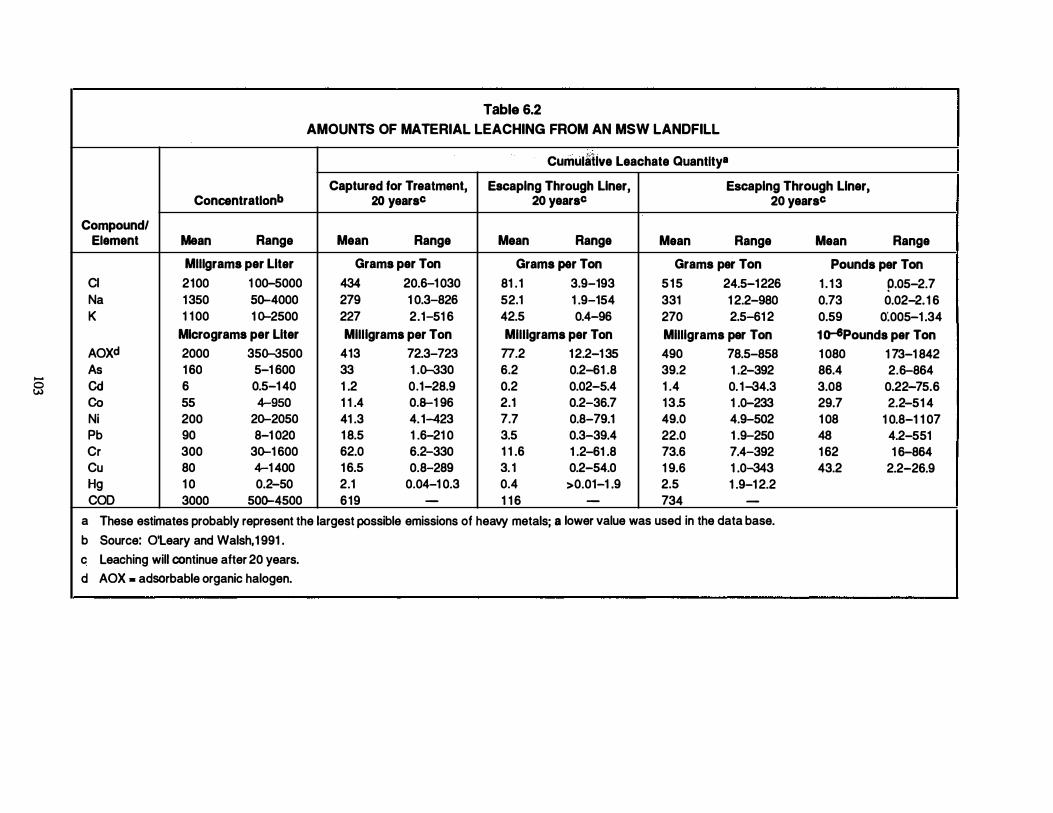
......
8
Table 6.2 AMOUNTS OF MATERIAL LEACHING FROM AN MSW LANDFILL
Cumulative Leachate Quantity•
Captured for Treatment, Escaping Through Liner, Escaping Through Liner, Concentratlonb 20 yearsc 20 yearsc 20 yearsc
Compound/ Element Mean Range Mean Range Mean Range Mean Range Mean Range
Mlllgrams per Liter Grams per Ton Grams per Ton Grams per Ton Pounds per Ton Cl 2100 1 00-5000 434 20.6-1 030 81 . 1 3.9-193 5 1 5 24.5-1 226 1 . 1 3 p.05-2.7
Na 1 350 So-4000 279 1 0.3-826 52.1 1 .9-154 331 1 2.2-980 0.73 0.02-2. 1 6
K 1 1 00 1 0-2500 227 2.1-51 6 42.5 0.4-96 270 2.5-61 2 0.59 0'.005-1 .34
Micrograms per Liter Milligrams per Ton Milligrams per Ton Milligrams per Ton 1o-6Pounds per Ton AOXd 2000 350-3500 413 72.3-723 n.2 1 2.2-1 35 490 78.5-858 1 080 1 73-1 842
As 1 60 5-1 600 33 1 .0-330 6.2 0.2-61 .8 39.2 1 .2-392 86.4 2.6-864
Cd 6 0.5-1 40 1 .2 0.1-28.9 0.2 0.02-5.4 1 .4 0. 1-34.3 3.08 0.22-75.6
Co 55 4-950 1 1 .4 0.8-1 96 2.1 0.2-36.7 1 3.5 1 .0-233 29.7 2.2-51 4
Ni 200 20-2050 41 .3 4. 1-423 7.7 0.8-79.1 49.0 4.9-502 1 08 1 0.8-1 1 07
Pb 90 8-1 020 1 8.5 1 .6-21 0 3.5 0.3-39.4 22.0 1 .9-250 48 4.2-551
Cr 300 30-1 600 62.0 6.2-330 1 1 .6 1 .2-61 .8 73.6 7.4-392 1 62 1 6-864
Cu 80 4-1 400 1 6.5 0.8-289 3. 1 0.2-54.0 1 9.6 1 .0-343 43.2 2.2-26.9
Hg 1 0 0.2-50 2.1 0.04-1 0.3 0.4 >0.01-1 .9 2.5 1 .9-1 2.2
COD 3000 50o-4500 619 - 1 1 6 - 734 -
a These estimates probably represent the largest possible emissions of heavy metals; a lower value was used in the data base. b Source: O'Leary and Walsh, 1 991 .
c Leaching will continue after 20 years. d AOX • adsorbable organic halogen.
-- �----·- -------
I

The current EPA regulations (CFR, 1991c) require:
1 . Measurement of the effect of the leachate on the groundwater at a "relevant point of compliance"
2. Maintenance of the quality of the groundwater at a level sufficient for its intended use, taking into account the natural background levels of salinity and pollutants (CFR, 1991c).
Air Emissions
No studies on air emissions from ash monofills were located. Air emissions from monof:tlls will be lower than those from MSW landfills because ash contains very low concentrations of biodegradable organics, or none at all.
Other possible air emissions could result: (1) from organic materials adsorbed on the carbon that occurs in flyash, particularly RDF flyash; and (2) possibly from mercury that is initially absorbed on the flyash, the scrubber lime, or the carbon. The opinion is becoming more prevalent that the carbon in flyash actively adsorbs organic materials and metals from flue gas (ICF, 1991).
Although more than 30 species or organic materials, dioxins, furans, and polychlorinated biphenyls (PCBs) have been detected at low levels in flyash, as shown in Table 6.3, they are not particularly volatile and adsorb strongly to materials (Jones, 199 1 ; Rigo, 199 1).
Although mercury has been reported to evaporate from ash samples collected from MSW baghouses (in Germany) while the samples were stored in laboratories, no reports on metal emissions from ash monofills were found (Bergstrom, 1986).
Water Emissions
Overall, for each single ton of original MSW at the curb, the leachate from ash monofills appears to be much smaller in volume than that from normal landfills. For landfills of equal depth, the difference is a consequence of the smaller volume and surface area occupied by the ash monofill; the smaller area receives less rain that could become leachate.
Because of its alkalinity, the leachate from an ash monofill also appears to have lower metal concentrations than the leachate from a raw MSW landfill. Combustors that use lime for acidgas control create a residue that causes the ash to harden; the lime apparently further reduces the leaching potential of the ash (Varello, 1992). However, these conclusions are based on extremely limited data, and no ash monofills have been monitored over a long period, although such studies are under way (Roffman, 1992). No study was found that considered the effect of hardening of the ash on the amount of leachate that passes through an ash monofill and is either captured in a collection system or escapes through the liner.
Ash derived from burning MSW contains virtually all the metals that were originally present in the waste. The low levels of organic materials present in the ash could dissolve in the leachate. The composition of the leachate resulting from rain on a monofill is shown in Table 6.4. The single study of ash monofills on which Tables 6.3 and 6.4 are based found that levels of metals and organic materials in the ash were extremely low (Roffman, 1992).
105
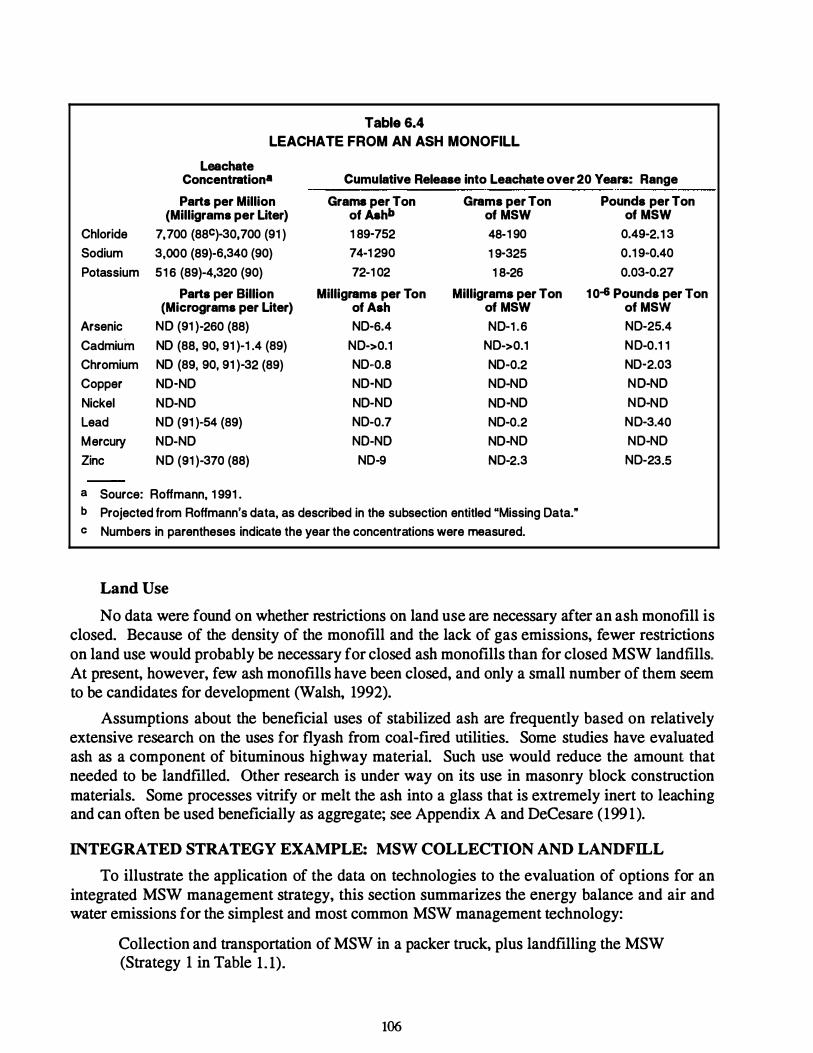
Table 6.4 LEACHATE FROM AN ASH MONO FILL
Leachate Concentration• Cumulative Release into Leachate over 20 Years: Range
Chloride Sodium Potassium
Arsenic Cadmium Chromium Copper Nickel Lead Mercury Zinc
Parts per Million (Milligrams per Liter)
7, 700 (88C)-30, 700 (91 ) 3,000 (89)-6,340 (90) 51 6 (89)-4,320 (90)
Parts per Billion (Micrograms per Liter)
NO (91 )-260 (88) NO (88, 90, 91 )-1 .4 (89) NO (89, 90, 91 )-32 (89) NO-NO NO-NO NO (91 )-54 (89) NO-NO NO (91 )-370 (88)
a Source: Rottmann, 1 991 .
Grams per Ton Grams per Ton of Ashb of MSW 1 89-752 48-1 90 74-1 290 1 9-325 72-1 02 1 8-26
Milligrams per Ton Milligrams per Ton of Ash of MSW N0-6.4 ND-1 .6
ND->0.1 N0->0.1 ND-0.8 ND..0.2 NO-NO NO-NO NO-NO NO-NO ND-0.7 N0-0.2 NO-NO NO-NO ND-9 ND-2.3
b Projected from Rottmann's data, as described in the subsection entitled "Missing Data." c Numbers in parentheses indicate the year the concentrations were measured.
Land Use
Pounds per Ton of MSW
0.49-2.1 3 0.1 9..0.40 0.03..0.27
1 0-6 Pounds per Ton of MSW N0-25.4 ND-0.1 1 ND-2.03 NO-NO NO-NO N0-3.40 NO-NO N0-23.5
No data were found on whether restrictions on land use are necessary after an ash monofill is closed. Because of the density of the monofill and the lack of gas emissions, fewer restrictions on land use would probably be necessary for closed ash monofills than for closed MSW landfills. At present, however, few ash monofills have been closed, and only a small number of them seem to be candidates for development (Walsh, 1992).
Assumptions about the beneficial uses of stabilized ash are frequently based on relatively extensive research on the uses for flyash from coal-fired utilities. Some studies have evaluated ash as a component of bituminous highway material. Such use would reduce the amount that needed to be landfilled. Other research is under way on its use in masonry block construction materials. Some processes vitrify or melt the ash into a glass that is extremely inert to leaching and can often be used beneficially as aggregate; see Appendix A and DeCesare ( 199 1 ).
INTEGRA TED STRATEGY EXAMPLE: MSW COLLECTION AND LANDFll..L
To illustrate the application of the data on technologies to the evaluation of options for an integrated MSW management strategy, this section summarizes the energy balance and air and water emissions for the simplest and most common MSW management technology:
Collection and transportation of MSW in a packer truck, plus landfilling the MSW (Strategy 1 in Table 1 . 1).
106
Table 6.5 shows the energy balance and emissions that result from this strategy. In the table, the energy and emissions for collecting MSW and transporting it to the landfill, the emissions from the landfill, and the energy recovered from the landfill gas and leachate are included.
Energy recovery is included in the example, although existing and proposed regulations do not require it. High efficiency in landfill gas· recovery is assumed for the analysis.
Both the energy requirements and the air emissions for MSW collection and landfill operation depend most strongly on the efficiency of truck use. Overall energy requirements for landfilling are low; therefore, when gas recovery is included, the strategy is a net energy producer of about 2 million Btu per ton of MSW over 20 years.
INTEGRATED STRATEGIES DESCRIBED IN THE DATA BASE
Each of the integrated strategies that includes any other major technology also includes landfilling. Thus, the calculation given here is repeated in each section that covers a major technology, to provide a basis for comparing the relative differences in energy use/recovery and emissions for the more complex strategies. Because an ash monofill cannot exist without some technology to combust the waste, the effects of ash monofills are included only with all the integrated strategies that include combustion.
The data base also allows landfilling to be integrated with any other selection of MSW strategies. Because all integrated strategies include landfilling, Exhibit IT and the computerized data base provide the calculations that have already been performed for all the integrated strategies listed in Table 1 . 1 in "Introduction."
MISSING DATA AND RESEARCH NEEDS
Sanitary landfilling technology has been studied extensively, and substantial quantities of data are available on many parameters. This subsection describes gaps in the data about emissions, especially water emissions from ash monofills, and energy balances that were identified during this study. Note that some of the data identified as "missing" in this subsection may actually exist; however, they were not found, and therefore are not reflected in this analysis. Many of the data identified as missing in this subsection would be helpful in refining the estimates presented in this report.
Emissions
Collection and Processing Equipment
No data (on a per ton of MSW transported) were found for the actual emissions generated by collection programs. Accordingly, information from a local community was used, and emissions were estimated on the basis of the fuel used.
No data were found on actual emissions during the construction and operation of landfills, including emissions from heavy equipment used for landfill compaction and operations and releases from MSW as it is compacted. Nor were data found on particulates and dust that may result from placing daily cover on landfills.
107
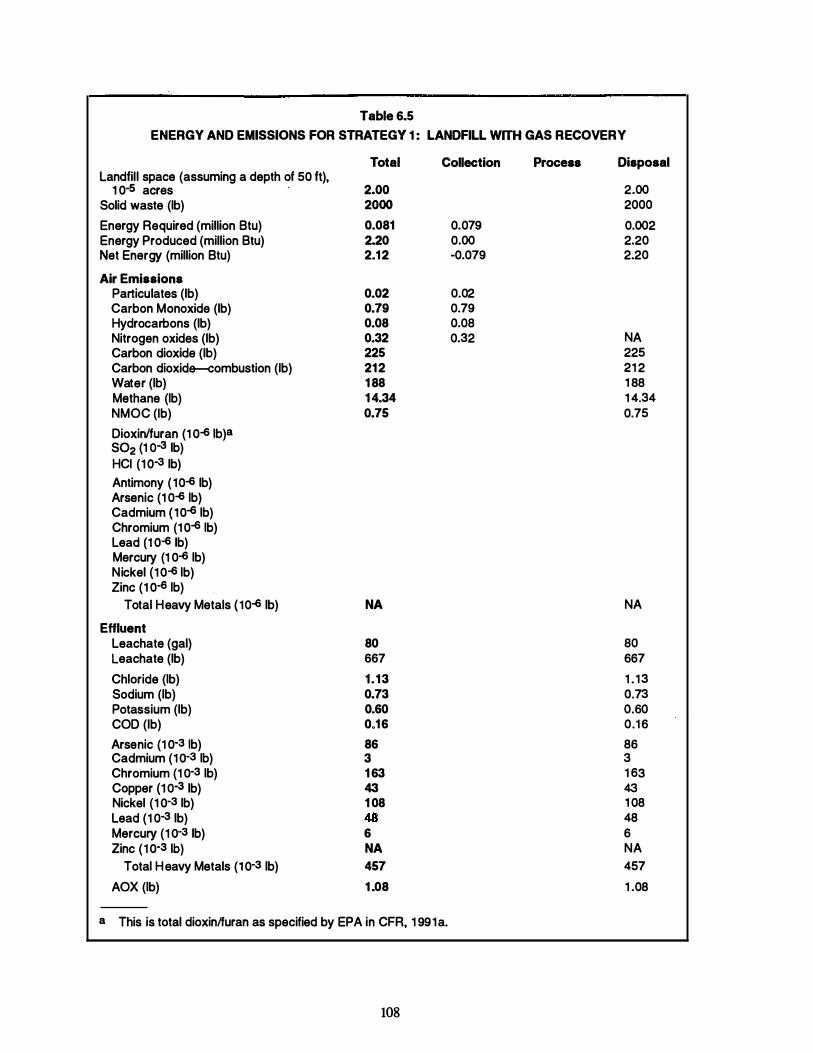
Table 6.5 ENERGY AND EMISSIONS FOR STRATEGY 1 : LANDFILL WITH GAS RECOVERY
Total Collection Landfill space (assuming a depth of 50 ft),
1 0-s acres ·
Solid waste (lb) Energy Required (million Btu) Energy Produced (million Btu) Net Energy (million Btu) Air Emissions
Particulates (lb) Carbon Monoxide (lb) Hydrocarbons (lb) Nitrogen oxides (lb) Carbon dioxide (lb) Carbon dioxide--<:ombustion (lb) Water (lb) Methane (Jb) NMOC (Ib) Dioxin/furan (1 0-6 Jb)a so2 (1 o-a lb) HCI (1 0-3 lb) Antimony (10-6 lb) Arsenic (1 0-6 Jb) Cadmium (10-6 Jb) Chromium (1 0-6 Jb) Lead (1 0-6 lb) Mercury (1 0-6 lb) Nickel {1 0-6 Jb) Zinc (1 0-6 Jb)
Total Heavy Metals {10-6 lb) Effluent
Leachate (gal) Leachate (lb) Chloride (Jb) Sodium (lb) Potassium (lb) COD (lb) Arsenic (1 0-3 1b) Cadmium (1 0-3 1b) Chromium (1 0-3 1b) Copper { 1 o-3 lb) Nickel (1 0-3 Jb) Lead (1 0-3 lb) Mercury (1 0-3 lb) Zinc (1 0-3 1b)
Total Heavy Metals (1 0-3 lb) AOX (lb)
2.00 2000
0.081 2.20 2.1 2
0.02 0.79 0.08 0.32 225 21 2 1 88 1 4.34 0.75
NA
80 667 1 . 1 3 0.73 0.60 0.1 6
86 3 1 63 43 1 08 48 6 NA 457
1 .08
a This is total dioxinlfuran as specified by EPA in CFR, 1 991a.
108
0.079 0.00 -0.079
0.02 0.79 0.08 0.32
Process Disposal
2.00 2000 0.002 2.20 2.20
NA 225 21 2 1 88 1 4.34 0.75
NA
80 667 1 . 13 0.73 0.60 0.1 6 86 3 1 63 43 1 08 48 6 NA 457 1 .08
Landfill Air Emissions
No data were found on actual emissions from spraying leachate at the working face of the landfill, or from aeration in leachate treatment or sewage treatment plants.
No data were found on changes in the composition of trace organic components in landfill gas over long periods.
Several sources stated or implied that dioxins have been measured in the emissions from combusting landflll gas. However, none of these sources provided quantitative data on those emissions.
Landfill Water Emissions
No data were found to document changes in composition of leachate over 20 years or longer for use in estimating whether metal and organic concentrations decline or remain roughly steady. Comparisons of leachate during a landfill's acidic stage and during its methane-generating stage
. . were found, but none of these data covered long periods. EPA data from the early 1970s analyzed leachate from the landfill types that were common at that time (Bogner, 1992). Those data might be useful for long-term comparisons.
Models .exist to help predict the amount of leachate that would penetrate the bottom liner of a landfill, but few data were found. No data were found on the amounts and composition of leachate from shredfill or balefill operations.
Long-term studies of leachate composition may eventually reflect the changing composition or the waste stream. The recent significant reductions of mercury in alkaline cells and the popularity of zinc-air cells as replacements for mercury batteries in hearing aids are examples of technological changes that will influence waste stream composition. Reduction of metals in inks is another example (Usherson, 1992). New laws in Europe and California also require elimination of lead from the 2 billion wine bottle caps produced each year that are made of lead (Andre and Karpel, 1991).
Ash Monotill Water Emissions
The amounts of metals and organic materials entering the ground below ash monofill liners have not been widely studied. Therefore, those estimates are based on fewer data than any other estimates presented in this section. The assumptions on which the estimates are based are discussed below, along with indication of gaps in the data.
Data are available on the composition of leachate from a closed monofill over 4 years, but not for the 20-year time frame of interest here. The data show that highly soluble materialspotassium, sodium, and chloride-appear in roughly the same concentrations each year (Roffman, 1992). By extrapolation, it is assumed that the leaching of those ions is at steady state, and that the leachate does not become saturated with them. However, all the heavy metals that were detected during 4 years of monitoring decreased sharply during the study period; therefore, it was assumed for the analysis reported here that the low levels noted in year 4 will be the maximum concentration for the next 1 6 years. That assumption is believed to be conservative.
It has been assumed that the depth of the monofill is the same as that for a regular MSW landfill. Very few design data on existing ash monofills were found.
109
The difference in volume between a raw MSW landfill and an ash monofill is known. To estimate the surface area on which rain will fall, it is necessary to assume a depth for the ash in the monofill. It has been assumed that the depths for both types of landfills are equal.
Data on MSW landfills provide estimates of the amount of rainfall on the closed, capped landfill surface that enters the landfill. The fraction of rainfall that is collected as leachate on the liner and the fraction that leaks into the ground below have also been estimated. Similar data for ash monofills were not found, and thus the proportions reported for raw MSW landfills were used for ash monofllls as well. However, if the ash in the monofill hardens, as is frequently reported, it would be unreasonable to assume that rates of infiltration or of percolation to the bottom of the monofill were the same as those for MSW landfills. Because data on the amount of leachate that escapes MSW landfills were applied to ash monofills in this analysis, the estimates of leachate escaping to the ground in this report are likely to be overstated, and the estimates of the amounts of metal that are released in leachate may be too large as well.
Energy
Few data were found on the energy requirements for collecting and landfilling MSW; those data that do exist are based on truck capacity rather than on the actual tonnage collected. Nor were actual energy data (on a per ton of MSW basis) found for ongoing landfill construction, filling, compacting, and covering.
110
7. MATERIALS COLLECTION, SEPARATION, AND RECYCLING
This section describes programs and processes to collect and separate recyclable material from waste and to recycle the separated materials into potentially useful products. The reusable materials that are most commonly recycled are newspaper, glass, aluminum and ferrous metals, plastic, and cardboard. The entire process that is needed for successful recycling consists of five steps:
• Separating reusable materials from other municipal waste, often at curbside, but sometimes at a central materials recovery facility
• Transporting and processing (including remanufacturing) the separated materials for use as replacements for virgin materials
• Managing the wastes from separation and recycling
• Returning the materials to beneficial use or to commerce, often as parts of other products
• Selling the recycled product to consumers (NSWMA, 199 1 ; Kiser, 1992).
Many different options are available for each of these steps. This section focuses mainly on the processes that a municipality can use to separate potentially recyclable materials from its waste stream because only collection and separation programs are operated under the direct control of a municipality. However, unless beneficial uses are found for the separated materials, separation is usually insufficient to reduce the amount of waste.
Four approaches to separation are common:
• Drop-off centers-Community members transport certain separated wastes (e.g., bottles, cans, newsprint) to a convenient site where the recyclables may ·
be cleaned before they are shipped to a processor or user. Grocery chains that accept or give credit for plastic and paper grocery bags and centers that dispense payments for beverages containers with deposit or redemption values are also functioning as drop-off centers.
• Curbside collection-Residents set out recyclable materials separated by type for pick up by the waste hauler in a compartmented truck.
• Mixed recyclable collection-Residents place all recyclables in a single bag and set the bags out with the trash for collection.
• Mixed waste separation-Normal MSW is manually and/or mechanically separated into recyclable materials at a central facility.
Materials recovery facilities (MRFs) are the newest separation tool, and they are being implemented more rapidly than any other method for solid waste management. MRFs can be broadly defined as the plants where recyclables are separated and consolidated for shipment. In this section, the term "MRF' refers to a facility that receives separated materials for further processing. The term "mixed waste MRF" refers to a facility that accepts raw refuse (trash,
1 1 1
MSW) and manually or mechanically separates recyclable materials from it. (The residue could be landfilled, mass burned, or processed with RDF.) In addition, plants that prepare RDF can be considered as facilities that separate recyclable material.
One reason for adding material recovery systems is to meet the U.S. Environmental Protection Agency's (EPA's) goal of voluntarily reducing the quantity of MSW by 25% by 1992 through source reduction and recycling. Many states have translated those goals into regulations mandating recycling. Another objective of recycling is to provide an economic benefit by reducing the use of virgin materials and the consumption of process energy. Other expectations for recycling include reducing emissions from disposal and extending landfill life. Either sourceseparation with processing at an MRF or mixed-waste processing can help to reduce the amount of material that ends up in a landfill.
TECHNOLOGY DESCRIPTION
Collection Options
Three of the four approaches for separation of reusable materials from MSW begin with collection of the waste. Source-separated materials can be collected in several ways. One common approach is to collect the separated materials in a truck with compartments designed to segregate the various types; a second truck stops at the same locations to pick up the remaining MSW. In another variation, called blue bag, the generator of the waste can bundle all the "recyclable material" together in one (blue) plastic bag and set it out with the rest of the MSW. One packer truck is used to collect both the blue bag and the remaining MSW, and the blue bag is sent to a facility for further separation of the contents.
Processing Options
After reusable materials are collected, they can be taken to an MRF for processing to make them suitable for recycling and remanufacture into useful products. The processing facilities can be loosely categorized as low-technology or high-technology. About one-half of all operating and planned MRFs are "high-technology" facilities (Berenyi and Gould, 1990).
'
A low-technology MRF is a facility that relies mainly on manual labor to separate the collected material into individual components. These facilities usually consist of a series of belt conveyors from which materials are removed by hand. Mechanical separation is often limited to magnetic separation of ferrous metal and volume reduction equipment such as a baler, a glass crusher, and an aluminum can flattener/blower.
A high-technology MRF supplements manual labor with screens, magnetic separators, air classifiers, shredders and balers, and sometimes with eddy current separators (Savage and Diaz, 1990). Figure 7.1 shows a high-technology MRF. The separated products from a facility of this type could include corrugated boxboard, ferrous metals, aluminum, plastic film, high-density polyethylene (HDPE) and polyethylene terephthalate (PET) containers, and sometimes product components such as household and automobile batteries (see Appendix E).
112
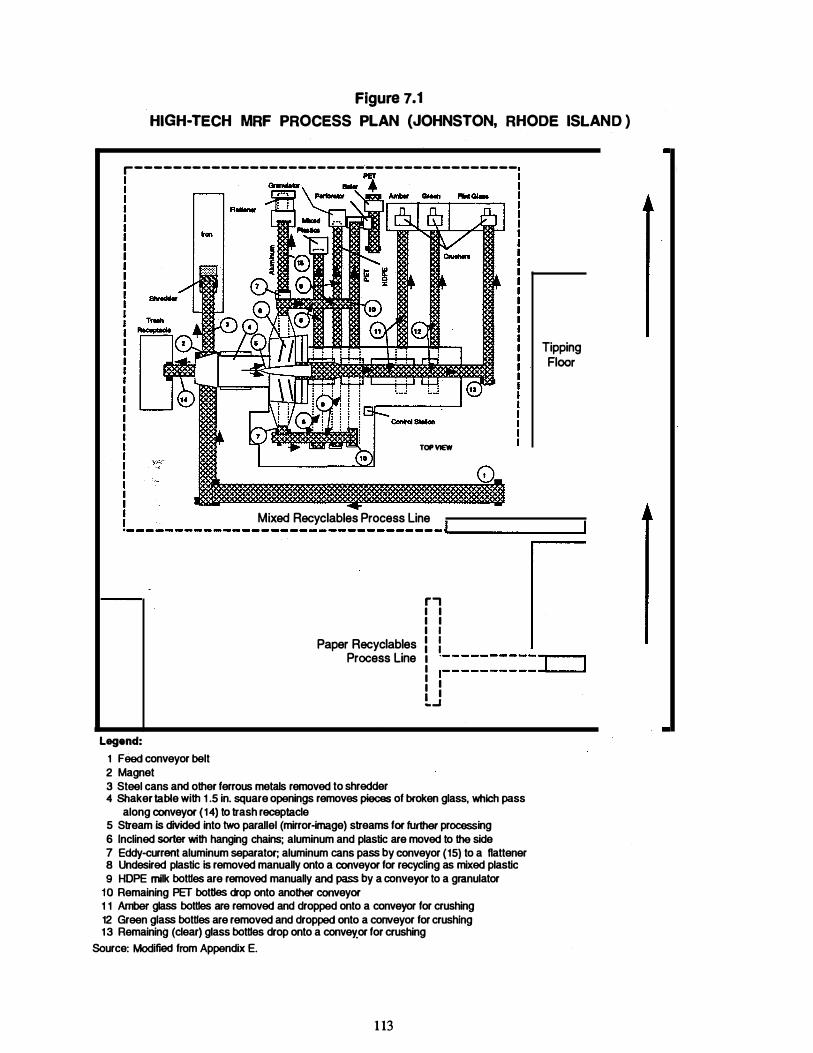
Figure 7.1
HIGH· TECH MRF PROCESS PLAN (JOHNSTON, RHODE ISLAND )
r----------------------------------------
TOP VIEW
Mixed Recyclables Process Line
Tipping Floor
------- - - ------------------------ «------------1
Legend: 1 Feed conveyor belt 2 Magnet
Paper Recyclables Process Line
3 Steel cans and other ferrous metals removed to shredder
r, I I I I I I I I I I I · - - - - - - - - - - -,----,
I �----------_.J _ __, I I I I t.�
4 Shaker table with 1 .5 in. square openings removes pieces of broken glass, which pass along conveyor (14) to trash receptacle
5 Stream is divided into two parallel (mirror-image) streams for further processing 6 Inclined sorter with hanging chains; aluminum and plastic are moved to the side 7 Eddy-current aluminum separator; aluminum cans pass by conveyor (15) to a flattener a Undesired plastic is removed manually onto a conveyor for recycling as mixed plastic 9 HOPE milk bottles are removed manually and pass by a conveyor to a granulator
10 Remaining PET bottles drop onto another conveyor 1 1 Amber glass bottles are removed and dropped onto a conveyor for crushing 12 Green glass bottles are removed and dropped onto a conveyor for crushing 13 Remaining (clear) glass bottles drop onto a convev.or for crushing
Source: Modified from Appendix E.
1 13
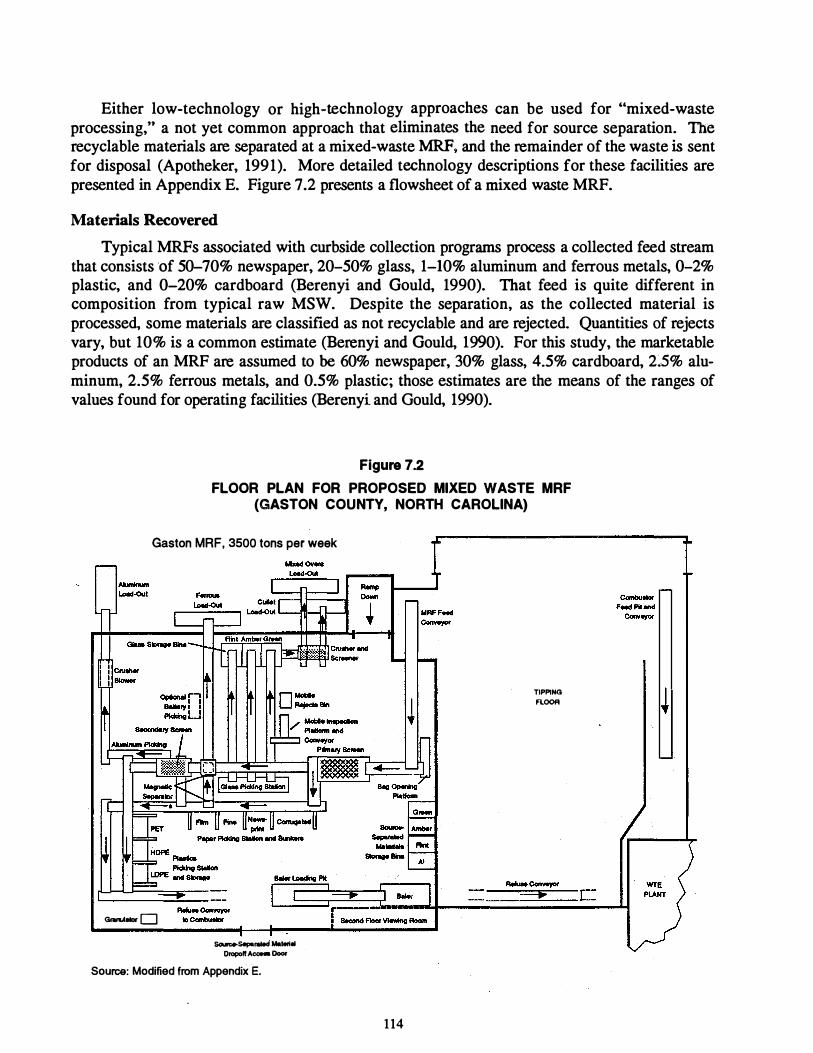
Either low-technology or high .. technology approaches can be used for "mixed-waste processing," a not yet common approach that eliminates the need for source separation. The recyclable materials are separated at a mixed-waste MRF. and the remainder of the waste is sent for disposal (Apotheker, 1991). More detailed technology descriptions for these facilities are presented in Appendix E. Figure 7.2 presents a flowsheet of a mixed waste MRF.
Materials Recovered
Typical MRFs associated with curbside collection programs process a collected feed stream that consists of 50-70% newspaper, 20-50% glass, 1-10% aluminum and ferrous metals, 0-2% plastic, and 0-20% cardboard (Berenyi and Gould, 1990). That feed is quite different in composition from typical raw MSW. Despite the separation, as the collected material is processed, some materials are classified as not recyclable and are rejected. Quantities of rejects vary, but 10% is a common estimate (Berenyi and Gould, 1990). For this study, the marketable products of an MRF are assumed to be 60% newspaper, 30% glass, 4.5% cardboard, 25% aluminum, 2.5% ferrous metals, and 0.5% plastic; those estimates are the means of the ranges of values found for operating facilities (Berenyi and Gould, 1990).
Figure 7.2
FLOOR PLAN FOR PROPOSED MIXED WASTE MRF (GASTON COUNTY, NORTH CAROLINA)
Gaston MRF, 3500 tons per week
G<onul.a D so.-�- Maloriol
Dropoft A- Door
Source: Modified from Appendix E.
114
TIPPING FLOOR
=+ c:
COMMERCIAL STATUS
Regulatory Stimulus for Recycling
As of 1990, 38 states had enacted recycling laws. Unlike laws aimed at protecting human health and the environment by specifying how a disposal method must operate (e.g., by requiring emission controls on combustors and landfills), recycling laws attempt to reduce the need for the other disposal options by specifying required levels of reduction, separation, and diversion. More than 20 states requi� or set goals for separation of recyclable materials from MSW. As of 1990, 40 states had passed laws to encourage state agencies to purchase products with recycled content. Other laws intended to implement source reduction (which is outside the scope of this study) include requirements for alterations in the composition of products that eventually become waste (see Appendix E and NSWMA, 1991 ; Bullock and Salvador, 1990).
At the municipal level, federal goals and state laws have increased interest in recycling programs. Municipalities have been implementing collection and separation programs at a rapid rate. The number of operating programs increased by 80% in 1990, to 2,700 curbside collection programs; the National Solid Waste Management Association (NSWMA) estimates that 3,500 curbside collection programs were operating in 1991 (Allen, 1992).
Prevalence of MRFs
As of 1991 , 35 MRFs were operating in the United States, and plans for another 64 had been announced (ICF Inc., 1991). Exhibit I provides more detailed information on these facilities. The capacity of existing MRFs that sort collected materials, whether mixed or separately collected, averages 89 tons per day; planned facilities are larger, averaging 162 tons per day. The design capacity of all existing MRFs totals about 1 million tons per year. If all those facilities were operated at 100% of capacity, the need for new landfill space would be reduced by about 1 % (SRI calculations based on Appendix E; Berenyi and Gould, 1990; Franklin Associates, 1990). The amount of material diverted from landfills by recycling programs that do not include MRFs is unknown.
Percentage of Waste Being Recycled
Extensive confusion exists about the amount of recycling that is being done, the role that recycling plays in managing MSW, and the extent to which community-based recycling programs help to reduce the amount of waste to be handled in other ways. To put these. issues in context, it is important to briefly review the various segments of the recycling industry.
The oldest, largest segment is the secondary materials and scrap industry, which handles old cars, railroad scrap, shipbreaking, textile waste, paper, and similar products. Industry participants consist mainly of large companies and entrepreneurs that buy cardboard, plastic film, used pallets, and other waste or scrap from commercial businesses such as grocery stores and warehouses, printers, and shops. They recycle nearly 100 million tons per year of metals, glass, paper, plastics, fiber, and other materials. That amount includes about 1 .3 million tons of aluminum scrap (other than used aluminum cans), 29 million tons of paper, and 26 million tons of "old" ferrous scrap (Business Recycling Coalition, 1991). Materials recycled by such companies are outside the scope of this report because although they recycle separated materials, they are not managing MSW.
115
The next largest segment consists of state programs established in response to bottle depositand redemption laws that require cash payments for returned containers. For purposes of this study, it has been assumed that individual communities do not have the option of establishing such laws for their own jurisdictions alone.
The third segment of the industry consists of the types of programs that a community can implement, including dropoff centers, curbside collection, mixed waste processing, and RDF preparation. Such community-controlled programs are the focus of this section.
The statistics that are reported about recycling often fail to distinguish clearly among these segments, and they can be quite misleading when applied to a community. For example:
• A widely quoted Franklin Associates study (Franklin Associates, 1990b) indicates that 13% of the MSW generated in the United States is recycled. That estimate would indicate that recycling is comparable to combustion (17%) as a major technology for waste management. However, that percentage includes not only curbside pickup, buy-back centers, drop-off sites. MRFs, and mixed waste recycling, but also bottles returned for redemption values in response to "bottle bills," commercial enterprises that collect and recycle office paper, commercial cardboard recycling activities at large grocery and other commercial and industrial plants, and newsprint recycling performed by volunteer organizations. It also includes material such as compost that is recovered from the waste but used as landfill cover (Franklin Associates, 1990b).*
• Other studies indicate that 10% of MSW is recycled, but these include bottles returned for deposit and commercially collected cardboard and paper, as well as voluntarily separated materials, in MSW recycling statistics (OTA, 1988).
When the effectiveness of community-based collection and separation programs alone is considered, the picture is different, but equally confusing:
*
• Estimates prepared for various Northeastern states indicated a range of 2-9% by weight for materials either set out at the curb or taken to drop-off centers (White et al., 1990).
• Estimates based on studies of 24 curbside programs indicate that about 10-12% by weight of the waste stream was put out at the curb for collection as recyclables (Snow, 1989).
• One community reported rates of 32%, but the OTA noted that this percentage included construction debris, which is not normally included in estimates of MSW (OTA, 1988).
It is inappropriate to include compost that is used in a landfill in estimates of quantities recycled because the "recycled" material is not diverted from the landfill. California legislators showed awareness of that distinction in choosing incentives to encourage development of new commercial uses for the glass recovered in California's redemption program. The state pays a fee to organizations for each ton of glass that is used in ways that are likely to keep it out of a landfill. Using the glass as daily cover or as part of the compost for the final cover would not be considered to divert it from landfill, and thererfore would be ineligible for payment (California Beverage Container Act 14581.5).
1 16.
• A community in New Jersey reported recycling rates of 47%, but those quantities apparently included car bodies and white goods (Kiser, 1992).
• New York City uses "diversion rates" (i.e., the percentage of recyclable materials that is separated for collection) to measure the success of its programs. It achieved a milestone of 30% diversion in 1990. The 30% diversion translated to a 6% saving at the Fresh Kills landfill (Magnuson, 199 1).
In this study, the estimates of the effect of recycling on MSW management are based on the assumption that a community that offers curbside collection will be able to sustain collection of separated recyclables totaling 12% of its MSW by weight (Snow, 1989). Thus, 12% sustainable collection rates were used in the estimates of energy, emissions, and landfill savings used in the integrated strategy examples. In estimating energy requirements and emissions for collection and transportation, data for an actual community were used. In the model community used for estimating transportation requirements for the "Integrated System Example" later in this section, 6.5% of the MSW (by weight) was set out for curbside collection or dropped off at a recycling center. ·(Another 4.5% of the MSW was set out as yard waste for separate collection and com posting.)
If 12% o:( MSW by weight is diverted to an MRF, the volume of the compacted landfill required by a community is reduced by 9%. Because the life of a landfill is limited by volume, a 9% reduction in landfill volume extends the useful life of the landfill by 9% (SRI calculations based on Berenyi and Gould, 1990, and Franklin Associates, 1990).
Markets and Beneficial Uses
A typical curbside collection program would collect cardboard, newsprint, glass, and aluminum. For this study, it was assumed that all the recyclables collected and separated in an MRF are sold for reuse.* In the real world, markets for recyclable materials vary by region. Some regions have no markets for some of the recovered and separated products; in those cases, communities either fail to offer to collect the material-e.g., many communities in the Northeast do not collect tin cans (Waste Age, 1991)-or communities must pay potential users to accept them.
If no furnaces suitable for recycling green and amber glass into containers are located within an economic distance, alternative uses for the glass must be identified (Trombly, 199 1). Mixed paper, a material that can be easily recovered in an MRF, has very limited markets, and these traditional markets are not growing (Rushton, 1992; Morris, 1991). New uses will be needed. Similar difficulties have been encountered in finding markets for other types of recycled products.
ENERGY CONSIDERATIONS
This subsection presents the results of a life-cycle analysis of energy inputs and outputs over the 20-year time frame used in this study. The basis is 1 ton of MSW at the curb.
Determining how much energy is used, saved, or avoided through recycling requires a complex analysis. Energy requirements for the entire recycling process include not only those
* Those assumptions can be changed in the data base.
117
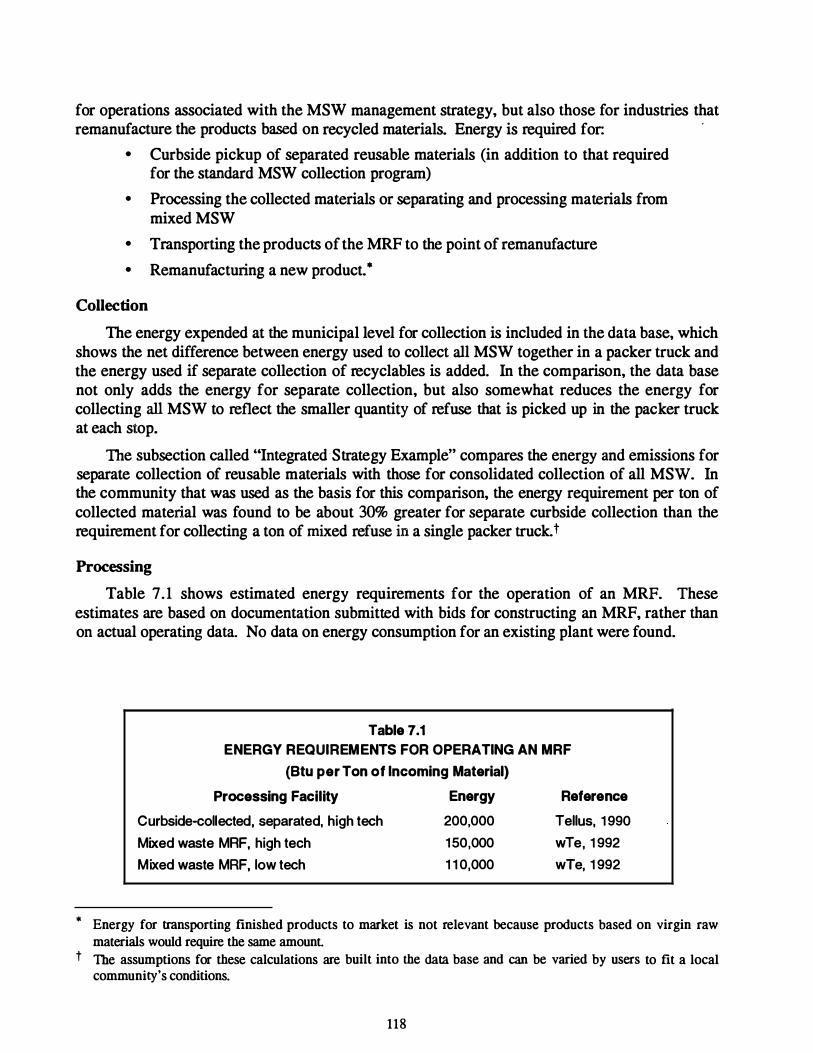
for operations associated with the MSW management strategy, but also those for industries that remanufacture the products based on recycled materials. Energy is required for:
·
• Curbside pickup of separated reusable materials (in addition to that required for the standard MSW collection program)
• Processing the collected materials or separating and processing materials from mixed MSW
• Transporting the products of the MRF to the point of remanufacture
• Remanufacturing a new product. •
Collection
The energy expended at the municipal level for collection is included in the data base, which shows the net difference between energy used to collect all MSW together in a packer truck and the energy used if separate collection of recyclables is added. In the comparison, the data base not only adds the energy for separate collection, but also somewhat reduces the energy for collecting all MSW to reflect the smaller quantity of refuse that is picked up in the packer truck at each stop.
The subsection called "Integrated ·Strategy Example" compares the energy and emissions for separate collection of reusable materials with those for consolidated collection of all MSW. In the community that was used as the basis for this comparison, the energy requirement per ton of collected material was found to be about 30% greater for separate curbside collection than the requirement for collecting a ton of mixed refuse in a single packer truck. t
Processing
Table 7. 1 shows estimated energy requirements for the operation of an MRF. These estimates are based on documentation submitted with bids for constructing an MRF, rather than on actual operating data. No data on energy consumption for an existing plant were found.
Table 7.1 ENERGY REQUIREMENTS FOR OPERATING AN MRF
(Btu per Ton of Incoming Material)
Processing Facility Energy Reference
Curbside-collected, separated, high tech 200,000 Tellus, 1 990
Mixed waste MRF, high tech 150,000 wTe, 1 992
Mixed waste MRF, low tech 1 1 0,000 wTe, 1 992
• Energy for transporting finished products to market is not relevant because products based on virgin raw materials would require the same amount.
t The assumptions for these calculations are built into the data base and can be varied by users to fit a local community's conditions.
118
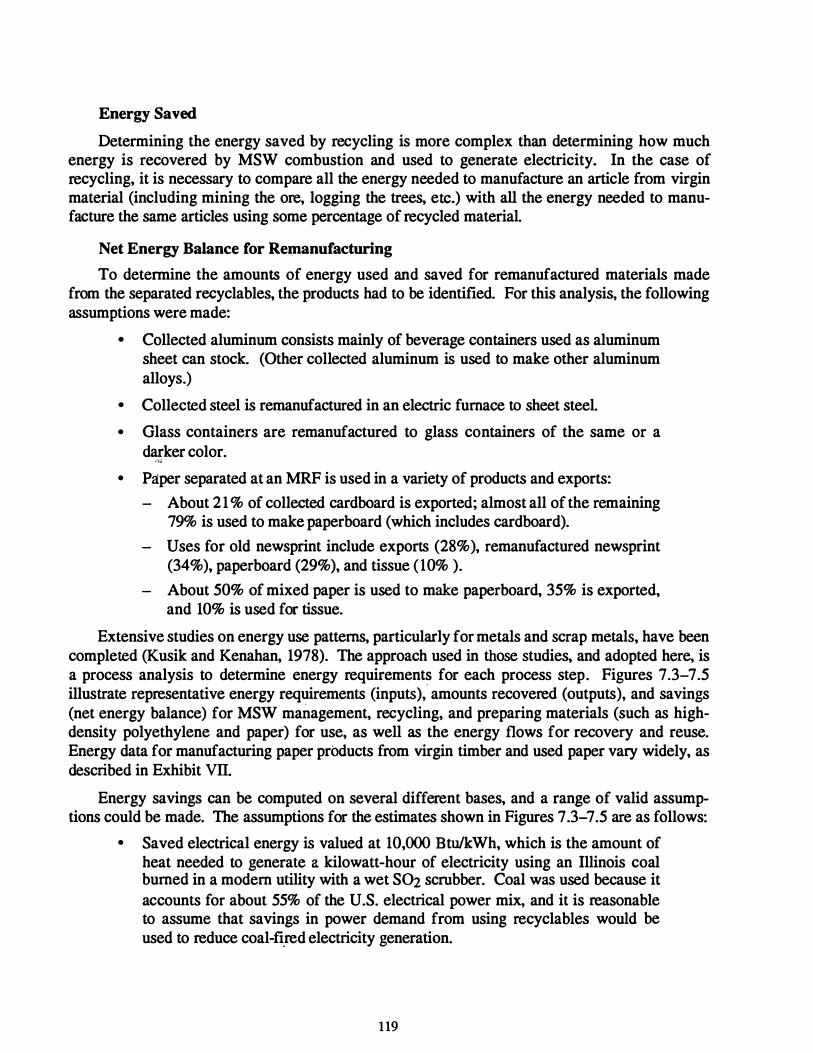
Energy Saved
Determining the energy saved by recycling is more complex than determining how much energy is recovered by MSW combustion and used to generate electricity. In the case of recycling, it is necessary to compare all the energy needed to manufacture an article from virgin material (including mining the ore, logging the trees, etc.) with all the energy needed to manufacture the same articles using some percentage of recycled material.
Net Energy Balance for Remanufacturing
To determine the amounts of energy used and saved for remanufactured materials made from the separated recyclables, the products had to be identified. For this analysis, the following assumptions were made:
• Collected aluminum consists mainly of beverage containers used as aluminum sheet can stock. (Other collected aluminum is used to make other aluminum alloys.)
• Collected steel is remanufactured in an electric furnace to sheet steel.
• Glass containers are remanufactured to glass containers of the same or a darker color.
•''<;J
• Paper separated at an MRF is used in a variety of products and exports:
- About 2 1 % of collected cardboard is exported; almost all of the remaining 79% is used to make paperboard (which includes cardboard).
- Uses for old newsprint include exports (28% ), remanufactured newsprint (34%), paperboard (29%), and tissue ( 10% ).
- About 50% of mixed paper is used to make paperboard, 35% is exported, and 10% is used for tissue.
Extensive studies on energy use patterns, particularly for metals and scrap metals, have been completed (Kusik and Kenahan, 1978). The approach used in those studies, and adopted here, is a process analysis to determine energy requirements for each process step. Figures 7.3-7.5 illustrate representative energy requirements (inputs),
" amounts recovered (outputs), and savings
(net energy balance) for MSW management, recycling, and preparing materials (such as highdensity polyethylene and paper) for use, as well as the energy flows for recovery and reuse. Energy data for manufacturing paper products from virgin timber and used paper vary widely, as described in Exhibit VII.
Energy savings can be computed on several different bases, and a range of valid assumptions could be made. The assumptions for the estimates shown in Figures 7.3-7.5 are as follows:
• Saved electrical energy is valued at 10,000 Btu/kWh, which is the amount of heat needed to generate a kilowatt-hour of electricity using an Illinois coal burned in a modern utility with a wet S{h scrubber. Coal was used because it accounts for about 55% of the U.S. electrical power mix, and it is reasonable to assume that savings in power demand from using recyclables would be used to reduce coal-fi.red electricity generation.
1 19
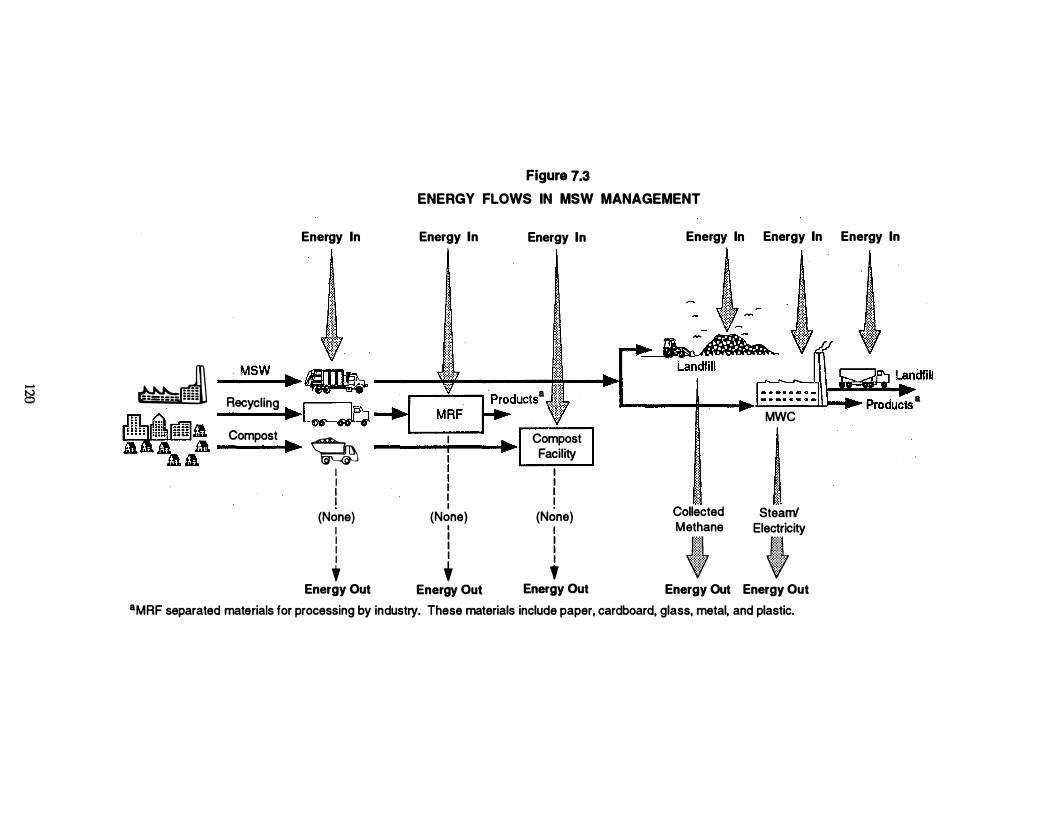
-�
Figure 7.3
ENERGY FLOWS IN MSW MANAGEMENT
Energy In Energy In Energy In
' j � -_M_s--tw ..... � � ··:::::::::·· a �tl P �" �ducts .J�lit Recycling ... . �� ''t'''' JTibrllill. r;ffi1
1 Compost �i Compost _. � i ., Facility I I I I
(None) I I I I •
Energy Out
I I I
(None) I I I I +
Energy Out
I I I I
(None) I I I I '
Energy Out
Energy In Energy In Energy In
l-- I I � · t ... Landfill �� Landfill
- · - · · - · - ... a - • -· · - · - Products MWC
I I . Collected Steam/ Methane f El
iity
Energy Out Energy Out
8MAF separated materials for processing by industry. These materials include paper, cardboard, glass, metal, and plastic.
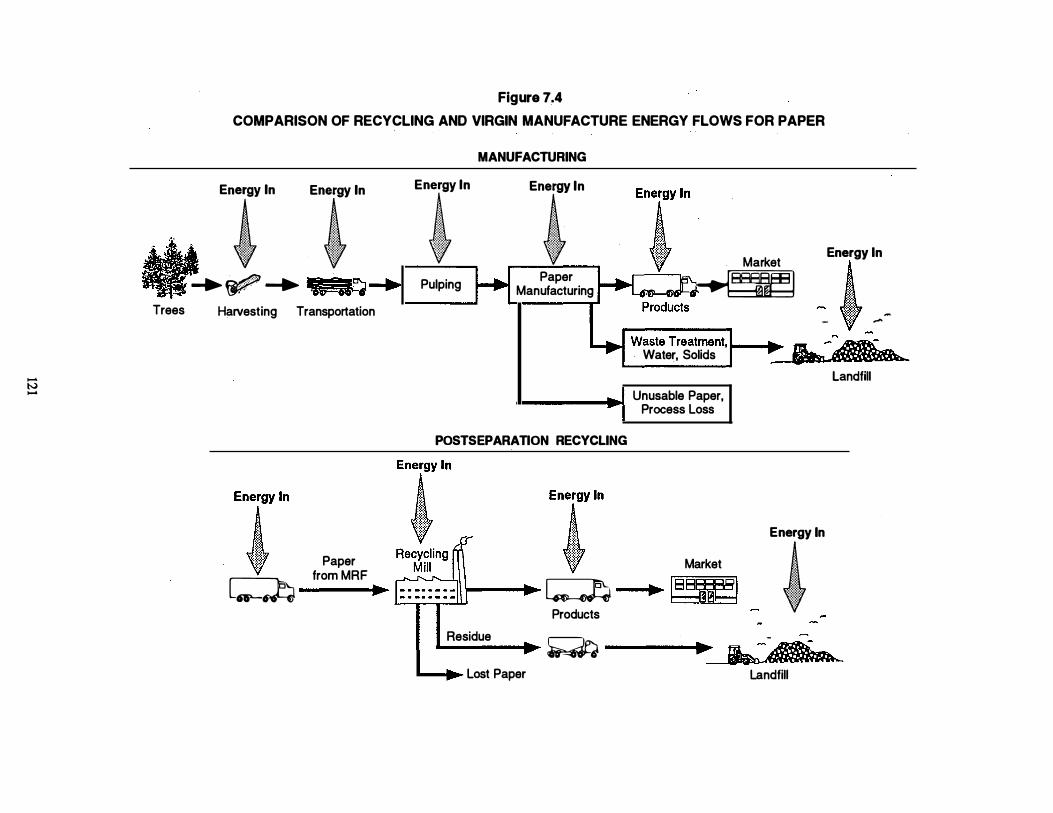
...... N ......
Figure 7.4 COMPARISON OF RECYCLING AND VIRGIN MANUFACTURE ENERGY FLOWS FOR PAPER
En� ln Enli:' ln
_.. � _. IICZ&EJ Trees Harvesting Transportation
Paper
Enf ln
Pulping
MANUFACTURING
Enf ln
Paper Manufacturing
POSTSEPARATION RECYCLING
Energy In
� 1 Market �
�--.t
- . :::;::: .. - ·::l�lf' ,--Waste Treat'!lent, l .. ��
Water, Solids
Unusable Paper, Process Loss
Market
Landfill
Energy In
from MRF I � ... [3\1 .... � � �� � Products - M
-----. ... � Residue ., �
Landfill
I
I � Lost Paper
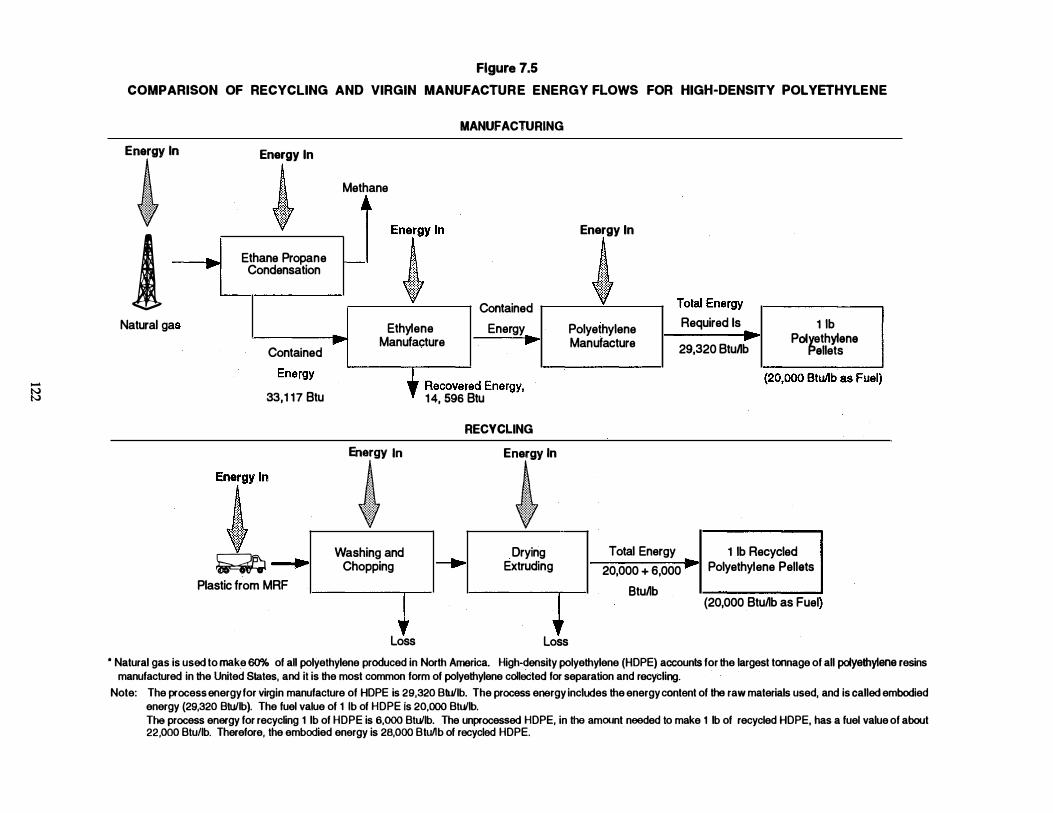
-�
Figure 7.5 COMPARISON OF RECYCLING AND VIRGIN MANUFACTUR E ENERGY FLOWS FOR HIGH-DENSITY POLYETHYLENE
ET �
l Natural ga
. ---
Energy In � Methane . j Energy ln Ethane Propane Condensation
• Ill"'
Contained - -
f--
Ethylene Manufacture
MANUFACTURING
Contained Energy
�
33,1 17 Btu 14, 596 Btu
En�ergy ln . . . �
Plastic from M
... p
RF
Er l·
Washing and Chopping
, Loss
RECYCLING E� ln
I-. Drying
Extruding
,, Loss
Energy In
I VlGI �1 111:111\;IJ
Polyethylene Required Is 1 lb -Manufacture ... Pol�ethylene
29,320 BtuJib ellets
Total Energy 1 lb Recycled 20,000 + 6,000 ... Polyethylene Pellets
Btullb (20,000 Btullb as Fuel
• Natural gas is used to make 60"/o of all polyethylene produced in North America. High-density polyethylene (HOPE) accounts for the largest tonnage of all polyethylene resins manufactured in the United States, and it is the most common form of polyethylene collected for separation and recycling.
Note: The process energy for virgin manufacture of HOPE is 29,320 Btu/lb. The process energy includes the energy content of the raw materials used, and is called embodied energy (29,320 Btullb). The fuel value of 1 lb of HOPE is 20,000 Btu/lb. The process energy for recycling 1 lb of HOPE is 6,000 Btu/lb. The unprocessed HOPE, in the amount needed to make 1 lb of recycled HOPE, has a fuel value of about 22,000 Btu/lb. Therefore, the embodied energy is 28,000 Btullb of recycled HOPE.

• Energy accounting for plastic recycling can be very difficult. This study is based on the inherent Btu value of the plastic and the additional energy used to polymerize and process it; the energy used to wash and pelletize the plastic during recycling was subtracted. The pelletizing energy was used as a surrogate for molding of the thermoplastic into a new part. It is assumed that the plastic is displacing another legitimate plastic source, usually industrial scrap. Btu values are fuel Btu values; the washing and pelletizing are electrical Btus.
Btus for extracting and transporting oil to the point of conversion into plastic were included, but the Btu content in the virgin oil or gas that became the resin was excluded. These simplifying assumptions are valid only when the recycled plastic is legitimately substituting for the same virgin resin. The recycled material need not be applied to the same end use of the plastic; for example, refining used polyethylene terephthalate (PEn bottles into fiberfill displaces other PET.
Among the separated recyclable materials, the largest single saving in electrical generation is from reuse of aluminum, although the absolute quantity saved is small. The data were not adjusted to reflect the fact that hydropower is a major source of the energy used for producing aluminum, and that about 12% of the aluminum used in the United States is produced in Canada. Recycling would permit saved low-cost power to be transferred to locations that need it, and thus would reduce the need for total primary generation from other energy sources.
Analysis of energy savings for paper remanufacture is more complicated than determining the energy savings for aluminum or steel manufacture because:
• The source of energy for papermaking varies with the kind of paper made; fossil fuels are used in some cases, but waste from papermaking is burned for fuel in others.
• The amount of energy used to remanufacture a paper product varies with the particular product being produced.
• The recycle content of remanufactured paper varies with the final product, and the percentage of waste paper used for each grade affects the energy savings for remanufacture.
These and similar factors are discussed in Exhibit VII.
Published estimates of the energy savings achieved by recycling vary from 10 million Btu per ton of paper product to zero. According to preliminary results of an ongoing study for recycling of newsprint alone, energy savings vary widely, depending on the assumptions made in the comparison (see Exhibit VII).
Special Issues
Two special issues related to energy analysis of recycling should be mentioned here:
• Percentage of virgin resources displaced by recycled materials
• Potential energy savings from repeated recycling.
123
Displacement of Virgin Resources. The analysis in this section assumes that the recycled material is displacing an equal amount of the same virgin resource; that is, that a pound of recycled aluminum displaces a pound of virgin aluminum used to produce cans or other products. In some cases. that assumption is invalid. For example, consideli broken or green glass in the Northeast. Because the region has no green glass furnaces. the separated glass must be used in other applications. if it is to be recycled. If the glass displaces sand in asphalt slurry seal (glasphalt), the potential energy savings will no·t be equivalent to the saving that would be achieved if it were displacing glass.
Energy Saving from Repeated Recycling. An uncertainty in conducting a life-cycle analysis that includes recycling is the effect of the 20-year period that is being considered for energy savings and releases in this report. The number of times the same material is recycled will affect the amount of energy that is saved over 20 years. The energy analysis used in the data base assumes that, for example, an aluminum can recycled displaces the energy needed to manufacture the aluminum needed for a new can from virgin resources (taking into account smelting losses). That assumption actually represents the maximum energy that could be saved; it thus overestimates the actual saving for all materials that already are recycled to a reasonable extent.
Nationwide about 62% of all aluminum beverage cans were recycled in 1990, and some can makers managed to buy more used cans than they made (Powell, 1992). When a can is recycled, about 13% of the metal is lost in shredding and resmelting (Kusik and Kenahan, 1979). If 62% of all cans are recycled, the recycled metal accounts for 54% of the new cans made from the mix of new metal and used cans.
Production of a can that consists entirely of recycled metal saves 80% of the energy need to produce the same can from virgin aluminum (Sellers and Sellers, 1989). For a can that is 54% recycled metal. the energy saving is 43%. A series sum for an infinite number of recycles shows that the maximum energy savings is 1 . 18 times the energy saved in the first recyle. If it is assumed that a can will be recycled "infinitely" over the 20-year period covered in this analysis, the total energy saving is 50% of the energy needed to make a new can from virgin metal.
Similar analyses can be made for paper, glass, and plastic. Because percentages of energy saved by recycling are lower for these materials than for aluminum, the total energy saving is smaller.
Transportation of Separated Materials for Remanufacture
Table 7.2 presents estimates developed for this report of energy consumed to transport materials from the point of separation (at the MRF) to the point of reuse or remanufacture, and compares those estimates with the energy required to transport the virgin raw materials to the point of original manufacture. (The assumptions on which the estimates in Table 7.2 were based are detailed in Exhibit II) The table shows that transportation energy to the point of remanufacture is a small percentage of the total energy of manufacture. Waste paper is excluded from the comparison. Despite an extensive search, no data on transportation distances for waste paper were found.
Clearly, variations between communities in the distances that separated products might travel to a remanufacturing site might be large. However, because the energy needs for transportation of the separated materials to remanufacture averaged to be a small percentage of energy of remanufacture, their contribution is not considered separately in the data base variables.
124
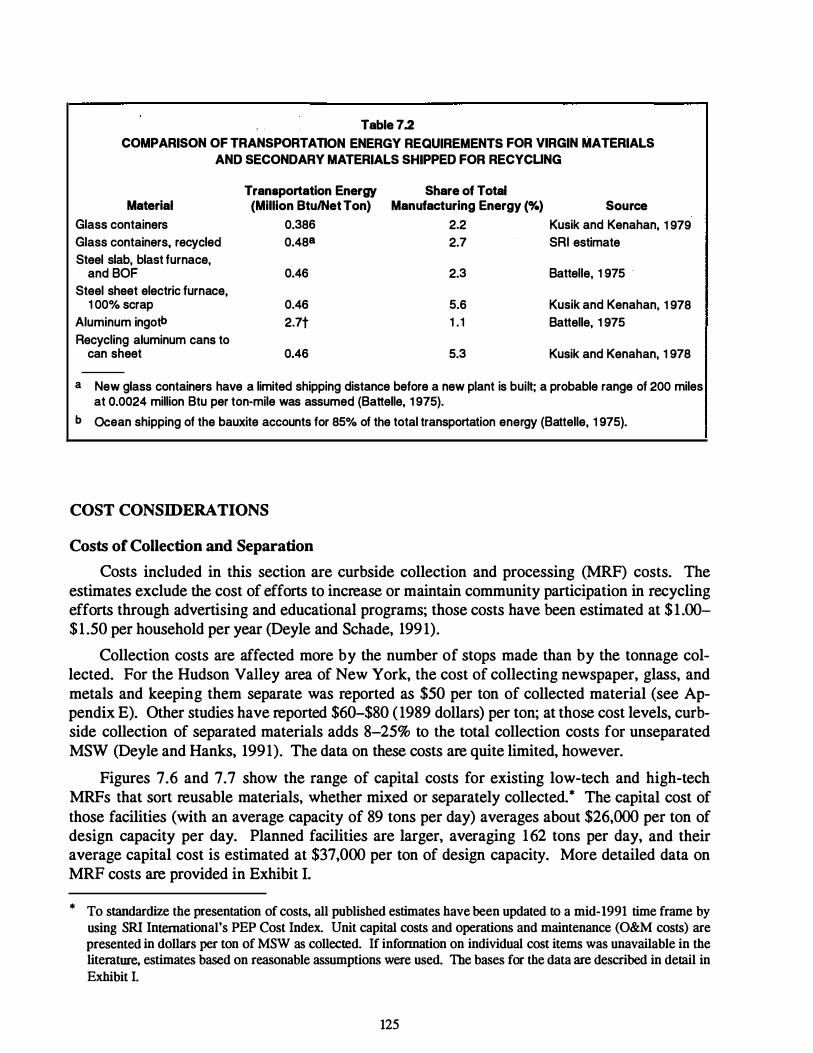
Table 7.2
COMPARISON OF TRANSPORTATION ENERGY REQUIREMENTS FOR VIRGIN MATERIALS AND SECONDARY MATERIALS SHIPPED FOR RECYCUNG
Transportation Energy Share of Total Material (Million Btu/Net Ton) Manufacturing Energy (%) Source
Glass containers 0.386 2.2 Kusik and Kenahan, 1 979 Glass containers, recycled 0.488 2.7 SRI estimate Steel slab, blast furnace,
and BOF 0.46 2.3 Battelle, 1 975 ·
Steel sheet electric furnace, 1 00% scrap 0.46 5.6 Kusik and Kenahan, 1 978
Aluminum ingotb 2.7t 1 . 1 Battelle, 1 975 Recycling aluminum cans to
can sheet 0.46 5.3 Kusik and Kenahan, 1 978
a New glass containers have a limited shipping distance before a new plant is built; a probable range of 200 miles at 0.0024 million Btu per ton-mile was assumed (Battelle, 1 975).
b Ocean shipping of the bauxite accounts for 85% of the total transportation energy (Battelle, 1 975).
COST CONSIDERATIONS
Costs of Collection and Separation
Costs included in this section are curbside collection and processing (MRF) costs. The estimates exclude the cost of efforts to increase or maintain community participation in recycling efforts through advertising and educational programs; those costs have been estimated at $ 1 .00-$1 .50 per household per year (Deyle and Schade, 199 1).
Collection costs are affected more by the number of stops made than by the tonnage collected_ For the Hudson Valley area of New York, the cost of collecting newspaper, glass, and metals and keeping them separate was reported as $50 per ton of collected material (see Appendix E). Other studies have reported $60-$80 ( 1989 dollars) per ton; at those cost levels, curbside collection of separated materials adds 8-25% to the total collection costs for unseparated MSW (Deyle and Hanks, 1991). The data on these costs are quite limited, however.
Figures 7.6 and 7.7 show the range of capital costs for existing low-tech and high-tech MRFs that sort reusable materials, whether mixed or separately collected.* The capital cost of those facilities (with an average capacity of 89 tons per day) averages about $26,000 per ton of design capacity per day. Planned facilities are larger, averaging 162 tons per day, and their average capital cost is estimated at $37,000 per ton of design capacity. More detailed data on MRF costs are provided in Exhibit I.
* To standardize the presentation of costs, all published estimates have been updated to a mid-1991 time frame by using SRI International's PEP Cost Index. Unit capital costs and operations and maintenance (O&M costs) are presented in dollars per ton of MSW as collected. If information on individual cost items was unavailable in the literature, estimates based on reasonable assumptions were used. The bases for the data are described in detail in Exhibit I.
125
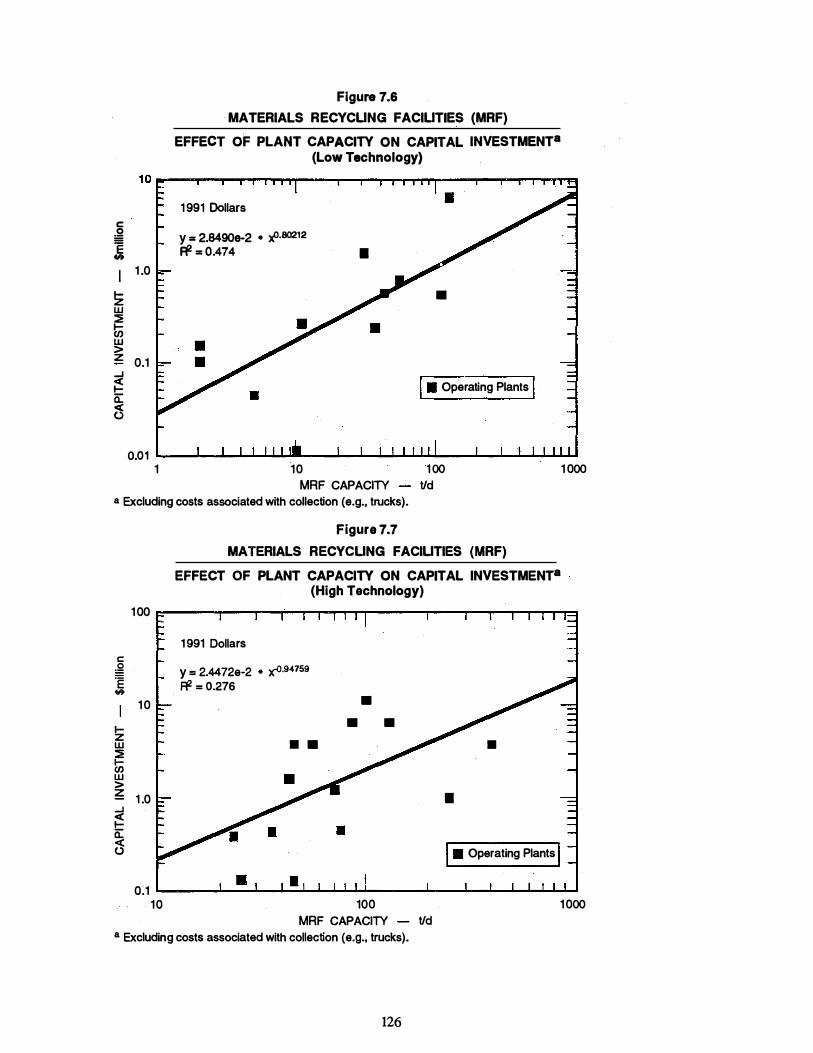
c::
� I I 1 .0
!z w :::E � g;! z 0.1 _, � a: <3
Figure 7.6
· MATERIALS RECYCUNG FACIUTIES (MRF)
EFFECT OF PLANT CAPACITY ON CAPITAL INVESTMENT8 (Low Technology}
1 991 Dollars
y = 2.8490e-2 • ;x0-80212 R! = 0.474 •
•
•
I • Operating Plants I
O.Q1 .___...�-.__,__,__,_...�...�...l...ll---'---'-L....l.....�o-�...I..I...L....--'--'--""-'-'-.&..�..�1..11
1 10 MRF CAPACITY
1 00 Vd
a Excluding costs associated with collection (e.g., trucks).
100
c::
� .E ..
10 1-z w :::E 1-en w > � 1 .0 _, � a: < (.)
0.1
Figure 7.7
MATERIALS RECYCUNG FACIUTIES {MRF)
EFFECT OF PLANT CAPACITY ON CAPITAL INVESTMENT8 (High Technology)
1 991 Dollars
y = 2.4472e-2 • x-0·94759 R! = 0.276
• •
• • •
•
•
I • Operating Plants I
1 000
10 100 MRF CAPACITY
1000 Vd
a Excluding costs associated with collection (e.g., trucks).
126

Operating costs for the MRFs are shown in Figures 7.8 and 7.9. In general, low-technology MRFs have higher operating costs, averaging $65 per ton, than high-technology MRFs, which average $39 per ton, because of the greater labor intensity of the fonner. The figures show loglog plots that tend to suggest a narrower range of prices than the actual range. Other studies show a range of $26-$86 per ton, with an average of $45 per ton (Bishop, 199 1).
Because the cost ranges are so wide and the number of data points is so small, the data in Figures 7.6 through 7.9, as well as the more detailed cost data provided in Exhibit I, are useful only as order-of-magnitude estimates of the possible costs of new MRFs. The variations reflect inconsistencies in the sources of the estimates rather than predictable variations based on the type of technology or the size of the facility.
Sources of Income for MRFs
The cost of operating a collection program and an MRF is covered by revenues from sale of separated products and by tipping fees charged to generators of materials going to the MRF (either directly or indirectly through waste disposal charges). Costs remain relatively fixed regardless of the amount of material recycled, but revenues depend on the quantity, quality, and prevailing prices of the products. Revenues may be lower, in general, in states with deposit laws because container materials generate higher revenues than many other recycled materials, and smaller quanfities of container materials are set out for curbside collection in "bottle bill" states (White, 1990).
Revenues from Sale of Products
Prices of products vary depending on the region and with time; therefore, revenues from products vary between $8 and $32 per ton (Bishop, 1991).* Table 7.3 shows revenue ranges for individual products (at the MRF).
Prices paid for recycled products also vary greatly over time, as illustrated by the changes in the national average price for various products in 1991 shown in Figure 7. 10. These prices have been volatile in the past, and they are likely to remain so. The prices of all the major recycled products fell during the second half of 199 1 , and the price of old newspaper fell below zero in some areas (that is, paper mills charged a fee for accepting old newsprint). In general, prices decreased overall for the last 6 months of 1991 .
Tipping Fees
About one-half of existing MRFs charge a tipping fee to haulers that bring materials to an MRF; others charge no tipping fee in order to encourage participation. One source estimates that tipping fees range from $2.50 to $70 per ton of material delivered to the MRF, with an average of about $27 per ton [386]. Another source gave a range of $8 to $ 1 10 per ton (Glenn and Riggle, 1989). Tipping fees, even when added to revenue from sales of recovered materials, are usually insufficient to cover the O&M costs of the operation (Berenyi and Gould, 1990).
* Estimates of revenues in 1989 from two planned mixed waste MRFs and one MRF that handles curbsidecollected separated waste showed a range of $25 to $70 per ton. The facility with the lowest revenues is in the Northeast; the one with the highest is in the South (wTe, 1992).
127
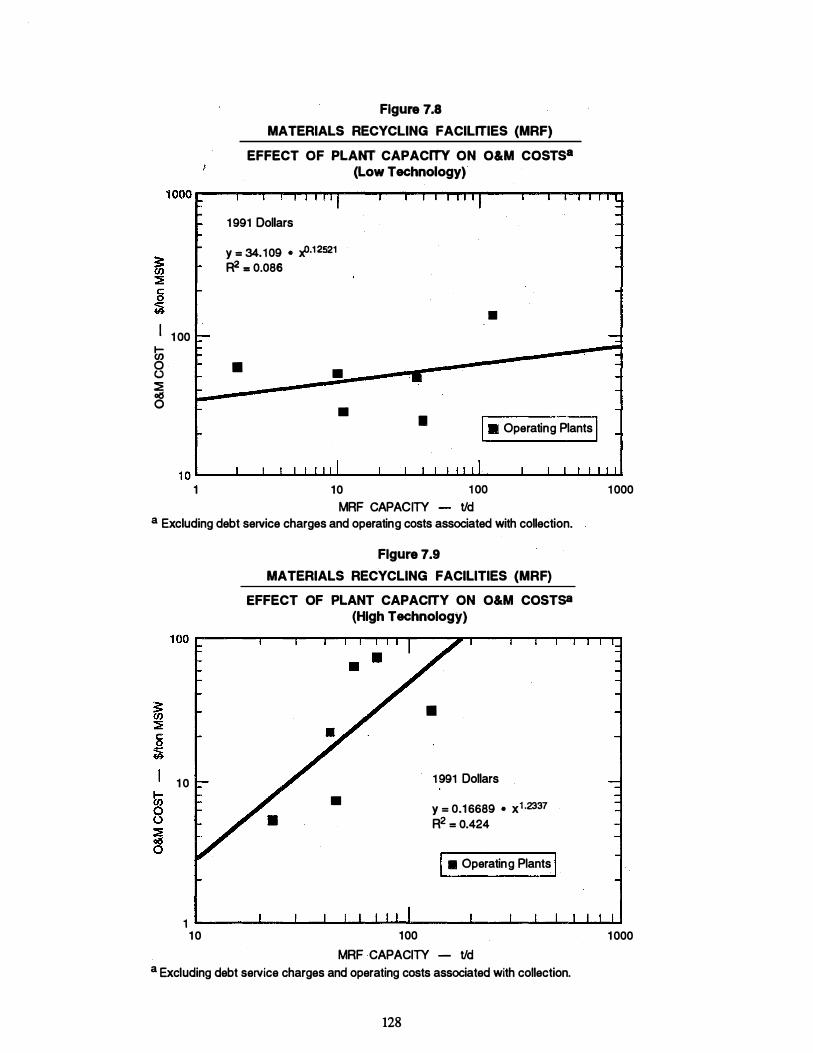
I 1 00
� 0 (.) � �
Figure 7.8
MATERIALS RECYCLING FACILITIES (MRF)
EFFECT OF PLANT CAPACrrY ON O&M COSTS8 (Low Technology)
1 991 Dollars
y = 34.109 . x£>.12521 R2 = 0.086
• •
•
•
• I • Operating Plants I
1 0 �--�������--_. __ ._�� .. �----������
1 10
MRF CAPACITY 1 00
Vd a Excluding debt service charges and operating costs associated with collection.
1 0
Flgure 7.9
MATERIALS RECYCLING FACILITIES (MRF)
EFFECT OF PLANT CAPACITY ON O&M COSTS& (High Technology)
•
•
1 991 Dollars
y = 0.1 6689 • x1•2337 R2 = 0.424
I • Operating Plants j
1 000
1 ______ _. __ _. __ �_.--� .. �------�--�_.����� 1 0 100 1 000
MRF CAPACITY - Vd a Excluding debt service charges and operating costs associated with collection.
128
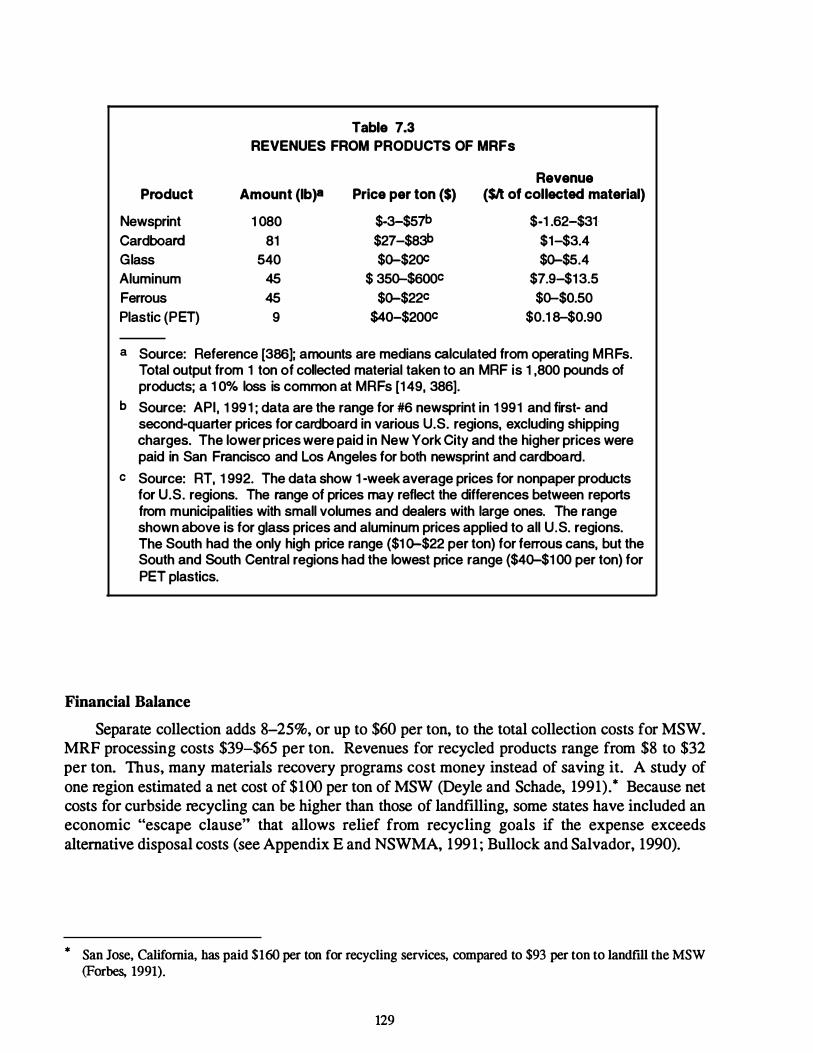
Product
Newsprint Cardboard Glass Aluminum Ferrous Plastic (PET)
Table 7.3 REVENUES FROM PRODUCTS OF MRFs
Amount (lb)•
1 080 81
540 45 45
9
Price per ton ($) $-3-$57b $27-$83b $Q-$20C
$ 350-$600C $Q-$22C
$4Q-$20QC
Revenue (SA of collected material)
$-1 .62-$31 $1-$3.4 $Q-$5.4
$7.9-$13.5 $0-$0.50
$0.1 8-$0.90
a Source: Reference [386]; amounts are medians calculated from operating MRFs. Total output from 1 ton of collected material taken to an MRF is 1 ,800 pounds of products; a 1 0% loss is common at MRFs [149, 386].
b Source: API, 1 991 ; data are the range for #6 newsprint in 1 991 and first- and second-quarter prices for cardboard in various U.S. regions, excluding shipping charges. The lower prices were paid in New York City and the higher prices were paid in San Francisco and Los Angeles for both newsprint and cardboard.
c Source: RT, 1 992. The data show 1 -week average prices for nonpaper products for U.S. regions. The range of prices may reflect the differences between reports from municipalities with small volumes and dealers with large ones. The range shown above is for glass prices and aluminum prices applied to all U.S. regions. The South had the only high price range ($1 Q-$22 per ton) for ferrous cans, but the South and South Central regions had the lowest price range ($40--$1 00 per ton) for PET plastics.
Financial Balance
Separate collection adds 8-25%, or up to $60 per ton, to the total collection costs for MSW. MRF processing costs $39-$65 per ton. Revenues for recycled products range from $8 to $32 per ton. Thus, many materials recovery programs cost money instead of saving it. A study of one region estimated a net cost of $100 per ton of MSW (Deyle and Schade, 1991).* Because net costs for curbside recycling can be higher than those of landfilling, some states have included an economic "escape clause" that allows relief from recycling goals if the expense exceeds alternative disposal costs (see Appendix E and NSWMA, 199 1 ; Bullock and Salvador, 1990).
* San Jose. California, has paid $160 per ton for recycling services, compared to $93 per ton to landfill the MSW (Forbes, 1991).
129
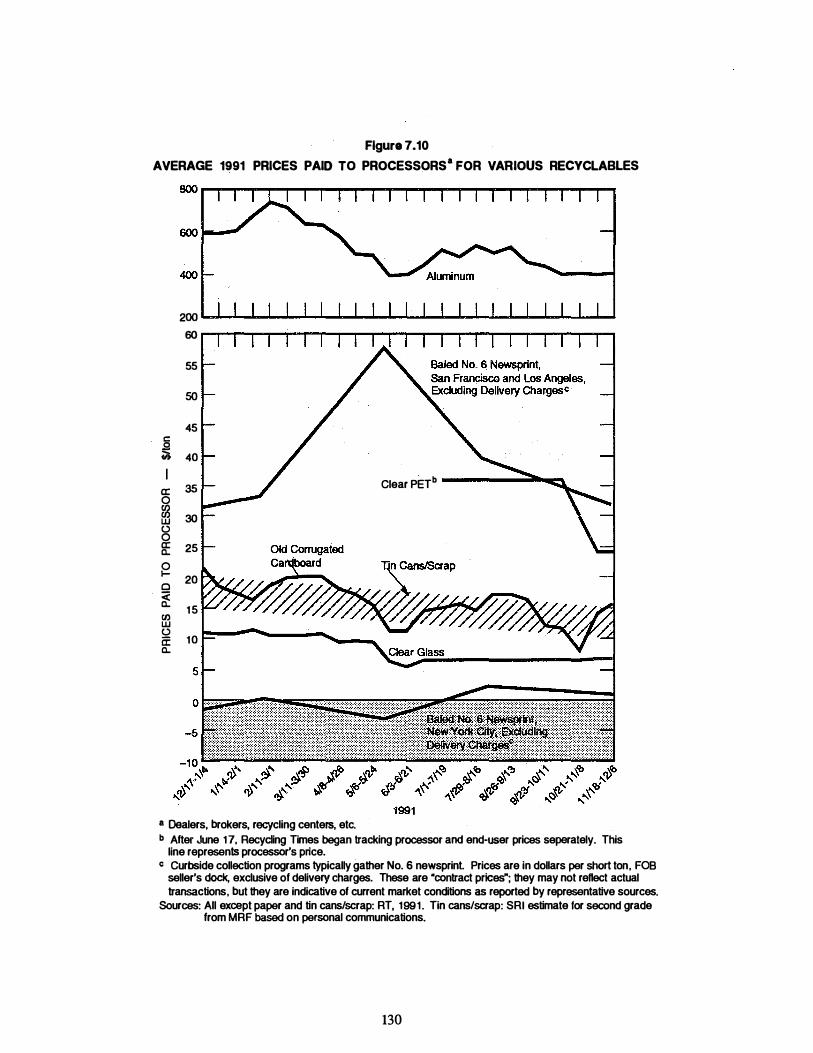
Figure 7.10
AVERAGE 1991 PRICES PAID TO PROCESSORS8 FOR VA'RIOUS RECYCLABLES
400
200 60
55
50
45 c: .9 ilt 40
a: 35 Clear PETb
0 � 30 w (.) 0 a: 25 a..
0 1- 20 0 � 15 CJ) w (.) a: 10 a..
a Dealers, brokers, recycling centers, etc. b After June 17, Recycling Times began tracking processor and end-user prices separately. This
line represents processor's price. c CUrbside collection programs typically gather No. 6 newsprint. Prices are in dollars per short ton, FOB
seller's dock, exclusive of delivery charges. These are •contract prices"; they may not renect actual transactions, but they are indicative of current market conditions as reported by representative sources.
Sources: All except paper and tin cans/scrap: RT, 1991. Tin cans/scrap: SRI estimate for second grade from MRF based on personal communications.
130

ENVIRONMENTAL RELEASES
This subsection presents the results of a life-cycle analysis of emissions. The bases are the same as those used for calculating the energy balance.
The environmental releases associated with collection and separation are local issues, whereas releases associated with transport to remanufacturing facilities (which might even be outside the United States) and emissions from remanufacture are distant effects. Local and distant emissions are covered separately in this subsection.
Community Environmental Releases
Releases associated with recycling include the greater emissions that result from multiple pickups in both packer trucks and multi-compartment trucks instead of a single collection of MSW, as discussed under "Energy Requirements." In the estimates given in Exhibit II, the packer truck emissions have been adjusted downward to reflect the results of collecting smaller quantities of MSW at each stop.
Other environmental releases result from operating the MRF; they include truck traffic, noise, dust, and odors. When the recycled materials are diverted from a landfill, however, emissions from the landfill may decrease, and less land space will be required. If the recyclables are diverted from combustion, emissions and ash from the MSW combustor may be reduced. The data base takes these potential reductions into account.
Emissions from Remanufacture
The environmental releases that are eliminated by avoiding mining, harvesting, and extracting raw materials and the impact of recycling on land use are typically included in analyses of recycling. Those issues are beyond the scope of this project, but results of past "cradle-to-grave analyses" are presented in Table 7 .4. The bases from which these reductions were estimated are unclear; the reductions may well assume emission levels that are higher than current standards or practice. New analyses of newsprint and glass now under way at Argonne National Laboratories should update and expand the data presented here.
INTEGRA TED SYSTEM EXAMPLE: CURBSIDE COLLECTION OF RECYCLABLE MATERIAL, SEPARATION IN AN MRF, RECYCLING WITH LANDFILL OF THE REMAINING MSW
To· illustrate -the application of the data on technologies to the evaluation of options for an integrated MSW management strategy, this section summarizes the energy balance and air and water emissions for:
• Collection and transportation of MSW in a packer truck, plus collection and transportation of curbside-separated recyclables in a multi-compartment truck, plus MRF operations and remanufacturing, plus landfilling the remaining MSW (Strategy 6 in Table 1 . 1)
• Collection and transportation of MSW in a packer truck, plus landfilling the MSW (Strategy 1 in Table 1 . 1). *
* All integrated strategy examples compare other technologies with a strategy of landfilling alone because none can eliminate the need for landfill; thus, all integrated strategies involve adding other technologies to IandfJ.lling.
131
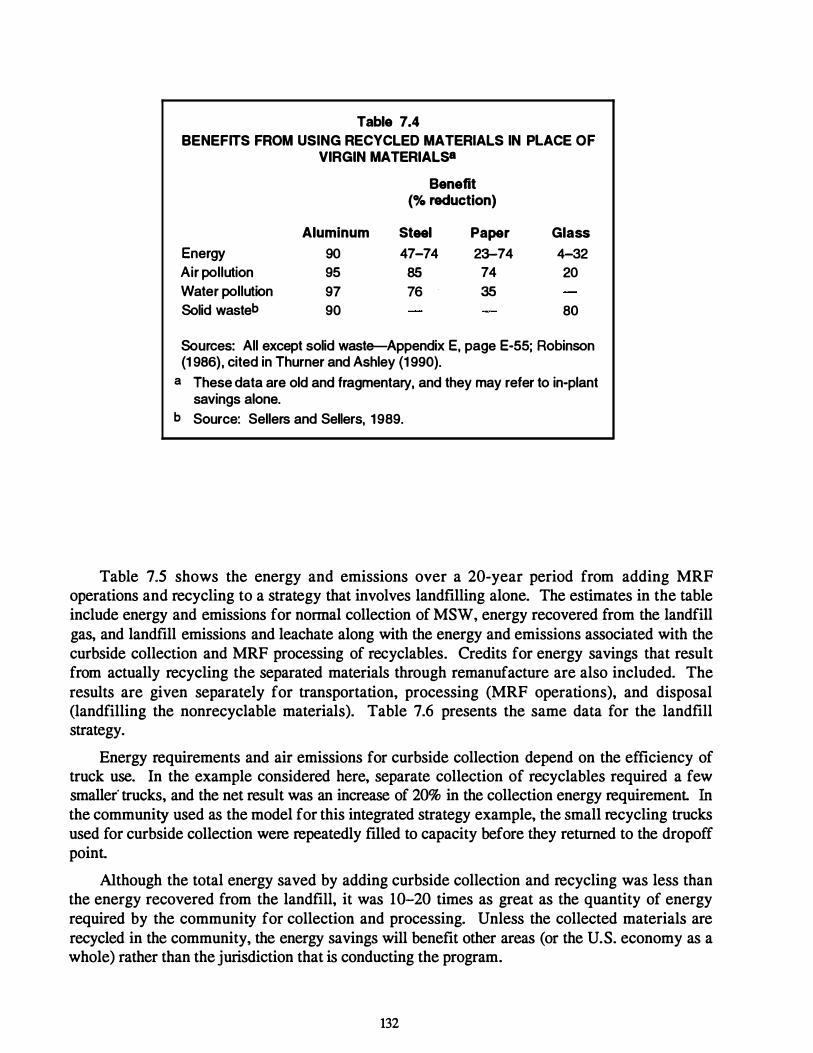
Table 7.4 BENEFITS FROM USING RECYCLED MATERIALS IN PLACE OF
VIRGIN MATERIALS&
Benefit (o/o reduction)
Aluminum Steel Paper Glass Energy 90 47-74 23-74 4-32 Air pollution 95 85 74 20 Water pollution 97 76 35 Solid wasteb 90 80
Sources: All except solid waste-Appendix E, page E-55; Robinson (1 986), cited in Thurner and Ashley (1 990).
a These data are old and fragmentary, and they may refer to in-plant savings alone.
b Source: Sellers and Sellers, 1989.
Table 7.5 shows the energy and emissions over a 20-year period from adding MRF operations and recycling to a strategy that involves landfilling alone. The estimates in the table include energy and emissions for normal collection of MSW, energy recovered from the landfill gas, and landfill emissions and leachate along with the energy and emissions associated with the curbside collection and MRF processing of recyclables. Credits for energy savings that result from actually recycling the separated materials through remanufacture are also included. The results are given separately for transportation, processing (MRF operations), and disposal (landfilling the nonrecyclable materials). Table 7.6 presents the same data for the landfill strategy.
Energy requirements and air emissions for curbside collection depend on the efficiency of truck use. In the example considered here, separate collection of recyclables required a few smaller· trucks, and the net result was an increase of 20% in the collection energy requirement In the community used as the model for this integrated strategy example, the small recycling trucks used for curbside collection were repeatedly filled to capacity before they returned to the dropoff point
Although the total energy saved by adding curbside collection and recycling was less than the energy recovered from the landfill, it was 10-20 times as great as the quantity of energy required by the community for collection and processing. Unless the collected materials are recycled in the community, the energy savings will benefit other areas (or the U.S. economy as a whole) rather than the jurisdiction that is conducting the program.
132
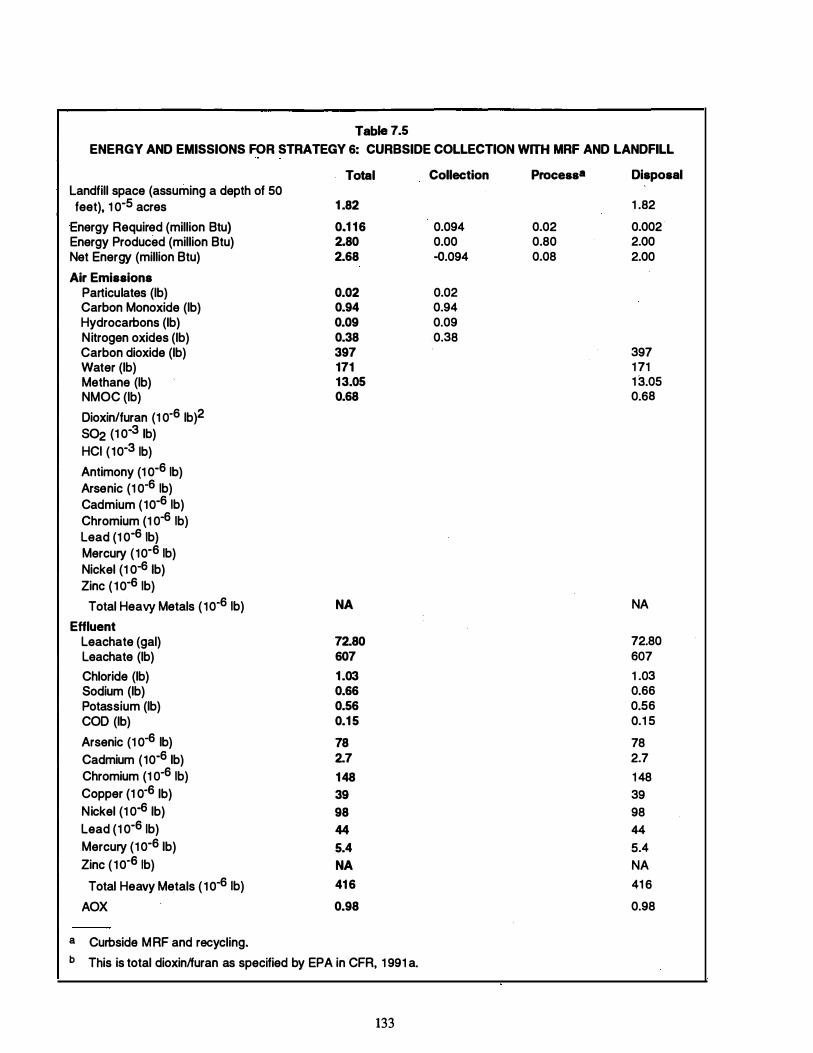
Table 7.5 ENERGY AND EMISSIONS FOR STRATEGY 6: CURBSIDE COLLECTION WITH MRF AND LANDFILL
Landfill space (assuming a depth of 50 feet), 1 o-5 acres
Energy Required (million Btu) Energy Produced (million Btu) Net Energy (million Btu) Air Emissions
Particulates (lb) Carbon Monoxide (lb) Hydrocarbons (lb) Nitrogen oxides (lb) Carbon dioxide (lb) Water (lb) Methane (lb) NMOC (Ib) Dioxin/furan (1 o-6 lb )2 so2 (1 o-3 lb) HCI ( 1o-3 1b) Antimony (1 o-6 1b) Arsenic (1 o-6 1b) Cadmium (1o-6 1b) Chromium (1 0-6 1b) Lead (1 o-6 1b) Mercury (1o-6 1b) Nickel (1 o-6 lb) Zinc ( 1o-6 1b)
Total Heavy Metals ( 1o-6 1b) Effluent
Leachate (gal) Leachate (lb) Chloride (lb) Sodium (lb) Potassium (lb) COD (lb) Arsenic (1 o-6 lb) Cadmium (1o-6 lb) Chromium (1 0-6 1b) Copper (1 o-6 lb) Nickel (1 0-6 lb) Lead (1 o-6 1b) Mercury (1 o-6 lb) Zinc ( 1o-6 tb)
Total Heavy Metals ( 1o-6 tb) AOX
a Curbside M RF and recycling.
Total
1 .82
0.1 1 6 2.80 2.68
0.02 0.94 0.09 0.38 397 171 1 3.05 0.68
NA
72.80 607 1 .03 0.66 0.56 0.1 5
78 2.7 1 48 39 98 44 5.4 NA 41 6
0.98
b This is total dioxinlfuran as specified by EPA in CFR, 1 991 a.
133
Collection
0.094 0.00 -o.094
0.02 0.94 0.09 0.38
Process•
0.02 0.80 0.08
Disposal
1 .82 0.002 2.00 2.00
397 1 71 1 3.05 0.68
NA
72.80 607 1 .03 0.66 0.56 0.1 5 78 2.7 1 48 39 98 44 5.4 NA 41 6 0.98
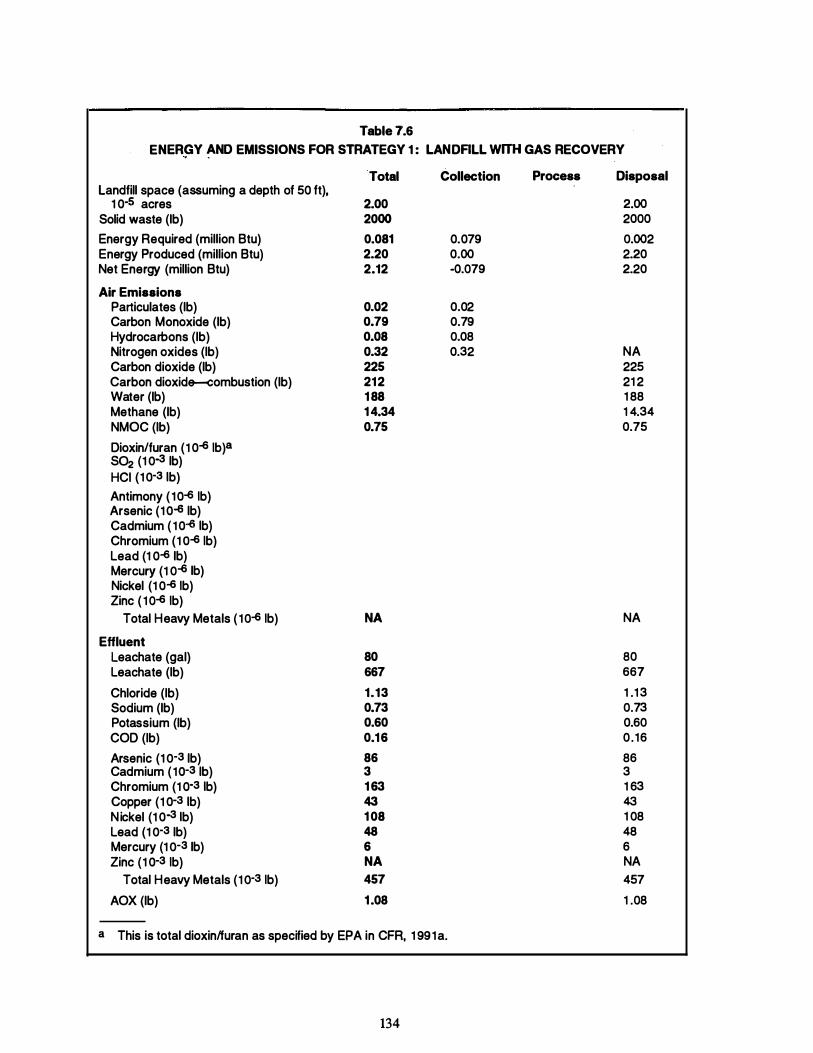
Table 7.6 ENER�Y �NO EMISSIONS FOR STRATEGY 1 : LANDRLL WITH GAS RECOVERY
Total Collection Landfill space (assuming a depth of 50 ft),
1 0·5 acres Solid waste (lb) Energy Required (million Btu) Energy Produced (million Btu) Net Energy (million Btu) Air Emissions
Particulates (lb) Carbon Monoxide (lb) Hydrocarbons (lb) Nitrogen oxides (lb) Carbon dioxide (lb) Carbon dioxide-combustion (lb) Water (lb) Methane (lb) NMOC (lb) Dioxin/furan (1 0-6 1b)a so2 (1 o-3 lb) HCI (1 0-3 1b) Antimony ( 10-6 1b) Arsenic (1 0-6 lb) Cadmium ( 10-6 1b) Chromium (1 0-6 1b) Lead (1 0-6 lb) Mercury (1 o-6 lb) Nickel (1 0-6 1b) Zinc ( 10-6 1b)
Total Heavy Metals ( 10-6 1b) Effluent
Leachate (gal) Leachate (lb) Chloride (lb) Sodium (lb) Potassium (lb) COD (lb) Arsenic (1 Q-3 lb) Cadmium (10-3 lb) Chromium (1 0·3 1b) Copper (1 0-3 1b) N ickel (1 0-3 1b) Lead (1 Q-3 lb) Mercury (1 Q-3 lb) Zinc (1 0-3 1b)
Total Heavy Metals (1 Q·3 1b) AOX (lb)
2.00 2000 0.081 2.20 2.12
0.02 0.79 0.08 0.32 225 21 2 1 88 1 4.34 0.75
NA
80 667
1.13 0.73 0.60 0.1 6
86 3 1 63 43 1 08 48 6 NA 457
1 .08
a This is total dioxin/furan as specified by EPA in CFR, 1 991a.
134
0.079 0.00 -0.079
0.02 0.79 0.08 0.32
Process Disposal
2.00 2000 0.002 2.20 2.20
NA 225 21 2 1 88 1 4.34 0.75
NA
80 667 1 .1 3 0.73 0.60 0.16 86 3 1 63 43 1 08 48 6 NA 457 1 .08
� --��----------------------------�------

In comparison with landfilling alone, the strategy that includes recycling increases air emissions for the collection step, but decreases the emissions from the landfill. Water emissions from the landfill also decrease by about 10%, for a net reduction in water emissions.
Few data on collection distances and loadings per trip have been published. The data used in this example were collected by SRI International from community officials of an affluent residentia1/commercial community in California that has had an active program for curbside collection of recyclables for more than 12 years (City of Palo Alto, 1991). The data should be considered illustrative only; additional examples are needed to draw reliable conclusions.
Details of the calculations used to obtain estimates of emissions and energy consumption are presented in Exhibit II. The computerized version of the data base allows a user to change the collection amounts and mix of collected materials, to substitute other measures of collection efficiency for those used in this report, and to enter the actual miles traveled.
OTHER INTEGRATED STRATEGIES DESCRIBED IN THE DATA BASE
The computerized data base also allows the user to analyze the effects of integrating separation and recycling with any of the other technologies in an integrated MSW management strategy. Calculations for the following integrated strategies that include collection, separation, and recycling or on-site separation and recycling have already been performed and are included in Exhibit II and in the computerized data base:
•
•
•
•
Collection and transportation of MSW in a packer truck, plus collection and transportation of curbside-separated recyclables in a multi-compartment truck, plus MRF operations and remanufacturing, plus landfilling the remaining MSW (Strategy 6 in Table 1 . 1 )
Collection and transportation of MSW in a packer truck, plus collection and transportation of curbside-separated recyclables in a multi-compartment truck, plus MRF operations and remanufacturing, plus mass burning the remaining MSW, plus landfilling ash in a monofill (Strategy 7 in Table 1 . 1 )
Collection and transportation of MSW in a packer truck, plus collection and transportation of curbside separated recyclables in a multi-compartment truck, plus MRF operations and remanufacturing, plus on-site RDF preparation and metal recovery, plus combustion of the RDF, plus landfilling RDF rejects, plus landfllling ash in a monofill (Strategy 8 in Table 1 .1)
Collection and transportation of MSW in a packer truck, plus collection and transportation of curbside-separated recyclables in a multi-compartment truck, plus MRF operations and remanufacturing, plus on-site RDF preparation and metal recovery, plus composting of RDF, plus landfilling RDF rejects (Strategy 9 in Table 1 . 1).
Calculations are also provided for the following less commonly used integrated strategies that add separate collection of yard waste for com posting to the strategies that involve collection and separation of recyclables:
135
• Collection and transportation of MSW in a packer truck, plus collection and transportation of curbside-separated recyclables in a multi-compartment truck, plus collection and transportation of curbside-separated yard waste in a packer truck, plus MRF operations and remanufacturing, plus yard waste com posting, plus landfllling the remaining MSW (Strategy 10 in Table 1.1)
• Collection and transportation of MSW in a packer truck, plus collection and transportation of curbside-separated recyclables in a multi-compartment truck, plus collection and transportation of curbside-separated yard waste in a packer truck, plus MRF operations and remanufacturing, plus yard waste composting, plus mass burning of the remaining MSW, plus landfilling the ash in a monoftll (Strategy 1 1 in Table 1 . 1)
• Collection and transportation of MSW in a packer truck, plus collection and transportation of curbside-separated recyclables in a multi-compartment truck, plus collection and transportation of curbside-separated yard waste in a packer truck, plus MRF operations and remanufacturing, plus composting of yard waste, plus on-site RDF preparation and metal recovery, plus combustion of the RDF, plus landfilling RDF rejects, plus landfilling ash in a monofill (Strategy 15 in Table 1. 1).
On-site separation of recyclables from MSW (which does not require collection of recyclables separated by the waste generators) is covered in two additional strategies:
• Collection and transportation of MSW in a packer truck, plus on-site separation of recyclables (in a mixed-waste MRF), plus mass burning the remaining MSW, plus landfilling ash into a monofill (Strategy 3 in Table 1 .1)
• Collection and transportation of MSW in a packer truck. plus on-site RDF preparation and metal recovery, plus RDF combustion, plus landfilling of RDF rejects, plus landfilling of ash in a monofill (Strategy 4 in Table 1 . 1).
MISSING OR LIMITED DATA AND RESEARCH NEEDS
Materials collection, separation, and recycling constitute a new MSW management option, and data on many aspects of that option are limited or unavailable. This section describes data gaps and research needs related to amounts and destinations of separated material, energy requirements, environmental releases, and system information needs.
Amounts Collected and Destinations and Applications of Materials
More than 2,700 curbside collection programs may be operating in the United States (Glenn and Riggle. 1991). Operating or planned MRFs exceeded 100 in 1991 , and the number of such facilities is increasing rapidly (ICF Inc., 1991). The destination of the material collected by programs that are not operated in association with an MRF is unclear. Inadequate data are available on the amounts of materials actually collected, recovered, and sold or beneficially used; most sources report on the design capacity of MRFs.
The field of materials recovery is still relatively new, and systems for encouraging participation, collection, and processing continue to evolve. Better estimates of the amounts of material collected by curbside programs are needed. The validity of the frequent assertion that
136
additional education can motivate greater participation has apparently not been tested, and no study has established the maximum sustainable levels of participation. Some sources have reported nationwide data on the effectiveness of dropoff programs, especially by comparison with curbside collection programs. Limited data are reported in Appendix E (see page E-20).
The effects of "bottle bill" legislati_on on amounts of materials set out in curbside programs remain unclear. One study has covered that issue, but confirmation of the results would be useful (White et al., 1990). In particular, no data are available on the effect of bottle bills on the total diversion of containers from MSW disposal (that is, the total number of containers set out at curbside or returned for payment at redemption centers). One study included a model to estimate potential effects; however, the results give no clear indication whether bottle bills have a consistently positive or negative effect (Ackerman and Schatzki, 199 1).
The yield of reusable glass, metals, and paper that is picked up for separation is not well documented. For example, the breakage of glass during collection is substantial in some communities as a consequence of the trucks that are used. The broken, mixed color glass cannot be sold, and becomes process loss. One community reports that the reason for wetting all the paper it receives is "to prevent blowing." The extra water distorts the accounting of actual yields.
Little information is available on the effectiveness of mixed waste MRF programs. The few reported data suggest that such programs divert twice as much recyclable waste as curbside collection of separated materials. If so, research to encourage the mixed waste approach is needed.
If additional studies make it clear that certain materials are unlikely to find a market in certain regions, then alternative uses need to be found for those materials in those regions. For example, new economic uses for mixed paper and glass are clearly needed in some areas.
Energy
Transport/Collection
Reliable data on actual fuel use in collection and processing for materials recovery are not available for comparison with fuel use for standard MSW collection and disposal. Most MRF studies assume that the trucks used for transporting reusable materials have the same energy consumption as a packer truck, but differences between the two may be significant.
Processing
The estimates of energy used for processing are based on design documents. Estimates for operating MRFs of actual power use per ton processed would be more reliable.
Recycling/Reuse
All the detailed comparisons of energy use for recycling with energy use for production of virgin metals and glass are now 14-17 years old, and process improvements may have strongly affected the conclusions (Battelle, 1975; Kusik and Kenahan, 1978). In addition, no energy balances were found for reuse of collected materials in applications other than remanufacture of the original product (e.g., glass used as a substitute for sand in glasphalt, or mixed plastic used as a substitute for wood composites to produce "plastic lumber").
137
Environmental Releases
Transportation
Like data on energy use, emissions data for operating collection programs are sparse. Specific needs include:
• Actual emissions data from MSW collection or curbside collection operations
• Data on emissions per ton of material collected
• Comparisons of emissions for separate collection of reusable materials and emissions for a single collection of all MSW.
Processing
Only anecdotal accounts of environmental releases from actual MRF operations have been reported. Good data are not yet available.
Recycling/Reuse
Studies of the environmental advantages of recycling individual materials (e.g. , paper, metals, and glass) seem to be based on limited data and analysis, and they need to be updated. Many of the advantages claimed for recycling assumed high effluent levels for virgin manufacture that no longer reflect actual current practice.
Costs
Cost data available in the literature are limited, the range of capital and operating cost estimates is extremely broad, and most sources of cost data fail to clarify the basis for the estimates. As a result, published cost estimates are inadequate for comparing the costs of materials collection, separation, and recycling with those of other MSW options.
The capital cost variations reflect inconsistencies in the sources of the estimates rather than predictable variations based on the type of technology or the size of the facility. Similarly, the O&M costs are affected by site-specific conditions such as labor rates, labor contracts, safety rules, the size of the crew, and so on. Information on these factors is rarely provided in the literature.
The unavailability of information of this type makes it impossible to determine the reasons for the broad variations in the cost estimates published by various organizations. Comparisons of actual costs of various technologies should be based on site-specific quotations from individual vendors of the systems under consideration. To facilitate comparisons of the various strategies for managing MSW, costs for all the systems should be built up using a consistent set of assumptions and factors.
System Evaluations
Most recycling of waste and of materials that would otherwise become waste occurs outside the traditional MSW management system. Waste paper, postindustrial plastic, and scrap steel are widely collected and recycled in the secondary materials business. A systems study on secondary materials reclamation could show the effectiveness of various industry-commercialcommunity initiatives and their interactions with recycling efforts.
138
The present inability of the market to absorb all locally generated recovered materials shows that parts of the system are unable to keep up with supplies available. The supply of separated material is under the control of a waste management authority. Demand for the separated material is under the control of a large number of consumers. Obvious imbalances between supply and demand are reflected in the current prices for some separated materials. Research is needed to determine the effects of such imbalances on the ultimate benefits of curbside collection programs.
Reliable system studies will depend on the availability of cost data generated on a consistent basis, as outlined above.
139

8. COMPOSTING
Composting is low-temperature partial oxidation of the easily degradable proteins, fats, simple sugars, and carbohydrates contained in plant cells and animal tissues. It produces little alteration in difficult-to-degrade organic components such as cellulose, leather, and polymers, or in insoluble inorganics such as dirt, glass, ceramics, and metals. However, because composting requires a moist, warm environment under conditions that range from acidic to basic, metals may corrode (oxidize) during the composting time (CRSI, 1989).
Composting may be either aerobic or anaerobic. This section discusses only aerobic com posting. The term "anaerobic composting" refers to a process for stabilizing solid waste by using the same microorganisms used in anaerobic digestion; however, anaerobic composting does not optimize energy recovery to the degree that anaerobic digestion does (CRSI, 1989).
As part of an MSW management strategy, composting can be applied to mixed MSW or to separately collected leaves and other yard wastes. MSW composting results in a volume reduction of 50% of the original volume composted, and consumes about 50% of the organic mass (on a dry weight basis), which is released mainly as C02 and water. Yard waste composting results in a reduction of 30-50% of the weight of the original yard waste (Deyle and Hanks, 1991).
TECHNOLOGY DESCRIPTION
Composting is a technically proven biological process. Three basic systems are used:
• Static windrows (piles)
• Turned windrows
• In-vessel composting.
The three systems differ mainly in the manner in which oxygen is transferred into the compost Windrows are long piles, up to 6 feet high, of the material to be composted. Static windrows are built on a porous deck that allows air to be blown through the piles. The piles are not moved until composting is completed. Turned windrows are aerated by periodic mechanical mixing. For in-vessel composting, the material is placed in a tank, where it is aerated and mixed by. tumbling or stirring. Composting in a vessel is a relatively short term process. It is followed by additional open-air com posting.
In all composting systems, the following basic variables should be simultaneously optimized:
• Substrate (the feed material) and particle size
• Bacteria, fungi, and protozoa, which cause the reactions
141
• Additional nutrients (nitrogen, phosphorus, potassium, and trace metals), perhaps from sewage sludge, which is often added to MSW during composting to provide moisture, nitrogen, bacteria, and nutrients (Glaub et al., 1989)
• pH, which drops to about 4.5 in the early stages and should not significantly exceed 8.5 during the later stages of the compost cycle
• Aeration, which is critical because adequate 02 is needed to prevent anaerobic conditions
• Moisture content, which must be greater than 12% but less than saturation
• Process residence time.
The system chosen depends on whether a community decides on separate curbside collection of leaves and/or yard waste or a system to produce a compost product from mixed MSW. All three systems are used for composting mixed MSW. Yard waste composting uses the simpler, less capital-intensive windrow methods (Hammer, 1992). The differences among these two approaches are outlined below.
Yard Waste Composting
Leaves alone can be composted in I to 3 years using a front-end loader for occasional turning (Deyle and Hanks. 1991). Grass and leaves together require weekly turning to maintain aerobic conditions; a windrow turner is typically used. Systems for general yard waste often include shredding to permit com posting of brush and tree trimmings, and com posting takes 16-18 months (Deyle and Hanks. 1991). If the system is intended to produce compost for sale or commercial use, process conditions must be carefully controlled, and the final compost product must probably be passed through a sizing screen.
MSW Composting
Processing MSW to make compost is a much more complex process than composting yard waste alone. MSW requires preprocessing, which includes shredding, air classifying, and screening (CRSI, 1989), to improve the rate of composting and the quality of the product. Preprocessing methods similar to, but less intensive than, those used to make RDF are often employed, and only 40-60% of the MSW remains after preprocessing as feed to the com posting operation (Spencer, 1991). A typical process flowsheet is shown in Figure 8.1 and explained in detail in Appendix G. One large, technically successful operation in Wilmington, Delaware, makes about 37,000 tons per year of compost from RDF. The compost operation is part of a larger facility that makes RDF for combustion and recovers ferrous metals, aluminum, and glass from MSW (see Appendix G).
Specialized preprocessing equipment, such as the Dano Drum, developed in Europe is being used in the largest U.S. MSW composting plant (Apotheker, 1991a). Figure 8. 1 shows a flowsheet for that 600 ton per day plant.
142
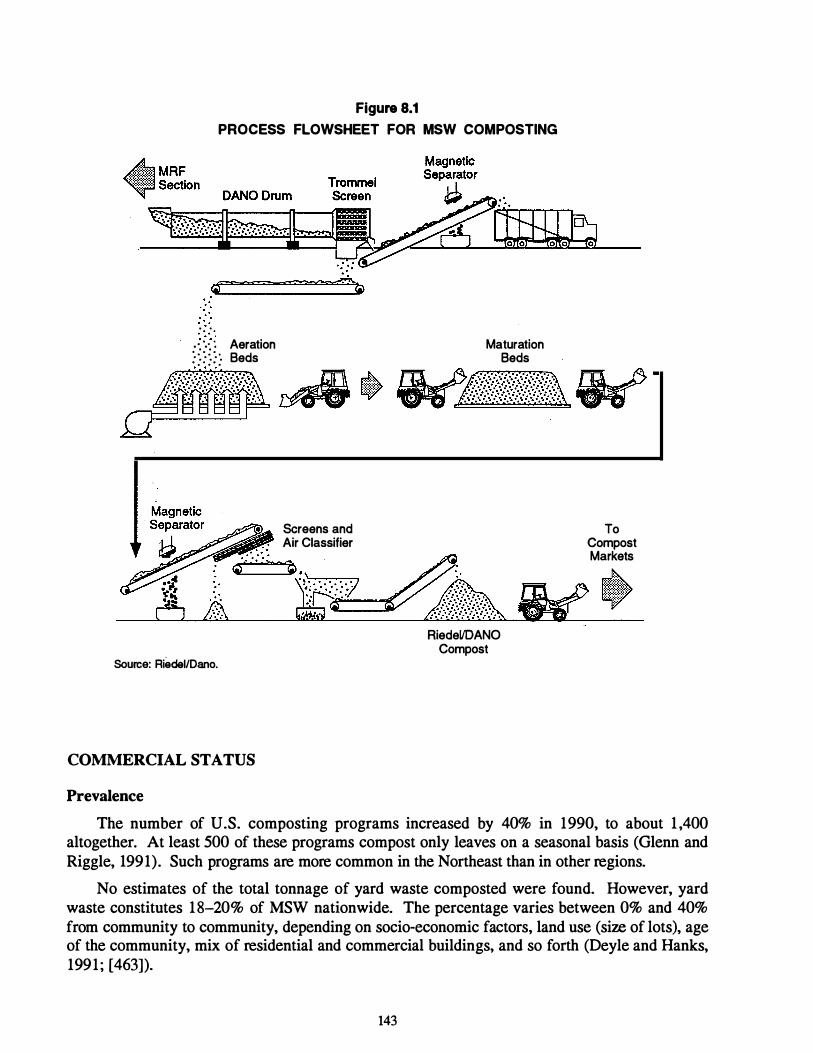
Figure 8.1 PROCESS FLOWSHEET FOR MSW COMPOSTING
· . · .
. ·. ·> Aeration Maturation · . .. -...: -. Beds Beds · . · . · .
Screens and Air Classifier
RiedeVOANO Compost
Source: Riedei/Dano.
COMMERCIAL STATUS
Prevalence
To Compost Markets
The number of U.S. composting programs increased by 40% in 1990, to about 1 ,400 altogether. At least 500 of these programs compost only leaves on a seasonal basis (Glenn and Riggle, 1991). Such programs are more common in the Northeast than in other regions.
No estimates of the total tonnage of yard waste composted were found. However, yard waste constitutes 18-20% of MSW nationwide. The percentage varies between 0% and 40% from community to community, depending on socio-economic factors, land use (size of lots), age of the community, mix of residential and commercial buildings, and so forth (Deyle and Hanks, 1991 ; [463]).
143
For composting mixed MSW, the United States has 16 operating plants with a total combined design capacity of 2,050 tons per day (Apotheker, 1991a). Another 1 1 plants (with a combined capacity of 1 ,900 tons per day) are under construction (Apotheker, 199 1a). Most of the MSW composting facilities have small capacities; 1 1 of the 15 operating facilities have capacities of less than 100 tons per day (Glenn and Riggle, 1991). The largest U.S. facility is the 600 ton per day plant mentioned in the preceding subsection (Apotheker, 199 l a). That facility is the first U.S. operation to adopt composting technologies that have been widely and successfully used in Europe (Apotheker, 1991a). It is still in the start-up stage, and no evaluations of its
· performance have been published (Apotheker, 1991a).
Applications and Markets
No estimates of the amount of compost produced as part of MSW management programs have been published. There is, however, an apparent limit on the total amount that could be used. One source suggests that about 60 tons per acre per year is the maximum acceptable level for agricultural use, although larger quantities are acceptable for sod use (Rigo, 1991). More detailed information is provided in Appendix G.
The products of composting facilities are often difficult to sell, or even to distribute free of charge. Compost produced from yard waste is a more marketable product than compost made from mixed MSW (Hammer, 1992). Typically, compost from MSW competes with compost derived from sewage sludge and sawdust (Humber, 199 1), or with manure (Hammer, 1992). These competing products have a higher fertilizer nutrient value than the MSW compost (Humber. 1991). A study of yard waste compost prices reported a range of $0 to $25 per ton for the compost (Deyle and Hanks, 1991).
Use of compost made from MSW is made more difficult because many states have no standards for compost content; without standards, consumers often fear using a waste-derived product (Hammer, 1992). A consortium of U.S. university and government researchers have proposed nationwide U.S. standards, but others have been unable to reach agreement on what standards would be appropriate (Hammer, 1992). Canadian and European standards are ten times more restrictive with respect to some metals than the proposed U.S. standards (Hammer, 1992). All the mixed MSW composting facilities operating in 1991 for which testing data are available are reported to meet the proposed U.S. standards (Hammer, 1992).
Apparently, no state or federal agency has yet proposed standards for determining when a compost product has been "stabilized" (a stable, or "finished" compost can be stored without releasing objectionable odors, and it does not inhibit plant growth). No formal system of grading has been introduced to measure nitrogen-phosphorus-potassium content, particle size and uniformity, contaminants such as glass and plastic, and pathogens, pesticides, and toxics, if any.
MSW compost is frequently used for landfill cover. In that application, it substitutes for "earthen materials" (FR, 1991j). For example, of the 37,000 tons of compost made from MSW in the Delaware Reclamation Plant in 1990. 500 tons were sold, and the rest went to landfill. (see Appendix G, page G- 1 1). The new federal guidelines for daily cover (FR, 199 1j) call for 6 inches of "earthen materials," but the regulation is based on performance, not material (Cassidy, 199 1). As long as the cover controls disease vectors, fire, odors, blowing litter, and scavenging, it is likely to be a permissible exception to the regulation (FR, 1991k). However, because compost used as daily landfill cover is not intended to promote plant growth (the daily cover will
144

be covered with more MSW) or improve the soil, it has little special value in this application; furthermore, compost may be no more effective in decreasing landfill volume than shredding MSW, which eliminates the need for daily cover (see also CRSI, 1989). The use of compost in the final closure landftll cover may be beneficial.
A separate segment of the industry composts sewage sludge at more than 100 installations. In some sludge com posting operations, MSW is a useful additive to increase air circulation in the composting piles.
ENERGY BALANCE
This subsection presents the results of a life-cycle analysis of energy inputs and outputs over the 20-year time frame used in this study. The basis is 1 ton of MSW at the curb.
Energy Required for Processing
The composting process is low-temperature oxidation, but it recovers no energy. On the average, composting consumes about 100,000 Btu per ton for simple yard waste or leaf com posting, and about 300,000 Btu per ton for MSW preparation and com posting.
Energy requirements for particular composting systems are approximately as follows: "'''"·''
• lri.:.;vessel com posting (MSW)-300,000 Btu per ton of MSW • Static windrow (MSW)-246,000 Btu per ton of MSW • Turned windrow (MSW)-208,000 Btu per ton of MSW • Static windrow (yard waste)-106,000 Btu per ton of feed • Turned windrow (yard waste)-68,000 Btu per ton of feed
Preprocessing of MSW requires 140,000 Btu per ton (see Appendix G, page G-37). These requirements are comparable to the energy requirements for mixed waste materials recovery facilities but lower than those for RDF preparation (see Appendix A).
Energy Required for Separate Collection of Yard Waste
No published data on actual energy expended for separate collection of yard waste were found. Data for one city in California obtained by SRI International (City of Palo Alto, 1991) show that 2.3 million Btu were required per ton of yard · waste collected. Additimial details are provided in the later subsection entitled "Integrated Strategy Example" and in Exhibit II.
COST CONSIDERATIONS
Yard Waste
Only one report on yard waste com posting costs was found: a detailed study of capital and operating costs, as well as revenues (Deyle and Hanks, 199 1). The study compared composting options in Oklahoma, where landfill tipping fees are low (roughly $8 to $12 per ton).
For a leaf/grass com posting facility processing a minimum of 13 tons per day, capital costs were estimated as shown in Table 8. 1 . The operating costs estimated by Deyle and Hanks, in
145
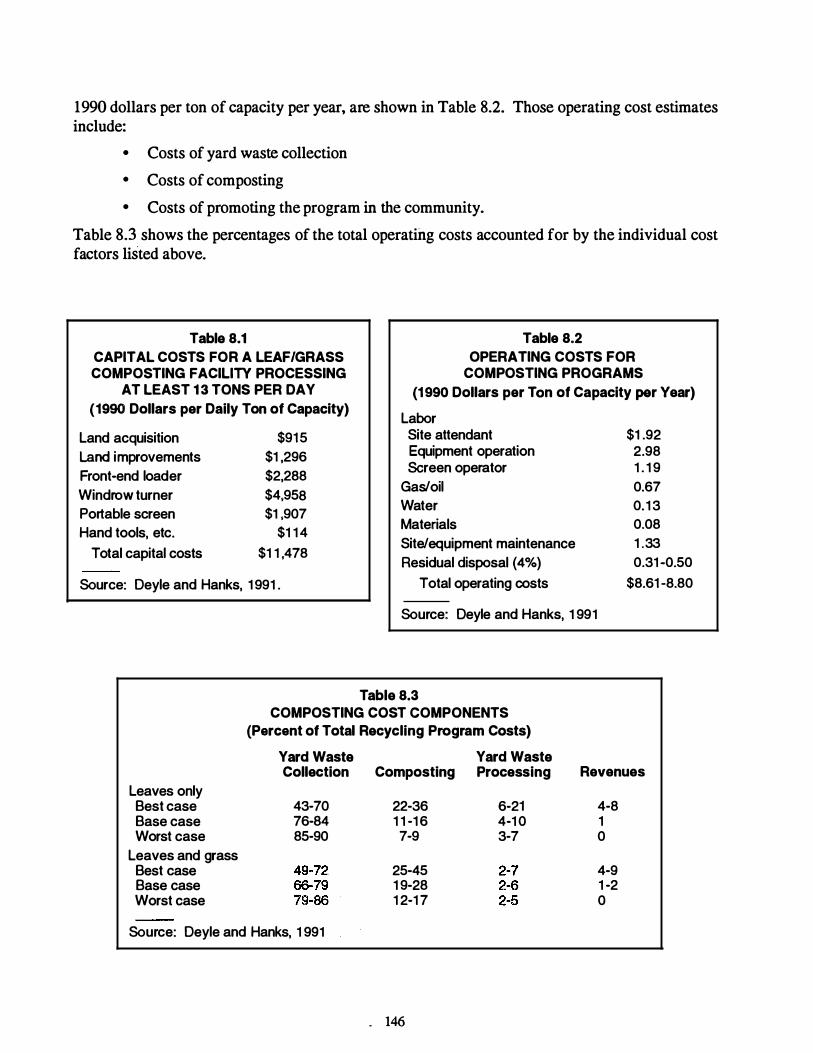
1990 dollars per ton of capacity per year, are shown in Table 8.2. Those operating cost estimates include:
• Costs of yard waste collection • Costs of com posting • Costs of promoting the program in the community.
Table 8.3 shows the percentages of the total operating costs accounted for by the individual cost factors listed above.
Table 8.1 CAPITAL COSTS FOR A LEAF/GRASS COMPOSTING FACILITY PROCESSING
AT LEAST 1 3 TONS PER DAY (1990 Dollars per Daily Ton of Capacity)
Land acquisition Land improvements Front-end loader Windrow turner Portable screen Hand tools, etc.
Total capital costs
$915 $1 ,296 $2,288 $4,958 $1 ,907
$1 1 4 $1 1 ,478
Source: Deyle and Hanks, 1 991 .
Table 8.2 OPERATING COSTS FOR
COMPOSTING PROGRAMS (1990 Dollars per Ton of Capacity per Year)
Labor Site attendant Equipment operation Screen operator
Gas/oil Water Materials Site/equipment maintenance Residual disposal (4%)
Total operating costs
Source: Deyle and Hanks, 1 991
Table 8.3
$1 .92 2.98 1 . 1 9 0.67 0.1 3 0.08 1 .33 0.31-0.50
$8.61 -8.80
COMPOSTING COST COMPONENTS (Percent of Total Recycling Program Costs)
Yard Waste Collection Composting
Leaves only Best case Base case Worst case
Leaves and grass Best case Base case Worst case
43-70 76-84 85-90
Source: Deyle and Hanks, 1 991
22-36 1 1 -1 6 7-9
25-45 1 9-28 1 2-1 7
. 146
Yard Waste Processing
6-21 4-1 0 3-7
Revenues
4-8 1 0
4-9 1 -2 0

Those costs may be partly or fully offset by revenues from selling all the product or valuing it for municipal use. In the Oklahoma study, Deyle and Hanks ( 1991) assumed revenues of $0 to $8 per ton, consistent with other materials. Nationwide, revenues ranging from $0 to $25 per ton have been reported (Deyle and Hanks, 199 1). However, revenues made up for only a small portion of the costs (see Table 8.3).
For the midrange (base) case program in Oklahoma, Deyle and Hanks ( 1991) found that the net cost of com posting added $ 1 per household per month above the cost of landfilling the waste. The results would be different for areas with tipping fees of $25-$ 100 per ton, but the difference would not necessarily be proportional to the difference in tipping fees (Deyle and Hanks, 1991). In areas where tipping fees are higher or compost products have a greater value, composting might be less costly than landfilling.
MSW Composting
Published data on MSW com posting costs are limited. Capital costs in the range of $40,000 to $80,000 per ton of daily capacity for MSW com posting and preprocessing facilities have been reported (Apotheker, 199 1a).
Figure 8.2 summarizes the capital cost estimates for 12 facilities published as of late 1991 (detailed costs are presented in Exhibit I).* Capital costs range from $21 ,600 to $73,540 per ton of MSW per'"day. Figure 8.3 shows the operation and maintenance (O&M) cost estimates for these plants. The average O&M cost is $66 per ton of MSW processed, and the range is $30 to $70 per ton. (Tipping fees range from $15 to $78 per ton.)
The investment costs show no scale effects: Investment is a linear function of capacity within the capacity range of 10 to 1 ,000 tons per day. O&M costs decline linearly with capacity, but the correlation is quite poor.
Despite the good correlation between investment cost and capacity, some caution is advisable in using the data. In many cases, the sources of the estimates fail to provide sufficient information to convert them to a consistent bases or to judge the reasons for the differences. For example, the finance charge for the capital investment for a given facility would be significantly affected by the prevalent interest rate at the time of project financing, but many sources fail to note that interest rate. Moreover, capital investment in general would be affected by the type and composition of the wastes and the plant site conditions, but many sources fail to provide data on these matters.
Similarly, the O&M costs are affected by site-specific conditions such as labor rates, labor contracts, safety rules, the size of the crew, and so on. Again, information on these factors is rarely provided in the literature. ·Tipping fees generally reflect the capital and O&M costs of a facility, but in some communities the tipping fee is levied as a tax on all residents. The arrangements for a given facility are rarely described in the sources from which the data presented in this report are derived.
* To standardize the presentation of costs, all published estimates have been updated to a mid-1991 time frame by using SRI International's PEP Cost Index. Unit capital costs and operations and maintenance (O&M costs) are presented in dollars per ton of MSW as collected. If data on individual cost items were unavailable, estimates based on reasonable assumptions were used. The bases for the data are described in detail in Exhibit I.
147
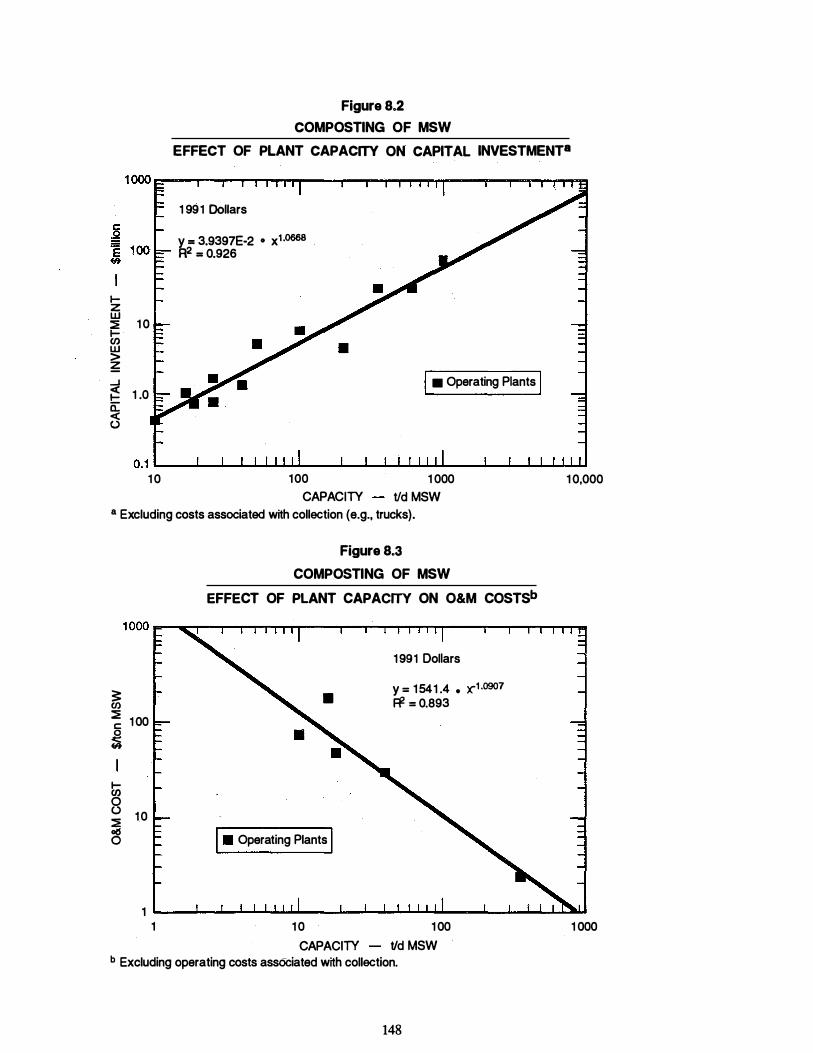
Figure 8.2
COMPOSTING OF MSW
EFFECT OF PLANT CAPACITY ON CAPITAL INVESTMENT•
1-z w � 1 0 I-f/) w > � ....J � 1 .0 0::: < ()
1 991 Dollars
y = 3.9397E-2 • x1·0668 R2 = 0.926
j • Operating Plants I
0.1 ------�--_.��._ ________ _.��._--�----��� 1 0 100
CAPACITY 1 000
tid MSW a Excluding costs associated with collection (e.g., trucks).
3: fJ) � 1 00 c: � � 8 §
10
Figure 8.3
COMPOSTING OF MSW
EFFECT OF PLANT CAPACITY ON O&M COSTSb
•
l • Operating Plants I
1 991 Dollars
y = 1 541 .4 • x-1 ·0907 � = 0.893
1 0,000
1 �--������._--�-.....�����._--�����uau 1 1 0
CAPACITY 1 00
tid MSW b Excluding operating costs associated with collection.
148
1 000
ENVIRONMENTAL RELEASES
This subsection presents the results of a life-cycle analysis of emissions. The bases are the same as those used for calculating the energy balance. Data on releases from composting are limited and incomplete. The information in this subsection should therefore be used with caution.
This subsection presents data or releases from composting alone. Air emissions from separate collection are included in the "Integrated Strategy Example" in a later subsection.
Air Emissions
Air releases from composting include emissions from the preparation steps, in the form of dust, and emissions from the compost as it warms and is aerated during composting. If yard wastes for composting are collected separately, emissions resulting from that step should be included.
The primary emissions are water vapor and C02, but it is reasonable to expect that volatile solvents in the MSW will be vaporized during aeration. If the process is not carefully controlled, the piles of compost can become anaerobic, releasing methane and foul odors. One new, large (150 ton per day), mechanized facility (Agripost) was recently closed because of odor problems (Allen, 1991). The 600 ton per day facility that uses the Dano Drum was reported to have odor problems, at'ieast during startup (Apotheker, 1991a). Other air releases include the inevitable odor of MSW (CRSI, 1989); dust from turning, screening, and packaging; and possibly release of bacteria.
Water Emissions
Com posting requires the addition of water above the amount normally in the refuse. In the largest U.S. facility, the water content of the incoming MSW is 23%, and the level is doubled for com posting. Because of evaporation during composting, the final product is 40% moisture. To prevent water emissions in outdoor composting, the compost must be protected from snow and rain, or the composting must take place on an impervious surface so that the leachate and runoff can be collected or sent to a sewage treatment plant, if the local plant will accept it (CRSI, 1989).
Land Use
Composting requires more space than most waste management options because of the time required for composting and subsequent "stabilization." For complete reaction and aeration, composting windrows, for example, should not exceed 6 feet in height (Apotheker, 1991a); that constraint limits how high the MSW or yard waste can be piled.
The 600 ton per day MSW composting facility composts the material in two areas, each of which is 150 feet by 350 feet. The compost is aerated in 6-foot-high piles for 2 1 days, and then removed to other areas 75 feet wide by 350 feet long for another 21 days. Altogether, the waste is processed and stored for at least 6 weeks, and the facility must be large enough to hold that amount of material for that length of time.
The processing and storage period for yard waste is 1 to 3 years. Thus, significantly larger land areas would be requirea to process the same volume of compost as is processed in the MSW composting facility described above.
149
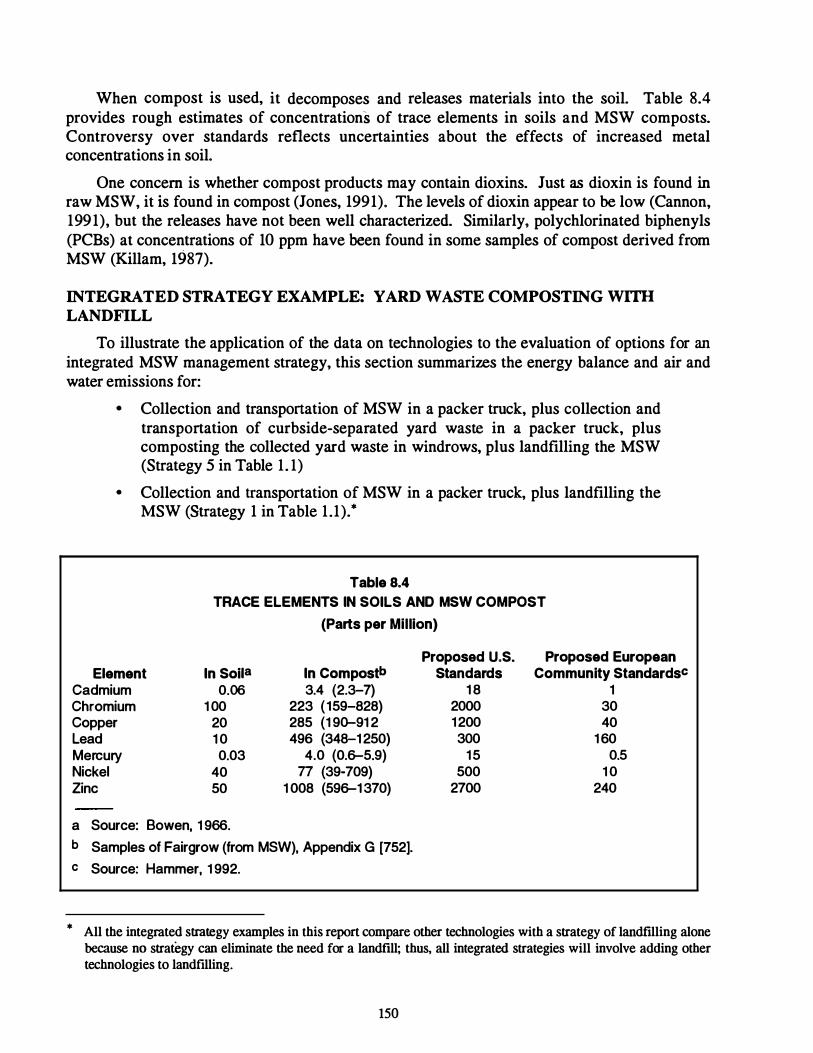
When compost is used, it decomposes and releases materials into the soil. Table 8.4 provides rough estimates of concentrations of trace elements in soils and MSW composts. Controversy over standards reflects uncertainties about the effects of increased metal concentrations in soil.
One concern is whether compost products may contain dioxins. Just as dioxin is found in raw MSW, it is found in compost (Jones, 1991). The levels of dioxin appear to be low (Cannon, 1991), but the releases have not been well characterized. Similarly. polychlorinated biphenyls (PCBs) at concentrations of 10 ppm have been found in some samples of compost derived from MSW (Killam, 1987).
INTEGRA TED STRATEGY EXAMPLE: YARD WASTE COMPOSTING WITH LANDFILL
To illustrate the application of the data on technologies to the evaluation of options for an integrated MSW management strategy, this section summarizes the energy balance and air and water emissions for:
• Collection and transportation of MSW in a packer truck, plus collection and transportation of curbside-separated yard waste in a packer truck, plus composting the collected yard waste in windrows, plus landfilling the MSW (Strategy 5 in Table 1 . 1)
• Collection and transportation of MSW in a packer truck, plus landfilling the MSW (Strategy 1 in Table 1 .1).*
Table 8.4 TRACE ELEMENTS IN SOILS AND MSW COMPOST
(Parts per Million)
Element Cadmium Chromium Copper Lead Mercury Nickel Zinc
In SoiJa 0.06
1 00 20 1 0 0.03
40 50
a Source: Bowen, 1 966.
In Compostb 3.4 (2.3-7)
223 (159-828) 285 (1 90-91 2 496 (348-1 250)
4.0 (0.�5.9) 77 (39-709)
1 008 (59� 1 370)
b Samples of Fairgrow (from MSW), Appendix G [752]. c Source: Hammer, 1 992.
Proposed U.S. Standards
1 8 2000 1 200 300
1 5 500
2700
Proposed European Community Standardsc
1 30 40
1 60 0.5
1 0 240
* All the integrated strategy examples in this report compare other technologies with a strategy of landftlling alone because no strategy can eliminate the need for a landfill; thus, all integrated strategies will involve adding other technologies to landftlling.
150
Table 8.5 shows the energy and emissions over .a 20-year period from adding curbside collection of yard waste for com posting to landfilling alone. The estimates in the table include energy and emissions for normal collection of MSW, the emissions and leachate from the landfill, and the energy recovered from the landfill gas, along with the energy and emissions for collection and transportation of the yard waste and for com posting. The results are separated into transportation, processing (composting), and disposal (landfilling the remainder). Table 8.6 presents the same data for the landfill strategy.
Detailed data on yard waste programs are extremely limited. The data used in Table 8.5 were collected by SRI International from community officials of an affluent residential/ commercial community in California (City of Palo Alto, 1991). The data should be considered illustrative only; additional examples are needed to draw reliable conclusions.
Although the community has conducted an active program of curbside collection of recyclables for more than 12 years, its yard waste composting program has been operating for only a year. The program operates year round, and because of the mild climate in the area, seasonal variations in quantities collected are not great.
Because . of the extensive transportation requirements, the net energy balance for the integrated strategy that includes yard waste com posting is a loss. The energy recovered from the uncomposted 'landfill does not quite offset the fuel use. Air emissions are also higher for the yard waste strategy than they are for landfilling alone.
Energy requirements and air emissions depend on the efficiency of truck use. The factors that influence truck use efficiency include:
• The time the truck is traveling • The size of the load picked up • The percentage of the truck that is filled before it returns to the landfill.
The program has high air emissions and large energy requirements per ton of waste because the small quantities of yard waste set out for collection result in inefficient use of trucks. A single stop for MSW at each location produces lower emissions than many separate stops for smaller loads. If trucks are not filled before they return to the landfill, additional inefficiency is incurred. For curbside collection of yard waste, the community uses its largest trucks because they have compacting mechanisms, but they are rarely more than 25% full when they complete their extended routes and return to the landfill. As a result, truck emissions per ton of yard waste collected are up to 30 times the rate for collection for landfilling alone. Clearly, programs that collect larger quantities of yard waste per trip would have dramatically lower emissions per ton.
Details of the calculations used to obtain estimates of emissions and energy consumption are presented in Exhibit II. The computerized version of the data base allows a user to change the collection amounts and the measures of collection efficiency used in this report, and to enter the actual miles traveled.
151
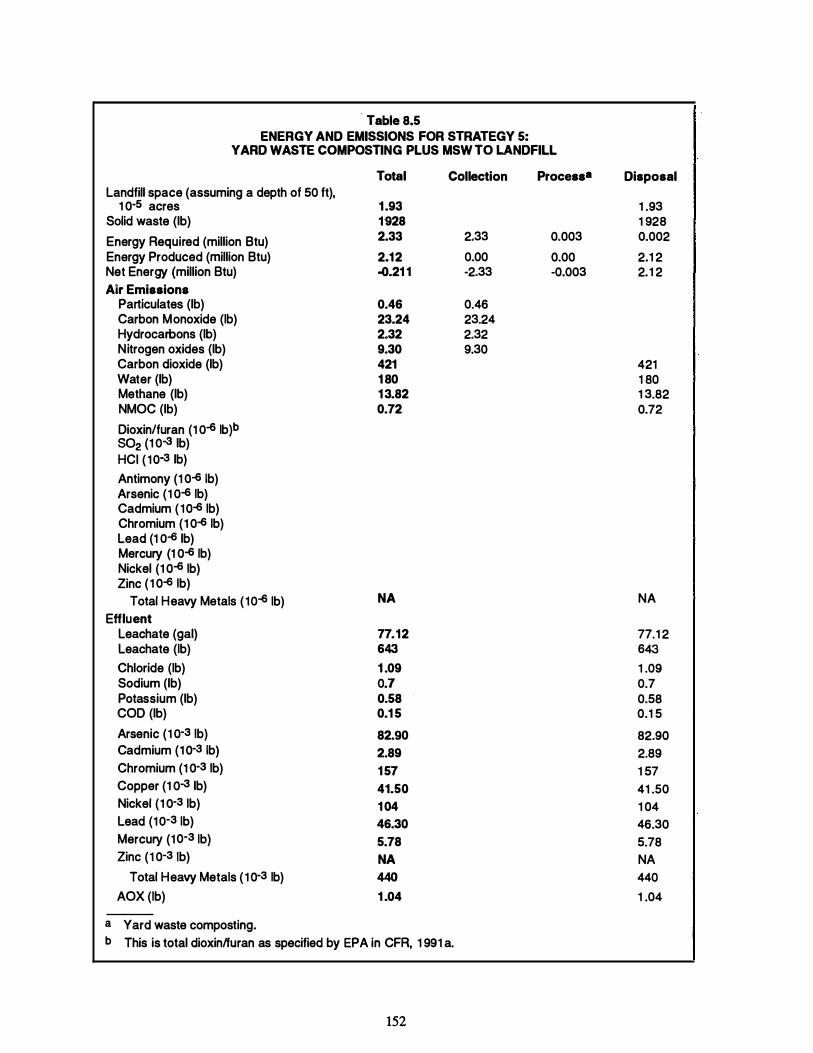
· Table 8.5 ENERGY AND EMISSIONS FOR STRATEGY 5:
YARD WASTE COMPOSTING PLUS MSW TO LANDFILL
Total Collection Landfill space (assuming a depth of 50 ft),
1 0-s acres Solid waste (lb) Energy Required (million Btu) Energy Produced (million Btu) Net Energy (million Btu) Air Emissions
Particulates (lb) Carbon Monoxide (lb) Hydrocarbons (lb) Nitrogen oxides (lb) Carbon dioxide (lb) Water (lb) Methane (lb) NMOC (lb) Dioxin/furan (1 Q-6 lb )b so2 (1 o-a lb) HCI ( 10-3 lb) Antimony (1 0-6 Jb) Arsenic (1 0-6 1b) Cadmium ( 10-6 1b) Chromium (1 0-6 1b) Lead (1 o-e lb) Mercury {1 0-6 lb) Nickel (1 0-6 1b) Zinc ( 1 0-6 1b)
Total Heavy Metals (10-6 1b) Effluent
Leachate (gal) Leachate (lb) Chloride (lb) Sodium (lb) Potassium (lb) COD (lb) Arsenic (1 0-3 1b) Cadmium (1 0-3 Jb) Chromium (1 0-3 1b) Copper ( 1 Q-3 lb) Nickel (1 Q·3 1b) Lead (1 o-3 lb) Mercury (1 o-3 lb) Zinc (1 0·3 Jb)
Total Heavy Metals ( 1 0·3 lb) AOX (lb)
a Yard waste composting.
1 .93 1928 2.33
2.12 ..0.21 1
0.46 23.24 2.32 9.30 421 1 80 1 3.82 0.72
NA
77.12 643 1 .09 0.7 0.58 0.1 5
82.90 2.89 1 57 41.50 1 04 46.30 5.78 NA 440 1 .04
b This is total dioxin/furan as specified by EPA in CFR, 1 991 a.
152
2.33 0.00 -2.33
0.46 23.24 2.32 9.30
Process•
0.003 0.00 -0.003
Disposal
1 .93 1 928 0.002 2.1 2 2. 1 2
421 1 80 1 3.82 0.72
NA
77.1 2 643 1 .09 0.7 0.58 0.1 5 82.90 2.89 1 57 41 .50 1 04 46.30 5.78 NA 440 1 .04

Table 8.6 ENERGY AND EMISSIONS FOR STRATEGY 1 : LANDRLL WITH GAS RECOVERY
Total Collection Landfill space (assuming a depth of 50 ft),
1 0-s acres Solid waste (lb) Energy Required (million Btu) Energy Produced (million Btu) Net Energy (million Btu) Air Emissions
Particulates (lb) Carbon Monoxide (lb) Hydrocarbons (lb) Nitrogen oxides (lb) Carbon dioxide (lb) Carbon dioxide-combustion (lb) Water (lb) Methane (lb) NMOC (Ib) Dioxin/furan (1 0-6 1b)a so2 (1 o-3 lb) HCI (1 0-3 1b) Antimony {1 0-6 1b) Arsenic (1 0-6 1b) Cadmium ( 10-6 lb) Chromium ( 10-6 1b) Lead (1 o-6 lb) Mercury (1 0-6 1b) Nickel (1 0-6 lb) Zinc ( 10-6 1b)
Total Heavy Metals ( 10-6 1b) Effluent
Leachate (gal) Leachate (lb) Chloride (lb) Sodium (lb) Potassium (lb) COD (lb) Arsenic (1 0-3 1b) Cadmium (1 0-3 1b) Chromium (1 0-3 1b) Copper (1 0-3 1b) N ickel (1 0-3 lb) Lead (1 o-3 lb) Mercury (1 0-3 lb) Zinc (1 Q-3 1b)
Total Heavy Metals ( 1 0-3 1b) AOX (lb)
2.00 2000
0.081 2.20 2.1-2
0.02 0.79 0.08 0.32 225 212 1 88 1 4.34 0.75
NA
80 667
1 .1 3 0.73 0.60 0.1 6
86 3 1 63 43 1 08 48 6 NA 457
1 .08
a This is total dioxin/furan as specified by EPA in CFR, 1 991 a.
153
0.079 0.00 -0.079
0.02 0.79 0.08 0.32
l Process Disposal
2.00 2000 0.002 2.20 2.20
NA 225 212 1 88 1 4.34 0.75
NA
80 667 1 . 13 0.73 0.60 0. 1 6 86 3 1 63 43 1 08 48 6 NA 457 1 .08
IMPORTANT INTEGRATED STRATEGIES DESCRIBED IN THE DATA BASE
The computerized data base also allows the user to analyze the effects of combining com posting with any other technologies in an integrat�d MSW management strategy. Calculations for the following integrated strategies that include composting have already been performed and are included in the data base:
• Collection and transportation of MSW in a packer truck, plus collection and transportation of curbside-separated recyclables in a multi-compartment truck, plus MRF operations and remanufacturing, plus on-site RDF preparation and metal recovery, plus composting of RDF, plus landfilling RDF rejects (Strategy 9 in Table 1 . 1)
• Collection and transportation of MSW in a packer truck, plus collection and transportation of curbside-separated recyclables in a multi-compartment truck, plus collection and transportation of curbside-separated yard waste in a packer truck, plus MRF operations and remanufacturing, plus yard waste composting, plus landftlling the remaining MSW (Strategy 10 in Table 1 .1)
• Collection and transportation of MSW in a packer truck, plus collection and transportation of curbside-separated recyclables in a multi-compartment truck, plus collection and transportation of curbside-separated yard waste in a packer truck, plus MRF operations and remanufacturing, plus yard waste composting, plus mass burning of the remaining MSW, plus landfilling the ash in a monoflll (Strategy 11 in Table 1. 1).
Strategy 9 includes com posting of RDF instead of yard waste.
MISSING DATA AND RESEARCH NEEDS
In general, published data on composting of MSW and yard waste are quite limited. Important gaps are summarized in the following subsections.
Technology
Municipal Solid Waste
To date, success in composting MSW to produce a marketable product is quite rare. Facilities for large-scale comp9sting of MSW are encountering engineering and process control · problems (Allen, 1992). Increased application of the technology may depend on research to identify the causes of those problems and engineering development work to find better solutions ·
to operational problems.
Mechanical processing, either before or after composting, has been a major technical barrier to successful MSW operations because some systems are inappropriately designed (CRSI, 1989). Many appear to be designed to minimize initial capital cost or to minimize O&M costs. Initial operations often indicate the need for significant modifications of such plants (CRSI, 1989).
Troublesome problems with odor have been reported at some plants. Biofiltration is used for odor control at some composting facilities, but it requires relatively large areas and
154
sophisticated operational control, and perfonnance is frequently poor. The fate of odoriferous compounds absorbed in the bioftlter is not well known.
Yard Waste
Some communities are quite restrictive about the types of yard waste they will accept for com posting. Such restrictions are apparently required because of the equipment that the communities have chosen. The influence of such barriers to public participation has not been well characterized.
Markets
Municipal Solid Waste
MSW -derived compost fares worse than composts derived from sewage sludge, manure, and yard waste in the competition for available markets (Hammer, 1992). Acceptance of MSWderived compost will require a clearer understanding of appropriate uses for it. Solutions to that problem might include:
• A better rationale for setting standards • A .better understanding of the effects of contaminants on land and crops • Greater product consistency.
Yard Waste
Data on the following important topics were limited, unreliable, or unavailable: • The impact of curbside collection programs, particularly of household
hazardous waste, on the quality of compost products • Concentrations of toxics and pathogens in compost made from yard waste
(CRSI, 1989) • The effect of metals and chemicals in the compost on the food chain (CRSI,
1989).
Environmental Releases
No data on emissions from collection for composting were found. Once compost is made and applied to land, it may undergo only aerobic decomposition; if so, it would release little methane. No studies of any emissions from compost in use were found.
Municipal Solid Waste
No quantitative information was found for the following subjects : • Amounts and identity of volatile organic compounds (VOCs) released during
composting and curing • Specific emissions during com posting from discarded volatile solvents • Emissions from treatment of leachate.
155
Yard Waste
Little information is available about the nature and effectiveness of programs for curbside collection and com posting of yard waste. Missing data include:
Costs
• Emissions released during composting and curing • Disposition of the product, including quantities used as daily landfill cover or
otherwise disposed of as waste • The long-term environmental impacts of the eventual products of MSW
composting in various applications.
Few comparisons of the costs of com posting with those of other MSW management options have been published. Cost data on a consistent basis are needed to provide the foundation for such comparisons. (Exhibit I describes the difficulties in developing cost comparisons in greater detail.) Cost estimates for many installations have been notoriously inaccurate (CRSI, 1989).
System Evaluations
The benefits and costs of composting programs have been examined less carefully than those of other components of MSW management strategies because composting has been a small-scale contributor to the field. Given the increasing popularity of com posting, a thorough evaluation seems overdue.
The value of compostirig of either yard waste or MSW to an overall management strategy is difficult to evaluate because limited data are available on:
• Energy requirements • Transportation requirements and emissions
• Percentage of the compost produced that is beneficially used.
A system study could help to fill these data gaps.
156
9. LESS COMMONLY USED TECHNOLOGIES
This section provides overviews of three potentially useful MSW management technologies that are not in common use in the United States today:
• Anaerobic digestion • Cofrring RDF with coal for power production
• Gasification/pyrolysis.
To the extent possible, the section describes these three technologies and their energy balances, emissions, and costs. The available data are extremely limited because the technologies are rarely used at present Additional development work is needed to demonstrate the practicality of these technologies as components of integrated MSW management strategies.
ANAEROBIC DIGESTION
In anae�9bic digestion, the organic materials in MSW, which are first separated from the MSW by preprocessing, are biologically converted into methane and C{h. The anaerobic de-composition of MSW that occurs in landfills entails the same processes, but .it requires much more time for completion and is uncontrolled compared with the intentional anaerobic treatment of organic materials. The term "anaerobic digestion" usually refers to a process that is optimized to generate gas; in the process of doing so, the digestion also reduces the volume of the organic portion of MSW by 50%.*
The advantages attributed to the process are recovery of a high fraction of the energy (up to 55%) in the organic fraction of MSW as methane, and production of a compost that can be used as a soil amendment. Anaerobic digestion recovers energy from MSW slowly when compared to combustion, but digestion is very fast when compared to energy recovery by methane generation from landfills. Anaerobic digestion retention times range from 10 to 30 days (see Appendix H, page H-19ff), as opposed to the 2 to 20 years that a landfill requires to release one-half the methane it will generate (Augenstein and Pacey, 1991).
Technology Description
A typical system entails the four basic steps described below.
Preprocessing
As in RDF or aerobic compost preparation, MSW is separated into an organic-rich fraction that is then shredded or otherwise comminuted. The organic fraction is mixed with water, which is removed at the end of the process, or with sewage sludge, which provides a source of water.
Anaerobic Digestion
The mixture is placed in an air-tight reactor for 10-30 days, and a warm temperature is maintained in the reactor. Microorganisms react with the feedstock, and the dry weight of the
* Anaerobic composting, a similar process, was defmed in the introduction to Section 8.
157
organics declines by about 50% during the process. The gas produced is collected for use or for upgrading and sale.
Residue Treatment
The decomposed residue is removed from the reactor and then composted at the plant in a normal, aerobic fashion to stabilize the residue and remove odors. This stage of the com posting, which can be done in a vessel or in piles (Larsen Engineers, 1991), takes 2 days (Chynoweth and Le Grand, 1989) to 6 weeks (OWS, 1991).
Final Uses
The gas produced can be used in the digestion plant for fuel to provide process heat and to dry the compost if necessary. The gas, which has about 500-600 Btu per cubic foot, can also be upgraded to pipeline quality methane (1,000 Btu per cubic foot). The compost can be used in municipal projects, sold, or com busted to provide more energy (Larsen Engineers, 1991).
Most U.S. experience has been with pilot and demonstration plants with solids content of about 5% and with large quantities of water added to carry out the reaction. This approach requires large reactors and thus high capital costs. Two pilot and demonstration plants have been operated in the United States-the RefCoM plant at Pompano Beach, Florida, and the Solcon plant at Walt Disney World in Orlando, Florida. Both added sewage sludge · to MSW before anaerobic composting. A laboratory-scale prototype under investigation at the University of California at Davis has apparently operated with and without sewage sludge [450].
The RefCoM plant, which ran from 1977 to 1985, was designed to process more than 200 tons per day of MSW and 5 to 10 tons per day of sewage solids. but it never achieved that capacity (Renewable Energy Systems, 1990). The small Solcon experimental test unit was designed to produce methane directly, thereby avoiding the costs of separating methane from C(h; the unit achieved a product gas with a methane content of 93%.
Two commercial processes are used in Europe-those of Dranco and V alorga (discussed below). Neither adds sludge, and both operate with much less moisture than either the RefCoM or Sol con plants. In this newer technology, called high-solids anaerobic com posting� a solids content of 30% or more is used (Logsdon, 1990).
Appendix H presents more detailed information on these technologies and on individual installations.
Commercial Status
In Europe, the French company Valorga operates approximately eight plants in France that treat from 44 to 300 tons per day of mixed MSW using anaerobic digestion. The Belgian company OWS has been operating a pilot plant (27.5 tons per day) since 1984 and has one larger commercial-scale plant nearing completion. with start-up scheduled in 1992. ows· process is known by the acronym DRANCO (Larsen Engineers, 1991).
The United States has no commercial facility. In addition to the RefCoM and Solcon demonstration plants described above, the University of Florida operates a sequenced batch anaerobic composting (SEBAC) process, which is a high-solids pilot plant (Chynoweth et al., 1990).
158
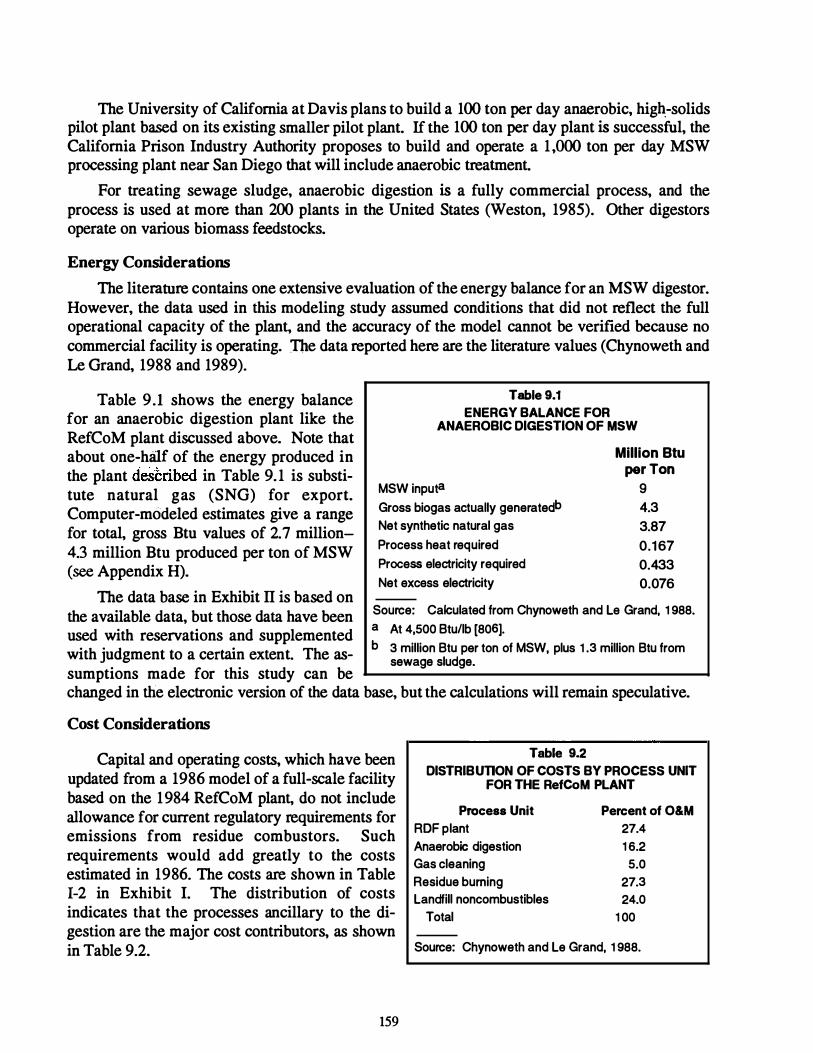
The University of California at Davis plans to build a 100 ton per day anaerobic, hig�-solids pilot plant based on its existing smaller pilot plant. If the 100 ton per day plant is successful, the California Prison Industry Authority proposes to build and operate a 1 ,000 ton per day MSW processing plant near San Diego that will include anaerobic treatment.
For treating sewage sludge, anaerobic digestion is a fully commercial process, and the process is used at more than 200 plants in the United States (Weston, 1985). Other digestors operate on various biomass feedstocks.
Energy Considerations
The literature contains one extensive evaluation of the energy balance for an MSW digestor. However, the data used in this modeling study assumed conditions that did not reflect the full operational capacity of the plant, and the accuracy of the model cannot be verified because no commercial facility is operating. l'h.e data reported here are the literature values (Chynoweth and Le Grand, 1988 and 1989).
Table 9.1 shows the energy balance for an anaerobic digestion plant like the RefCoM plant discussed above. Note that about one-haJJ of the energy produced in the plant described in Table 9. 1 is substitute natural gas (SNG) for export. Computer-modeled estimates give a range for total, gross Btu values of 2. 7 million-4.3 million Btu produced per ton of MSW (see Appendix H).
The data base in Exhibit II is based on the available data, but those data have been used with reservations and supplemented with judgment to a certain extent. The assumptions made for this study can be
Table 9.1 ENERGY BALANCE FOR
ANAEROBIC DIGESTION OF MSW
MSW inputa Gross biogas actually generatedb Net synthetic natural gas Process heat required Process electricity required Net excess electricity
Million Btu per Ton
9 4.3 3.87 0.167 0.433 0.076
Source: Calculated from Chynoweth and Le Grand, 1 988. a At 4,500 Btu/lb (806). b 3 million Btu per ton of MSW, plus 1 .3 million Btu from
sewage sludge.
changed in the electronic version of the data base, but the calculations will remain speculative.
Cost Considerations
Capital and operating costs, which have been updated from a 1986 model of a full-scale facility based on the 1984 RefCoM plant, do not include allowance for current regulatory requirements for emissions from residue combustors. Such requirements would add greatly to the costs estimated in 1986. The costs are shown in Table 1-2 in Exhibit I. The distribution of costs indicates that the processes ancillary to the digestion are the major cost contributors, as shown in Table 9.2.
159
Table 9.2 DISTRIBUTION OF COSTS BY PROCESS UNIT
FOR THE RefCoM PLANT
Process Unit RDF plant Anaerobic digestion Gas cleaning Residue burning Landfill noncombustibles
Total
Percent of O&M 27.4 1 6.2 5.0
27.3 24.0
1 00
Source: Chynoweth and Le Grand, 1 988.
Using a model, costs for the University of Florida's SEBAC process were estimated [852]. The estimated costs are likely to be lower than actual because no plants have been built. Updated costs for plants are included in Exhibit 1
Environmental Releases
Although claims have been made that anaerobic composting results in fewer environmental releases than mass burning (Chynoweth and Le Grand, 1988 and 1989). it is difficult to document expected advantages until the technology is proven. Such claims are often based on comparing expected releases from a hypothetical plant with emissions from MSW combustors operating under out-of-date emissions regulations.
Exhibit II sets forth estimates for an anaerobic digestion plant. Note that the data are incomplete and therefore underestimate emissions. Some estimates have been used to compensate for the lack of data, but those estimates are speculative.
Missing Data and Research Needs
No full-scale plant is operating in the United States. Until one is constructed, a consistent set of data to use in documenting energy. environmental releases, and costs will be lacking.
The largest existing facilities-300 tons per day, which operate in France-would be useful for many U.S. communities. The 1 ,000 ton per day San Diego facility will be valuable in providing information to evaluate all the parameters of the technology.
COFDUNG RDF vnTH COAL FOR POWER PRODUCTION
Introduction
RDF cofiring combines two or more materials as feed to a boiler. Although other fossil fuels can be used, the combination of RDF and coal has been used by electric utilities because the two fuels are ordinarily burned in a similar manner, using the same generic equipment. The RDF can either be produced at the power plant site or be shipped from another, generally nearby location. It is more frequently produced at another location. Coffing can permit a community to avoid the substantial cost of building a new dedicated MSW combustion facility.
Preparati<?n of RDF was discussed in the section on RDF. This section focuses on the differences between frring RDF with coal and fuing RDF alone.
Technology Description
For firing, RDF is combined with pulverized coal and fed to the frre box. Cyclone and semisuspension spreader stoker feed systems are often used. The boiler, steam turbine, and electrical generation subsystems are the same as those used in conventional coal-fired electricity generating units. The fuel handling and ash removal portions of the plant are slightly larger than in conventional coal-fired units because cofiring of RDF requires larger fuel volumes and produces larger quantities of ash. The conventional SOx and particulate removal systems installed on the original units for burning coal usually require no modification when the plant is converted for cofiring. Electrostatic precipitators are reported to have lower efficiencies in cofiring plants, but the efficiency of bag houses is not affected by cofiring (McGowin, 1991).
160
At present the characteristics of the fuel mixture and those of the frre box and boiler limit the amount of RDF that can be burned. The boiler output of the unit is generally kept near or above 50% of the nominal unit capacity before RDF is added to avoid flame loss, and the heat supplied by the RDF is kept below 25% of the total needed; 10-15% is more common (McGowin, 1991).
Commercial Status
At present, although 40 plants in the United States now make RDF and/or use RDF as a fuel source, only 3 U.S. electric utilities cofire RDF with coal to generate power. The existing cofll'ing plants, with a combined capacity of 564 MW, have been operating for some years, as shown in Exhibit I. Six other units with a combined capacity of 1 ,29 1 MW have operated in the past but have been shut down, primarily for economic reasons (see Appendix B for additional details). The most recent closure was in 199 1 (McGowin, 1992). Although cofiring with coal for power production accounts for only 3% of the total RDF consumed, the three operating plants, as well as the six that have been abandoned, provide evidence that the technology can work.
Because of the extensive processing required to make RDF from MSW, RDF preparation plants tend to be fairly large; capacities of 1 ,000-2,000 tons per day are common. A 500 MW coal-fired power unit operating at an average of 65% of capacity and using RDF for 10% of the heat input W:iil consume the output of a 660 ton per day RDF installation. Efficient use of RDF will require utility plants in the 500 to 1,000 MW range, perhaps configured as multiple units to ensure continuous use of the RDF produced.
Utilities generally have little economic or operational incentive to convert coal-fired boilers to cofiring projects. Utilities have important concerns about the use or introduction of RDF into existing boilers. Some of the concerns are regulatory (see the "Environmental Releases" subsection below), but others are related to performance. Because only about 10-15% of the heat release during normal fll'ing will come from RDF, the major concern of utilities is whether RDF might interfere with plant operations. The potential for additional problems with ash slagging and/or boiler tube erosion is a factor in utility decisions.
Energy Considerations
The use of RDF for power production displaces coal. Current utility plants have been optimized for the fuel they use. Switching to RDF will lower the efficiency of the boiler by about 2-3% (McGowin, 199 1), and the utility will lose power generating capacity. The total saving of coal achieved by cofiring at 10% of the heat content, is about 5.3-5.7% when the energy consumed in preparing the RDF from MSW is included.* This calculation neglects the costs of producing the coal. Mining and delivery of Eastern coal to the plant will require approximately 0.26 to 0.3 1 million Btu per ton of coal, or about 1 .1-1.3% of the energy content
* Estimates based on individual process energy requirements [888] indicate that the processing of MSW to RDF requires from 27 to 39 kilowatt-hours (kWH) per short ton of RDF produced. At an energy equivalent of 10,000 Btu per kWh, that quantity is 2.3-3.3% of the energy content of the RDF. (If the RDF plant heat-to-electricity conversion rate of 1 5,450 Btu per kWh is used, the energy for RDF preparation ranges from 3.54 to 5.1% of the energy recovered.) The remainder of the loss in net electricity produced reflects the lower efficiency in the conversion of heat energy to electricity by the coftred unit, compared to a coal-only unit.
161
of the coal.* If these losses are charged to the coal-only unit's efficiency, the overall coal energy savings for coftring RDF with the coal is about 5%.
The conversion efficiencies for cofiring RDF with coal in a boiler are substantially higher than those for other electricity generation technologies based on MSW. Even if the larger of the energy requirements for RDF processing are assumed, the efficiency of power production when RDF is cofrred is higher than that from mass burning of MSW. Coftring at a 10% heat content level is expected to be approximately 1.4% more efficient in the use of RDF than simple RDF firing.t
Environmental Releases
The environmental regulations for any new cofrred unit that uses 30% or less by weight of RDF are not subject to the standards applied to municipal waste combustors. They fall instead under the requirements for fossil-fuel-fired installations (CFR, 199 1d; FR. 1991a). New cofrred units will be expected to conform to the standards established by the Clean Air Act Amendments of 1990 (P.L. 101-549, especially 104 STAT 2584) for acid gas emissions. These generally will call for emissions lower than 1.20 pounds S<h, and 0.45 pound NOx per million Btu.
Compared with firing coal alone, RDF cofiring is expected initially to produce smaller quantities of so2. but larger amounts of particulates and hydrogen chloride, as well as larger quantities of ash that contains metals (e.g., lead and cadmium) and organics. However, conventional pollution control technologies are expected to permit RDF cofiring units to meet federal emissions standards (McGowin, 1991).
Because of the low fuel value and density of RDF, its use would substantially increase truck traffic to the power plant. Thus, it would increase transportation-related environmental emissions in the neighborhood.
Cost Data
The Department of Energy (DOE) and the Electric Power Research Institute (EPRI) have developed guidelines for model cofrring. projects in terms of design criteria, capital and operation and maintenance (O&M) costs, and other factors (Fiscus, 1988a�). A summary of the results, derived from a later report (McGowin, 1991), is provided in Appendix B. The three example plants considered in the DOE and EPRI study were used with the data for two operating RDFcoal-frred plants to develop the cost estimates for this study. Details of those estimates, normalized to reflect 1991 costs, are provided in Exhibit I.
The data provided by EPRI for 1984 conditions show that the additional capital cost associated with building a new plant to cofire RDF are only slightly greater than the costs for a coal-only installation. Unit capital costs also vary with plant size and may differ by as much as 5-6% according to the coal to be burned. The additional cost for a cofired unit using an Eastern coal is estimated at $22 per kilowatt (1.8%) for a plant consisting of two 200-MW units and $17 per kilowatt ( 1.4%) for a plant consisting of two 500-MW units. Under financing and other
* This estimate assumes underground mining and transportation by unit train for a distance of 180 miles or by truck for a distance of 50 miles (Kinderman et al., 1975).
t Assuming standard heat content and heat rate values.
162
conditions characteristic of utility operations, these differences in capital costs will increase the cost of electricity attributable to capital by 0.8 and 0.5 mill per kWh ( 10-year levelized values), respectively, for the smaller and the larger cofning plants operating at a 65% capacity factor.
Retrofitting a coal plant with two 50-MW units to accept RDF as well is relatively more costly. The additional capital cost is $40 per kilowatt, and the resulting increase in capital charges is 1 .2 mills per kWh.
The O&M costs are higher for all the example retrofitted cofiring plants, but they decrease as the size of unit increases. The higher costs estimated for the cofired units arise in part from the impurities in RDF that may increase corrosion and erosion in the boiler, cause slagging, and require additional maintenance.
Overall the retrofitted cofiring plant has a higher electricity cost of 1 .2 mills per kWh generated when it is compared to a coal-only unit. On the other hand, the electricity cost per kilowatt-hour is lower for the new plants at 0.3 and 0.5 mill per kWh for the 200 and 500 MW units, if the costs of RDF fuel are excluded from the calculations.
McGowin and Hughes (undated) have also calculated the value of MSW fuel as RDF to a retrofitted 250 MW coal-cofired unit and to a dedicated MSW and RDF-only installation of the same size. B�ause of the larger capital cost of the entirely new facilities, the overall electricity cost is higher:,when MSW is disposed of in these dedicated units. To break even when the RDF is cofired in a retrofitted facility, the utility must be paid $1 .65 per ton of MSW ($1 .96 per ton of RDF). * The equivalent tipping fee was $41 .65 per ton of MSW, with allowance for sale of electricity at $0.05 per kWh. The tipping fee was estimated at $1 15 per ton of MSW for RDF, and $74.40 per ton for direct-fired MSW.
Missing Data and Research Needs
Barriers to Widespread Use
The most significant barriers to wider use of cofiring as an MSW management strategy include:
• Finding utilities that have coal fired boilers they can afford to derate, and that are willing to overcome the engineering concerns about performance and reliability
• Providing incentives to induce those utilities to take the institutional and public exposure risks associated with the change.
Technical Problems
Among the major technical problems are those of compatibility between specific coals and RDF mixtures; the influence of these combinations on ash slagging and fire box performance must be considered separately for each coal and RDF mixture used. Continued study of longterm performance and possible needs for operational modifications will be important in determining the future for cofiring installations.
* 1bat estimate assumes coal cost at $1 .60 per million Btu and standard electric utility fmancing.
163
The emissions from coft.ring may also differ from those of coal-only plants; the possible effects of those differences are a technical, as well as a regulatory, concern.
Emissions
Direct comparisons between the emissions from cofiring and those from coal-only installations are impossible at present because no data are available on:
• Air emissions arising from a coal unit that was converted to cofiring
• Air emissions from the few operating units that alternately fire coal and RDF
• Effects, if any, of co firing on the composition and amounts of waste water.
Costs
The actual conditions under which MSW projects are built and operated are different for each one. Published cost estimates cover facilities built during different time periods under different fmancial conditions, and the sources often fail to report the assumptions on which the estimates are based. These uncertainties confound attempts to compare one technology with another. The DOEIEPRI engineering cost comparisons (McGowin, 199 1 ) provide a partial solution to these problems for RDF cofiring and coal-only plants because the comparisons have been developed on a consistent basis. More extensive comparable data on costs of operating facilities are nevertheless needed.
GASIFICATION/PYROLYSIS
Introduction
For the purposes of this discussion, the following definitions were used for gasification and pyrolysis. Gasification is a high-temperature process that is optimized to produce a fuel gas with a minimum of liquids and solids. Gasification, which is more proven than pyrolysis, consists of heating the feed material in a vessel with or without the addition of oxygen. Water may or may not be added. Decomposition reactions take place, and a mixture of hydrogen and CO are the predominant gas products, along with water, methane, and C02. Pyrolysis is a medium- to hightemperature (500-10<XrC) process for converting solid feedstocks into a mixture of solid, liquid, and gaseous products. Pyrolysis to maximize production of liquid fuels and chemical feedstocks directly from a feedstock requires careful reaction control and fast heating and cooling rates to prevent the liquids that do form from breaking down to gases.
Technical Status
Although gasification/pyrolysis plants for MSW that were operated in the 1970s experienced many technical problems, the application of this technology to MSW offers potential advantages. One is that in some locations, nearby industrial users could bum the gas for process heat. Other claimed advantages include reductions in metal volatilization and particulates compared with MSW combustion technologies. The studies that found those advantages, however, were based on comparisons with direct firing of MSW or RDF before modem mandated air pollution controls were developed and installed (see Appendix D). No data to support such claims were found for this study. The higher efficiencies inherent with combined cycles for power generation may revive interest in pyrolysis and gasification. Compared with low-temperature gasification
164
processes such as anaerobic digestion, high-temperature gasification is likely to convert a larger fraction of the organics into a fuel gas. Anaerobic digestion converts about 40-55% of the contained energy in the biodegradable part of the feed into energy in the methane product; typical gasifiers (e.g., methane from coal or lignite) achieve about 75% conversion of the energy in the solid (including plastics) to the energy in the product gas.* Performance on lignite does not translate directly into performance on MSW because the handling characteristics and chemical compositions of the materials are quite different Many of the smaller gasifiers appear to perform functions similar to those that occur in two-stage, starved-air modular combustors (a
, proven combustion technology).
Preparation of MSW for gasification varies greatly with the process. Some processes, e.g., the Andco-Torrax (which may still be in use in Japan and France), require minimal preparation. Other processes, e.g., the Purox process, required RDF. Pyrolysis intended for direct production of liquid fuels or chemicals requires very rapid heat transfer and the preparation of RDF with a minimum of inert solids.
Although the U.S. MSW pyrolysis plants were closed in the late 1970s, gasification projects based on biomass, coal, and lignite have proceeded. Several gasifiers produced by Texaco, Lurgi, and other companies are operating commercially on coal, and a few are processing biomass. t A successful 100 megawatt-electricity (MWe) integrated gasification/combined cycle gasifier demQnstration power plant was sponsored by EPRI. That pilot plant was larger in power output than most of the largest municipal waste combustors (MWCs) in the United States. The Great Plains Gasification Project, which operated on lignite, was a short-lived technical success; it was abandoned in large part because natural gas prices fell dramatically just as it was coming on line (this plant is being converted to liquid fuel production via Fischer-Tropsch). Sasol I and II, which are very large coal-to-gasoline conversion plants in South Africa, use Lurgi gasifiers successfully for converting coal to synthetic petroleum products via Fischer-Tropsch reactions.
Although none of these projects were intended to use MSW feedstocks, they made significant progress in proving gasification and pyrolysis technology in general. The integrated gasification/combined cycle work indicated that gasifiers can be clean ways to handle fuel feedstocks that have many impurities.
Commercial Status
No commercial plants that gasify or pyrolyze MSW are operating in the United States today. The history of U.S. efforts to develop gasification and pyrolysis processes is discussed in the subsection on technical status and in Appendix D. Attempts to apply these technologies to MSW were made in the 1970s, but the plants failed to achieve acceptable technical or economic performance, and all have been shut down.
· ·
One gasifier designed for 400 tons per day of MSW may still be operating in France; a 400+ ton per day fluid bed gasifier and a 150 ton per day gasifier may still be operating in Japan. The
* Texaco achieved 76.6% efficiency in converting energy in feedstock to energy in product gas; Dow claimed 76% conversion efficiency, and Great Plains claimed 72% (SRI, 1985).
t Plants in Georgia, Florida, Missouri, and Oregon are gasifying wood chips or whole-tree chips. One large plant generates gas at a rate sufficient to produce 20 million Btu per hour. The gas from some of _these operations is used in a clay kiln (CEC, 1991).
165
most recent references, published in 1988, appear to report on work done in the early 1980s (see Appendix D). A 200 ton per day MSW gasifier is reported to be under construction in Italy (Dhargalkar, 1991). No current data on these possibly operational facilities were found. The old data are fragmentary and anecdotal or simply descriptive of the earlier projects; they do not provide a basis for estimating energy efficiency, emissions, or costs for the plants.
Energy Considerations
In the plants that may be operating on MSW, several sources report conversion of 70-80% of the energy in the feed to energy in the output gas (see Appendix D, page D-38, and [83 1 ,834]). Such conversion estimates typically refer to the efficiency of the gasifier alone, and not to ancillary preparation and processing equipment, if any. The net energy output in a 400 ton per day plant ranges from 5 million to 8 million Btu per ton of MSW (see Exhibit II, "Basic Gasification,.).
Because of the low volumetric energy content of gas produced when air is used in gasification of solid fuels, the gas is often converted on site to electricity. MSW, as a solid fuel, could instead be directly combusted to produce electricity, without the gasification step. However, gasification and/or pyrolysis may have efficiency advantages when used in conjunction with combined cycle electrical power generation (Larson and Williams, 1990).
The assumptions about energy consumption and production for gasification/pyrolysis made in the data base in Exhibit II are derived from the data found in the literature, but adjustments were made to conform with reasonable assumptions about the performance of the facilities. Even with those adjustments, the estimates used in this report are highly uncertain, and additional data are needed.
Environmental Releases
Data on emissions from gasification/pyrolysis plants are scarce. Fragmentary data on the emissions from plants in Japan have been published _(see Appendix D and [108,834]), but the data are incomplete, and the feed for the Japanese plants is different from U.S. MSW. The available data are insufficient to establish whether gasification would reduce emissions compared with those from modem direct combustion facilities with currently mandated air pollution control techniques. Because of lower gas flows, however, gas clean-up may be more economical.
Emissions from pyrolysis would include vent gas, flare gas, emissions from burning the gas, ash or slag, and possibly water from scrubbing the gas. If a liquid fuel is made, it might contain carcinogens. Although pyrolysis of wood can be controlled to prevent formation of carcinogens (Elliott, 1988), no data on similar results on MSW are available. In Japan, one of the features that favored selection of pyrolysis was that the residue that contained metals in the MSW was expected to be vitrified to a nonleachable slag that could be used or disposed of safely. No published reports indicate whether that expectation was realized.
The assumptions about environmental releases for gasification/pyrolysis made in the data base in Exhibit II are also derived from the data found in the literature, but adjustments were made to conform with reasonable assumptions about the performance of the facilities, in some cases by drawing analogies with related technologies. Even with those adjustments, the estimates used in this report are highly uncertain.
-
166
Cost Considerations
Estimates of the costs of pyrolysis facilities are highly speculative because no commercial plants have been built in the United States. For completeness, updates of previously published costs are included in Table 1.2 in Exhibit I, but it is not clear that those estimates are meaningful. Because the plants did not achieve adequate technical performance, the costs of those plants provide little indication of what it would cost to construct a new facility that would operate effectively.
Like anaerobic digestion, the greatest value of gasification and pyrolysis appears to lie in their ability to provide a clean, transportable fuel for use in another location for a purpose other than electricity generation. The most promising application of the fuel would probably be for industrial use to generate process heat. Pyrolysis produces a more transportable and storable form of energy than low-Btu gas or steam, but it probably could not compete economically with direct combustion for steam when the latter would be a feasible alternative. Pyrolysis liquids may be a source of valuable chemicals, although laboratory studies have only recently begun.
Missing Data
An important need is documentation for full-scale operating plants in the United States. Until such plants exist, actual operating data on energy requirements, environmental releases, costs, and product properties for gasification/pyrolysis on a basis consistent with those of other MSW technologies will not be available. That need might be partly met by data on plants that are operating in other countries, if they were available. However, current data on the few large plants in Japan and France are missing, and very little is known about the new plant under construction in Italy.
The prospects for this technology will remain limited until research and development are successfully completed and the resulting data are projected to be of economic interest for the United States. Without a demonstration plant, reliable data on the environmental impacts cannot be gathered, and gasification/pyrolysis cannot be assumed to be cleaner than direct combustion or other alternatives. Construction of a demonstration plant seems unlikely because economic incentives do not appear to exist at this time to justify the large-scale investment needed for renewed efforts to apply gasification/pyrolysis technology to MSW.
INTEGRA TED STRATEGIES
Strategies using the three less commonly used technologies were included the data base. Table 9.3 lists the steps in those strategies. Of these, Strategy 12 (cofiring RDF with coal) is in commercial use, and Strategy 15 (adding curbside collection of recyclables and yard waste to cofiring of RDF with coal) is feasible today. The others are not.
Cofiring of RDF with coal has been done commercially for a long time. Reasonably complete and reliable data are available on this option, although air emissions have been less well characterized than those from MSW combustion. For gasification/pyrolysis and anaerobic digestion, the data are speculative and incomplete.
167
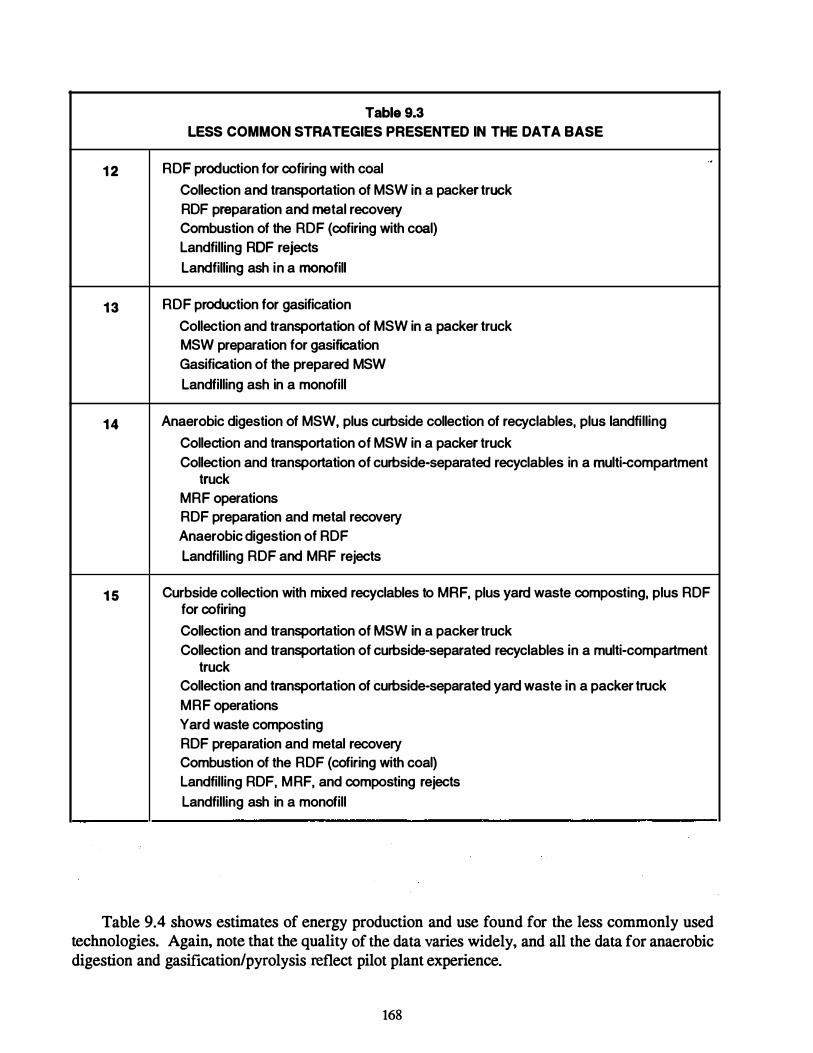
Table 9.3 LESS COMMON STRATEGIES PRESENTED IN THE DATA BASE
RDF production for cofiring with coal ..
1 2 Collection and transportation of MSW in a packer truck RDF preparation and metal recovery Combustion of the RDF (cofiring with coal) Landfilling RDF rejects Landfilling ash in a monofill
1 3 RDF production for gasification
Collection and transportation of MSW in a packer truck MSW preparation for gasifiCation Gasification of the prepared MSW Landfilling ash in a monofill
14 Anaerobic digestion of MSW, plus curbside collection of recyclables, plus landfilling
Collection and transportation of MSW in a packer truck Collection and transportation of curbside-separated recyclables in a multi-compartment
truck MRF operations RDF preparation and metal recovery Anaerobic digestion of ROF Landfilling RDF and MRF rejects
1 5 Curbside collection with mixed recyclables to MRF, plus yard waste composting, plus RDF for cofiring
Collection and transportation of MSW in a packer truck Collection and transportation of curbside-separated recyclables in a multi-compartment
truck Collection and transportation of curbside-separated yard waste in a packer truck MRF operations Yard waste composting RDF preparation and metal recovery Combustion of the RDF (cofiring with coal) Landfilling RDF, MRF, and composting rejects Landfilling ash in a monofill
Table 9.4 shows estimates of energy production and use found for the less commonly used technologies. Again, note that the quality of the data varies widely, and all the data for anaerobic digestion and gasification/pyrolysis reflect pilot plant experience.
168
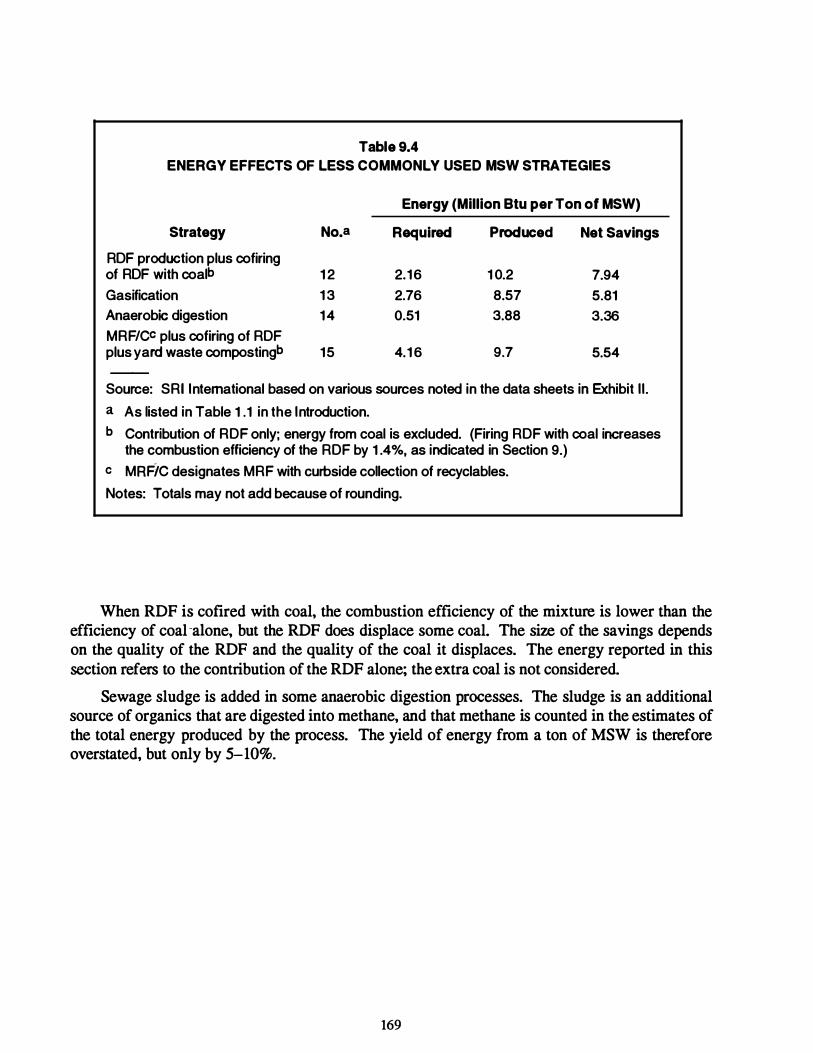
Table 9.4 ENERGY EFFECTS OF LESS COMMONLY USED MSW STRATEGIES
Energy (Million Btu per Ton of MSW)
Strategy No.a Required Produced Net Savings
RDF production plus cofiring of RDF with coalb 1 2 2.16 1 0.2 7.94 Gasification 1 3 2.76 8.57 5.81 Anaerobic digestion 14 0.51 3.88 3.36 MRF/CC plus cofiring of RDF plus yard waste compostingb 15 4.1 6 9.7 5.54
Source: SRI International based on various sources noted in the data sheets in Exhibit II.
a As listed in Table 1 .1 in the Introduction. b Contribution of RDF only; energy from coal is excluded. (Firing RDF with coal increases
the combustion efficiency of the RDF by 1 .4%, as indicated in Section 9.) c MAFIC designates MRF with curbside collection of recyclables.
Notes: Totals may not add because of rounding.
When RDF is cofired with coal, the combustion efficiency of the mixture is lower than the efficiency of coal -alone, but the RDF does displace some coal. The size of the savings depends on the quality of the RDF and the quality of the coal it displaces. The energy reported in this section refers to the contribution of the RDF alone; the extra coal is not considered.
Sewage sludge is added in some anaerobic digestion processes. The sludge is an additional source of organics that are digested into methane, and that methane is counted in the estimates of the total energy produced by the process. The yield of energy from a ton of MSW is therefore overstated, but only by 5-10%.
169

10. MISSING DATA AND RESEARCH NEEDS
The data gathered for this study vary significantly in quality. On some topics, no data at all are available. The effects of the limitations on the results of the analysis varied from trivial to major. The 20-year time period chosen for the life-cycle analysis of energy and emissions severely strained the limits of knowledge about many of the technologies. Identifying gaps in the available data was one of the important objectives of this study.
This section reproduces the subsections of Sections 5 through 8 entitled "Missing Data and Research Needs." It is intended to facilitate comparisons of the state of knowledge in the various fields. In addition, aspects of MSW management technologies that might benefit from additional research and development efforts are also described in this section, from a broad perspective.*
The order in which the observations appear should not be interpreted to imply any judgment about the relative importance of the missing data to the life-cycle analysis in this report or to possible efforts to increase the utility of any technology.
The cost data for all the technologies shared certain limitations, although the severity of the problems varied somewhat. Therefore, repetitive statements about missing cost data have been deleted from this section, and general observations about all the cost data are provided in the next subsection.
COSTS-ALL TECHNOLOGIES
Cost data available in the literature are limited, and the range of capital and operating cost estimates is extremely broad. The capital cost variations reflect inconsistencies in the sources of the estimates rather than predictable variations based on the type of technology or the size of the facility. Similarly, the O&M costs are affected by site-specific conditions such as labor rates, labor contracts, safety rules, the size of the crew, and so on. Accurate, consistent cost data are missing. To facilitate comparisons of the various strategies for managing MSW, costs for all the systems could be built up using a consistent set of assumptions and cost factors.
COMBUSTION
Technology
It was difficult to find data on the quantities of recyclable materials recovered from MSW during RDF operations. A few plants have been well characterized, but no broad data base exists.
Plants that precede mass burning with mixed waste processing are beginning to be operated. However, few data were found on operating results for those plants, on quantity and quality of materials removed, and on the markets for the products.
* Expert panels convened by the U.S. Department of Energy (DOE) have also identified research needs for each technology; in contrast with the observations in this report, the recommendations of those panels are at a detailed scientific and engineering level.
171
Few data were found on the amount of bulky waste removed before mass burning. Nor were data available on the amount of bulky material that is sold as scrap or on the fate of bulky materials that have no scrap value.
Emissions
Air
Although regulations on existing operating MSW combustors have become more restrictive (FR, 1987c; FR 1989a; FR 199 1a; and the timetable set by the Clean Air Act Amendments of 1990), periodic evaluations of older plants might show that emissions have been reduced as new guidelines governing older plants have been implemented.
Far less infonnation is available on stack emissions from smaller modular mass burn plants. After 1993, when the new guidelines on plants with capacities of less than 250 tons per day go into effect, assessments of emissions from smaller plants will become more available.
Few data on air emissions from the RDF preparation areas or tipping areas of a mass burn plants have been reported. Some of the air is used for combustion, but some is vented.
Long-term studies may also reflect the changing composition of the waste stream. Technological changes over time influence the nature of the waste that is discarded. Examples of such changes include the recent substantial reductions in the mercury in alkaline cells (from 1% to less than 0. 1% ) , the growing popularity of zinc-air cells as replacements for mercury batteries in hearing aids, and the elimination of some metals from inks. In addition, new laws in Europe and California are requiring elimination of lead from the 2 billion wine bottle closures produced each year (Andre and Karpel, 1991).
Some sources have referred to the possibility that free carbon in the flyash portion of the ash might absorb some metals, such as mercury, as well as organics. The role of free carbon as an adsorbent might be worth investigating.
No data were found to indicate whether significant reductions in emissions can be achieved by removing retrievable, and possibly recyclable, materials from the MSW prior to combustion.
Methods for reducing emissions from smaller modular mass burn units are needed. Better combustion control is needed for smaller modular combustors to allow them to maintain optimized combustion conditions during charging of new MSW.
Water
The available data were insufficient to support an evaluation of the water emissions from RDF preparation, if any is discharged. Data on the various blowdown streams from combustion operations were also unavailable, perhaps because those streams are entirely consumed in the ash quench tank.
172
SANITARY LANDFILLS
Emissions
Collection and Processing Equipment
No data (on a per ton of MSW transported) were found for the actual emissions generated by collection programs. Accordingly, information from a local community was used, and emissions were estimated on the basis of the fuel used.
No data were found on actual emissions during the construction and operation of landfills, including emissions from heavy equipment used for landfill compaction and operations and releases from MSW as it is compacted. Nor were data found on particulates and dust that may result from placing daily cover on landfills.
Landfill Air Emissions
No data were found on actual emissions from spraying leachate at the working face of the landfill, or from aeration in leachate treatment or sewage treatment plantS.
No data were found on changes in the composition of trace organic components in landfill gas over long periods .
.. ,; .. �·-
Statements were found that indicated that dioxins have been measured in the emissions from combusting hmdfill gas, but no quantitative data were found that indicate the amounts of those emissions.
No data were found on air emissions, if any, from ash monofllls.
Landfill Water Emissions
No data were found to document changes in composition of leachate over 20 years or longer for use in estimating whether metal and organic concentrations decline or remain roughly steady. Comparisons of leachate during a landfill's acidic stage and during its methane-generating stage were found, but none of these data covered long periods. EPA data from the early 1970s analyzed leachate from the landfill types that were common at that time (Bogner, 1992). Those data might be useful for long-term comparisons.
Models exist to help predict the amount of leachate that would penetrate the bottom liner of a landfill, but few data were found. No data were found on the amounts and composition of leachate from shredfill or balefUl operations.
No data were found on the amounts and composition of leachate from shredfill or baleflll operations.
Long-term studies of leachate composition may eventually reflect the changing composition of the waste stream. The recent significant reductions of mercury in alkaline cells and the popularity of zinc-air cells as replacements for mercury batteries in hearing aids are examples of technological changes that will influence waste stream composition. Reduction of metals in inks is another example (Usherson, 1992) New laws in Europe and California also require elimination of lead from the 2 billion wine bottle caps produced each year that are made of lead (Andre and Karpel, 199 1 ).
173

Ash Monotill Water Emissions
Leachate data for ash monofills are also inadequate. Although long-term, high-quality data on the composition of leachate have been reported, none of the sources reported on the quantity of leachate that is escaping through the bottom of the landfill. Data or estimates of leachate quantities are available for raw MSW landfllls.
The amounts of metals and organic materials entering the ground below ash monofill liners have not been widely studied. Of the estimates presented here. therefore, these estimates have the fewest data to support them. The assumptions on which the estimates are based are discussed below, along with indication of gaps in the data.
Data are available on the composition of leachate from a closed monofill over 4 years, but not for the 20-year time frame of interest here. The data show that highly soluble materialspotassium, sodium, and chloride-appear in roughly the same concentrations each year. By extrapolation, it is assumed that the leaching of those ions is at steady state, and that the leachate does not become saturated with them. However, heavy metals like zinc and cadmium decrease sharply over the 4 years for which data exist; therefore, it has been assumed that the low levels noted in year 4 will be the maximum concentration for the next 16 years. It is believed that this is a conservative assumption.
It has been assumed that the depth of the monofJ.ll is the same as that for a regular MSW landfill. If an old quarry were used, for example, this assumption may be reasonable; in other situations, the ash monofill may be shallower.
The difference in volume between a raw MSW landfill and an ash monofill is known. To estimate the surface area on which rain will fall, it is necessary to assume a depth for the ash in the monofill. It has been assumed that the depths for both types of landfills are equal.
Data on MSW landfills provide estimates of the amount of rainfall on the closed, capped landfill surface that enters the landfill. The fraction of rainfall that is collected as leachate on the liner and the fraction that leaks into the ground below have also been estimated. Similar data for ash monofills were not found, and thus the proportions reported for raw MSW landfills were used for ash monofills as well. However, if the ash in the monofill hardens, as is frequently reported, it would be unreasonable to assume that rates of infiltration or of percolation to the bottom of the monofill were the same as those for MSW landfills. Because data on the amount of leachate that escapes MSW landfills were applied to ash monofills in this analysis, the estimates of leachate escaping to the ground in this report are likely to be overstated, and the estimates of the amounts of metal that are released in leachate may be too large as well.
Energy
Few data were found on the energy requirements for collecting and landfilling MSW; those data that do exist are based on truck capacity rather than on the actual tonnage collected. Nor were actual energy data (on a per ton of MSW basis) found for ongoing landfill construction, filling, compacting, and covering.
Land
Engineering estimates that compare typical sizes of ash monofills with those of raw MSW landfills are available; however, comparisons of the actual depth and acreage of existing landfills
174
and monofills were not found. Similarly, no studies provide guidance concerning land use for ash monofills after closure.
Resear�Jt �to beneficial uses of stabilized ash is frequently based on the relatively extensive research on the uses for flyash from coal-fired utilities. Some studies have evaluated use of the ash as a component of bituminous highway material. Other research is under way on uses in masonry block construction materials. Some processes vitrify or melt the ash into a glass that is extremely inert to leaching and can often be used beneficially as aggregate (see Appendix A page A-80, and DeCesare, 1991). Alternative uses for ash could save landfill space.
MATERIALS COLLECTION, SEPARATION, AND RECYCLING
Amounts Collected and Destinations and Applications of Materials
More than 2,700 curbside collection programs may be operating in the United States (Glenn and Riggle, 1991). Operating or planned MRFs exceeded 100 in 199 1, and the number of such facilities is increasing rapidly (ICF Inc., 1991). The destination of the material collected by programs that are not operated in association with an MRF is unclear. Inadequate data are available on the amounts of materials actually collected, recovered, and sold or beneficially used; most sources report on the design capacity of MRFs.
The field of materials recovery is still relatively new, and systems for encouraging participation, collection, and processing continue to evolve. Better estimates of the amounts of material collected by curbside programs are needed. The validity of the frequent assertion that additional education can motivate greater participation has apparently not been tested, and no study has established the maximum sustainable levels of participation. Some sources have reported nationwide data on the effectiveness of dropoff programs, especially by comparison with curbside collection programs. Limited data are reported in Appendix E (see page E-20).
The effects of "bottle bill" legislation on amounts of materials set out in curbside programs remain unclear. One study has covered that issue, but confirmation of the results would be useful (White et al., 1990). In particular, no data are available on the effect of bottle bills on the total diversion of containers from MSW disposal (that is, the total number of containers set out at curbside or returned for payment at redemption centers). One study included a model to estimate potential effects; however, the results give no clear indication whether bottle bills have a consistently positive or negative effect (Ackerman and Schatzki, 1991).
The yield of reusable glass, metals, and paper that is picked up for separation is not well documented. For example, the breakage of glass during collection is substantial in some communities as a consequence of the trucks that are used. The broken, mixed color glass cannot be sold, and becomes process loss. One community reports that the reason for wetting all the paper it receives is "to prevent blowing." The extra water distorts the accounting of actual yields.
Little information is available on the effectiveness of mixed waste MRF programs. The few reported data suggest that such programs divert twice as much recyclable waste as curbside collection of separated materials. If so, research to encourage the mixed waste approach is needed.
If additional studies make it clear that certain materials are unlikely to find a market in certain regions, then alternative uses need to be found for those materials in those regions. For example, new economic uses for mixed paper and glass are clearly needed in some areas.
175
Energy
Transport/Collection
· Reliable data on actual fuel use in collection and processing for materials recovery are not available for comparison with fuel use for standard MSW collection and disposal. Most MRF studies assume that the trucks used for transporting reusable materials have the same energy consumption as a packer truck. but differences between the two may be significant.
Processing
The estimates of energy used for processing are based on design documents. Estimates for operating MRFs of actual power use per ton processed would be more reliable.
Recycling/Reuse
All the detailed comparisons of energy use for recycling with energy use for production of virgin metals and glass are now 14-17 years old, and process improvements may have strongly affected the conclusions (Battelle 1975; Kusik and Kenahan, 1978). In addition, no energy balances were found for reuse of collected materials in applications other than remanufacture of the original product (e.g., glass used as a substitute for sand in glasphalt, or mixed plastic used as a substitute for wood composites to produce "plastic lumber").
Environmental Releases
Transportation
Like data on energy use, emissions data for operating collection programs are sparse. Specific needs include:
• Actual emissions data from MSW collection or curbside collection operations
• Data on emissions per ton of material collected
• Comparisons of emissions for separate collection of reusable materials and emissions for a single collection of all MSW.
Processing
Only anecdotal accounts of environmental releases from actual MRF operations have been reported. Good data are not yet available.
Recycling/Reuse
Studies of the environmental advantages of recycling individual materials (e.g., paper, metals, and glass) seem to be based on limited data and analysis, and they need to be updated. Many of the advantages claimed for recycling assumed high effluent levels for virgin manufacture that no longer reflect actual current practice.
System Evaluations
Most recycling of waste and of materials that would otherwise become waste occurs outside the traditional MSW management system. Waste paper, postindustrial plastic, and scrap steel are widely collected and recycled in the secondary materials business. A systems study on
176
secondary materials reclamation could show the effectiveness of various industry-commercialcommunity initiatives and their interactions with recycling efforts.
The present inability of the market to absorb all locally generated recovered materials shows that parts of the system are unable to keep up with supplies available. The supply of separated material is underthe control of a waste management authority. Demand for the separated material is under the control of a large number of consumers. Obvious imbalances between supply and demand are reflected in the current prices for some separated materials. Research is needed to determine the effects of such imbalances on the ultimate benefits of curbside collection programs. For example, if depressed prices affect all scrap, curbside-collected material that enters the scrap cycle may simply displace other types of scrap, substituting large quantities of industrial waste for smaller quantities of municipal waste.
Reliable system studies will depend on the availability of cost data generated on a consistent basis, as outlined above.
COMPOSTING
Technology
Municipal Solid Waste
To date, success in composting MSW to produce a marketable product is quite rare. Facilities for large-scale com posting of MSW are encountering engineering and process control problems (Allen, 1992). Increased application of the technology may depend on research to identify the causes of those problems and engineering development work to find better solutions to operational problems.
Mechanical processing, either before or after com posting, has been a major technical barrier to successful MSW operations because some systems are inappropriately designed (CRSI, 1989). Many appear to be designed to minimize initial capital cost or to minimize O&M costs. Operating experience sometimes indicates the need for significant modifications of such plants (CRSI, 1989).
Troublesome problems with odor have been reported at some plants. Biofiltration is used for odor control at some composting facilities, but it requires relatively large areas and sophisticated operational control, and performance is frequently poor. The fate of odoriferous compounds absorbed in the bioftlter is not well known.
Yard Waste
Some communities are quite restrictive about the types of yard waste they will accept for composting. Such restrictions are apparently required because of the equipment that the communities have chosen. The influence of such barriers to public participation has not been well characterized.
177

Markets
Municipal Solid Waste
MSW -derived compost fares worse than composts derived from sewage sludge, manure, and yard waste in the competition for available markets (Hammer, 1992). Acceptance of MSWderived compost will require a clearer understanding of appropriate uses for it. Solutions to that problem might include:
• A better rationale for setting standards
• A better understanding of the effects of contaminants on land and crops
• Greater product consistency.
Yard Waste
Data on the following important topics were limited, unreliable, or unavailable:
• The impact of curbside collection programs, particularly of household hazardous waste, on the quality of compost products
• Concentrations of toxics and pathogens in compost made from yard waste (CRSI, 1989)
• The effect of metals and chemicals in the compost on the food chain (CRSI, 1989).
Environmental-Releases
No data on emissions from collection of composting were found. Once compost is made and applied to land, it may undergo only aerobic decomposition; if so, it would release little methane. No studies of any emissions from compost in use were found.
Municipal Solid Waste
No quantitative information was found for the following subjects :
• Amounts and identity of volatile organic compounds (VOCs) released during composting and curing
• Specific emissions volatile solvents that were discarded in MSW, during com posting
• Emissions from treatment of leachate.
Yard Waste
Little information is available about the nature and effectiveness of programs for curbside collection and composting of yard waste. Missing data include:
• Emissions released during com posting and curing
• Disposition of the product, including quantities used as daily landfill cover or otherwise disposed of as waste
178
• The long-term environmental impacts of the eventual products of MSW composting in various applications.
System Evaluations
The benefits and ·costs of com posting programs have been examined less carefully than those of other components of MSW management strategies because composting has been a small-scale contributor to the field. Given the increasing popularity of composting, a thorough evaluation seems overdue.
The value of composting of either yard waste or MSW to an overall management strategy is difficult to evaluate because limited data are available on:
• Energy requirements
• Transportation requirements and emissions
• Percentage of the compost produced that is beneficially used.
A system study could help to fill these data gaps.
LESS COMMONLY USED TECHNOLOGIES
Anaerobic Digestion
No full-scale plant is operating in the United States. Until one is constructed, a consistent set of data to use in documenting energy, environmental releases, and costs will be lacking. That need might be partly met by data on plants that are operating in other countries, if they were available. The 1 ,000 ton per day San Diego facility will be valuable in providing information to evaluate the economics, energy balance and emissions.
Cotiring RDF with Coal for Power Production
Barriers to Widespread Use
The most significant barriers to wider use of cofiring as an MSW management strategy include:
• Finding utilities with coal fired boilers that they can afford to derate, and that are willing to overcome the engineering concerns about performance and reliability
• Providing incentives to induce those utilities to take the institutional and public exposure risks associated with the change.
Technical Problems
Among the major technical problems are those of compatibility between specific coals and RDF mixtures; the influence of these combinations on ash slagging and fire box performance must be considered separately for each coal and RDF mixture used. Continued study of longterm performance and possible needs for operational modifications will be important in determining the future for cofiring installations.
179
The emissions from cofiring may also differ from those of coal-only plants; the possible effects of those differences are a technical, as well as a regulatory, concern.
Emissions
Direct comparisons between the emissions from cofiring and those from coal-only installations are impossible at present because no data are available on:
• Air emissions arising from a coal unit that was converted to cofiring
• Air emissions from the few operating units that alternately fire coal and RDF
• Effects, if any, of cofiring on the composition and amounts of waste water.
Gasification/Pyrolysis
An important need is documentation for full-scale operating plants in the United States. Until such plants exist, actual operating data on energy requirements, environmental releases, costs, and product properties for gasification/pyrolysis on a basis consistent with those of other MSW technologies will not be available. That need might be partly met by data on plants that are operating in other countries, if they were available. However, current data on the few large plants in Japan and France are missing, and very little is known about the new plant under construction in Italy.
180
11. REFERENCES
Ackerman, F. and T. Schatzki, 1991 . "Bottle Bills and Curbside Recycling Collection." Resource Recycling, June 1991, p. 75.
Allen, F. E., 1992. "As Recycling Surges, Market for Materials Is Slow to Develop." Wall Street . Journal, January 17, 1992.
Alter, H., 1991 . "The Future Course of Solid Waste Management in the U.S." Waste Management & Research 9, pp. 3.-20.
Andre, N� and S. Karpel, 1991. Tin Wine Bottle Capsules, in Tin and Its Uses. International Tin Research Institute #165, p. 10.
API, 1991 . American Paper Institute, Pulp and Paper 1992: North American Factbook.
Apotheker, S., 1991a. Engineering the Nation's Largest MSW Composting Plant Resource Recyclint July 1991 , p. 43.
Apotheker, S., 1991b. Mixed Waste Processing: Head-to-Head with Curbside Recycling Collection. Resource Recovery, September 1991.
Augenstein, D. , 1990. Greenhouse Effect Contributions of U.S. Landfill Methane. Proceedings, 13th Annual International Landfill Gas Symposium. SW ANA (GRCPA), Chicago, lllinois, 1990.
Augenstein, D., 1992. Personal communication to P. Shepherd, National Renewable Energy Laboratory, March 3, 1992.
Augenstein, D. and J. Pacey, 1991. Landfill Methane Models. Proceedings, Technical Session, 29th Annual Solid Waste Exposition. SW ANA, Cincinnati, Ohio, August 1991.
Bahor, B. undated. H. Bahor, "Compliance Test Results." Personal communication to Booker Morey, SRI International, April 26, 1992.
Battelle, 1975. Energy Use Patterns in Metallurgical and Nonmetallic Mineral Processing, Phase 4. NTIS PB, 245759, 1975.
Berenyi, E. and R. Gould, 1990. 1990-91 Materials Recovery and Recycling Yearbook, Directory & Guide. Governmental Advisory Associates, Inc., New York, N.Y.
Berenyi, E. and R. Gould, 199 1a. 1991 Resource Recovery Yearbook, Directory & Guide. Governmental Advisory Associates, Inc., New York, N.Y.
Berenyi, E. and R. Gould, 1991b. 1991-1992 Methane Recovery from .Landfill Yearbook. Governmental Advisory Associates, Inc., New York, N.Y.
181

Bergstrom, J.G.P., 1986. "Mercury Behavior in Flue Gas," Waste and Management Research, 4: 57, 1986 (cited by Craig Vollend, Spectrum Technologists, April 17, 1992).
Berss, M., 1991. "No one wants to shoot Snow White." Forbes, October 14, 1991, p. 40. Bishop, R. S., 199 1 . "Defining the MRF and the Role of MRFs in Residential Waste
Recycling." Resource Recovery, October 1991 , p. 37.
Bogner, J. E., 1990. Energy Potential of Modem Landfills, Proceedings lllinois Energy Conference, Chicago, October 1990.
Bogner, J. E., 1992. Personal communication with Booker Morey, SRI International, June 6, 1992.
Bogner, J. and K. Spokas, 1992. Landfill CH4: Rates, Fates, and Role in Global Carbon Cycle. Paper accepted for Chemosphere special issue on Atmospheric Methane, 1992 (to be published).
Bowen, H.J.M, 1966. Trace Elements in Biochemistry. Academic Press, New York, 1966.
Bullock, D. and R. Salvador, 1990. "What Those Recycling Numbers Mean." Gershman Brickner and Bratton Inc, 1990.
Business Recycling Coalition, 1991. U.S. Chamber of Commerce, Washington, D.C., personal communication to Booker Morey, SRI International, September 1991.
California Beverage Container Act, 14581.5.
Cannon, C. A, 1991. MSW Management, July/August 1991, p. 10.
Cassidy, P., 1991. Personal communication with P. Cassidy, OSW, EPA, January 17, 199 1 .
CEC, 1991. California Energy Commission, "Energy Technology Status Report," Appendix A, Vol 1, 199 1 , pp. 9- 123.
Census Bureau, 1991 . Statistical Abstract of the United States. Bureau of the Census, U.S. Department of Commerce, Washington, D.C., 199 1.
CFR, 1991a. Code of Federal Regulations, 40 CFR 60.50a-60.58a, July 1, 1991 .
CFR, 1991b. Code of Federal Regulations, 40 CFR Part 241, 241 . 100-240. 101, July 1, 1991.
CFR, 1991c. Code of Federal Regulations, 40 CFR Part 241, 241.209, July 1, 199 1.
CFR, 1991d. Code of Federal Regulations, 40 CFR. Parts 51 , 52, and 60. Final Rule, July 1, 1991 .
City of Palo Alto, 1991 . "Palo Alto Materials Recovery Program Summary Report, 199 1 ," Palo Alto Sanitation Company, and personal communications with Booker Morey, SRI International, August 1991 .
·
182
Chynoweth, D. P. and R. Le Grand, 1988. Anaerobic Digestion of Municipal Solid Waste and Sludge. Proceedings, 23rd Intersociety Energy Conversion Engineering Conference. Vol. 4. ASME, New York, N.Y., July/August 1988, pp. 407-413.
Chynoweth, D. P. and R. Le Grand, 1989. "Anaerobic Digestion as an Integral Part of Municipal Waste Management'' in Y. R. Alston and G. E. Richards, Proceeding International Conference on Landfill Gas and Anaerobic Digestion of Solid Waste, Harwell Lab, 1989.
Chynoweth, D. P. et al., 1990. "Biogasification of Processed MSW." Biocycle, 3 1 October 1990, p. 50.
Coleman, C. and C. W. Scherer, 1990. Communication, Community Participation and Waste Management. Proceedings, First U.S. Conference on Municipal Solid Waste Management: Solutions for the 90s. Vol I, Washington, D.C., June 1990.
Combs, S., 1991 . Building Safety into MRF Design. Waste Age, August 1991, p. 95.
Connor, D. M. and A. C. Svendsen, 1986. Overcoming the Barriers to Public Acceptance of Waste Management Facilities. Proceedings, 8th Canadian Waste Management Conference. Halifax, Nova Scotia, September 1986, pp. 1-1 1 .
Council on Environmental Quality, 1990.
CRSI, 1989. �cal Recovery Systems, Inc. "Composting Technologies, Costs, Programs and Markets.'' Prepared for OTA, NTIS PB91-1 195 1 1, 1989.
DeCesare, R., 1991 . Personal communication with R. DeCesare, U.S. Bureau of Mines, concerning new studies under way by the Department of Energy, October 31 , 1991.
DelBello, A. B. Solid Waste Management Planning: Lessons for the 90s. Proceedings, First U.S. Conference on Municipal Solid Waste Management: Solutions for the 90s. Volume I. Washington, D. C., June 1990.
DeLuchi, M. A., 199 1. Emissions of Greenhouse Gases from the Use ofTransportation Fuel and Electrticity, Volume 1 , ANL/ESD/TM-22, 1991 .
Deyle, R. E. and Hanks, N. N., 1991. "Cost Effective Composting of Yard Waste.'' Waste Age, November 1991 , p. 83.
Deyle, R. E. and B. Schade, 1991. Residential Recycling in Mid-America: The Cost Effectiveness of Curbside Programs in Oklahoma. Resources Conservation and Recycling, 5, pp. 305-327.
Dhargalkar, P. H., 199 1. A Unique Approach to Municipal Waste Management in Chianti, Italy. Municipal Waste Combustion Conference, Tampa, Florida, April l991.
Dhargalkar, P. K. and J. T. Zmuda, 1989. Dry Scrubbing Experience in Resource Recovery Applications. Air and Waste Management Association, 82nd Annual Meeting, Anaheim, California, 1989.
· ·
183
DOE, 1991 . Electric Power Monthly, Energy Information Administration, DOE/EIA-0226(92103), March 1991.
Eastmount, 199 1 . SEMASS Emissions Test Report 21H, Eastmount Engineering Inc., Walpole, Massachusetts (July 1991).
Elliott, D. C., 1988. "Relation of Reaction Time and Temperature to Chemical Composition of Pyrolysis Oil.'' in E. J. Sotte and T. A. Milne, eds., Pyrolysis Oils from Biomass: Producing, Analyzing, and Upgrading, ACS Symposium Series, 376, p. 55.
Energy Technology Status Report, 1991. Appendix A, Vol l , June 1991, pp. 9-1 18.
Entropy, 1991 . H-Power Compliance Test Results, May 1991.
Environmental Policy Alert, December 1 1, 1991, p. 18.
EPA Office of Air Quality Planning and Standards. Report No. EPN530-SW-87-021B.
EPA, 1987. U.S. Environmental Protection Agency, Municipal Waste Combustion Study: Emission Data Base for Municipal Waste Combustors. EPN530-SW-87-02lb, June 1987.
EPA, 1989. The Solid Waste Dilemma: An Agenda for Action. EPA/530-SW-89-019.
EPA, 1990. Characterization of MSW in the U.S.: 1990 Update. EPA/530-SW-90-42a, June 1990.
EPRI, 1989. Technical Assessment Guide, P 6587L, Vol. 1, pp. 7-89.
Ferraro, F., 1991 . "Operating a Waste-to-Energy Facility in an Increasingly Stringent Regulatory Environment," Second International Conference on Municipal Waste Combustion, Tampa, Florida, April l991 .
Ferraro, F., 1992. Compliance Test Average. Personal communication to Booker Morey, SRI International, April 29, 1992.
Fiscus, C. E., et al., 1988a. Guidelines for Cofiring Refuse-Derived Fuel in electric Utility Boilers. Vol. 1 : Executive Summary, EPRI, June 1988.
Fiscus, C. E., et al., 1988b. Guidelines for Cofiring Refuse-Derived Fuel in Electric Utility Boilers. Vol. 2: Executive Summary, EPRI, June 1988.
Fiscus, C. E., et al., 1988c. Guidelines for Cofiring Refuse-Derived Fuel in electric Utility Boilers. Vol. 3: Executive Summary, EPRI, June 1988.
FR, 1987a. Federal Register 52 #129, July 7, 1987, p. 25402.
FR. 1987b. Federal Register 52 #129, July 7, 1987, p. 25404.
FR. 1987c. Federal Register 52 #129, July 7, 1987, p. 25339.
FR, 1989a. Federal Register 54 #743, December 20, 1989, p. 52209ff.
184
FR, 1989b. Federal Register 54 #243, December 20, 1989, p. 52218.
FR, 1991a. Federal Register 56 #28, February 1 1, 1991, pp. 5488-5527.
FR, 1991b. Federal Register 56 #104, May 30, 1991, pp. 24468-24528.
FR, 199 1c. Federal Register 56 #104, May 30, 1991, pp. 24472 and 24474.
FR, 199 1d. Federal Register 56 #104, May 30, 1991, p. 24473.
FR, 199 1e. Federal Register 56 #104, May 30, 1991, p. 24474.
FR, 199 1f. Federal Register 56 #104, May 30, 1991, p. 24476.
FR, 1991p. Federal Register 56 #104, May 30, 1991, p. 24480.
FR, 1991g. Federal Register 56 #104, May 30, 1991, p. 24489.
FR, 199 1h. Federal Register 56 #196, October 9, 1991 , p. 50980.
FR, 199 1i. Federal Register 56 #196, October 9, 1991, p. 50985.
FR, 1991n. Federal Register 56 #196, October 9, 1991, p. 50989.
FR, 1991m. ' Federal Register 56 #196, October 9, 1991, p. 50999.
FR, 1991j. Federal Register 56 #196, October 9, 1991, p. 51007.
FR, 199 1o. Federal Register 56 #196, October 9, 1991, p. 5 101 1 .
FR, 1991q. Federal Register 56 #196, October 9 , 1991, p. 51029.
FR, 1991k. Federal Register 56 #196, October 9, 1991, pp. 51050-51051.
FR, 19911. Federal Register 56 #104, May 30, 1991, p. 24497.
Franklin Associates, 1990a. Estimates of the Volume of MSW and Selected Components in Trash Cans and Landfills. Final report, February 1990.
Franklin Associates, 1990b. Characterization of Municipal Solid Waste in the United States: 1990 Update. U.S. Environmental Protection Agency, Washington, D.C., June 1990.
Glaub, J. C. et al., 1989. "Preparing MSW for Com posting." The Biocycle Guide to Composting Municipal Wastes. The J. G. Press, Inc, 1989.
Glenn, J. and D. Riggle, 1989. "Where Does the Waste Go?" Biocycle, Apri1 1989, p. 6.
Glenn, J. and D. Riggle, 1991. The State of Garbage in America. Biocycle, Apri1 1991, pp. 34-38).
185
Goodwin, R. W. Engineering Evaluation of Resource Recovery Residue Utilization Modes. Municipal Waste Combustion Conference, U.S. EPA and A WMA, Tampa, Florida, April 1991.
Hammer, S. A., 1992. Garbage in/Garbage out-a hard look at mixed municipal solid waste composting. Resource Recycling, February 1992, p. 40.
Hartman, M. R., 1991a. ABB Resource Recovery Systems: An Overview of the Fate of Metals During Combustion at the Mid-Connecticut Resource Recovery Facility. Municipal Waste Combustion Conference Proceedings, Second Air and Waste Management Conference, April 1991, Tampa, Florida, p. 347.
Hartman, M. R., 1991b. Control of Toxic Organic Pollutants at a State of the Art RDF Incinerator. Proceedings, 7th Annual Conference, Solid Waste Management and Materials Policy. New York, N.Y., January 30, 1991.
Humber, N., 1991. Personal communication with N. Humber, Humber and Associates, Natick, Massachusetts, October 24, 1991.
ICF Inc., 1991 . RD&D Priorities for Energy Production and Resource Conservation from Municipal Solid Waste: Draft Final Report. October 31 , 1991.
Jones. K., 1991 . Risk Assessment Comparing Compost and Incineration Alternatives. MSW Management, May-June 1991, p. 95.
Kapner, M. and S. Schwarz. A Guide to Air Pollution Control Equipment. Waste Alternatives/Waste-to-Energy. September 1988, pp. 38-43.
Kilgroe, J. D. and T. G. Brna, 1990. Control of PCDD/PCDF Emissions from Refuse Derived Fuel Combustors, Chemisphere 20, 1990, p. 1809.
Killam, G.G.G., 1987. Alternatives for Processing MSW. Ocean County. NJ, Resource Recovery Project.
Kinderman et al., 1975. "Manpower, Materials, Equipment and Utilities Requirements to Operate and Maintain Energy Facilities," SRI Project ECD-3846, March 1975 (in support of Bechtel Corporation Contract NSF-C-87 with the National Science Foundation).
Kiser, J.V.L., 1990. "Comprehensive Report on Municipal Waste Combustion, Part V, MWC Project Cost Data," Waste Age, November 1990, p. 156.
Kiser, J.V.L, 1991a. National Solid Wastes Management Association. J. Air Waste Management Assoc. 41 #9, September 1991, p. 1 161.
Kiser, J.V.L, 1991b. Municipal Waste Combustion Guide, Waste Age, November 1991.
Kiser, J.V.L., 1992. Integrated Waste Services Association. Personal communication to Philip Shepherd, NREL, June 25, 1992.
186
Klein, D. H., et al., 1975. Pathways of 37 Trace Elements Through a Coal Fired Plant. Environmental Science and Technology, V 9, #10, pp. 973-979.
Konheim, C. S., 1984. The Highest Hurdle: Public Acceptance of Resource Recovery Facility Sites. Proceedings of ASME National Waste Processing Conference. Orlando, Florida, June 1984, pp. 47-53.
Konheim, C. S. and N. M. Reiss, 1987. Public Participation in Siting Resource Recovery Facilities: Lesson Learned. Proceedings, APCA 80th Annual Meeting. New York, N.Y., iune 1987.
Kumar, S., 1987. Gas Production Engineering, Gulf Publishing Co .. 1987, p. 590.
Kusik, C. L. and C. B. Kenahan, 1978. Energy Use Patterns for Metal Recycling. USBM Information Circular 878 1.
Larsen Engineers, "Comments on Draft Update 1990- 1991 New York State Solid Waste Management Plan; Topics Technology Assessment,-Biogasification," April 1991.
Larson, E. D. and R. H. Williams, 1990. "Biomass-Gasifier Steam-Injected Gas Turbine Cogene��on." J. Eng. for Gas Turbine & Power, 1 12, p. 157.
Magnuson, A., 1991 . "NYC Recycles: Preliminary Recycling Plan." Resource Recovery, July 1991 , p 90.
McGee, K. D., 1989. The NIMBY Syndrome in Municipal Waste Management. Proceedings, International Conference on Municipal Waste Combustion. Hollywood, Florida, Apri1 1989, pp. 8B- l/8B-19.
McGowin, C. R., 1991 . Guidelines for Cofiring Refuse-Derived Fuel in Electric Utility Boilers. Proceedings: 1989 Conference on Municipal Solid Waste as a Utility Fuel, EPRI, Feburary 1991.
McGowin, C. R., 1992. Personal communication to Edwin M. Kinderman, SRI International, May 1992.
McGowin, C. R. and E. E. Hughes, (undated). "Efficient and Economical Energy Recovery from Waste by Cofiring with Coal," ACS Symposium Series Book, ·Clean Energy from Waste and Coal , to be published.
Morelli, J., 1990. Landfill Reuse Strategies. Biocycle, March 1990.
Morris, J., 1991 . "Mixed paper Recycling Practices in North America," Resource Recycling, January 199 1 , p. 84.
NCHS, 1991 . National Center for Health Statistics, U.S. Department of Health and Human Services, as reported in The World Almanac, 1991, p. 836
NSWMA, 1991 . Recycling in the States 1990. Review, National Solid Waste Management Association, Washington, D.C., 1991.
·
187
NSWMA, undated. Public Attitudes Toward Garbage Disposal. Special Report, National Solid Wastes Management Association, Washington, D.C., undated.
O'Leary, P. and P. Walsh. Leachate Control and Treatment. Waste Age, July 1991 , p. 103 and 108.
Logsdon, G., 1990. "Anaerobic Composting Gains Greater Support." Biocycle, October 1990, p 42.
OTA, 1988. "Facing America's Trash. What's Next for Municipal Solid Waste," U.S. Office of Technology Assessment, 1988.
OWS, 1991 . DRANCO brochure, 1991.
Patrick Engineering, 1991. County of Will Solid Waste Management Plan, Vol l , January 1991, pp. 2-9.
Pearl, D., 1991 . Neighborhoods Resist Recycling Plants. Wall Street Journal, October 14, 1991.
Powell, J., 1992. "How are we doing? the 1991 report." Resource Recycling, April 1992.
Radian, 1989. "Compliance Test Report," Volume 1. Radian Corp., December 1989.
Rathje, W., 1989. Rubbish ! Atlantic Monthly, December 1989, p. 100.
Rathje, W., 1990. "Excavating Landfills," GCRDA 13th Annual Landfill Gas Symposium. Chicago, lllinois, 1990.
Renewable Energy Systems, 1990. Refuse Conversion to Methane (RefCoM) Equipment and Research Development Program. Final Report. Renewable Energy Systems, Inc., October 1990.
Repa. E: W. and J. V. L. Kiser, 1988. Disposing Ash. Waste Alternatives/Landfill of the 90s. DeceJllber 1988, pp. 74-79.
Repa, E. W. and S. K. Sheets, Landfill Capacity in North America. Waste Age. May 1992, p. 18.
Rigo, H. G., 1991 . MSW Management, July/August 1991 , p. 10.
Robinson, W. D., ed., 1986. Solid Waste Handbook: A Practical Guide. John Wiley & Sons, Inc.
Roffman, H., 1991 . The Woodburn MWC-Ash Study, Fourth Year Results as of September 1991 . A WD Technologies, Inc., 1991.
RT, 1991. Waste Age's Recycling Times, Vol. 3, #26, December 31 , 1991 .
RT, 1992. Waste Age's Recycling Times, Vol. 4 , #6, March 24, 1992.
188
Rushton, J., 1992. "Developing Recycling Markets for the Components of Residential Mixed Paper," Resource Recycling, January 1992, p. 26.
RRR, 1992. Resource Recovery Report, Vol 16, #4, February 1992.
Savage, G. M. and L. F. Diaz, 1990. Processing of Solid Waste for Material Recovery. Proceedings of ASME National Waste Processing Conference. Long Beach, California, June 1990, pp. 417-426.
Scarlett, L., 199 1. Integrated Solid Waste Management. Problems and Policy Options. Policy Insight , #128, May 1991. Reason Foundation, Santa Monica California.
Sellers, V. R. and J. D. Sellers, 1989. "Comparative Energy and Environmental Impacts for Soft Drink Delivery Systems." Franklin Associates, 1989.
SETAC, 1991. A Technical Framework for Life-Cycle Assessment. Society of Environmental Toxicology and Chemistry and Society of Environmental Toxicology and Chemistry Foundation for Environmental Education, Inc., Washington, D.C. January 1991.
Snow, D., 1989. Trends in Collecting Recyclables. Waste Alternatives/Waste Reduction and Recycling. June 1989, pp. 58-65.
Spencer, R., 1991. Design Elements for Solid Waste Composting. Biocycle, July 199 1 , pp. 50-53).
SRI, 1985. Synthetic Fuels Report. Energy Technology Economics Program, SRI International, 1985.
SRI, 1990. New Horizons in Cancer Management. SRI International, September 1990.
SRI, 199 1. Personal communication with
SWMP, 1991 . Solid Waste Management Plan. County of Will, Illinois, January 1991.
TCR, 1991. Technology Characterization Report. State of California Energy Resources Conservation and Development Commission, October 1 1, 1991 .
Thornloe, S., 1991. "U.S. Research on Enhancing Landfill Gas Production, Landfill Gas Enhancement Data Exchange." Final Report of the Landfill Gas Expert Working Group, P.S. Lawson, D.J.V. Campbell, A. Lagerkvist, and J. E. Meijer, International Energy Agency, AEA-EE-0286, 1991.
Thurner, C. and D. Ashley. Developing Recycling Markets and Industries. Washington, C. D., National Conference of State Legislatures, July 1990.
J. Trombly, "Developing Non-Traditional Glass Markets," Resource Recycling, October 1991, p. 71 .
Usherson, J., 1992. "Recycled Paper and Sludge. " Resource Recycling, March 1992, p. 95.
189
Varello, P., 1992. Integrated Waste Services Association, Testimony to Committee on Energy and Commerce, Subcommittee on Transportation and Hazardous Materials, Washington, D.C., March 10, 1992.
Vesilind, P.A. et al., in press. "Assessing the True Cost of Landfills," Department of Civil and Environmental Engineering, to be published in Waste Management and Research Journal. 1992.
Walsh, P., 1990. "Sanitary Landfill Costs, Estimated." Part 1 : WasteAge, March 1990, p. 50; Part 2: Waste Age, April 1990, p. 289.
Walsh, P., 1992. Personal communication with B. Morey, SRI International, June 8, 1992.
Waste Age, November 1990, p. 156.
Waste Age, 1991. · Directory of Materials Recovery Facilities, May 1991, p. 129.
Weast, E., 1970. Handbook of Chemistry and Physics, E. Weast, ed., CRC Press, 1970.
Weston, 1985. Roy F. Weston, Inc. 1984 Needs Survey Report to Congress: Planned and Existing Projects in the United States. DOE/CF/30784/1 , August 1985.
White, A.L. et al. "Energy Implications of Alternative Solid Waste Management Systems." Tellus Institute, Boston, February 1990.
Wiseman. A. C., 1991. Impediments to Economically Efficient Solid Waste. Management Resources Magazine, Fall 1991, PP. 9-1 1 .
wTe, 1992. wTe Corp., personal communications to Booker Morey of SRI International, April 1992.
190
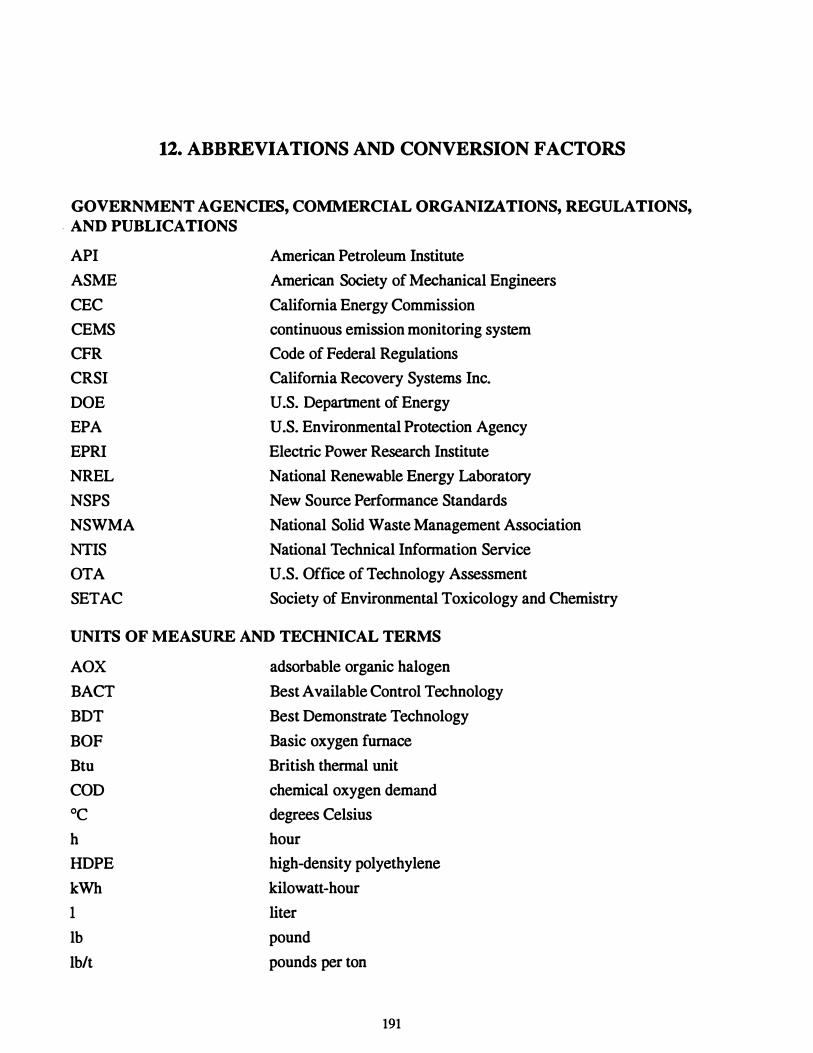
12. ABBREVIATIONS AND CONVERSION FACTORS
GOVERNMENT AGENCIES, COMMERCIAL ORGANIZATIONS, REGULATIONS, . AND PUBLICATIONS
API
ASME
CEC
CEMS
CFR
CRSI
DOE
EPA
EPRI
NREL
NSPS
NSWMA
NTIS
OTA
SETAC
American Petroleum Institute
American Society of Mechanical Engineers
California Energy Commission
continuous emission monitoring system
Code of Federal Regulations
California Recovery Systems Inc.
U.S. Department of Energy
U.S. Environmental Protection Agency
Electric Power Research Institute
National Renewable Energy Laboratory
New Source Performance Standards
National Solid Waste Management Association
National Technical Information Service
U.S. Office of Technology Assessment
Society of Environmental Toxicology and Chemistry
UNITS OF MEASURE AND TECHNICAL TERMS
AOX adsorbable organic halogen
BACT Best Available Control Technology
BDT Best Demonstrate Technology
BOF Basic oxygen furnace
Btu British thermal unit
COD chemical oxygen demand
oc degrees Celsius
h hour
HDPE high-density polyethylene
kWh kilowatt-hour
1 liter
lb pound
lb/t pounds per ton
191
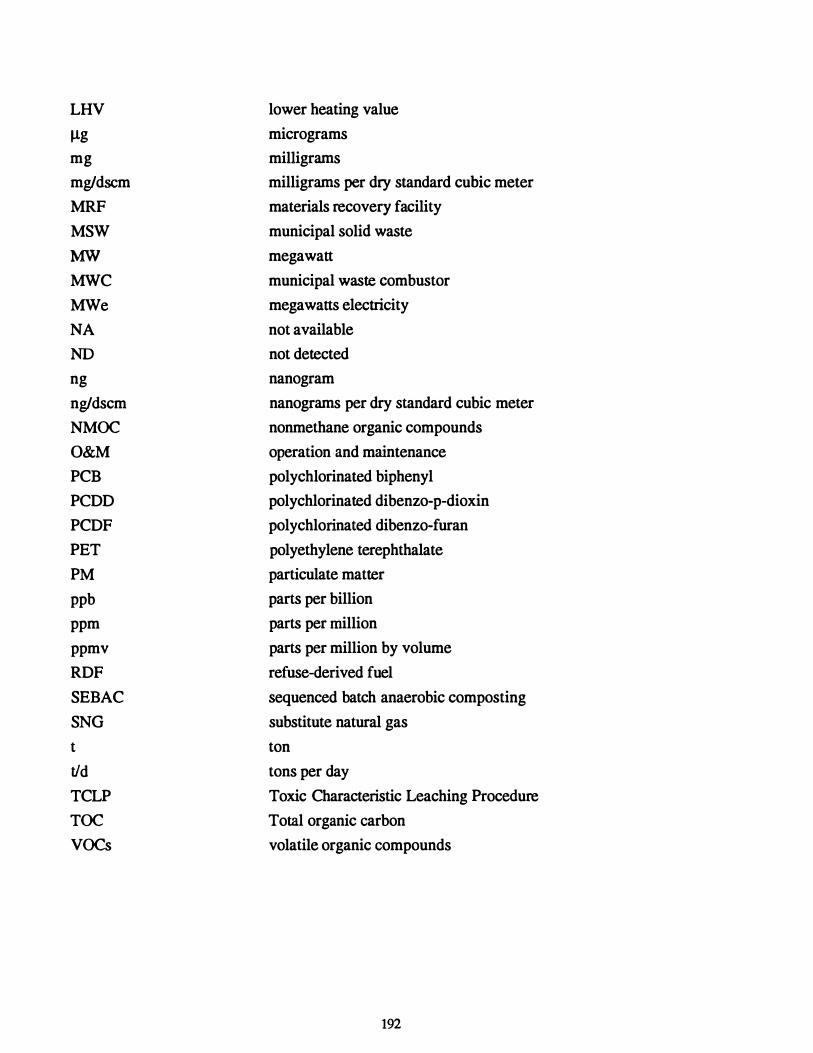
LHV
IJ.g
mg
mg/dscm
MRF
MSW
MW MWC
MWe
NA
ND
ng
ng/dscm
NMOC
O&M PCB
PCDD
PCDF
PET
PM
ppb
ppm
ppmv
RDF
SEBAC
SNG
t
t/d
TCLP
TOC
VOCs
lower heating value
micrograms
milligrams
milligrams per dry standard cubic meter
materials recovery facility
municipal solid waste
megawatt
municipal waste combustor
megawatts electricity
not available
not detected
nanogram
nanograms per dry standard cubic meter
nonmethane organic compounds
operation and maintenance
polychlorinated biphenyl
polychlorinated dibenzo-p-dioxin
polychlorinated dibenzo-furan
polyethylene terephthalate
particulate matter
parts per billion
parts per million
parts per million by volume
refuse-derived fuel
sequenced batch anaerobic composting
substitute natural gas
ton
tons per day
Toxic Characteristic Leaching Procedure
Total organic carbon
volatile organic compounds
192
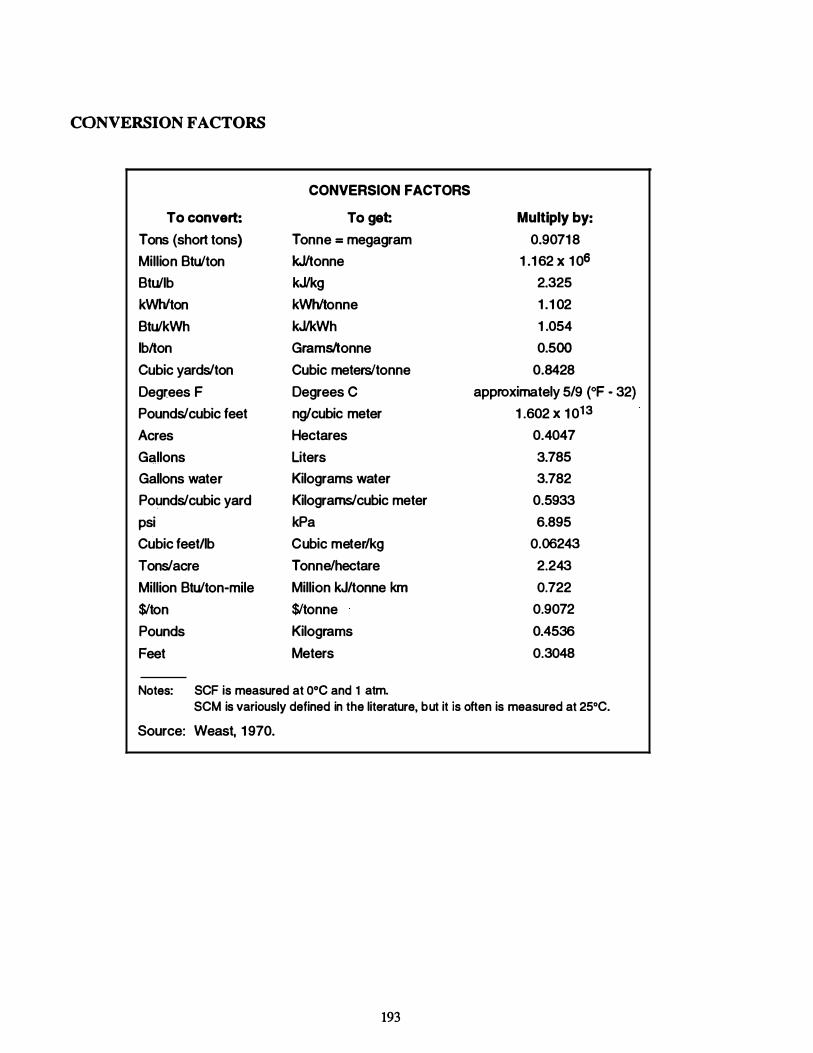
CONVERSION FACTORS
CONVERSION FACTORS
To convert: To get
Tons (short tons) Tonne = megagram
Million Btu/ton kJ/tonne
Btullb kJ/kg
kWh/ton kWh/tonne
Btu/kWh kJ/kWh
lb/ton Grams/tonne
Cubic yards/ton Cubic meters/tonne
Degrees F Degrees C
Pounds/cubic feet ng/cubic meter
Acres Hectares
Gallons Liters
Gallons water Kilograms water
Pounds/cubic yard Kilograms/cubic meter
psi kPa
Cubic feetllb Cubic meter/kg
Tons/acre Tonne/hectare
Million Btu/ton-mile Million kJ/tonne km $/ton $/tonne
Pounds Kilograms
Feet Meters
Notes: SCF is measured at ooc and 1 atm.
Multiply by:
0.90718
1 .1 62 x 1 06
2.325
1 .1 02
1 .054
0.500
0.8428
approximately 5/9 (°F - 32) 1 .602 X 1 013
0.4047
3.785
3.782
0.5933
6.895
0.06243
2.243
0.722
0.9072
0.4536
0.3048
SCM is variously defined in the literature, but it is often is measured at 25°C. Source: Weast, 1 970.
193

Document Control Page 1 . NREL Report No.
NREL/TP-431-4988A
4. Title and Subtitle
2. NTIS Accession No.
DE92016433
Data Sununary of Municipal Solid Waste Management Alternatives. Volume I: Report Text
·
7. Author(s) SRI International
9. Performing Organization Name and Address
SRI International 333 Ravenswood Ave. Menlo Park. CA 94025-3493
1 2. Sponsoring Organization Name and Address
National Renewable Energy Laboratory 1617 Cole Blvd. Golden, CO 80401
1 5. Supplementary Notes NREL Technical Monitor: Bimleshwar Gupta and Philip Shepherd (303) 23 1-1760
1 6. Abstract (Umlt: 200 words)
3. Recipient's Accession No.
5. Publication Date October 1992
6.
8. Performing Organization Rapt. No.
1 0. Projectrrask/Work Unit No. WM21.1010
1 1 . Contract (C) or Grant (G) No.
(C) RF-1-11003
(G)
1 3. Type of Report & Period Covered Subcontract Report
1 4.
The overall objective of the study in this report was to gather data on waste management technologies to allow comparison of various alternatives for managing municipal solid waste (MSW). The specific objectives of the study were to:
1. Compile detailed data for existing waste management technologies on costs, envirorunental releases, energy requirements and production, and coproducts such as recycled materials and compost. 2. Identify missing infonnation necessary to make energy, economic, and envirorunental comparisons of various MSW management technologies, and define needed research that could enhance the usefulness of the technology. 3. Develop a data base that can be used to identify the technology that best meets specific criteria defined by a user of the data base.
Volume I contains the report text. Volume II contains supporting exhibits. Volumes ill through X are appendices, each addressing a specific MSW management technology. Volumes XI and XII contain project bibliographies.
1 7. Document Analysis a. Descriptors
municipal waste; waste to energy; resource recovery; recycling
b. Identifiers/Open-Ended T arms
c. UC Categories 249
1 8. Availability Statement National Technical Infonnation Service U.S. Department of Commerce 5285 Port Royal Road Springfield, VA 22161
onn .NO. wo�� �o-jU·!S 1 J
1 9. No. of Pages
215
20. Price
AlO