Data Sheet on Unemployment and Labour Force
25
End of 7th End of 8t End of 9th FYP(2007) Education GPER 72% 81% 112.00% NPER - 62% 88.00% Primary School Completion R- 77.00% 87%* Teacher Student Ratio (Prim 1:41 1:39 1:30 Teacher Student Ratio(Secon 1:38 1:36 1:26 Gender Parity in Education Gender Parity In- 0.9 1 GPI –Lower & Mi- 0.87 1.05 GPI –Higher Se- 0.61 0.86 Girls for every 100 boys Girl-Boy Rat- 88 98 - Girl-Boy Rati- 87 100.7 -Girl-Boy Ra- 61 81.3 - Girl-Boy R- 39 54 National Literacy - - 59.50% Adult Literacy - - 53% Health & Sanitation Life Expectancy 66.1 - - Population Growth Rate 3.11 2.52 1.33 IMR (per 1,000) 70.71 60.12 40.13 U-5MR (per 1,000) 96.91 842 61.53 MMR (per 100,000) 3801 2552 150-200 Trained Birth Attendance (% 10.91 23.62 51% Access to improved sanitati80% (1996) 885(2000) 89% Access to improved drinking- 78%(2000) 84% Nutrition (Children) - % underweight 17 - - % stunted 40 - - % wasted 2.6 - - Human Development Index ( H0.55 (1998) 0.583 (20 0.613(2006)
-
Upload
utkarsh235 -
Category
Documents
-
view
222 -
download
3
description
data
Transcript of Data Sheet on Unemployment and Labour Force

End of 7th FY End of 8th End of 9th FYP(2007)EducationGPER 72% 81% 112.00%NPER - 62% 88.00%Primary School Completion Rate - 77.00% 87%*Teacher Student Ratio (Primary) 1:41 1:39 1:30Teacher Student Ratio(Secondary) 1:38 1:36 1:26Gender Parity in Education Gender Parity Index (GPI) - 0.9 1 GPI –Lower & Middle Sec - 0.87 1.05 GPI –Higher Secondary - 0.61 0.86Girls for every 100 boys Girl-Boy Ratio (Primary) - 88 98 - Girl-Boy Ratio (Lower - 87 100.7 -Girl-Boy Ratio (Higher - 61 81.3 - Girl-Boy Ratio (Tertiary) - 39 54National Literacy - - 59.50%Adult Literacy - - 53%Health & SanitationLife Expectancy 66.1 - -Population Growth Rate 3.11 2.52 1.33IMR (per 1,000) 70.71 60.12 40.13U-5MR (per 1,000) 96.91 842 61.53MMR (per 100,000) 3801 2552 150-200Trained Birth Attendance (%) 10.91 23.62 51%Access to improved sanitation 80% (1996) 885(2000) 89%Access to improved drinking wate- 78%(2000) 84%Nutrition (Children) -% underweight 17 - -% stunted 40 - -% wasted 2.6 - -Human Development Index ( HDI)0.55 (1998) 0.583 (2000.613(2006)

Labor forceLabor forceLabor partiLabor partiLabor participation rate, total (% of total population ages 15+)1991 37.12169 205853.3 49.6 78.2 64.41992 36.86141 203635.8 49 78.4 64.21993 36.58539 198433.2 48.3 78.6 63.91994 36.24239 192180.1 47.5 78.9 63.61995 36.08837 187398.3 47 79.1 63.41996 36.08887 186256.9 46.9 79.2 63.51997 36.60032 188624.9 47.5 79.3 63.71998 37.23532 194415 48.4 79.4 64.11999 38.0719 203335.1 49.8 79.3 64.72000 38.86448 214785.6 51.5 79.2 65.52001 39.5599 228293.8 53.5 79.1 66.52002 40.1178 243641.3 55.7 78.9 67.62003 40.56934 260583.4 58 78.7 68.72004 40.86903 278571.3 60.2 78.4 69.82005 41.17404 295186.5 62 78 70.52006 41.45032 310489.4 63.4 77.6 712007 41.716 323604 64.3 77.2 71.22008 42.01734 334867.3 64.9 76.6 71.22009 42.25542 344327.9 65.1 76 712010 42.51618 352699.4 65.2 75.5 70.72011 42.47963 364265.2 65.5 76 71.1

Labor participation rate, total (% of total population ages 15+)

Annual Report for the fiscal year 2011-12Summary Findings of Labour Force Survey 2012Subject 2009Total Population 679,700Total Labour Force 325,700Total Persons Employed 312,800Total Unemployed 12,900Unemployment Rate 4% Rural 7500 (3.0%) Urban 5400 (7.5%)Total Youth Unemployed 9000Youth Unemployment Rate 12.90% Male 3200 Female 5800 Rural 5400

2010 2011 2012696,500 713,200 734,851331,900 334,200 336,391320,900 323,700 329,487
11,000 10,500 6,9043.30% 3.10% 2.10%
6100 (2.6%5100 (2.1%3663 (1.5%)4900 (5.1%5400 (5.9%3241 (3.5%)
5100 4800 34769.20% 9.20% 7.30%
1800 1500 13933300 3300 20832000 2200 1743

Note: The rate for 2008 has not been included since there was no survey done during that year

TABLE 4.1: PERCENTAGE OF POPULATION ACCORDING TO ECONOMIC ACTIVITY BY AGE & SEX, 1984
Age groupAgriculture Service Business Others Occupation
Male
Less than 15 7 1 92
1 54.7 2 * 3.5 39.7
20-24 70.9 11.1 1.5 4 12.5
25-29 76.7 13.8 2 4.4 3.1
30-34 82 11.1 1.7 4.3 0.8
35-39 84.4 7.7 2.4 4.3 *
40-44 87.7 5.9 2.3 3.6 *
45-54 90.5 3.3 1.6 3.6 1
55-64 88.1 1 0.9 4 6
65 and over 71.1 1.5 * 0.9 26
All ages 52.5 3.9 0.9 2.8 39.9
Age 15-64 78.4 6.5 1.4 4 9.6
Female
Less than 15 9.2 0.2 90.7
15-19 87.8 * * 0.4 11
20-24 95.7 1 1.1 * 2.1
25-29 98 * * * 0.7
30-34 98.4 * * * *35-39 99.1 * * * *40-44 99.2 * * *45-54 98.4 * * * 1.255-64 91.1 * * * 8.5
65 and over 73.2 * * 26.1All ages 61.5 0.3 0.3 0.2 37.8
Age 15-64 95.4 0.4 0.5 0.2 3.6

TABLE 4.1: PERCENTAGE OF POPULATION ACCORDING TO ECONOMIC ACTIVITY BY AGE & SEX, 1984

Table 4.4: Percent distribution of umemployed persons by age- sex and area of
residence, Bhutan, 1998
Age grouTotal Urban Rural
Both sexes 100 37.2 62.8
15-19 20.4 5.9 14.5
20-24 25.1 9.6 15.5
25-29 13.1 6.9 6.2
30-34 10.5 4.5 6.1
35-39 13 3.3 9.7
40-44 4.1 1.8 2.3
45-49 4.1 3.2 0.9
50-54 4.8 0.5 4.4
55-59 4.4 1 3.4
60-64 0.5 0.5 0
65+ 0 0 0
Male 55.6 14.7 40.9
15-19 9.4 2.3 7.2
20-24 17.5 3.4 14
25-29 6.4 2.5 3.9
30-34 4.8 1.6 3.3
35-39 8.1 1.6 6.5
40-44 2.1 0.8 1.3
45-49 2 1.2 0.9
50-54 1.1 0.3 0.9
55-59 3.8 0.7 3.1
60-64 0.3 0.3 0
65+ 0 0 0
Female 44.4 22.5 21.9
15-19 11 3.6 7.4
20-24 7.6 6.2 1.4
25-29 6.6 4.3 2.3
30-34 5.7 2.9 2.8
35-39 4.9 1.7 3.2
40-44 2 1.1 1
45-49 2.1 2.1 0
50-54 3.7 0.2 3.5
55-59 0.5 0.3 0.3
60-64 0.2 0.2 0
65+ 0 0 0
Source: National Labour Force survey 1998, Bhutan

Table 4.5: Percent distribution of umemployed persons by age- sex and area of
residence, Bhutan, 1999
Age grouTotal Urban Rural
Both sexes 100 26.2 73.8
15-19 18.9 5.8 13.1
20-24 30.5 8.4 22.1
25-29 18.9 4.7 14.2
30-34 3.5 2.3 1.2
35-39 3.4 2 1.4
40-44 5.1 1.3 3.8
45-49 11.7 0.8 1.9
50-54 4.4 0.8 3.6
55-59 2.1 0 2.1
60-64 1.4 0.1 1.3
65+ 0 0 0
Male 47.1 10.4 36.7
15-19 5.2 2.2 2.9
20-24 14.6 3.8 10.8
25-29 9.1 1.6 7.4
30-34 2 0.8 1.2
35-39 0.8 0.8 0
40-44 2.5 0.3 2.2
45-49 9.6 0.3 9.4
50-54 3.2 0.5 2.7
55-59 0 0 0
60-64 0 0 0
65+ 0 0 0
Female 52.9 15.8 37.2
15-19 13.7 3.6 10.1
20-24 15.9 4.6 11.3
25-29 9.8 3 6.8
30-34 1.5 1.5 0
35-39 2.6 1.2 1.4
40-44 2.6 1 1.7
45-49 2.1 0.5 1.6
50-54 1.2 0.3 0.9
55-59 2.1 0 2.1
60-64 1.4 0.1 1.3
65+ 0 0 0
Source: National Labour Force survey 1999, Bhutan

Table 4.6: Percent distribution of employed persons by age-sex and area of residence, Bhutan, 1998
Age group Total Urban Rural
Both sexes 100 13.3 86.7
15-19 10.8 0.6 10.2
20-24 12.6 1.7 10.8
25-29 13.3 2.9 10.4
30-34 11.7 2.4 9.3
35-39 10.8 2 8.8
40-44 9.7 1.4 8.3
45-49 8.5 1 7.4
50-54 8.1 0.5 7.5
55-59 6.1 0.3 5.8
60-64 4.7 0.2 4.5
65+ 3.8 0.1 3.7
Male 55.8 9.8 46
15-19 4.8 0.3 4.5
20-24 6.3 1 5.3
25-29 6.8 2 4.8
30-34 6.9 1.9 5
35-39 6.4 1.6 4.9
40-44 5.4 1.1 4.3
45-49 5 0.9 4.2
50-54 4.7 0.4 4.2
55-59 3.8 0.3 3.5
60-64 3 0.1 2.9
65+ 2.6 0.1 2.4
Female 44.2 3.5 40.8
15-19 6 0.3 5.7
20-24 6.3 0.7 5.6
25-29 6.4 0.9 5.6
30-34 4.8 0.6 4.3
35-39 4.4 0.4 4
40-44 4.3 0.3 4
45-49 3.4 0.2 3.3
50-54 3.4 0.1 3.3
55-59 2.3 0.1 2.3
60-64 1.7 0 1.6
65+ 1.3 0 1.3
Source: National labour Survey 1998, Bhutan
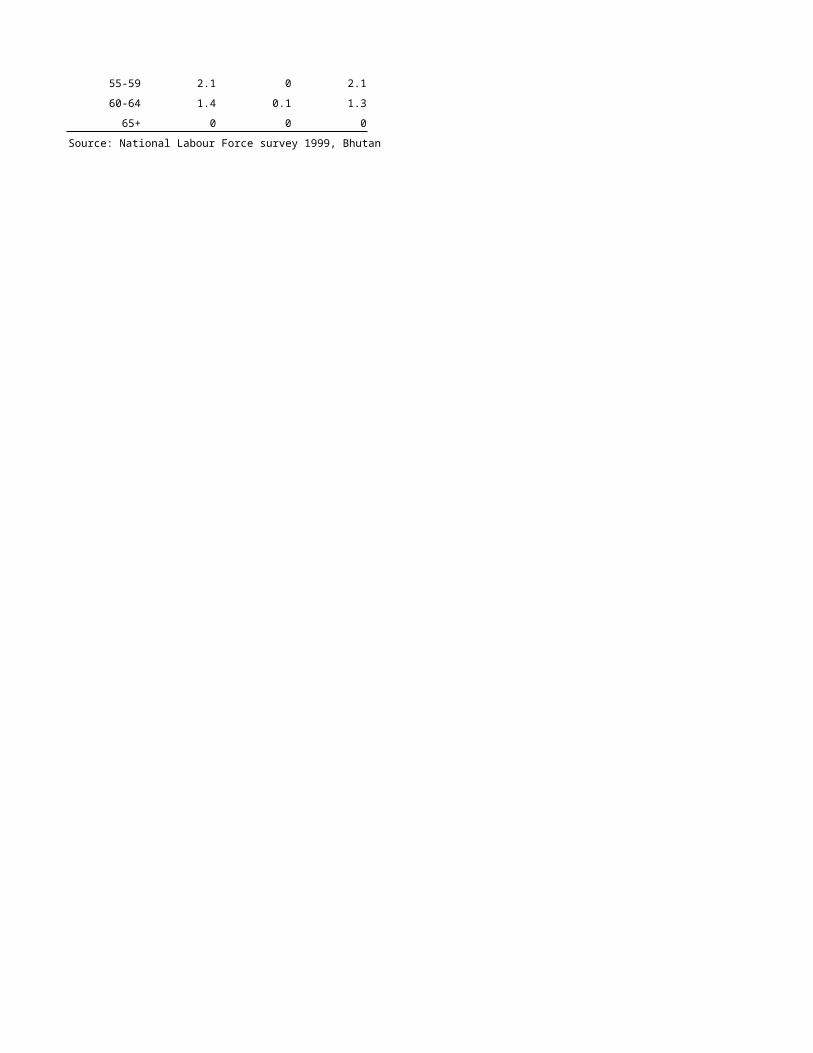
Table 4.7: Percent distribution of employed by age-sex and area of receidence, Bhutan, 1999
Age group Total Urban Rural
Both sexes 100 11 89
15-19 7.2 0.4 6.8
20-24 9.1 1.3 7.8
25-29 8.3 2.4 6
30-34 6.5 2.1 4.4
35-39 6.1 1.8 4.3
40-44 5.3 1.1 4.1
45-49 5 0.9 4.1
50-54 3.1 0.4 2.6
55-59 3.1 0.3 2.9
60-64 1.3 0.1 1.1
65+ 1.4 0.1 1.3
Male 54.5 7.7 46.8
15-19 5.6 0.2 5.4
20-24 6.6 0.7 5.9
25-29 6.8 1.5 5.2
30-34 5.8 1.5 4.3
35-39 5.4 1.3 4.1
40-44 5.6 0.9 4.7
45-49 4.7 0.8 4
50-54 4.3 0.3 4
55-59 4.1 0.2 3.9
60-64 3 0.1 2.9
65+ 2.6 0.1 2.5
Female 45.5 3.3 42.2
15-19 6.8 0.3 6.5
20-24 7.8 0.6 7.2
25-29 6 0.8 5.2
30-34 4.4 0.6 3.8
35-39 4.3 0.5 3.9
40-44 4.1 0.2 3.9
45-49 4.1 0.2 3.9
50-54 2.6 0.1 2.6
55-59 2.9 0.1 2.8
60-64 1.1 0 1.1
65+ 1.3 0 1.3
Source: National Labout Force Survey 1999, Bhutan

Table 4.8: Percent distribution of economically active and inactive population
by age and area of residence, participation rate, 1998
Age group
Total EconomicallEconomically active population Rate
Percent Inactive Employednemployed LFPR EmploymentUnemployment
Rate Rate
Both areas 100 41.1 58.1 0.8 58.9 98.6 1.4
15-19 17 10.6 6.3 0.2 37.8 97.5 2.5
20-24 13.2 5.7 7.3 0.2 56.7 97.3 2.7
25-29 11.2 3.3 7.7 0.1 70.1 98.6 1.4
30-34 9.3 2.4 6.8 0.1 74.2 98.8 1.2
35-39 8.6 2.2 6.3 0.1 74.3 98.4 1.6
40-44 7.8 2.1 5.6 0 72.8 99.4 0.6
45-49 7.1 2.1 4.9 0 70.2 99.3 0.7
50-54 6.9 2.2 4.7 0 68.6 99.2 0.8
55-59 5.8 2.2 3.6 0 62.4 99 1
60-64 5.2 2.5 2.7 0 52.5 99.8 0.2
65+ 8 5.8 2.2 0 28 99.5 0.5
Urban 14.9 6.9 7.7 0.3 53.9 96.2 3.8
15-19 2.5 2.1 0.4 0 16.1 88.2 11.8
20-24 2.3 1.3 1 0.1 46.1 92.8 7.2
25-29 2.7 1 1.7 0.1 63.6 96.8 3.2
30-34 2.1 0.7 1.4 0 68.1 97.5 2.5
35-39 1.7 0.5 1.1 0 69.8 97.7 2.3
40-44 1.2 0.3 0.8 0 72.3 98.2 1.8
45-49 0.9 0.2 0.6 0 72.2 95.9 4.1
50-54 0.5 0.2 0.3 0 64.7 98.8 1.2
55-59 0.3 0.1 0.2 0 61.7 96.2 3.8
60-64 0.3 0.2 0.1 0 34.7 95.3 4.7
65+ 0.4 0.3 0.1 0 21.9 98.7 1.3
Rural 85.1 34.2 50.4 0.5 59.8 99 1
15-19 14.5 8.5 5.9 0.1 41.5 98.1 1.9
20-24 10.9 4.5 6.3 0.1 59 98.1 1.9
25-29 8.4 2.3 6 0 72.2 99.2 0.8
30-34 7.2 1.7 5.4 0 76.1 99.1 0.9
35-39 6.9 1.7 5.1 0.1 75.4 98.5 1.5
40-44 6.6 1.8 4.8 0 72.9 99.6 0.4
45-49 6.2 1.9 4.3 0 69.9 99.8 0.2
50-54 6.4 2 4.4 0 68.9 99.2 0.8
55-59 5.4 2 3.4 0 62.4 99.2 0.8
60-64 4.9 2.3 2.6 0 53.3 100 0
65+ 7.6 5.5 2.1 0 28.3 99.6 0.4
Source: National Labour Force survey 1998, Bhutan

Table 4.9: Percent distribution of economically active and inactive population
by age abd area of residence,participation rate, Bhutan, 1999
Age groupTotal Economicall Economically active population Rate
Percent Inactive EmployedUnemployed LFPREmploymentUnemployment
Rate Rate
Both areas 100 30.4 68.7 1 69.6 98.6 1.4
15-19 18.1 9.4 8.5 0.2 48 97.9 2.1
20-24 14.6 4.4 9.9 0.3 69.9 97.1 2.9
25-29 10.9 2 8.7 0.2 82 97.7 2.1
30-34 8.6 1.5 7 0 82 99.5 0.5
35-39 8.1 1.4 6.6 0 82.8 99.5 0.5
40-44 8.1 1.3 6.7 0.1 83.4 99.3 0.7
45-49 7.5 1.3 6.1 0.1 82.8 98.2 1.8
50-54 6 1.1 4.8 0 81.1 99.1 0.9
55-59 6.1 1.3 4.8 0 79 99.6 0.4
60-64 4.5 1.6 2.8 0 63.6 99.5 0.5
65+ 7.6 5 2.7 0 35 100 0
Urban 13.5 5.7 7.6 0.3 57.8 96.7 3.3
15-19 2.4 2 0.3 0.1 14.9 83.9 16.1
20-24 2 1 0.9 0.1 49.2 91.6 8.4
54-29 2.4 0.8 1.6 0 68.1 97.3 2.7
30-34 2 0.5 1.5 0 74.1 98.5 1.5
35-39 1.6 0.4 1.2 0 75.1 98.4 1.6
40-44 1.1 0.3 0.8 0 73.9 98.4 1.6
45-49 0.8 0.2 0.6 0 76.9 98.8 1.2
50-54 0.4 0.1 0.3 0 72.9 97.4 2.6
55-59 0.3 0.1 0.2 0 67 100 0
60-64 0.2 0.1 0.1 0 52.8 99.3 0.7
65+ 0.3 0.2 0.1 0 28.5 100 0
Rural 86.5 24.7 61.1 0.7 71.5 98.8 1.2
15-19 15.8 7.4 8.2 0.1 52.9 98.5 1.5
20-24 12.6 3.4 9 0.2 73.2 97.7 2.3
25-29 8.5 1.2 7.1 0.1 86 98.1 1.9
30-34 6.6 1 5.6 0 84.4 99.8 0.2
35-39 6.4 1 5.4 0 84.7 99.8 0.2
40-44 7 1.1 5.9 0 84.8 99.4 0.6
45-49 6.6 1.1 5.4 0.1 83.5 98.1 1.9
50-54 5.6 1 4.5 0 81.7 99.2 0.8
55-59 5.8 1.2 4.6 0 79.6 99.5 0.5
60-64 4.3 1.5 2.7 0 64.1 99.5 0.5
65+ 7.4 4.8 2.6 0 35.3 100 0
Source: National Labour Force survey 1999, Bhutan

Table 4.10: Percent distribution of economically active and inactive population
by age and sex specific participation rate, Bhutan, 1998
Age groupTotal Econimacall Economically active population Rate
Percent Inactive EmployedUnemployed LFPR EmploymentUnemployment
Rate Rate
Both sexes 100 41.1 58.1 0.8 58.9 98.6 1.4
15-19 17 10.6 6.3 0.2 37.8 97.5 2.5
20-24 13.2 5.7 7.3 0.2 56.7 97.3 2.7
25-29 11.2 3.3 7.7 0.1 70.1 98.6 1.4
30-34 9.3 2.4 6.8 0.1 74.2 98.8 1.2
35-39 8.6 2.2 6.3 0.1 74.3 98.4 1.6
40-44 7.8 2.1 5.6 0 72.8 99.4 0.6
45-49 7.1 2.1 4.9 0 70.2 99.3 0.7
50-54 6.9 2.2 4.7 0 68.6 99.2 0.8
55-59 5.8 2.2 3.6 0 62.4 99 1
60-64 5.2 2.5 2.7 0 52.5 99.8 0.2
65+ 8 5.8 2.2 0 28 99.5 0.5
Male 50.3 17.4 32.4 0.4 65.3 98.6 1.4
15-19 8.4 5.6 2.8 0.1 34.1 97.4 2.6
20-24 6.6 2.8 3.7 0.1 57.7 96.3 3.7
25-29 5.2 1.2 4 0.1 76.6 98.7 1.3
30-34 4.7 0.6 4 0 86.8 99 1
35-39 4.3 0.5 3.7 0.1 87.4 98.3 1.7
40-44 3.9 0.7 3.1 0 81.1 99.5 0.5
45-49 3.4 0.5 2.9 0 85.9 99.4 0.6
50-54 3.5 0.8 2.7 0 78 99.7 0.3
55-59 3.1 0.9 2.2 0 72.2 98.6 1.4
60-64 2.9 1.1 1.8 0 61 99.9 0.1
65+ 4.2 2.7 1.5 0 35.4 100 0
Female 49.7 23.6 25.7 0.4 52.5 98.6 1.4
15-19 8.6 5.1 3.5 0.1 41.4 97.5 2.5
20-24 6.6 2.9 3.6 0.1 55.7 98.3 1.7
25-29 5.9 2.1 3.7 0.1 64.3 98.6 1.4
30-34 4.6 1.8 2.8 0 61.6 98.4 1.6
35-39 4.2 1.7 2.5 0 60.8 98.5 1.5
40-44 3.9 1.4 2.5 0 64.5 99.4 0.6
45-49 3.6 1.6 2 0 55.3 99.2 0.8
50-54 3.4 1.4 2 0 59.1 98.5 1.5
55-59 2.6 1.3 1.3 0 50.8 99.7 0.3
60-64 2.3 1.3 1 0 41.9 99.8 0.2
65+ 3.8 3 0.7 0 19.7 98.6 1.4
Crude activity = 38. Employment rate = 98.6. General activity = 59.
Unemployment rate = 1.4. Economic dependency ratio = 166.
Note:- LFPR = Labour Force Participation Rate.
Source: National Labour Force Survey 1998 and 1999, Bhutan
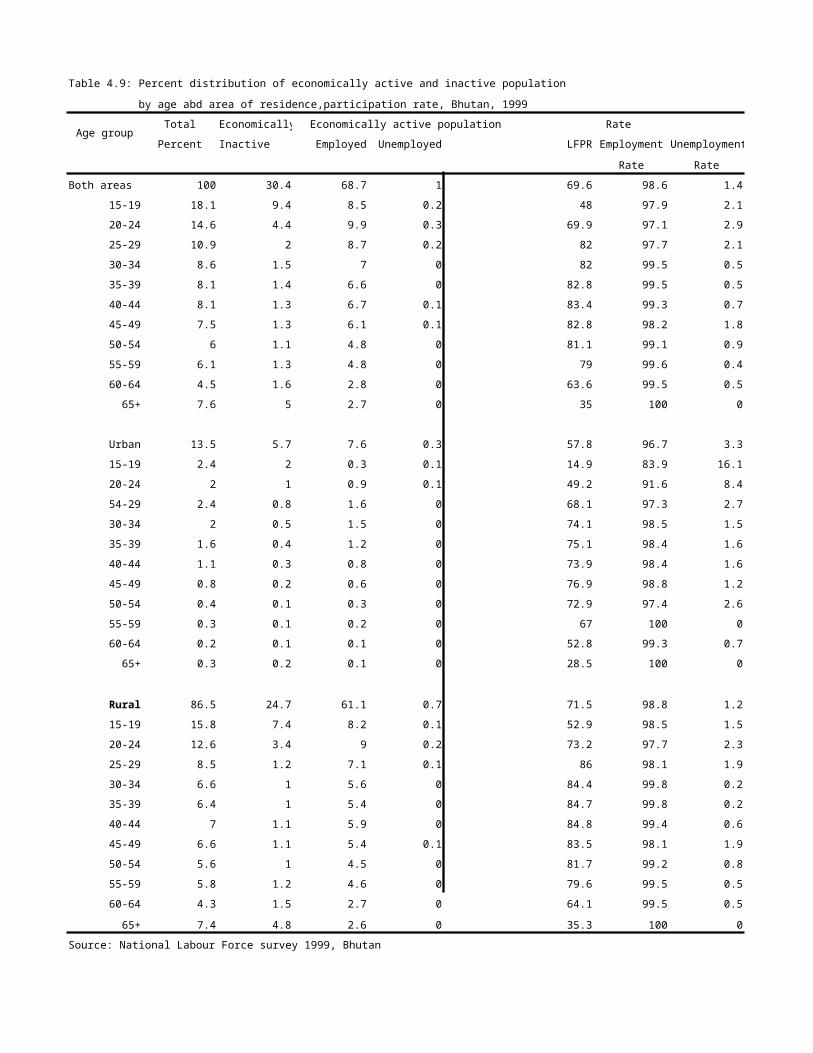
Table 4.11: Percent distribution of economically active and inactive population
by age and sex specific participation rate in Bhutan,1999
Age group
Toal EconomicallEconomically active population Rate
Percent Incative EmployedUnemployed LFPR EmploymentUnemployment
Rate Rate
Both sexes 100 30.4 68.7 1 69.6 98.6 1.4
15-19 1801 9.4 8.5 0.2 48 97.7 2.1
20-24 1406 4.4 9.9 0.3 69.9 97.1 2.9
25-29 10.9 2 8.7 0.2 82 97.9 2.1
30-34 8.6 1.5 7 0 82 99.5 0.5
35-39 8.1 1.4 6.6 0 82.8 99.5 0.5
40-44 8.1 1.3 6.7 0.1 83.4 99.3 0.7
45-49 7.5 1.3 6.1 0.1 82.8 98.2 1.8
50-54 6 1.1 4.8 0 81.1 99.1 0.9
55-59 6.1 1.3 4.8 0 79 99.6 0.4
60-64 4.5 1.6 2.8 0 63.6 99.5 0.5
65+ 7.6 5 2.7 0 35 100 0
Male 49.4 11.5 37.4 0.5 76.7 98.8 1.2
15-19 8.8 5 3.8 0.1 44 98.7 1.3
20-24 6.9 2.2 4.6 0.1 67.7 97 3
25-29 5.2 0.5 4.6 0.1 90.5 98.1 1.9
30-34 4.2 0.2 4 0 95 99.5 0.5
35-39 3.9 0.3 3.7 0 93.5 99.8 0.2
40-44 4 0.1 3.9 0 98.3 99.4 0.6
45-49 3.5 0.1 3.3 0.1 95.8 97.2 2.8
50-54 3.3 0.3 3 0 91.5 98.9 1.1
55-59 3 0.2 2.8 0 94.2 100 0
60-64 2.6 0.5 2.1 0 80.4 100 0
65+ 4 2.2 1.8 0 44.5 100 0
Female 50.6 18.8 31.3 0.5 62.8 98.4 1.6
15-19 9.3 4.5 4.7 0.1 51.8 97.2 2.8
20-24 7.6 2.1 5.3 0.2 71.9 97.2 2.8
25-29 5.7 1.5 4.1 0.1 74.1 97.7 2.3
30-34 4.4 1.3 3 0 69.5 99.5 0.5
35-39 4.1 1.1 3 0 72.5 99.2 1.8
40-44 4.2 1.3 2.8 0 69.2 99.1 0.9
45-49 4 1.1 2.8 0 71.3 99.3 0.7
50-54 2.7 0.8 1.8 0 68.3 99.4 0.6
55-59 3.1 1.1 2 0 64.4 99 1
60-64 1.9 1.1 0.8 0 41.4 98.3 1.7
65+ 3.7 2.8 0.9 0 24.7 100 0
Crude activity =45 Employment rate = 98.6 General activity = 70 Unemployment rate = 1.4
Economic dependency ratio =122. Note:- LFPR = Labour Participation Rate.
Source: National Labour Force Survey 1998 and 1999, Bhutan

Table 4.12: Percent distribution of population in different econommic
status by sex and area of residence, Bhutan, 1998
Economic st Both areas Urban area Rural
Both sexes 100 15.6 84.4
Under 15 ye 36.1 6.1 30
Economically 37.7 5.1 32.5
Employed 37.1 4.9 32.2
Unemployed 0.5 0.2 0.3
Economically 26.2 4.4 21.8
Work around 8.3 2 6.4
Students 6.7 1.5 5.2
Retired 0.3 0.1 0.2
Others 10.9 0.8 10.1
Male 50.4 7.9 42.5
Under 15 ye 18.3 3.1 15.2
Economically 21 3.7 17.3
Employed 20.7 3.6 17.1
Umemploye 0.3 0.1 0.2
Economically 11.1 1.1 10
Work around 1.4 0.1 1.3
Students 4.2 0.7 3.5
Retired 0.2 0.1 0.1
Others 5.3 0.2 5.1
Female 49.6 7.7 41.9
Under 15 ye 17.8 3 14.8
Economically 16.7 1.4 15.3
Employed 16.4 1.3 15.1
Unemployed 0.2 0.1 0.1
Economically 15.1 3.3 11.8
Work around 7 1.9 5.1
Students 2.4 0.8 1.7
Retired 0.1 0 0.1
Others 5.6 0.6 5
Source: National Labour Force Survey 1998, Bhutan

Table 4.13: Percent distribution of population in different economic
status by sex and area of residence, Bhutan, 1999
Economic stBoth areas Urban areasRural areas
Both sexes 100 14.1 85.9
Under 15 ye 35.5 5.4 30
Economically 45 5 39.9
Employed 44.3 4.9 39.4
Unemployed 0.6 0.2 0.5
Economically 19.6 3.7 15.9
Work around 6.3 1.8 4.5
Students 7.6 1.5 6.1
Retired 0.1 0 0.1
Others 5.6 0.3 5.2
Male 50 7.2 42.8
Under 15 ye 18.1 2.7 15.3
Economically 24.4 3.5 21
Employed 24.2 3.4 20.7
Unemployed 0.3 0.1 0.2
Economically 7.4 1 6.5
Work around 0.3 0 0.3
Students 4.4 0.8 3.6
Retired 0.1 0 0.1
Others 2.6 0.1 2.5
Female 50 6.9 43.1
Under 15 ye 17.4 2.7 14.7
Economically 20.5 1.6 18.9
Employed 20.2 1.5 18.7
Unemployed 0.3 0.1 0.2
Economically 12.2 2.7 9.5
Work around 5.9 1.7 4.2
Students 3.2 0.7 2.5
Retired 0 0 0
Others 3 0.2 2.8
Source: National Labour Force Survey 1999, Bhutan