DATA REPORT: PENETROMETER MEASUREMENTS OF IN SITU ...
68
Proc. IODP | Volume 308 doi:10.2204/iodp.proc.308.203.2008 Flemings, P.B., Behrmann, J.H., John, C.M., and the Expedition 308 Scientists Proceedings of the Integrated Ocean Drilling Program, Volume 308 Abstract We conducted temperature and pore pressure measurements us- ing the Davis-Villinger Temperature-Pressure Probe and the tem- perature/dual pressure probe penetrometers during Integrated Ocean Drilling Program Expedition 308. In Ursa Basin, 18 mea- surements were used to determine that the geothermal gradient at Site U1324 is bilinear. The temperature gradient is 18.6°C/km in lithostratigraphic Unit I and 16.7°C/km in Unit II. Based on nine measurements at Site U1322, the geothermal gradient is 21.9°C/ km. In Brazos-Trinity Basin IV, the geothermal gradient at Site U1320 is 23.1°C/km. In Ursa Basin, significant overpressures (overpressure ratio = ~0.7) are observed in the sediments above ~200 meters below seafloor (mbsf) at Sites U1322 and U1324. At Site U1324, pore pressure decreases with increasing depth be- tween 200 and 300 mbsf. Below 300 mbsf and within lithostrati- graphic Unit II, overpressure is approximately constant (~1 MPa). Unit II is composed of silty claystone interbedded with beds of silt and very fine sand. In Brazos-Trinity Basin IV, only two penetrom- eter deployments were made and the data are inconclusive. Introduction The objective of this report is to present in situ pressure and tem- perature data measured using downhole pressure penetrometers during Integrated Ocean Drilling Program (IODP) Expedition 308 (see the “Expedition 308 summary” chapter). These data have also been presented and interpreted in Long et al. (2007a) (see the “DOWNHOLE” folder in “Supplementary material”). Pressure and temperature data are critical for constraining fluid flow, heat flow, and hydraulic and thermal diffusivity. In addition, tempera- ture affects sediment diagenesis and microbial activity. Expedi- tion 308 is dedicated to the study of overpressure and fluid flow on the Gulf of Mexico continental slope. Knowledge of the pore pressure, and stress regime in general, is critical for evaluating submarine slope stability. It has been hypothesized that overpres- sure, pore pressures in excess of hydrostatic pressure, can weaken the strength of sediments and thus cause slope instability near the seafloor (Davis et al., 1983; Dugan and Flemings, 2002). Over- pressure and the shallow-water flow frequently cause operational problems during drilling (Ostermeier et al., 2001). Data report: penetrometer measurements of in situ temperature and pressure, IODP Expedition 308 1 H. Long, 2 P.B. Flemings, 3 B. Dugan, 4 J.T. Germaine, 5 and D. Ferrell 6 Chapter contents Abstract . . . . . . . . . . . . . . . . . . . . . . . . . . . . . . . 1 Introduction . . . . . . . . . . . . . . . . . . . . . . . . . . . 1 Method . . . . . . . . . . . . . . . . . . . . . . . . . . . . . . . 2 Results . . . . . . . . . . . . . . . . . . . . . . . . . . . . . . . . 2 Acknowledgments . . . . . . . . . . . . . . . . . . . . . . . 4 References . . . . . . . . . . . . . . . . . . . . . . . . . . . . . 5 Figures . . . . . . . . . . . . . . . . . . . . . . . . . . . . . . . . 6 Tables . . . . . . . . . . . . . . . . . . . . . . . . . . . . . . . . 20 Appendix A . . . . . . . . . . . . . . . . . . . . . . . . . . . 23 Appendix B . . . . . . . . . . . . . . . . . . . . . . . . . . . 27 Appendix C . . . . . . . . . . . . . . . . . . . . . . . . . . . 34 Appendix figures . . . . . . . . . . . . . . . . . . . . . . . 36 Appendix tables. . . . . . . . . . . . . . . . . . . . . . . . 46 1 Long, H., Flemings, P.B., Dugan, B., Germaine, J.T., and Ferrell, D., 2008. Data report: penetrometer measurements of in situ temperature and pressure, IODP Expedition 308. In Flemings, P.B., Behrmann, J.H., John, C.M., and the Expedition 308 Scientists, Proc. IODP, 308: College Station, TX (Integrated Ocean Drilling Program Management International, Inc.). doi:10.2204/iodp.proc.308.203.2008 2 ExxonMobil Upstream Research Company, 3120 Buffalo Speedway, Houston TX 77098, USA. [email protected] 3 John A. and Katherine G. Jackson School of Geosciences, The University of Texas at Austin, 1 University Station C1100, Austin TX 78712-0254, USA. 4 Department of Earth Science, Rice University, Houston TX 77005, USA. 5 Department of Civil and Environmental Engineering, Massachusetts Institute of Technology, Cambridge MA 02139, USA. 6 Integrated Ocean Drilling Program, Texas A&M University, College Station TX 77845, USA.
Transcript of DATA REPORT: PENETROMETER MEASUREMENTS OF IN SITU ...

Flemings, P.B., Behrmann, J.H., John, C.M., and the Expedition 308 ScientistsProceedings of the Integrated Ocean Drilling Program, Volume 308
Data report: penetrometer measurements of in situ temperature and pressure, IODP Expedition 3081
H. Long,2 P.B. Flemings,3 B. Dugan,4 J.T. Germaine,5 and D. Ferrell6
Proc. IODP | Volume 308
Chapter contents
Abstract . . . . . . . . . . . . . . . . . . . . . . . . . . . . . . . 1
Introduction . . . . . . . . . . . . . . . . . . . . . . . . . . . 1
Method . . . . . . . . . . . . . . . . . . . . . . . . . . . . . . . 2
Results . . . . . . . . . . . . . . . . . . . . . . . . . . . . . . . . 2
Acknowledgments. . . . . . . . . . . . . . . . . . . . . . . 4
References . . . . . . . . . . . . . . . . . . . . . . . . . . . . . 5
Figures . . . . . . . . . . . . . . . . . . . . . . . . . . . . . . . . 6
Tables. . . . . . . . . . . . . . . . . . . . . . . . . . . . . . . . 20
Appendix A . . . . . . . . . . . . . . . . . . . . . . . . . . . 23
Appendix B . . . . . . . . . . . . . . . . . . . . . . . . . . . 27
Appendix C . . . . . . . . . . . . . . . . . . . . . . . . . . . 34
Appendix figures . . . . . . . . . . . . . . . . . . . . . . . 36
Appendix tables. . . . . . . . . . . . . . . . . . . . . . . . 46
1Long, H., Flemings, P.B., Dugan, B., Germaine, J.T., and Ferrell, D., 2008. Data report: penetrometer measurements of in situ temperature and pressure, IODP Expedition 308. In Flemings, P.B., Behrmann, J.H., John, C.M., and the Expedition 308 Scientists, Proc. IODP, 308: College Station, TX (Integrated Ocean Drilling Program Management International, Inc.). doi:10.2204/iodp.proc.308.203.20082ExxonMobil Upstream Research Company, 3120 Buffalo Speedway, Houston TX 77098, USA. [email protected] A. and Katherine G. Jackson School of Geosciences, The University of Texas at Austin, 1 University Station C1100, Austin TX 78712-0254, USA.4Department of Earth Science, Rice University, Houston TX 77005, USA.5Department of Civil and Environmental Engineering, Massachusetts Institute of Technology, Cambridge MA 02139, USA.6Integrated Ocean Drilling Program, Texas A&M University, College Station TX 77845, USA.
AbstractWe conducted temperature and pore pressure measurements us-ing the Davis-Villinger Temperature-Pressure Probe and the tem-perature/dual pressure probe penetrometers during IntegratedOcean Drilling Program Expedition 308. In Ursa Basin, 18 mea-surements were used to determine that the geothermal gradient atSite U1324 is bilinear. The temperature gradient is 18.6°C/km inlithostratigraphic Unit I and 16.7°C/km in Unit II. Based on ninemeasurements at Site U1322, the geothermal gradient is 21.9°C/km. In Brazos-Trinity Basin IV, the geothermal gradient at SiteU1320 is 23.1°C/km. In Ursa Basin, significant overpressures(overpressure ratio = ~0.7) are observed in the sediments above~200 meters below seafloor (mbsf) at Sites U1322 and U1324. AtSite U1324, pore pressure decreases with increasing depth be-tween 200 and 300 mbsf. Below 300 mbsf and within lithostrati-graphic Unit II, overpressure is approximately constant (~1 MPa).Unit II is composed of silty claystone interbedded with beds of siltand very fine sand. In Brazos-Trinity Basin IV, only two penetrom-eter deployments were made and the data are inconclusive.
IntroductionThe objective of this report is to present in situ pressure and tem-perature data measured using downhole pressure penetrometersduring Integrated Ocean Drilling Program (IODP) Expedition 308(see the “Expedition 308 summary” chapter). These data havealso been presented and interpreted in Long et al. (2007a) (see the“DOWNHOLE” folder in “Supplementary material”). Pressureand temperature data are critical for constraining fluid flow, heatflow, and hydraulic and thermal diffusivity. In addition, tempera-ture affects sediment diagenesis and microbial activity. Expedi-tion 308 is dedicated to the study of overpressure and fluid flowon the Gulf of Mexico continental slope. Knowledge of the porepressure, and stress regime in general, is critical for evaluatingsubmarine slope stability. It has been hypothesized that overpres-sure, pore pressures in excess of hydrostatic pressure, can weakenthe strength of sediments and thus cause slope instability nearthe seafloor (Davis et al., 1983; Dugan and Flemings, 2002). Over-pressure and the shallow-water flow frequently cause operationalproblems during drilling (Ostermeier et al., 2001).
doi:10.2204/iodp.proc.308.203.2008

H. Long et al. Data report: penetrometer measurements
Three sites were drilled in Brazos-Trinity Basin IVand three sites were drilled in Ursa Basin during Ex-pedition 308 (Figs. F1, F2, F3). To document the insitu pore pressure and temperature, we deployed twotypes of pressure penetrometers: the temperature/dual pressure probe (T2P) and the Davis-VillingerTemperature-Pressure Probe (DVTPP) (Fig. F4). TheDVTPP was deployed previously during Ocean Drill-ing Program Legs 190, 201, and 204 (D’Hondt, Jør-gensen, Miller, et al., 2003; Long et al., 2007a;Moore, Taira, Klaus, et al., 2001; Tréhu, Bohrmann,Rack, Torres, et al., 2003). The T2P is a new tool un-der development as a cooperative effort betweenPennsylvania State University, Massachusetts Insti-tute of Technology (MIT), and IODP-Texas A&MUniversity (TAMU) (Expedition 308 Scientists, 2005;Flemings et al., 2006; see also the “PHYSPROP”folder in “Supplementary material”).
MethodThe DVTPP and T2P penetrometers interface withthe colleted delivery system (CDS). The CDS is low-ered by wireline and engages with the bottom-holeassembly (BHA). Once the CDS is engaged in theBHA, the drill string is used to push the probe intothe formation. The drill string is then raised 3–4 mand the CDS telescopes to decouple the probe fromthe drill string. The probe remains in the formationto measure pressure and temperature for 30–90 min.After measurement, the wireline pulls the CDS to itsextended position and then pulls the penetrometerout of the formation. A detailed description of thedeployment procedure is presented in “AppendixA.” The data are downloaded from the data acquisi-tion unit when the tool is retrieved.
When the penetrometers penetrate the formation,the temperature (resulting from friction on thetool) and pressure (resulting from deformation ofthe soil) are raised relative to their in situ values.Subsequently, the tools are left in place in order todissipate toward the equilibrium values (Fig. F5).Temperature decay can be used to infer the forma-tion temperature and thermal conductivity (Daviset al., 1997; Villinger and Davis, 1987). Decay of thepenetration-induced pore pressure can be used toinfer formation pressure, hydraulic diffusivity, andpermeability (Baligh and Levadoux, 1986; Guptaand Davidson, 1986; Long et al., 2007a; Whittle etal., 2001).
Rates of pressure and temperature decay are func-tions of the probe diameter and the hydraulic/ther-mal diffusivity of the sediment (Bullard, 1954; Longet al., 2007a; Villinger and Davis, 1987). Pressure de-cay is much slower than temperature decay in low-
Proc. IODP | Volume 308
permeability mudstones (Long et al., 2007a). Becauseof the restricted time available for deployment, wemust interpret in situ pressure from partial dissipa-tion records. If detailed soil properties are available,the in situ pressure and hydraulic diffusivity of thesediment can be inferred from modeling of soil be-havior for different penetrometer geometries. How-ever, in many cases soil properties are not availableor there are insufficient resources to pursue soil mod-eling. In these cases, in situ pressure is inferred fromsimple extrapolation approaches such as inversetime (1/t) extrapolation (Davis et al., 1991; Lim et al.,2006; Long et al., 2007b; Villinger and Davis, 1987;Whittle et al., 2001) and inverse square root of time(1/ ) extrapolation (Long et al., 2007b).
ResultsSites U1319, U1320, and U1321 were drilled in theBrazos-Trinity Basin IV (Figs. F1, F2). Sites U1319and U1320 were cored and penetrometer measure-ments were made. Sites U1322, U1323, and U1324were drilled in the Ursa Basin (Figs. F1, F3). SitesU1322 and U1324 were cored and penetrometermeasurements were made.
We present the temperature and pressure data fromthe penetrometer deployments at the four sites inthis report. In the main text, we present our best es-timate of the in situ temperature and pressure. In“Appendix A,” we describe how the DVTPP was cal-ibrated and present a detailed description of eachDVTPP deployment. In “Appendix B,” we describehow the T2P was calibrated and we describe eachT2P deployment. In “Appendix C,” we present a dis-cussion of the pressure state within the drill pipebased on the DVTPP pressure measurements.
The temperature and pressure data are available inMicrosoft Excel format in the “APP_A” and “APP_B”folders in “Supplementary material.” These datahave been recalibrated and consequently are differ-ent and improved relative to the data discussed inthe Expedition Reports section of this volume. Theoriginal raw data can be found in the “DOWNHOLE”folder in “Supplementary material.” The pene-trometer data are integrated with the rig instrumen-tation system data (“TruView data”) in order to betterunderstand and assess the quality of each measure-ment.
Summary of deploymentsTwenty DVTPP deployments and twenty-eight T2Pdeployments were completed during Expedition 308(Table T1). The deployment number (Table T1) re-flects the deployment sequence of each tool during
t
2

H. Long et al. Data report: penetrometer measurements
Expedition 308 (Expedition 308 Scientists, 2005).Deployments are divided into three types: Type I,Type II, and Type III (Table T1; Fig. F6).
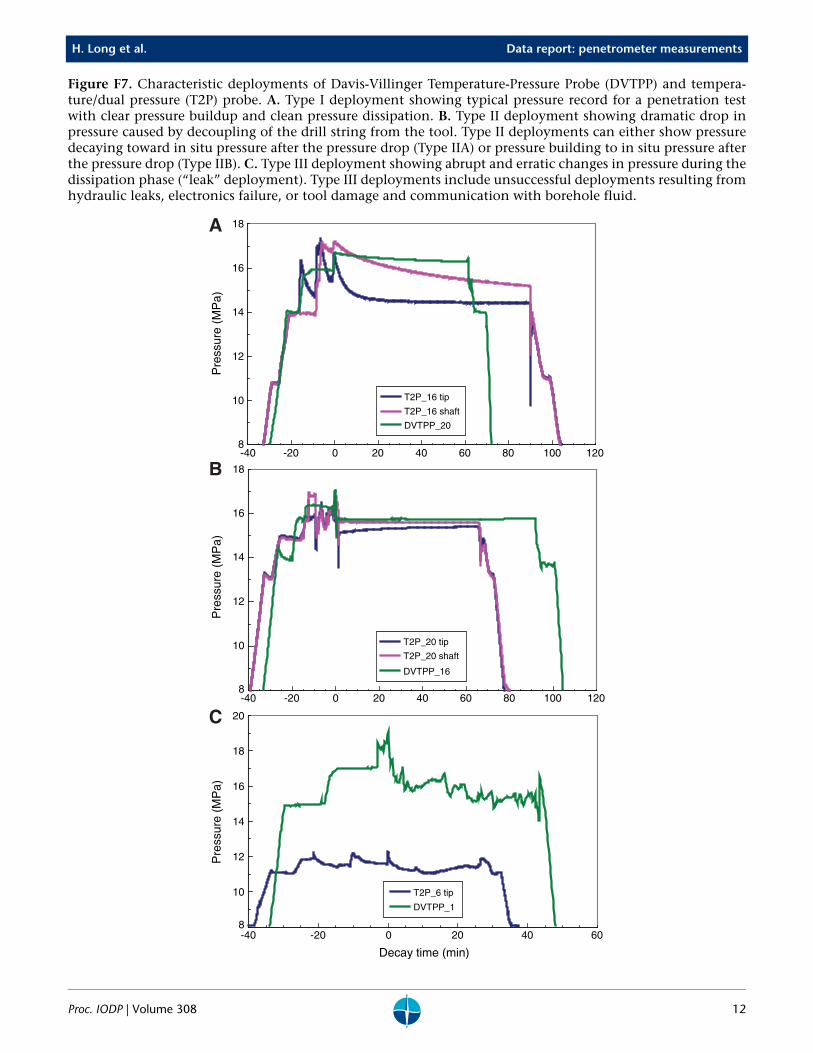
Figure F7A illustrates ideal penetrometer deploy-ments for the DVTPP and the T2P (Type I; Table T1).The tip pressure is at maximum during insertionand, subsequently, pressure declines with time. Atthe end of the deployment, the shaft pressure of theT2P is much greater than that of the tip pressure.This is because the shaft has a much larger diameter.As a result it disturbs a greater region around thepenetrometer and this takes a greater amount oftime to subside to the in situ pressure. A detailedcomparison of the DVTPP and the T2P geometriesand their consequent behavior during insertion anddissipation is presented by Long et al. (2007a).
Figure F7B presents deployments for both theDVTPP and the T2P that were slightly dislodgedwhen the drill string was raised subsequent to pene-tration to decouple itself from the penetrometerthrough the CDS (Types IIA and IIB). In this situa-tion, the tool pressure dropped abruptly when thebit was raised. Analysis of the temperature recordfrom both tools and the accelerometer record fromthe DVTPP shows that coincident with the abruptdrop in pressure there was frictional heating andmovement of the tool (Flemings et al., 2006; Long etal., 2007b). The pressure either decayed toward theformation pressure after it rebounded to a certainlevel (Type IIA; Table T1) or kept building during thedissipation phase (Type IIB; Table T1; Fig. F7B).
Type III includes all the unsuccessful deploymentsthat failed to yield useful information about the insitu conditions. Type III deployment problems arethree-fold. First, in early cases there was an internalhydraulic leak in the DVTPP and the tip pressure ofthe T2P. The leaks resulted in abrupt and erraticdrops in pressure during the dissipation phase (Fig.F7C). Eventually, the internal hydraulic leak wasrepaired. Second, in the worst case the tool dis-lodgement weakened the seal around the probeand created communications with the boreholefluid, ruining the pressure and temperature measure-ments (see “Appendix A,” “Appendix B”). Third,the tool did not record any reliable data because ofelectronic and/or mechanical failure. The latter wasespecially true for the T2P, as it was prone to bendingbecause of its very narrow diameter tip.
During several deployments, the DVTPP was notfully decoupled from the BHA because of friction inthe CDS (in “Appendix A,” see DVTPP Deployments1, 2, 3, 8, 12, and 13). In these cases, the tool movedduring the dissipation phase. Frictional heatingcaused by these tool movements may have compro-mised the temperature measurement. Continuous
Proc. IODP | Volume 308
movement of the tool may also have affected thepressure measurements. In several T2P deployments,circulation of the drilling fluid resumed during thedissipation phase. In these cases, it is often possibleto see a slight pressure and temperature increase atthe onset of circulation. (in “Appendix B,” see T2PDeployments 2, 3, 4, 5, and 12). In some cases, theonset of circulation resulted in further tool insertion(in “Appendix B,” see T2P Deployments 6 and 7).The tool disturbance caused by pumping fluid mayaffect the accuracy of the pressure and temperaturemeasurements.
Data extrapolationDuring Expedition 308, T2P temperatures equili-brated to formation temperatures (see “AppendixB”). In contrast, temperatures measured with theDVTPP did not equilibrate to in situ temperatures(see “Appendix A”). The reason for this is that theDVTPP has a significantly larger geometry. We use in-verse time (1/t) extrapolation to estimate the in situtemperature for the DVTPP deployments (Davis etal., 1997; Villinger and Davis, 1987).
Pressures measured by both the T2P and the DVTPPpenetrometers did not reach in situ pressures duringthe dissipation phase (see “Appendix A,” “Appen-dix B”). In the absence of detailed soil properties, weused two empirical approaches to infer the in situpressure from the partial dissipation records: 1/t ex-trapolation and 1/ extrapolation. Accuracy of theextrapolated in situ pressures depends on the toolthat was used, pressure port, type of deployment,depth of deployment, and the pressure decay time(Long et al., 2007b). Long et al. (2007b) showed that1/t extrapolation more closely matches theoreticalmodeling results than the extrapolation does whenpressure decays <80% of the penetration-inducedpressure. The error of a good (Type I) deploymentwith long dissipation time (e.g., 90 min) should bewithin 0.1 MPa, whereas the error of a deep deploy-ment with short decay time could be more than 0.5MPa.
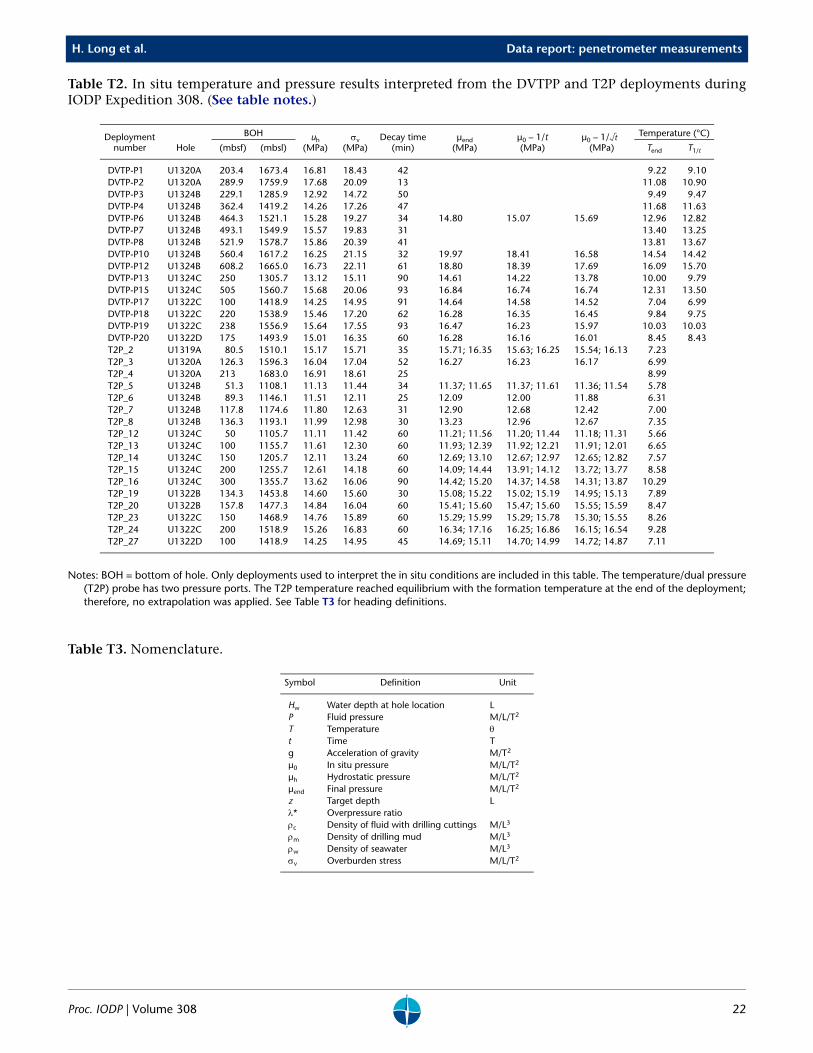
Table T2 presents the interpreted in situ pressure andtemperature for the T2P and the DVTPP deploy-ments during Expedition 308.
In situ temperatureBrazos-Trinity Basin IVFigure F8 presents the in situ temperatures taken atSites U1319 and U1320. The geothermal gradient atSite U1320 is 23.1°C/km. The only measurement atSite U1319 suggests a higher geothermal gradientthan that at Site U1320.
t
3

H. Long et al. Data report: penetrometer measurements
Ursa BasinFigure F9 presents the in situ temperatures taken atSites U1322 and U1324. The geothermal gradient atSite U1324 is bilinear. The thermal gradient is18.6°C/km in the sediments above 360 meters belowseafloor (mbsf), corresponding to lithostratigraphicUnit I, which is predominantly composed of terrige-nous clay and mud with a marked paucity of silt andsand (see the “Site U1324” chapter). The geothermalgradient is 16.7°C/km in lithostratigraphic Unit II,which extends from 360 to 600.8 mbsf and includesinterbedded silt and very fine sand with beds andlaminae of mud and clay (see the “Site U1324”chapter). Sediments are predominantly clay andmud at Site U1322. The geothermal gradient is21.9°C/km, which is significantly higher than that atSite U1324.
In situ pressureWe present our pressure results with respect to hy-drostatic pressure and overburden stress. The hydro-static pressure is calculated starting from the seafloorand assuming a seawater density of 1.024 g/cm3.Bulk density data from shipboard moisture and den-sity (MAD) measurements were integrated to calcu-late the overburden stress. The static pressure of thewater column above seafloor was subtracted fromthe pressure results.
Brazos-Trinity Basin IVWe have only one pressure measurement at SiteU1319. The T2P penetration was completed at 80.5mbsf. The last recorded pressure of the T2P tip equalsthe overburden stress, whereas that of the shaft ex-ceeds the overburden stress. This clearly shows thatpressures had not dissipated to in situ pressure (Fig.F10B). The pressure dissipation time was only 35min for this deployment. The 1/ extrapolation ofthe tip pressure, which should give a better estima-tion of in situ pressure (Long et al., 2007b), suggeststhat the formation pressure is 0.37 MPa higher thanhydrostatic (Fig. F10D). The 1/ extrapolated in situpressure suggests that the formation pressure at 80.5mbsf is 0.37 MPa higher than the hydrostatic pres-sure (Fig. F10D). The shaft pressure was still higherthan the overburden stress after 1/t and 1/ extrapo-lation (Fig. F10C, F10D).
We made two T2P and two DVTPP deployments atSite U1320, but only one deployment can be used toestimate the in situ pressure. The last recorded pres-sure was slightly greater than the hydrostatic pres-sure (Fig. F11B). The estimated in situ pressure byboth 1/t and 1/ extrapolation suggests that forma-
t
t
t
t
Proc. IODP | Volume 308
tion pressure at 126.3 mbsf is close to hydrostaticpressure (Fig. F11C, F11D).
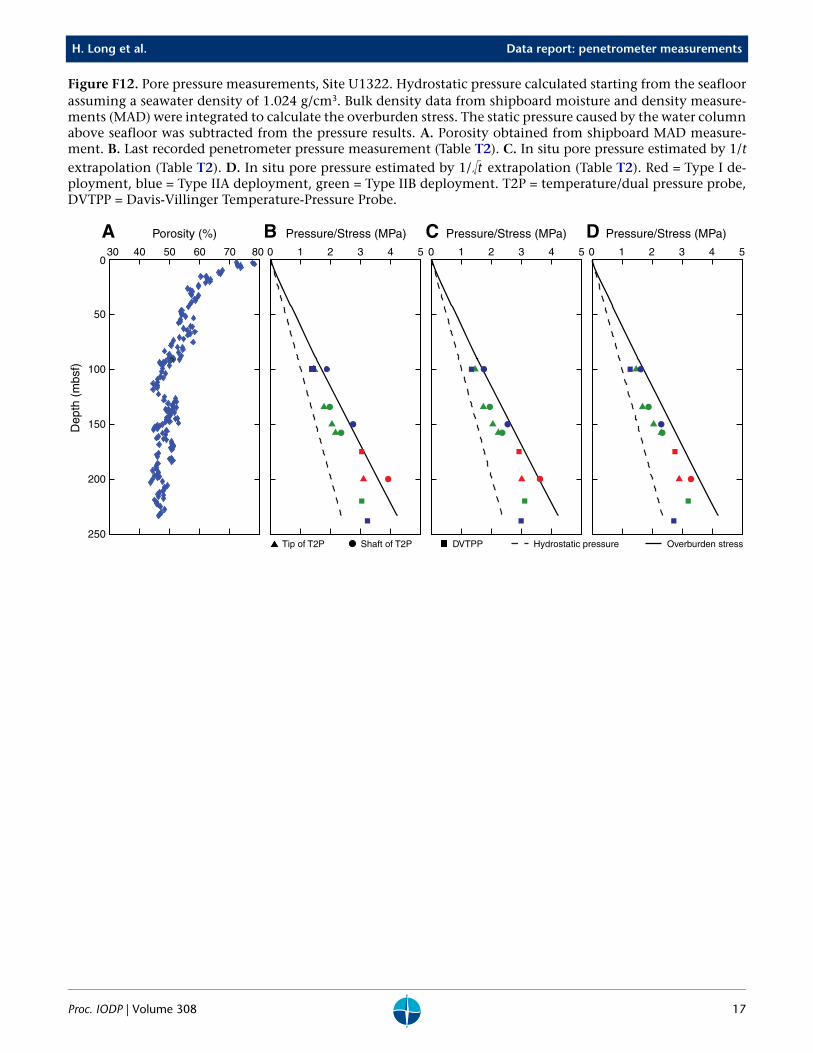
Ursa BasinFigure F12 presents the pore pressure measurementsat Site U1322, where sediments are predominantlyclay and mud. The last recorded pressures are scat-tered, with some of them equal to or exceeding theoverburden stress (σv) (Fig. F12B). This indicates thatpressures had not dissipated to the in situ pressure atthe end of the deployments.
The 1/t extrapolation predicts consistently higherpressure at the shaft sensor of the T2P than that atthe tip sensor (Fig. F12C). Some shaft pressures arestill equal to or even higher than the overburdenstress (Fig. F12C). These indicate that 1/t extrapola-tion of the shaft pressure overestimates the in situpressure, consistent with theoretical modeling pre-sented by Long et al. (2007b).
Application of 1/ extrapolation drives the shaftpressure closer to the tip pressure (Fig. F12D). The re-sults make more physical sense because ultimatelythe shaft pressure and tip pressure converge at the insitu pressure. We believe the 1/ extrapolation pro-vides more accurate in situ pressure estimate thanthe 1/t extrapolation does for the shaft pressure.
Nevertheless, both extrapolation approaches predictsignificant overpressure and similar trends. The over-pressure ratio (λ* = [u0 – uh]/[σv – uh]) is as high as0.75. Overpressure starts to drop from ~200 mbsf.
Figure F13 presents the pore pressure measurementsat Site U1324. Both extrapolation approaches predictsignificant overpressure in the sediments above ~200mbsf (Fig. F13C, F13D) that correspond to hemipe-lagic silty claystone. Within this section, the magni-tude and trend of the overpressure are similar tothose at Site U1322 (Fig. F14). The sediments below300 mbsf have less overpressure (Fig. F13). The over-pressure seems to be constant within lithostrati-graphic Unit II, in which sediments are composed ofsilty claystone interbedded with beds of silt and veryfine sand. The transition occurs at the section from200 to 300 mbsf.
AcknowledgmentsWe thank the participants of Expedition 308 thatmade the deployment of the T2P possible. We alsothank Derryl Schroeder and Mike Meiring for theirhelp and assistance on the postcruise T2P pressurecalibration. Kevin Grigar is thanked for helpful dis-cussion on the geometry and operation of the CDSand the BHA.
t
t
4

H. Long et al. Data report: penetrometer measurements
This research used samples and/or data provided bythe Integrated Ocean Drilling Program (IODP). Fund-ing for this research was provided by a SchlangerOcean Drilling Fellowship, which is part of the U.S.National Science Foundation-sponsored U.S. ScienceSupport Program for IODP (USSSP-IODP). In addi-tion, the Pennsylvania State GeoFluids Consortiumsupported this research.
ReferencesBaligh, M.M., and Levadoux, J.-N., 1986. Consolidation
after undrained piezocone penetration, II. Interpreta-tion. J. Geotech. Eng., 112(7):727–745.
Bullard, E.C., 1954. The flow of heat through the floor of the Atlantic Ocean. In Bullard, E.C., A Discussion on the Floor of the Atlantic Ocean. Proc. R. Soc. London, Ser. A, 222(1150):408–429.
D’Hondt, S.L., Jørgensen, B.B., Miller, D.J., et al., 2003. Proc. ODP, Init. Repts., 201: College Station, TX (Ocean Drilling Program). doi:10.2973/odp.proc.ir.201.2003
Davis, D., Suppe, J., and Dahlen, F.A., 1983. Mechanics of fold-and-thrust belts and accretionary wedges. J. Geo-phys. Res., 88(B2):1153–1172. doi:10.1029/JB088iB02p01153
Davis, E.E., Villinger, H., MacDonald, R.D., Meldrum, R.D., and Grigel, J., 1997. A robust rapid-response probe for measuring bottom-hole temperatures in deep-ocean boreholes. Mar. Geophys. Res., 19(3):267–281. doi:10.1023/A:1004292930361
Davis, E.E., Horel, G.C., Macdonald, R.D., Villinger, H., Bennett, R.H., and Li, H., 1991. Pore pressures and per-meabilities measured in marine sediments with a teth-ered probe. J. Geophys. Res., 96(B4):5975–5984. doi:10.1029/91JB00220
Dugan, B., and Flemings, P.B., 2002. Fluid flow and stabil-ity of the US continental slope offshore New Jersey from the Pleistocene to the present. Geofluids, 2(2):137–146. doi:10.1046/j.1468-8123.2002.00032.x
Expedition 308 Scientists, 2005. Overpressure and fluid flow processes in the deepwater Gulf of Mexico: slope stability, seeps, and shallow-water flow. IODP Prel. Rept., 208. doi:10.2204/iodp.pr.308.2005
Flemings, P.B., Germaine, J., Long, H., Dugan, B., Sawyer, D., Behrmann, J.H., and John, C., 2006. Measuring tem-perature and pressure with the temperature two pres-sure (T2P) probe in the Ursa Basin, Gulf of Mexico: development of a new pressure and temperature probe for the IODP (Paper OTC 17957). Proc.—Annu. Offshore Technol. Conf. http://www.otcnet.org/2006/tech_prog/sched/documents/otc179571.pdf
Proc. IODP | Volume 308
Graber, K.K., Pollard, E., Jonasson, B., and Schulte, E. (Eds.), 2002. Overview of Ocean Drilling Program engi-neering tools and hardware. ODP Tech. Note, 31. doi:10.2973/odp.tn.31.2002
Gupta, R.C., and Davidson, J.L., 1986. Piezoprobe deter-mined coefficient of consolidation. Soils Found., 26:12-22.
Lim, B.S., Tumay, M.T., and Seo, D.D., 2006. Status of con-solidation from incomplete piezocone dissipat tests. In Puppala, A.J., Fratta, D., Alshibli, K., Pamukcu, S. (Eds.), Site and Geomaterial Characterization (GSP 149). Proc. Sess. GeoShanghai, 149:7. (Abstract)
Long, H., Flemings, P.B., and Germaine, J.T., 2007a. Inter-preting in situ pressure and hydraulic properties with borehole penetrometers in ocean drilling: DVTPP and piezoprobe deployments at southern Hydrate Ridge, off-shore Oregon. J. Geophys. Res., 112(B4):B04101. doi:10.1029/2005JB004165
Long, H., Flemings, P.B., Germaine, J., Dugan, B., and Saw-yer, D., 2007b. In-situ pore pressure at IODP Site U1324, Ursa Basin, Gulf of Mexico (Paper OTC 18772). Proc.—Annu. Offshore Technol. Conf. http://www.otcnet.org/2007/technical/schedule/documents/otc187721.pdf
Mikada, H., Moore, G.F., Taira, A., Becker, K., Moore, J.C., and Klaus, A. (Eds.), 2005. Proc. ODP, Sci. Results, 190/196: College Station, TX (Ocean Drilling Program). doi:10.2973/odp.proc.sr.190196.2005
Ostermeier, R.M., Pelletier, J.H., Winker, C.D., and Nichol-son, J.W., 2001. Trends in shallow sediment pore pres-sures. Proc.—SPE/IADC Drill. Conf., 1–11.
Sawyer, D.E., Flemings, P., and Dugan, B., 2007. Lateral variations in core, log, and seismic attributes of a mass transport complex in the Ursa Region, IODP Expedition 308, Northern Gulf of Mexico (Paper OTC 19098). Proc.—Annu. Offshore Technol. Conf. http://www.otc-net.org/2007/technical/schedule/documents/otc190981.pdf
Tréhu, A.M., Bohrmann, G., Rack, F.R., Torres, M.E., et al., 2003. Proc. ODP, Init. Repts., 204: College Station, TX (Ocean Drilling Program). doi:10.2973/odp.proc.ir.204.2003
Villinger, H., and Davis, E.E., 1987. A new reduction algo-rithm for marine heat flow measurements. J. Geophys. Res., 92(B12):12846–12856. doi:10.1029/JB092iB12p12846
Whittle, A.J., Sutabutr, T., Germaine, J.T., and Varney, A., 2001. Prediction and interpretation of pore pressure dis-sipation for a tapered piezoprobe. Geotechnique, 51(7):601–617. doi:10.1680/geot.51.7.601.51388
Initial receipt: 15 June 2007Acceptance: 16 April 2008Web publication: 29 October 2008MS 308-203
5

H. Long et al. Data report: penetrometer measurements
Figure F1. Bathymetric map of study areas.
Brazos-Trinity Region
Ursa Region
Dep
th (
m)
26°
28°
30°N
95°W 93° 91° 89° 87°
0
-4000
-3000
-2000
-1000
1000
2000
3000
4000
km
50 1000
Proc. IODP | Volume 308 6

H. Long et al. Data report: penetrometer measurements
Figure F2. Seismic cross section of Brazos-Trinity Basin IV showing locations of Sites U1319, U1320, and U1321.SF = seafloor.
5 km
Two-
way
trav
eltim
e (m
s)
2.0
2.2
2.4
SW NE
R60
R50
R30
R40
R10
SF
R20
SiteU1319
SiteU1321
SiteU1320
1.8
1.6
Dip Line 3020
Proc. IODP | Volume 308 7
H. Long et al. Data report: penetrometer measurements
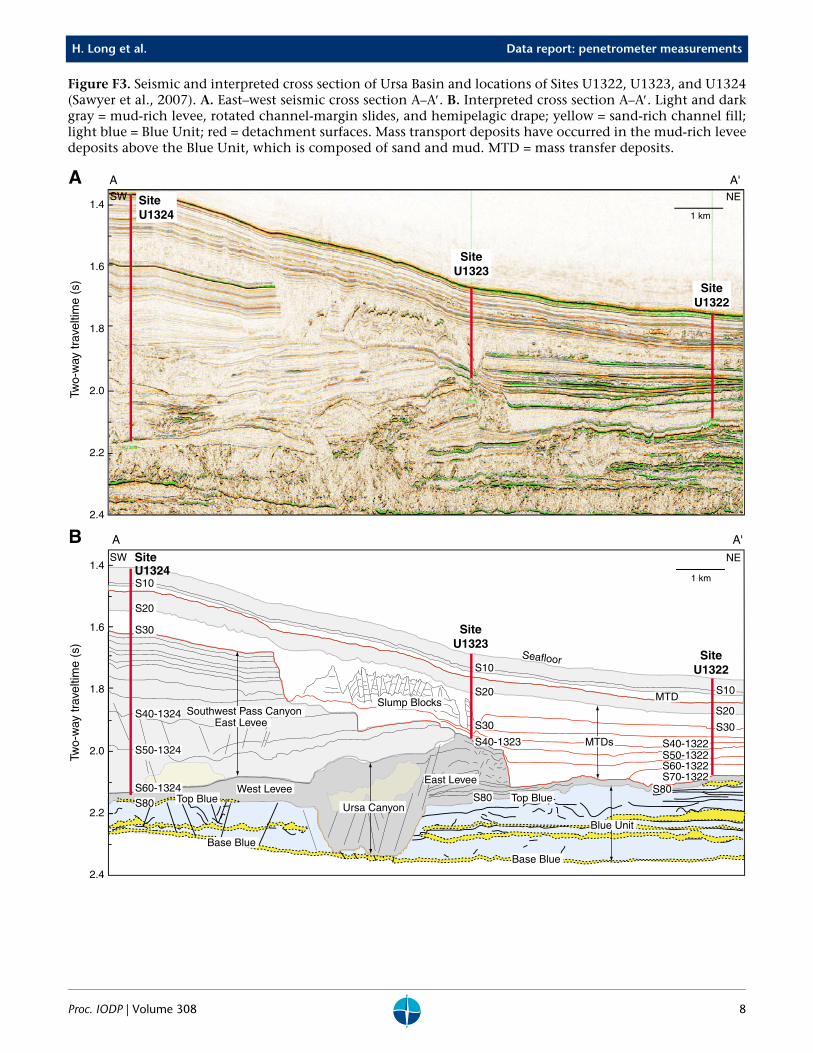
Figure F3. Seismic and interpreted cross section of Ursa Basin and locations of Sites U1322, U1323, and U1324(Sawyer et al., 2007). A. East–west seismic cross section A–A′. B. Interpreted cross section A–A′. Light and darkgray = mud-rich levee, rotated channel-margin slides, and hemipelagic drape; yellow = sand-rich channel fill;light blue = Blue Unit; red = detachment surfaces. Mass transport deposits have occurred in the mud-rich leveedeposits above the Blue Unit, which is composed of sand and mud. MTD = mass transfer deposits.
SW NE
Top Blue
Seafloor
Slump Blocks
SW NE
Two-
way
trav
eltim
e (s
)
2.0
1.6
2.2
1.8
2.4
1.4
West Levee
1 km
Two-
way
trav
eltim
e (s
)
2.0
1.6
2.2
1.8
2.4
1.4
S20
S20
S20
S30
S30 S30S40-1324
S40-1322
S80Top Blue
Base Blue
Base Blue
East LeveeS80
S80
S50-1324
S60-1324
S40-1323S50-1322S60-1322S70-1322
Blue Unit
MTDs
Ursa Canyon
Southwest Pass CanyonEast Levee
SiteU1322
SiteU1323
SiteU1324
S10
S10
S10
1 km
A A'
A A'
MTD
A
B
SiteU1322
SiteU1323
SiteU1324
Proc. IODP | Volume 308 8

H. Long et al. Data report: penetrometer measurements
Figure F4. Davis-Villinger Temperature-Pressure Probe (DVTPP) and temperature/dual pressure (T2P) probepenetrometers.
T2P
DVTPP
2R = 55.5 mm590
1100
23.60
100
Thermistor
Pressureport
DVTPP
2Rtip = 8 mm
2R2 = 35.6 mm
223
013.7
2R1 = 6 mm
182
Pressure port
T2P
2R3 = 6 or 9 mm
Pressure port
Thermistor
mm
mm
Proc. IODP | Volume 308 9

H. Long et al. Data report: penetrometer measurements
Figure F5. Procedure for probe penetration. Drill string pushes the probe into the formation. After penetration,the drill string is raised and the colleted delivery system telescopes to decouple the drill string from the tool.The probe stays in the formation to monitor the temperature and pressure. A good measurement is indicatedby an abrupt increase in pressure and temperature during penetration and then a slow dissipation of pressureand temperature as the tool stays in the formation.
Time
Pre
ssur
e/Te
mpe
ratu
re
Dissipation
Pre-penetration
Penetration Drill string raisedPressure dissipation
In situ pressure
Dissipation
Pen
etra
tion
In situ temperature
Proc. IODP | Volume 308 10

H. Long et al. Data report: penetrometer measurements
Figure F6. Summary of temperature/dual pressure (T2P) probe and Davis-Villinger Temperature-Pressure Probe(DVTPP) deployments during Expedition 308. Type I, II, and III deployments are defined in Figure F7. Type Iand II deployments can give insight into in situ conditions. Type III deployments do not provide useful infor-mation about in situ conditions.
I21%
II35%
III44%
I10%II
30%
III60%
T2P DVTPP
Type I: ideal penetrometer deploymentType II: penetrometer slightly dislodged during deploymentType III: unsuccessful deployment
Proc. IODP | Volume 308 11
H. Long et al. Data report: penetrometer measurements
Figure F7. Characteristic deployments of Davis-Villinger Temperature-Pressure Probe (DVTPP) and tempera-ture/dual pressure (T2P) probe. A. Type I deployment showing typical pressure record for a penetration testwith clear pressure buildup and clean pressure dissipation. B. Type II deployment showing dramatic drop inpressure caused by decoupling of the drill string from the tool. Type II deployments can either show pressuredecaying toward in situ pressure after the pressure drop (Type IIA) or pressure building to in situ pressure afterthe pressure drop (Type IIB). C. Type III deployment showing abrupt and erratic changes in pressure during thedissipation phase (“leak” deployment). Type III deployments include unsuccessful deployments resulting fromhydraulic leaks, electronics failure, or tool damage and communication with borehole fluid.
8
10
12
14
16
18
-40 -20 0 20 40 60 80 100 120
Pre
ssur
e (M
Pa)
8
10
12
14
16
18
-40 -20 0 20 40 60 80 100 120
Pre
ssur
e (M
Pa)
8
10
12
14
16
18
20
-40 -20 0 20 40 60
Pre
ssur
e (M
Pa)
T2P_16 tip
T2P_16 shaft
DVTPP_20
T2P_20 tip
T2P_20 shaft
DVTPP_16
T2P_6 tip
DVTPP_1
A
B
C
Proc. IODP | Volume 308 12
Decay time (min)

H. Long et al. Data report: penetrometer measurements
Figure F8. In situ temperature in Brazos-Trinity Basin IV, Sites U1319 and U1320. Temperature/dual pressure(T2P) probe temperature reached equilibrium with the formation temperature at the end of the deployment(Table T2). Davis-Villinger Temperature-Pressure Probe (DVTPP) temperature did not equilibrate with the for-mation temperature at the end of the deployment. In situ temperatures were estimated using 1/t extrapolation(Table T2). Red = temperature measurements subjected to influence of tool movements during dissipationphase.
0
50
100
150
200
250
300
350
0 2 4 6 8 10 12
Temperature (°C)
Dep
th (
mbs
f)
Site U1319 T2P
Site U1320 T2P
Site U1320 DVTPP
23.1°C/km
Proc. IODP | Volume 308 13

H. Long et al. Data report: penetrometer measurements
Figure F9. Temperature data for Ursa Basin, Sites U1322 and U1324. Temperature/dual pressure (T2P) probetemperature reached equilibrium with the formation temperature at the end of the deployment (Table T2). Davis-Villinger Temperature-Pressure Probe (DVTPP) temperature did not equilibrate with the formation temperatureat the end of the deployment. In situ temperatures were estimated using 1/t extrapolation (Table T2). Red sym-bols = temperature measurements subjected to influence of tool movements during dissipation phase.
0
100
200
300
400
500
600
700
4 6 8 10 12 14 16
Temperature (°C)D
epth
(m
bsf)
Site U1324 T2P
Site U1324 DVTPP
Site U1322 T2P
Site U1322 DVTPP
18.6°C/km
16.7°C/km
21.9°C/km
Proc. IODP | Volume 308 14

H. Long et al. Data report: penetrometer measurements
Figure F10. Pore pressure measurements, Site U1319. Hydrostatic pressure calculated starting from the seafloorassuming a seawater density of 1.024 g/cm3. Bulk density data from shipboard moisture and density (MAD)measurements were integrated to calculate the overburden stress. The static pressure resulting from the watercolumn above seafloor was subtracted from the pressure results. A. Porosity obtained from shipboard MADmeasurement. B. Last recorded penetrometer pressure measurement (Table T2). C. In situ pore pressure estimatedby 1/t extrapolation (Table T2). D. In situ pore pressure estimated by 1/ extrapolation (Table T2). T2P = tem-perature/dual pressure probe.
t
30 40 50 60 70 800
20
40
60
80
100
120
140
160
0 1 2 3 0 1 2 30 1 2 3
Dep
th (
mbs
f)
Pressure/Stress (MPa)Porosity (%) Pressure/Stress (MPa) Pressure/Stress (MPa)
Tip of T2P (Type I) Shaft of T2P (Type I) Hydrostatic pressure Overburden stress
A B C D
Proc. IODP | Volume 308 15

H. Long et al. Data report: penetrometer measurements
Figure F11. Pore pressure measurements, Site U1320. Hydrostatic pressure calculated starting from the seafloorassuming a seawater density of 1.024 g/cm3. Bulk density data from shipboard moisture and density (MAD)measurements were integrated to calculate the overburden stress. The static pressure caused by the water col-umn above seafloor was subtracted from the pressure results. A. Porosity obtained from shipboard MAD mea-surement. B. Last recorded penetrometer pressure measurement (Table T2). C. In situ pore pressure estimatedby 1/t extrapolation (Table T2). D. In situ pore pressure estimated by 1/ extrapolation (Table T2). T2P = tem-perature/dual pressure probe.
t
0 2 4 6 0 2 4 60 2 4 6
Dep
th (
mbs
f)
Pressure/Stress (MPa)Porosity (%) Pressure/Stress (MPa) Pressure/Stress (MPa)
30 40 50 60 70 800
50
100
150
200
250
300Tip of T2P (Type IIA) Hydrostatic pressure Overburden stress
A B C D
Proc. IODP | Volume 308 16
H. Long et al. Data report: penetrometer measurements
Figure F12. Pore pressure measurements, Site U1322. Hydrostatic pressure calculated starting from the seafloorassuming a seawater density of 1.024 g/cm3. Bulk density data from shipboard moisture and density measure-ments (MAD) were integrated to calculate the overburden stress. The static pressure caused by the water columnabove seafloor was subtracted from the pressure results. A. Porosity obtained from shipboard MAD measure-ment. B. Last recorded penetrometer pressure measurement (Table T2). C. In situ pore pressure estimated by 1/textrapolation (Table T2). D. In situ pore pressure estimated by 1/ extrapolation (Table T2). Red = Type I de-ployment, blue = Type IIA deployment, green = Type IIB deployment. T2P = temperature/dual pressure probe,DVTPP = Davis-Villinger Temperature-Pressure Probe.
t
0 1 2 3 4 5 0 1 2 3 4 5 0 1 2 3 4 5
Dep
th (
mbs
f)
Pressure/Stress (MPa)Porosity (%) Pressure/Stress (MPa) Pressure/Stress (MPa)
30 40 50 60 70 800
50
100
150
200
250DVTPPTip of T2P Shaft of T2P Hydrostatic pressure Overburden stress
A B C D
Proc. IODP | Volume 308 17

H. Long et al. Data report: penetrometer measurements
Figure F13. Pore pressure measurements, Site U1324. Hydrostatic pressure calculated starting from the seafloorassuming a seawater density of 1.024 g/cm3. Bulk density data from shipboard moisture and density measure-ments (MAD) were integrated to calculate the overburden stress. The static pressure caused by the water columnabove seafloor was subtracted from the pressure results. A. Porosity obtained from shipboard MAD measure-ment. B. Last recorded penetrometer pressure measurement (Table T2). C. In situ pore pressure estimated by 1/textrapolation (Table T2). D. In situ pore pressure estimated by 1/ extrapolation (Table T2). Red = Type I de-ployment, blue = Type IIA deployment, green = Type IIB deployment. T2P = temperature/dual pressure probe,DVTPP = Davis-Villinger Temperature-Pressure Probe.
t
0 5 10 0 5 10 0 5 10
Dep
th (
mbs
f)
Pressure/Stress (MPa)Porosity (%) Pressure/Stress (MPa) Pressure/Stress (MPa)
30 40 50 60 70 800
100
200
300
400
500
600
DVTPPTip of T2P Shaft of T2P Hydrostatic pressure Overburden stress
A B C D
Proc. IODP | Volume 308 18

H. Long et al. Data report: penetrometer measurements
Figure F14. In situ pressure estimates by 1/ extrapolation in the upper 250 mbsf at Sites U1322 and U1324.The hydrostatic pressure is calculated starting from the seafloor assuming a seawater density of 1.024 g/cm3.Bulk density data from shipboard moisture and density measurements were integrated to calculate the over-burden stress. The static pressure caused by the water column above seafloor was subtracted from the pressureresults. T2P = temperature/dual pressure probe, DVTPP = Davis-Villinger Temperature-Pressure Probe.
t
0 1 2 3 4 5
Dep
th (
mbs
f)
Pressure/Stress (MPa)
0
50
100
150
200
250DVTPPTip of T2P Shaft of T2P
Hydrostatic pressure Overburden stress
Site U1322
0 1 2 3 4 5
Pressure/Stress (MPa)
Site U1324
Proc. IODP | Volume 308 19

H. Lo
ng
et al.D
ata repo
rt: pen
etrom
eter measurem
ents
Proc. IOD
P | Volume 308
20
ntinued on next page.)
Remarks
c leak; tool vibrating during decayc leak; tool vibrating during decayc leak; tool vibrating during decayc leak; good To data recordedoid; good T
soil?, good Tessure; tool movements during decaying error; no data recorded unusual decay curve le dataoid; tool vibrating during decayating during decayoid; communication with boreholeoid; commination with borehole?; further tool
on during decayoid; commination with boreholeoid; good Toid; good Toid; good Tssure/temperature decay test in water columnen; lost thermistor 3; insignificant pressure/temperature se caused by pumping; shaft had no response; insignificant pressure/rature response caused by pumping by its own weight; slight pressure and temperature se caused by pumpingen; lost thermistor 2; slight pressure increase due to ingnsertion caused by pumping; internal leak at tip nsertion caused by pumping; internal leak at tips not stable; internal leak at tip nication with borehole fluidsmunication with sensors; weird Tessure increase caused by pumpingessure pulses during decay perturbations during decays typical decayecay on both tip and shaft
nication with borehole fluidstonstant pressure during decayonstant shaft pressure during decay card was ajar; no data recorded the electronics; no data recorded data are only available for decay phaseecay on both tip and shaft
nication with borehole fluid
Table T1. Summary of the DVTPP and T2P deployments during IODP Expedition 308. (See table notes.) (Co
Deploymentnumber Hole
File name
TruView data
Decay time (min) Type
Date(2005) Tool
Depth
(mbsf) (mbsl)
DVTP-P1 U1320A 1320a24 203.4 1673.4 LF 42 III 9 Jun 9367; 88587; 0226-3 HydrauliDVTP-P2 U1320A 1320a33 289.9 1759.9 LF 13 III 9 Jun 9367; 88587; 0226-3 HydrauliDVTP-P3 U1324B 1324b27 229.1 1285.9 50 III 22 Jun 9367; 88587; 0226-3 HydrauliDVTP-P4 U1324B 1324b45 362.4 1419.2 No match 47 III 23 Jun 9367; 88587; 0226-3 HydrauliDVTP-P5 U1324B 387.9 1444.7 NA 10 III 23 Jun Failed; nDVTP-P6 U1324B 1324b59 464.3 1521.1 No match 34 IIB 24 Jun 9368; 88579; 0226-2 Pullout/vDVTP-P7 U1324B 1324b62 493.1 1549.9 No match 31 III 24 Jun 9368; 88579; 0226-2 DilatantDVTP-P8 U1324B 1324b64 521.9 1578.7 HF 41 III 24 Jun 9368; 88579; 0226-2 Weird prDVTP-P9 U1324B 541.1 1597.9 30 III 25 Jun ProgramDVTP-P10 U1324B 1324b68 560.4 1617.2 HF 32 IIA 25 Jun 9367; 88587; 0226-3 Good T;DVTP-P11 U1324B 1324b72 589.2 1646.0 HF 45 III 25 Jun 9367; 88587; 0226-3 UnreliabDVTP-P12 U1324B 1324b74 608.2 1665.0 HF 61 IIA 25 Jun 9367; 88587; 0226-3 Pullout/vDVTP-P13 U1324C 1324c05 250 1305.7 HF 90 I 27 Jun 9367; 88587; 0226-3 Tool vibrDVTP-P14 U1324C 1324c07 405 1460.7 HF 94 III 27 Jun 9367; 88587; 0226-3 Pullout/vDVTP-P15 U1324C 1324c08 505 1560.7 HF 93 IIB 28 Jun 9367; 88587; 0226-3 Pullout/v
insertiDVTP-P16 U1322B 1322b19 166.7 1486.2 HF 92 III 29 Jun 9367; 88587; 0226-3 Pullout/vDVTP-P17 U1322C 1322c02 100 1418.9 LF 91 IIA 1 Jul 9368; 88579; 0226-2 Pullout/vDVTP-P18 U1322C 1322c03 220 1538.9 HF 62 IIB 1 Jul 9368; 88579; 0226-2 Pullout/vDVTP-P19 U1322C 1322c04 238 1556.9 HF 93 IIA 1 Jul 9368; 88579; 0226-2 Pullout/vDVTP-P20 U1322D 1322d04 175 1493.9 HF 60 I 2 Jul 9368; 88579; 0226-2 Type preT2P_1 U1319A t2p_1 7 Jun Sn4; S50-73; Z59-72; 0509-3; straight PressureT2P_2 U1319A t2p_2 80.5 1510.1 LF 35 Tip: I; Shaft: I 7 Jun Sn4; S50-73; Z59-72; 0509-3; straight Tip brok
responT2P_3 U1320A t2p_3 126.3 1596.3 LF 52 Tip: IIA; Shaft: III 8 Jun Sn2; S50-75; S50-74; 0509-2; taper Tip bent
tempeT2P_4 U1320A t2p_4 213 1683.0 LF 25 Tip: I; Shaft: III 9 Jun Sn4; S50-73; Z59-72; 0509-6; straight installed
increaT2P_5 U1324B t2p_5 51.3 1108.1 LF 34 Tip: IIA; Shaft: IIA 21 Jun Sn2; S50-75; Y67-16; 0509-2; straight Tip brok
pumpT2P_6 U1324B t2p_6 89.3 1146.1 LF 25 Tip: III; Shaft: I 21 Jun Sn4; S50-73; Z59-72; 0509-6; taper Further iT2P_7 U1324B t2p_7 117.8 1174.6 LF 31 Tip: III; Shaft: I 21 Jun Sn4; S50-73; Z59-72; 0509-6; taper Further iT2P_8 U1324B t2p_8 136.3 1193.1 LF 30 Tip: III; Shaft: IIA 22 Jun Sn4; S50-73; Z59-72; 0509-6; taper Shaft waT2P_9 U1324B t2p_9 368 1424.8 LF 40 Tip: III; Shaft: III 23 Jun Sn2; S50-75; S50-74; 0509-1; taper CommuT2P_10 U1324B t2p_10 394.5 1451.3 30 Tip: III; Shaft: III 23 Jun Sn2; S50-75; S50-74; 0509-1; taper Lost comT2P_11 U1324B t2p_11 593.2 1650.0 Bad data 15 Tip: III; Shaft: III 25 Jun Sn4; S50-73; S50-74; 0509-6; taper Tool testT2P_12 U1324C t2p_12 50 1105.7 LF 60 Tip: IIA; Shaft: IIA 26 Jun Sn4; S50-73; S50-74; 0509-6; taper Slight prT2P_13 U1324C t2p_13 100 1155.7 LF 60 Tip: IIA; Shaft: I 26 Jun Sn4; S50-73; S50-74; 0509-6; taper Slight prT2P_14 U1324C t2p_14 150 1205.7 LF 60 Tip: IIB; Shaft: IIA 26 Jun Sn4; S50-73; S50-74; 0509-6; taper PressureT2P_15 U1324C t2p_15 200 1255.7 LF 60 Tip: IIA; Shaft: I 27 Jun Sn4; S50-73; S50-74; 0509-6; taper Shaft haT2P_16 U1324C t2p_16 300 1355.7 HF 90 Tip: I; Shaft: I 27 Jun Sn2; Z59-72; S50-75; 0509-1; taper Typical dT2P_17 U1322B t2p_17 42 1361.5 HF 60 Tip: III; Shaft: III 28 Jun Sn2; S50-74; S50-73; 0509-1; taper CommuT2P_18 29 Jun Bench teT2P_19 U1322B t2p_19 134.3 1453.8 HF 30 Tip: IIB; Shaft: IIB 29 Jun Sn2; S50-74; S50-73; 0509-1; taper Nearly cT2P_20 U1322B t2p_20 157.8 1477.3 HF 60 Tip: IIB; Shaft: IIB 29 Jun Sn2; S50-75; S50-73; 0509-1; taper Nearly cT2P_21 U1322C t2p_21 50 1368.9 60 Tip: III; Shaft: III 30 Jun Sn4; S50-72; S50-75; 0509-4; taper MemoryT2P_22 U1322C t2p_22 75 1393.9 60 Tip: III; Shaft: III 30 Jun Sn2; S50-74; S50-73; 0509-1; taper FloodedT2P_23 U1322C t2p_23 150 1468.9 HF 60 Tip: IIB; Shaft: IIA 1 Jul Sn4; S50-72; S50-75; 0509-4; taper TruViewT2P_24 U1322C t2p_24 200 1518.9 HF 60 Tip: I; Shaft: I 1 Jul Sn4; S50-72; S50-75; 0509-4; taper Typical dT2P_25 U1322D t2p_25 40 1358.9 N/A 60 Tip: III; Shaft: III 2 Jul Sn4; S50-72; S50-75; 0509-4; taper Commu

H. Lo
ng
et al.D
ata repo
rt: pen
etrom
eter measurem
ents
Proc. IOD
P | Volume 308
21
in period); HF = high frequency data (1 s period), T = temperature. N/A = not available. Sequence of elements in tool column follows logger, tip transducer,geometry. Shaft transducer and geometry are not applicable for DVTPP.
0 1388.9 LF 45 Tip: III; Shaft: III 2 Jul Sn4; S50-72; S50-75; 0509-4; taper Communication with borehole fluid0 1418.9 HF 45 Tip: IIB; Shaft: IIA 2 Jul Sn4; S50-72; S50-75; 0509-4; taper Pullout/void4 1452.9 HF 45 Tip: III; Shaft: III 2 Jul Sn4; S50-72; S50-75; 0509-4; taper Communication with borehole fluid; broken tip; bent drive tube
TruView data
Decay time (min) Type
Date(2005) Tool Remarks
Depth
bsf) (mbsl)
Notes: LF = low frequency data (1 mshaft transducer, thermistor, and
T2P_26 U1322D t2p_26 7T2P_27 U1322D t2p_27 10T2P_28 U1322D t2p_28 13
Deploymentnumber Hole
File name (m
Table T1 (continued).
H. Long et al. Data report: penetrometer measurements
Table T2. In situ temperature and pressure results interpreted from the DVTPP and T2P deployments duringIODP Expedition 308. (See table notes.)
Notes: BOH = bottom of hole. Only deployments used to interpret the in situ conditions are included in this table. The temperature/dual pressure(T2P) probe has two pressure ports. The T2P temperature reached equilibrium with the formation temperature at the end of the deployment;therefore, no extrapolation was applied. See Table T3 for heading definitions.
Table T3. Nomenclature.
Deploymentnumber Hole
BOH uh(MPa)
σv (MPa)
Decay time (min)
µend (MPa)
µ0 – 1/t(MPa)
µ0 – 1/ (MPa)
Temperature (°C)
(mbsf) (mbsl) Tend T1/t
DVTP-P1 U1320A 203.4 1673.4 16.81 18.43 42 9.22 9.10DVTP-P2 U1320A 289.9 1759.9 17.68 20.09 13 11.08 10.90DVTP-P3 U1324B 229.1 1285.9 12.92 14.72 50 9.49 9.47DVTP-P4 U1324B 362.4 1419.2 14.26 17.26 47 11.68 11.63DVTP-P6 U1324B 464.3 1521.1 15.28 19.27 34 14.80 15.07 15.69 12.96 12.82DVTP-P7 U1324B 493.1 1549.9 15.57 19.83 31 13.40 13.25DVTP-P8 U1324B 521.9 1578.7 15.86 20.39 41 13.81 13.67DVTP-P10 U1324B 560.4 1617.2 16.25 21.15 32 19.97 18.41 16.58 14.54 14.42DVTP-P12 U1324B 608.2 1665.0 16.73 22.11 61 18.80 18.39 17.69 16.09 15.70DVTP-P13 U1324C 250 1305.7 13.12 15.11 90 14.61 14.22 13.78 10.00 9.79DVTP-P15 U1324C 505 1560.7 15.68 20.06 93 16.84 16.74 16.74 12.31 13.50DVTP-P17 U1322C 100 1418.9 14.25 14.95 91 14.64 14.58 14.52 7.04 6.99DVTP-P18 U1322C 220 1538.9 15.46 17.20 62 16.28 16.35 16.45 9.84 9.75DVTP-P19 U1322C 238 1556.9 15.64 17.55 93 16.47 16.23 15.97 10.03 10.03DVTP-P20 U1322D 175 1493.9 15.01 16.35 60 16.28 16.16 16.01 8.45 8.43T2P_2 U1319A 80.5 1510.1 15.17 15.71 35 15.71; 16.35 15.63; 16.25 15.54; 16.13 7.23T2P_3 U1320A 126.3 1596.3 16.04 17.04 52 16.27 16.23 16.17 6.99T2P_4 U1320A 213 1683.0 16.91 18.61 25 8.99T2P_5 U1324B 51.3 1108.1 11.13 11.44 34 11.37; 11.65 11.37; 11.61 11.36; 11.54 5.78T2P_6 U1324B 89.3 1146.1 11.51 12.11 25 12.09 12.00 11.88 6.31T2P_7 U1324B 117.8 1174.6 11.80 12.63 31 12.90 12.68 12.42 7.00T2P_8 U1324B 136.3 1193.1 11.99 12.98 30 13.23 12.96 12.67 7.35T2P_12 U1324C 50 1105.7 11.11 11.42 60 11.21; 11.56 11.20; 11.44 11.18; 11.31 5.66T2P_13 U1324C 100 1155.7 11.61 12.30 60 11.93; 12.39 11.92; 12.21 11.91; 12.01 6.65T2P_14 U1324C 150 1205.7 12.11 13.24 60 12.69; 13.10 12.67; 12.97 12.65; 12.82 7.57T2P_15 U1324C 200 1255.7 12.61 14.18 60 14.09; 14.44 13.91; 14.12 13.72; 13.77 8.58T2P_16 U1324C 300 1355.7 13.62 16.06 90 14.42; 15.20 14.37; 14.58 14.31; 13.87 10.29T2P_19 U1322B 134.3 1453.8 14.60 15.60 30 15.08; 15.22 15.02; 15.19 14.95; 15.13 7.89T2P_20 U1322B 157.8 1477.3 14.84 16.04 60 15.41; 15.60 15.47; 15.60 15.55; 15.59 8.47T2P_23 U1322C 150 1468.9 14.76 15.89 60 15.29; 15.99 15.29; 15.78 15.30; 15.55 8.26T2P_24 U1322C 200 1518.9 15.26 16.83 60 16.34; 17.16 16.25; 16.86 16.15; 16.54 9.28T2P_27 U1322D 100 1418.9 14.25 14.95 45 14.69; 15.11 14.70; 14.99 14.72; 14.87 7.11
Symbol Definition Unit
Hw Water depth at hole location LP Fluid pressure M/L/T2
T Temperature θt Time Tg Acceleration of gravity M/T2
µ0 In situ pressure M/L/T2
µh Hydrostatic pressure M/L/T2
µend Final pressure M/L/T2
z Target depth Lλ* Overpressure ratioρc Density of fluid with drilling cuttings M/L3
ρm Density of drilling mud M/L3
ρw Density of seawater M/L3
σv Overburden stress M/L/T2
t
Proc. IODP | Volume 308 22

H. Long et al. Data report: penetrometer measurements
Appendix ADavis-Villinger Temperature-Pressure ProbeIn Appendix A, we present the DVTPP deploymentsduring Expedition 308, which includes five sections:(1) instruments that were used; (2) temperature cali-bration; (3) pressure calibration; (4) example DVTPPdeployment showing the detailed deploymentprocedure; and (5) detailed description of eachDVTPP deployment. Figures showing pressure,temperature, and TrueView data for each DVTPPdeployment are in the “APP_A” folder in “Supple-mentary material.”
InstrumentsDuring Expedition 308, two data logger/pressuretransducer/thermistor combinations were used: (1)logger 9368-PXDCR 88579-thermistor 0226-2(DVTPP2) and (2) logger 9367-PXDCR 88587-therm-istor 0226-3 (DVTPP3). In the “DOWNHOLE” folderin “Supplementary material,” PXDCR 79481 andthermistor 0226-1 were listed together with logger9367. However, this is not correct.
Temperature calibrationTemperature calibrations were carried out on thedata logger and the thermistor separately. The datalogger response to resistance was determined using ahighly stable resistance box that simulates the resis-tance variation of the thermistor over its full temper-ature range. The calibration coefficients of the datalogger were provided by the U.S. Implementing Or-ganization (USIO) (Table AT1A). Table AT1B presentsthe commercial calibration of the thermistors. TheSteinhart-Hart relationship is used to describe thetemperature as a function of the thermistor resis-tance (Table AT1A) (Davis et al., 1997).
During Expedition 308, the DVTPP temperature datawere not always reduced correctly. For example, theDVTPP3 temperature data was calibrated using thecalibration coefficients of thermistor 0226-1 (see the“DOWNHOLE” folder in “Supplementary mate-rial”). However, thermistor 0226-1 was not used ineither of the DVTPP tools that were deployed duringExpedition 308. This problem was also reported dur-ing IODP Expedition 311 (A.M. Tréhu, pers. comm.,2007). In a similar fashion for DVTPP2, the tempera-ture calibrations of several deployments were doneusing coefficients of thermistor 0226-1 or 0226-3 in-stead of 0226-2 (see the “DOWNHOLE” folder in“Supplementary material”). In this report, we recal-culated the temperature for all deployments usingthe correct calibration coefficients provided by theUSIO (Table AT1).
Proc. IODP | Volume 308
Pressure calibrationThe calibration factors for all pressure transducersare illustrated in Table AT2. The calibration factors ofthe pressure transducers are stored in the central pro-cessing unit of the pressure interface modulemounted to the DVTPP logger. Two frequency (or pe-riod) output signals are sent from the pressure trans-ducer. Pressure is measured with a force-sensitivequartz crystal whose output period changes with ap-plied load. A second period output comes from aquartz crystal temperature sensor used for tempera-ture compensation. The last calibration of the twotransducers was made in 2002 by the manufacturer(Table AT2).
In December 2006, the USIO performed a calibrationverification of the DVTPP pressure transducers usinga deadweight tester that was recently calibrated bythe manufacturer. DVTPP2 and DVTPP3 recordedpressures 7 and 4 psi greater, respectively, than thatmeasured by the deadweight tester. In this report, wesubtracted the average atmosphere pressure recordedby the DVTPP from the pressure data. After the cor-rection, the calibration offsets are excluded and theDVTPP pressure is comparable to the hydrostaticpressure calculated from an assumed seawater den-sity of 1.024 g/cm3 in which the atmosphere pressureis not accounted.
DVTPP deployment procedureEvery DVTPP deployment is slightly different. Wepresent DVTPP Deployment 20 to illustrate ourapproach to interpreting the deployment history.This deployment was at 175 mbsf in Hole U1322D.The operational sequence for this deployment isillustrated in Table AT3, and a graphical representa-tion of the pressure, temperature, coreline depth,block position, accelerometer, pump strokes, core-line tension, and hookload are illustrated inFIGUREA1_1322D04.XLS in the “APP_A” folder in“Supplementary material.” For reasons that we donot understand, some of the bit depth data shiftedduring deployment. Instead, we use the travelingblock position to constrain movements of the drillbit during tool deployment whenever it is available.The traveling block is attached to the top end of thedrill string above the rig floor. Its position was re-corded in meters above rig floor.
Prior to deployment, the BHA was located 5.5 mabove the bottom of the hole (BOH). The DVTPP wasconnected to the CDS and lowered into the boreholewith the wireline (Event 1). The DVTPP was stoppedat the seafloor for 5 min to record the fluid pressureand temperature in the pipe (Event 2). Fluid circula-tion was stopped during the tool stop to remove theeffect of pump pressure on the measured pressure.
23

H. Long et al. Data report: penetrometer measurements
The pump flux is proportional to the pump strokerate (1.654 gal/stroke) (Graber et al., 2002).
The CDS was then lowered by wireline (Event 3). Atthis time, the CDS was fully extended and hanginginside the drill pipe. The BHA was moved downwardto 7 m above BOH (Event 4). As the CDS approachedthe BHA, it was decelerated and slowly lowered tolatch into the BHA. This can be identified by a sharpdecrease in coreline tension (Event 5). For this de-ployment, when fully extended the CDS was 21.84m including the DVTPP probe. When the CDS wasfully retracted, the tip of the DVTPP extended 1.1 mbelow the BHA. This length can vary depending onhow many spacers (92 cm long) are connected to theDVTPP. The CDS was retracted ~2 m when latched in(Event 5).
Next, the BHA was lowered to further retract theCDS stoke (Event 6). The probe was pushed into theformation. This induced increases in pressure andtemperature after the CDS was fully retracted. Theoperator stopped the insertion when the hookloaddropped by ~5,000 lb (Event 7), indicating that theBHA reached BOH or that the formation is too firmfor further penetration. In this case, the probe waspushed ~1.1 m into the formation. Subsequently, theBHA was raised 2.4 m and the CDS was partially ex-tended to decouple the DVTPP from the BHA (Event8).
In this deployment, the tool was left in place for 60min. Tool acceleration was recorded during the de-ployment, which is a measure of tool movementduring the dissipation phase. The tool was then re-covered by wireline (Event 9) and stopped at themudline for 5 min to register the fluid pressure inthe pipe (Event 10).
DVTPP deployments during Expedition 308Deployment 1: Hole U1320A, 203.4 mbsf
Table AT4 and FIGUREA2_1320A24.XLS in the“APP_A” folder in “Supplementary material” pres-ent the sequence of operations and the tool responseto particular events for DVTPP Deployment 1. Fluidcirculation was kept on for the entire deployment.The tool was stopped at the seafloor for 10 min to re-cord the fluid pressure in the pipe. When the probewas pushed into the formation, the temperature andpressure increased. After the penetration pressurepulse, the pressure decreased rapidly and erratically.The last pressure reading was 1 MPa less than the hy-drostatic pressure.
We interpreted that this was caused by an internalhydraulic leak in the DVTPP; when pressure reacheda high value, fluid leaked into the pressure housing,causing a rapid decrease. The pressure then slowly
Proc. IODP | Volume 308
increased and leakage once again occurred. Becauseof the internal leak, no in situ pressure can be ascer-tained. Unfortunately, this internal leak was notidentified and fixed until DVTPP Deployment 4. Thetemperature record appears reasonable. The last tem-perature reading was 10.2°C. However, the acceler-ometer recorded slight tool movement throughoutthe dissipation phase. The tool movements resultedin a very slight oscillation (magnitude < 0.01°C, pe-riod ≈ 50 s) in the temperature record. This suggestsminor coupling (through the CDS) with the BHA.The frictional heat caused by tool movement mayhave affected the temperature measurement.
Deployment 2: Hole U1320A, 289.9 mbsf
Table AT5 and FIGUREA3_1320A33.XLS in the“APP_A” folder in “Supplementary material” pres-ent the sequence of operations and the tool responseto particular events for DVTPP Deployment 1. As theprobe was pushed into the formation, the tempera-ture and pressure increased. The pressure thendecreased rapidly to less than the hydrostatic pres-sure. Once again, an internal leak is interpreted to bepresent; no in situ pressure can be inferred from De-ployment 2. The temperature record was reasonable,and the last temperature reading was 11.08°C. Theaccelerometer recorded tool movements throughoutthe dissipation phase. The frictional heat caused bytool movement may have affected the temperaturemeasurement.
Deployment 3: Hole U1324B, 229.1 mbsf
Table AT6 and FIGUREA4_1324B27.XLS in the“APP_A” folder in “Supplementary material” pres-ent the sequence of operations and the tool responseto particular events for DVTPP Deployment 3. TheTruView data are missing for this deployment. Keydeployment events are derived from the shipboardDVTPP Downhole Tool Data Sheet (see the “DOWN-HOLE” folder in “Supplementary material”) andthe pressure and temperature data.
When the probe was pushed into the formation, thetemperature and pressure increased. After the pene-tration pressure pulse, the pressure decreased rapidlyand erratically. Because of the internal leak, no insitu pressure could be inferred from Deployment 3.The temperature record looks reasonable, and thelast temperature reading was 9.5°C. The accelerome-ter recorded tool movements throughout the dissipa-tion phase. The tool movements resulted in a slightoscillation (magnitude ≈ 0.05°C, period ≈ 1 min) inthe temperature record. This most likely was due tosome coupling between the BHA and the tool. Thefrictional heat caused by tool movement may haveaffected the temperature measurement.
24

H. Long et al. Data report: penetrometer measurements
Deployment 4: Hole U1324B, 362.4 mbsf
Table AT7 and FIGUREA5_1324B45.XLS in the“APP_A” folder in “Supplementary material” pres-ent the sequence of operations and the tool responseto particular events for DVTPP Deployment 4. TheTruView data do not match this deployment. Key de-ployment events are derived from the shipboardDVTPP Downhole Tool Data Sheet (see the “DOWN-HOLE” folder in “Supplementary material”) andthe pressure and temperature data.
As the pressure decay started, the pressure decreasedrapidly and erratically. This was the fourth consecu-tive deployment where erratic pressures were re-corded. After this deployment the tool was inspectedand an internal hydraulic leak was found and fixed.No in situ pressure could be inferred from Deploy-ment 4 because of the leak. The temperature recordwas reasonable, and the last reading was 11.68°C.The temperature record had a very slight oscillation(magnitude ≈ 0.01°C, period ≈ 1 min) during the dis-sipation phase, whereas the accelerometer did not re-cord significant tool acceleration. This indicatessome minor coupling between the BHA and the tool.
Deployment 5: Hole U1324B, 387.9 mbsf
No data were recorded for this deployment.
Deployment 6: Hole U1324B, 464.3 mbsf
Table AT8 and FIGUREA6_1324B59.XLS in the“APP_A” folder in “Supplementary material” pres-ent the sequence of operations and the tool responseto particular events for DVTPP Deployment 6. TheTruView data do not match this deployment. Key de-ployment events are derived from the shipboardDVTPP Downhole Tool Data Sheet (see the “DOWN-HOLE” folder in “Supplementary material”) andthe pressure and temperature data.
As the probe was pushed into the formation, thetemperature and pressure increased (Table AT8).When the BHA was lifted to decouple the BHAthrough the CDS, the pressure decreased dramati-cally to subhydrostatic pressure. A pressure reboundthen occurred. We interpret that the tool was pulledup with the BHA, creating a void around the probetip. As the void equilibrated with the formation, thepressure increased to 14.86 MPa at the end of the de-ployment. This deployment recorded a good temper-ature decay curve. The last temperature reading was12.96°C.
Deployment 7: Hole U1324B, 493.1 mbsf
Table AT9 and FIGUREA7_1324B62.XLS in the“APP_A” folder in “Supplementary material” pres-ent the sequence of operations and the tool response
Proc. IODP | Volume 308
to particular events for DVTPP Deployment 7. TheTruView data do not match this deployment. Key de-ployment events are derived from the onboardDVTPP Downhole Tool Data Sheet (see the “DOWN-HOLE” folder in “Supplementary material”) andthe pressure and temperature profiles.
As the probe was pushed into the formation, thetemperature and pressure increased (Table AT9). Af-ter penetration, the pressure decreased to a value sig-nificantly below hydrostatic pressure and thenslowly rebounded to a final value of 12.72 MPa. Thepressure data may be explained by either a slow toolpullout after penetration or penetration in a dilatantsediment. Core photos show that the sediment atthis location is clayey silt to silt. Probe penetrationcould generate an annular dilation zone around theprobe, which could have significant negative excesspore pressure. The drop to subhydrostatic pressuremay reflect this negative excess pore pressure migrat-ing to the pressure port. The temperature recordlooks very good, and the last temperature readingwas 13.4°C.
Deployment 8: Hole U1324B, 521.9 mbsf
Table AT10 and FIGUREA8_1324B64.XLS in the“APP_A” folder in “Supplementary material” pres-ent the sequence of operations and the tool responseto particular events for DVTPP Deployment 8. Themeasured pore pressure was less than the hydrostaticpressure throughout the deployment, and there wasno record of penetration. As a result, during the nextDVTPP deployment, the DVTPP3 was deployed andthe DVTPP2 was rebuilt.
The temperature record was reasonable. The lasttemperature reading was 13.84°C. However, theDVTPP Downhole Tool Data Sheet (see the “DOWN-HOLE” folder in “Supplementary material”) docu-mented a tool pullout operation 5 min after the endof the penetration. At this time, the BHA moved up-ward 4 m and the hookload increased. The BHA thenmoved upward 2 m and lowered and raised again. Allof this occurred during the dissipation phase. Theraising and lowering of the BHA were recorded by in-creases and decreases in the hookload and the accel-erometer record. The thermistor did not record anysignificant temperature change during those opera-tions. A second pullout occurred 41 min after thepenetration. These observations suggest that the first“pullout” and the following bit movements werewithin the retraction/extension limit of the CDS andthus did not cause significant tool movement.
Deployment 9: Hole U1324B, 541.1 mbsf
A programming error occurred during this deploy-ment and no data were recorded.
25

H. Long et al. Data report: penetrometer measurements
Deployment 10: Hole U1324B, 560.4 mbsf
Table AT11 and FIGUREA9_1324B68.XLS in the“APP_A” folder in “Supplementary material” pres-ent the sequence of operations and the tool responseto particular events for DVTPP Deployment 8. Pres-sure and temperature both increased sharply duringpenetration. When the BHA was lifted to decouplethe BHA, the pressure decreased rapidly by ~1 MPaand then decayed to a value of 20 MPa while the toolwas in the formation. The pressure decayed linearlywith time, which was unusual. Additionally, thepressure did not decrease to atmospheric pressurewhen the DVTPP was raised to the rig floor. In situpressure may not be inferred from this deployment.The temperature decreased to 15.69°C prior to pull-out.
Deployment 11: Hole U1324B, 589.2 mbsf
Table AT12 and FIGUREA10_1324B72.XLS in the“APP_A” folder in “Supplementary material” pres-ent the sequence of operations and the tool responseto particular events for DVTPP Deployment 11. Thetemperature and pressure sensors both recorded un-reliable data during this deployment.
Deployment 12: U1324B, 608.2 mbsf
Deployment 12 was completed at the base of thehole. Table AT13 and FIGUREA11_1324B74.XLS inthe “APP_A” folder in “Supplementary mate-rial”present the sequence of operations and the toolresponse to particular events for this deployment.The pressure increased during penetration and thenquickly declined, followed by a rapid recovery. Thebit movement and acceleration record suggest thatthe quick pressure drop was related to the decou-pling of the tool from the drill string after the inser-tion, and the rapid recovery was due to reset of thetool on its own weight. The pressure then followed adissipation profile to a final pressure of 18.9 MPa.The temperature record continuously decayed to alow value of 17.2°C and then slightly increased to17.34°C. The last temperature reading was 17.15°C.The accelerometer recorded tool movementsthroughout the dissipation phase. We interpret acoupling between the BHA and the tool. The oscillat-ing pressure and the odd temperature record werecaused by tool movements.
Deployment 13: Hole U1324C, 250 mbsf
Table AT14 and FIGUREA12_1324C05.XLS in the“APP_A” folder in “Supplementary material” pres-ent the sequence of operations and the tool responseto particular events for DVTPP Deployment 13. Simi-lar to Deployment 12, this deployment also recordedtool movement during the dissipation phase. No
Proc. IODP | Volume 308
sharp pressure drop was recorded when the drill bitwas raised after insertion. The temperature record in-creased slightly during the dissipation phase, andthe last temperature reading was 11.01°C. This read-ing may not reflect the formation temperature dueto the influence of the tool movement. The pressurealso slightly increased during dissipation and thensubsided to an end value of 14.7 MPa. This pressureincrease may affect the estimate of the formationpressure.
Deployment 14: Hole U1324C, 405 mbsf
Table AT15 and FIGUREA13_1324C07.XLS in the“APP_A” folder in “Supplementary material” pres-ent the sequence of operations and the tool responseto particular events for DVTPP Deployment 14. Thetool insertion generated a relatively small pressurepulse for this depth. The pressure dropped rapidlywhen the drill bit was lifted. The pressure then re-bounded to a final value of 15.82 MPa, which wasvery close to the recorded pressure at BOH prior tothe penetration. The temperature increased whenthe drill bit was lifted and then decreased rapidly toa value close to the borehole fluid temperature. Nearthe end of the deployment, the temperature in-creased to a final value of 11.38°C. The temperatureincrease was most likely due to tool movement,which can be identified on the acceleration data. Weinterpret that tool dislodgement weakened the sealaround the probe and created communication withthe borehole fluid. The sensors recorded the pressureand temperature of the borehole fluids instead of insitu conditions.
Deployment 15: Hole U1324C, 505 mbsf
Table AT16 and FIGUREA14_1324C08.XLS in the“APP_A” folder in “Supplementary material” pres-ent the sequence of operations and the tool responseto particular events for DVTPP Deployment 15. Simi-lar to Deployment 14, the tool insertion generated arelatively small pressure pulse for this depth. Thepressure decreased rapidly when the drill bit waslifted. The pressure then rebounded to a nearly con-stant value. The temperature only slightly decreasedafter penetration and then increased to a high value(higher than its penetration temperature) at the endof the deployment. We interpreted that the tool sur-face temperature was lower than the formation tem-perature during penetration. The tool temperaturehad to increase to equilibrate with the formation.The end temperature was 13.5°C.
Deployment 16: Hole U1322B, 166.7 mbsf
Table AT17 and FIGUREA15_1322B19.XLS in the“APP_A” folder in “Supplementary material” pres-
26

H. Long et al. Data report: penetrometer measurements
ent the sequence of operations and the tool responseto particular events for DVTPP Deployment 16. Thetemperature and pressure increased when the CDSlatched in position. This suggests that the tip wentinto the formation slightly while the CDS was latch-ing in. When the drill bit was lowered to insert thetool, it recorded a second temperature and pressureincrease. Pressure decreased rapidly when the drillbit was lifted. The pressure then quickly reboundedto a near-constant value that was very close to the re-corded pressure at BOH prior to penetration. Theremay have been communication with the boreholefluid. The temperature dropped rapidly and thenslowly increased to 9.06°C. The end temperature of9.06°C was not representative of in situ conditions.
Deployment 17: Hole U1322C, 100 mbsf
Table AT18 and FIGUREA16_1322C02.XLS in the“APP_A” folder in “Supplementary material” pres-ent the sequence of operations and the tool responseto particular events for DVTPP Deployment 17. Thebit depth dramatically shifted during this deploy-ment, and the block position data are not available.The pressure decreased rapidly after the insertionspike and then slowly dissipated to a final value of14.73 MPa. This dissipation curve may be extrapo-lated to estimate in situ pressure. The temperature re-cord had good insertion spike and continuous decaycurve. The last temperature reading was 7.04°C.
Deployment 18: Hole U1322C, 220 mbsf
Table AT19 and FIGUREA17_1322C03.XLS in the“APP_A” folder in “Supplementary material” pres-ent the sequence of operations and the tool responseto particular events for DVTPP Deployment 18. Thepressure increased during penetration and then de-creased abruptly when the drill bit was lifted. Thepressure then rebounded slowly to a final value of16.36 MPa. Modeling of the rebound curve may con-strain the in situ pressure. The temperature recordhad good insertion spike and continuous decaycurve. The temperature decayed to 9.11°C at the endof deployment.
Deployment 19: Hole U1322C, 238 mbsf
Table AT20 and FIGUREA18_1322C04.XLS in the“APP_A” folder in “Supplementary material” pres-ent the sequence of operations and the tool responseto particular events for DVTPP Deployment 19. Thepressure increased during penetration and decreasedabruptly when the bit was picked up off BOH. Pres-sure then slowly dissipated to a final value of 16.55MPa. Extrapolation of the pressure record may pro-vide an estimate of the in situ pressure. The tempera-ture record had good insertion spike and continuous
Proc. IODP | Volume 308
decay curve. The temperature decayed to 10.03°C atthe end of deployment.
Deployment 20: Hole U1322D, 175 mbsf
Table AT3 and FIGUREA1_1322D04.XLS in the“APP_A” folder in “Supplementary material” pres-ent the sequence of operations and the tool responseto particular events for DVTPP Deployment 20. Bothpressure and temperature profiles had good insertionspikes and continuous decay curves. The pressuredissipated to 16.37 MPa and the temperature dissi-pated to 8.68°C at the end of the deployment.Extrapolation of the pressure record will provide esti-mate of the in situ condition.
Appendix BTemperature/dual pressure probe
This appendix presents the T2P deployments madeduring Expedition 308 in four parts: (1) instrumentsused; (2) temperature calibration; (3) pressure cali-bration; and (4) detailed description of each T2P de-ployment. Figures showing pressure, temperature,and TrueView data for each T2P deployment are inthe “APP_B” folder in “Supplementary material.”
InstrumentsDuring Expedition 308, two types of penetrometertips (Fig. F4), two data loggers, six pressure transduc-ers, and five thermistors were used in combinationto form the T2P probes that measured the formationpressure and temperature (Table T1).
Temperature calibrationTemperature calibrations were carried out on thedata logger and thermistor separately. The data log-ger response to resistance was determined using ahighly stable resistance box that simulates the resis-tance variation of the thermistor over its full temper-ature range. The calibration coefficients of the datalogger were provided by the USIO prior to the expe-dition (Table AT21A). Table AT21B presents thecommercial calibration of the thermistors prior tothe cruise. Accuracy of the presented data is ±0.05°Cbetween –40° and 125°C. The Steinhart-Hart rela-tionship is used to describe the temperature as afunction of the thermistor resistance (Table AT21A)(Davis et al., 1997).
Pressure calibrationThe T2P measures pore pressure with steel pressuretransducers. The force on the sensing element due tothe pressure results in a deformation of the sensingelement and a change in the output signal.
27
H. Long et al. Data report: penetrometer measurements
Onboard calibrationFive out of six pressure transducers were calibratedusing a witness pressure transducer provided by theUSIO and a high-pressure oil pump in the downholetools laboratory on the drillship prior to deploy-ment. We ran the pump pressure from atmosphericpressure to 5000 psi and then stepped down to atmo-spheric pressure. The hysteresis was insignificant(Fig. AF1). The calibration curve is a straight line thatcan be characterized by its slope and its intersectionon the y-axis (Fig. AF1; Table AT22).
Problems in the pressure calibrationAll transducers were flooded with seawater wheneverthe tip of the T2P was broken. The seawater thatleaked into the transducer weakened the insulationof the circuit inside the transducer, and the transduc-ers became unstable, rendering the original pressurecalibrations invalid.
To remove the moisture and stabilize the pressuretransducers on the drill ship, the transducers wereoven-dried at up to 60°C for up to 24 h before reuse.After oven drying, the slope of the calibration curveshowed no significant change, but the intersectionon the y-axis was subject to change (Table AT22). Wedid not recalibrate the transducers each time afterbeing flooded. Therefore, we needed a systematic ap-proach to correct any potential errors related to thechange of the intersection as a result of oven drying.
Furthermore, analysis of pressure data calibrated ac-cording to the onboard calibrations showed that cer-tain transducers were very sensitive to operatingtemperature. As an example, for onboard pressurecalibration of T2P Deployment 1 (a tool test in watercolumn) (see FIGUREB7_T2P_DEPLOY1.XLS in the“APP_B” folder in “Supplementary material”) themeasurements were made at temperatures from 4° to27°C. The tip pressure reading was in good agree-ment with the hydrostatic pressure calculated by as-suming an average fluid density of 1.024 g/cm3. Theshaft pressure reading matched the tip pressureclosely at ~20°C, the temperature at which the trans-ducers were calibrated. However, at significantlycolder temperature, there was discrepancy betweenthe tip and shaft pressures. The discrepancy variedwith water temperature, up to 0.6 MPa at ~5°C. Inthis example, the shaft pressure transducer wasmuch more sensitive to temperature than the tiptransducer.
The “compensated temperature range” of the T2Ppressure transducers is from 25° to 235°C. Out of thisrange, the slope (S) and intersection (I) of the calibra-tion curve are subject to change because of variationin temperature (Fig. AF2). The onboard calibrations
Proc. IODP | Volume 308
were done at the room temperature of the downholetools laboratory on the vessel. These calibrations arenot sufficient to describe the behavior of the trans-ducers over the operating temperature range of thetool. Therefore, the temperature influence on thecalibration curve must be tested to achieve accuratepressure calibration.
Postcruise calibrationTwo pressure transducers were lost during postcruiseshipment between laboratories. We checked the per-formance of the four available transducers before therecalibration. They were not stable and performeddifferently on different channels and data loggers.This was similar to the behavior observed immedi-ately after transducers were flooded on the ship. Weinterpret this as being caused by the salt left in thetransducers when they were flooded during deploy-ments.
To correct for this problem, the transducers werebaked at 55°C in an oven prior to recalibration tostabilize the transducers. Three of the four availabletransducers were very stable after oven drying.
In March 2007, we recalibrated the T2P pressuretransducers using the same deadweight tester thatwas used to verify the calibrations of the DVTPPpressure transducers (see “Appendix A”). Calibra-tions were conducted at controlled temperatures toexplore the influence of temperature on the slopeand intersection of the calibration curve.
We ran the deadweight tester pressure from atmo-spheric pressure to 4015 psi and then stepped downto atmospheric pressure. The hysteresis was insignifi-cant and the calibration curves were straight lines(Fig. AF3). No significant difference was observed be-tween loggers Sn2 and Sn4 or between the tip pres-sure channel and the shaft pressure channel.
The results show that the slope and intersection ofthe calibration curve are linear functions of tempera-ture (Figs. AF4, AF5, AF6). These relationships allowus to confidently interpret the calibration coeffi-cients (slope and intersection of the calibrationcurve) for any given temperature within the range.
Recalibration of the T2P pressure dataWe present the T2P deployment in the water column(T2P 1) to illustrate how we recalibrated the T2Ppressure data using the postcruise calibrations (seeFIGUREB7_T2P_DEPLOY1.XLS in the “APP_B” folderin “Supplementary material”). The two pressuretransducers (S50-73 at the tip and Z59-72 at theshaft) were recalibrated under controlled tempera-tures. We used the temperature measured at the T2Ptip thermistor to determine the calibration coeffi-
28

H. Long et al. Data report: penetrometer measurements
cients from the trendlines in Figures AF4 and AF5.We then applied the calibration coefficients to calcu-late the pressure from the transducer reading.
Neither of the calculated tip and shaft pressuresmatch the hydrostatic pressures at the tool stops. Weinterpret this is caused by changes of the intersectiondue to oven drying (Table AT22). The offset from hy-drostatic pressure is a constant value regardless ofthe operating temperature for both transducers. Thissuggests that the change in the intersection causedby the effects of oven drying is constant for anygiven deployment (e.g., a constant vertical shift ofthe I-T relationship presented in Figs. AF4B, AF5B,and AF6B).
The offset was corrected by matching the tip andshaft pressure records to the hydrostatic pressure attool stops. After this correction, the tip pressurematches the shaft pressure very well. The hydrostaticpressures at tool stops are calculated from an as-sumed seawater density of 1.024 g/cm3 in which theatmosphere pressure is not accounted.
For the three pressure transducers not recalibratedunder controlled temperatures, we applied the cali-bration coefficients obtained from the onboard cali-bration tests (Table AT22). We then compared these tothe pressure data of one of the recalibrated transducers(S50-73, S50-75, and Z59-72). We took the differencebetween the tip and the shaft pressures as a functionof the temperature measured at the probe tip. Thetemperature influence and the shift of the intersection(a constant value) were then compensated by applyingthis function (see FIGUREB15_T2P_DEPLOY8.XLS andFIGUREB22_T2P_DEPLOY16.XLS in the “APP_B”folder in “Supplementary material”).
T2P deployment procedureThe deployment procedure of the T2P is similar tothat of the DVTPP (see “Appendix A”). We integrateTruView data, the shipboard T2P Deployment LogSheet (see the “DOWNHOLE” folder in “Supple-mentary material”), and pressure and temperaturerecords to define operation events and understandfield measurements.
T2P deployments during Expedition 308Deployment 1: Hole 1319A, tool test in water column
Deployment 1, completed in the water column priorto drilling, was the first sea deployment of the T2Pprobe. The deployment was intended to pressure testthe T2P probe, to check the pressure transducer cali-brations, and to confirm that the T2P probe couldsuccessfully pass through the lockable flapper valve(LFV) of the BHA.
Proc. IODP | Volume 308
The time-event log for T2P Deployment 1 is illus-trated in Table AT23, and a graphical representationof the pressure and temperature records is illustratedin FIGUREB7_T2P_DEPLOY1.XLS in the “APP_B”folder in “Supplementary material.” The T2P waslowered until the tip was 511 meters below sea level(mbsl), where a hydrostatic reference was recordedfor 2 min. The tool was then lowered until the tipwas at 1011 mbsl for another 2 min reference. TheT2P probe was then lowered through the LFV. TheT2P probe tip reached a maximum depth of 1387.5mbsl (42.1 m above seafloor), where a 7 min refer-ence was recorded. References were also taken duringretrieval of the T2P probe when the tip was at 1010mbsl and at 511 mbsl. No drilling fluid was circu-lated during the deployment.
The tool test was successful. The tool recorded pres-sure and temperature for the entire deployment andsuccessfully passed through the LFV. The tempera-ture record showed a downhole decrease in tempera-ture to 4.58°C at 1387.5 mbsl.
Deployment 2: Hole U1319A, 80.5 mbsf
Table AT24 and FIGUREB9_T2P_DEPLOY2.XLS inthe “APP_B” folder in “Supplementary material”present the sequence of the operations and the toolresponse to particular events for T2P Deployment 2.Traveling block position data are not available forthis deployment. The bit depth data dramaticallyshifted during this deployment. Drilling fluid circu-lation was stopped when taking the hydrostatic ref-erence, when pushing the probe into the sediment,and for the first 12 min the T2P probe was in the sed-iment. Fluid circulation resumed 12 min after thepenetration at 14 strokes per minute (spm). Corre-sponding to the onset of fluid circulation, both thetip and shaft pressures increased very slightly (<0.01MPa).
The temperature and pressure records increasedwhen the CDS was latching into position (TableAT24). This response suggests the tool entered theformation while positioning the CDS to the retractedposition. When the drill bit was lowered to insert thetool, it recorded a second temperature and pressureincrease. Pressure and temperature records variedduring the penetration process. We believe thesevariations were due to variations of the soil proper-ties. After 35 min in the formation, pressure at thetip was 15.71 MPa, whereas the shaft recorded pres-sure of 16.35 MPa. Extrapolation of the pressurerecords may provide an estimate of the in situ pres-sure. The temperature record provided an in situ for-mation temperature of 7.23°C at the end of the de-ployment.
29

H. Long et al. Data report: penetrometer measurements
When the T2P probe was recovered on the rig floor,the shroud was not covering the tip. The tip of thetool was damaged and the themistor was missing.The drive tube was bent slightly. We interpret thatthe shroud never reseated over the tip during re-trieval of the tool. Damage of the tip was interpretedto result from bending of the tip during penetrationfollowed by a straightening of the tip when the T2Pprobe was pulled through the LFV in the BHA. Mostlikely, the T2P probe and drive tube were damagedbecause the T2P probe did not enter the sedimentvertically. To achieve vertical penetration, future de-ployments occurred with the drill bit <2 m off BOHinstead of 12 m.
Deployment 3: Hole U1320A, 126.3 mbsf
Table AT25 and FIGUREB10_T2P_DEPLOY3.XLS inthe “APP_B” folder in “Supplementary material”present the sequence of the operations and the toolresponse to particular events for T2P Deployment 3.In contrast to Deployment 2, Deployment 3 used thetapered needle probe and was initiated with the drillbit ~1 m off BOH. These modifications were done todecrease the chance for bending or breaking the nee-dle probe. The quality of the bit depth data is poor.The absolute bit depth value is not reliable. To explorethe bit movement during the deployment, the bitdepth data have to be used together with Table AT25.
The T2P probe recorded temperature and pressure atthe tip, whereas the shaft transducer did not recordany data during the deployment. The temperatureand pressure records increased while positioning theCDS to retracted position. When the drill bit waslowered to insert the tool, it recorded a second tem-perature and pressure increase. The tip pressure de-creased abruptly when the drill bit was lifted. Thefluid circulation resumed at 10 spm 5 min after pen-etration. No significant pressure and temperature re-sponses were observed as a result of the onset of fluidcirculation. Pressure dissipation was recorded at thetip until the probe was pulled out of the formation.The last recorded pressure was 16.27 MPa. Extrapola-tion of the pressure records will provide an estimateof the in situ pressure. The temperature decay wascontinuous and provided an in situ formation tem-perature of 6.99°C.
Deployment 4: Hole U1320A, 213.0 mbsf
Table AT26 and FIGUREB11_T2P_DEPLOY4.XLS inthe “APP_B” folder in “Supplementary material”present the sequence of the operations and the toolresponse to particular events for T2P Deployment 4.Deployment 4 used the straight needle probe. Opera-tional procedures were similar to Deployment 3 ex-cept we did not use the drill string to push the T2P
Proc. IODP | Volume 308
into the formation. Instead, we used the weight ofthe tool to push the tool into the formation. The tippressure and temperature recorded spikes duringpenetration by the tool weight, whereas the shaftpressure did not record any penetration response.This indicates that the shaft pressure port did not gointo the formation throughout the deployment.Fluid circulation resumed 6 min after the insertionspike, causing slight increases in both pressure andtemperature. The final tip pressure was 17.19 MPa,the same as the shaft pressure. This suggests that theborehole fluid communicated with the tip pressurebecause of the short penetration distance (<0.25 m).The temperature reached an equilibrium value of8.99°C. The temperature measurement may be sub-ject to the influence of the borehole fluid.
Deployment 5: Hole U1324B, 51.3 mbsf
Table AT27 and FIGUREB12_T2P_DEPLOY5.XLS inthe “APP_B” folder in “Supplementary material”present the sequence of the operations and the toolresponse to particular events for T2P Deployment 5.The bit depth data shift dramatically, whereas the bitmovement directions match the bit movements re-corded in the T2P log sheet. To explore the bit posi-tion during the deployment, the bit depth datashould be used together with Table AT27.
The BHA was positioned 0.5 m off BOH before theCDS latch-in. The temperature and pressure recordsincreased while positioning the CDS to the retractedposition. According to the tool dimensions, the T2Ptip went into the formation by ~0.6 m at the latch-inposition. The drill bit was lowered to 0.25 m off BOHat the end of penetration. The tool only recordedslight temperature and pressure increases due to the0.25 m further insertion. The fluid circulation re-sumed 10 min after the penetration at 9 spm. Corre-sponding to the onset of fluid circulation, both thetip and shaft sensors recorded a slight pressure in-crease (<0.05 MPa). The tip and shaft pressures weregenerally constant during the dissipation phase. Thetip had a final pressure of 11.37 MPa, and the shafthad a final pressure of 11.65 MPa. The temperaturerecord continuously decayed to an equilibrium tem-perature of 5.78°C.
Upon pulling the tool out of the formation, allsensor readings were lost. At the rig floor, it wasnoted that the tip was bent and the thermistor andbottom porous stone were missing from the tool. Webelieved the tool may have been bent duringpenetration and then broken during the pulloutwhen all sensor readings were lost. The pressure andtemperature measurements should be viewed cau-tiously because of the damage incurred during thedeployment.
30

H. Long et al. Data report: penetrometer measurements
Deployment 6: Hole U1324B, 89.3 mbsf
Table AT28 and FIGUREB13_T2P_DEPLOY6.XLS inthe “APP_B” folder in “Supplementary material”present the sequence of the operations and the toolresponse to particular events for T2P Deployment 6.The pressure and temperature records showed threespikes. The first spike occurred when the tool landedin the BHA, the second pulse occurred when the toolwas pushed into the formation, and the third pulseoccurred when circulation began while the tool wasin the sediment. The shaft pressure reading continu-ously dissipated to its end value of 12.09 MPa. Thetip pressure was not smooth and went close to or be-low the hydrostatic pressure after each pulse. We in-terpreted that there was an internal hydraulic leak atthe tip. The temperature record was reasonable afterthe first two pulses, whereas it showed a rapid de-crease after the third pulse. The last temperaturereading was 5.74°C, which was even lower than theborehole fluid temperature (5.98°C) that was re-corded prior to the first spike. We use the tempera-ture data after the second spike to constrain the insitu temperature.
Deployment 7: Hole U1324B, 117.8 mbsf
Table AT29 and FIGUREB14_T2P_DEPLOY7.XLS inthe “APP_B” folder in “Supplementary material”present the sequence of the operations and the toolresponse to particular events for T2P Deployment 7.Similar to Deployment 6, the pressure and tempera-ture records all showed responses to latching of thetool in the BHA, pushing into to the formation, andturning on circulation while in the formation. Theinternal leak at the tip pressure was not identifiedand repaired in Deployment 7. The shaft pressurereading had a continuous dissipation curve to its endvalue of 12.84 MPa after the third spike. The temper-ature record exhibited a type decay curve and pro-vided an in situ temperature of 7.00°C.
Deployment 8: Hole U1324B, 136.3 mbsf
Table AT30 and FIGUREB15_T2P_DEPLOY8.XLS inthe “APP_B” folder in “Supplementary material”present the sequence of the operations and the toolresponse to particular events for T2P Deployment 8.The shaft pressure was not stable during this deploy-ment, with multiple abrupt increases and decreasesin pressure that were not associated with deploy-ment events. The tip pressure and temperature re-cords showed responses to latching of the tool in theBHA, pushing into to the formation, and backing-offthe drill bit after penetration. The hydraulic leak atthe tip pressure resulted in erratic dissipation curve.The temperature decay was smooth and provided anin situ temperature of 7.35°C. The tool was disassem-
Proc. IODP | Volume 308
bled and reassembled after this deployment becauseof the poor pressure readings on both transducers.
Deployment 9: Hole U1324B, 368 mbsf
Table AT31 and FIGUREB16_T2P_DEPLOY9.XLS inthe “APP_B” folder in “Supplementary material”present the sequence of the operations and the toolresponse to particular events for T2P Deployment 9.This deployment recorded large pressure and tem-perature increases with the landing of the tool in theBHA. After a short period of decay, the tool waspulled out of the formation by pulling the wirelineup. The pressure abruptly dropped to the boreholefluid pressure. The temperature increased abruptlyfirst and then decreased to the borehole fluid tem-perature. The pressure and temperature had similarresponses when pushing the tool into the formation.The abrupt pressure decrease was caused by backing-off the drill bit. The pressure and temperaturerecords suggest that the tool was measuring thepressure and temperature of the borehole fluid. Noin situ conditions can be ascertained from thisdeployment.
Deployment 10: Hole U1324B, 394.5 mbsf
The connection between the sensors and the data ac-quisition system had poor contact. This precludedcollection of any data.
Deployment 11: Hole U1324B, 593.2 mbsf
Table AT32 and FIGUREB17_T2P_DEPLOY11.XLS inthe “APP_B” folder in “Supplementary material”present the sequence of the operations and the toolresponse to particular events for T2P Deployment 11.All connections were cleaned and the tool was reas-sembled because of the communication problemduring Deployment 10. Deployment 11 was a test ofthe sensors and data acquisition system and did notinvolve pushing the probe into the sediment. Thecoreline depth and hook load data were not reliableduring this deployment. The tip pressure showed ex-cellent agreement with the shaft pressure. Two pres-sure decreases occurred in the tip pressure. Thesemay have been caused by the tip being partly em-bedded in the sediment, whereas the shaft had notpenetrated the formation. Overall this deploymentconfirmed that the electronic failure had been fixed.
Deployment 12: Hole U1324C, 50 mbsf
Table AT33 and FIGUREB18_T2P_DEPLOY12.XLS inthe “APP_B” folder in “Supplementary material”present the sequence of the operations and the toolresponse to particular events for T2P Deployment 12.The bit depth data had a dramatic shift and was notreliable. To explore the bit movement during the
31
H. Long et al. Data report: penetrometer measurements
deployment, the bit depth data should be used to-gether with Table AT33. The temperature and pres-sure records increased while positioning the CDS tothe retracted position. When the drill bit was low-ered to insert the tool, further temperature andpressure responses were recorded. Pressure and tem-perature records varied during the penetration pro-cess. These variations were due to variations of thesediment properties. The tip and shaft pressures de-creased when the BHA was lifted; however, the mag-nitude of the decreases was small (<0.1 MPa). At thesame time, the thermistor recorded a rapid increasein temperature. Fluid circulation resumed 8 min af-ter the penetration at 10 spm. Corresponding to theonset of fluid circulation, both the tip and shaft pres-sures slightly increased. Then all sensors recorded agradual dissipation. The tip measurement had anend value of 11.21 MPa. The shaft measurement hadan end value of 11.56 MPa. Extrapolation of thepressure records will provide an estimate of the insitu pressure. The temperature decayed to an equilib-rium temperature of 5.66°C.
Deployment 13: Hole U1324C, 100 mbsf
Table AT34 and FIGUREB19_T2P_DEPLOY13.XLS inthe “APP_B” folder in “Supplementary material”present the sequence of the operations and the toolresponse to particular events for T2P Deployment 13.All sensors had significant increases associated withpushing the tool into the sediment. The tip andshaft pressures decreased when the BHA was lifted,whereas the magnitude of the decrease was muchlarger at the tip. As the same time, the thermistor re-corded a small increase in temperature. All sensorsrecorded a gradual dissipation. The tip had an endvalue of 11.93 MPa, and the shaft had an end valueof 12.39 MPa. Extrapolation of the pressure recordswill provide an estimate of the in situ pressure. Thetemperature decayed to an equilibrium temperatureof 6.65°C.
Deployment 14: Hole U1324C, 150 mbsf
Table AT35 and FIGUREB20_T2P_DEPLOY14.XLS inthe “APP_B” folder in “Supplementary material”present the sequence of the operations and the toolresponse to particular events for T2P Deployment 14.Similar to Deployment 13, pressure and temperatureincreased with insertion into the formation, fol-lowed by dissipation curves. All sensors recorded twoperturbations while in the formation that could notbe associated with any deployment event. After thelast perturbation, the shaft pressure continued alonga normal dissipation curve, whereas the tip showed alarger pressure decrease followed by a pressure in-
Proc. IODP | Volume 308
crease. The tip measurement had an end value of12.69 MPa. The shaft measurement had an end valueof 13.10 MPa. The pressure records likely can be usedto evaluate the in situ pressure. The temperature(7.57°C) appeared to be in equilibrium with the for-mation prior to pulling the tool out off BOH.
Deployment 15: Hole U1324C, 200 mbsf
Table AT36 and FIGUREB21_T2P_DEPLOY15.XLS inthe “APP_B” folder in “Supplementary material”present the sequence of the operations and the toolresponse to particular events for T2P Deployment 15.The temperature and pressure records increasedwhile positioning the CDS to the retracted position.When the drill bit was lowered to insert the tool, itrecorded further temperature and pressure responses.The tip and shaft pressures rapidly decreased whenthe BHA was backing-off the BOH. At the same time,the thermistor recorded a rapid increase in tempera-ture. The shaft then continued along a normal dissi-pation curve, whereas the tip showed a pressurerebound followed by a gradual dissipation. The tipmeasurement had an end value of 14.09 MPa. Theshaft measurement had an end value of 14.44 MPa.The pressure records can be used to evaluate the insitu pressure. The temperature decayed to an equilib-rium temperature of 8.58°C.
All sensors lost communication with the data acqui-sition unit during retrieval of the tool from the for-mation. When the tool reached the rig floor, the tipwas bent and the drive tube was loose. The loosedrive tube most likely caused the failure to recorddata during the retrieval as the sensor cables wererouted through the drive tube where they were con-nected with the data acquisition unit.
Deployment 16: Hole U1324C, 300 mbsf
Table AT37 and FIGUREB22_T2P_DEPLOY16.XLS inthe “APP_B” folder in “Supplementary material”present the sequence of the operations and the toolresponse to particular events for T2P Deployment 16.The temperature and tip pressure records increasedwhile positioning the CDS to the retracted position.When the drill bit was lowered to insert the tool, itrecorded further temperature and pressure responses.Pressure and temperature records varied during thepenetration process. These variations were due tovariations of the soil properties and penetration rate.The pressure and temperature sensors recorded con-tinuous dissipation curves. The end temperature of10.29°C was equilibrated with the formation. Theend shaft pressure was 15.2 MPa, and the end tippressure was 14.42 MPa. Extrapolation of the pres-
32

H. Long et al. Data report: penetrometer measurements
sure records will provide an estimate of the in situpressure.
Deployment 17: Hole U1322B, 42 mbsf
Table AT38 and FIGUREB23_T2P_DEPLOY17.XLS inthe “APP_B” folder in “Supplementary material”present the sequence of the operations and the toolresponse to particular events for T2P Deployment 17.When the drill bit was lowered to insert the tool, itrecorded temperature and pressure responses. How-ever, the pressure signals decreased significantlywhen backing-off the drill bit. The pressures wereconstant during the dissipation phase and wereequal to the pressure recorded prior to the tool inser-tion. The temperature record showed a second spikewhen backing-off the drill bit and then decayed to atemperature that was close to the borehole fluid tem-perature. These observations suggest that the toolwas communicating with the borehole fluid. There-fore, this deployment did not provide any constrainton in situ conditions.
Deployment 19: Hole U1322B, 134.3 mbsf
Table AT39 and FIGUREB24_T2P_DEPLOY19.XLS inthe “APP_B” folder in “Supplementary material”present the sequence of the operations and the toolresponse to particular events for T2P Deployment 19.The temperature and pressure records increasedwhile positioning the CDS to the retracted position.When the drill bit was lowered to insert the tool, itrecorded further temperature and pressure responses.Pressure and temperature records varied during thepenetration process. These variations were due tovariations of the sediment properties. The tip andshaft pressures abruptly decreased when the BHAwas backing-off the BOH. At the same time, thethermistor recorded a rapid increase. After this per-turbation, the tip and shaft pressure rapidly re-bounded to nearly constant values. The end shaftpressure was 15.22 MPa, and the end tip pressure was15.08 MPa. The temperature decayed to an equilib-rium temperature of 7.89°C.
Deployment 20: Hole U1322B, 157.8 mbsf
Table AT40 and FIGUREB25_T2P_DEPLOY20.XLS inthe “APP_B” folder in “Supplementary material”present the sequence of the operations and the toolresponse to particular events for T2P Deployment 20.The temperature and pressure records increased dur-ing the first landing attempt with the bit 12 m offBOH, then the tool was pulled back up to reland itwith the bit 3 m off the BOH. Fluids were circulatedduring landing of the tool in the BHA. When thedrill bit was lowered to insert the tool, it recordedfurther temperature and pressure responses. The tip
Proc. IODP | Volume 308
and shaft pressures abruptly decreased when theBHA was backing-off the BOH. At the same time, thethermistor recorded a rapid increase. After this per-turbation, the tip pressure rapidly rebounded to avalue and then slowly built up to an end pressure of15.41 MPa. The shaft pressure rapidly rebounded to anearly constant value of 15.60 MPa. The end pres-sures may provide a rough estimate of the in situpressure. The temperature decayed to an equilibriumtemperature of 8.47°C.
Deployment 21: Hole U1322C, 50 mbsf
A data acquisition error resulted in only 3 min of re-corded data. Inspection of the data acquisition unitafter recovering the probe revealed that the memorycard was dislodged and thus data could not be re-corded. The memory card was replaced, and thequick release button for the card was removed. Thismodification made it harder for the memory card tobe accidentally ejected.
Deployment 22: Hole U1322C, 75 mbsf
This deployment suffered from a hydraulic leak thatflooded the electronics connecting the pressuretransducers and the thermistor to the data acquisi-tion unit. The flooding shorted all circuits; therefore,no pressure and temperature data were recorded. Allelectrical components were cleaned and dried afterthe deployment.
Deployment 23: Hole U1322C, 150 mbsf
Table AT41 and FIGUREB26_T2P_DEPLOY23.XLS inthe “APP_B” folder in “Supplementary material”present the sequence of the operations and the toolresponse to particular events for T2P Deployment 23.TruView data are only available for the dissipationphase. Temperature and pressure signals increasedwith landing of the tool in the BHA and again withpenetration into the formation. The tip pressure de-creased when the bit was pulled up and then slowlyrebounded to a final pressure of 15.29 MPa. Theshaft pressure decreased when the bit was lifted andthen continuously decayed to an end pressure of15.99 MPa. The temperature decayed to an equilib-rium value of 8.26°C.
Deployment 24: Hole U1322C, 200 mbsf
Table AT42 and FIGUREB27_T2P_DEPLOY24.XLS inthe “APP_B” folder in “Supplementary material”present the sequence of the operations and the toolresponse to particular events for T2P Deployment 24.The tip pressure and temperature records increasedwhile positioning the CDS to the retracted position.A second increase recorded by all sensors occurredwhen the tool was pushed into the formation. Pres-
33
H. Long et al. Data report: penetrometer measurements
sure and temperature records then smoothly dissi-pated while the tool was in the formation. The tipdecayed to a final pressure of 16.34 MPa, and theshaft dissipated to a final pressure of 17.16 MPa. Ex-trapolation of the pressure records will provide goodestimate of the in situ pressure. The temperature de-cayed to an equilibrium value of 9.28°C.
Deployment 25: Hole U1322D, 40 mbsf
Table AT43 and FIGUREB28_T2P_DEPLOY25.XLS inthe “APP_B” folder in “Supplementary material”present the sequence of the operations and the toolresponse to particular events for T2P Deployment 25.The TruView data are missing for this deployment.Key deployment events are derived from the ship-board T2P Log Sheet (see the “DOWNHOLE” folderin “Supplementary material”). Pressure and tem-perature pulses were recorded when the probe waspushed into the formation but the pressure droppedrapidly when the drill bit was lifted off the BOH. Thetip and shaft then increased to a nearly constantpressure of 13.78 MPa, which was equal to the fluidpressure at BOH. The temperature decreased rapidlyupon pulling up of the bit and then was nearly con-stant and close to the temperature of the boreholefluid. The pressure and temperature records suggestthat the measurement was influenced by communi-cation with the borehole fluid. Thus this deploy-ment did not provide any constraint on in situconditions.
Deployment 26: Hole U1322D, 70 mbsf
Table AT44 and FIGUREB29_T2P_DEPLOY26.XLS inthe “APP_B” folder in “Supplementary material”present the sequence of the operations and the toolresponse to particular events for T2P Deployment 26.Similar to Deployment 25, the seal around the probewas weakened when the bit was lifted off the BOH.The pressure and temperature measurements weresubject to influence of the borehole fluid. This de-ployment did not provide any constraint on in situconditions.
Deployment 27: Hole U1322D, 100 mbsf
Table AT45 and FIGUREB30_T2P_DEPLOY27.XLS inthe “APP_B” folder in “Supplementary material”present the sequence of the operations and the toolresponse to particular events for T2P Deployment 27.The pressure and temperature records increasedwhile positioning the CDS to the retracted positionand pushing the tool into the formation. The tip andshaft pressures rapidly decreased while backing-offthe bit. The tip pressure rebounded to a near-constantvalue of 14.69 MPa. The shaft pressure dissipated to afinal value of 15.11 MPa. This dissipation curve can
Proc. IODP | Volume 308
be extrapolated to evaluate the in situ pressure.Smooth temperature decay was measured. The finaltemperature of 7.11°C was equilibrated with theformation.
Deployment 28: Hole U1322D, 134 mbsf
Table AT46 and FIGUREB31_T2P_DEPLOY28.XLS inthe “APP_B” folder in “Supplementary material”present the sequence of the operations and the toolresponse to particular events for T2P Deployment 28.The pressure and temperature records increasedwhile positioning the CDS to the retracted positionand pushing the tool into the formation. The tip andshaft pressures rapidly decreased while backing-off thebit. Pressures at the shaft and tip were near-constantduring the dissipation phase. The temperature in-creased while backing-off the bit and then rapidlydecayed to a final temperature of 7.31°C. The pres-sure and temperature measurements were subject toinfluence of the borehole fluid. This deployment didnot provide any constraint on in situ conditions.
All sensor data records were lost during recovery ofthe probe. At the rig floor, it was noted that the tiphad broken and the drive tube had bent during thedeployment. Damage to the probe likely occurredwhile pushing into the formation and then the tipwas broken when pulling out of the formation.
Appendix CFluid pressure within the drilling pipe
To check tool performance and the pressure calibra-tion, we made multiple 2–10 min tool stops to takethe fluid pressure in the drill pipe prior to and aftertool penetration. We stopped fluid circulation duringtool stop to remove the effect of pump pressure onthe measured pressure. Here, we present a discussionof the pressure state within the drill pipe based onthe DVTPP pressure measurements.
Figure AF7 presents the fluid pressure taken at orabove the seafloor. The measured fluid pressure isgenerally not equal to the calculated hydrostaticpressure. The tool pressure is either close to or higherthan hydrostatic pressure for deployments with nodrilling mud involved. However, the tool pressurecan be either significantly higher or lower than hy-drostatic pressure if drilling mud was used. In addi-tion, the range of the offset value is larger than seenduring deployments in water without mud. Thus,the tool-stop technique can not effectively check thepressure calibration.
Figure AF8 presents the fluid pressure taken at BOHprior to tool penetration. The fluid pressure at BOHis either close to or higher than the hydrostatic pres-
34
H. Long et al. Data report: penetrometer measurements
sure for deployments with no drilling mud involved.The tool pressure is significantly higher than hydro-static pressure if drilling mud was used. It shows ageneral trend where the pressure offset at the BOHincreases with the depth of the borehole.
To understand the fluid pressure in the drill pipe, wepresent two ideal scenarios of the fluid conditionswithin the drill pipe and outside the drill pipe. Thefirst scenario is one where no drilling mud was usedand the seawater was not contaminated with drillingcuttings (Fig. AF9A). In this case, the fluid in thepipe is static and the pressure is equal to hydrostaticpressure everywhere. The second scenario is whendrilling mud was used and the mud elevations insideand outside the pipe are at the seafloor. The fluid inthe drill pipe is static and has hydrostatic pressureabove the mud elevation (e.g., Stops 1 and 2 in Fig.AF9B). The fluid pressure below the mud elevation(e.g., Stop 3) is higher than hydrostatic pressure, fol-lows the static pressure gradient of the drilling mud,and can be calculated using
P = ρwgHw + ρmg(z – Hw),
where
g = acceleration of gravity,ρw = density of seawater,ρm = density of drilling mud,z = the target depth, andHw = depth of water at the location of the hole.
For almost all deployments, the tool pressure duringtool stop reached a steady pressure within 1 min (see“Appendix A,” “Appendix B”). This suggests thatfluid in the dill pipe was static during most of thetime of the tool stop. It is reasonable to assume thatthe fluid pressure within the drill pipe was equal tothe fluid pressure inside the annulus at BOH.
Figure AF10 presents three possible scenarios thatcould be encountered at tool stops. The first scenariois one in that no drilling mud was used; the eleva-tion of fluid with cuttings inside the pipe is lower
Proc. IODP | Volume 308
than that outside the pipe. The fluid elevation in thedrill pipe must be above sea level to reach the staticcondition. ΔH can be calculated by
.
Once ΔH is determined, the fluid pressure in the drillpipe can be calculated everywhere. The offset fromhydrostatic pressure is constant above the interfaceof seawater and the fluid with cuttings (e.g., Stops 1and 2). Below the interface, fluid pressure follows thepressure gradient of the fluid with drilling cuttings(Fig. AF10A).
The second scenario is one where drilling mud wasused to stabilize the borehole, and the mud elevationwithin the pipe is lower than that outside the pipe.The fluid elevation in the drill pipe must be abovesea level to equilibrate with the fluid pressure atBOH. ΔH can be calculated by
.
The pressure within the pipe is higher than hydro-static pressure everywhere. The offset from hydro-static pressure is constant above the interface ofseawater and the drilling mud (e.g., Stops 1 and 2).Below the interface, fluid pressure follows the pres-sure gradient of the drilling mud (Fig. AF10B).
The third scenario is one where drilling mud wasused to stabilize the borehole and the mud elevationwithin the pipe is higher than the mud elevationoutside the pipe. The fluid elevation in the drill pipewill be lower than sea level to equilibrate with thefluid pressure at BOH. ΔH can be calculated by
.
The pressure within the pipe could be either lower(e.g., Stops 1 and 2) or higher than hydrostatic pres-sure (e.g., Stop 3) depending on the location of thetool stop (Fig. AF10C).
ΔHρc ρw–( )H1
ρw
----------------------------=
ΔHρc ρw–( )H1 ρm ρw–( )H2+
ρw
-----------------------------------------------------------------=
ΔHρw ρm–( )H1 ρc ρm–( )H2+
ρw
-----------------------------------------------------------------=
35

H. Long et al. Data report: penetrometer measurements
Figure AF1. Onboard pressure calibration of transducer Z59-72. The pump pressure was run to 4000 psi fromatmospheric pressure (psia) and then stepped down to atmosphere pressure.
y = 0.11819436x + 26.92982866
R2 = 0.99997830
0
1,000
2,000
3,000
4,000
5,000
0 10,000 20,000 30,000 40,000
Pum
p pr
essu
re (
psia
)
Transducer reading (bit)
Proc. IODP | Volume 308 36

H. Long et al. Data report: penetrometer measurements
Figure AF2. Influence of temperature (T) on T2P pressure transducers. The slope (S) and intersection (I) of thecalibration curve can change with temperature.
Transducer reading (bit)
App
lied
pres
sure
(ps
i)
T1T2
T1
T2
Slope Intersection
S1
S2
I1
I2
S1 S2
I1
I2
Proc. IODP | Volume 308 37
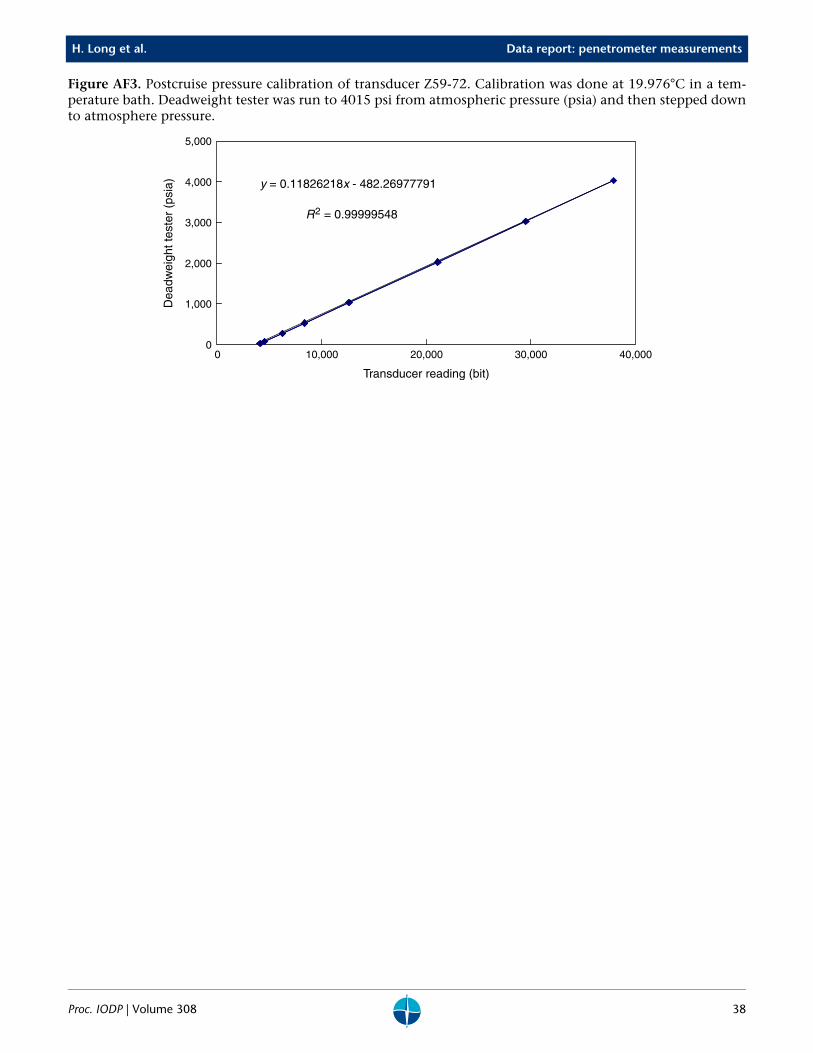
H. Long et al. Data report: penetrometer measurements
Figure AF3. Postcruise pressure calibration of transducer Z59-72. Calibration was done at 19.976°C in a tem-perature bath. Deadweight tester was run to 4015 psi from atmospheric pressure (psia) and then stepped downto atmosphere pressure.
y = 0.11826218x - 482.26977791
R2 = 0.99999548
0
1,000
2,000
3,000
4,000
5,000
0 10,000 20,000 30,000 40,000
Transducer reading (bit)
Dea
dwei
ght t
este
r (p
sia)
Proc. IODP | Volume 308 38

H. Long et al. Data report: penetrometer measurements
Figure AF4. Calibration coefficients of transducer S50-73 vs. temperature. A. Calibration curve slope vs. tem-perature. B. Intersection on y-axis of the calibration curve vs. temperature.
-5 0 5 10 15 20 25 30 35
Temperature (°C)
Slo
pe (
psi/b
it)
-5 0 5 10 15 20 25 30 35
Temperature (°C)
Inte
rsec
tion
(psi
)
BAy = 1.54163555x - 11.95662084
R2 = 0.96725644
-20
-10
0
10
20
30
40
y = -0.00007092x + 0.11913248
R2 = 0.96984164
0.1165
0.1170
0.1175
0.1180
0.1185
0.1190
0.1195
Proc. IODP | Volume 308 39

H. Long et al. Data report: penetrometer measurements
Figure AF5. Calibration coefficients of transducer Z59-72 vs. temperature. A. Calibration curve slope vs. tem-perature. B. Intersection on y-axis of the calibration curve vs. temperature.
-5 0 5 10 15 20 25 30 35
Temperature (°C)
Slo
pe (
psi/b
it)
-5 0 5 10 15 20 25 30 35
Temperature (°C)
Inte
rsec
tion
(psi
)
BA
y = -0.00009770x + 0.12027181
R2 = 0.98500121
0.1165
0.1170
0.1175
0.1180
0.1185
0.1190
0.1195
0.1200
0.1205
y = 8.00330492x - 646.31445310
R2 = 0.99796676
-700
-650
-600
-550
-500
-450
-400
-350
-300
Proc. IODP | Volume 308 40

H. Long et al. Data report: penetrometer measurements
Figure AF6. Calibration coefficients of transducer S50-75 vs. temperature. A. Calibration curve slope vs. tem-perature. B. Intersection on y-axis of the calibration curve vs. temperature.
y = -0.00008958x + 0.12916082
R2 = 0.95473203
0.1260
0.1265
0.1270
0.1275
0.1280
0.1285
0.1290
0.1295
-5 0 5 10 15 20 25 30 35
Temperature (°C)
Slo
pe (
psi/b
it)
y = -3.66990268x + 720.89753526
R2 = 0.99690183
600
620
640
660
680
700
720
740
-5 0 5 10 15 20 25 30 35
Temperature (°C)
Inte
rsec
tion
(psi
)
BA
Proc. IODP | Volume 308 41

H. Long et al. Data report: penetrometer measurements
Figure AF7. Offset between tool pressure and hydrostatic pressure for tool stops at or above seafloor. Hydro-static pressure was calculated assuming a seawater density of 1.024 g/cm3. DVTPP = Davis-VillingerTemperature-Pressure Probe.
0
200
400
600
800
1000
1200
1400
1600
-1 -0.5 0 0.5 1.0
Offset (MPa)
Dep
th (
mbs
l)
DVTPP with drilling mud DVTPP without drilling mud
Proc. IODP | Volume 308 42

H. Long et al. Data report: penetrometer measurements
Figure AF8. Offset between tool pressure and hydrostatic pressure at the bottom of the hole. Hydrostatic pres-sure calculated assuming a seawater density of 1.024 g/cm3. DVTPP = Davis-Villinger Temperature-PressureProbe.
0
100
200
300
400
500
600
700
0 0.5 1.0 1.5 2.0 2.5
Offset (MPa)
Dep
th (
mbs
f)
DVTPP with drilling mud DVTPP without drilling mud
Proc. IODP | Volume 308 43

H. Long et al. Data report: penetrometer measurements
Figure AF9. Two ideal scenarios of fluid condition in drill pipe A. Predicted fluid pressure profile for cases inwhich no drilling mud was used and the seawater was not contaminated with the drilling cuttings. B. Predictedfluid pressure profile for cases in which drilling mud was used and the mud elevations inside and outside thepipe are at seafloor. Brown line = predicted static pressure assuming the borehole was filled with a 10.5 ppgdrilling mud. ρw = density of seawater (1.024 g/cm3), ρm = density of drilling mud (1.259 g/cm3; 10.5 ppg), HW =water depth at hole location, HH = hole depth, Hs1 = water depth at Stop 1.
Rig floor
HW
HH
Stop 1
HW
HH
Stop 2
Stop 3
A B
ρw ρm
Hs1
0
100
200
300
400
500
0 0.4 0.8 1.2 0 0.4 0.8 1.2
Seafloor Seafloor
Offset (MPa) Offset (MPa)
Stop 1
Stop 2
Stop 3
Stop 1
Stop 2
Stop 3Hyd
rost
atic
pre
ssur
e
Hyd
rost
atic
pre
ssur
e
Drilling m
ud
Seawater Drilling mud
Sea level
Drilling m
ud
Bottom of hole Bottom of hole
Proc. IODP | Volume 308 44

H. Lo
ng
et al.D
ata repo
rt: pen
etrom
eter measurem
ents
Proc. IOD
P | Volume 308
45
ig floor was assumed to be sufficiently no drilling mud was used and fluid ining mud was used to stabilize the bore- pressure profile for cases where drillingion outside the pipe. Brown line = pre-eawater (1.024 g/cm3), ρm = density ofepth at hole location, HH = hole depth,drostatic pressure at Stop 2.
} ΔH
ρm
ρc
ρw
H2
H1
Seafloor
Stop 3
Hyd
rost
atic
pre
ssur
e
H1 = 50 m; H2 = 150 m m of hole
Drilling m
ud
0-0.4 0.4 0.8 1.2
Offset (MPa)
Stop 1
Stop 2
Figure AF10. Three possible scenarios that could be encountered at tool stops. The drill pipe above the rlong, and three fluids with different density do not mix. A. Predicted fluid pressure profile for cases wherethe borehole is contaminated with drilling cuttings. B. Predicted fluid pressure profile for cases where drillhole and mud elevation within the pipe is lower than the mud elevation outside the pipe. C. Predicted fluidmud was used to stabilize the borehole and mud elevation within the pipe is higher than the mud elevatdicted static pressure by assuming the borehole was filled with a 10.5 ppg drilling mud. ρw = density of sdrilling mud (1.259 g/cm3; 10.5 ppg), ρc = density of fluid with cuttings (1.139 g/cm3; 9.5 ppg), HW = water dHs1 = water depth at Stop 1, ΔH = offset in hydrostatic pressure, H1 = hydrostatic pressure at Stop 1, H2 = hy
Drilling m
ud
Rig floor
Sea level
HW
Stop 1
Stop 2
Stop 3
} ΔH } ΔH
ρw
ρm
ρw
ρc
H2
H1H1
HH
Hs1
0
100
200
300
400
500
Stop 1
Stop 2
Stop 3
Stop 1
Stop 2
Stop 3
Seafloor
Hyd
rost
atic
pre
ssur
e
Seafloor
Seawater Drilling mud Fluid with cuttings
Hyd
rost
atic
pre
ssur
e
H1 = 50 m; H2 = 100 m H1 = 100 mBottom of hole Bottom of hole Botto
B CA
Fluid w
ith drilling cuttings
0-0.2 0.2 0.4 0.6
Offset (MPa)
0 0.4 0.8 1.2
Offset (MPa)

H. Long et al. Data report: penetrometer measurements
Table AT1. Temperature calibration of DVTPP. A. Calibration coefficients for data loggers and thermistors.Channel T1 is the logger channel used to measure the thermistor. Rt′ = thermistor resistance in ohms. B. Actualthermistor calibration data.
Table AT1A. Calibration coefficients. (See table notes.)
Notes: For Channel T1 calibration, Rt′ = R1 × (k1 – x)/[k0 – (k1 – x)], where x = T1 counts. For thermistor calibration (ohms to Kelvin [Steinhart andHart]), 1/t = A + B × Ln(Rt′) + C × Ln(Rt′)3, where ºC = K – 273.15.
Table AT1B. Temperature vs. resistance.
Table AT2. Pressure calibration of DVTPP, 7 June 2002. (See table notes.)
Notes: For internal temperature sensor, temperature (°C) = Y1U + Y2U2 + Y3U3, U0 = temperature signal period (µs) at 25°C, U = temperature sig-nal period – U0 (µs). For pressure transducer, pressure (psi) = C(1 – T0
2/T2)[1 – D(1 – T02/T2)], T = Pressure signal period (µs), U0 = temperature
signal period (µs) at 25°C, C = C1 + C2U + C3U2, D = D1 + D2U, T0 = T1 + T2U + T3U2 + T4U3 + T5U4.
Calibrationcoefficient Logger 9367 Logger 9368
R1 251680.977 249507.092k0 65564.0623 65534.6958k1 65550.3036 65533.6013
Calibrationcoefficient Thermistor 0226-3 Thermistor 0226-2
A 4.60148156E–04 4.52826700E–04B 2.10947147E–04 2.11217111E–04C 6.41209309E–08 6.19876025E–08
Serialnumber
Resistance (Ω)
0.000ºC 50.000ºC 100.000ºC 150.000ºC
0226-2 1666200 162749 27716 69630226-3 1602700 157535 26907 6781
PXDCR 88587 PXDCR 88579
Temperature coefficientsU0 (µs) 5.833194 5.878972Y1 (°C/µs) –4036.649 –3969.749 Y2 (°C/µs) –12666.34 –11880.87Y3 0 0
Pressure coefficientsC1 (psia) –68866.77 –66259.12 C2 (psia/µs) –694.2135 –2504.110C3 (psia/µs2) 255224.2 223122.2D1 0.029732 0.030630D2 0 0T1 (psia) 30.32667 30.23938T2 (psia/µs) 1.025313 0.409012T3 (psia/µs2) 62.84291 58.71868T4 0 0T5 0 0
Proc. IODP | Volume 308 46
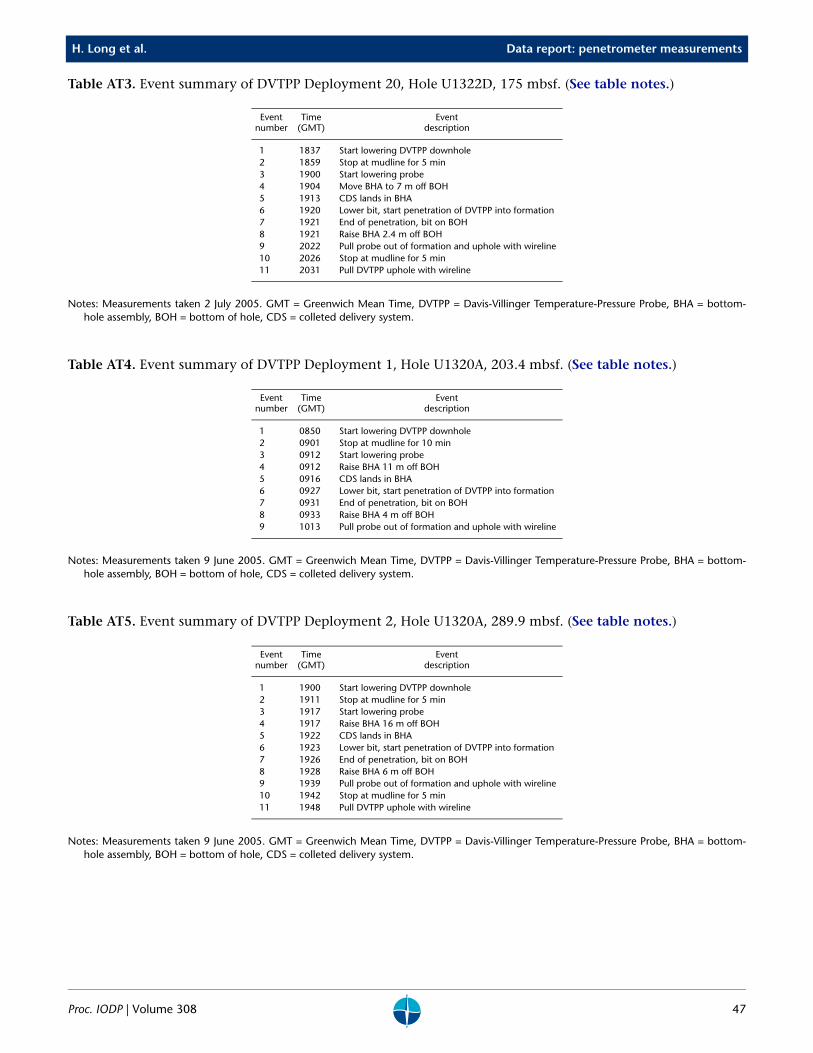
H. Long et al. Data report: penetrometer measurements
Table AT3. Event summary of DVTPP Deployment 20, Hole U1322D, 175 mbsf. (See table notes.)
Notes: Measurements taken 2 July 2005. GMT = Greenwich Mean Time, DVTPP = Davis-Villinger Temperature-Pressure Probe, BHA = bottom-hole assembly, BOH = bottom of hole, CDS = colleted delivery system.
Table AT4. Event summary of DVTPP Deployment 1, Hole U1320A, 203.4 mbsf. (See table notes.)
Notes: Measurements taken 9 June 2005. GMT = Greenwich Mean Time, DVTPP = Davis-Villinger Temperature-Pressure Probe, BHA = bottom-hole assembly, BOH = bottom of hole, CDS = colleted delivery system.
Table AT5. Event summary of DVTPP Deployment 2, Hole U1320A, 289.9 mbsf. (See table notes.)
Notes: Measurements taken 9 June 2005. GMT = Greenwich Mean Time, DVTPP = Davis-Villinger Temperature-Pressure Probe, BHA = bottom-hole assembly, BOH = bottom of hole, CDS = colleted delivery system.
Eventnumber
Time (GMT)
Event description
1 1837 Start lowering DVTPP downhole2 1859 Stop at mudline for 5 min3 1900 Start lowering probe4 1904 Move BHA to 7 m off BOH5 1913 CDS lands in BHA6 1920 Lower bit, start penetration of DVTPP into formation7 1921 End of penetration, bit on BOH8 1921 Raise BHA 2.4 m off BOH9 2022 Pull probe out of formation and uphole with wireline10 2026 Stop at mudline for 5 min11 2031 Pull DVTPP uphole with wireline
Eventnumber
Time (GMT)
Event description
1 0850 Start lowering DVTPP downhole2 0901 Stop at mudline for 10 min3 0912 Start lowering probe4 0912 Raise BHA 11 m off BOH5 0916 CDS lands in BHA6 0927 Lower bit, start penetration of DVTPP into formation7 0931 End of penetration, bit on BOH8 0933 Raise BHA 4 m off BOH9 1013 Pull probe out of formation and uphole with wireline
Eventnumber
Time (GMT)
Event description
1 1900 Start lowering DVTPP downhole2 1911 Stop at mudline for 5 min3 1917 Start lowering probe4 1917 Raise BHA 16 m off BOH5 1922 CDS lands in BHA6 1923 Lower bit, start penetration of DVTPP into formation7 1926 End of penetration, bit on BOH8 1928 Raise BHA 6 m off BOH9 1939 Pull probe out of formation and uphole with wireline10 1942 Stop at mudline for 5 min11 1948 Pull DVTPP uphole with wireline
Proc. IODP | Volume 308 47

H. Long et al. Data report: penetrometer measurements
Table AT6. Event summary of DVTPP Deployment 3, Hole U1324B, 229.1 mbsf. (See table notes.)
Notes: Measurements taken 22 June 2005. GMT = Greenwich Mean Time, DVTPP = Davis-Villinger Temperature-Pressure Probe, BHA = bottom-hole assembly, BOH = bottom of hole, CDS = colleted delivery system.
Table AT7. Event summary of DVTPP Deployment 4, Hole U1324B, 362.4 mbsf. (See table notes.)
Notes: Measurements taken 23 June 2005. GMT = Greenwich Mean Time, DVTPP = Davis-Villinger Temperature-Pressure Probe, BHA = bottom-hole assembly, BOH = bottom of hole, CDS = colleted delivery system.
Table AT8. Event summary of DVTPP Deployment 6, Hole U1324B, 464.3 mbsf. (See table notes.)
Notes: Measurements taken 24 June 2005. GMT = Greenwich Mean Time, DVTPP = Davis-Villinger Temperature-Pressure Probe, BHA = bottom-hole assembly, BOH = bottom of hole, CDS = colleted delivery system.
Eventnumber
Time (GMT)
Event description
1 0946 Start lowering DVTPP downhole2 1009 Stop at mudline for 2 min3 1011 Start lowering probe4 Raise BHA off BOH5 CDS lands in BHA6 1024 Lower bit, start penetration of DVTPP into formation7 1028 End of penetration, bit on BOH8 Raise BHA off BOH9 1118 Pull probe out of formation and uphole with wireline10 1230 Stop at mudline for 2 min11 1232 Pull DVTPP uphole with wireline
Eventnumber
Time (GMT)
Event description
1 0615 Start lowering DVTPP downhole2 0636 Stop at mudline for 5 min3 0641 Start lowering probe4 Raise BHA off BOH5 0657 CDS lands in BHA6 0701 Lower bit, start penetration of DVTPP into formation7 0704 End of penetration, bit on BOH8 Raise BHA off BOH9 0751 Pull probe out of formation and uphole with wireline10 0827 Stop at mudline for 5 min11 0832 Pull DVTPP uphole slowly with wireline
Eventnumber
Time (GMT)
Event description
1 0220 Start lowering DVTPP downhole2 0230 Stop at mudline for 5 min3 0235 Start lowering probe4 Raise BHA off BOH5 0247 CDS lands in BHA6 0253 Lower bit, start penetration of DVTPP into formation7 0257 End of penetration, bit on BOH8 Raise BHA off BOH9 0331 Pull probe out of formation and uphole slowly with wireline10 0338 Stop at mudline for 5 min11 0343 Pull DVTPP uphole slowly with wireline
Proc. IODP | Volume 308 48

H. Long et al. Data report: penetrometer measurements
Table AT9. Event summary of DVTPP Deployment 7, Hole U1324B, 493.1 mbsf. (See table notes.)
Notes: Measurements taken 24 June 2005. GMT = Greenwich Mean Time, DVTPP = Davis-Villinger Temperature-Pressure Probe, BHA = bottom-hole assembly, BOH = bottom of hole, CDS = colleted delivery system.
Table AT10. Event summary of DVTPP Deployment 8, Hole U1324B, 521.9 mbsf. (See table notes.)
Notes: Measurements taken 24 June 2005. GMT = Greenwich Mean Time, DVTPP = Davis-Villinger Temperature-Pressure Probe, BHA = bottom-hole assembly, BOH = bottom of hole, CDS = colleted delivery system.
Table AT11. Event summary of DVTPP Deployment 10, Hole U1324B, 560.4 mbsf. (See table notes.)
Notes: Measurements taken 25 June 2005. GMT = Greenwich Mean Time, DVTPP = Davis-Villinger Temperature-Pressure Probe, BHA = bottom-hole assembly, BOH = bottom of hole, CDS = colleted delivery system.
Eventnumber
Time (GMT)
Event description
1 0735 Start lowering DVTPP downhole2 0743 Stop at mudline for 5 min3 0748 Start lowering probe4 Raise BHA off BOH5 0755 CDS lands in BHA6 0757 Lower bit, start penetration of DVTPP into formation7 0801 End of penetration, bit on BOH8 Raise BHA off BOH9 0832 Pull probe out of formation and uphole with wireline10 0839 Stop at mudline for 5 min11 0844 Pull DVTPP uphole with wireline
Eventnumber
Time (GMT)
Event description
1 1846 Start lowering DVTPP downhole2 1857 Stop at mudline for 5 min3 1902 Start lowering probe4 1856 Raise BHA 17 m off BOH5 1912 CDS lands in BHA6 1914 Lower bit, start penetration of DVTPP into formation7 1924 End of penetration, bit on BOH8 1930 Raise BHA 4 m off BOH9 2005 Pull probe out of formation and uphole with wireline10 2013 Stop at mudline for 5 min11 2018 Pull DVTPP uphole with wireline
Eventnumber
Time (GMT)
Event description
1 0720 Start lowering DVTPP downhole2 0731 Stop at mudline for 5 min3 0736 Start lowering probe4 0739 Raise BHA 16 m off BOH5 0742 CDS lands in BHA6 0742 Lower bit, start penetration of DVTPP into formation7 0747 End of penetration, bit on BOH8 0748 Raise BHA 4 m off BOH9 0819 Pull probe out of formation and uphole with wireline10 0827 Stop at mudline for 5 min11 0832 Pull DVTPP uphole with wireline
Proc. IODP | Volume 308 49

H. Long et al. Data report: penetrometer measurements
Table AT12. Event summary of DVTPP Deployment 11, Hole U1324B, 589.2 mbsf. (See table notes.)
Notes: Measurements taken 25 June 2005. GMT = Greenwich Mean Time, DVTPP = Davis-Villinger Temperature-Pressure Probe, BHA = bottom-hole assembly, BOH = bottom of hole, CDS = colleted delivery system.
Table AT13. Event summary of DVTPP Deployment 12, Hole U1324B, 608.2 mbsf. (See table notes.)
Notes: Measurements taken 25 June 2005. GMT = Greenwich Mean Time, DVTPP = Davis-Villinger Temperature-Pressure Probe, BHA = bottom-hole assembly, BOH = bottom of hole, CDS = colleted delivery system.
Table AT14. Event summary of DVTPP Deployment 13, Hole U1324C, 250 mbsf. (See table notes.)
Notes: Measurements taken 27 June 2005. GMT = Greenwich Mean Time, DVTPP = Davis-Villinger Temperature-Pressure Probe, BHA = bottom-hole assembly, BOH = bottom of hole, CDS = colleted delivery system.
Eventnumber
Time (GMT)
Event description
1 1402 Start lowering DVTPP downhole2 1411 Stop at mudline for 5 min3 1416 Start lowering probe4 1416 Raise BHA 23 m off BOH5 1423 CDS lands in BHA6 1423 Lower bit, start penetration of DVTPP into formation7 1430 End of penetration, bit on BOH8 Raise BHA off BOH9 1515 Pull probe out of formation and uphole with wireline10 1522 Stop at mudline for 5 min11 1527 Pull DVTPP uphole with wireline
Eventnumber
Time (GMT)
Event description
1 2248 Start lowering DVTPP downhole2 2305 Stop at mudline for 5 min3 2310 Start lowering probe4 2257 Raise BHA 17 m off BOH5 2318 CDS lands in BHA6 2329 Lower bit, start penetration of DVTPP into formation7 2334 End of the first penetration, bit is 0.2 m off BOH8 2334 Raise BHA 4 m off BOH9 2335 Lower bit, start further penetration 10 2335 End of penetration, bit on BOH11 2336 Raise BHA 3 m off BOH12 0037 Pull probe out of formation and uphole with wireline13 0045 Stop at mudline for 5 min14 0050 Pull DVTPP uphole with wireline
Eventnumber
Time (GMT)
Event description
1 0700 Start lowering DVTPP downhole2 0709 Stop at mudline for 5 min3 0714 Start lowering probe4 0716 Raise BHA 14.5 m off BOH5 0717 CDS lands in BHA6 0717 Lower bit, start penetration of DVTPP into formation7 0722 End of first penetration, bit 0.15 m off BOH8 0724 Raise BHA 3.5 m off BOH9 0724 Lower bit, start further penetration 10 0725 End of penetration, bit on BOH11 0855 Pull probe out of formation and uphole with wireline12 0900 Stop at mudline for 5 min13 0904 Pull DVTPP uphole with wireline
Proc. IODP | Volume 308 50

H. Long et al. Data report: penetrometer measurements
Table AT15. Event summary of DVTPP Deployment 14, Hole U1324C, 405 mbsf. (See table notes.)
Notes: Measurements taken 27 June 2005. GMT = Greenwich Mean Time, DVTPP = Davis-Villinger Temperature-Pressure Probe, BHA = bottom-hole assembly, BOH = bottom of hole, CDS = colleted delivery system.
Table AT16. Event summary of DVTPP Deployment 15, Hole U1324C, 505 mbsf. (See table notes.)
Notes: Measurements taken 28 June 2005. GMT = Greenwich Mean Time, DVTPP = Davis-Villinger Temperature-Pressure Probe, BHA = bottom-hole assembly, BOH = bottom of hole, CDS = colleted delivery system.
Table AT17. Event summary of DVTPP Deployment 16, Hole U1322B, 166.7 mbsf. (See table notes.)
Notes: Measurements taken 29 June 2005. GMT = Greenwich Mean Time, DVTPP = Davis-Villinger Temperature-Pressure Probe, BHA = bottom-hole assembly, BOH = bottom of hole, CDS = colleted delivery system.
Eventnumber
Time (GMT)
Event description
1 1752 Start lowering DVTPP downhole2 1800 Stop at mudline for 5 min3 1805 Start lowering probe4 1756 Move BHA to 17 m off BOH5 1812 CDS lands in BHA6 1822 Lower bit, start penetration of DVTPP into formation7 1826 End of penetration, bit on BOH8 1830 Raise BHA 8.5 m off BOH9 2000 Pull probe out of formation and uphole with wireline10 2007 Stop at mudline for 5 min11 2012 Pull DVTPP uphole with wireline
Eventnumber
Time (GMT)
Event description
1 0030 Start lowering DVTPP downhole2 0043 Stop at mudline for 5 min3 0048 Start lowering probe4 0057 CDS lands in BHA5 0106 Lower bit, start penetration of DVTPP into formation6 0109 End of penetration, bit on BOH7 0112 Raise BHA 6.4 m off BOH8 0242 Pull probe out of formation and uphole with wireline9 0249 Stop at mudline for 5 min10 0254 Pull DVTPP uphole with wireline
Eventnumber
Time (GMT)
Event description
1 2242 Start lowering DVTPP downhole2 2257 Stop at mudline for 5 min3 2302 Start lowering probe4 2254 Raise BHA 8 m off BOH5 2310 CDS lands in BHA, tip touched the formation6 2320 Lower bit, start penetration of DVTPP into formation7 2322 End of penetration, bit on BOH8 2323 Raise BHA 3 m off BOH9 2324 Move BHA back to BOH10 0054 Pull probe out of formation and uphole with wireline11 0058 Stop at mudline for 5 min12 0103 Pull DVTPP uphole with wireline
Proc. IODP | Volume 308 51

H. Long et al. Data report: penetrometer measurements
Table AT18. Event summary of DVTPP Deployment 17, Hole U1322C, 100 mbsf. (See table notes.)
Notes: Measurements taken 1 July 2005. GMT = Greenwich Mean Time, DVTPP = Davis-Villinger Temperature-Pressure Probe, BHA = bottom-hole assembly, BOH = bottom of hole, CDS = colleted delivery system.
Table AT19. Event summary of DVTPP Deployment 18, Hole U1322C, 220 mbsf. (See table notes.)
Notes: Measurements taken 1 July 2005. GMT = Greenwich Mean Time, DVTPP = Davis-Villinger Temperature-Pressure Probe, BHA = bottom-hole assembly, BOH = bottom of hole, CDS = colleted delivery system.
Table AT20. Event summary of DVTPP Deployment 19, Hole U1322C, 238 mbsf. (See table notes.)
Notes: Measurements taken 1 July 2005. GMT = Greenwich Mean Time, DVTPP = Davis-Villinger Temperature-Pressure Probe, BHA = bottom-hole assembly, BOH = bottom of hole, CDS = colleted delivery system.
Eventnumber
Time (GMT)
Event description
1 0152 Start lowering DVTPP downhole2 0211 Stop at mudline for 5 min3 0216 Start lowering probe4 Move BHA off BOH5 0222 CDS lands in BHA6 0233 Lower bit, start penetration of DVTPP into formation7 0234 End of penetration, bit on BOH8 0235 Raise BHA 4 m off BOH9 0405 Pull probe out of formation and uphole with wireline10 0409 Stop at mudline for 5 min11 0414 Pull DVTPP uphole with wireline
Eventnumber
Time (GMT)
Event description
1 1545 Start lowering DVTPP downhole2 1607 Stop at mudline for 5 min3 1612 Start lowering probe4 Move BHA to 16 m off BOH5 1616 CDS lands in BHA6 1617 Lower bit, start penetration of DVTPP into formation7 1619 End of penetration, bit on BOH8 1619 Raise BHA 5 m off BOH9 1721 Pull probe out of formation and uphole with wireline10 1728 Stop at mudline for 5 min11 1733 Pull DVTPP uphole with wireline
Eventnumber
Time (GMT)
Event description
1 1901 Start lowering DVTPP downhole2 1923 Stop at mudline for 5 min3 1928 Start lowering probe4 1928 Moving BHA to 11 m off BOH5 1934 CDS lands in BHA6 1944 Lower bit, start penetration of DVTPP into formation7 1945 End of penetration, bit on BOH8 1946 Raise BHA 2 m off BOH9 1948 Lower BHA back to BOH10 1950 Raise BHA 6 m off BOH11 2118 Pull probe out of formation and uphole with wireline12 2124 Stop at mudline for 5 min13 2128 Pull DVTPP uphole with wireline
Proc. IODP | Volume 308 52

H. Long et al. Data report: penetrometer measurements
Table AT21. Temperature calibration of T2P. A. Calibration coefficients for data loggers and thermistors. B. Ac-tual thermistor calibration data.
Table AT21A. Calibration coefficients. (See table notes.)
Notes: For temperature channel calibration (counts to ohms), Rt′ = R1 × [5/(x/65535 × 3.5/24900) – 24900] + R2, where x = counts and Rt′ =thermistor resistance in ohms. For thermistor calibration (ohms to Kelvin [Steinhart and Hart]), 1/t = A + B × Ln(Rt′) + C × Ln(Rt′)3, where t (ºC) =K – 273.15 and Rt′ = thermistor resistance in ohms.
Table AT21B. Temperature vs. resistance.
Table AT22. Onboard pressure calibration of T2P, June 2005. (See table note.)
Note: * = pressure calibration before being flooded, † = pressure calibration after oven drying.
Calibrationcoefficient Logger Sn 2 Logger Sn 4
R1 1.000729 0.990307767R2 176.136606 –72.74909712
Calibrationcoefficient
Thermistor 0509-1
Thermistor 0509-2
Thermistor 0509-3
Thermistor 0509-4
Thermistor 0509-5
Thermistor 0509-6
A 4.63276461E–04 5.43051013E–04 4.75887900E–04 4.82495572E–04 4.82688206E–04 4.71824656E–04B 2.10947147E–04 1.99981837E–04 2.08557612E–04 2.09282474E–04 2.08833095E–04 2.09263995E–04C 6.19690000E–08 8.35910000E–08 6.34430000E–08 6.20870000E–08 6.40080000E–08 6.27480000E–08
Resistance (Ω)
Serial # 0.000ºC 30.000ºC 60.000ºC 100.000ºC
0509-1 1795000 406620 116210 289800509-2 1720000 389890 114500 277950509-3 1740000 394200 112590 280350509-4 1651000 373340 106560 265350509-5 1655000 375720 107480 268100509-6 1712000 388430 111130 27740
Transducer number
Slope (psi/bit)
Intersection (psi) R2
S50-73 0.11768162 64.28686942 0.99999094S50-74* 0.12469840 209.49786126 0.99995831S50-74† 0.12473479 161.99347791 0.99999663S50-75 0.13043403 221.74997847 0.99999299Z59-72* 0.11819436 26.92982866 0.99997830Z59-72† 0.11816986 –490.20091995 0.99997433Y67-16 0.11944345 99.71216680 0.99999905
Proc. IODP | Volume 308 53

H. Long et al. Data report: penetrometer measurements
Table AT23. Event summary of T2P Deployment 1, Hole 1319A. (See table notes.)
Notes: Tool test in water column, 7 June 2005. GMT = Greenwich Mean Time, T2P = temperature/dual pressure probe, CDS = colleted deliverysystem.
Eventnumber
Time (GMT) Event description
1 2331 Start data logger at 1 Hz2 0146 T2P on rig floor3 0210 Raise T2P vertically4 0210 Remove pressure response chamber from T2P tip5 0210 Place shroud over T2P tip6 0211 Place T2P in drill pipe7 0213 Connect T2P to spacer8 0216 Connect CDS to spacer9 0216 CDS in extended position10 0220 Start lowering T2P downhole11 0232 Stop at 511 mbsl12 0235 Start lowering probe13 0241 Stop at 1011 mbsl14 0244 Start lowering probe15 0255 Stop at 1388 mbsl16 0301 Start pulling T2P uphole17 0316 Stop at 1010 mbsl18 0319 Continue pulling T2P uphole19 0323 Stop at 511 mbsl20 0325 Continue pulling T2P uphole21 0341 T2P on rig floor22 0341 T2P tip in pressure response chamber23 0346 Pressure response test24 0358 Download data from data logger25 0440 Remove battery from T2P
Proc. IODP | Volume 308 54

H. Long et al. Data report: penetrometer measurements
Table AT24. Event summary of T2P Deployment 2, Hole U1319A, 80.5 mbsf. (See table notes.)
Notes: Measurements taken 7 June 2005. GMT = Greenwich Mean Time, T2P = temperature/dual pressure probe, CDS = colleted delivery sys-tem, LFV = lockable float valve, spm = strokes per minute, BHA = bottom-hole assembly, DC = direct current.
Eventnumber
Time (GMT) Event description
1 0607 Start data logger at 1 Hz2 1313 T2P on rig floor3 1315 Raise T2P vertically4 1316 Remove pressure response chamber from T2P tip5 1316 Place shroud over T2P tip6 1319 Place T2P in drill pipe7 1320 Connect T2P to spacer8 1323 Connect CDS to spacer9 1325 CDS in extended position10 1326 Start lowering T2P downhole, pumps on11 1335 Stop at 511 mbsl, pumps off12 1337 Start lowering probe, pumps on13 1344 Stop at 1012 mbsl, pumps off14 1346 Start lowering probe, pumps on15 1352 Stop at 1431 mbsl, pumps off16 1355 Start lowering probe17 1358 Pass T2P through LFV18 1405 CDS lands in BHA19 1408 Start penetration of T2P into sediment20 1415 End of T2P penetration21 1427 Pumps on at 10 spm22 1447 Start pulling T2P uphole23 1448 Stop pulling at 1509 mbsl24 1449 Pull/release winch to free CDS from BHA25 1452 Start pulling T2P uphole26 1509 Stop at 511 mbsl, pumps off27 1511 Start pulling T2P uphole28 1520 Detach CDS from wireline29 1527 Detach CDS from spacer30 1530 Detach spacer from T2P31 1530 T2P on rig floor32 1531 T2P tip in pressure response chamber33 1539 T2P in workroom34 1549 Remove battery from T2P35 1604 Connect T2P to DC power36 1605 Download data from data logger
Proc. IODP | Volume 308 55

H. Long et al. Data report: penetrometer measurements
Table AT25. Event summary of T2P Deployment 3, Hole U1320A, 126.3 mbsf. (See table notes.)
Notes: Measurements taken 8–9 June 2005. GMT = Greenwich Mean Time, T2P = temperature/dual pressure probe, CDS = colleted delivery sys-tem, spm = strokes per minute, BHA = bottom-hole assembly, BOH = bottom of hole, DC = direct current.
Eventnumber
Time (GMT) Event description
1 Start data logger at 1 Hz2 2308 T2P on rig floor3 2314 Remove pressure response chamber from T2P tip4 2314 Place shroud over T2P tip5 2315 Connect T2P to spacer6 2317 Connect CDS to spacer7 2322 Connect CDS to wireline8 2323 Start lowering T2P downhole, pumps on9 2330 Stop at 511 mbsl, pumps off10 2333 Start lowering probe, pumps on11 2340 Stop at 1011 mbsl, pumps off12 2343 Start lowering probe, pumps on13 2344 Pump at 13 spm14 2350 Stop at 1490 mbsl, pumps off15 2353 Start lowering probe, pumps on at 13 spm16 2357 Pumps off17 0000 CDS lands in BHA18 0000 Raise BHA to 2 m off BOH19 0002 Start penetration of T2P into sediment, 2m advance of BHA20 0003 End of T2P penetration21 0004 Raise BHA 3m off BOH22 0007 Pump at 10 spm23 0055 Pull T2P uphole slowly 10 m24 0059 10 m pull completed25 0059 Pull T2P uphole, pump at 10 spm26 0105 Stop at 511 mbsl, pumps off27 0109 Pull T2P uphole, pumps on28 0113 Detach CDS from wireline29 0116 Detach CDS from spacer30 0118 Detach spacer from T2P31 0118 T2P on rig floor32 0118 T2P tip in pressure response chamber33 0126 T2P in workroom34 0146 Remove battery from T2P35 0146 Connect T2P to DC power
Download data from data logger
Proc. IODP | Volume 308 56
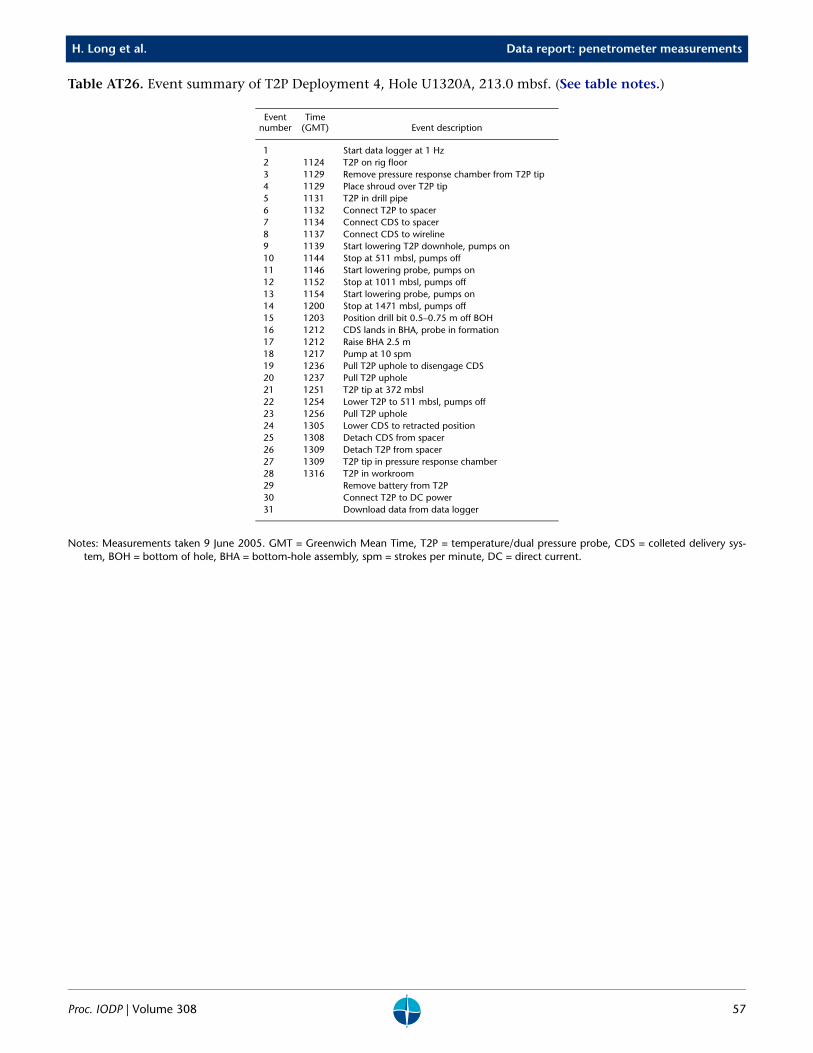
H. Long et al. Data report: penetrometer measurements
Table AT26. Event summary of T2P Deployment 4, Hole U1320A, 213.0 mbsf. (See table notes.)
Notes: Measurements taken 9 June 2005. GMT = Greenwich Mean Time, T2P = temperature/dual pressure probe, CDS = colleted delivery sys-tem, BOH = bottom of hole, BHA = bottom-hole assembly, spm = strokes per minute, DC = direct current.
Eventnumber
Time (GMT) Event description
1 Start data logger at 1 Hz2 1124 T2P on rig floor3 1129 Remove pressure response chamber from T2P tip4 1129 Place shroud over T2P tip5 1131 T2P in drill pipe6 1132 Connect T2P to spacer7 1134 Connect CDS to spacer8 1137 Connect CDS to wireline9 1139 Start lowering T2P downhole, pumps on10 1144 Stop at 511 mbsl, pumps off11 1146 Start lowering probe, pumps on12 1152 Stop at 1011 mbsl, pumps off13 1154 Start lowering probe, pumps on14 1200 Stop at 1471 mbsl, pumps off15 1203 Position drill bit 0.5–0.75 m off BOH16 1212 CDS lands in BHA, probe in formation17 1212 Raise BHA 2.5 m18 1217 Pump at 10 spm19 1236 Pull T2P uphole to disengage CDS20 1237 Pull T2P uphole21 1251 T2P tip at 372 mbsl22 1254 Lower T2P to 511 mbsl, pumps off23 1256 Pull T2P uphole24 1305 Lower CDS to retracted position25 1308 Detach CDS from spacer26 1309 Detach T2P from spacer27 1309 T2P tip in pressure response chamber28 1316 T2P in workroom29 Remove battery from T2P30 Connect T2P to DC power31 Download data from data logger
Proc. IODP | Volume 308 57

H. Long et al. Data report: penetrometer measurements
Table AT27. Event summary of T2P Deployment 5, Hole U1324B, 51.3 mbsf. (See table notes.)
Notes: Measurements taken 21 June 2005. GMT = Greenwich Mean Time, T2P = temperature/dual pressure probe, CDS = colleted delivery sys-tem, spm = strokes per minute, BOH = bottom of hole, BHA = bottom-hole assembly.
Eventnumber
Time (GMT) Event description
1 Start data logger at 1 Hz2 1140 T2P on rig floor3 1147 Remove pressure response chamber from T2P tip4 1147 Place shroud over T2P tip5 1148 Connect T2P to spacer6 1150 Connect CDS to spacer7 1155 Start lowering T2P downhole, pumps on8 1204 Stop at 515 mbsl, pumps off9 1208 Start lowering probe, pumps on10 1212 Stop at 768 mbsl, pumps off11 1214 Start lowering probe, pumps on12 1219 Stop at 1066 mbsl, pumps off13 1222 Start lowering probe, pumps on at 18 spm14 1223 Bit is 0.5 m off BOH15 1224 Start lowering probe to land in BHA16 1225 CDS lands in BHA, pumps off17 1225 Raise BHA to 2 m off BOH18 1226 Start penetration of T2P into sediment, 2 m advance of BHA19 1227 End of T2P penetration, bit 0.25 m off BOH20 1227 Raise BHA 2 m off BOH21 1232 Pump at 11 spm22 1257 Pull T2P uphole slowly with wireline23 1258 CDS clear of BHA24 1300 Stop at 1067 mbsl, pumps off25 1304 Pull T2P uphole slowly with wireline26 1309 Stop at 767 mbsl, pumps off27 1311 Pull T2P uphole slowly with wireline28 1315 Stop at 516 mbsl, pumps off29 1317 Pull T2P uphole slowly with wireline30 1325 Disconnect wireline from CDS31 1325 Extend CDS32 1328 Disconnect CDS from spacer33 1328 Disconnect spacer from CDS34 1330 Disconnect T2P from spacer35 1333 T2P out of pipe36 Download data from data logger
Proc. IODP | Volume 308 58

H. Long et al. Data report: penetrometer measurements
Table AT28. Event summary of T2P Deployment 6, Hole U1324B, 89.3 mbsf. (See table notes.)
Notes: Measurements taken 21 June 2005. GMT = Greenwich Mean Time, T2P = temperature/dual pressure probe, BHA = bottom-hole assembly,CDS = colleted delivery system, BOH = bottom of hole, spm = strokes per minute.
Eventnumber
Time (GMT) Event description
1 1417 Start data logger at 1 Hz2 1615 T2P on rig floor3 1647 Start lowering T2P downhole, pumps on4 1656 Stop at 511 mbsl, pumps off5 1657 Start lowering probe, pumps on6 1703 Stop at 761 mbsl, pumps off7 1704 Start lowering probe, pumps on8 1710 Stop at 1058 mbsl, pumps off9 1716 Start lowering probe10 1718 Stop at 1135 mbsl, pumps off11 1720 Start lowering probe to land in BHA12 1722 CDS lands in BHA, pumps off13 1731 Start penetration of T2P into sediment14 1733 End of T2P penetration, bit 1 m off BOH15 1736 Raise BHA 2 m off BOH16 1742 Pump at 11 spm17 1808 Pull T2P uphole slowly with wireline18 1811 CDS clear of BHA19 1813 Stop at 1058 mbsl, pumps off20 1815 Pull T2P uphole slowly with wireline21 1818 Stop at 760 mbsl, pumps off22 1820 Pull T2P uphole slowly with wireline23 1823 Stop at 511 mbsl, pumps off24 1825 Pull T2P uphole slowly with wireline25 1831 Disconnect wireline from CDS26 1832 Retract CDS27 1835 Disconnect CDS from spacer28 1837 Disconnect spacer from CDS29 1838 T2P out of pipe30 1850 Download data from data logger
Proc. IODP | Volume 308 59

H. Long et al. Data report: penetrometer measurements
Table AT29. Event summary of T2P Deployment 7, Hole U1324B, 117.8 mbsf. (See table notes.)
Notes: Measurements taken 21 June 2005. GMT = Greenwich Mean Time, T2P = temperature/dual pressure probe, BHA = bottom-hole assembly,CDS = colleted delivery system, BOH = bottom of hole, spm = strokes per minute.
Eventnumber
Time (GMT) Event description
1 2018 Start data logger at 1 Hz2 2056 T2P on rig floor3 2107 Start lowering T2P downhole, pumps on4 2115 Stop at 511 mbsl, pumps off5 2117 Start lowering probe, pumps on6 2120 Stop at 761 mbsl, pumps off7 2122 Start lowering probe, pumps on8 2126 Stop at 1058 mbsl, pumps off9 2130 Start lowering probe10 2133 Stop at 1164 mbsl, pumps off11 2140 Start lowering probe to land in BHA12 2144 CDS lands in BHA, pumps off13 2147 Start penetration of T2P into sediment14 2148 End of T2P penetration, bit 1 m off BOH15 2152 Raise BHA 2 m off BOH16 2158 Pump at 14 spm17 2228 Pull T2P uphole slowly with wireline18 2233 CDS clear of BHA19 2234 Stop at 1058 mbsl, pumps off20 2236 Pull T2P uphole slowly with wireline21 2240 Stop at 760 mbsl, pumps off22 2242 Pull T2P uphole slowly with wireline23 2246 Stop at 511 mbsl, pumps off24 2248 Pull T2P uphole slowly with wireline25 2255 Disconnect wireline from CDS26 2256 Retract CDS27 2258 Disconnect CDS from spacer28 2259 Disconnect spacer from CDS29 2301 T2P out of pipe30 2308 Download data from data logger
Proc. IODP | Volume 308 60

H. Long et al. Data report: penetrometer measurements
Table AT30. Event summary of T2P Deployment 8, Hole U1324B, 136.3 mbsf. (See table notes.)
Notes: Measurements taken 22 June 2005. GMT = Greenwich Mean Time, T2P = temperature/dual pressure probe, CDS = colleted delivery sys-tem, BHA = bottom-hole assembly, BOH = bottom of hole.
Table AT31. Event summary of T2P Deployment 9, Hole U1324B, 368.0 mbsf. (See table notes.)
Notes: Measurements taken 23 June 2005. GMT = Greenwich Mean Time, T2P = temperature/dual pressure probe, CDS = colleted delivery sys-tem, BHA = bottom-hole assembly, BOH = bottom of hole.
Eventnumber
Time (GMT) Event description
1 0028 Start data logger at 1 Hz2 0145 T2P on rig floor3 0158 Start lowering T2P downhole, pumps on4 0208 Stop at 511 mbsl, pumps off5 0210 Start lowering probe, pumps on6 0214 Stop at 761 mbsl, pumps off7 0217 Start lowering probe, pumps on8 0221 Stop at 1058 mbsl, pumps off9 0223 Start lowering probe10 0227 Stop at 1151 mbsl, pumps off11 0232 Start lowering probe12 0234 Stop at 1181 mbsl, pumps off13 0238 Start lowering probe14 0243 CDS lands in BHA, pumps off15 0243 Start penetration of T2P into sediment16 0244 End of T2P penetration, bit at BOH17 0245 Raise BHA 1.5 m off BOH18 0316 Pull T2P uphole slowly with wireline19 0318 CDS clear of BHA20 0320 Stop at 1058 mbsl, pumps off21 0323 Pull T2P uphole slowly with wireline22 0327 Stop at 761 mbsl, pumps off23 0330 Pull T2P uphole slowly with wireline24 0333 Stop at 511 mbsl, pumps off25 0336 Pull T2P uphole slowly with wireline26 0342 Disconnect wireline from CDS27 0345 Disconnect CDS from spacer28 0346 Disconnect spacer from CDS29 0347 T2P out of pipe30 0411 Download data from data logger
Eventnumber
Time (GMT) Event description
1 1328 Start data logger at 1 Hz2 1457 T2P on rig floor3 1511 Start lowering T2P downhole, pumps on4 1528 Stop at 1058 mbsl, pumps off5 1533 Start lowering probe6 1545 Stop at 1432 mbsl, pumps off7 1549 Start lowering probe8 1553 CDS lands in BHA, pumps off9 1554 Start penetration of T2P into sediment10 1558 End of T2P penetration, bit at BOH11 1559 Raise BHA 2 m off BOH12 1640 Pull T2P uphole slowly with wireline13 1648 Stop at 1058 mbsl, pumps off14 1651 Pull T2P uphole slowly with wireline15 1701 Disconnect wireline from CDS16 1704 Disconnect CDS from spacer17 1706 Disconnect spacer from CDS18 1708 T2P out of pipe19 1730 Download data from data logger
Proc. IODP | Volume 308 61

H. Long et al. Data report: penetrometer measurements
Table AT32. Event summary of T2P Deployment 11, Hole U1324B, 593.2 mbsf. (See table notes.)
Notes: Measurements taken 25 June 2005. GMT = Greenwich Mean Time, T2P = temperature/dual pressure probe, CDS = colleted delivery sys-tem, BHA = bottom-hole assembly.
Table AT33. Event summary of T2P Deployment 12, Hole U1324C, 50.0 mbsf. (See table notes.)
Notes: Measurements taken 26 June 2005. GMT = Greenwich Mean Time, T2P = temperature/dual pressure probe, CDS = colleted delivery sys-tem, BHA = bottom-hole assembly, BOH = bottom of hole.
Eventnumber
Time (GMT) Event description
1 1802 Start data logger at 1 Hz2 1818 T2P on rig floor3 1831 Start lowering T2P downhole, pumps on4 1842 Stop at 1068 mbsl, pumps off5 1845 Start lowering probe6 1850 Stop at 1510 mbsl, pumps off7 1856 Start lowering probe8 1858 CDS lands in BHA, pumps off9 1914 Pull T2P uphole slowly with wireline10 1925 Stop at 1067 mbsl, pumps off11 1928 Pull T2P uphole slowly with wireline12 1934 Disconnect wireline from CDS13 1938 Disconnect CDS from spacer14 1940 Disconnect spacer from CDS15 1946 T2P out of pipe16 2010 Download data from data logger
Eventnumber
Time (GMT) Event description
1 Start data logger at 1 Hz2 1044 T2P on rig floor3 1052 Start lowering T2P downhole, pumps on4 1109 Stop at 491 mbsl, pumps off5 1111 Start lowering probe6 1114 Stop at 741 mbsl, pumps off7 1119 Stop at 1057 mbsl, pumps off8 1122 Stop at 1095 mbsl, pumps off9 1128 Start lowering probe10 1129 CDS lands in BHA, pumps off11 1132 Start penetration of T2P into sediment12 1140 End of T2P penetration, bit on BOH13 1140 Raise BHA 4.5m off BOH14 1241 Pull T2P uphole slowly with wireline15 1244 Stop at 1057 mbsl, pumps off16 1248 Pull T2P uphole slowly with wireline17 1254 Stop at 741 mbsl, pumps off18 1256 Pull T2P uphole slowly with wireline19 1300 Stop at 491 mbsl, pumps off20 1302 Pull T2P uphole slowly with wireline21 Download data from data logger
Proc. IODP | Volume 308 62

H. Long et al. Data report: penetrometer measurements
Table AT34. Event summary of T2P Deployment 13, Hole U1324C, 100.0 mbsf. (See table notes.)
Notes: Measurements taken 26 June 2005. GMT = Greenwich Mean Time, T2P = temperature/dual pressure probe, CDS = colleted delivery sys-tem, BHA = bottom-hole assembly, BOH = bottom of hole.
Table AT35. Event summary of T2P Deployment 14, Hole U1324C, 150.0 mbsf. (See table notes.)
Notes: Measurements taken 26 June 2005. GMT = Greenwich Mean Time, T2P = temperature/dual pressure probe, CDS = colleted delivery sys-tem, BHA = bottom-hole assembly, BOH = bottom of hole.
Eventnumber
Time (GMT) Event description
1 1442 Start data logger at 1 Hz2 1618 T2P on rig floor3 1628 Start lowering T2P downhole, pumps on4 1644 Stop at 741 mbsl, pumps off5 1646 Start lowering probe6 1652 Stop at 1057 mbsl, pumps off7 1654 Start lowering probe8 1703 CDS lands in BHA, pumps off9 1704 Start penetration of T2P into sediment10 1705 End of T2P penetration, bit 1 m off BOH11 1706 Raise BHA 2 m off BOH12 1808 Pull T2P uphole slowly with wireline13 1811 Stop at 1057 mbsl, pumps off14 1813 Pull T2P uphole slowly with wireline15 1817 Stop at 741 mbsl, pumps off16 1819 Pull T2P uphole slowly with wireline17 1822 Stop at 491 mbsl, pumps off18 1824 Pull T2P uphole slowly with wireline19 1830 Disconnect wireline from CDS20 1834 Disconnect CDS from spacer21 1836 Disconnect spacer from CDS22 1836 T2P out of pipe23 Download data from data logger
Eventnumber
Time (GMT) Event description
1 Start data logger at 1 Hz2 2128 Stop at 491 mbsl, pumps off3 2130 Start lowering T2P4 2135 Stop at 741 mbsl, pumps off5 2137 Start lowering T2P6 2143 Stop at 1057 mbsl, pumps off7 2145 Start lowering T2P8 2149 Stop at 1195 mbsl, pumps off9 2152 Start lowering T2P10 2155 CDS lands in BHA, pumps off11 2156 Start penetration of T2P into sediment12 2157 End of T2P penetration, bit on BOH13 2157 Raise BHA 2.5 m off BOH14 2302 Pull T2P uphole slowly with wireline15 2309 Stop at 1057 mbsl, pumps off16 2314 Pull T2P uphole slowly with wireline17 2318 Stop at 741 mbsl, pumps off18 2321 Pull T2P uphole slowly with wireline19 2324 Stop at 491 mbsl, pumps off20 2326 Pull T2P uphole slowly with wireline21 Download data from data logger
Proc. IODP | Volume 308 63

H. Long et al. Data report: penetrometer measurements
Table AT36. Event summary of T2P Deployment 15, Hole U1324C, 200.0 mbsf. (See table notes.)
Notes: Measurements taken 27 June 2005. GMT = Greenwich Mean Time, T2P = temperature/dual pressure probe, CDS = colleted delivery sys-tem, BHA = bottom-hole assembly, BOH = bottom of hole.
Table AT37. Event summary of T2P Deployment 16, Hole U1324C, 300.0 mbsf. (See table notes.)
Notes: Measurements taken 27 June 2005. GMT = Greenwich Mean Time, T2P = temperature/dual pressure probe, BOH = bottom of hole, BHA =bottom-hole assembly.
Eventnumber
Time (GMT) Event description
1 0049 Start data logger at 1 Hz2 0156 T2P on rig floor3 0209 Start lowering T2P downhole, pumps on4 0217 Stop at 491 mbsl, pumps off5 0219 Start lowering probe6 0224 Stop at 741 mbsl, pumps off7 0226 Start lowering probe8 0232 Stop at 1057 mbsl, pumps off9 0235 Start lowering probe10 0240 Stop at 1245 mbsl, pumps off11 0243 Start lowering probe12 0247 CDS lands in BHA, pumps off13 0248 Start penetration of T2P into sediment14 0249 End of T2P penetration, bit 1 m off BOH15 0252 Raise BHA 4.5 m off BOH16 0353 Pull T2P uphole slowly with wireline17 0356 Stop at 1057 mbsl, pumps off18 0359 Pull T2P uphole slowly with wireline19 0402 Stop at 741 mbsl, pumps off20 0405 Pull T2P uphole slowly with wireline21 0407 Stop at 491 mbsl, pumps off22 0410 Pull T2P uphole slowly with wireline23 0415 Disconnect wireline from CDS24 0417 Disconnect CDS from spacer25 0419 Disconnect spacer from CDS26 0421 T2P out of pipe27 Download data from data logger
Eventnumber
Time (GMT) Event description
1 Start data logger at 1 Hz2 1118 Start lowering T2P downhole, pumps on3 1137 Stop at 491 mbsl, pumps off4 1139 Start lowering probe5 1143 Stop at 741 mbsl, pumps off6 1145 Start lowering probe7 1149 Stop at 1057 mbsl, pumps off8 1152 Start lowering probe9 1157 Stop at 1345 mbsl, pumps off10 1159 Start lowering probe11 1205 Start penetration of T2P into sediment12 1217 End of T2P penetration, bit on BOH13 1222 Raise BHA 4m off BOH14 1347 Pull T2P uphole slowly with wireline15 1354 Stop at 1057 mbsl, pumps off16 1357 Pull T2P uphole slowly with wireline17 1402 Stop at 741 mbsl, pumps off18 1404 Pull T2P uphole slowly with wireline19 1409 Stop at 491 mbsl, pumps off20 1411 Pull T2P uphole slowly with wireline21 Download data from data logger
Proc. IODP | Volume 308 64

H. Long et al. Data report: penetrometer measurements
Table AT38. Event summary of T2P Deployment 17, Hole U1322B, 42.0 mbsf. (See table notes.)
Notes: Measurements taken 28 June 2005. GMT = Greenwich Mean Time, T2P = temperature/dual pressure probe, CDS = colleted delivery sys-tem, BHA = bottom-hole assembly, BOH = bottom of hole.
Table AT39. Event summary of T2P Deployment 19, Hole U1322B, 134.3 mbsf. (See table notes.)
Notes: Measurements taken 29 June 2005. GMT = Greenwich Mean Time, T2P = temperature/dual pressure probe, CDS = colleted delivery sys-tem, BHA = bottom-hole assembly, BOH = bottom of hole.
Eventnumber
Time (GMT) Event description
1 1839 Start data logger at 1 Hz2 2010 T2P on rig floor3 2022 Start lowering T2P downhole, pumps on4 2029 Stop at 491 mbsl, pumps off5 2031 Start lowering probe6 2035 Stop at 741 mbsl, pumps off7 2037 Start lowering probe8 2043 Stop at 1321 mbsl, pumps off9 2046 Start lowering probe10 2048 Stop at 1351 mbsl, pumps off11 2050 Start lowering probe12 2057 CDS lands in BHA, pumps off13 2057 Start penetration of T2P into sediment14 2100 End of T2P penetration, bit on BOH15 2100 Raise BHA 4.0 m off BOH16 2207 Pull T2P uphole slowly with wireline17 2210 Stop at 1321 mbsl, pumps off18 2213 Pull T2P uphole slowly with wireline19 2219 Stop at 741 mbsl, pumps off20 2221 Pull T2P uphole slowly with wireline21 2226 Stop at 491 mbsl, pumps off22 2228 Pull T2P uphole slowly with wireline23 2232 Disconnect wireline from CDS24 2235 Disconnect CDS from spacer25 2237 Disconnect spacer from CDS26 2238 T2P out of pipe27 Download data from data logger
Eventnumber
Time (GMT) Event description
1 Start data logger at 1 Hz2 1230 Start lowering T2P downhole, pumps on3 1236 Stop at 491 mbsl, pumps off4 1238 Start lowering probe5 1244 Stop at 741 mbsl, pumps off6 1246 Start lowering probe7 1303 Stop at 1321 mbsl, pumps off8 1307 Start lowering probe9 1334 Stop at 1443 mbsl, pumps off10 1336 Start lowering probe11 1341 CDS lands in BHA, pumps off12 1352 Start penetration of T2P into sediment13 1354 End of T2P penetration, bit on BOH14 1354 Raise BHA 4.0 m off BOH15 1425 Pull T2P uphole slowly with wireline16 1429 Stop at 1321 mbsl, pumps off17 1431 Pull T2P uphole slowly with wireline18 1440 Stop at 741 mbsl, pumps off19 1441 Pull T2P uphole slowly with wireline20 1446 Stop at 491 mbsl, pumps off21 1447 Pull T2P uphole slowly with wireline22 Download data from data logger
Proc. IODP | Volume 308 65

H. Long et al. Data report: penetrometer measurements
Table AT40. Event summary of T2P Deployment 20, Hole U1322B, 157.8 mbsf. (See table notes.)
Notes: Measurements taken 29 June 2005. GMT = Greenwich Mean Time, T2P = temperature/dual pressure probe, CDS = colleted delivery sys-tem, BHA = bottom-hole assembly, BOH = bottom of hole.
Table AT41. Event summary of T2P Deployment 23, Hole U1322C, 150.0 mbsf. (See table notes.)
Notes: Measurements taken 1 July 2005. GMT = Greenwich Mean Time, T2P = temperature/dual pressure probe, CDS = colleted delivery system,BHA = bottom-hole assembly, BOH = bottom of hole.
Eventnumber
Time (GMT) Event description
1 Start data logger at 1 Hz2 1815 T2P on rig floor3 1838 Start lowering T2P downhole, pumps on4 1846 Stop at 491 mbsl, pumps off5 1849 Start lowering probe6 1854 Stop at 741 mbsl, pumps off7 1857 Start lowering probe8 1905 Stop at 1321 mbsl, pumps off9 1908 Start lowering probe10 1913 Stop at 1467 mbsl, pumps off11 1919 Start lowering probe12 1936 CDS lands in BHA, pumps off13 1936 Start penetration of T2P into sediment14 1937 End of T2P penetration, bit on BOH15 1937 Raise BHA 4.0 m off BOH16 2043 Pull T2P uphole slowly with wireline17 2110 Disconnect wireline from CDS18 2113 Disconnect CDS from spacer19 2114 Disconnect spacer from CDS20 2215 T2P out of pipe21 Download data from data logger
Eventnumber
Time (GMT) Event description
1 Start data logger at 1 Hz2 0651 T2P on rig floor3 0701 Start lowering T2P downhole, pumps on4 0709 Stop at 491 mbsl, pumps off5 0712 Start lowering probe6 0717 Stop at 741 mbsl, pumps off7 0719 Start lowering probe8 0729 Stop at 1321 mbsl, pumps off9 0743 Start lowering probe10 0752 Stop at 1459 mbsl, pumps off11 0754 Start lowering probe12 0758 CDS lands in BHA, pumps off13 0758 Start penetration of T2P into sediment14 0802 End of T2P penetration, bit 1 m off BOH15 0803 Raise BHA 4.0 m off BOH16 0905 Pull T2P uphole slowly with wireline17 0912 Stop at 1321 mbsl, pumps off18 0914 Pull T2P uphole slowly with wireline19 0924 Stop at 741 mbsl, pumps off20 0926 Pull T2P uphole slowly with wireline21 0932 Stop at 491 mbsl, pumps off22 0934 Pull T2P uphole slowly with wireline23 Download data from data logger
Proc. IODP | Volume 308 66

H. Long et al. Data report: penetrometer measurements
Table AT42. Event summary of T2P Deployment 24, Hole U1322C, 200.0 mbsf. (See table notes.)
Notes: Measurements taken 1 July 2005. GMT = Greenwich Mean Time, CDS = colleted delivery system, BHA = bottom-hole assembly, T2P =temperature/dual pressure probe, BOH = bottom of hole.
Table AT43. Event summary of T2P Deployment 25, Hole U1322D, 40.0 mbsf. (See table notes.)
Notes: Measurements taken 2 July 2005. GMT = Greenwich Mean Time, T2P = temperature/dual pressure probe, CDS = colleted delivery system,BHA = bottom-hole assembly, BOH = bottom of hole.
Eventnumber
Time (GMT) Event description
1 1201 Stop at 491 mbsl for 2 min2 1208 Stop at 741 mbsl for 2.5 min3 1222 Stop at 1321 mbsl for 3 min4 1226 Stop at 1367 mbsl for 7 min5 1239 Stop at 1509 mbsl, pumps off6 1212 Start lowering probe7 1248 CDS lands in BHA8 1249 Lowering BHA, start penetration9 1251 End of T2P penetration, bit 1 m off BOH10 1251 Raise BHA 5 m off BOH11 1351 Pull T2P uphole slowly with wireline12 1357 Stop at 1321 mbsl for 2.5 min, pumps off13 1409 Stop at 741 mbsl for 2 min, pumps off14 1414 Stop at 491 mbsl for 3 min, pumps off15 1416 Pull T2P uphole slowly with wireline
Eventnumber
Time (GMT) Event description
1 Start data logger at 1 Hz2 0206 Start lowering T2P downhole, pumps on3 0214 Stop at 491 mbsl, pumps off4 0221 Stop at 741 mbsl, pumps off5 0232 Stop at 1321 mbsl, pumps off6 0238 Stop at 1349 mbsl, pumps off7 0240 Start lowering probe8 0245 CDS lands in BHA, pumps off9 0246 Start penetration of T2P into sediment10 0246 End of T2P penetration, bit 0.8 m off BOH11 0246 Raise BHA 4.0 m off BOH12 0349 Pull T2P uphole slowly with wireline13 0352 Stop at 1321 mbsl, pumps off14 0355 Pull T2P uphole slowly with wireline15 0402 Stop at 741 mbsl, pumps off16 0404 Pull T2P uphole slowly with wireline17 0408 Stop at 491 mbsl, pumps off18 0410 Pull T2P uphole slowly with wireline19 Download data from data logger
Proc. IODP | Volume 308 67

H. Long et al. Data report: penetrometer measurements
Table AT44. Event summary of T2P Deployment 26, Hole U1322D, 70.0 mbsf. (See table notes.)
Notes: Measurements taken 2 July 2005. GMT = Greenwich Mean Time, T2P = temperature/dual pressure probe, CDS = colleted delivery system,BHA = bottom-hole assembly, BOH = bottom of hole.
Table AT45. Event summary of T2P Deployment 27, Hole U1322D, 100.0 mbsf. (See table notes.)
Notes: Measurements taken 2 July 2005. GMT = Greenwich Mean Time, T2P = temperature/dual pressure probe, CDS = colleted delivery system,BHA = bottom-hole assembly, BOH = bottom of hole.
Table AT46. Event summary of T2P Deployment 28, Hole U1322D, 134.0 mbsf. (See table notes.)
Notes: Measurements taken 2 July 2005. GMT = Greenwich Mean Time, T2P = temperature/dual pressure probe.
Eventnumber
Time (GMT) Event description
1 Start data logger at 1 Hz2 0632 T2P on rig floor3 0656 Stop at 741 mbsl, pumps off4 0707 Stop at 1321 mbsl, pumps off5 0718 Stop at 1386 mbsl, pumps off6 0720 Start lowering probe7 0724 CDS lands in BHA, pumps off8 0726 Start penetration of T2P into sediment9 0727 End of T2P penetration, bit 0.8 m off BOH10 0727 Raise BHA 4.0 m off BOH11 0814 Pull T2P uphole slowly with wireline12 0816 Stop at 1321 mbsl, pumps off13 0826 Stop at 741 mbsl, pumps off14 0832 Stop at 491 mbsl, pumps off15 Download data from data logger
Eventnumber
Time (GMT) Event description
1 Start data logger at 1 Hz2 1104 Stop at 491 mbsl, pumps off3 1115 Stop at 741 mbsl, pumps off4 1115 Stop at 1321 mbsl, pumps off5 1124 Stop at 1409 mbsl, pumps off6 1126 Start lowering T2P7 1129 CDS lands in BHA, pumps off8 1129 Start penetration of T2P into sediment9 1130 End of T2P penetration, bit 0.8 m off BOH10 1130 Raise BHA 4.0m off BOH11 1216 Pull T2P uphole slowly with wireline12 1219 Stop at 1321 mbsl, pumps off13 1228 Stop at 741 mbsl, pumps off14 1235 Stop at 491 mbsl, pumps off15 Download data from data logger
Eventnumber
Time (GMT) Event description
1 Start data logger at 1 Hz2 1452 T2P on rig floor3 1510 Stop at 491 mbsl, pumps off4 1512 Start lowering probe5 1515 Stop at 741 mbsl, pumps off6 1516 Start lowering probe7 Download data from data logger
Proc. IODP | Volume 308 68