DATA REPORT: PARTICLE SIZE ANALYSIS OF SEDIMENTS IN ...
20
Proc. IODP | Volume 308 doi:10.2204/iodp.proc.308.205.2008 Flemings, P.B., Behrmann, J.H., John, C.M., and the Expedition 308 Scientists Proceedings of the Integrated Ocean Drilling Program, Volume 308 Abstract We conducted particle size analyses on 340 samples from Inte- grated Ocean Drilling Program Expedition 308 Sites U1324 (246 samples) and U1322 (94 samples) in the Ursa Basin (Gulf of Mex- ico) and found two characteristic lithologies: silty clay and clayey silt. Silty clays are composed of ~60% (±10%) clay-sized particles by weight, ~40% silt-sized particles by weight, and <1% sand- sized particles by weight. Clayey silts are generally composed of ~30% clay-sized particles by weight, 65%–70% silt-sized particles by weight, and 0%–5% sand-sized particles by weight. Site U1322 is dominated by silty clays with little particle size variation throughout the cored interval (0–235 meters below seafloor [mbsf]). At Site U1324, both lithologies occur where the lower- most section (~360–608 mbsf) is dominated by clayey silt and the uppermost section (0–360 mbsf) is dominated by silty clay. Introduction Integrated Ocean Drilling Program (IODP) Expedition 308 was aimed at understanding how geology, pressure, and stress com- bine to control overpressure and fluid flow on the Gulf of Mexico continental slope (see the “Expedition 308 summary” chapter). We focused on two areas: a reference site, Brazos-Trinity Basin IV, and an overpressured area, the Ursa Basin. The Ursa Basin is lo- cated ~200 km southeast of Louisiana (USA) in ~1000 m of water directly downdip of rapid Pleistocene sedimentation from the Mississippi River system (Fig. F1). In the uppermost 1000 meters below seafloor (mbsf) in the Ursa Basin, a sand-rich permeable unit, the Blue Unit, was buried rapidly and asymmetrically by an eastward-thinning mud-rich overburden (Fig. F2) (Winker and Booth, 2000; Winker and Shipp, 2002; Sawyer et al., 2007b; see the “Expedition 308 summary” chapter). At Site U1324 in the Ursa Basin, we cored a 608 m thick succes- sion, including the eastern levee of the Southwest Pass Canyon, overlying distal turbidites, and hemipelagic drape (see the “Site U1324” chapter). At Site U1322, we cored a stacked succession of mass transport deposits, distal turbidites, and hemipelagic drape (see the “Site U1322” chapter). In general, these sediments were identified by shipboard sedimentologists as predominantly fine grained (silt and clay) with little sand (see the “Expedition 308 summary” chapter). However, shipboard analyses could not quan- Data report: particle size analysis of sediments in the Ursa Basin, IODP Expedition 308 Sites U1324 and U1322, northern Gulf of Mexico 1 Derek E. Sawyer, 2 Ryan Jacoby, 3 Peter Flemings, 2 and John T. Germaine 4 Chapter contents Abstract . . . . . . . . . . . . . . . . . . . . . . . . . . . . . . . 1 Introduction . . . . . . . . . . . . . . . . . . . . . . . . . . . 1 Methods . . . . . . . . . . . . . . . . . . . . . . . . . . . . . . 2 Principles of hydrometer analysis . . . . . . . . . . . 2 Samples . . . . . . . . . . . . . . . . . . . . . . . . . . . . . . . 3 Sample preparation (Penn State) . . . . . . . . . . . 3 Hydrometer analysis (Penn State) . . . . . . . . . . 3 Sample preparation (MIT) . . . . . . . . . . . . . . . . 3 Hydrometer analysis (MIT) . . . . . . . . . . . . . . . . 4 Results . . . . . . . . . . . . . . . . . . . . . . . . . . . . . . . . 4 Reproducibility . . . . . . . . . . . . . . . . . . . . . . . . . 4 Acknowledgments . . . . . . . . . . . . . . . . . . . . . . . 4 References . . . . . . . . . . . . . . . . . . . . . . . . . . . . . 4 Figures . . . . . . . . . . . . . . . . . . . . . . . . . . . . . . . . 6 Tables . . . . . . . . . . . . . . . . . . . . . . . . . . . . . . . . 17 1 Sawyer, D.E., Jacoby, R., Flemings, P., and Germaine, J.T., 2008. Data report: particle size analysis of sediments in the Ursa Basin, IODP Expedition 308 Sites U1324 and U1322, northern Gulf of Mexico. In Flemings, P.B., Behrmann, J.H., John, C.M., and the Expedition 308 Scientists, Proc. IODP, 308: College Station, TX (Integrated Ocean Drilling Program Management International, Inc.). doi:10.2204/iodp.proc.308.205.2008 2 Jackson School of Geosciences, The University of Texas at Austin, Austin TX 78712-0254, USA. Correspondence author: [email protected] 3 Department of Geosciences, The Pennsylvania State University, University Park PA 16802, USA. 4 Department of Civil and Environmental Engineering, The Massachusetts Institute of Technology, Cambridge MA 02139, USA.
Transcript of DATA REPORT: PARTICLE SIZE ANALYSIS OF SEDIMENTS IN ...

Proc. IODP | Volume 308
Flemings, P.B., Behrmann, J.H., John, C.M., and the Expedition 308 ScientistsProceedings of the Integrated Ocean Drilling Program, Volume 308
Data report: particle size analysis of sediments in the Ursa Basin, IODP Expedition 308 Sites U1324 and U1322,
northern Gulf of Mexico1
Derek E. Sawyer,2 Ryan Jacoby,3 Peter Flemings,2 and John T. Germaine4
Chapter contents
Abstract . . . . . . . . . . . . . . . . . . . . . . . . . . . . . . . 1
Introduction . . . . . . . . . . . . . . . . . . . . . . . . . . . 1
Methods . . . . . . . . . . . . . . . . . . . . . . . . . . . . . . 2
Principles of hydrometer analysis . . . . . . . . . . . 2
Samples . . . . . . . . . . . . . . . . . . . . . . . . . . . . . . . 3
Sample preparation (Penn State) . . . . . . . . . . . 3
Hydrometer analysis (Penn State) . . . . . . . . . . 3
Sample preparation (MIT) . . . . . . . . . . . . . . . . 3
Hydrometer analysis (MIT) . . . . . . . . . . . . . . . . 4
Results . . . . . . . . . . . . . . . . . . . . . . . . . . . . . . . . 4
Reproducibility . . . . . . . . . . . . . . . . . . . . . . . . . 4
Acknowledgments. . . . . . . . . . . . . . . . . . . . . . . 4
References . . . . . . . . . . . . . . . . . . . . . . . . . . . . . 4
Figures . . . . . . . . . . . . . . . . . . . . . . . . . . . . . . . . 6
Tables. . . . . . . . . . . . . . . . . . . . . . . . . . . . . . . . 17
1Sawyer, D.E., Jacoby, R., Flemings, P., and Germaine, J.T., 2008. Data report: particle size analysis of sediments in the Ursa Basin, IODP Expedition 308 Sites U1324 and U1322, northern Gulf of Mexico. In Flemings, P.B., Behrmann, J.H., John, C.M., and the Expedition 308 Scientists, Proc. IODP, 308: College Station, TX (Integrated Ocean Drilling Program Management International, Inc.). doi:10.2204/iodp.proc.308.205.20082Jackson School of Geosciences, The University of Texas at Austin, Austin TX 78712-0254, USA. Correspondence author: [email protected] of Geosciences, The Pennsylvania State University, University Park PA 16802, USA.4Department of Civil and Environmental Engineering, The Massachusetts Institute of Technology, Cambridge MA 02139, USA.
AbstractWe conducted particle size analyses on 340 samples from Inte-grated Ocean Drilling Program Expedition 308 Sites U1324 (246samples) and U1322 (94 samples) in the Ursa Basin (Gulf of Mex-ico) and found two characteristic lithologies: silty clay and clayeysilt. Silty clays are composed of ~60% (±10%) clay-sized particlesby weight, ~40% silt-sized particles by weight, and <1% sand-sized particles by weight. Clayey silts are generally composed of~30% clay-sized particles by weight, 65%–70% silt-sized particlesby weight, and 0%–5% sand-sized particles by weight. Site U1322is dominated by silty clays with little particle size variationthroughout the cored interval (0–235 meters below seafloor[mbsf]). At Site U1324, both lithologies occur where the lower-most section (~360–608 mbsf) is dominated by clayey silt and theuppermost section (0–360 mbsf) is dominated by silty clay.
IntroductionIntegrated Ocean Drilling Program (IODP) Expedition 308 wasaimed at understanding how geology, pressure, and stress com-bine to control overpressure and fluid flow on the Gulf of Mexicocontinental slope (see the “Expedition 308 summary” chapter).We focused on two areas: a reference site, Brazos-Trinity Basin IV,and an overpressured area, the Ursa Basin. The Ursa Basin is lo-cated ~200 km southeast of Louisiana (USA) in ~1000 m of waterdirectly downdip of rapid Pleistocene sedimentation from theMississippi River system (Fig. F1). In the uppermost 1000 metersbelow seafloor (mbsf) in the Ursa Basin, a sand-rich permeableunit, the Blue Unit, was buried rapidly and asymmetrically by aneastward-thinning mud-rich overburden (Fig. F2) (Winker andBooth, 2000; Winker and Shipp, 2002; Sawyer et al., 2007b; seethe “Expedition 308 summary” chapter).
At Site U1324 in the Ursa Basin, we cored a 608 m thick succes-sion, including the eastern levee of the Southwest Pass Canyon,overlying distal turbidites, and hemipelagic drape (see the “SiteU1324” chapter). At Site U1322, we cored a stacked succession ofmass transport deposits, distal turbidites, and hemipelagic drape(see the “Site U1322” chapter). In general, these sediments wereidentified by shipboard sedimentologists as predominantly finegrained (silt and clay) with little sand (see the “Expedition 308summary” chapter). However, shipboard analyses could not quan-
doi:10.2204/iodp.proc.308.205.2008

D.E. Sawyer et al. Data report: particle size analysis of sediments
tify the relative proportion of clay, silt, and sand,which also prevented proper lithologic classification.
Most lithologic classification schemes for clastic sed-iments rely on determining the relative percentageof clay-sized particles, silt-sized particles, and sand-sized particles (Wentworth, 1922). These texturaldata are then used to name the rock/sediment type,for which numerous conventions exist (Shepard,1954; Krumbein and Sloss, 1963; Folk, 1968; Blatt etal., 1980; Potter et al., 1980). “Mud” is a generic termreferring to sediments composed predominantly ofparticles finer than 63 µm, which includes silt- andclay-sized particles (Aplin et al., 1999; Potter et al.,2005; Yang and Aplin, 2007). In the Ursa Basin, weencountered sediments that were almost exclusivelycomposed of particles finer than 63 µm (see the “Ex-pedition 308 summary” chapter). To avoid namingall samples “mud” in this report, we adopted theShepard (1954) classification (Fig. F3).
Our objective was to create a downcore profile ofparticle size at both sites, which is critical for perme-ability constraints in numerical fluid flow models,and which will help illuminate the stratigraphic his-tory of the Ursa Basin. We analyzed 340 samples (Ta-bles T1, T2), which were primarily from 10 cm3 plugsamples taken shipboard and whole-core trimmingsfrom constant-rate-of-strain (CRS) consolidationtests (see Long et al.). We employed standard wet-sieve and hydrometer techniques to measure particlesize distribution and the relative percentages of sand,silt, and clay in each sample. Here we describe ourexperimental background and procedure and presentthe overall results. Individual data files for each exper-iment can be found in “Supplementary material.”
MethodsSamples were analyzed at the Pennsylvania StateUniversity (Penn State) and the Massachusetts Insti-tute of Technology (MIT), using the standard hy-drometer method (ASTM D422-63, 2003). We chosethis method because we have considerable experi-ence using this technique on fine-grained soils, themethod is capable of processing large samples (>20g) with no minimum particle size restrictions, and itis internationally recognized as a standard in theAmerican Standard for Testing and Materials (ASTMD422-63; ASTM International, 2003) and in the Brit-ish Standard Institution (BS 1377; British StandardsInstitution, 1990).
Specific gravity was determined on a representativesubset of samples at MIT according to ASTM Stan-dard D854-06 (ASTM International, 2006), which is awater pycnometer method. In this method, the massof a pycnometer (of known volume) that is filled
Proc. IODP | Volume 308
with deaired water and a small amount of soil arecompared with the same pycnometer filled onlywith deaired water.
The hydrometer method used here is in general ac-cordance with ASTM D422-63 (ASTM International,2003) guidelines, but we describe the slightly differ-ent approaches taken at Penn State and MIT below.In addition to the hydrometer method, other au-thors have used laser particle and pipette analyses formeasuring particle size distribution in mud-rich sam-ples (Folk, 1968; McCave and Syvitski, 1991; Lewisand McConchie, 1994; Loizeau et al., 1994; Cramp etal., 1997; Konert and Vandenberghe, 1997).
Principles of hydrometer analysis
The physical principles of sedimentation underlyingthe hydrometer analysis are presented in a numberof texts including Das (2002); we briefly review themhere. The hydrometer analysis applies Stokes’s law,which governs the terminal velocity at which spheri-cal particles settle through a column of fluid (Craig,1992). Stokes’s law assumes particles that (1) arerigid, spherical, and smooth; (2) have similar density;(3) are separated from each other; (4) do not interactduring sedimentation; and (5) are large enough sothat settlement is not governed by Brownian motion.The law is also strictly applicable to slow fluid move-ments that display laminar flow patterns (i.e., Reyn-olds number = <1) (Wen et al., 2002).
Hydrometer analysis begins after thoroughly mixingthe sediment and water, after which particles settleout of the water column according to Stokes’s law.The density of a sediment-water suspension dependson the concentration and specific gravity of the sedi-ments present in the mixture. If the suspension isallowed to stand, particles will settle out of the sus-pension and the density of the sediment-watersuspension will decrease. A hydrometer measures thedensity of the suspension at a known depth belowthe surface.
The two basic calculations made during a hydrome-ter analysis are the particle diameter at a specifictime and depth and the percentage of the originalsample mass still left in suspension. We calculate theparticle diameter according to the following equation:
, (1)
where
D = equivalent sedimentation diameter of particle (millimeters),
D 30ηGs 1–( )
-------------------- Lt---=
2

D.E. Sawyer et al. Data report: particle size analysis of sediments
η = viscosity of water (grams seconds per square centimeter),
Gs= specific gravity of sediment,L = effective depth measured from water surface to
center of gravity of hydrometer bulb (centime-ters), and
t = time measured from start of sedimentation (seconds).
The percentage of particles remaining in suspen-sion finer than particle diameter, D, is
, (2)
where
Gs= specific gravity of sediment,V = total water-sediment volume (1000 mL),M = dry sample mass (grams),Rh= corrected hydrometer reading of slurry mix-
ture (grams per liter), andB = hydrometer reading of reference mixture of
dispersing agent and distilled water (grams per liter).
SamplesTwo types of samples were used in this study: ship-board samples taken approximately every 1–2 m(9–40 g) and trimmings from whole-core geotechnicalsamples (20–50 g) that were used for shore-basedconsolidation tests (see Long et al.).
Sample preparation (Penn State)
Samples were prepared differently at each university,with prehydrometer analysis sand content obtainedonly at Penn State using a wet-sieve analysis (sieve-hydrometer method). Samples were first manuallydisaggregated and placed in a drying oven at 55°Cfor at least 16 h before recording dry masses. Driedsamples were mixed with 5 g of dispersing agent (so-dium hexametaphosphate) and ~200 mL of deion-ized water and tempered for another 24–48 h. Themixture was further disaggregated for 2 min usingthe ASTM-recommended Hamilton-Beach maltmixer (ASTM D422-63; ASTM International 2003).
To measure sand content of samples, the slurry waswashed with deionized water through a 62.5 µmsieve and the retained portion was dried andweighed. This process provided the percentage ofsand by weight for each sample processed at PennState.
%FinerGs
Gs 1–--------------- × V
M----- ×
Rh B–( )10
--------------------=
Proc. IODP | Volume 308
The remaining fine-grained slurry was poured into a1000 mL plastic cylinder and filled with deionizedwater to create a solution of 1000 mL. We generallyprepared 8–16 cylinders before initiating the hy-drometer analysis. One cylinder containing onlydistilled water and 5 g of dispersing agent was alsoprepared so that reference hydrometer readingscould be made and then used to make water densitycorrections (as described below). A total of 311 sam-ples were analyzed at Penn State (Tables T1, T2). Inaddition, seven of the samples taken from theremnants of whole-core samples were prepared forreproducibility experiments, the results of which wediscuss below.
Hydrometer analysis (Penn State)
Prior to the start of each experiment, each cylinderwas mixed for 2 min using a plunging rod. Once therod was removed, the stopwatch was started and thehydrometer was inserted and steadied. Readingswere made at 15 and 30 s without removing the hy-drometer. After the 30 s reading (and each subse-quent reading), the hydrometer was removed, rinsedin deionized water, and wiped dry before obtainingreadings at 1, 2, 4, 8, 16, and up to at least 1024 min.Hydrometer readings were recorded to the nearest0.1 g/L.
An example data sheet and plot are given in FiguresF4 and F5, respectively. We made continuous hy-drometer readings on the reference mixture, B,which contained distilled water and dispersingagent. Reading B was then subtracted from the sus-pension reading, Rh, in Equation 2. We continuallymonitored temperature in the laboratory and up-dated water viscosity, η, accordingly. The effectivedepth, L, in Equation 1, is hydrometer-specific andwas calculated according to a prescribed calibrationprocedure (Lewis and McConchie, 1994).
Specific gravity of the sample, Gs, in Equations 1 and2, was determined on a representative subset of 19samples obtained at MIT in general accordance withASTM Standard D854-06 (ASTM International,2006). These measurements are presented in TableT4. Measurements ranged between 2.65 and 2.77.For samples where no specific gravity measurementswere made, we used an average value of 2.70 for eval-uating Equations 1 and 2.
Sample preparation (MIT)Air-dried samples were mixed with 5 g of sodiumhexametaphosphate and distilled water. The solu-
3

D.E. Sawyer et al. Data report: particle size analysis of sediments
tion was allowed to temper for 16 h before it wasmixed in the ASTM-recommended Hamilton Beachmalt mixer for 1 min and transferred to a 1000 mLcylinder. Distilled water was added to the cylinder tocreate a 1000 mL suspension, and the tube wasplaced in a constant-temperature water bath. Onlyone cylinder was prepared at a time before startingthe hydrometer analysis. A total of 29 samples wereanalyzed using this method (Tables T1, T2).
Hydrometer analysis (MIT)The prepared suspension was mixed thoroughly witha plunging rod for 1 min. The removal of the plung-ing rod marked the beginning of the sedimentationprocess. Two sets of hydrometer readings were ob-tained for the first 2 min (4, 14, 30, 60, 90, and 120s) of sedimentation with the hydrometer remainingin the suspension. Readings were recorded to 0.2 of agraduation by estimating five increments betweengraduations. The slurry was then remixed, and addi-tional readings were made at 2, 4, 8, 16, and 32 min,for up to 2 days. At the end of the experiment, theslurry was poured into an evaporating dish and driedin an oven to obtain the final mass of sediment anddispersing agent. The basic measurements and con-stants in this method are the same as described forPenn State in Figures F4 and F5, respectively.
ResultsWe conducted particle size distribution curves for340 samples at Penn State and MIT. Sand, silt, andclay percentages are given in Table T1 for Site U1322and in Table T2 for Site U1324. Data sheets andcurves similar to Figures F4 and F5 for each sampleare available in Excel format in “Supplementarymaterial.”
We plot the downcore profile of percent sand, silt, andclay against gamma ray and resistivity logs for SitesU1322 and U1324 in Figures F6 and F7, respectively.
We plot sand, silt, and clay percentages for all sam-ples from both sites on a single classification chart inFigure F8. In Figure F9, we plot results for SitesU1322 and U1324 separately. Nearly all samplesfrom Site U1322 plot as silty clay, whereas samplesfrom Site U1324 are scattered in a wide range in bothsilty clay and clayey silt fields. The four sand samplesare from Site U1324 (~305 mbsf) (Fig. F7).
From our particle size analyses of the Ursa Basin sam-ples, we define two characteristic lithologies: siltyclay and clayey silt. Silty clays are generally com-posed of ~60% (±10%) clay-sized particles by weight,~40% silt-sized particles by weight, and <1% sand-
Proc. IODP | Volume 308
sized particles by weight. Ursa Basin clayey silts aregenerally composed of ~65%–70% silt-sized particlesby weight, 30% clay-sized particles by weight, and0%–5% sand-sized particles by weight.
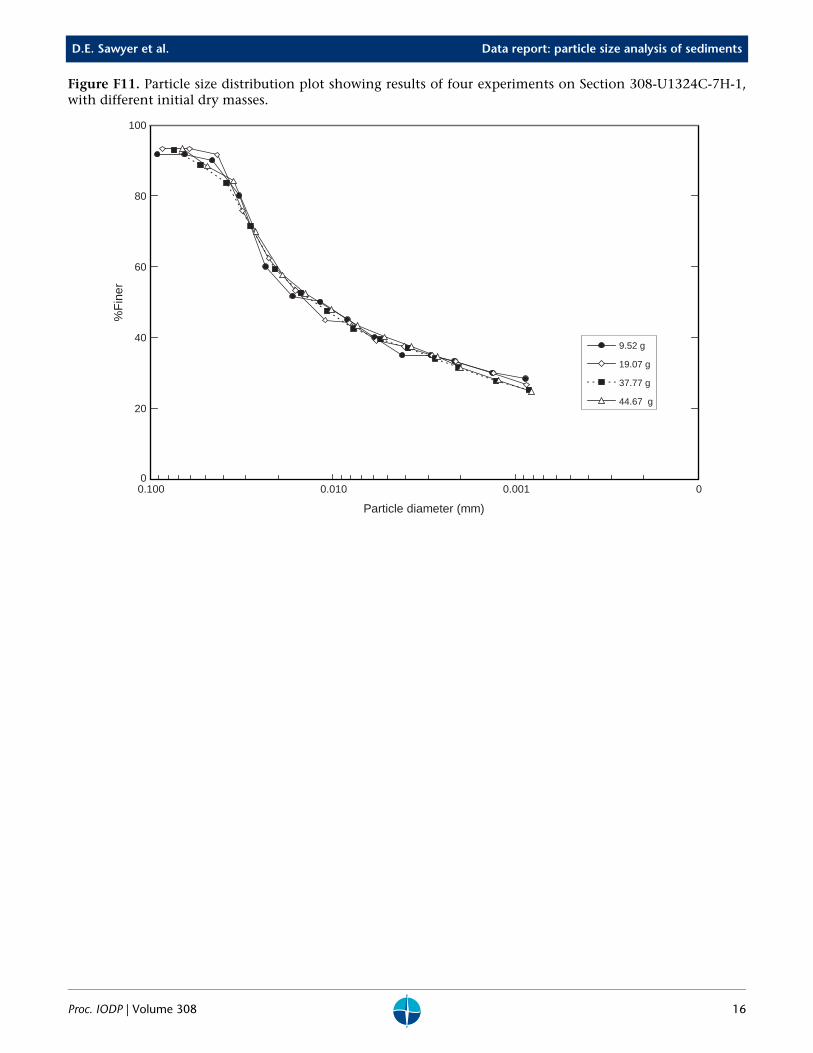
ReproducibilityWe used samples from whole-core trimmings to runrepeat experiments from whole-core trimmings atPenn State to gauge the reproducibility of our experi-ments. We conducted two types of tests: multiple hy-drometer runs on a single sample and hydrometerruns on a single sample in which we varied the ini-tial dry mass. We show an example of each type oftest in Figures F10 and F11.
Samples were prepared by “cone and quartering” toensure homogeneity. In this process, sediment ismixed and piled into a cone that is then divided intoquarters, and opposite quarters are combined.
The first-order results of our experiments show thatparticle size distribution curves from both types oftests generally match each other (Figs. F10, F11). Astatistical treatment of the reproducibility experi-ments was conducted by the Statistical ConsultingCenter at Penn State. They applied a cubic-splineregression method and concluded that our experi-ments are fairly consistent and reproducible.
We did not test the reproducibility of the experi-ments performed at MIT. However, the equipment,materials, and procedures used at MIT were verysimilar to those used at Penn State. Furthermore, wedistinguish the MIT experiments as red squares inFigures F6 and F7 to show that the MIT experimentslie within the expected range of results.
AcknowledgmentsAll samples used in this study were collected duringIODP Expedition 308. Funding for this research wasprovided by the U.S. Science Support Program, ad-ministered by the Consortium for Ocean Leadership(formerly Joint Oceanographic Institutions). This re-search was also sponsored by the Petroleum ResearchFund (PRF 44476-AC8). We thank the crew and sci-ence party from Expedition 308. H. Nelson and L.Arnold provided help with formatting data sheets,figures, and digital files. We thank Y. Feng and T.Yang for statistical analysis of reproducibility tests.We thank I.W. Aiello for a helpful review.
ReferencesAplin, A.C., Fleet, A.J., and Macquaker, J.H.S., 1999. Muds
and mudstones: physical and fluid flow properties. In
4

D.E. Sawyer et al. Data report: particle size analysis of sediments
Aplin, A.C., Fleet, A.J., and Macquaker, J.H.S. (Eds.), Muds and Mudstones: Physical and Fluid Flow Properties. Geol. Soc. Spec. Pub., 158:1–8.
ASTM International, 2003. Standard test method for parti-cle-size analysis of soils (Standard D422-63[2002]). In Annual Book of ASTM Standards (Vol. 04.08): Soil and Rock (I): West Conshohocken, PA (Am. Soc. Testing and Mater.), 10–17.
ASTM International, 2006. Standard test methods for spe-cific gravity of soil solids by water pycnometer (D854-06). In Annual Book of ASTM Standards (Vol 04.08): Soil and Rock (I): West Conshohocken, PA (Am. Soc. Testing and Mater.).
Blatt, H., Middleton, G., and Murray, R., 1980. Origin of Sedimentary Rocks (2nd ed.): Englewood Cliffs, NJ (Pren-tice-Hall).
British Standards Institution, 1990. Methods of Test for Soils for Civil Engineering Purposes (Pt. 2): Classification Tests (Rep. BS 1377): London (British Standards Inst.).
Craig, R.F., 1992. Soil Mechanics (5th ed.): London (Chap-man and Hall).
Cramp, A., Lee, S.V., Herniman, J., Hiscott, R.N., Manley, P.L., Piper, D.J.W., Deptuck, M., Johnston, S.K., and Black, K.S., 1997. Data report: interlaboratory compari-son of sediment grain-sizing techniques: data from Amazon Fan upper levee complex sediments. In Flood, R.D., Piper, D.J.W., Klaus, A., and Peterson, L.C. (Eds.), Proc. ODP, Sci. Results, 155: College Station, TX (Ocean Drilling Program), 217–228. doi:10.2973/odp.proc.sr.155.242.1997
Das, B.M., 2002. Principles of Geotechnical Engineering (5th ed.): St. Paul, MN (Brooks Cole).
Folk, R.L., 1968. Petrology of Sedimentary Rocks: Austin, TX (Univ. Texas).
Konert, M., and Vandenberghe, J., 1997. Comparison of laser grain size analysis with pipette and sieve analysis: a solution for the underestimation of the clay fraction. Sedimentology, 44(3):523–535. doi:10.1046/j.1365-3091.1997.d01-38.x
Krumbein, W.C., and Sloss, L.L., 1963. Stratigraphy and Sed-imentation (2nd ed.): San Francisco, CA (W. H. Freeman and Co.).
Lewis, D.W., and McConchie, D.M., 1994. Analytical Sedi-mentology: New York (Chapman and Hall).
Loizeau, J.-L., Arbouille, D., Santiago, S., and Vernet, J.-P., 1994. Evaluation of a wide range laser diffraction grain size analyser for use with sediments. Sedimentology, 41(2):353–361. doi:10.1111/j.1365-3091.1994.tb01410.x
Proc. IODP | Volume 308
McCave, I.N., and Syvitski, J.P.M., 1991. Principles and methods of geological particle size analysis. In Syvitski, J.P.M. (Ed.), Principles, Methods, and Application of Particle Size Analysis: New York (Cambridge Univ. Press), 3–21.
Potter, P.E., Maynard, J.B., and Depetris, P.J., 2005. Mud and Mudstones: Introduction and Overview: Berlin (Springer-Verlag).
Potter, P.E., Maynard, J.B., and Pryor, W.A., 1980. Sedimen-tology of Shale: Berlin (Springer-Verlag).
Sawyer, D.E., Flemings, P.B., and Dugan, B., 2007a. Lateral variations in core, log, and seismic attributes of a mass transport complex in the Ursa Region, IODP Expedition 308, Northern Gulf of Mexico [paper presented at the Offshore Technology Conference, 5–8 May 2007, Hous-ton, TX].
Sawyer, D.E., Flemings, P.B., Shipp, R.C., and Winker, C.D., 2007b. Seismic geomorphology, lithology, and evolu-tion of the late Pleistocene Mars-Ursa turbidite region, Mississippi Canyon area, northern Gulf of Mexico. AAPG Bull., Vol. 91(2):215–234. doi:10.1306/08290605190
Shepard, F.P., 1954. Nomenclature based on sand-silt-clay ratios. J. Sediment. Petrol., 24:151–158.
Wen, B., Aydin, A., and Duzgoren-Aydin, S., 2002. A com-parative study of particle size analyses by sieve-hydrom-eter and laser diffraction methods. Geotech. Test. J., 25(4):434–442.
Wentworth, C.K., 1922. A scale of grade and class terms of clastic sediments. J. Geol., 30:377–392.
Winker, C.D., and Booth, J.R., 2000. Sedimentary dynam-ics of the salt-dominated continental slope, Gulf of Mexico: integration of observations from the seafloor, near-surface, and deep subsurface. Deep-Water Reservoirs of the World: Proc. GCSSEPM 20th Annu. Res. Conf., 1059–1086.
Winker, C.D., and Shipp, R.C., 2002. Sequence strati-graphic framework for prediction of shallow water flow in the greater Mars-Ursa area, Mississippi Canyon area, Gulf of Mexico continental slope [22nd Annual GCSSEPM Foundation Bob F. Perkins Research Confer-ence, Houston, TX, 8–11 December, 2002]. (Abstract) http://www.gcssepm.org/pubs/2002_ab_56.htm
Yang, Y., and Aplin, A.C., 2007. Permeability and petro-physical properties of 30 natural mudstones. J. Geophys. Res., 112(B3):B03206. doi:10.1029/2005JB004243
Initial receipt: 20 December 2007Acceptance: 28 April 2008Publication: 13 November 2008MS 308-205
5

D.E. Sawyer et al. Data report: particle size analysis of sediments
Figure F1. Bathymetry map of the Ursa Basin with locations of Site U1324 and Site U1322 (red dots) (modifiedfrom Sawyer et al., 2007b). The Ursa Basin is downdip of the Mississippi River. Seismic line A–A′ is shown inFigure F2. CI = contour interval.
1
849
894
New Orleans0 100km
1200
1000
800
Site U1324
Site U1323Site U1322
1400
A
A´
CI = 200 m5 km
28.30°N
28.01°
88.96°W 89.38°
N
Proc. IODP | Volume 308 6

D.E. Sawyer et al. Data report: particle size analysis of sediments
Figure F2. Seismic cross section A–A′ through Expedition 308 sites and stratigraphic interpretation of seismiccross section (modified from Sawyer et al., 2007a). Seismic reflectors are defined in the “Expedition 308 sum-mary” chapter. MTC = mass transport complex.
SW NE
Top Blue
Seafloor
Slump blocks
SW NE
Two-
way
trav
eltim
e (s
)
2.0
1.6
2.2
1.8
2.4
1.4
West levee
1 km
Two-
way
trav
eltim
e (s
)
2.0
1.6
2.2
1.8
2.4
1.4
S20
S20
S20
S30
S30 S30
S40-1324
S40-1322
S80Top Blue
Base Blue
Base Blue
East leveeS80
S80
S40-1323S50-1322S60-1322S70-1322
Blue Unit
MTCs
Ursa Canyon
Site U1322
Site U1323
Site U1324
S10
S10
S10
1 km
A A´
A A´
MTC-1
MTC-2
S50-1324
Southwest Pass CanyonEast levee
S60-1324
MTC-2
Mass transport complex Mud Sand and silty sand Blue unit
MTC-U1322-10MTC-U1322-11
Site U1322
Site U1323
Site U1324
Proc. IODP | Volume 308 7

D.E. Sawyer et al. Data report: particle size analysis of sediments
Figure F3. Shepard’s (1954) classification ternary diagram based on relative percentages of sand, silt, and clayused to define lithology of Ursa Basin samples.
Percent silt0 10 20 30 40 50 60 70 80 90 100
Percent clay
0
10
20
30
40
50
60
70
80
90
100
Percent sand
0
10
20
30
40
50
60
70
80
90
100
Sand-Silt-Clay
Clay
SiltSand
Clayey silt
Silty clay
Sandy siltSilty sand
Clayey sand
Sandy clay
Proc. IODP | Volume 308 8

D.E. Sawyer et al. Data report: particle size analysis of sediments
Figure F4. Sample data sheet for hydrometer analysis. Hr = hydrometer reading, effective depth = depth (L inEquation 1) of hydrometer’s center, corrected for viscosity. Data sheets for all experiments are available in “Sup-plementary material.”
Project: Test Number: 130Tested by: RJJ
Boring: U1324B Hydrometer Test Date: 11/13/2006Sample: 02H 05W Type: 151H Fisher Brand
Location: 60-65 cm Number: 98Volume = 72 cm3 •Dispersing agent: Sodium
Assumed Specific Gravity: 2.70 Hr @ 1035 = 5.912 cm HexametaphosphateMeasured Dry Sample Mass: 26.24 g Hr @ 1000 = 15.212 cm •Dispersing agent not included
Measured Dispersing Aggent Mass: 5.00 g Meniscus = 0.8 g/L in sample dry mass
Elapsed Time Susp'n ReadingWater + Disp'nt
Reading Temp.
(min.) (g/L) (g/L) (°C)
0.25 1018.5 1002.6 23.90.5 1018.4 1002.6 23.9
1 1018.7 1002.6 23.92 1018.7 1002.6 23.94 1018.3 1002.7 23.98 1017.0 1002.6 23.9
16 1015.5 1002.5 23.932 1014.4 1002.4 23.964 1013.8 1002.5 23.9
128 1012.8 1002.8 23.9256 1012.4 1002.9 24.0622 1011.6 1002.9 24.1
1253 1010.9 1002.8 24.02766 1009.9 1002.9 24.0
0.1040.4099.60 0.0625
Remarks/Comments:
0.0017749.31882E-06 11.89872742
97.45
72.63
0.020437
0.0105890.007588
97.45
87.16
52.66
10.00453539
11.3117946811.57858229
10.4580743310.8582557411.15172211
9.36315E-069.36315E-069.34094E-06
(g-s/cm2)
9.36315E-069.36315E-069.36315E-069.36315E-06
42.37
57.50
10.08457167
9.36315E-06 10.11125043
9.34094E-069.34094E-06
9.36315E-069.36315E-069.36315E-06
(cm)
10.05789291
10.00453539
0.00085812.08547875
60.53
0.00126149.03
11.68529733
12.35226636
(mm)
0.081532
(%)
96.24
Hydrometer AnalysisODP Leg 308
Measurements Constants
Viscosity
Results
% Finer
0.014697
95.63 0.0577290.0406580.028750
DiameterEffective Depth
0.0038660.002743
0.005404
94.42
78.69
68.40
(wet sieved at 62.5μm) Interpolated value at silt/sand boundary (2μm)Mass retained on sieve (grams): % Finer
% passing 0.0625 mm:
Diameter (mm)
Sand-% of dry mass: 53.79 0.002
Proc. IODP | Volume 308 9

D.E. Sawyer et al. Data report: particle size analysis of sediments
Figure F5. Sample particle size distribution plot on a semilog scale. Black circles = hydrometer readings, opentriangle = sand fraction from wet-sieving through 62.5 µm sieve. Sand/silt boundary is defined at 62.5 µm, andsilt/clay boundary is defined at 2 µm. Particle size distribution plots sheets for all experiments are available in“Supplementary material.”
0
20
40
60
80
100
00.0010.0100.1001.000
Clayparticle size (mm)
Siltparticle size (mm)
Sandparticle size (mm)
%F
iner
Hydrometer data
Sieve data
Sample U1324B-02H-05W, 60-65 cm, 10.40 mbsf
Proc. IODP | Volume 308 10

D.E. Sawyer et al. Data report: particle size analysis of sediments
Figure F6. Downcore profile of particle distribution, Site U1322. Red squares = MIT measurements. Gamma rayand resistivity (P16B) logs are from wireline data. Lithologic units were defined by shipboard sedimentologists(see the “Site U1322” chapter).
0
50
100
150
200
Dep
th (
mbs
f)
IA
IB
IC
ID
II
Lithologicunit
Gamma ray(API)
40 90
Resistivity (P16B)(ΩM)
0.5 2
ClaySiltSand
100%0%
Proc. IODP | Volume 308 11

D.E. Sawyer et al. Data report: particle size analysis of sediments
Figure F7. Downcore profile of particle distribution, Site U1324. Red squares = MIT measurements. Gamma rayand resistivity (P16B) logs are from wireline data. Lithologic units were defined by shipboard sedimentologists(see the “Site U1324” chapter).
100
200
300
400
500
600
Dep
th (
mbs
f)
IA
IB
IC
ID
IE
IF
IG
IIA
IIB
IIC
IID
0
Lithologicunit
Gamma ray(API)
40 90
Resistivity (P16B)(ΩM)
0.5 2
ClaySiltSand
100%0%
Proc. IODP | Volume 308 12

D.E. Sawyer et al. Data report: particle size analysis of sediments
Figure F8. Ternary diagrams for all 340 samples from Site U1324 (gray circles) and Site U1322 (black circles).
50
Percent silt0 100
Percent clay
0
50
100
Percent sand100
0
25
75
75
25
25 75
Clay
SiltSand
Sandyclay
Clayeysand
Siltyclay
Clayeysilt
Silty sand Sandy silt
Sand-Silt-Clay
Proc. IODP | Volume 308 13

D.E. Sawyer et al. Data report: particle size analysis of sediments
Figure F9. Ternary diagrams for (A) Site U1322 samples and (B) Site U1324 samples.
Percent silt0 50 100
Percent clay
0
50
100
Percent sand
0
25
50
75
100
75
25
25 75
Clay
SiltSand
Sandyclay
Clayeysand
Siltyclay
Clayeysilt
Silty sand Sandy silt
Percent silt0 100
Percent clay
0
Percent sand
0
100
50
50
100
25
50
75
75
25
25 75
Clay
SiltSand
Sandyclay
Clayeysand
Siltyclay
Clayeysilt
Siltysand
Sandysilt
Sand-Silt-Clay
Sand-Silt-Clay
A
B
Proc. IODP | Volume 308 14

D.E. Sawyer et al. Data report: particle size analysis of sediments
Figure F10. Particle size distribution plot of three reproducibility runs for Section 308-U1324C-7H-1.
0
20
40
60
80
100
00.0010.0100.100
Particle diameter (mm)
%F
iner
Proc. IODP | Volume 308 15
D.E. Sawyer et al. Data report: particle size analysis of sediments
Figure F11. Particle size distribution plot showing results of four experiments on Section 308-U1324C-7H-1,with different initial dry masses.
0
20
40
60
80
100
00.0010.0100.100
Particle diameter (mm)
%F
iner
9.52 g
19.07 g
37.77 g
44.67 g
Proc. IODP | Volume 308 16

D.E. Sawyer et al. Data report: particle size analysis of sediments
Table T1. Particle size analysis results, Site U1322. (See table note.)
Hole, core, section, interval (cm)
Depth (mbsf)
Particle size (wt%) Process siteSand Silt Clay
308-U1322B-1H-1, 60–62 0.60 5.76 21.45 72.79 PSUU1322B-2H-1, 60–62 4.60 0.07 19.39 80.54 PSUU1322B-2H-5, 60–62 10.60 0.49 20.33 79.18 PSUU1322B-3H-2, 60–62 15.60 0.13 41.53 58.34 PSUU1322B-3H-4, 60–62 18.60 0.10 43.35 56.55 PSUU1322B-3H-5, 60–62 20.10 0.13 31.58 68.29 PSUU1322B-4H-2, 60–62 25.10 0.13 44.21 55.66 PSUU1322B-4H-3 27.17 0.40 34.10 65.50 MITU1322B-4H-5, 60–62 29.60 0.07 41.77 58.16 PSUU1322B-5H-2, 60–62 34.60 0.13 31.63 68.24 PSUU1322B-5H-6, 60–62 40.60 0.05 34.35 65.60 PSUU1322B-6H-3, 60–62 45.36 0.05 64.54 35.41 PSUU1322B-6H-4, 60–62 46.36 0.15 33.76 66.09 PSUU1322B-6H-5, 60–62 47.86 0.06 30.89 69.05 PSUU1322B-6H-6, 60–62 49.36 0.11 30.68 69.21 PSUU1322B-6H-7, 60–62 50.36 0.04 39.04 60.92 PSUU1322B-7H-1, 60–62 52.10 0.17 35.03 64.80 PSUU1322B-7H-2, 60–62 53.60 0.12 35.54 64.34 PSUU1322B-7H-3, 60–62 55.10 0.03 36.61 63.36 PSUU1322B-7H-4, 60–62 56.60 0.11 35.02 64.87 PSUU1322B-7H-5, 60–62 58.10 0.08 36.66 63.26 PSUU1322B-7H-6, 60–62 59.60 0.03 37.92 62.05 PSUU1322B-8H-1, 60–62 61.60 0.05 38.62 61.33 PSUU1322B-8H-2, 60–62 63.10 0.01 38.24 61.75 PSUU1322B-8H-3, 60–62 64.60 0.02 37.76 62.22 PSUU1322B-8H-4, 60–62 66.10 0.02 38.01 61.97 PSUU1322B-8H-5, 60–62 67.60 0.02 31.12 68.86 PSUU1322B-8H-6, 60–62 69.10 0.01 38.12 61.87 PSUU1322B-9H-1, 60–62 71.10 0.02 46.63 53.35 PSUU1322D-2H-2 72.00 0.00 41.00 59.00 MITU1322D-2H-2 72.00 0.40 41.40 58.20 MITU1322B-9H-2, 60–62 72.60 0.02 38.65 61.33 PSUU1322B-9H-4, 60–62 75.60 0.03 45.20 54.77 PSUU1322B-1H-1, 60–62 80.60 0.02 40.77 59.21 PSUU1322B-1H-2, 60–62 82.10 0.02 39.98 60.00 PSUU1322B-1H-5, 60–62 86.60 0.41 40.38 59.21 PSUU1322B-11H-1, 60–62 90.10 0.02 43.49 56.49 PSUU1322B-11H-3, 60–62 91.61 0.03 36.48 63.49 PSUU1322B-11H-5, 60–62 93.70 0.02 51.20 48.78 PSUU1322B-11H-6, 60–62 95.20 0.03 40.01 59.96 PSUU1322B-11H-7, 60–62 96.70 0.02 47.63 52.35 PSUU1322B-12H-1, 59–61 99.59 0.03 47.65 52.32 PSUU1322B-12H-2, 59–61 101.09 0.05 41.90 58.05 PSUU1322B-12H-3, 59–61 102.59 0.01 45.21 54.78 PSUU1322D-3H-3, 42–46 103.44 0.07 48.21 51.72 PSUU1322B-12H-4, 59–61 104.09 0.02 48.21 51.77 PSUU1322B-12H-5, 59–61 105.59 0.02 37.85 62.13 PSU
U1322B-12H-6, 59–61 107.09 0.01 43.54 56.45 PSUU1322B-12H-7, 59–61 108.09 0.03 49.70 50.27 PSUU1322B-13H-1, 59–61 109.09 0.02 51.53 48.45 PSUU1322B-13H-3, 59–61 111.92 0.02 47.25 52.73 PSUU1322B-13H-4, 59–61 113.42 0.02 45.54 54.44 PSUU1322B-14H-1, 60–62 116.90 0.02 42.91 57.07 PSUU1322B-14H-3, 60–62 119.90 0.36 25.55 74.09 PSUU1322B-14H-4, 60–62 121.40 0.01 45.15 54.84 PSUU1322B-14H-5, 60–62 122.90 0.02 37.07 62.91 PSUU1322B-15H-1, 60–62 125.40 0.13 39.20 60.67 PSUU1322B-15H-1 125.80 0.00 29.60 70.40 MITU1322B-15H-2, 59–61 126.89 0.07 33.85 66.08 PSUU1322B-15H-3, 59–61 128.39 0.08 34.85 65.07 PSUU1322B-15H-4, 60–62 129.90 0.07 42.00 57.93 PSUU1322B-16H-1, 59–62 134.89 0.04 43.50 56.46 PSUU1322B-16H-4, 55–58 139.35 0.05 37.46 62.49 PSUU1322B-17H-3, 60–62 144.53 0.06 39.82 60.12 PSUU1322B-17H-4, 60–62 145.35 0.07 40.16 59.77 PSUU1322B-18H-1, 60–62 150.50 0.21 44.17 55.62 PSUU1322B-18H-2, 60–62 152.00 0.50 49.80 49.70 PSUU1322B-18H-3, 60–62 153.50 0.44 45.40 54.16 PSUU1322B-18H-4, 61–63 155.01 0.25 38.01 61.74 PSUU1322B-18H-5, 60–62 156.50 0.19 40.27 59.54 PSUU1322B-18H-6 158.01 0.70 33.70 65.60 MITU1322B-19H-2, 60–62 159.90 0.31 43.22 56.47 PSUU1322B-19H-5, 60–62 164.40 0.09 38.20 61.71 PSUU1322B-2H-1, 66–68 167.36 0.42 44.83 54.75 PSUU1322B-2H-2, 60–62 168.80 0.81 42.88 56.31 PSUU1322B-21H-1, 60–62 175.10 0.14 39.45 60.41 PSUU1322B-21H-4, 60–62 179.60 0.18 43.10 56.72 PSUU1322B-22H-1, 60–62 182.90 0.07 38.70 61.23 PSUU1322B-22H-2, 60–62 184.40 0.07 37.48 62.45 PSUU1322B-23H-1, 60–62 189.60 0.16 40.78 59.06 PSUU1322B-23H-6, 60–62 197.10 0.31 36.56 63.13 PSUU1322B-24H-1, 59–61 199.09 0.26 37.56 62.18 PSUU1322B-24H-2, 59–61 200.59 0.62 46.10 53.28 PSUU1322B-25H-1, 60–62 202.30 0.35 41.17 58.48 PSUU1322B-25H-5, 60–62 207.65 0.06 35.20 64.74 PSUU1322B-25H-6, 60–62 209.13 0.03 38.88 61.09 PSUU1322B-26H-1, 59–61 210.89 0.02 39.00 60.98 PSUU1322B-27H-1, 58–62 214.68 0.03 44.76 55.21 PSUU1322B-27H-2, 58–62 216.18 0.24 41.20 58.56 PSUU1322B-27H-4, 58–62 219.18 0.36 39.01 60.63 PSUU1322B-28H-2, 60–62 222.40 0.26 37.71 62.03 PSUU1322B-29H-3, 60–62 230.70 0.05 33.97 65.98 PSUU1322B-29H-4, 60–62 232.20 0.07 36.05 63.88 PSUU1322B-29H-5, 60–62 233.70 0.04 33.71 66.25 PSU
Hole, core, section, interval (cm)
Depth (mbsf)
Particle size (wt%) Process siteSand Silt Clay
Note: PSU = the Pennsylvania State University, MIT = Massachusetts Institute of Technology.
Proc. IODP | Volume 308 17

D.E. Sawyer et al. Data report: particle size analysis of sediments
Table T2. Particle size analysis results, Site U1324. (See table note.) (Continued on next page.)
Hole, core, section, interval (cm)
Depth (mbsf)
Particle size (wt%) Process siteSand Silt Clay
308-U1324B-1H-1, 60–64 0.60 1.43 21.66 76.91 PSUU1324B-1H-2, 60–64 2.10 0.06 35.18 64.76 PSUU1324B-2H-3, 60–65 7.40 0.16 42.33 57.51 PSUU1324B-2H-5, 60–65 10.40 0.40 45.81 53.79 PSUU1324B-2H-6, 60–65 11.90 0.16 37.35 62.49 PSUU1324B-2H-6, 128–130 12.58 0.25 63.16 36.59 PSUU1324B-3H-1, 60–65 13.90 0.18 40.41 59.41 PSUU1324B-3H-2, 60–65 15.40 0.23 39.03 60.74 PSUU1324B-3H-3, 61–66 16.91 0.14 42.35 57.51 PSUU1324B-3H-4, 60–65 18.40 0.11 36.59 63.30 PSUU1324B-3H-4, 114–116 18.94 0.11 52.06 47.83 PSUU1324B-3H-5, 59–64 19.89 0.04 32.05 67.91 PSUU1324B-3H-6, 59–64 21.39 0.07 30.24 69.69 PSUU1324B-4H-1, 58–63 23.38 0.08 41.65 58.27 PSUU1324B-4H-5, 59–64 29.39 0.03 36.90 63.07 PSUU1324B-4H-7 31.86 0.00 44.50 55.50 MITU1324B-4H-7 32.10 0.00 44.70 55.30 MITU1324B-4H-7 32.14 0.70 34.20 65.10 MITU1324B-5H-2, 59–63 34.39 0.06 39.84 60.10 PSUU1324B-5H-5, 59–63 38.89 0.14 38.68 61.18 PSUU1324B-5H-6, 59–63 40.39 0.02 32.54 67.44 PSUU1324B-6H-1, 60–62 42.40 0.04 30.60 69.36 PSUU1324B-6H-5, 60–62 48.40 0.24 32.73 67.03 PSUU1324C-1H-1 51.10 0.00 31.90 68.10 MITU1324C-1H-1 51.10 0.00 34.60 65.40 MITU1324C-1H-1-1 51.14 0.04 42.59 57.37 PSUU1324C-1H-1-2 51.21 0.01 44.10 55.89 PSUU1324B-7H-2, 60–62 53.40 0.03 34.26 65.71 PSUU1324B-7H-6, 60–62 59.41 0.07 42.86 57.07 PSUU1324B-7H-7, 5–9 60.31 0.00 42.80 57.20 MITU1324B-7H-7, 5–9 60.31 0.00 39.00 61.00 MITU1324B-7H-7, 5–9 60.31 0.10 36.20 63.70 MITU1324B-7H-7 60.62 0.00 50.40 49.60 MITU1324B-8H-3, 60–62 64.40 0.13 54.16 45.71 PSUU1324B-9H-1, 61–63 70.91 0.03 40.57 59.40 PSUU1324B-9H-4, 60–62 75.40 0.14 35.17 64.69 PSUU1324B-9H-6, 60–62 78.40 0.01 34.34 65.65 PSUU1324B-1H-1, 60–62 80.40 0.02 33.17 66.81 PSUU1324B-1H-5, 60–62 86.40 0.03 38.09 61.88 PSUU1324B-1H-7 88.80 0.00 39.70 60.30 MITU1324B-11H-2, 60–62 91.40 0.02 34.51 65.47 PSUU1324B-11H-4, 60–62 94.40 0.01 43.68 56.31 PSUU1324B-12H-1, 60–62 99.40 0.03 49.63 50.34 PSUU1324C-2H-2 104.50 0.00 49.20 50.80 MITU1324B-12H-5, 60–62 105.40 0.02 39.73 60.25 PSUU1324B-13H-1, 60–62 108.90 0.01 51.06 48.93 PSUU1324B-13H-2, 60–62 110.40 0.06 41.76 58.18 PSUU1324B-13H-3, 60–62 111.90 0.07 36.13 63.80 PSUU1324B-13H-4, 60–62 113.40 0.04 39.31 60.65 PSUU1324B-13H-5, 60–62 114.90 0.05 37.74 62.21 PSUU1324B-13H-6, 60–62 116.40 0.04 39.69 60.27 PSUU1324B-13H-7-1 117.40 0.03 40.07 59.90 PSUU1324B-14H-1, 60–62 118.40 0.03 45.56 54.41 PSUU1324B-14H-2, 60–62 119.36 0.02 55.02 44.96 PSUU1324B-14H-3, 60–62 120.22 0.02 55.68 44.30 PSUU1324B-14H-4, 60–62 121.52 0.03 34.97 65.00 PSUU1324B-14H-5, 60–62 122.25 0.03 36.88 63.09 PSUU1324B-14H-6, 60–62 123.74 0.05 41.37 58.58 PSUU1324B-14H-7, 60–62 125.25 0.02 54.80 45.18 PSUU1324B-15H-1, 60–62 127.90 0.08 39.20 60.72 PSUU1324B-15H-2, 60–62 129.40 0.02 33.42 66.56 PSUU1324B-15H-3, 60–62 130.90 0.05 28.45 71.50 PSUU1324B-15H-4, 60–62 132.40 0.04 39.30 60.66 PSUU1324B-15H-5, 60–62 133.90 0.01 45.54 54.45 PSUU1324B-15H-5 134.20 0.30 37.70 62.00 MITU1324B-16H-2, 60–62 138.40 0.01 44.49 55.50 PSUU1324B-16H-3, 60–62 139.40 0.01 44.06 55.93 PSU
U1324B-16H-4, 60–62 140.33 0.01 42.73 57.26 PSUU1324B-16H-5, 60–62 141.83 0.01 34.59 65.40 PSUU1324B-16H-5, 5–10 142.10 1.10 41.50 57.40 MITU1324B-16H-5, 5–10 142.10 0.00 42.00 58.00 MITU1324B-16H-5, 5–10 142.10 0.00 37.70 62.30 MITU1324B-16H-6, 60–62 143.33 0.01 50.19 49.80 PSUU1324B-16H-7, 60–62 144.33 0.02 41.30 58.68 PSUU1324B-17H-1, 60–62 145.50 0.01 37.39 62.60 PSUU1324B-17H-2, 60–62 147.00 0.04 37.96 62.00 PSUU1324B-17H-3, 60–62 148.50 0.04 38.46 61.50 PSUU1324B-17H-4, 60–62 150.00 0.01 48.79 51.20 PSUU1324B-17H-5, 60–62 151.50 0.01 44.39 55.60 PSUU1324B-17H-6, 60–62 153.00 0.02 56.13 43.85 PSUU1324B-18H-1, 60–62 154.30 0.02 44.98 55.00 PSUU1324B-18H-2, 60–62 155.80 0.03 41.47 58.50 PSUU1324B-18H-3, 59–61 157.29 0.05 39.45 60.50 PSUU1324B-18H-4, 60–62 158.80 0.01 39.24 60.75 PSUU1324B-18H-5, 60–62 160.30 0.00 48.50 51.50 MITU1324B-19H-1, 60–62 162.60 0.04 40.06 59.90 PSUU1324B-19H-2, 60–62 164.10 0.10 36.17 63.73 PSUU1324B-19H-3, 60–62 165.60 0.15 33.25 66.60 PSUU1324B-19H-4, 60–62 167.10 0.22 35.03 64.75 PSUU1324B-19H-5, 60–62 168.60 0.02 33.78 66.20 PSUU1324B-19H-1, 60–62 170.10 0.02 35.48 64.50 PSUU1324B-20H-1, 60–62 171.40 0.02 36.28 63.70 PSUU1324B-20H-2, 60–62 172.90 0.04 34.64 65.32 PSUU1324B-20H-3, 60–62 174.40 0.01 32.39 67.60 PSUU1324B-20H-4, 60–62 175.90 0.03 30.24 69.73 PSUU1324B-20H-5, 60–62 177.40 0.03 39.70 60.27 PSUU1324B-21H-1, 60–62 179.60 0.01 35.84 64.15 PSUU1324B-21H-3, 112–116 183.14 0.31 55.04 44.65 PSUU1324B-21H-5, 60–62 185.60 0.02 38.10 61.88 PSUU1324B-22H-3, 60–62 190.50 0.02 37.23 62.75 PSUU1324B-23H-1, 60–62 194.40 0.12 40.79 59.09 PSUU1324B-23H-5 199.80 0.50 37.30 62.20 MITU1324B-24H-1, 60–62 201.00 0.05 28.05 71.90 PSUU1324B-24H-3, 60–62 204.00 0.02 35.78 64.20 PSUU1324B-25H-1, 60–62 208.10 0.09 31.31 68.60 PSUU1324B-25H-5, 60–62 214.10 0.06 34.14 65.80 PSUU1324B-26H-3, 60–62 219.70 0.17 36.26 63.57 PSUU1324B-26H-3 220.34 0.00 34.00 66.00 MITU1324B-26H-4, 60–62 221.20 0.04 36.56 63.40 PSUU1324B-26H-5, 60–62 222.20 0.08 35.32 64.60 PSUU1324B-27H-4, 60–62 227.60 0.08 37.96 61.96 PSUU1324B-28H-4, 60–62 234.22 0.08 32.94 66.98 PSUU1324B-29H-2, 60–62 240.70 0.01 29.89 70.10 PSUU1324B-29H-5, 60–62 245.20 0.02 34.28 65.70 PSUU1324B-29H-6, 60–62 246.70 0.02 32.72 67.26 PSUU1324B-30H-2, 60–62 249.40 0.12 39.26 60.62 PSUU1324B-30H-3, 60–62 250.90 0.12 35.78 64.10 PSUU1324B-30H-6, 60–62 255.40 0.02 36.57 63.41 PSUU1324B-31H-3, 60–62 260.40 0.02 43.34 56.64 PSUU1324B-31H-3, 120–124 261.02 0.03 41.26 58.71 PSUU1324B-31H-4, 60–62 261.90 0.01 28.99 71.00 PSUU1324B-31H-5, 60–62 263.40 0.01 43.89 56.10 PSUU1324B-32H-4, 60–62 269.70 0.03 35.01 64.96 PSUU1324B-33H-2, 60–62 275.74 0.03 35.18 64.79 PSUU1324B-33H-5, 60–62 280.20 0.02 37.75 62.23 PSUU1324B-34H-2, 60–62 284.60 0.02 33.78 66.20 PSUU1324B-34H-3, 60–62 286.10 0.04 29.16 70.80 PSUU1324B-34H-5, 60–62 289.10 0.02 36.98 63.00 PSUU1324B-35H-2, 60–62 292.50 0.03 33.36 66.61 PSUU1324B-35H-3, 60–62 294.00 0.01 37.61 62.38 PSUU1324B-36H-1, 60–62 297.00 0.03 33.07 66.90 PSUU1324B-36H-2, 60–62 298.50 0.03 36.67 63.30 PSUU1324B-36H-3, 60–62 300.00 0.18 40.53 59.29 PSUU1324B-36H-5, 60–62 303.00 0.05 37.95 62.00 PSUU1324C-6H-3-1 303.94 0.03 36.37 63.60 PSU
Hole, core, section, interval (cm)
Depth (mbsf)
Particle size (wt%) Process siteSand Silt Clay
Proc. IODP | Volume 308 18

D.E. Sawyer et al. Data report: particle size analysis of sediments
U1324C-6H-3-2 304.02 0.11 37.09 62.80 PSUU1324B-37H-1, 10–12 305.70 91.99 4.69 3.32 PSUU1324B-37H-1, 18–20 305.78 93.90 3.52 2.58 PSUU1324B-37H-1, 110–112 306.70 94.12 3.21 2.67 PSUU1324B-37H-3, 60–63 309.20 0.64 36.06 63.30 PSUU1324B-38H-1, 10–12 311.40 96.27 2.09 1.64 PSUU1324B-38H-1, 60–62 311.90 0.28 35.52 64.20 PSUU1324B-38H-2, 60–62 313.40 0.03 34.87 65.10 PSUU1324B-39H-3, 60–62 322.80 0.05 41.67 58.28 PSUU1324B-39H-4, 60–62 324.30 0.04 35.66 64.30 PSUU1324B-40H-1, 60–62 328.20 0.21 36.24 63.55 PSUU1324B-40H-4, 60–62 332.70 0.12 32.98 66.90 PSUU1324B-41H-3, 63–65 337.13 0.11 32.18 67.71 PSUU1324B-42H-1, 59–61 339.59 0.02 34.77 65.21 PSUU1324B-42H-3, 58–60 342.58 0.01 34.99 65.00 PSUU1324B-43H-2, 59–61 347.09 0.02 31.98 68.00 PSUU1324B-45X-2, 60–62 360.00 0.02 35.34 64.64 PSUU1324B-46X-2, 109–110 364.99 0.09 59.37 40.54 PSUU1324B-46X-3, 60–62 366.00 0.15 60.98 38.87 PSUU1324B-47H-2, 60–62 370.10 0.46 64.70 34.84 PSUU1324B-47H-3, 60–62 371.60 1.23 62.42 36.35 PSUU1324B-47H-4, 64–66 372.62 11.91 49.83 38.26 PSUU1324B-48H-1, 60–62 373.80 1.95 65.14 32.91 PSUU1324B-48H-3, 60–62 376.80 1.10 52.30 46.60 MITU1324B-48H-4, 60–62 378.30 0.05 32.95 67.00 PSUU1324B-48H-5, 60–62 379.80 14.37 58.19 27.44 PSUU1324B-48H-6, 60–62 380.80 1.93 51.27 46.80 PSUU1324B-49H-2, 60–62 383.60 0.03 42.97 57.00 PSUU1324B-49H-4, 60–62 386.51 1.84 69.39 28.77 PSUU1324B-50H-2, 60–62 390.00 0.13 71.69 28.18 PSUU1324B-50H-3, 27–29 391.17 3.11 77.42 19.47 PSUU1324B-50H-4, 60–62 393.00 0.00 49.00 51.00 MITU1324B-50H-5, 57–59 393.97 0.09 58.02 41.89 PSUU1324B-51X-1, 60–62 395.10 0.15 47.94 51.91 PSUU1324B-52X-1, 57–59 397.37 1.67 61.42 36.91 PSUU1324B-52X-2, 60–62 398.90 1.66 77.27 21.07 PSUU1324B-52X-2, 95–97 399.25 2.05 80.34 17.61 PSUU1324B-52X-3, 60–62 400.40 0.25 60.19 39.56 PSUU1324B-52X-4, 60–62 401.90 0.61 63.89 35.50 PSUU1324B-52X-5, 11–13 402.91 1.01 68.77 30.22 PSUU1324C-7H-1-2 405.81 1.54 66.73 31.73 PSUU1324B-53X-1, 72–74 407.12 3.43 65.01 31.56 PSUU1324B-53X-2, 70–72 408.60 30.30 52.50 17.20 MITU1324B-53X-3, 59–61 409.99 5.78 71.29 22.93 PSUU1324B-53X-4, 64–66 411.54 2.58 65.89 31.53 PSUU1324B-54X-1, 87–89 416.87 0.22 51.81 47.97 PSUU1324B-54X-2, 60–62 418.10 0.06 53.44 46.50 PSUU1324B-54X-3, 60–62 419.60 0.08 51.32 48.60 PSUU1324B-55X-4, 60–62 430.80 0.03 33.68 66.29 PSUU1324B-55X-7, 60–62 434.80 0.02 37.70 62.28 PSUU1324B-56X-4, 60–62 440.40 0.02 25.81 74.17 PSUU1324B-57X-1, 60–62 445.60 0.08 71.53 28.39 PSUU1324B-57X-4, 60–62 450.10 0.04 34.68 65.28 PSUU1324B-58X-1, 60–62 455.20 0.19 62.44 37.37 PSUU1324B-58X-3, 60–62 458.20 0.08 41.97 57.95 PSUU1324B-58X-4, 60–62 459.70 0.10 33.97 65.93 PSU
Hole, core, section, interval (cm)
Depth (mbsf)
Particle size (wt%) Process siteSand Silt Clay
U1324B-58X-5, 60–62 461.24 0.10 31.12 68.78 PSUU1324B-59X-3, 60–62 466.74 0.05 50.79 49.16 PSUU1324B-59X-5, 60–62 469.74 0.10 68.55 31.35 PSUU1324B-60X-1, 68–70 474.58 0.05 61.60 38.35 PSUU1324B-60X-2-1 476.86 0.02 41.48 58.50 PSUU1324B-60X-2-1 476.86 0.02 41.18 58.80 PSUU1324B-60X-5, 59–61 480.49 0.03 48.02 51.95 PSUU1324B-61X-1, 60–62 484.10 0.00 37.30 62.70 MITU1324B-61X-2, 60–62 485.60 0.08 39.80 60.12 PSUU1324B-61X-5, 60–62 490.10 5.30 34.50 60.20 MITU1324B-62X-2, 60–62 495.08 0.31 63.19 36.50 PSUU1324B-62X-5, 61–63 499.59 0.38 69.72 29.90 PSUU1324B-62X-6, 42–44 500.90 0.98 76.60 22.42 PSUU1324B-62X-6, 60–62 501.08 0.09 47.37 52.54 PSUU1324B-62X-CC, 10–12 501.49 1.86 81.30 16.84 PSUU1324B-63X-1, 60–62 503.30 0.36 64.99 34.65 PSUU1324B-63X-2, 60–62 504.80 0.13 78.76 21.11 PSUU1324B-63X-2, 78–80 504.98 0.04 33.36 66.60 PSUU1324B-63X-3, 61–63 506.31 0.06 44.16 55.78 PSUU1324C-8H-2, 32–34 506.82 0.60 80.82 18.58 PSUU1324B-63X-4, 23–25 507.43 1.40 78.24 20.36 PSUU1324B-63X-4, 60–62 507.80 0.36 73.49 26.15 PSUU1324B-63X-4, 139–141 508.59 0.46 74.49 25.05 PSUU1324B-63X-5, 60–62 509.34 0.20 62.09 37.71 PSUU1324C-8H-5, 28–30 510.78 1.46 84.27 14.27 PSUU1324B-64X-1, 60–62 513.00 0.10 49.15 50.75 PSUU1324B-64X-2, 60–62 514.00 0.10 55.17 44.73 PSUU1324B-64X-3, 64–66 514.76 0.57 76.54 22.89 PSUU1324B-64X-4, 33–35 515.97 0.04 43.76 56.20 PSUU1324B-64X-4, 60–62 516.29 0.18 75.26 24.56 PSUU1324B-64X-4, 74–76 516.38 0.14 71.00 28.86 PSUU1324B-65X-1, 60–62 522.50 0.03 44.97 55.00 PSUU1324B-65X-3, 60–62 525.50 0.14 38.41 61.45 PSUU1324B-65X-4, 60–62 527.00 0.10 34.14 65.76 PSUU1324B-65X-5, 60–62 528.50 0.08 45.15 54.77 PSUU1324B-65X-6, 60–62 529.50 0.10 37.65 62.25 PSUU1324B-66X-1, 60–62 532.20 0.15 39.17 60.68 PSUU1324B-67X-1, 53–55 541.63 0.22 39.16 60.62 PSUU1324B-67X-2, 60–62 543.20 0.03 42.69 57.28 PSUU1324B-67X-4, 53–55 546.13 0.11 52.88 47.01 PSUU1324B-67X-4, 60–62 546.20 0.04 40.87 59.09 PSUU1324B-67X-5, 60–62 547.22 0.11 41.77 58.12 PSUU1324B-67X-6, 24–26 548.36 0.11 61.06 38.83 PSUU1324B-67X-6, 60–62 548.72 0.02 39.80 60.18 PSUU1324B-68X-1, 60–62 551.30 0.07 50.29 49.64 PSUU1324B-68X-4, 60–62 555.80 0.62 61.91 37.47 PSUU1324B-69X-2, 60–62 562.50 1.50 48.49 50.01 MITU1324B-70X-1, 59–61 570.59 0.12 37.48 62.40 PSUU1324B-70X-3, 62–64 573.62 0.17 44.63 55.20 PSUU1324B-70X-6-1 578.13 0.03 38.17 61.80 PSUU1324B-71X-1, 62–64 580.22 0.11 50.66 49.23 PSUU1324B-71X-3, 59–62 583.19 10.90 76.14 12.96 PSUU1324B-73X-1, 60–62 593.80 4.41 51.78 43.81 PSUU1324B-74X-5, 64–66 605.24 5.68 71.10 23.22 PSUU1324B-74X-6, 59–61 606.19 0.16 50.68 49.16 PSU
Hole, core, section, interval (cm)
Depth (mbsf)
Particle size (wt%) Process siteSand Silt Clay
Note: PSU = the Pennsylvania State University, MIT = Massachusetts Institute of Technology.
Table T2 (continued).
Proc. IODP | Volume 308 19

D.E. Sawyer et al. Data report: particle size analysis of sediments
Table T3. Nomenclature.
Table T4. Specific gravity measurements of 19 samples. (See table note.)
Note: CRS = constant-rate-of-strain consolidation test.
Name Definition Dimensions
η Viscosity of water MT/L2
D Diameter of particle LGs Specific gravity of sediment DimensionlessL Effective depth Lt Elapsed time TM Dry sediment mass MRh Corrected hydrometer reading on sample tube M/L3
B Corrected hydrometer reading on reference tube M/L3
Hole, core, section
Depth (mbsf)
Test number Description
Specific gravity
308-U1324C-1H-1 0.50 SG002 CRS799 2.744U1324B-4H-7 31.78 SG001 CRS800 2.735U1324B-4H-7 32.70 SG016 CRS013 2.686U1324C-1H-1 51.00 SG017 CRS799 2.649U1324B-7H-7 59.30 SG005 Natural 2.733U1324B-7H-7 59.30 SG006 Oven dried 2.736U1324B-7H-7 59.30 SG009 CRS802 2.680U1324B-10H-7 88.80 SG011 CRS813 2.674U1324C-2H-4 104.50 SG019 CRS807 2.665U1324B-15H-5 135.00 SG003 CRS803 2.766U1324B-16H-5 141.50 SG007 Natural 2.742U1324B-16H-5 141.50 SG008 Oven dried 2.735U1324B-16H-5 141.50 SG013 CRS801 2.716U1324B-23H-5 199.80 SG018 CRS812 2.671U1322D-2H-2 5.80 SG004 CRS796 2.746U1322B-4H-3 27.17 SG015 CRS815 2.668U1322D-2H-2 72.00 SG020 CRS798 2.680U1322B-15H-1 125.80 SG010 CRS808 2.694U1322B-18H-6 157.30 SG012 CRS810 2.689
Proc. IODP | Volume 308 20