The Lever Lab/Page 2 The Graph. You will need a piece of blank graph paper.
APPENDIX I
Data Quality Assessment Report
APPENDIX I DATA QUALITY ASSESSMENT REPORT
DRAFT – AIR MONITORING SUMMARY REPORT
SA RECYCLING - BAKERSFIELD 2000 E. BRUNDAGE LANE
BAKERSFIELD, CALIFORNIA 93307-2734 CONTRACT NO. 15-T4124
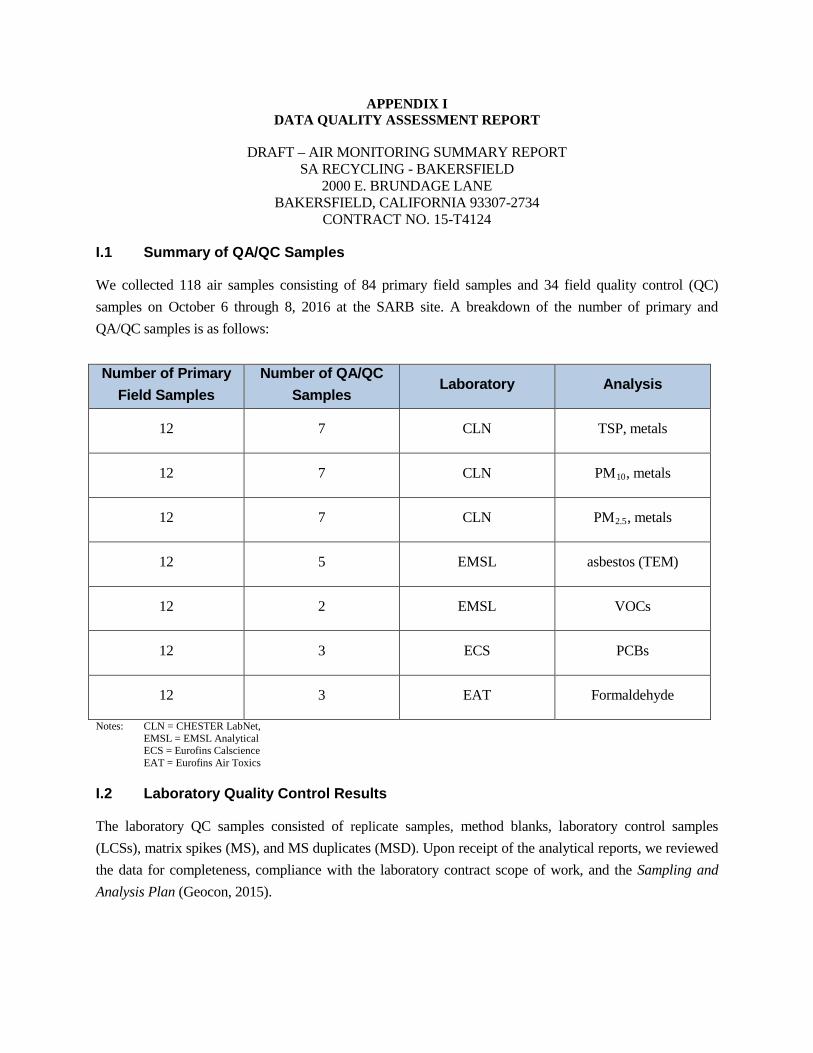
I.1 Summary of QA/QC Samples
We collected 118 air samples consisting of 84 primary field samples and 34 field quality control (QC) samples on October 6 through 8, 2016 at the SARB site. A breakdown of the number of primary and QA/QC samples is as follows: Number of Primary
Field Samples Number of QA/QC
Samples Laboratory Analysis
12 7 CLN TSP, metals
12 7 CLN PM10, metals
12 7 CLN PM2.5, metals
12 5 EMSL asbestos (TEM)
12 2 EMSL VOCs
12 3 ECS PCBs
12 3 EAT Formaldehyde
Notes: CLN = CHESTER LabNet, EMSL = EMSL Analytical ECS = Eurofins Calscience EAT = Eurofins Air Toxics
I.2 Laboratory Quality Control Results
The laboratory QC samples consisted of replicate samples, method blanks, laboratory control samples (LCSs), matrix spikes (MS), and MS duplicates (MSD). Upon receipt of the analytical reports, we reviewed the data for completeness, compliance with the laboratory contract scope of work, and the Sampling and Analysis Plan (Geocon, 2015).
I.2.1 CLN QA/QC Review
The following analytical notes were included in the case CLN’s Case Narrative: • “Many of the samples had thicker than usual deposits and did not conform (DNC) to the thin film
method. This resulted in high uncertainties for the analytes listed in the comments for each affected samples. The results have not been blank corrected. “
• “All of the data have been reviewed by the analysts performing the analyses and the project manager. All of the quality control and sample-specific information in this package is complete and meets or exceeds the minimum requirements for acceptability. “
The results of CLN’s QA/QC procedures are in Appendix I.
J.2.2 EMSL QA/QC Review
The following analytical notes were included in EMSL’s Case Narrative for the asbestos samples:
• “The samples were received via overnight carrier and were logged in following normal lab procedures. All samples were received under Chain of Custody and in good condition.
• All samples were analyzed according to the TEM AHERA method EPA 40 CFR, Part 763, Subpart E, except for EMSL order 041628499. These samples had a particulate loading greater than ten percent and were analyzed at the clients’ request. This method is for the determination of asbestos concentrations in air samples by TEM. Air samples are collected on a membrane filter, prepared via a direct preparation method and analyzed with an electron microscope at approximately 20,000 X magnification. Fibers encountered during analysis were identified by morphology, Energy Dispersive X-Ray analysis, and Selected Area Electron Diffraction. Results are reported in structures per cc or air, with an analytical sensitivity of <0.005 structures per cc of air.
• The Quality Control and equipment calibration were performed in compliance with EMSL’s Quality Assurance Manual. One laboratory blank was analyzed and three inter-analyst QC analyses were completed. All QC presented with this package were found to be concordant.”
The following analytical notes were included in EMSL’s QA/QC Summaries for the TOS samples: • Serial numbers for four samples were incorrect on the chain of custody. The correct information was
verified using information recorded Field Log and was clarified to the lab in an email dated October 17, 2016.
• “Test meets all NELAP requirements unless otherwise specified.”
I.2.3 EAT QA/QC Review
The following analytical notes were included in EAT’s Laboratory Narrative:
• “The Chain of Custody was missing method information. EATL proceeded with the analysis as per the original contract or verbal agreement.”
• “There were no analytical discrepancies.”
The results of EAT’s QA/QC procedures are in Appendix I.
I.2.4 ECS QA/QC Review
The following analytical notes were included in ECS’s Work Order Narrative:
• “Unless otherwise noted on the Sample Receiving forms all samples were received in good condition and within the recommended EPA temperature criteria for the methods noted on the COC. The COC and Sample Receiving Documents are integral elements of the analytical report and are presented at the back of the report.
• All samples were analyzed within prescribed holding times (HT) and/or in accordance with the Calscience Sample Acceptance Policy unless otherwise noted in the analytical report and/or comprehensive case narrative, if required.
• Any parameter identified in 40CFR Part 136.3 Table II that is designated as "analyze immediately" with a holding time of <= 15 minutes (40CFR-136.3 Table II, footnote 4), is considered a "field" test and the reported results will be qualified as being received outside of the stated holding time unless received at the laboratory within 15 minutes of the collection time.
• All quality control parameters (QC) were within established control limits except where noted in the QC summary forms or described further within this report.
The results of ECS’s QA/QC procedures in Appendix I.
I.3 Field Quality Control Results
Field QC samples consisted of field blank samples, trip blanks and lab blank samples, and two field duplicate sample pairs. The results of analysis of the QA/QC samples are presented in Tables 1 through 7 of the report.
I.3.1 Field Blanks, Trip Blanks, and Lab Blanks
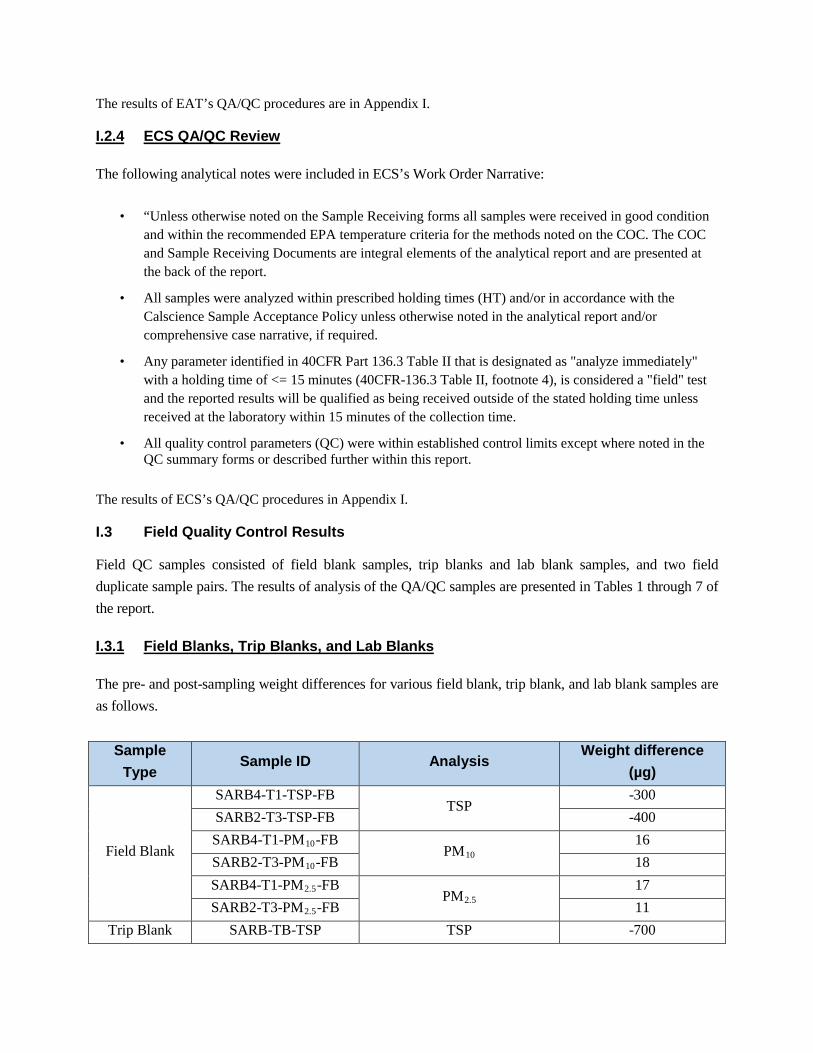
The pre- and post-sampling weight differences for various field blank, trip blank, and lab blank samples are as follows.
Sample Type
Sample ID Analysis Weight difference
(µg)
Field Blank
SARB4-T1-TSP-FB TSP
-300 SARB2-T3-TSP-FB -400 SARB4-T1-PM10-FB
PM10 16
SARB2-T3-PM10-FB 18 SARB4-T1-PM2.5-FB
PM2.5 17
SARB2-T3-PM2.5-FB 11 Trip Blank SARB-TB-TSP TSP -700
Sample Type
Sample ID Analysis Weight difference
(µg) SARB-TB-PM10 PM10 7 SARB-TB-PM2.5 PM2.5 8
Lab Blank
Lab Blank TSP
0 Lab Blank 400 Lab Blank
PM10/PM2.5
3 Lab Blank -1 Lab Blank 2 Lab Blank 2
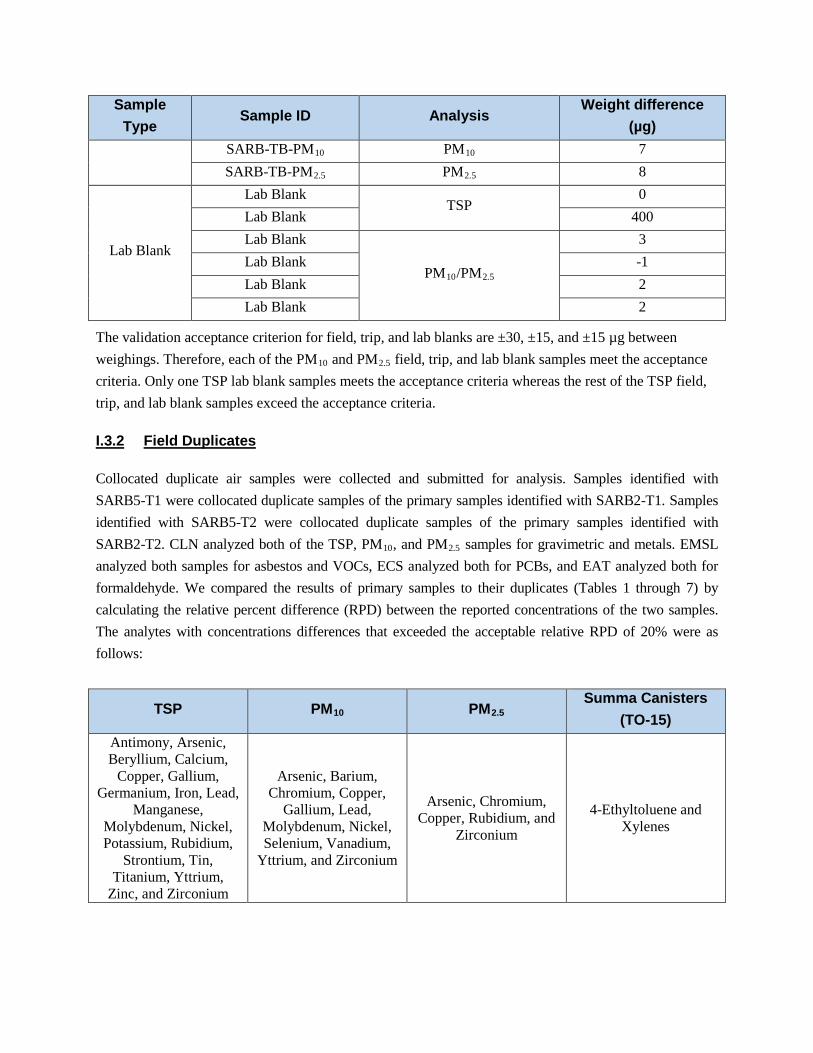
The validation acceptance criterion for field, trip, and lab blanks are ±30, ±15, and ±15 µg between weighings. Therefore, each of the PM10 and PM2.5 field, trip, and lab blank samples meet the acceptance criteria. Only one TSP lab blank samples meets the acceptance criteria whereas the rest of the TSP field, trip, and lab blank samples exceed the acceptance criteria.
I.3.2 Field Duplicates
Collocated duplicate air samples were collected and submitted for analysis. Samples identified with SARB5-T1 were collocated duplicate samples of the primary samples identified with SARB2-T1. Samples identified with SARB5-T2 were collocated duplicate samples of the primary samples identified with SARB2-T2. CLN analyzed both of the TSP, PM10, and PM2.5 samples for gravimetric and metals. EMSL analyzed both samples for asbestos and VOCs, ECS analyzed both for PCBs, and EAT analyzed both for formaldehyde. We compared the results of primary samples to their duplicates (Tables 1 through 7) by calculating the relative percent difference (RPD) between the reported concentrations of the two samples. The analytes with concentrations differences that exceeded the acceptable relative RPD of 20% were as follows:
TSP PM10 PM2.5 Summa Canisters
(TO-15) Antimony, Arsenic, Beryllium, Calcium,
Copper, Gallium, Germanium, Iron, Lead,
Manganese, Molybdenum, Nickel, Potassium, Rubidium,
Strontium, Tin, Titanium, Yttrium,
Zinc, and Zirconium
Arsenic, Barium, Chromium, Copper,
Gallium, Lead, Molybdenum, Nickel, Selenium, Vanadium,
Yttrium, and Zirconium
Arsenic, Chromium, Copper, Rubidium, and
Zirconium
4-Ethyltoluene and Xylenes
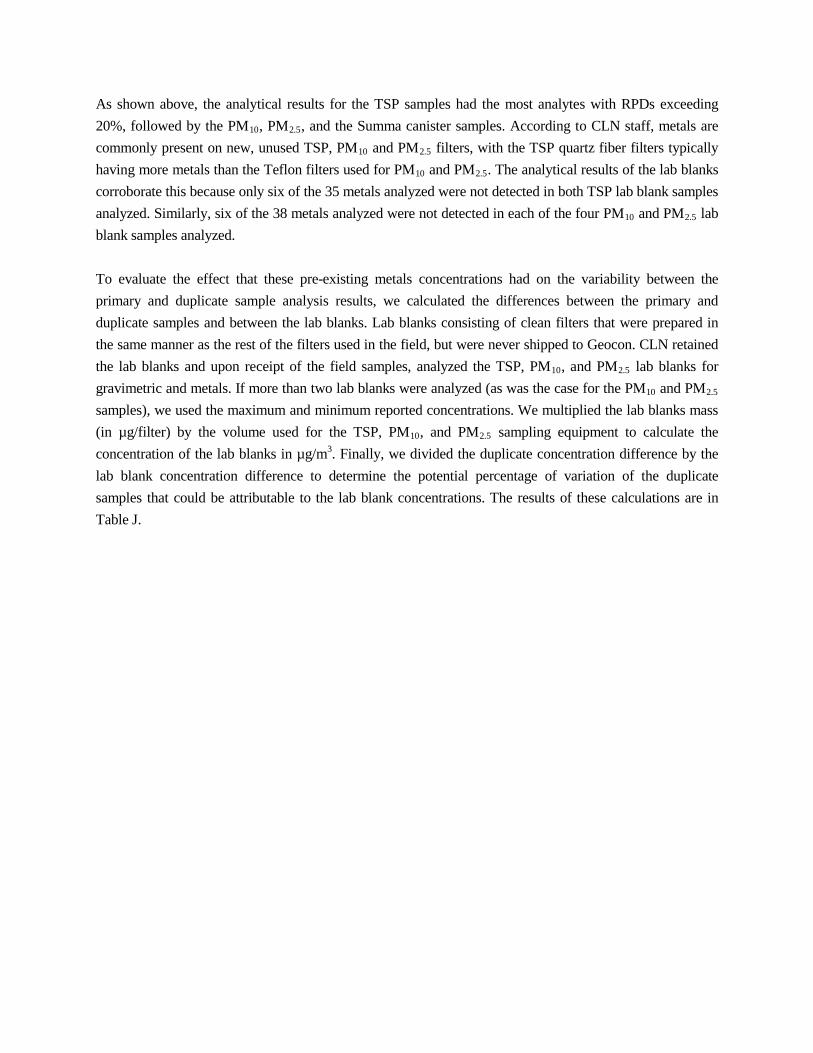
As shown above, the analytical results for the TSP samples had the most analytes with RPDs exceeding 20%, followed by the PM10, PM2.5, and the Summa canister samples. According to CLN staff, metals are commonly present on new, unused TSP, PM10 and PM2.5 filters, with the TSP quartz fiber filters typically having more metals than the Teflon filters used for PM10 and PM2.5. The analytical results of the lab blanks corroborate this because only six of the 35 metals analyzed were not detected in both TSP lab blank samples analyzed. Similarly, six of the 38 metals analyzed were not detected in each of the four PM10 and PM2.5 lab blank samples analyzed. To evaluate the effect that these pre-existing metals concentrations had on the variability between the primary and duplicate sample analysis results, we calculated the differences between the primary and duplicate samples and between the lab blanks. Lab blanks consisting of clean filters that were prepared in the same manner as the rest of the filters used in the field, but were never shipped to Geocon. CLN retained the lab blanks and upon receipt of the field samples, analyzed the TSP, PM10, and PM2.5 lab blanks for gravimetric and metals. If more than two lab blanks were analyzed (as was the case for the PM10 and PM2.5 samples), we used the maximum and minimum reported concentrations. We multiplied the lab blanks mass (in µg/filter) by the volume used for the TSP, PM10, and PM2.5 sampling equipment to calculate the concentration of the lab blanks in µg/m3. Finally, we divided the duplicate concentration difference by the lab blank concentration difference to determine the potential percentage of variation of the duplicate samples that could be attributable to the lab blank concentrations. The results of these calculations are in Table J.
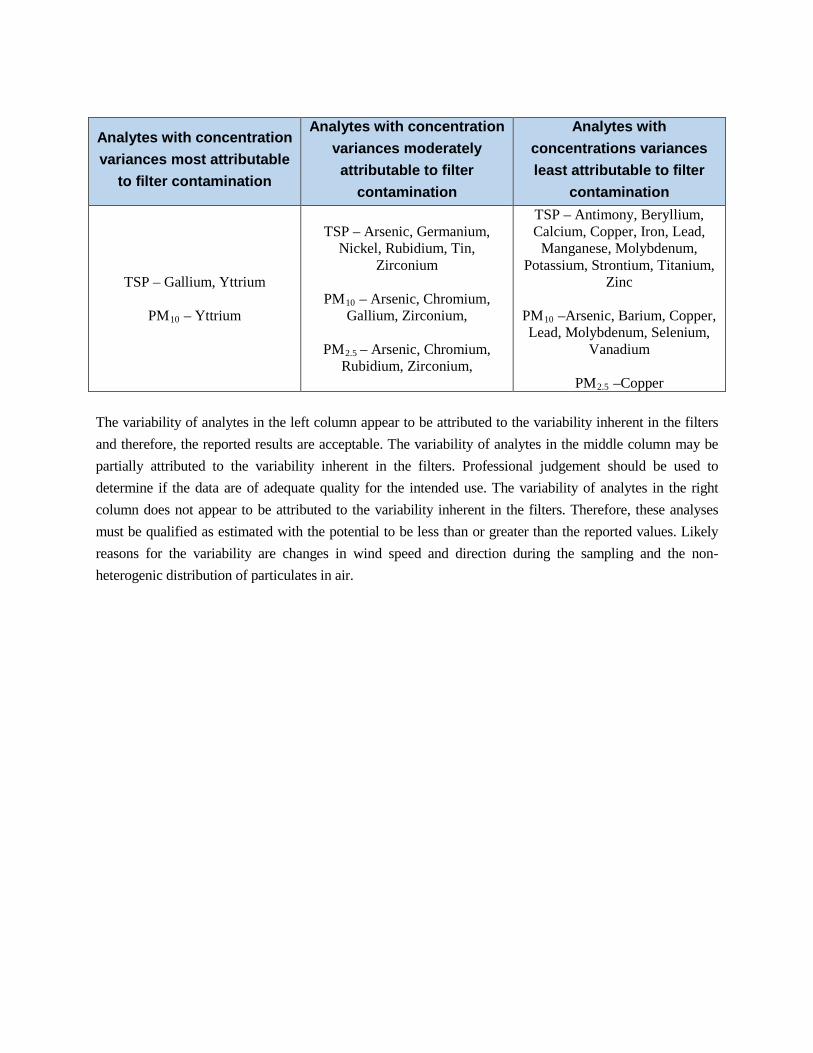
Analytes with concentration variances most attributable
to filter contamination
Analytes with concentration variances moderately attributable to filter
contamination
Analytes with concentrations variances least attributable to filter
contamination
TSP – Gallium, Yttrium
PM10 – Yttrium
TSP – Arsenic, Germanium, Nickel, Rubidium, Tin,
Zirconium
PM10 – Arsenic, Chromium, Gallium, Zirconium,
PM2.5 – Arsenic, Chromium,
Rubidium, Zirconium,
TSP – Antimony, Beryllium, Calcium, Copper, Iron, Lead,
Manganese, Molybdenum, Potassium, Strontium, Titanium,
Zinc
PM10 –Arsenic, Barium, Copper, Lead, Molybdenum, Selenium,
Vanadium
PM2.5 –Copper The variability of analytes in the left column appear to be attributed to the variability inherent in the filters and therefore, the reported results are acceptable. The variability of analytes in the middle column may be partially attributed to the variability inherent in the filters. Professional judgement should be used to determine if the data are of adequate quality for the intended use. The variability of analytes in the right column does not appear to be attributed to the variability inherent in the filters. Therefore, these analyses must be qualified as estimated with the potential to be less than or greater than the reported values. Likely reasons for the variability are changes in wind speed and direction during the sampling and the non-heterogenic distribution of particulates in air.
Sample ID: Primary Result
Duplicate Result
Duplicate Concentration
Difference
Relative Percent
Difference
Lab Blank Minimum
Lab Blank Maximum
Mass Difference
Volume of (used to
convert mass into
concentration)
Lab Blank Concentration
Difference
Possible Variation From Blank Filters1
Primary/Duplicate (µg/m3) (µg/m3) (µg/m3) (%) (µg/filter) (µg/filter) (µg/filter) (m3) (µg/m3) (%)
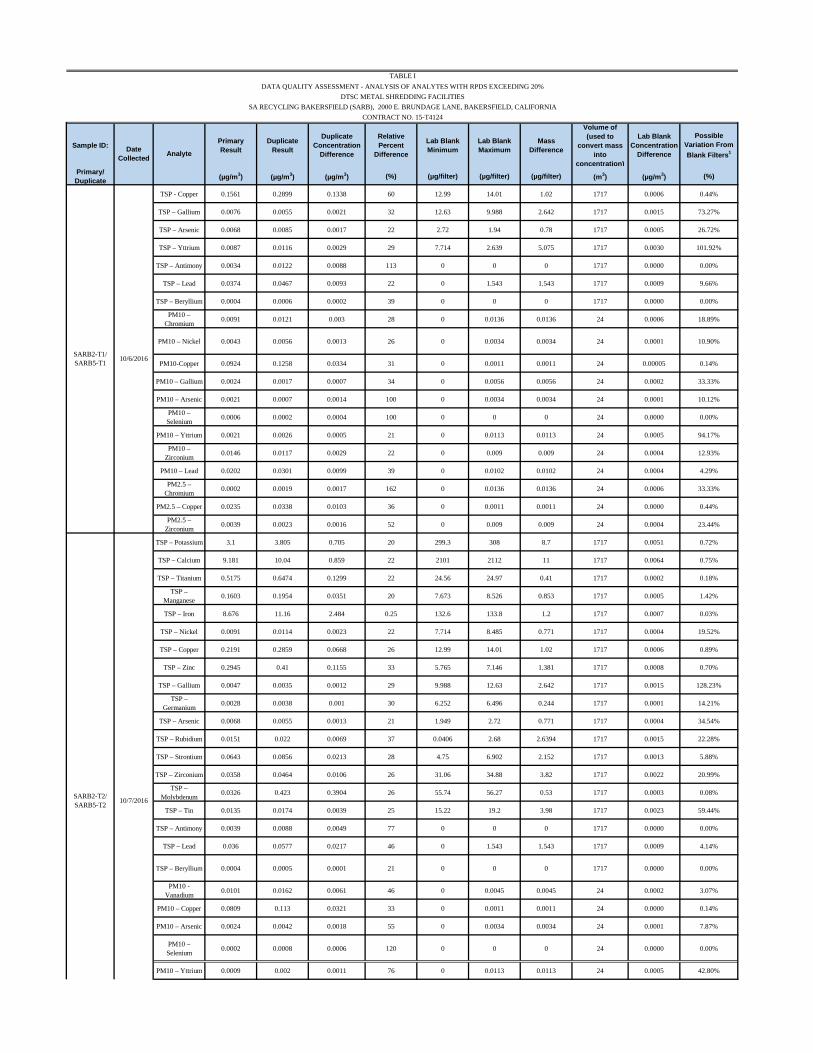
TSP - Copper 0.1561 0.2899 0.1338 60 12.99 14.01 1.02 1717 0.0006 0.44%
TSP – Gallium 0.0076 0.0055 0.0021 32 12.63 9.988 2.642 1717 0.0015 73.27%
TSP – Arsenic 0.0068 0.0085 0.0017 22 2.72 1.94 0.78 1717 0.0005 26.72%
TSP – Yttrium 0.0087 0.0116 0.0029 29 7.714 2.639 5.075 1717 0.0030 101.92%
TSP – Antimony 0.0034 0.0122 0.0088 113 0 0 0 1717 0.0000 0.00%
TSP – Lead 0.0374 0.0467 0.0093 22 0 1.543 1.543 1717 0.0009 9.66%
TSP – Beryllium 0.0004 0.0006 0.0002 39 0 0 0 1717 0.0000 0.00%
PM10 – Chromium 0.0091 0.0121 0.003 28 0 0.0136 0.0136 24 0.0006 18.89%
PM10 – Nickel 0.0043 0.0056 0.0013 26 0 0.0034 0.0034 24 0.0001 10.90%
PM10-Copper 0.0924 0.1258 0.0334 31 0 0.0011 0.0011 24 0.00005 0.14%
PM10 – Gallium 0.0024 0.0017 0.0007 34 0 0.0056 0.0056 24 0.0002 33.33%
PM10 – Arsenic 0.0021 0.0007 0.0014 100 0 0.0034 0.0034 24 0.0001 10.12%
PM10 – Selenium 0.0006 0.0002 0.0004 100 0 0 0 24 0.0000 0.00%
PM10 – Yttrium 0.0021 0.0026 0.0005 21 0 0.0113 0.0113 24 0.0005 94.17%
PM10 – Zirconium 0.0146 0.0117 0.0029 22 0 0.009 0.009 24 0.0004 12.93%
PM10 – Lead 0.0202 0.0301 0.0099 39 0 0.0102 0.0102 24 0.0004 4.29%
PM2.5 – Chromium 0.0002 0.0019 0.0017 162 0 0.0136 0.0136 24 0.0006 33.33%
PM2.5 – Copper 0.0235 0.0338 0.0103 36 0 0.0011 0.0011 24 0.0000 0.44%
PM2.5 – Zirconium 0.0039 0.0023 0.0016 52 0 0.009 0.009 24 0.0004 23.44%
TSP – Potassium 3.1 3.805 0.705 20 299.3 308 8.7 1717 0.0051 0.72%
TSP – Calcium 9.181 10.04 0.859 22 2101 2112 11 1717 0.0064 0.75%
TSP – Titanium 0.5175 0.6474 0.1299 22 24.56 24.97 0.41 1717 0.0002 0.18%
TSP – Manganese 0.1603 0.1954 0.0351 20 7.673 8.526 0.853 1717 0.0005 1.42%
TSP – Iron 8.676 11.16 2.484 0.25 132.6 133.8 1.2 1717 0.0007 0.03%
TSP – Nickel 0.0091 0.0114 0.0023 22 7.714 8.485 0.771 1717 0.0004 19.52%
TSP – Copper 0.2191 0.2859 0.0668 26 12.99 14.01 1.02 1717 0.0006 0.89%
TSP – Zinc 0.2945 0.41 0.1155 33 5.765 7.146 1.381 1717 0.0008 0.70%
TSP – Gallium 0.0047 0.0035 0.0012 29 9.988 12.63 2.642 1717 0.0015 128.23%
TSP – Germanium 0.0028 0.0038 0.001 30 6.252 6.496 0.244 1717 0.0001 14.21%
TSP – Arsenic 0.0068 0.0055 0.0013 21 1.949 2.72 0.771 1717 0.0004 34.54%
TSP – Rubidium 0.0151 0.022 0.0069 37 0.0406 2.68 2.6394 1717 0.0015 22.28%
TSP – Strontium 0.0643 0.0856 0.0213 28 4.75 6.902 2.152 1717 0.0013 5.88%
TSP – Zirconium 0.0358 0.0464 0.0106 26 31.06 34.88 3.82 1717 0.0022 20.99%
TSP – Molybdenum 0.0326 0.423 0.3904 26 55.74 56.27 0.53 1717 0.0003 0.08%
TSP – Tin 0.0135 0.0174 0.0039 25 15.22 19.2 3.98 1717 0.0023 59.44%
TSP – Antimony 0.0039 0.0088 0.0049 77 0 0 0 1717 0.0000 0.00%
TSP – Lead 0.036 0.0577 0.0217 46 0 1.543 1.543 1717 0.0009 4.14%
TSP – Beryllium 0.0004 0.0005 0.0001 21 0 0 0 1717 0.0000 0.00%
PM10 - Vanadium 0.0101 0.0162 0.0061 46 0 0.0045 0.0045 24 0.0002 3.07%
PM10 – Copper 0.0809 0.113 0.0321 33 0 0.0011 0.0011 24 0.0000 0.14%
PM10 – Arsenic 0.0024 0.0042 0.0018 55 0 0.0034 0.0034 24 0.0001 7.87%
PM10 – Selenium 0.0002 0.0008 0.0006 120 0 0 0 24 0.0000 0.00%
PM10 – Yttrium 0.0009 0.002 0.0011 76 0 0.0113 0.0113 24 0.0005 42.80%
TABLE IDATA QUALITY ASSESSMENT - ANALYSIS OF ANALYTES WITH RPDS EXCEEDING 20%
Date Collected Analyte
10/6/2016
DTSC METAL SHREDDING FACILITIESSA RECYCLING BAKERSFIELD (SARB), 2000 E. BRUNDAGE LANE, BAKERSFIELD, CALIFORNIA
CONTRACT NO. 15-T4124
SARB2-T1/SARB5-T1
SARB2-T2/SARB5-T2 10/7/2016
Sample ID: Primary Result
Duplicate Result
Duplicate Concentration
Difference
Relative Percent
Difference
Lab Blank Minimum
Lab Blank Maximum
Mass Difference
Volume of (used to
convert mass into
concentration)
Lab Blank Concentration
Difference
Possible Variation From Blank Filters1
Primary/Duplicate (µg/m3) (µg/m3) (µg/m3) (%) (µg/filter) (µg/filter) (µg/filter) (m3) (µg/m3) (%)
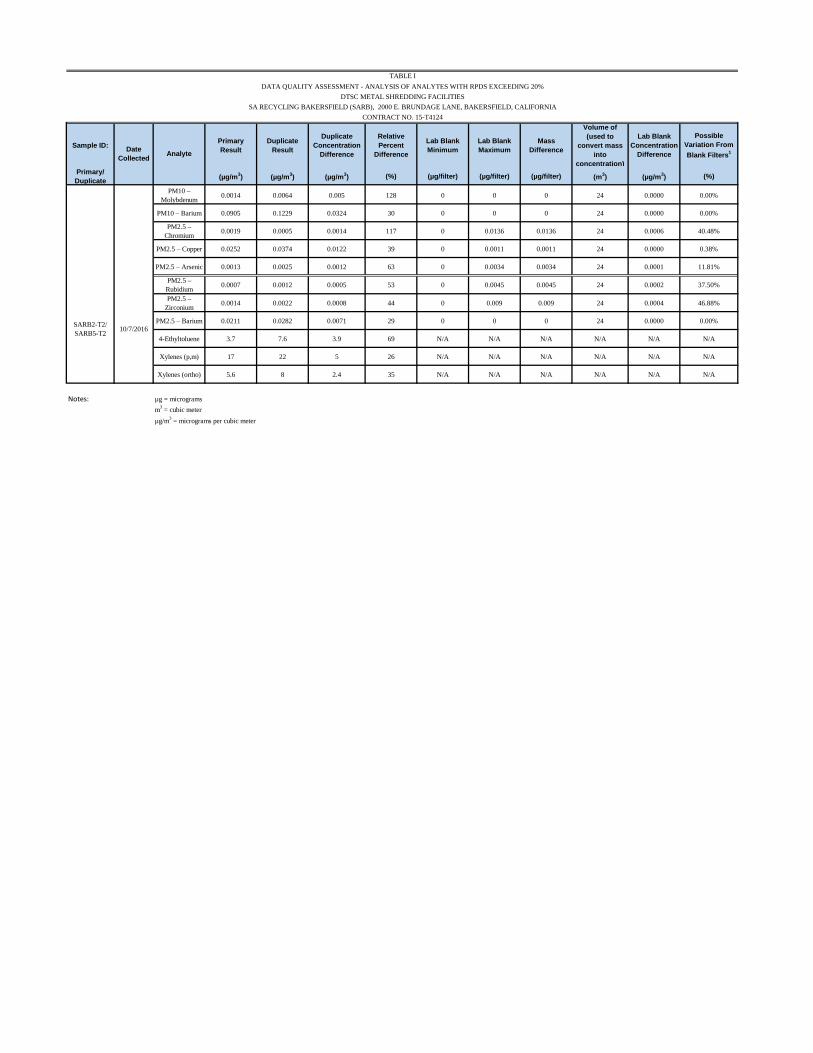
TABLE IDATA QUALITY ASSESSMENT - ANALYSIS OF ANALYTES WITH RPDS EXCEEDING 20%
Date Collected Analyte
DTSC METAL SHREDDING FACILITIESSA RECYCLING BAKERSFIELD (SARB), 2000 E. BRUNDAGE LANE, BAKERSFIELD, CALIFORNIA
CONTRACT NO. 15-T4124
PM10 – Molybdenum 0.0014 0.0064 0.005 128 0 0 0 24 0.0000 0.00%
PM10 – Barium 0.0905 0.1229 0.0324 30 0 0 0 24 0.0000 0.00%
PM2.5 – Chromium 0.0019 0.0005 0.0014 117 0 0.0136 0.0136 24 0.0006 40.48%
PM2.5 – Copper 0.0252 0.0374 0.0122 39 0 0.0011 0.0011 24 0.0000 0.38%
PM2.5 – Arsenic 0.0013 0.0025 0.0012 63 0 0.0034 0.0034 24 0.0001 11.81%
PM2.5 – Rubidium 0.0007 0.0012 0.0005 53 0 0.0045 0.0045 24 0.0002 37.50%
PM2.5 – Zirconium 0.0014 0.0022 0.0008 44 0 0.009 0.009 24 0.0004 46.88%
PM2.5 – Barium 0.0211 0.0282 0.0071 29 0 0 0 24 0.0000 0.00%
4-Ethyltoluene 3.7 7.6 3.9 69 N/A N/A N/A N/A N/A N/A
Xylenes (p,m) 17 22 5 26 N/A N/A N/A N/A N/A N/A
Xylenes (ortho) 5.6 8 2.4 35 N/A N/A N/A N/A N/A N/A
Notes: µg = micrograms m3 = cubic meterµg/m3 = micrograms per cubic meter
SARB2-T2/SARB5-T2 10/7/2016
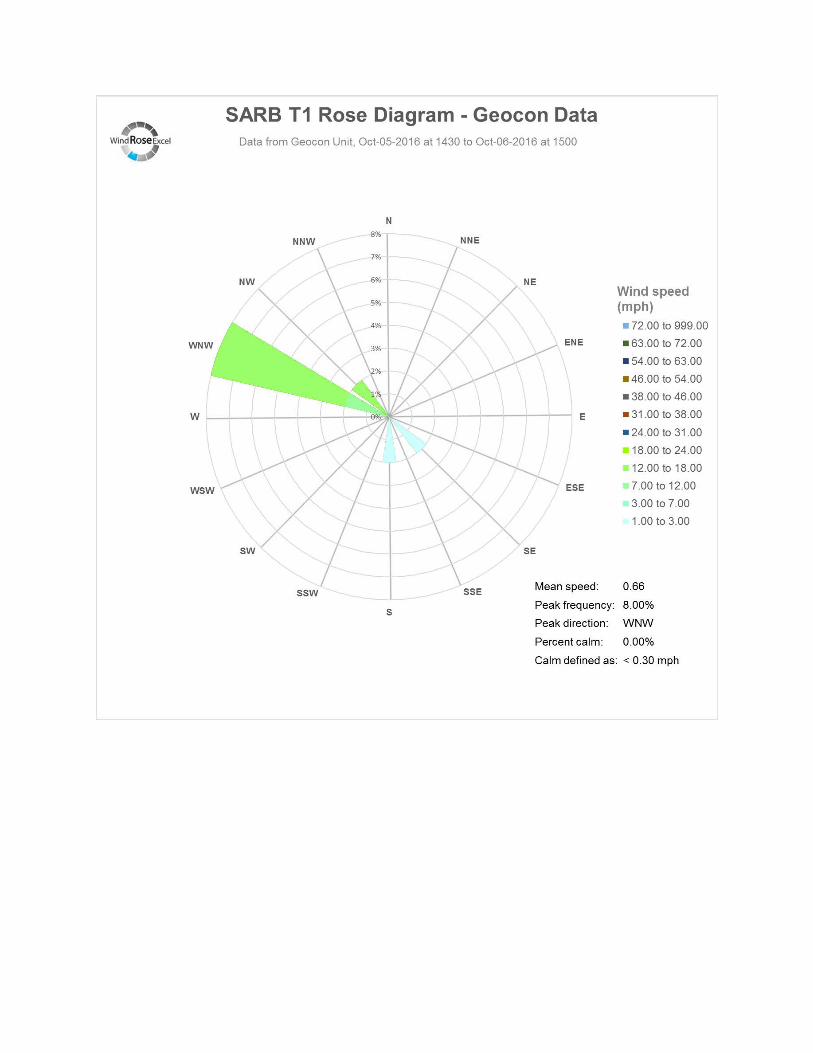
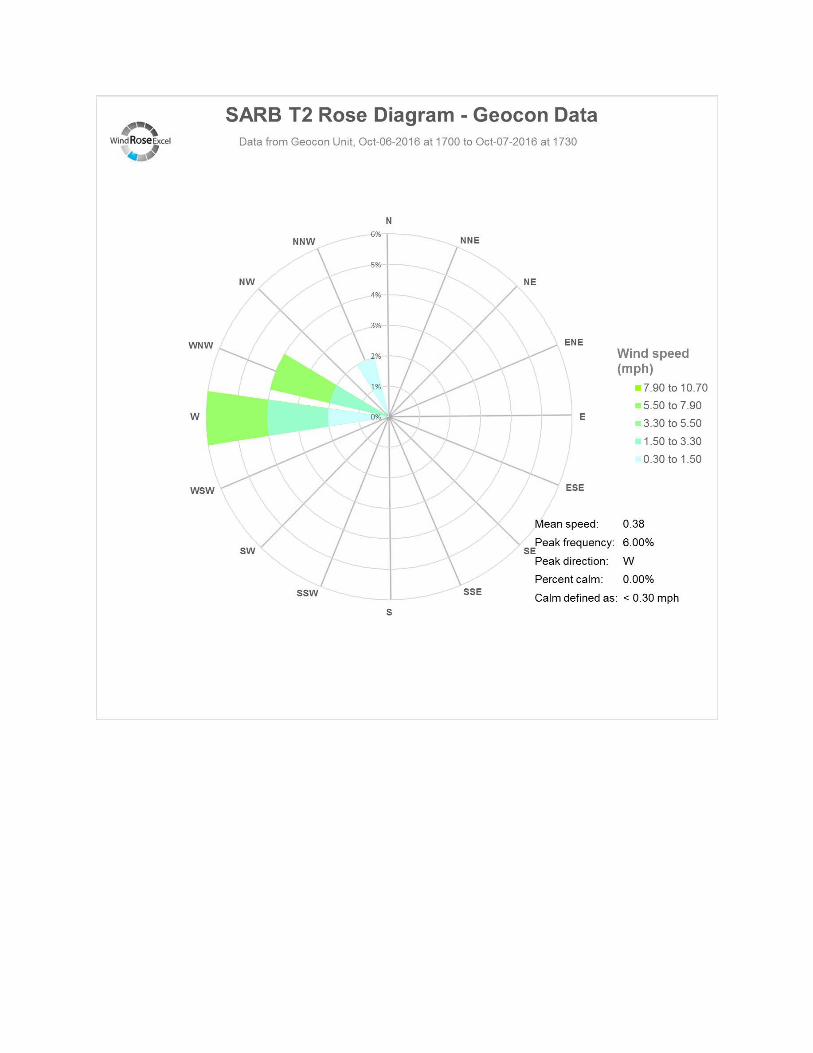
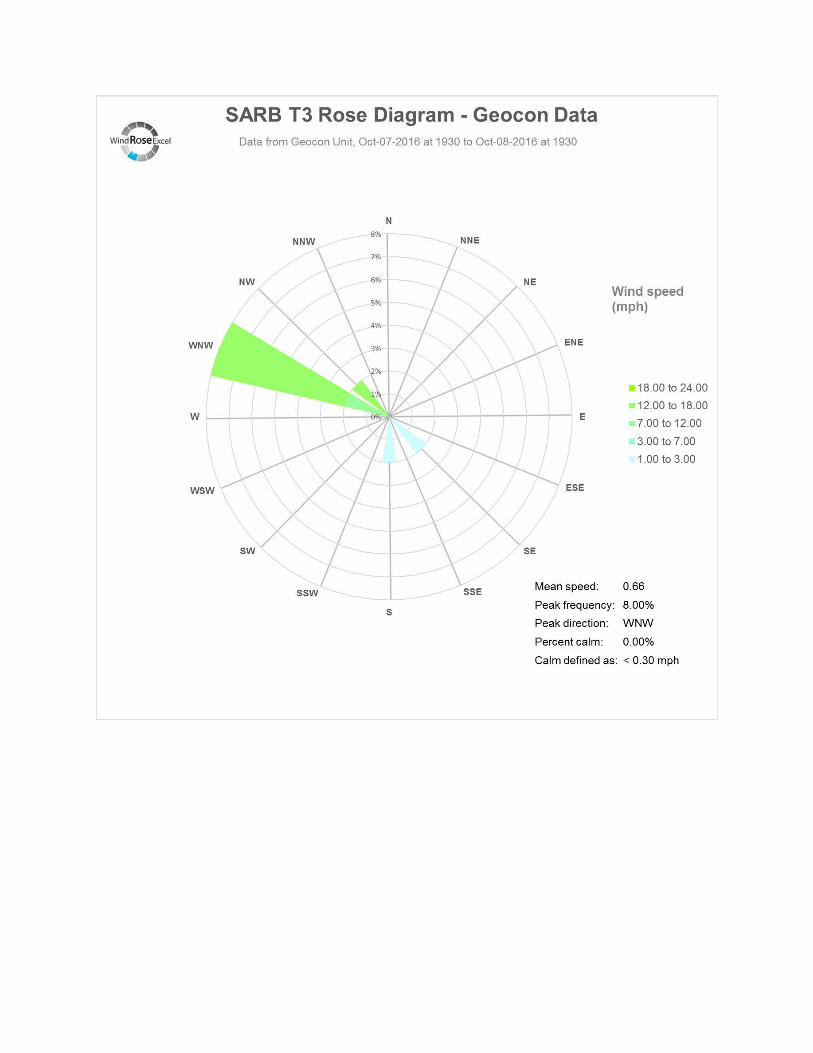
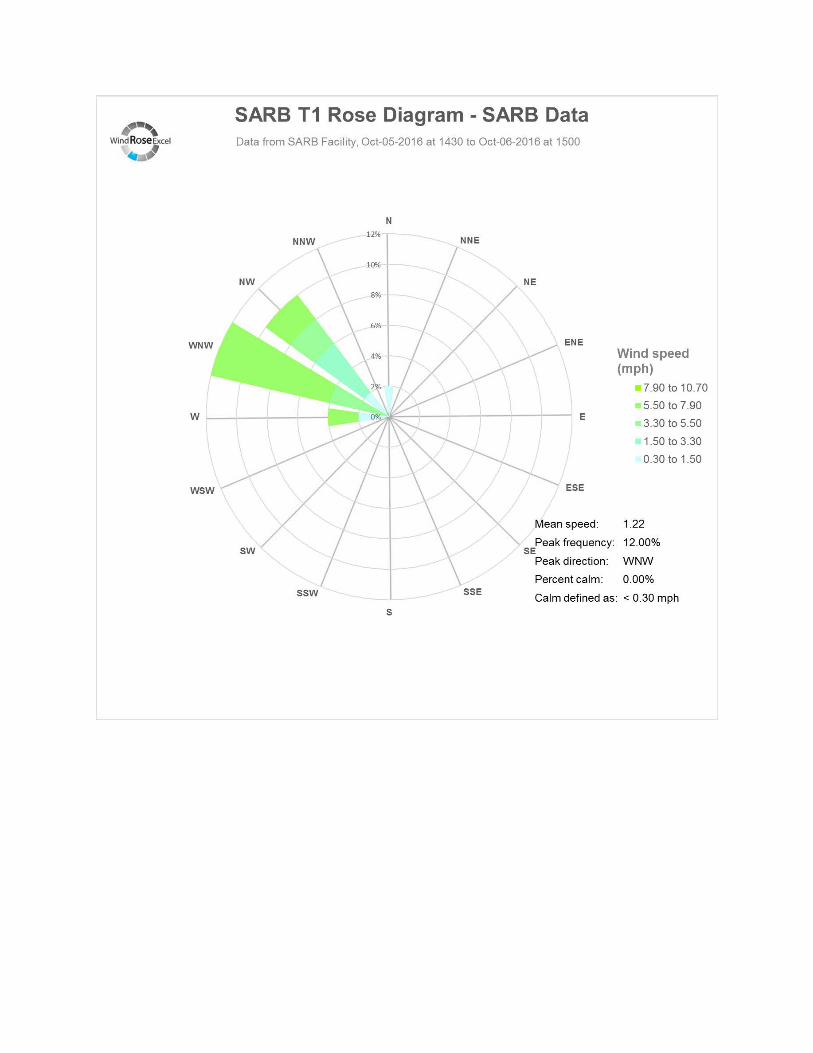
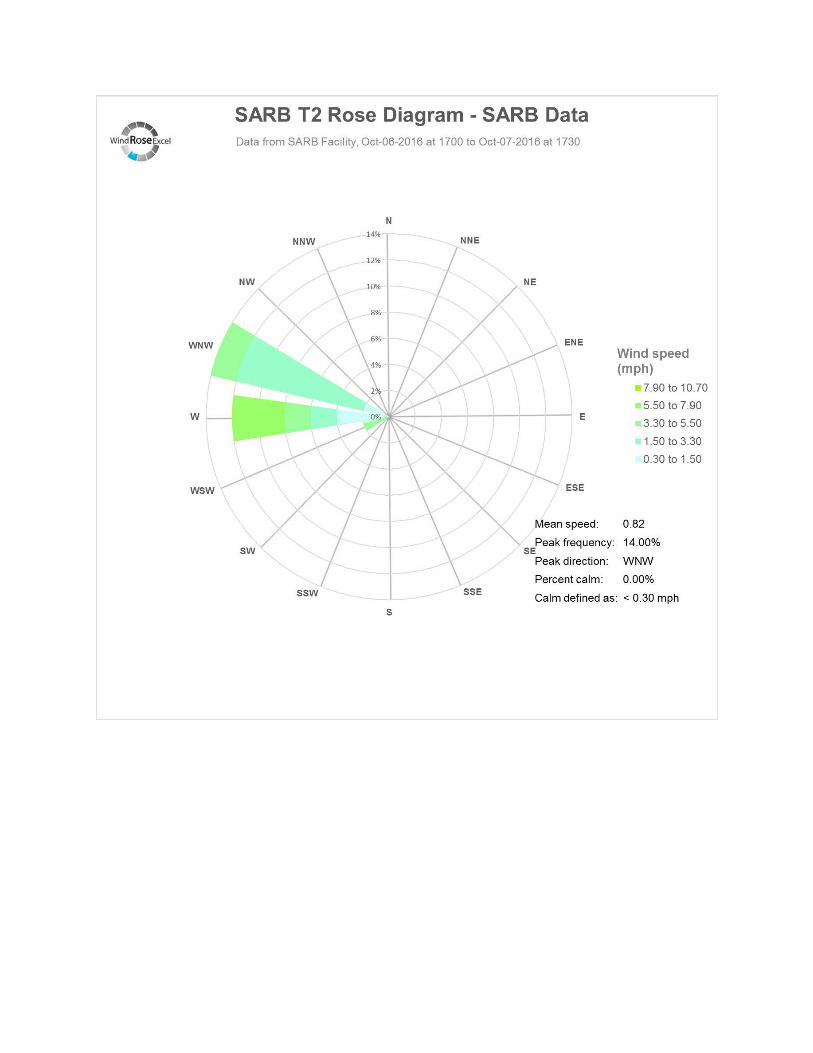
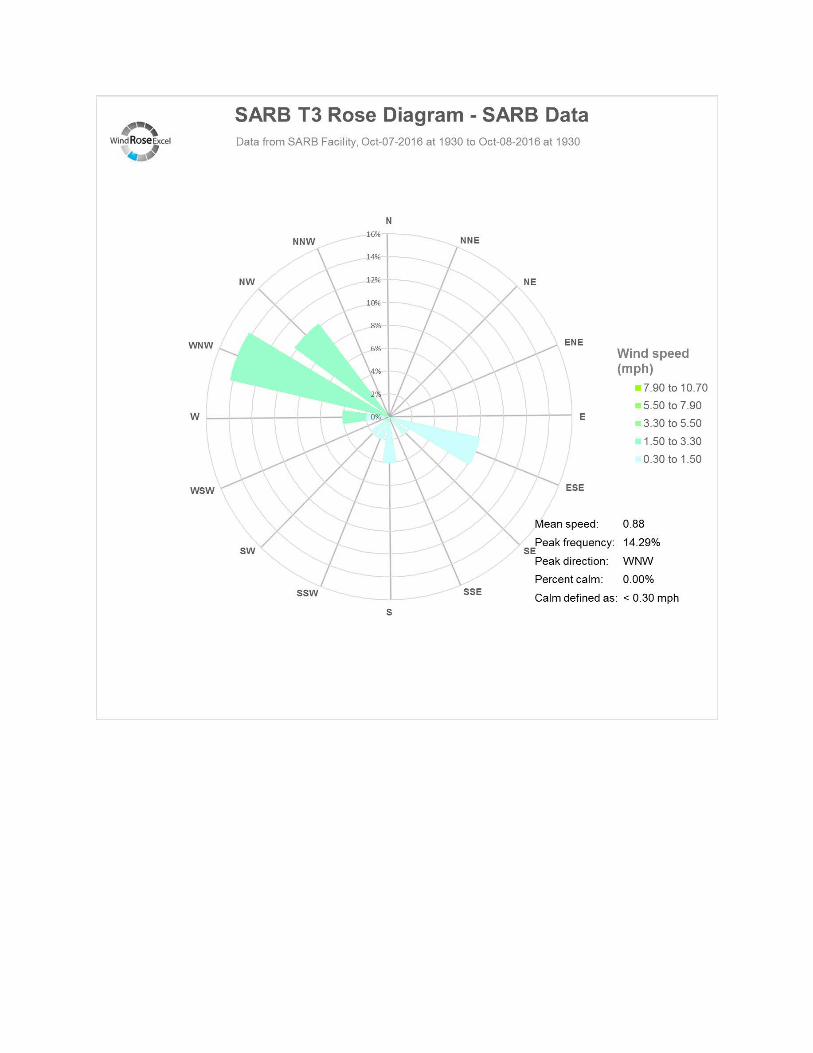
APPENDIX J
Wind Rose Diagrams