Data Presentation A guide to good graphics Bureau of Justice Statistics Marianne W. Zawitz.
50
Data Presentation Data Presentation A guide to good graphics Bureau of Justice Bureau of Justice Statistics Statistics Marianne W. Marianne W. Zawitz Zawitz
-
Upload
lorin-haynes -
Category
Documents
-
view
220 -
download
0
Transcript of Data Presentation A guide to good graphics Bureau of Justice Statistics Marianne W. Zawitz.
Data PresentationData Presentation
A guide to good graphics
Bureau of Justice StatisticsBureau of Justice Statistics Marianne W. ZawitzMarianne W. Zawitz
Bureau of Justice StatisticsBureau of Justice Statistics
Quality presentations of data -Quality presentations of data -
Take advantage of how we already process information
Reduce the number of processes required to understand the data
Tear down some fundamental obstacles to understanding
show the big picture
are paragraphs of data
are best when constructed to convey one finding or concept
Statistical Graphics -- Statistical Graphics --
Bureau of Justice StatisticsBureau of Justice Statistics
Bureau of Justice StatisticsBureau of Justice Statistics
Therefore, you should maximize:
Data density
Data ink
The purpose is to show the data. The purpose is to show the data.
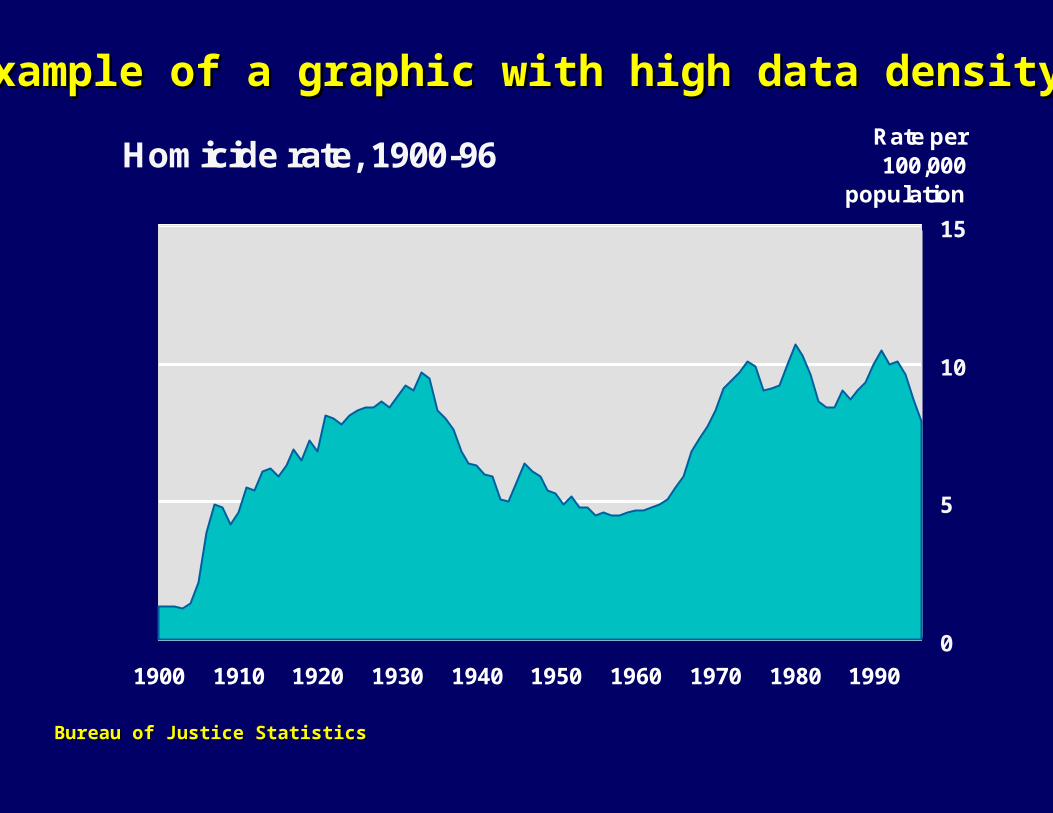
Homicide rate, 1900-96
0
5
10
15
1900 1910 1920 1930 1940 1950 1960 1970 1980 1990
Rate per 100,000
population
Bureau of Justice StatisticsBureau of Justice Statistics
Example of a graphic with high data densityExample of a graphic with high data density
Bureau of Justice StatisticsBureau of Justice Statistics
Use graphics, when you have -Use graphics, when you have -
More than 10 data points
To show big picture not fine data
Use tables, when you need -Use tables, when you need -
Exact numeric values
Localized comparisons
Bureau of Justice StatisticsBureau of Justice Statistics
Graphics for continuous variablesGraphics for continuous variables
Line graphs
Area charts
Scatter plots
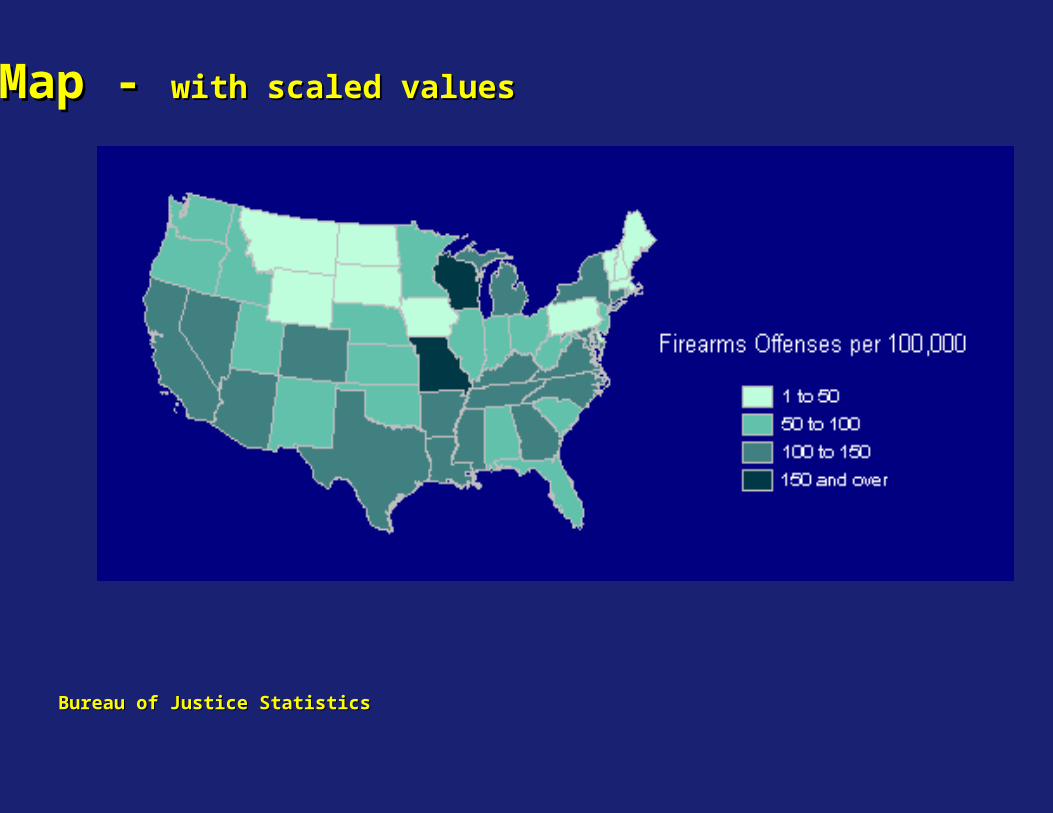
Maps
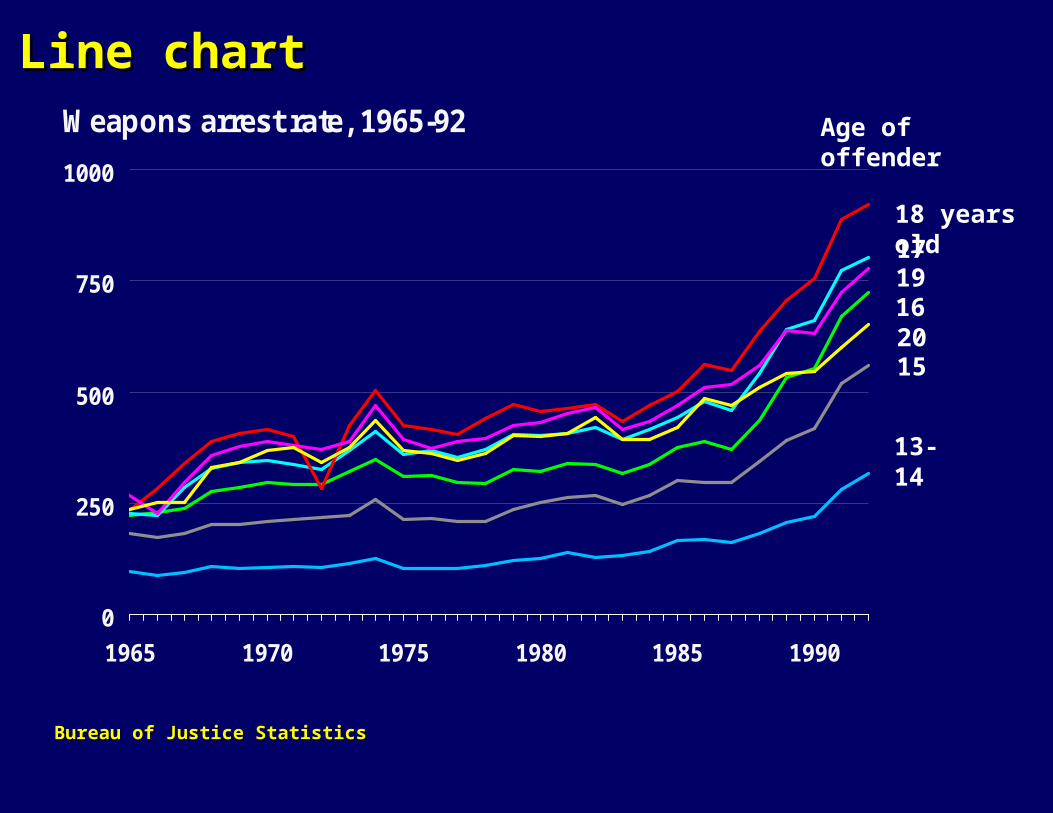
Weapons arrest rate, 1965-92
0
250
500
750
1000
1965 1970 1975 1980 1985 1990
Bureau of Justice StatisticsBureau of Justice Statistics
13-14
15
16
1718 years old
19
20
Age of offender
Line chartLine chart
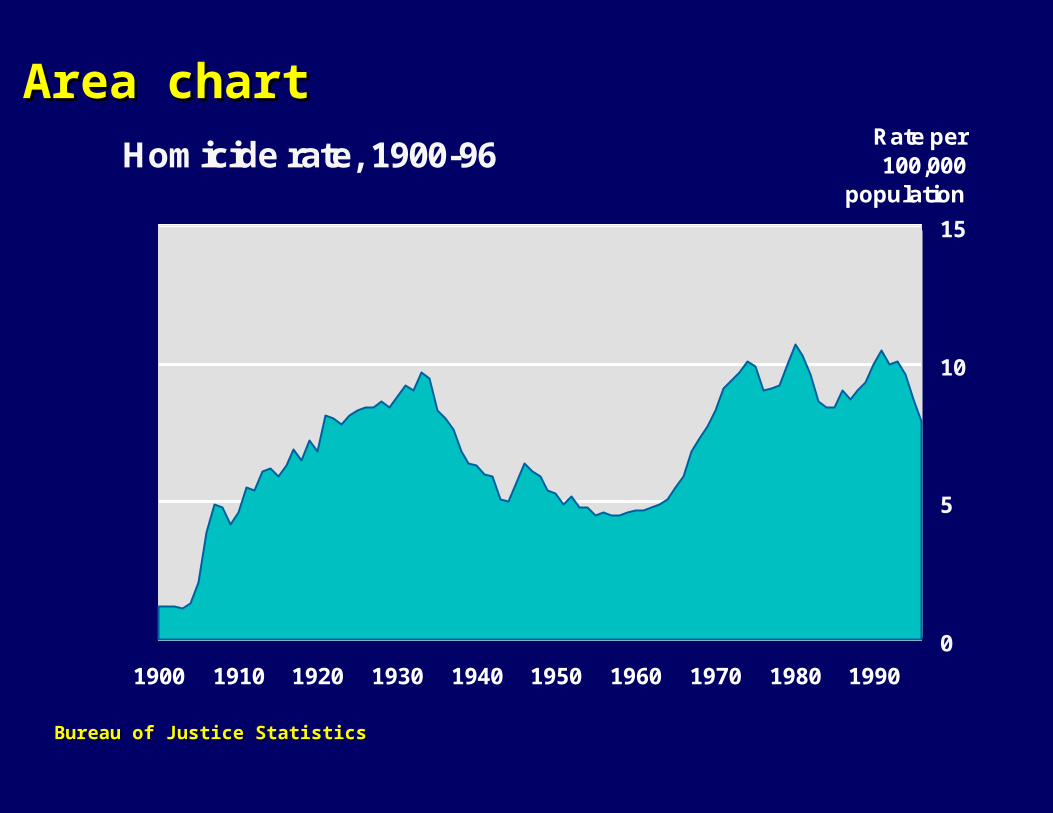
Homicide rate, 1900-96
0
5
10
15
1900 1910 1920 1930 1940 1950 1960 1970 1980 1990
Rate per 100,000
population
Area chartArea chart
Bureau of Justice StatisticsBureau of Justice Statistics
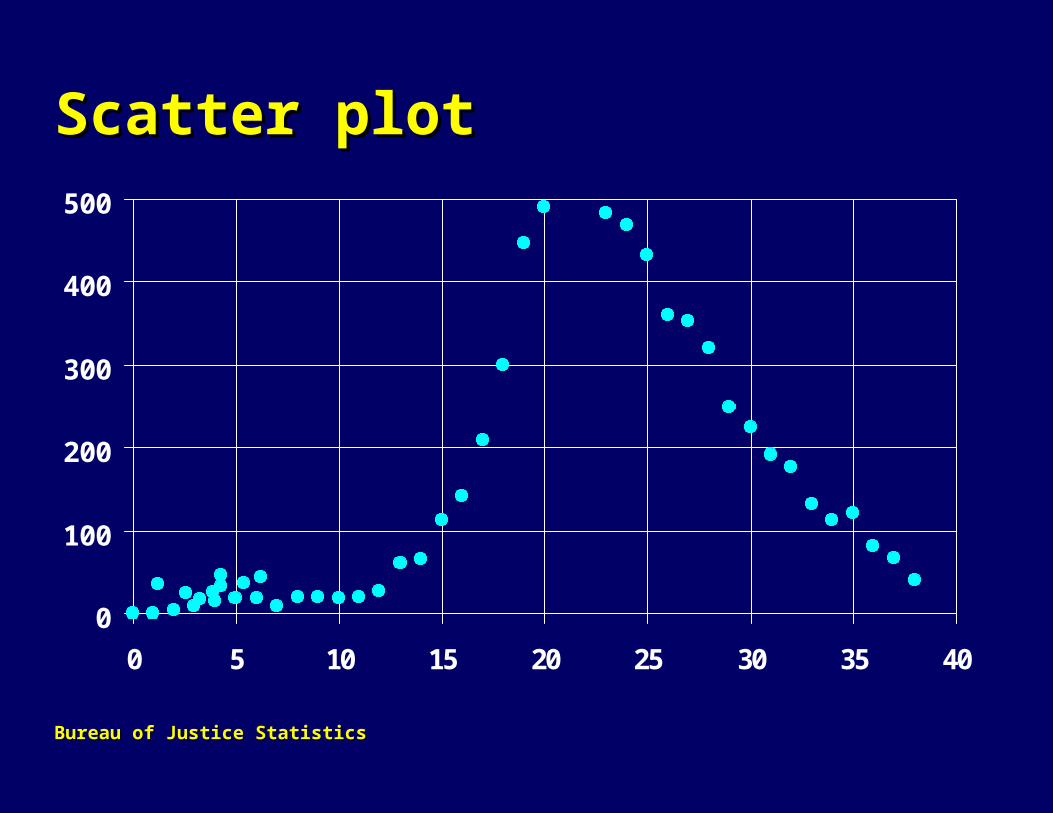
Scatter plotScatter plot
0
100
200
300
400
500
0 5 10 15 20 25 30 35 40
Bureau of Justice StatisticsBureau of Justice Statistics
Bureau of Justice StatisticsBureau of Justice Statistics
Map - Map - with scaled valueswith scaled values
Bureau of Justice StatisticsBureau of Justice Statistics
Graphics for categorical variablesGraphics for categorical variables
Bar graphs
Maps
Diagrams
Bureau of Justice StatisticsBureau of Justice Statistics
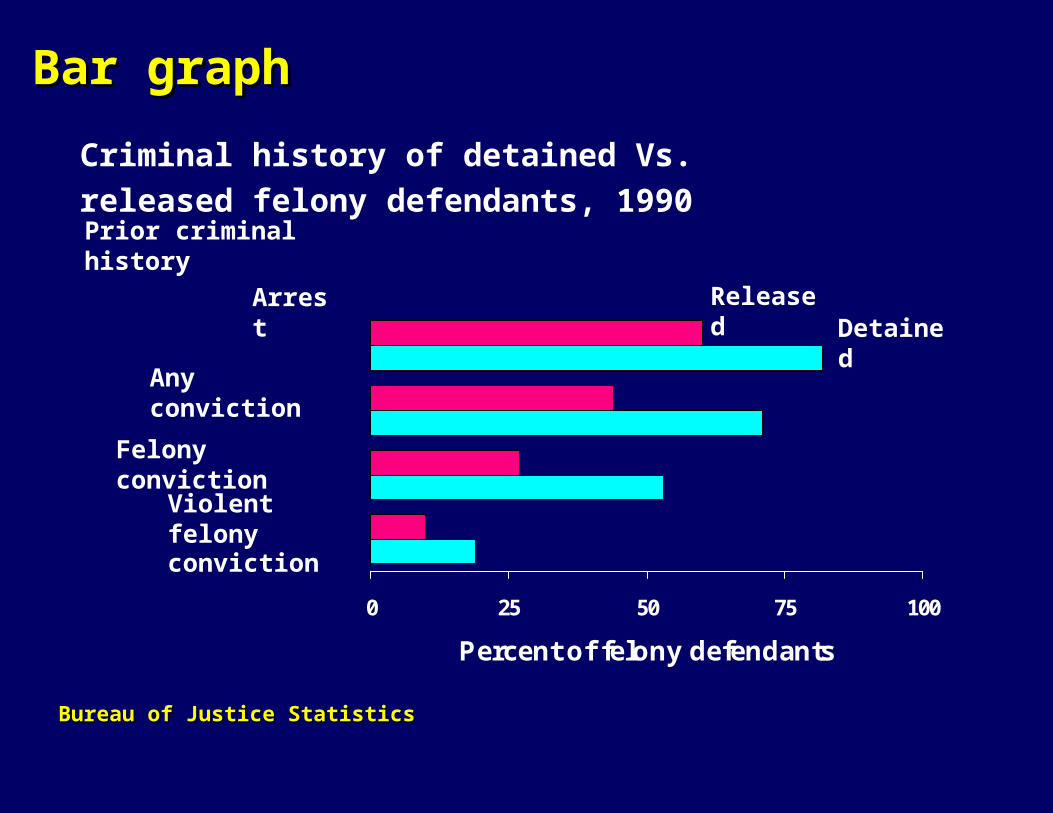
Criminal history of detained Vs. released felony defendants, 1990
0 25 50 75 100
Percent of felony defendants
Prior criminal history
Arrest
Any conviction
Felony conviction
Violent felony conviction
ReleasedDetained
Bar graphBar graph
Bureau of Justice StatisticsBureau of Justice Statistics
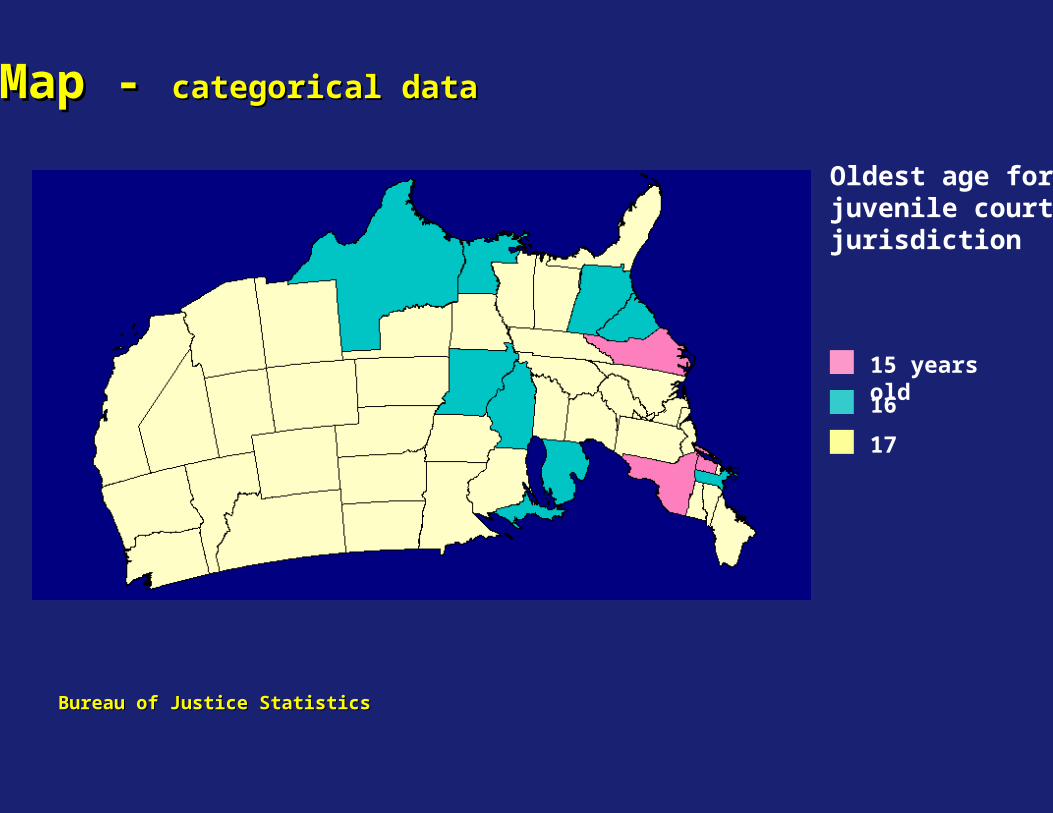
Oldest age forjuvenile courtjurisdiction
15 years old
16
17
Map - Map - categorical datacategorical data
Bureau of Justice StatisticsBureau of Justice Statistics
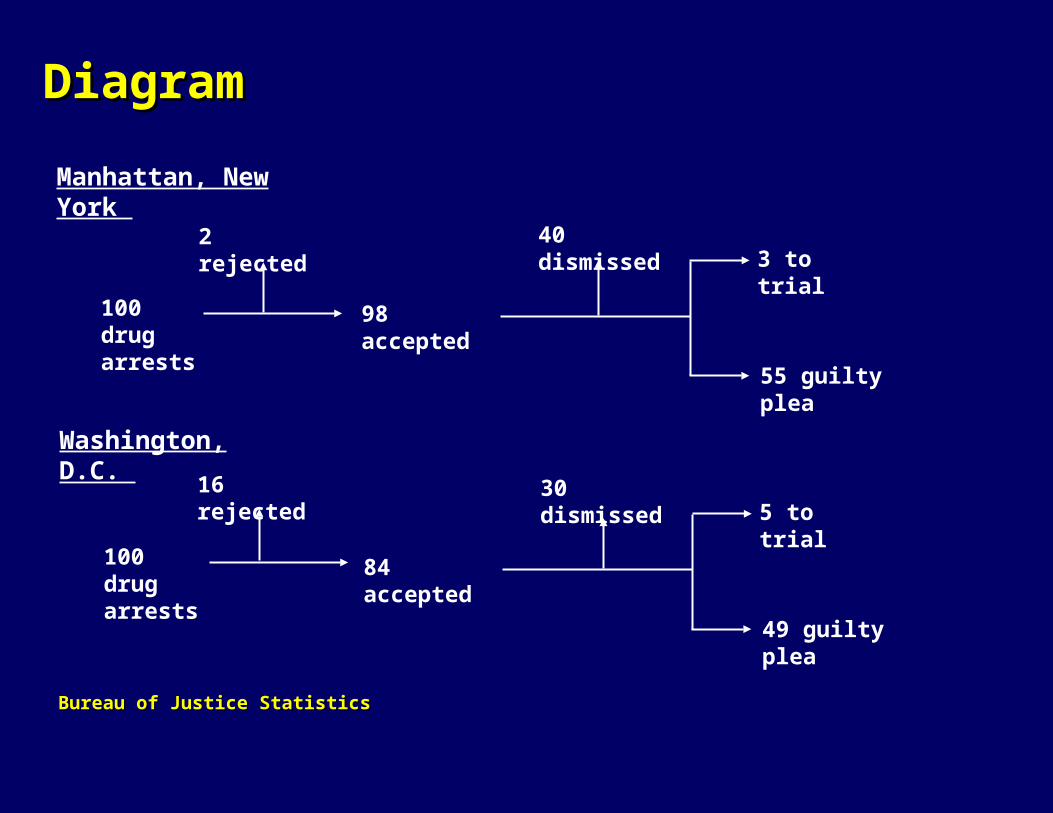
100 drugarrests
100 drugarrests
98 accepted
3 to trial
55 guilty plea
40 dismissed2 rejected
84 accepted
5 to trial
49 guilty plea
30 dismissed16 rejected
Manhattan, New York
Washington, D.C.
DiagramDiagram
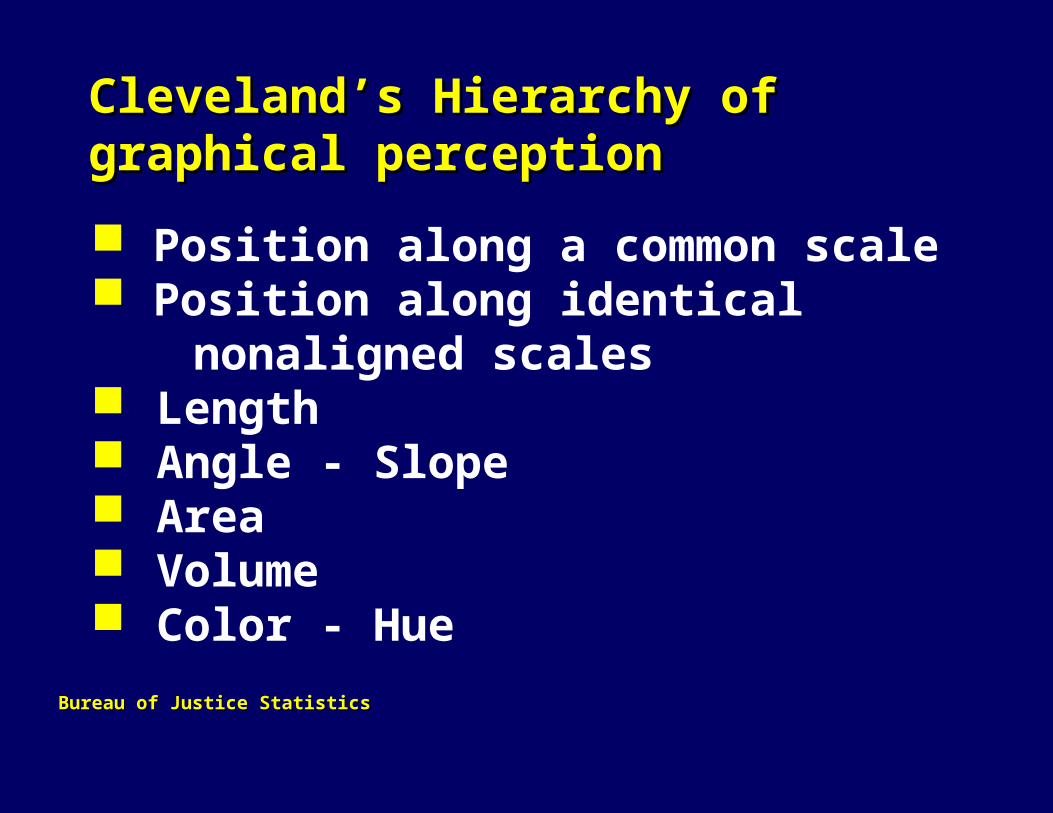
Cleveland’s Hierarchy of graphical Cleveland’s Hierarchy of graphical perceptionperception
Position along a common scale Position along identical nonaligned scales
Length Angle - Slope Area Volume Color - Hue
Bureau of Justice StatisticsBureau of Justice Statistics
Graphic styles to avoidGraphic styles to avoid
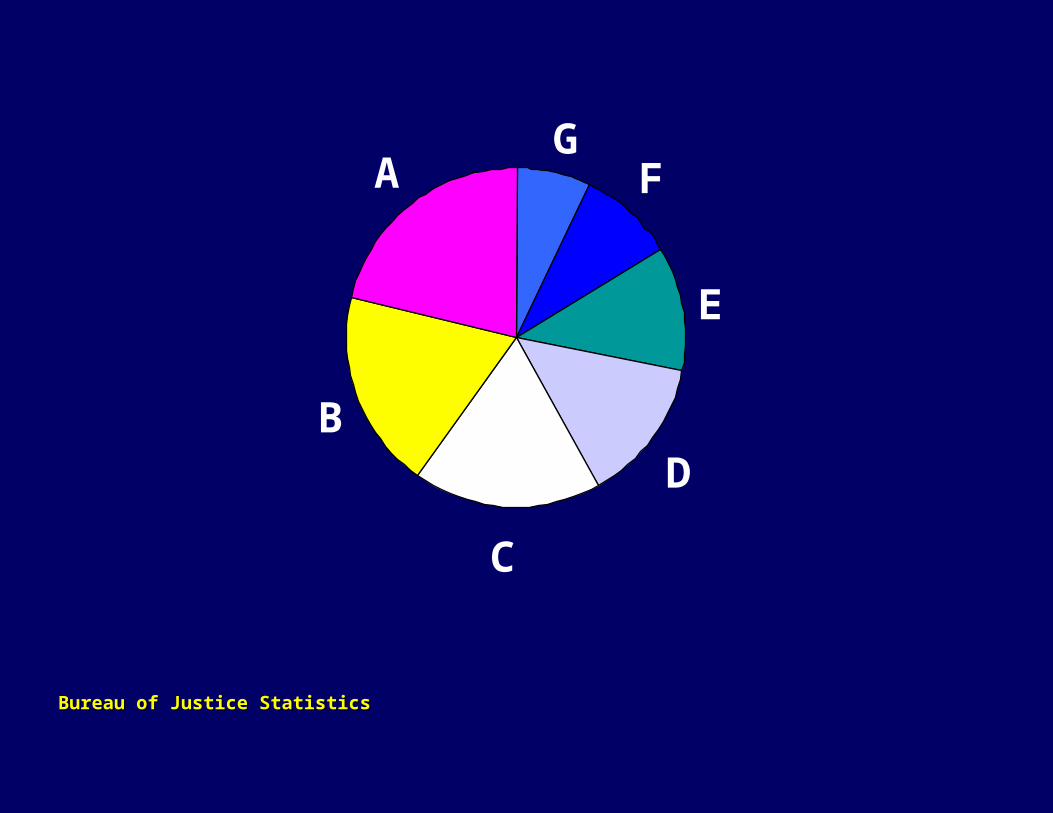
Pie charts
Stacked bar graphs
Stacked line graphs
Bureau of Justice StatisticsBureau of Justice Statistics
Bureau of Justice StatisticsBureau of Justice Statistics
G
F
E
D
C
B
A
Bureau of Justice StatisticsBureau of Justice Statistics
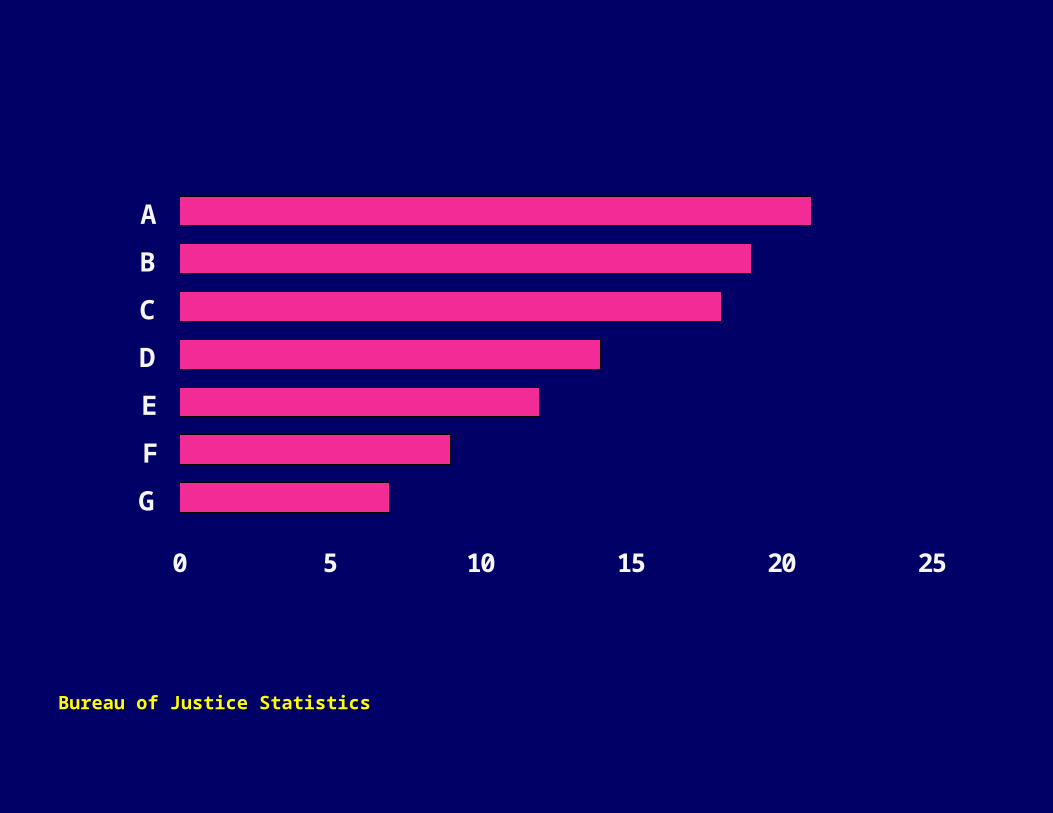
0 5 10 15 20 25
A
B
C
D
E
F
G
Bureau of Justice StatisticsBureau of Justice Statistics
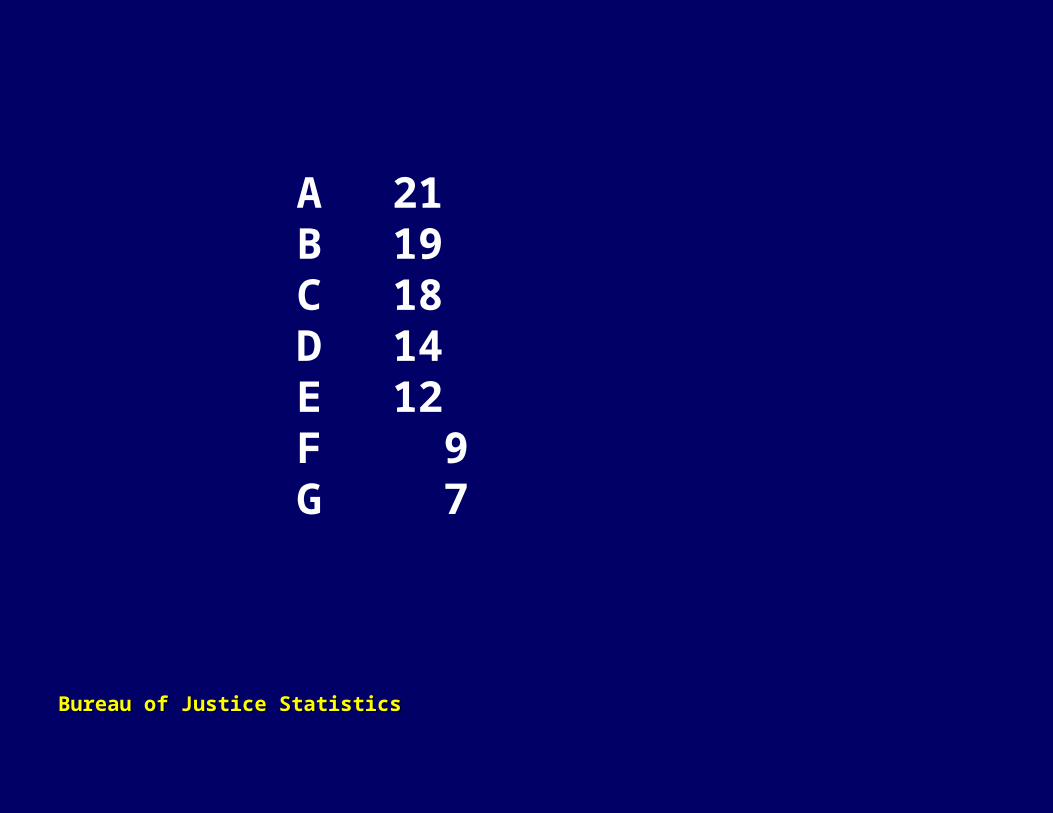
A 21B 19C 18D 14E 12F 9G 7
Bureau of Justice StatisticsBureau of Justice Statistics
"Simplicity of design and complexity of data"
Edward R. Tufte
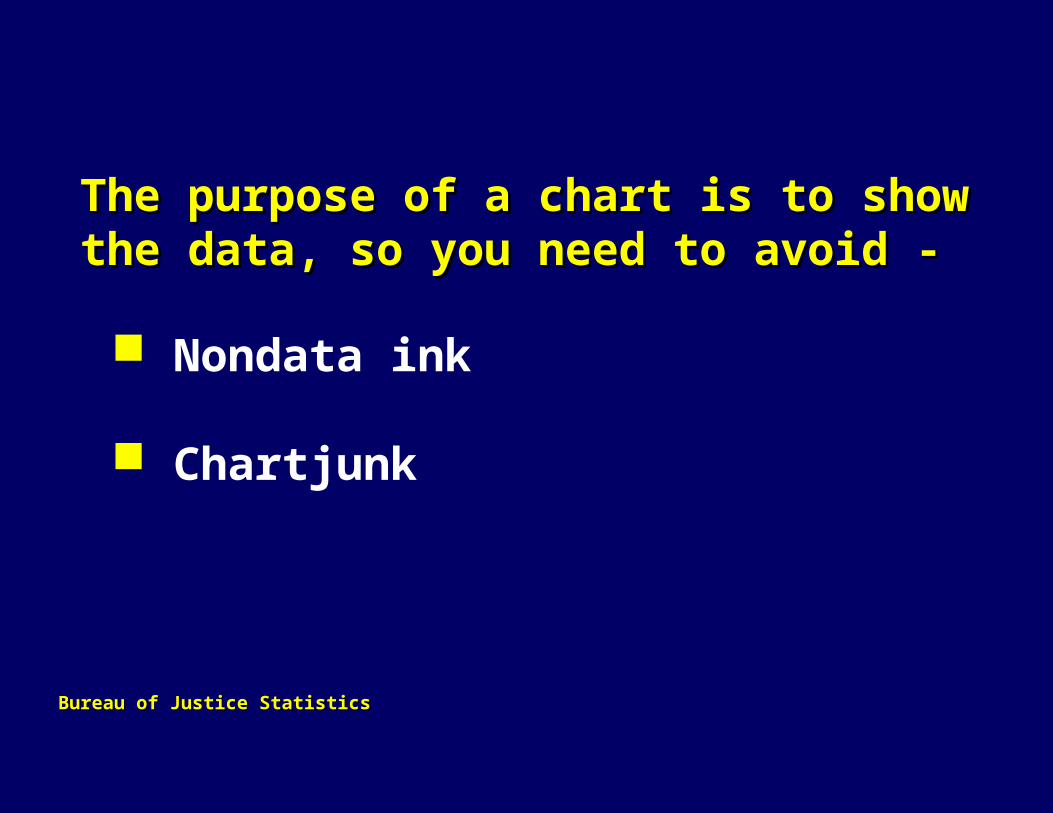
The purpose of a chart is to show the The purpose of a chart is to show the data, so you need to avoid -data, so you need to avoid -
Nondata ink
Chartjunk
Bureau of Justice StatisticsBureau of Justice Statistics
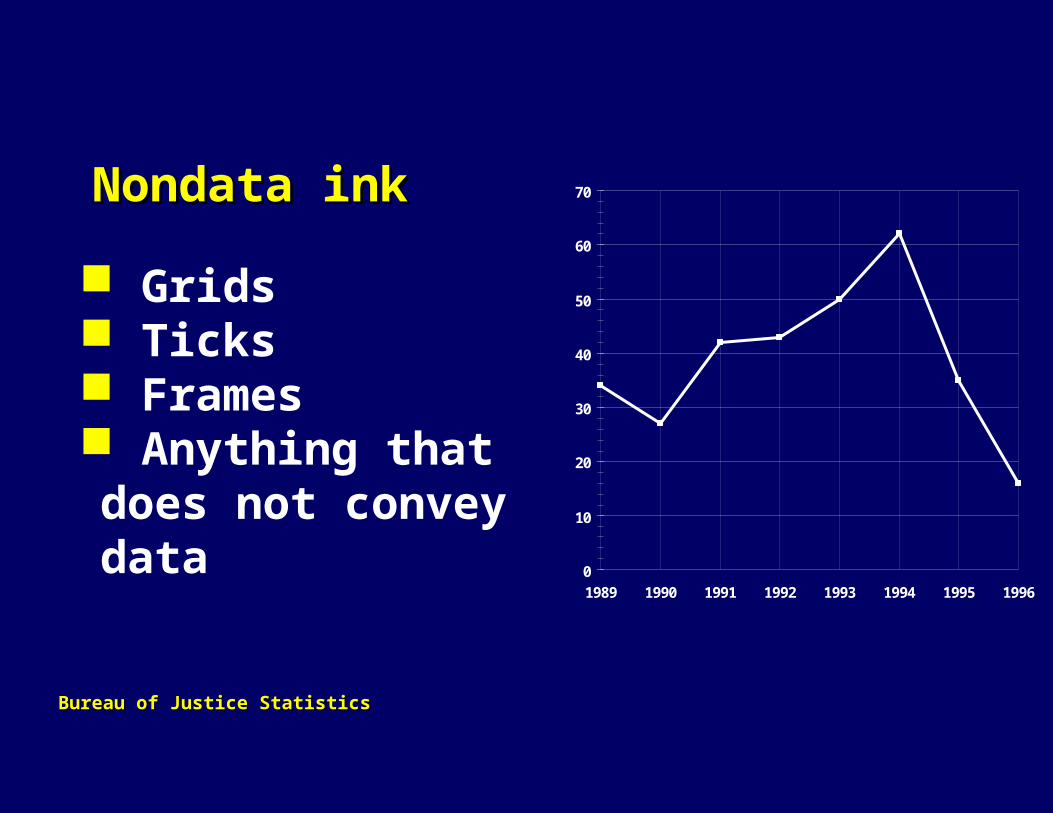
Nondata inkNondata ink
Grids Ticks Frames Anything that does not convey data
0
10
20
30
40
50
60
70
1989 1990 1991 1992 1993 1994 1995 1996
Bureau of Justice StatisticsBureau of Justice Statistics
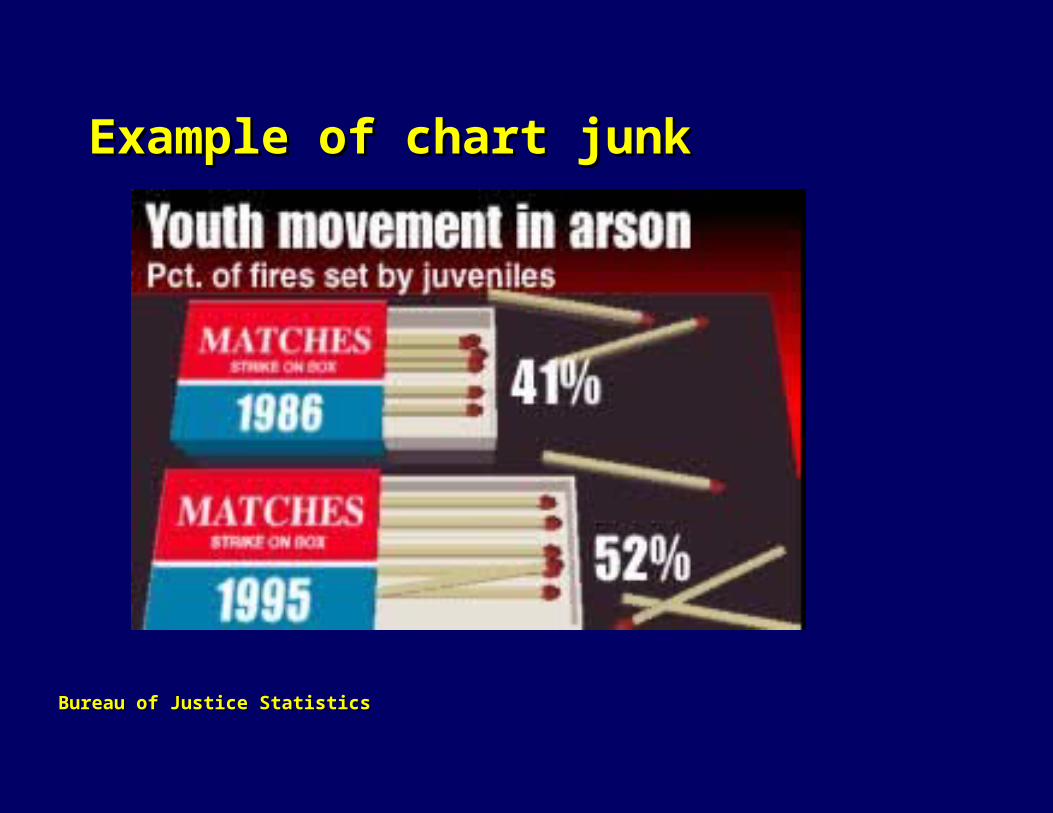
Example of chart junkExample of chart junk
Bureau of Justice StatisticsBureau of Justice Statistics
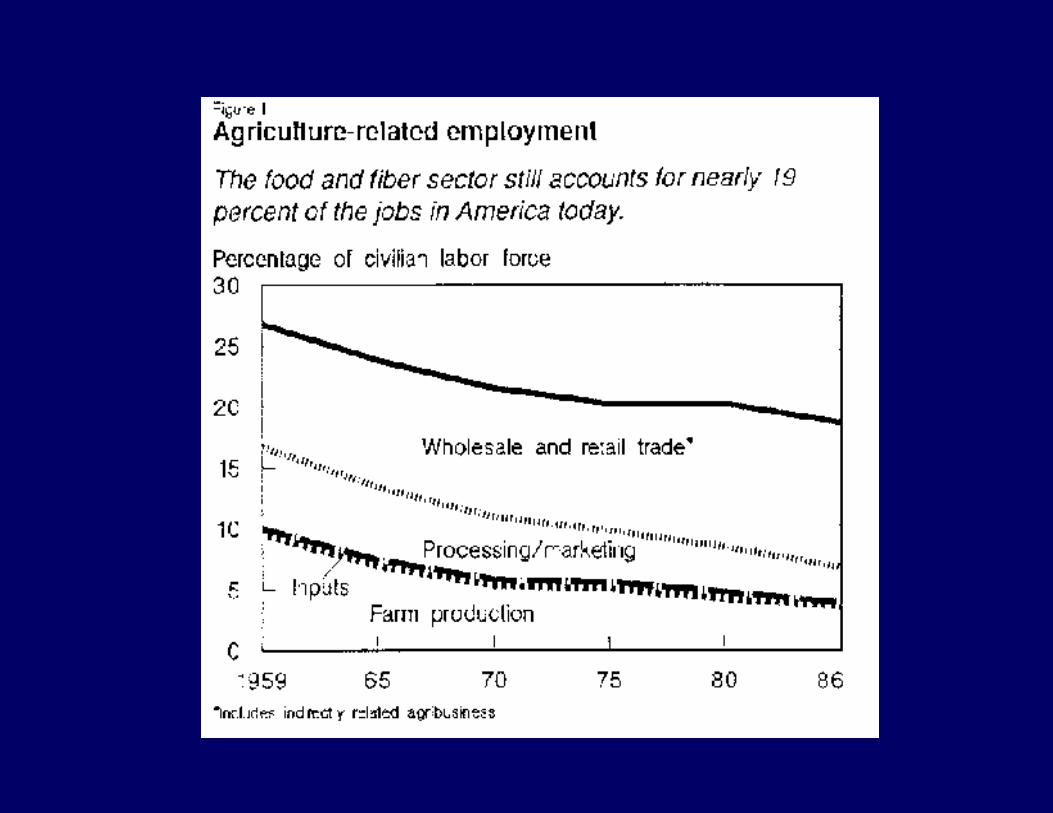
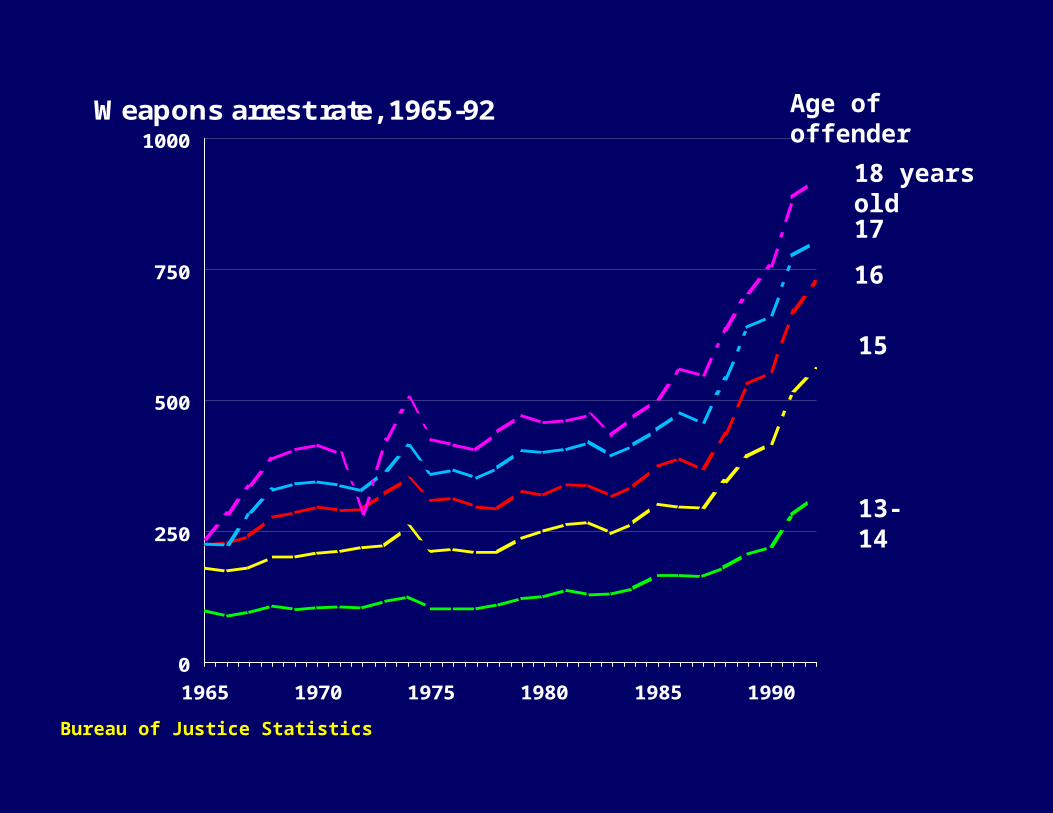
Broken lines, markers, and hatching fill patterns obscure the data and are hard to look at
Improper aspect ratios can distort the slope of a line
Perspective can distort values
Avoid optical illusionsAvoid optical illusions
Bureau of Justice StatisticsBureau of Justice Statistics
Patterned lines can mislead the user
Broken lines and markers require the brain to consolidate all of the pieces (continuation effect)
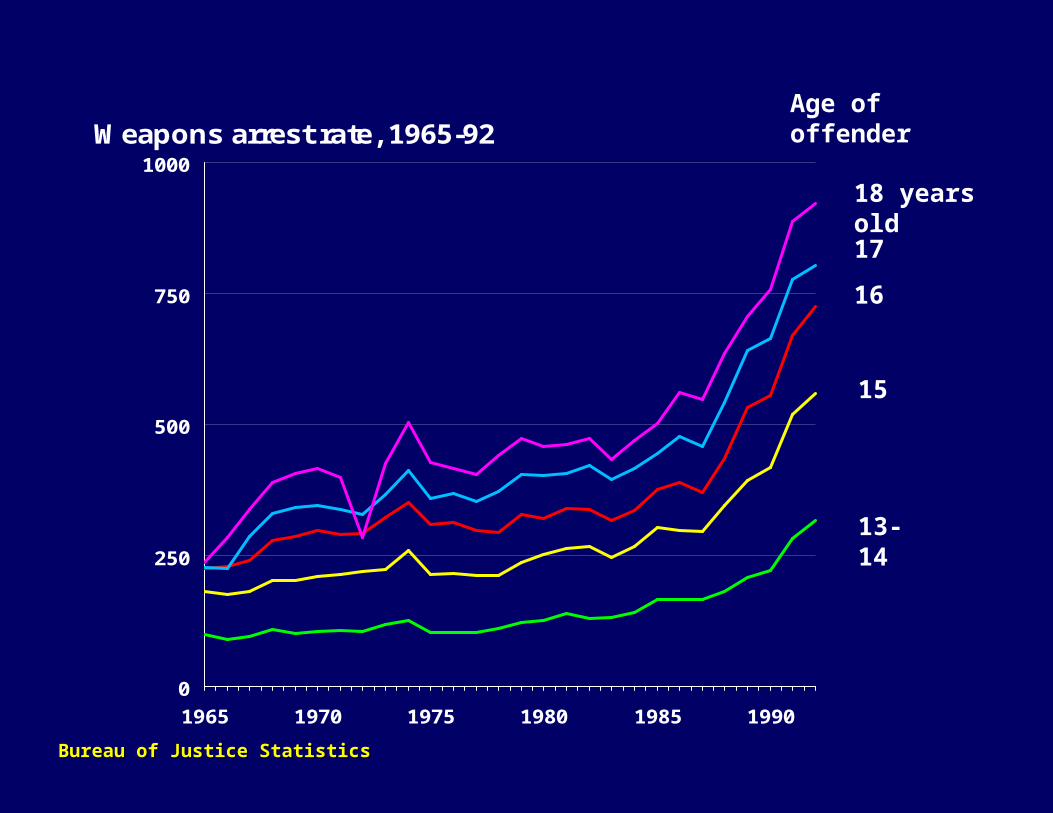
Use solid lines and avoid markers Use solid lines and avoid markers on lineson lines
Bureau of Justice StatisticsBureau of Justice Statistics
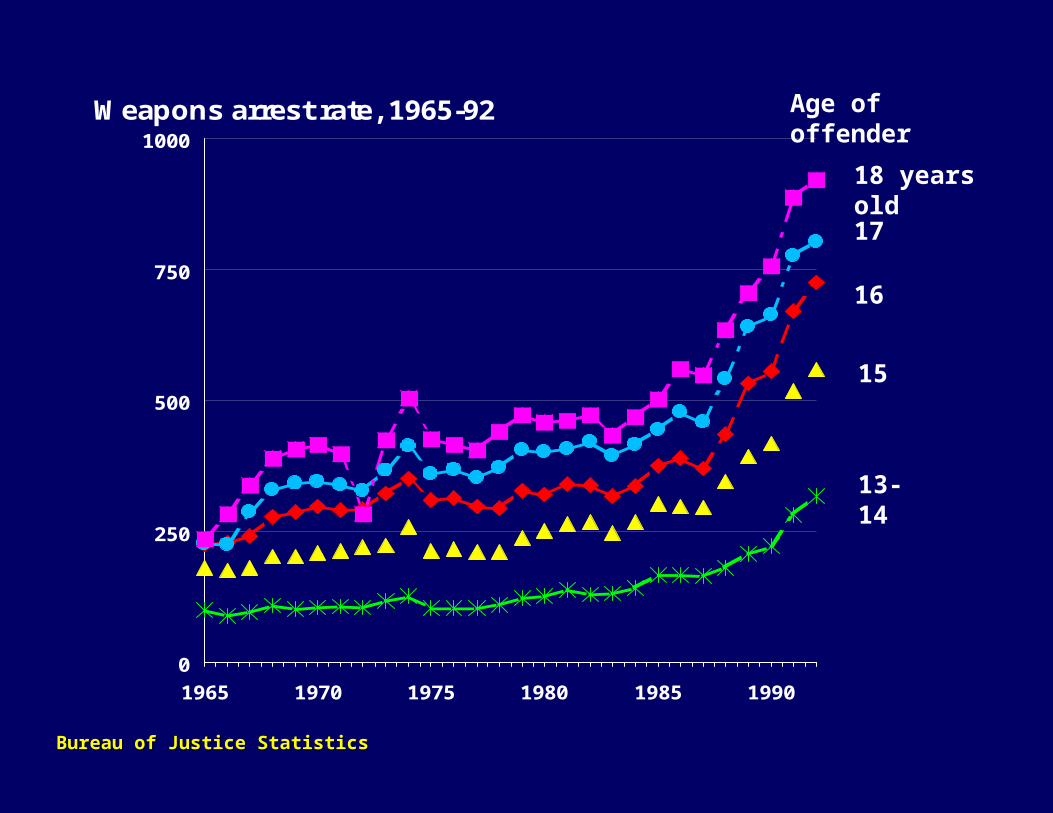
Weapons arrest rate, 1965-92
0
250
500
750
1000
1965 1970 1975 1980 1985 1990
13-14
15
16
17
18 years old
Age of offender
Bureau of Justice StatisticsBureau of Justice Statistics
Weapons arrest rate, 1965-92
0
250
500
750
1000
1965 1970 1975 1980 1985 1990
13-14
15
16
17
18 years old
Age of offender
Bureau of Justice StatisticsBureau of Justice Statistics
Weapons arrest rate, 1965-92
0
250
500
750
1000
1965 1970 1975 1980 1985 1990
13-14
15
16
17
18 years old
Age of offender
Bureau of Justice StatisticsBureau of Justice Statistics
Hatched fill patterns cause a moiré effect which is hard to look at
Keep the space between bars to a minimum to avoid the moiré effect
Use solid fill patternsUse solid fill patterns
Bureau of Justice StatisticsBureau of Justice Statistics
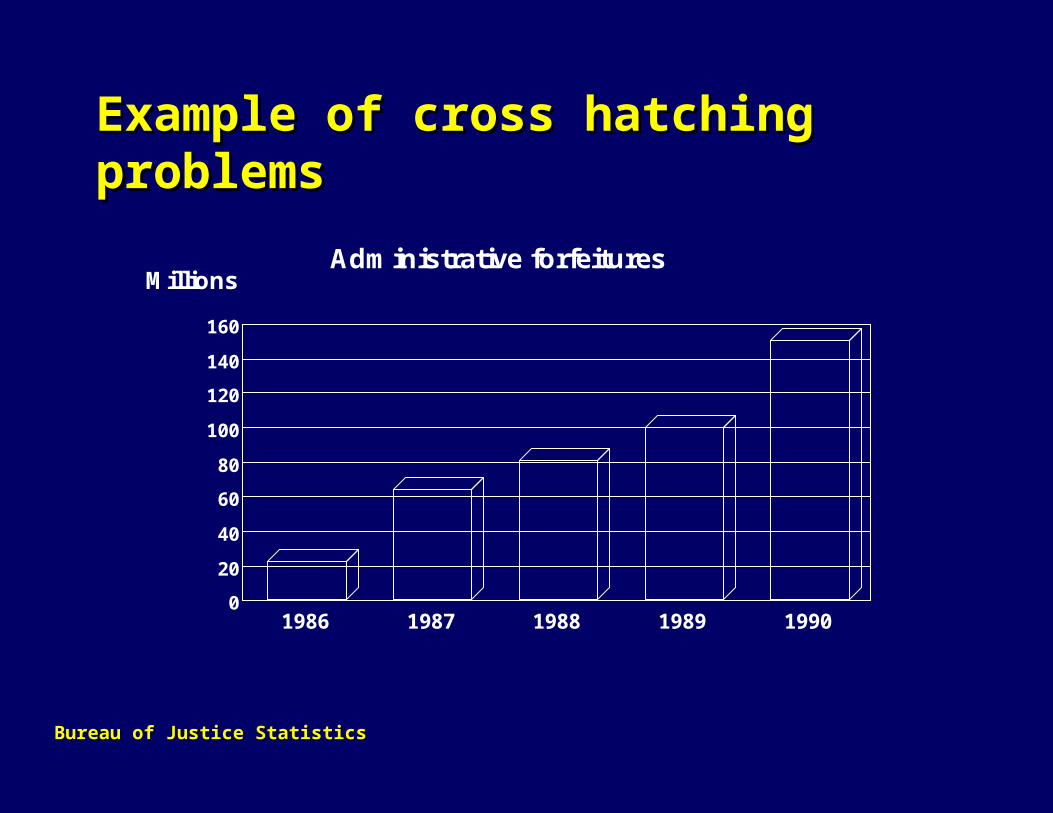
0
20
40
60
80
100
120
140
160
Millions
1986 1987 1988 1989 1990
Administrative forfeitures
Example of cross hatching problemsExample of cross hatching problems
Bureau of Justice StatisticsBureau of Justice Statistics

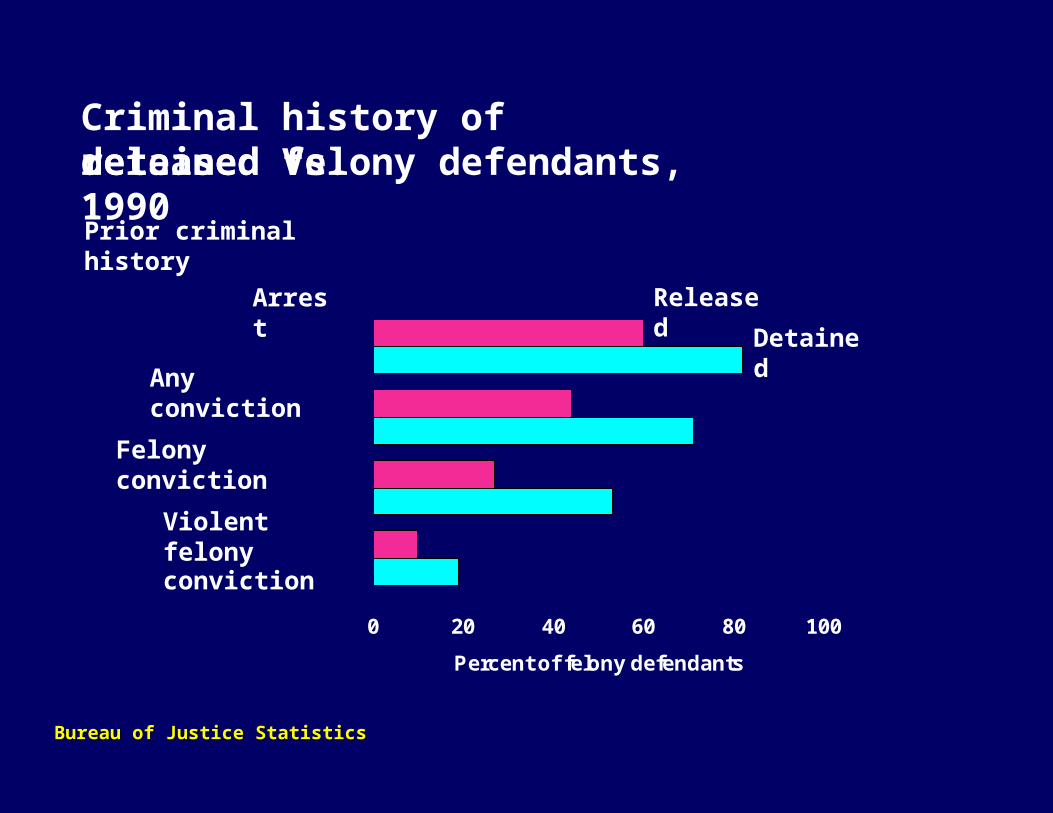
Criminal history of detained Vs. released felony defendants, 1990
0 20 40 60 80 100Percent of felony defendants
ReleasedDetained
Prior criminal history
Arrest
Any conviction
Felony conviction
Violent felony conviction
Bureau of Justice StatisticsBureau of Justice Statistics
Criminal history of detained Vs. released felony defendants, 1990
0 20 40 60 80 100
Percent of felony defendants
Prior criminal history
Arrest
Any conviction
Felony conviction
Violent felony conviction
Released
Detained
Bureau of Justice StatisticsBureau of Justice Statistics
Use an aspect ratio that is appropriate Use an aspect ratio that is appropriate to the data and our visual system to the data and our visual system
The aspect ratio of a chart is the comparison of the width to the height
An improper aspect ratio can distort the slope of a line or make differences disappear
Bureau of Justice StatisticsBureau of Justice Statistics
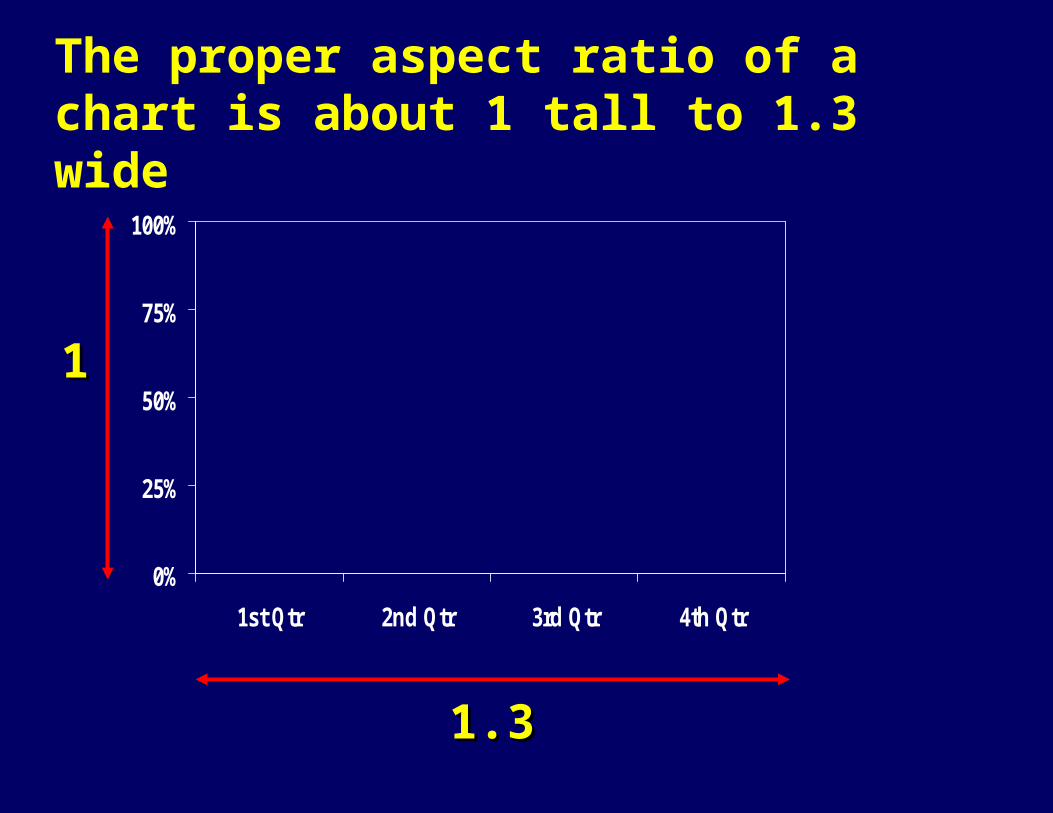
The proper aspect ratio of a chart is about 1 tall to 1.3 wide
0%
25%
50%
75%
100%
1st Qtr 2nd Qtr 3rd Qtr 4th Qtr
11
1.31.3
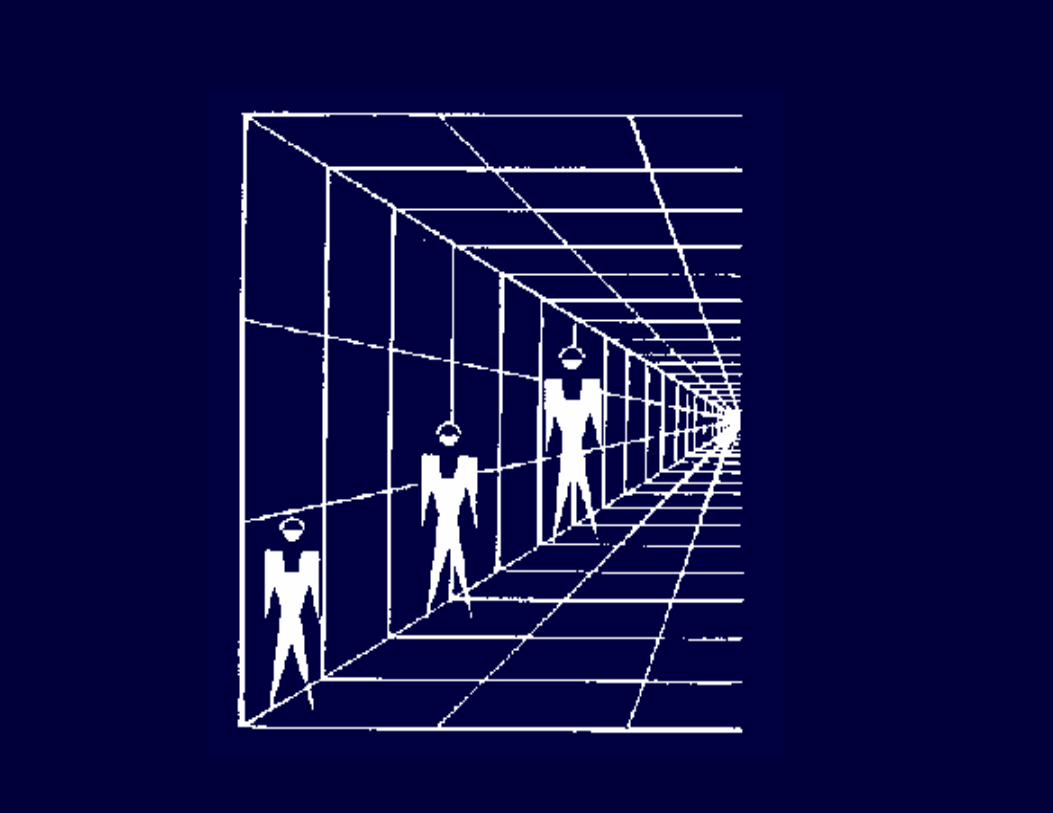
Never use 3 dimensional designs Never use 3 dimensional designs for 2 dimensional datafor 2 dimensional data
Designs done in perspective make accurate comparisons impossible
Data can easily be hidden
Bureau of Justice StatisticsBureau of Justice Statistics
0
2
4
6
8
10
12
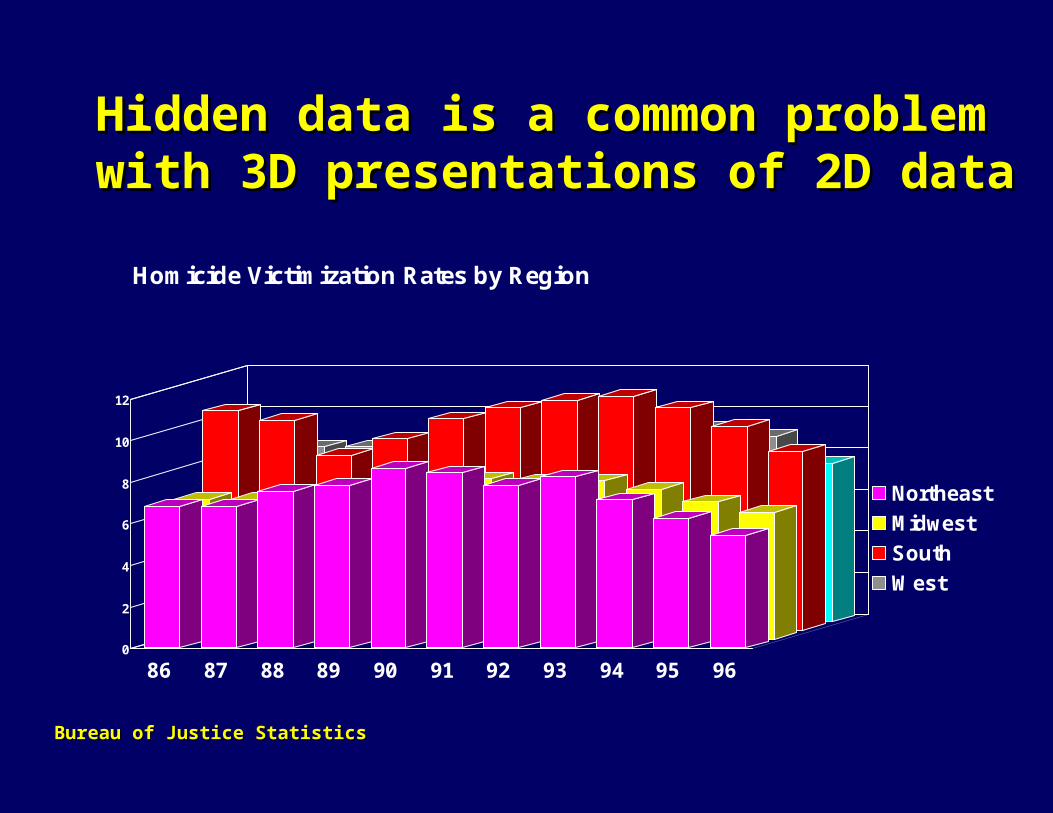
86 87 88 89 90 91 92 93 94 95 96
Homicide Victimization Rates by Region
Northeast
Midwest
South
West
Hidden data is a common problem with Hidden data is a common problem with 3D presentations of 2D data3D presentations of 2D data
Bureau of Justice StatisticsBureau of Justice Statistics
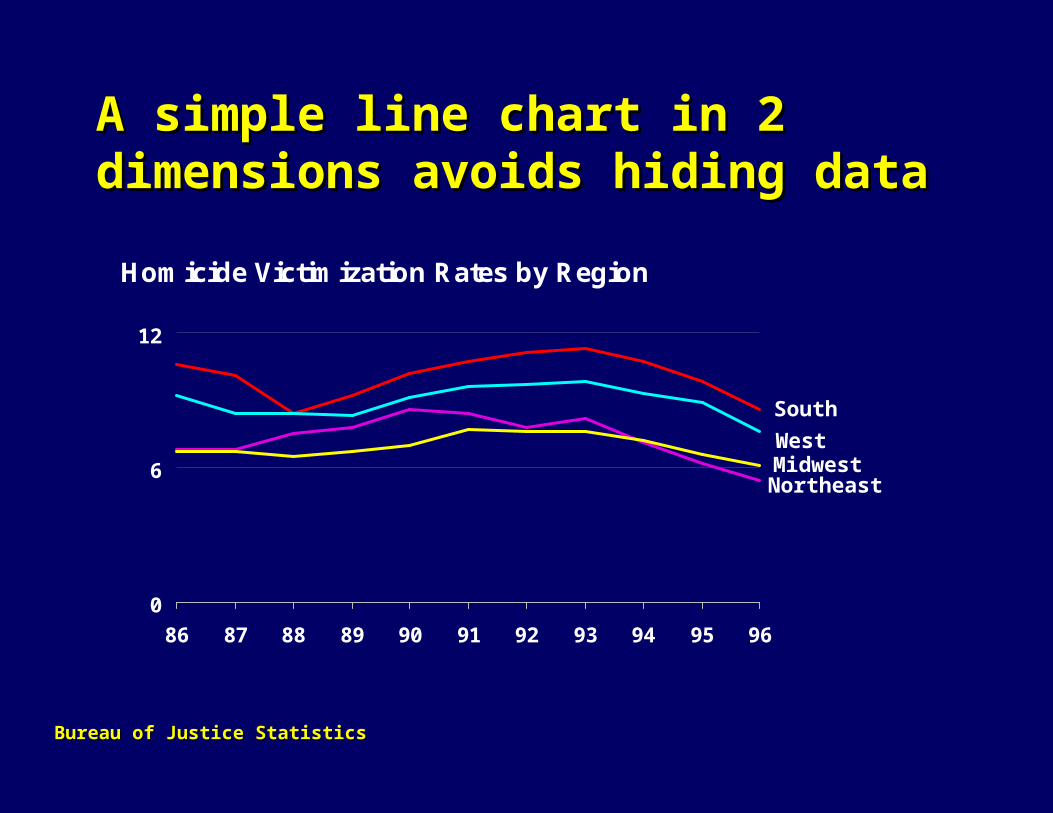
Homicide Victimization Rates by Region
0
6
12
86 87 88 89 90 91 92 93 94 95 96
A simple line chart in 2 dimensions A simple line chart in 2 dimensions avoids hiding data avoids hiding data
West
South
NortheastMidwest
Bureau of Justice StatisticsBureau of Justice Statistics
Avoid graphical puzzlesAvoid graphical puzzles
Start the scale at zero
Use only one unit of measurement per graphic
Bureau of Justice StatisticsBureau of Justice Statistics
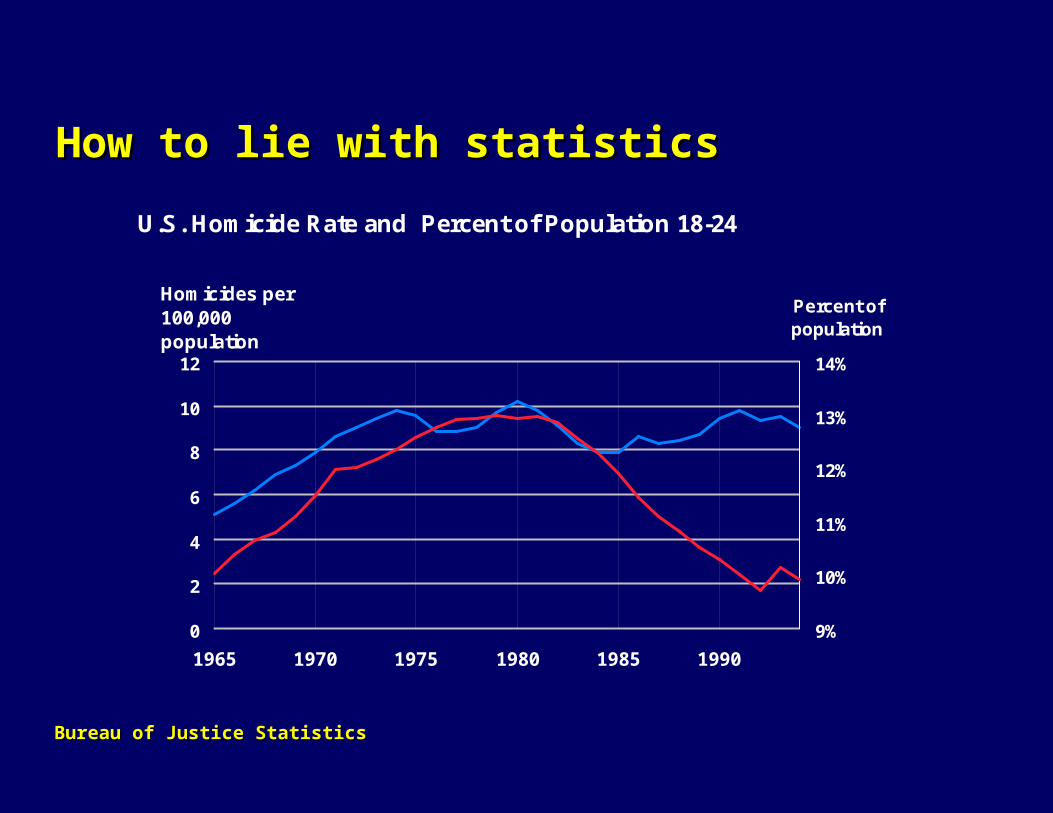
U.S. Homicide Rate and Percent of Population 18-24
0
2
4
6
8
10
12
1965 1970 1975 1980 1985 1990
Homicides per 100,000 population
9%
10%
11%
12%
13%
14%
Percent of population
How to lie with statisticsHow to lie with statistics
Bureau of Justice StatisticsBureau of Justice Statistics
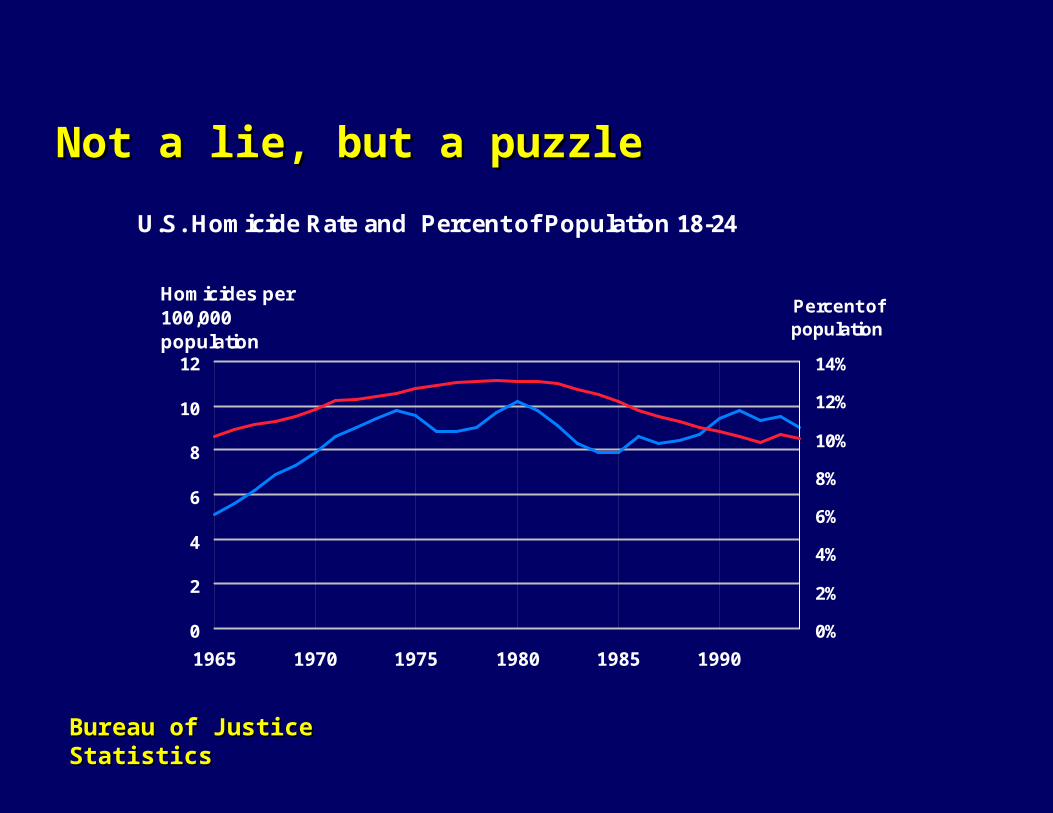
U.S. Homicide Rate and Percent of Population 18-24
0
2
4
6
8
10
12
1965 1970 1975 1980 1985 1990
Homicides per 100,000 population
0%
2%
4%
6%
8%
10%
12%
14%
Percent of population
Not a lie, but a puzzleNot a lie, but a puzzle
Bureau of Justice StatisticsBureau of Justice Statistics
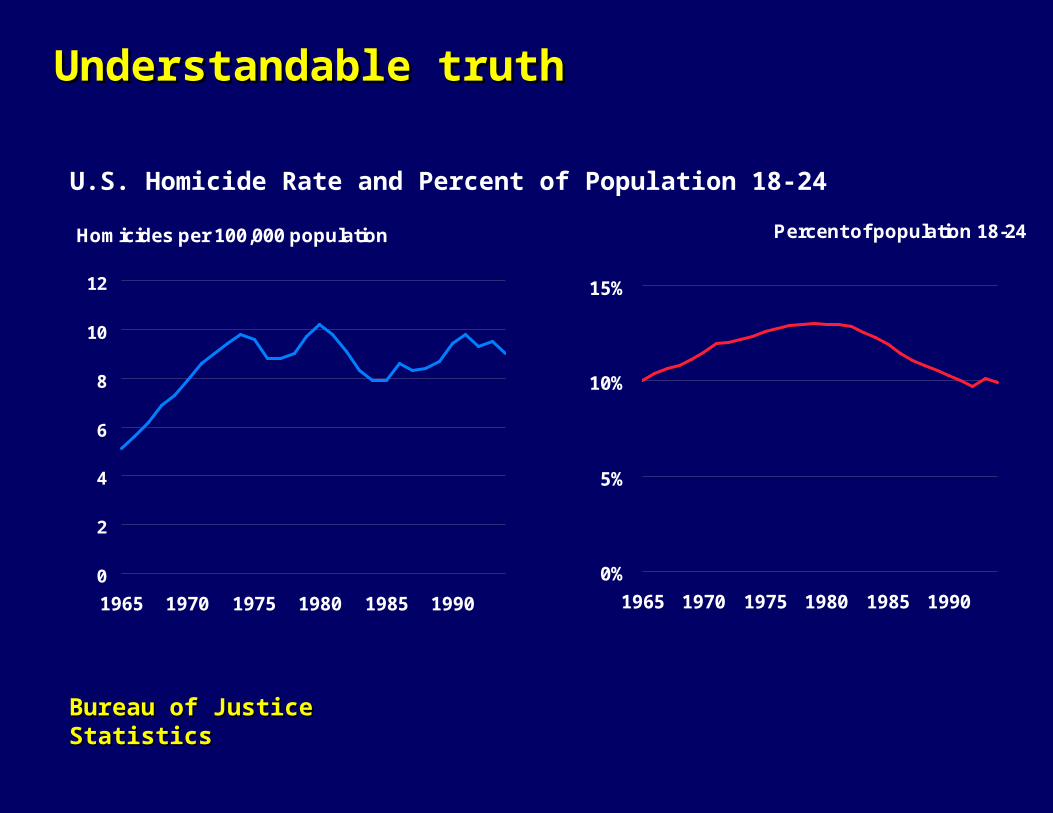
Percent of population 18-24
0%
5%
10%
15%
1965 1970 1975 1980 1985 1990
Homicides per 100,000 population
0
2
4
6
8
10
12
1965 1970 1975 1980 1985 1990
U.S. Homicide Rate and Percent of Population 18-24
Bureau of Justice StatisticsBureau of Justice Statistics
Understandable truthUnderstandable truth
Scale selections should --Scale selections should --
include all of the data
result in ticks, grids, or labels that are easy to understand like 10s, 100s, 1,000s
use as few labels as required to convey the message
Bureau of Justice StatisticsBureau of Justice Statistics
Use small multiples Use different colors for different lines Use different weights or shades in black and white
Break lines to show one on top Reduce the number of lines shown to those of interest
How to display many lines on a line chart How to display many lines on a line chart
Bureau of Justice StatisticsBureau of Justice Statistics
Bureau of Justice StatisticsBureau of Justice Statistics
0
250
500
750
1000
1965 1970 1975 1980 1985 1990
0
250
500
750
1000
1965 1970 1975 1980 1985 1990
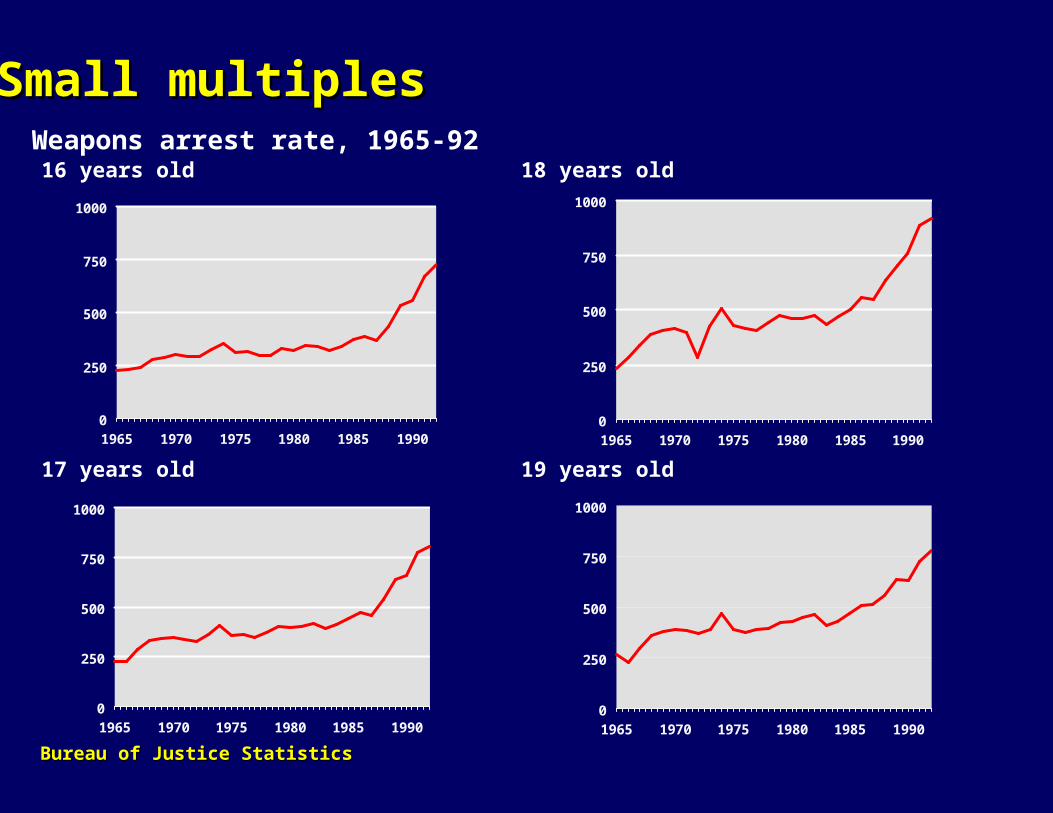
Weapons arrest rate, 1965-92
0
250
500
750
1000
1965 1970 1975 1980 1985 1990
16 years old
0
250
500
750
1000
1965 1970 1975 1980 1985 1990
18 years old
17 years old 19 years old
Small multiplesSmall multiples
Do not use abbreviations
Avoid acronyms
Write all labels left to right
Use proper grammar
Do not use legends unless using maps
Make all verbal tasks easy to understandMake all verbal tasks easy to understand
Bureau of Justice StatisticsBureau of Justice Statistics
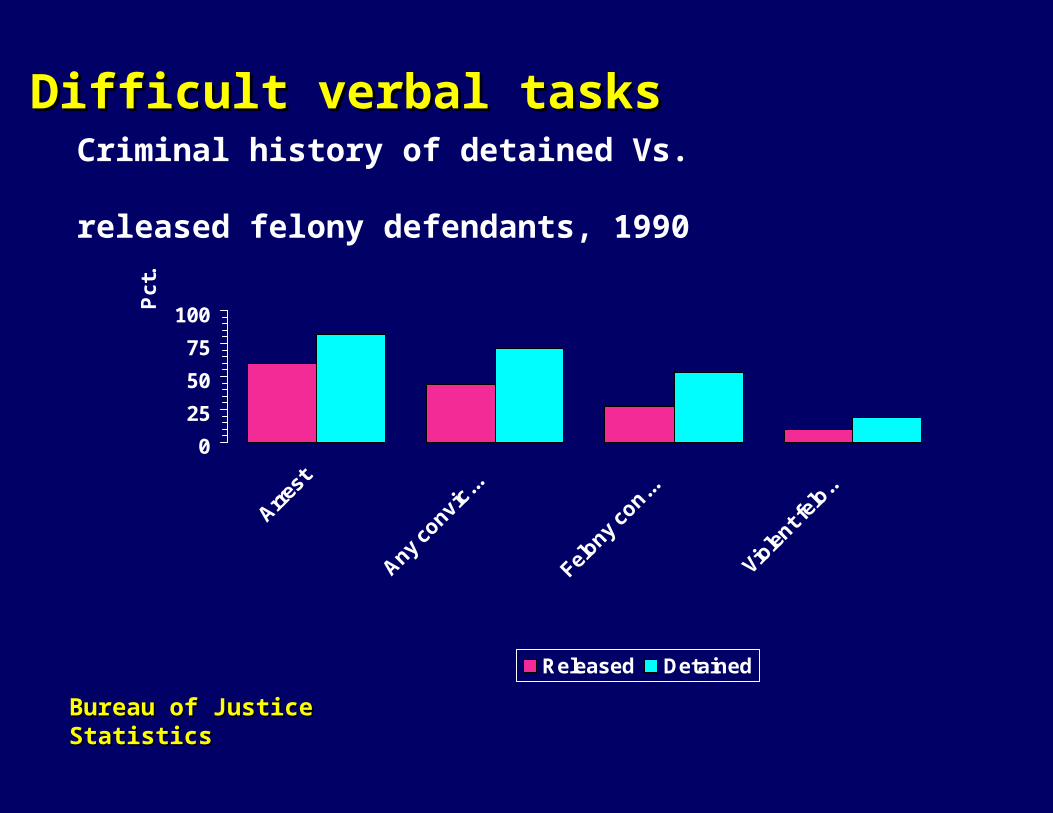
Criminal history of detained Vs. released felony defendants, 1990
Pc
t.
0
25
50
75
100
Arrest
Any co
nvic...
Felony
con...
Viole
nt fel
o..
Released Detained
Bureau of Justice StatisticsBureau of Justice Statistics
Difficult verbal tasksDifficult verbal tasks
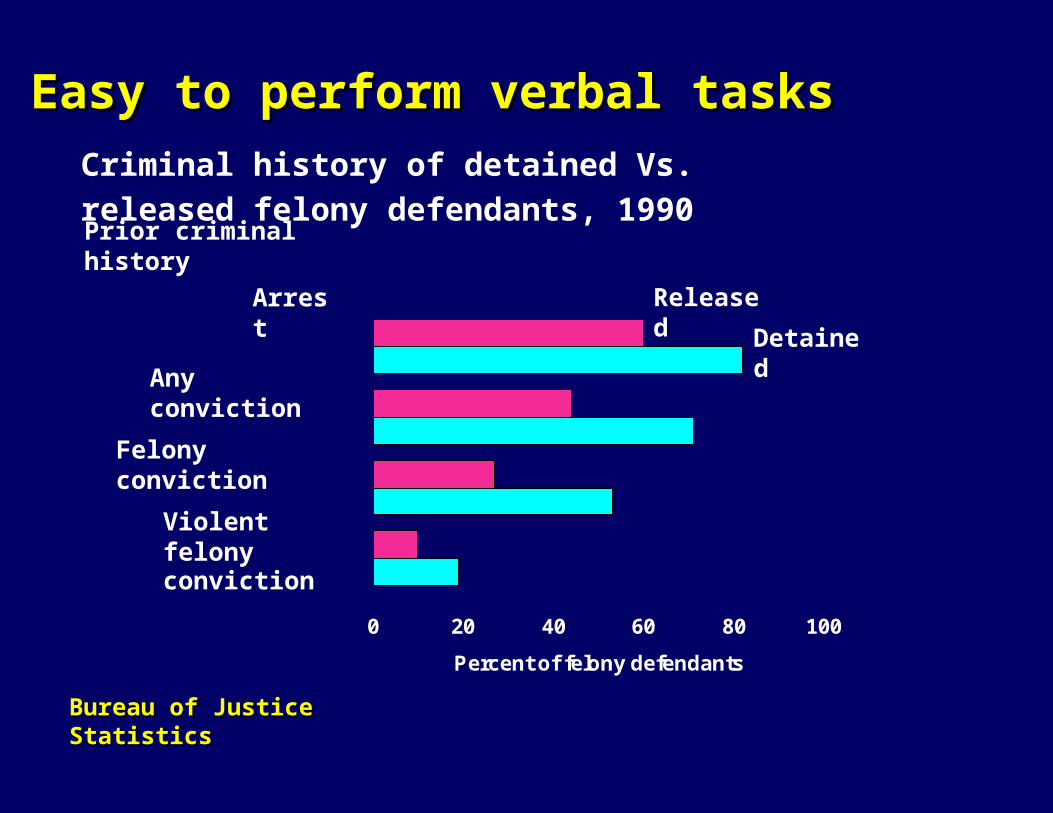
Criminal history of detained Vs.
released felony defendants, 1990
0 20 40 60 80 100
Percent of felony defendants
Prior criminal history
Arrest
Any conviction
Felony conviction
Violent felony conviction
Released
Detained
Bureau of Justice StatisticsBureau of Justice Statistics
Easy to perform verbal tasksEasy to perform verbal tasks