Data plane designs for implementation and further ...
89
IST IP IDEALIST (Industry-Driven Elastic and Adaptive Lambda Infrastructure for Service and Transport Networks) D2.3 – Final Version Page 1 of 89 Data plane designs for implementation and further experimental evaluation Status and Version: Final Version Date of issue: 10.02.2015 Distribution: Project Internal Author(s): Name Partner Patricia Layec ALBLF Arnaud Dupas ALBLF Haik Mardoyan ALBLF Rafael Rios Muller ALBLF Jean-Christophe Antona ALBLF Emilio Hugues-Salas UNIVBRIS Shuangi Yan UNIVBRIS Yan Yan UNIVBRIS Geogios Zervas UNIVBRIS Dimitra Simeonidou UNIVBRIS Markus Nölle HHI Nicola Sambo CNIT Anna Chiadò Piat TI Emilio Riccardi TI Diego Roccato TI Antonio Napoli Coriant Marc Bohn Coriant Tahla Rahman TU/e Antonio D’Errico TEI Josep M. Fabrega CTTC Michela Svaluto Moreolo CTTC Juan Pedro Fernandez-Palacios Gimenez TID Alexandros Stavdas UoP Checked by: Emilio Riccardi TI Ref. Ares(2015)553567 - 10/02/2015
Transcript of Data plane designs for implementation and further ...

IST IP IDEALIST (Industry-Driven Elastic and Adaptive Lambda
Infrastructure for Service and Transport Networks)
D2.3 – Final Version
Page 1 of 89
Data plane designs for implementation and further experimental evaluation
Status and Version: Final Version
Date of issue: 10.02.2015
Distribution: Project Internal
Author(s): Name Partner
Patricia Layec ALBLF
Arnaud Dupas ALBLF
Haik Mardoyan ALBLF
Rafael Rios Muller ALBLF
Jean-Christophe Antona ALBLF
Emilio Hugues-Salas UNIVBRIS
Shuangi Yan UNIVBRIS
Yan Yan UNIVBRIS
Geogios Zervas UNIVBRIS
Dimitra Simeonidou UNIVBRIS
Markus Nölle HHI
Nicola Sambo CNIT
Anna Chiadò Piat TI
Emilio Riccardi TI
Diego Roccato TI
Antonio Napoli Coriant
Marc Bohn Coriant
Tahla Rahman TU/e
Antonio D’Errico TEI
Josep M. Fabrega CTTC
Michela Svaluto Moreolo CTTC
Juan Pedro Fernandez-Palacios Gimenez
TID
Alexandros Stavdas UoP
Checked by: Emilio Riccardi TI
Ref. Ares(2015)553567 - 10/02/2015

IST IP IDEALIST (Industry-Driven Elastic and Adaptive Lambda
Infrastructure for Service and Transport Networks)
D2.3 – Final Version
Page 2 of 89
Executive Summary
Traffic demand is continuously increasing and more recently it is also becoming more dynamic mainly due to newest drivers such as cloud networking and/or Internet of things. The limited available bandwidth in optical fibers shifts the necessity of higher transmission capacity into the requirement of increasing, as much as possible, the optical spectral efficiency. The IDEALIST project thus proposes to investigate flexgrid and flexrate networks (also named Elastic Optical Networks-EON) towards 1Tbit/s, as a way to address the increasing traffic demand. This novel network architecture is based on the combination of new transmission techniques, new switching architectures and software-defined network elements, being supervised by a centralized control plane. The resulting high flexibility allows the design of scalable, reconfigurable, and more sustainable network solutions offering the capabilities to limit cost and energy consumption at the same time.
To fully benefit from the EON architecture, the data plane nodes need to evolve to become flexgrid, flexrate and software defined. Deliverable D2.3 leverages on the common architecture of data plane identified in the previous deliverable D2.2. To simplify, this common architecture includes (Figure 1): (i) a flexible optical node (Flex-OXC in figure) able to provide flexibility in terms of optical switching at wavelength and optical bandwidth level through bandwidth variable WSS, and an high level of internal architectural flexibility and scalability; (ii) several Sliceable-Bandwidth Variable Transponders (S-BVT) modules adding flexibility thanks to a multi-flow optical front end that can adapt its transmission rate (symbol rate, FEC, modulation, etc.) according to the reach or physical impairments; (iii) a flexible digital cross connect (Flex-Digital XC in figure) with the task of client mapping and equipped whit a flexible and configurable OTN fabric. All of these major functional blocks include a high level of programmability to add more intelligence to EON, providing a smart network with efficient control and monitoring.
Figure 1: Schematic view of the IDEALIST node architecture. A more detailed figure is available in deliverable D2.2, Figure 3.
Chapter 2 highlights the latest results concerning node architecture at the optical layer, with a particular emphasis on two innovative optical node architectures: Architecture on Demand (AoD) and SERANO.
In all known optical node architectures (AoD or SERANO are no exceptions), some optical filtering elements seem unavoidable to address optical switching. Many of them can be crossed by an optical channel routed through the network from the source to the

IST IP IDEALIST (Industry-Driven Elastic and Adaptive Lambda
Infrastructure for Service and Transport Networks)
D2.3 – Final Version
Page 3 of 89
destination node. This cascade of filters imposes some bandwidth restriction on the channel spectrum for both single-carrier channels and superchannels. Therefore the chapter starts with an analysis of the impairments from a cascaded of optical filters, continuing with the discussion of two promising techniques effective in counteract this filtering penalty. First, the application of suitable spectral shaping, shows that 32GBd/s PM-8QAM/16QAM signals can be transmitted in a 37.5GHz WDM grid and experiments also evidence that high order modulations are more sensitive to the filtering penalty. Second, a super-filter technique is proposed taking into account the other co-propagating channels, that can be seen as a generalization of filtering for superchannel, where now all the involved channels may not have the same destination.
Then a discussion of AoD follows, exploring the advantages it brings in an EON. AoD provides a high level of flexibility and scalability, with the particularity of offering a self-healing architecture by bypassing faulty components or by internal rerouting within the node. In terms of availability, AoD is well-suited to manage a greater number of lightpaths with respect to traditional hard wired nodes. In addition, the reduction of failure-prone component is another key advantage in AoD.
Scalability of optical switching is traditionally obtained with component with higher number of ports (mainly WSSs), but alternatively an innovative optical backplane architecture could be proposed to address the requirement on optical switch connectivity. A pay-as-you-grow model is proposed with either unidirectional or expandable architecture for which the number of connections as well as the power consumption is studied analytically.
The SERANO solution is also reviewed, collecting all the most important results obtained up to now.
Chapter 3 provides a brief review of the main transmission techniques investigated within IDEALIST namely Nyquist WDM, OFDM and Time-Frequency Packing (TFP); all these techniques can be adapted to specific network scenarios and can be used to implement superchannels. A subsection is dedicated to the analysis of system performance using Gaussian noise model, which can provide a simple and valuable tool in planning and designing a complex EON.
High speed elastic transmission is possible with the three transmission techniques mentioned above, but needs more and more versatile and efficient DSP algorithms. Efficiency is often expressed in terms of BER performance or OSNR sensitivity, but ideally energy-efficiency and low-cost implementations are also at stake. Some of the most recent advanced DSP solutions are outlined showing substantial improvements. For instance, data aided equalization in the nonlinear regime is shown to be up to 2dB better by implementing CAZAC- sequences. Further, a novel nonlinear cross-polarization (XPolM) equalizer is proposed, showing a gain of several dBs for high Q-factors with no need for the knowledge of link parameters. Other pre-emphasis techniques reduce the effects of DAC limitation, which are a particular concern especially for high baud rates. Indeed, the 1Tbit/s transmission will likely use the highest possible baud rate, providing that the hardware limitations of high speed electronic allow a reasonable penalty to the system transmission. In previous deliverables D2.1 and D2.2, the 1Tbit/s transmission was only investigated in terms of superchannels or OFDM waveforms, but in this deliverable the first single-carrier 1Tbit/s line transmission is shown to be possible.
Additionally, low cost implementations are well-suited for metro networks such as BRAS centralization with the ability to serve multiple destinations. For such an application a multiband OFDM with single-sideband is proposed. In the other direction (upstream), an

IST IP IDEALIST (Industry-Driven Elastic and Adaptive Lambda
Infrastructure for Service and Transport Networks)
D2.3 – Final Version
Page 4 of 89
optical DMT is used in combination with shared coherent detection at the sliceable transponder located at the BRAS. Experimental back-to-back and transmission over a mesh network show good results in term of required OSNR for a 10-3 BER.
Chapter 4 is mainly dedicated to the aspects of monitoring, programmability and control of network devices such as S-BVT and flexible OTN interfaces.
Programmability is first applied to code rate adaptation. In this case, the monitoring system is able to predict the OSNR degradation in advance so as to trigger a code rate change and hence avoid errors before they occur. In addition, the S-BVT can be further improved with a programmable and asymmetric wavelength source. A single source generated comb of sub-carriers avoids the laser drift between sub-carriers. Experiments with different sub-carrier spacing are obtained using the ITU-T flexgrid channel allocation. The control plane is realized in conjunction with WP3, hence a more detailed description of the used SDN-controller is for instance available in Deliverable D3.2.
A software-defined real-time elastic OTN/BVT prototype, whose details plans were presented in the previous deliverables, is now running. The flexible OTN mapping delivers just-enough capacity for a flexgrid transmission The BVT then adjusts the symbol rate to match the bit rate to the flexible OTN mapping. The real-time OTN/BVT prototype has a sub-millisecond reconfiguration; this has been realized using commercially available FPGA and electronic components.
Finally, a first level of interoperability at data plane has been demonstrated. A joint experiment on DSP compatibility with Nyquist WDM ensures that a minimum performance could be guaranteed. Using a PM-16QAM and standard hard decision FEC for interoperability, a 300km reach could be obtained, which demonstrates feasibility. This first interoperability experiment between two system vendors also permitted to update the common reference list of parameters for interoperability.
Leveraging on these first subsystem demonstrations, further experimental demonstrations will be conducted and described in WP4, being the results of a lot of collaborative effort to integrate hardware and software elements.

IST IP IDEALIST (Industry-Driven Elastic and Adaptive Lambda
Infrastructure for Service and Transport Networks)
D2.3 – Final Version
Page 5 of 89
Table of Contents
1 Introduction 7
1.1 Purpose and scope 7
1.2 References 8
1.3 Acronyms 12
1.4 Document history 17
1.5 Document overview 17
2 Node architectures 19
2.1 Filtering aspects 19 2.1.1 Filter cascade effects modeling 19 2.1.2 Experimental verification of mitigation of filtering cascade penalties employing spectral shaping within optical nodes 25 2.1.3 Super-filtering assessment 27
2.2 Architecture on Demand (AoD) 31 2.2.1 Availability aspects of self-healing optical nodes designed by Architecture on Demand 31 2.2.1.1 Availability of self-healing optical nodes 31
2.2.1.2 Availability evaluation 33
2.2.2 Efficient optical amplification in self-healing synthetic ROADMs 34 2.2.3 Synthetic optical nodes implemented by AoD 36 2.2.4 Numerical results 38 2.2.5 Experimental demonstration of backplane architectures for AoD-based optical nodes 40 2.2.6 Backplane architectures 40 2.2.7 Backplane architectural trade-offs 41 2.2.8 Experimental setup and results 42
2.3 The Switchless Elastic Rate Node (SERANO) architecture 44
3 Sliceable bandwidth variable transponders 47
3.1 Brief review of transmission techniques 47
3.2 Advanced DSP solutions 49 3.2.1 System performance prediction using the Gaussian noise model 49 3.2.2 Performance issues using CAZAC training sequences for data-aided channel estimation 51 3.2.3 Tolerance of phase noise with 8QAM 54 3.2.4 Nonlinear inter-channel XPolM mitigation 56 3.2.5 Performance of digital pre-emphasis 60 3.2.5.1 Back-to-back 60
3.2.5.2 Link 63
3.2.5.3 Experimental verification 67
3.3 Long haul applications 68 3.3.1 Single-carrier NWDM 1Tbit/s experiment 68 3.3.2 Transmission scheme comparison: NWDM vs. TFP 70

IST IP IDEALIST (Industry-Driven Elastic and Adaptive Lambda
Infrastructure for Service and Transport Networks)
D2.3 – Final Version
Page 6 of 89
3.4 MAN use case 70 3.4.1 OFDM-based S-BVT 71 3.4.2 Alternative modulations for low cost modulators 74
4 Aspects on monitoring, programmability and control 76
4.1 Performance monitoring and code adaptation: experiment 76
4.2 Programmable and asymmetric multi-wavelength source 78 4.2.1 S-BVT based on programmable and asymmetric multi-wavelength with extended SDN 79 4.2.2 Experimental demonstration 80
4.3 Multilayer border node 81
4.4 DSP technology compatibility 84
4.5 Multivendor interoperability 86
5 Conclusions 88

IST IP IDEALIST (Industry-Driven Elastic and Adaptive Lambda
Infrastructure for Service and Transport Networks)
D2.3 – Final Version
Page 7 of 89
1 Introduction
1.1 Purpose and scope
Traffic demand is continuously increasing and more recently it is also becoming more dynamics due to new uses such as cloud networking and/or Internet of things. The limited available bandwidth in optical fibers shifted the requirement of higher data rates into a higher spectral efficiency. The IDEALIST project then proposes to investigate flexgrid and flexrate networks towards 1Tbit/s to meet this increasing traffic demand.
This document is the third deliverable related to data plane solutions. After assessing and modeling different candidate options for transmission and switching, this document is more focused on the experimental evaluations. Multiple subsystems targeting one or more functional blocks of the common data plane architecture depicted in deliverable D2.2 have been developed/prototyped and experimentally validated. These subsystems will be further enhanced and fed to WP4 for final assessments of global node architectures, comprising of both data plane and control plane integration.
This deliverable details the most recent advances of the common data plane architecture by first addressing the optical node architecture part. This includes activities on filtering cascade which ultimately limits the usable bandwidth; further work on Architecture on Demand (AoD) including self-healing procedure and availability assessment and Switchless Elastic RAte NOde (SERANO) proposals. Second, high speed S-BVT investigates three main transmission techniques (i.e. Nyquist WDM, OFDM, time-frequency packing) with numerical simulations towards 1Tbit/s and very often completed with experimental evaluation of the proposed solutions. Experiments are a key requirement before transferring some of the S-BVT solutions to the product line of system vendors. The achieved numerical and experimental results are of high quality according to the very large number of publications accepted to major international conferences or journal papers. Third, elastic optical networks open the way to more intelligent networks with monitoring information and control plane trigger. Collaboration with WP3 is ongoing for such activities. This includes programmable aspects of various network elements such as FEC, multi-band asymmetric laser, a real-time flex-OTN/BVT prototype. Finally, progresses on DSP interoperability is also reported with the first interoperable experiment between two major system vendors. This permits to update the reference list of parameters required for interoperability.
Last but not least, it is important to stress that a significant number of contributions of the document are the result of deep collaboration between consortium members and also between workpackages.

IST IP IDEALIST (Industry-Driven Elastic and Adaptive Lambda
Infrastructure for Service and Transport Networks)
D2.3 – Final Version
Page 8 of 89
1.2 References
[Amaya-JOCN13] N. Amaya, G. Zervas and D. Simeonidou, “Introducing Node Architecture Flexibility for Elastic Optical Networks”, in Journal of Optical Communications and Networking, Vol. 5, No. 6, pp. 593-608, June 2013.
[Amaya-ICTON11] N. Amaya, G. Zervas, D. Simeonidou, “Architecture on Demand for Transparent Optical Networks”, in Proc. ICTON, Stockholm, Sweden, 2011,pp.Th.A1.5.1-4.
[Antona-ECOC14] J.-C. Antona, P. Layec, G. De Valicourt, “Non Quadrature Intensity Modulation Formats,” in Proc ECOC, 2014, paper P4.14.
[Agrawal06] G. P. Agrawal, “Nonlinear Fiber Optics”, Academic Press, 2006
[Bahl-InfoTheory74] L. Bahl, J. Cocke, F. Jelinek, and J. Raviv, “Optimal decoding of linear codes for minimizing symbol error rate,” Information Theory, IEEE Transactions on, 1974.
[Barbieri-TransComm09] A. Barbieri, D. Fertonani, and G. Colavolpe, “Time-frequency packing for linear modulations: spectral efficiency and practical detection schemes,” Communications, IEEE Transactions on, vol. 57, no. 10, pp. 2951–2959, 2009.
[Castro-ECOC] A. Castro, F. Cugini, L. Velasco, and P. Castoldi, “On the benefits of differentiating the filter configurations in flexgrid optical networks,” in ECOC Conf., 2014.
[Cugini-JOCN] F. Cugini, F. Fresi, F. Paolucci, G. Meloni, N. Sambo, A. Giorgetti, T. Foggi, L. Potí, and P. Castoldi, “Active Stateful PCE with Hitless LDPC Code Adaptation”, JOCN 2015
[Džanko-ECOC13] M. Džanko, et al., “Self-Healing Optical Networks with Architecture on Demand Nodes”, in Proc. ECOC, London, UK, 2013, pp. 1-3.
[De Valicourt-ECOC14] G. De Valicourt et al, “ Ultra-Compact Monolithic Integrated InP Transmitter at 224 Gb/s with PDM-2ASK-2PSK modulation ”, in Proc. OFC, 2014, paper Th5C.3
[Dupas-OFC15] A. Dupas, E. Dutisseuil, P. Layec, P. Jenneve, S. Frigerio, Y. Yan, E. Hugues-Salas, G. Zervas, D. Simeonidou, S. Bigo, “Real-Time Demonstration of Software-Defined Elastic Interface for Flexgrid Networks” in Proc OFC 2015, paper M3A.2.
[Elschner-OE12] R. Elschner, F. Frey, C. Meuer, J. K. Fischer, S. Alreesh, C. Schmidt-Langhorst, L. Molle, T. Tanimura, C. Schubert, “Experimental demonstration of a format-flexible single-carrier coherent receiver using data-aided digital signal processing,” Opt. Express, vol. 20, pp. 28786-28791, 2012.
[Fabrega-ICTON13] J. M. Fabrega, P. Sevillano, M. Svaluto Moreolo, J. J. Martínez, A. Villafranca, J. M. Subías, “All-Optical In-Band OSNR Measurement in Intensity-Modulated Direct-Detection Optical OFDM Systems,” in Proceedings of International Conference on Transparent Optical Networks, June 2013, Cartagena (Spain)
[Fabrega-OFC15] J.M. Fabrega, M. Svaluto Moreolo, F. J. Vilchez; K. Christodoulopoulos, E. Varvarigos, J.-P. Fernandez-Palacios "Experimental validation of MTU-BRAS connectivity with DMT transmission and coherent detection in flexgrid metro networks using sliceable transceivers," In Proceedings Optical Fiber Communication conference (OFC 2015), Los Angeles (USA), paper Th3H.4.
[Fischer-JLT14] J. K. Fischer, S. Alreesh, R. Elschner, F. Frey, M. Nölle, C. Schmidt-Langhorst, and C. Schubert, “Bandwidth-Variable Transceivers based on Four-Dimensional Modulation Formats”, IEEE/OSA Journal of Lightwave Technology, vol. 32, pp. 2886-2895, 2014
[Fortune-JOCN09] S. Fortune, “Algorithmic Choice of Optical Amplifiers Respecting Noise and Nonlinearity Constraints”, IEEE/OSA J. Opt. Commun. Netw., vol. 1, no. 5, pp. 366-375, 2009.
[Frank-IT62] R. Frank and S. A. Zadoff, “Phase shift pulse codes with good periodic correlation properties (Corresp.)“, IRE Trans. on Information Theory, vol. 8, pp. 381-382, 1962
[Furdek-ONDM14] M. Furdek, M. Džanko, P. Glavica, L. Wosinska, B. Mikac, N. Amaya, G. Zervas, D. Simeonidou, “Efficient Optical Amplification in Self-Healing Synthetic ROADMs”, ONDM 2014, Stockholm, Sweden, May 19-22, 2014

IST IP IDEALIST (Industry-Driven Elastic and Adaptive Lambda
Infrastructure for Service and Transport Networks)
D2.3 – Final Version
Page 9 of 89
[Garrich-ONDM12] M. Garrich, et al., “Architecture on Demand: Synthesis and Scalability”, in Proc. ONDM, Colchester, UK, 2012, pp. 1-6.
[Ghazisaeidi-ECOC12] A. Ghazisaeidi et al., “Performance Analysis of Decision-Aided Nonlinear Cross-Polarization Mitigation Algorithm,” Proc. ECOC 2012, paper We3C.
[Hamad-JOCN09] A. M. Hamad, A. E. Kamal, “Optical Amplifiers Placement in WDM Mesh Networks for Optical Multicasting Service Support”, IEEE/OSA J. Opt. Commun. Netw., vol. 1, no. 1, pp. 85-102, 2009.
[Heimiller-IT60] R. C. Heimiller, “Phase Shift Pulse Codes with Good Periodic Correlation Properties”, IRE Trans. on Information Theory, IT-6, pp. 311-329, 1960
[Hillerkuss-OPTEXP10] D. Hillerkuss, M. Winter, M. Teschke, A. Marculescu, J. Li, G. Sigurdsson, K. Worms, S. Ben Ezra, N. Narkiss, W. Freude, and J. Leuthold, “Simple all-optical FFT scheme enabling Tbit/s real-time signal processing,” Opt. Express vol. 18, no. 9, pp. 9324-9340, Sept. 2010.
[IDEALIST-D1.3] ICT-IDEALIST Deliverable D1.3: “Preliminary results and improvement of reference scenarios”
[IDEALIST-D2.1] ICT-IDEALIST Deliverable D2.1: “Assessment of all potential flexgrid / flex-rate data plane technologies including transmission & switching”
[IDEALIST-D2.2] ICT-IDEALIST Deliverable D2.2: “Modelling and experimental work on the chosen flexgrid / flexrate technology options”.
[Kang-Opt.Express07] I. Kang et al, "Phase-shift-keying and on-off-keying with improved performances using electroabsorption modulators with interferometric effects", in Opt. Express, vol. 15, no. 4, pp. 1467–1473, 2007
[Kuschnerov-JLT-2009] M. Kuschnerov et al., “DSP for Coherent Single-Carrier Receivers,” J. Lightwav. Technol., Vol. 27, no. 17, p. 3614 (2009).
[Kuschnerov-PJ10] M. Kuschnerov, M. Chouayakh, K. Piyawanno, B. Spinnler, E. de Man, P. Kainzmaier, M. S. Alfiad, A. Napoli, and B. Lankl, “Data-Aided Versus Blind Single-Carrier Coherent Receivers”, Photonics Journal, IEEE, vol. 2, pp. 387-403, 2010.
[Layec-BLTJ13] P. Layec, A. Morea, F. Vacondio, O. Rival, and J.–C. Antona “Elastic Optical Networks: The Global Evolution to Software Configurable Optical Networks,” in Bell Labs Technical Journal, vol. 18, no.3, pp. 133-151, Dec. 2013.
[Layec-ECOC14] P. Layec, A. Ghazisaeidi, G. Charlet, J.–C. Antona and S. Bigo “A Novel Compensation Method at the Receiver for Cross-Polarization Modulation Effects,” in Proc. ECOC, 2014, paper Th.2.3.5.
[Layec-JLT15] P. Layec, A. Ghazisaeidi, G. Charlet, J.–C. Antona and S. Bigo, “Generalized Maximum Likelihood for Cross-Polarization Modulation Effects Compensation,” to appear in J. Light. Tech., 2015.
[Li-OFC10] L. Li et al., “Nonlinear Polarization Crosstalk Canceller for Dual-Polarization Digital Coherent Receivers,” Proc. OFC 2010, paper OWE3.
[Manousakis-JOCN13] K. Manousakis, A. Angeletou, M. Varvarigos, “Energy Efficient RWA Strategies for WDM Optical Networks”, IEEE/OSA J. Opt. Commun. Netw., vol. 5, no. 4. pp. 338-348, 2013.
[Mardoyan-OFC15] H. Mardoyan, et al., “Transmission of Single-Carrier Nyquist-Shaped 1Tb/s Line-Rate Signal over 3000 km,” in Proc OFC 2015
[Mikac-ICTON14] B. Mikac, M. Dzanko, M. Furdek, E. Hugues-Salas, G. Zervas, D. Simeonidou, “Availability Aspects of Self-healing Optical Nodes Designed by Architecture on Demand”, ICTON 2014, Graz, Austria, July 6-10, 2014.
[Morea-JOCN] A. Morea, J. Renaudier, T. Zami, A. Ghazisaeidi, O. Bertran-Pardo, “Throughput Comparison between 50GHz and 37.5GHz-grid Transparent Networks [Invited]”, IEEE/OSA J. Opt. Commun. Netw., vol. 7, no. 2., 2015.

IST IP IDEALIST (Industry-Driven Elastic and Adaptive Lambda
Infrastructure for Service and Transport Networks)
D2.3 – Final Version
Page 10 of 89
[Napoli-ComMag15] A. Napoli, M. Bohn, D. Rafique, A. Stavdas, N. Sambo, L. Poti, M . Noelle, J.K. Fischer, E. Riccardi, A. Pagano, A. Di Giglio, J. Gimenez, M. Svaluto Morolo, J. M. Fabrega, E. Hugues-Salas, G. Zervas, D. Simeounidou, P. Layec, A. D’Errico, T. Rahman, “Next Generation Elastic Optical Networks: the Vision of the European Research Project IDEALIST”, to appear in IEEE Commun. Mag., Feb. 2015.
[Noelle-OFC14] M. Noelle, F. Frey, R. Elschner, C. Schmidt-Langhorst, A. Napoli, and C. Schubert, "Performance Comparison of Different 8QAM Constellations for the Use in Flexible Optical Networks", in Proc OFC 2014, paper W3.B.2.
[Nölle-OFC2015] M. Nölle, F. Frey, R. Elschner, C. Schmidt-Langhorst, J. K. Fischer, and C. Schubert, “ Investigation of CAZAC Sequences for Data-Aided Channel Estimation Considering Nonlinear Optical Transmission“, OFC 2015 (accepted for publication), paper Th3G.2
[Paolucci-JOCN] F. Paolucci, F. Cugini, F. Fresi, G. Meloni, A. Giorgetti, N. Sambo, L. Potí, A. Castro, L. Velasco, and P. Castoldi, “Super-filter technique in SDN-controlled Elastic Optical Networks”, JOCN 2015.
[Pfau-JLT09] T. Pfau, et al., “Hardware-Efficient Coherent Digital Receiver Concept with Feedforward Carrier Recovery for M -QAM Constellations”, J. Light. Tech., 27(8), 989-999, (2009)
[Pittala-JLT14] F. Pittala, I. Slim, A. Mezghani, and J.A. Nossek, “Training-Aided Frequency-Domain Channel Estimation and Equalization for Single-Carrier Coherent Optical Transmission Systems”, IEEE/OSA Journal of Lightwave Technology, vol. 32, pp. 4247-4261, 2014
[Pittalà-ICTON11] F. Pittalà, F. N. Hauske, Y. Ye, N. G. Gonzalez, and I. T. Monroy, “Fast and Robust CD and DGD Estimation Based on Data-Aided Channel Estimation”, ICTON, 2011, paper We.D1.5.
[Poggiolini-PTL11] P. Poggiolini, A. Carena, V. Curri, G. Bosco, and F. Forghieri, “Analytical Modeling of Non-Linear Propagation in Uncompensated Optical Transmission Links”, IEEE Photonics Technology Letters, 2011, vol. 23, pp. 742-744
[Poggiolini-JLT12] P. Poggiolini, "The GN Model on Non-linear Propagation in Uncompensated Coherent Optical Systems", JLT, vol. 30, pp. 3857-3879, 2012
[Pulikkaseril-OPTICS EXPRESS] C.Pulikkaseril, L.A.Stuart, M.A.F Roelens, G.W.Baxter, S.Poole, S.Frisken, “Spectral Modeling of channel band shapes in wavelength selective switches”, 25 April 2011 / Vol. 19, No. 9 / OPTICS EXPRESS 8458.
[Rafique-JLT14a] Rafique, D., Napoli, A., Calabro, S., & Spinnler, B. (2014). Digital Preemphasis in Optical Communication Systems: On the DAC Requirements for Terabit Transmission Applications. Journal of Lightwave Technology, 32(19), 3247-3256.
[Rafique-JLT14b] Rafique, D., Rahman, T., Napoli, A., & Spinnler, B. Digital Pre-Emphasis in Optical Communication Systems: On the Nonlinear Performance.
[Rahman-PTL-2013] T. Rahman et al., “On the Mitigation of Optical Filtering Penalties Originating from ROADM Cascade,” Photon. Technol. Lett., Vol. 26, no. 2, p. 154 (2014).
[Rahman-ECOC-2014] T. Rahman et al., “Mitigation of Filtering Cascade Penalties using Spectral Shaping in Optical Nodes”, in proceedings ECOC 2014.
[Renaudier-ECOC13] J. Renaudier, A. Ghazisaeidi, P. Tran, O. Bertran-Pardo, G. Charlet, S. Bigo, “Long-Haul Transmission of 1-Tb/s Superchannels, 175-GHz Spaced, over SSMF using Nyquist Pulse Shaping and Flex-Grid WDM architecture”, in Proc. ECOC 2013.
[Rios-Muller-ECOC14] R. Rios-Müller, J. Renaudier, P. Tran, G. Charlet, “Experimental Comparison of Two 8-QAM Constellations at 200Gb/s over Ultra Long-Haul Transmission Link,” in Proc ECOC 2014.
[Röhrs-COMSIG92] U. H. Röhrs and L. P. Linde, „Some Unique Properties and Applications of perfect squares Minimum Phase CAZAC Sequences”, Southern African Conference on Communications and Signal Processing (COMSIG), 1992

IST IP IDEALIST (Industry-Driven Elastic and Adaptive Lambda
Infrastructure for Service and Transport Networks)
D2.3 – Final Version
Page 11 of 89
[Sambo-ECOC] N. Sambo, G. Meloni, F. Paolucci, M. Imran, F. Fresi, F. Cugini, P. Castoldi, L. Potì, “First demonstration of SDN-controlled SBVT based on multi-wavelength source with programmable and asymmetric channel spacing”, Proc. of ECOC 2014.
[Sambo-JLT11] N. Sambo, et al., "Modeling and Distributed Provisioning in 10–40–100-Gb/s Multirate Wavelength Switched Optical Networks," , Journal of Lightwave Technology, vol.29, May 2011
[Sambo-JLT] N. Sambo, G. Meloni, F. Paolucci, F. Cugini, M. Secondini, F. Fresi, L. Potì, P. Castoldi, "Programmable Transponder, Code and Differentiated Filter Configuration in Elastic Optical Networks," Lightwave Technology, Journal of , vol.32, no.11, pp.2079,2086, June1, 1 2014
[Sambo-JOCN] N. Sambo, A. D'Errico, C. Porzi, V. Vercesi, M. Imran, F. Cugini, A. Bogoni, L. Pot , P Castoldi, "Sliceable transponder architecture including multiwavelength source," Optical Communications and Networking, IEEE/OSA Journal of , vol.6, no.7, pp.590,600, July 2014
[Sambo-ComMag15] N. Sambo, P. Castoldi, A. D’Errico, E. Riccardi, A. Pagano, M. Svaluto Moreolo, J.M. Fabrega, D. Rafique, A. Napoli, S. Frigerio, E. Hugues-Salas, G. Zervas, M. Nolle, J.K. Fischer, A. Lord, J. Gimenez, “Next Generation Sliceable Bandwidth Variable Transponder: the Vision of the European Research Project IDEALIST”, to appear in IEEE Commun. Mag., Feb. 2015.
[Schmalen-BLTJ13] L. Schmalen and A. J. D. L. Van Wijngaarden, “Forward Error Correction in Optical Core and Optical Access Networks,” Bell Labs Technical Journal, vol. 18, no. 3, pp. 39–66, Nov. 2013.
[Schmogrow-OptExpress12] R. Schmogrow et al., "Real-time Nyquist pulse generation beyond 100Gb/s and its relation to OFDM," Opt. Express, vol. 20, no. 1, pp. 317-337, Jan. 2012.
[Shieh-10] W. Shieh and I. Djordjevic, Orthogonal Frequency Division Multiplexing for Optical Communications, Elsevier, 2010.
[Sperti-PTL11] D. Sperti et al., “Optical Solutions to Improve PDM-QPSK Resilience Against Cross-Channel Nonlinearities: A Comparison,” Photon. Tech. Lett., 23, pp. 667 (2011).
[Stojanovic-OFC12] N. Stojanovic et al., “Hybrid Compensation of Nonlinear Effects in Coherent Optical Receivers,” Proc. OFC 2012, paper OTh3C6
[Svaluto-ECOC13] M. Svaluto, J. M. Fabrega, F. J. Vilchez, L. Nadal, V. López, G. Junyent, "Experimental Validation of an Elastic Low-Complex OFDM-Based BVT for Flexi-Grid Metro Networks," in Proceedings of 39th European Conference and Exhibition on Optical Communication (ECOC 20013), London (UK).
[Svaluto-ECOC14] M. Svaluto Moreolo, J. M. Fabrega, F. J. Vilchez, K. Christodoulopoulos, E. Varvarigos, V. López, J. P. Fernández-Palacios, "Assessment of Flexgrid Technologies in the MAN for Centralized BRAS Architecture Using S-BVT," in Proceedings of European Conference on Optical Communications (ECOC 2014), Cannes (France).
[Svaluto-ONDM14] M. Svaluto Moreolo, J. M. Fabrega, L. Nadal, F. J. Vílchez, V. López, J. P. Fernández-Palacios, “Cost-Effective Data Plane Solutions Based on OFDM Technology for Flexi-Grid Metro Networks Using Sliceable Bandwidth Variable Transponders”, in Proc. ONDM 2014.
[Tran-PTL12] A. V. Tran, C. Zhu, C. C. Do, S. Chen, T. Anderson, D. Hewitt, and E. Skafidas, “8×40-Gb/s Optical Coherent Pol-Mux Single Carrier System With Frequency Domain Equalization and Training Sequences”, IEEE Photonics Technology Letters, vol. 24, pp. 885-887, 2012
[Xu-ISIT08] W. Xu et al., “On Exact ML Detection for Non-Coherent MIMO Wireless Systems: a Branch-Estimate-Bound Optimization Framework,” in Proc. ISIT 2008.
[Xu-OFC14] X. Xu, Q. Zhuge, B. Châtelain, M. Qiu, M. Chagnon, M. Morsy-Osman, W. Wang, and D. V. Plant, “Nonlinearity-Tolerant Frequency Domain Root M-shaped Pulse for Spectrally Efficient Coherent Transmissions,” Opt. Fiber Commun. Conf., 2014, W1G.3

IST IP IDEALIST (Industry-Driven Elastic and Adaptive Lambda
Infrastructure for Service and Transport Networks)
D2.3 – Final Version
Page 12 of 89
1.3 Acronyms
ADC Analog to Digital Converter
AoD Architecture on Demand
APS Automatic Protection Switch
AS Architecture Specific
ASE Amplified Spontaneous Emission
AWG Array Waveguide Grating
AWGN Additive White Gaussian Noise
B2B Back to Back
BCJR Bahl-Cocke-Jelinek-Raviv detector
BER Bit Error Ratio
BL Bit Loading
BP(F) Band Pass Filter
BPSK Binary Phase Shift keying
BRAS Broadband Remote Access Server
BV Bandwidth Variable
BVT BV Transponder
BV-WSS (or SSS)
Bandwidth Variable Wavelength Selective Switches (or Spectrum Selective Switches)
CapEx Capital Expenditure
CAZAC Constant Amplitude and Zero AutoCorrelation
CD Chromatic Dispersion
CDF Cumulative Distribution Function
CE Constant Envelope
CO Coherent
CW Continuous Wave
DAC Digital Analog Converter
DD Direct Detection
DGD Differential Group Delay
DMT Discrete MultiTone
DP (or PM) Dual Polarization (or Polarization Modulation)
DPE Digital Pre Emphasis
DSP Digital Signal Processing
DWDM Dense WDM
DXC Digital Cross Connect

IST IP IDEALIST (Industry-Driven Elastic and Adaptive Lambda
Infrastructure for Service and Transport Networks)
D2.3 – Final Version
Page 13 of 89
ECL External Cavity LASER
EDFA Erbium Doped Fiber Amplifier
EFS Enforced Fibre Switching algorithm
ENOB Effective Number Of Bits
EON Elastic Optical Network
ER Extinction Ratio
FEC Forward Error Correction
Flex-OXC Flexible OXC
FPGA Field Programmable Gate Array
FS Fiber Switch
FSP Fixed Shortest Path
FWHM Full Width Half Maximum
GFF Gain Flattening Filter
GML Generalizes- ML
GMPLS Generalized Multi-Protocol Label Switching
GN Gaussian Noise
GUI Graphical User Interface
HD Hard Decision
ICI Inter-Carrier Interference
IDEALIST Industry-Driven Elastic And Adaptive Lambda Infrastructure For Service And Transport Networks
IM Intensity Modulation
InP Indium Phosphide
I/O Input/Output
IP Internet Protocol
IQ In Phase-Quadrature
ISI Inter Symbol Interference
ITU-T International Telecommunication Union-Telecommunication Standardization Sector
(LA)-PSCF (Large Area) Pure Silica Core Fiber
LASER Light Amplification by Stimulated Emission of Radiation
LDPC Low-Density Parity-Check
LO Local Oscillator
MAN Metro Area Networks
MB Multi Band
MDT Mean Down Time

IST IP IDEALIST (Industry-Driven Elastic and Adaptive Lambda
Infrastructure for Service and Transport Networks)
D2.3 – Final Version
Page 14 of 89
MEMS Micro Electro-Mechanical System
ML Maximum Likelihood
MTBF Mean Time Between Failure
MTTF Mean Time To Failure
MTTR Mean Time To Repair
MTU Multi Tenant Unit
MW Multi Wavelengths
MZM Mach-Zehnder Modulator
NFP Network Function Progammable
NLT Non-Linear Threshold
NPCC Non-linear Polarization Crosstalk Canceller
NQIM Non Quadrature Intensity Mudulation
NSF National Science Foundation
NWDM Nyquist Wavelength Division Multiplexing
ODUn Optical Data Unit of Order n
OFDM Orthogonal Frequency Division Multiplexing
OH OverHead
OLA Optical Line Amplifier
OMS Optical Multiplexing Section
OOK Optical On-Off Keying (equivalent to Intensity Modulation)
OpEx Operating Expense
OPU Optical Payload Unit
OSNR Optical Signal to Noise Ratio
OTLC Optical Channels Transport Lanes OTLC
OTN Optical Transport Network
OTUn Optical Transport Unit of order N
OTUCnTG OTUCn among several Tributary Groups, of order N
OXC Optical Cross Connect
PAM Pulse Amplitude Modulation
PAMW Programmable and Asymmetric Multi-Wavelength
PAPR Peak to Average Power Ratio
PCE Path Computation Element
PDM Polarization-Division Multiplexing
PLC Planar Lightwave Circuit
PLZT Lanthanum-Doped Lead Zirconium Titanate Piezoelectric Material

IST IP IDEALIST (Industry-Driven Elastic and Adaptive Lambda
Infrastructure for Service and Transport Networks)
D2.3 – Final Version
Page 15 of 89
PM (or DP) Polarization Multiplexing
POS Piezoelectric Optical Switch
PRBS Pseudo-Random Bit Sequence
PS Polarization Scrambler
QoT Quality of Transmission
QPSK Phase Shift Keying
QAM Quadrature Amplitude Modulation
QIM Quadrature Intensity Modulation
RF Radio Frequency
ROADM Reconfigurable Optical Add Drop Multiplexer
RRC Root Raised Cosine
RSA Routing and Spectrum Allocation
RWA Routing and Wavelength Assignment
RWTA Routing and Wavelength/Tunnel Assignment
SD Soft Decision
SD-FEC Soft Decision FEC
SDM Spatial Division Multiplexing
SDN Software Defined Network
SE Spectral Efficiency
SERANO Switchless Elastic Rate Node
SLA Service Level Agreement
SNR Signal to Noise Ratio
SP Shortest Path
SPL Splitter
SPM Self-Phase Modulation
S-BVT Sliceable-BVT
SSB Single Side Band
SSMF Standard Single Mode Fiber
SSS (or BV-WSS)
Spectrum Selective Switch
TE Traffic Engineering
TFP Time Frequency Packing
TLS Tunable Laser Source
TTF Time To Failure
TTR Time To Repair

IST IP IDEALIST (Industry-Driven Elastic and Adaptive Lambda
Infrastructure for Service and Transport Networks)
D2.3 – Final Version
Page 16 of 89
VOA Variable Optical Attenuator
WAN Wide Area Network
WDM Wavelength Division Multiplexing
WP Work Package
WS Wave Shaper
WSS Wavelength Selective Switch
XC Cross Connect
XPM Cross Phase Modulation
XPolM Cross-Polarization Modulation

IST IP IDEALIST (Industry-Driven Elastic and Adaptive Lambda
Infrastructure for Service and Transport Networks)
D2.3 – Final Version
Page 17 of 89
1.4 Document history
Version Date Authors Comments
Draft v1.0 14/11/2014 Patricia Layec (ALBLF) ToC, some guidelines
Draft v1.1 09/01/2014 Patricia Layec, Emilio
Hugues-Salas Addition of ALBLF and UnivBris
contributions
Draft v1.2 12/01/2014 Markus Nölle (HHI) Addition of HHI contributions
Draft v1.3 15/01/2014 Nicola Sambo (CNIT) Addition of Filters, monitoring
Draft v1.4 19/01/2015 WP2 team Addition of CTTC, Coriant, UoP
contributions
Draft v1.5 29/01/2015 Patricia Layec (ALBLF) Corrections
Final Version 06/02/2015 Emilio Riccardi (TI) Final checked version
1.5 Document overview
This document is divided into 4 macro chapters, structured as follows:
Chapter 2 is dedicated to an update analysis of the most innovative optical node architectures - identified by IDEALIST - specifically designed to optimally cope with the inherent flexibility in optical spectrum allocation and bandwidth-distance trade off of the superchannel transmission techniques and of the Sliceable-Bandwidth Variable Transponders (S-BVT) devices. These are the Architecture on Demand (AoD) for an optical node and the Switchless Elastic Rate Node (SERANO) modules.
In all known optical node architectures (AoD or SERANO are no exceptions), some optical filtering elements seem unavoidable to address optical switching on a per superchannel basis; therefore the chapter starts with a discussion of the impact of cascaded optical filtering and on the most promising techniques to counteract it.
Then a discussion of AoD follows, exploring in some depth the enabled self-healing feature and the advantages it bring in an Elastic Optical Network (EON); how to maximize efficiency is also discussed in term of improving connection availability minimizing the amplification and filtering elements and considering several options for the flexible optical backplane implementation.
Finally the SERANO solution is reviewed, collecting all the most important results obtained up to now.
Chapter 3 provides a brief review of the main transmission techniques investigated within IDEALIST namely Nyquist WDM, OFDM and Time-Frequency packing (TFP); all these techniques can be adapted to specific network scenarios and can be used to implement superchannels. Then a section is dedicated to the analysis of system performance using Gaussian noise model, which can provide a simple and valuable tool in planning and designing a complex EON.

IST IP IDEALIST (Industry-Driven Elastic and Adaptive Lambda
Infrastructure for Service and Transport Networks)
D2.3 – Final Version
Page 18 of 89
Furthermore, several sections are dedicated to the introduction and analysis of new advanced DSP solutions which can effectively increase system performance, compensating for various kinds of linear and non- linear transmission impairments.
The last sections of the chapter give two examples of applications of these solutions to both long haul and metro area networks, where in particular low cost solutions based on different flavors of OFDM are discussed.
Chapter 4 is mainly dedicated to aspects of monitoring, programmability and control of network devices such as S-BVT and flexible OTN interfaces. Being these topics in between WP2 and WP3 domains, material here reported have to be integrated with what is written in the deliverables pertaining to WP3 (for example D3.2), in particular for what concern a detailed description of the architecture of the control plane, the Software Defined Network (SDN) controller and the format of exchanged messages.
Some example are given showing how an SDN controller can dynamically react to transmission performance degradation modifying redundancy or coding of transmitted signals, or how it can effectively control an elastic OTN S-BVT interface.
The last section of the chapter presents progresses on the aspects of multivendor interoperability, addressing both compatibility at the physical level and DSP technology.
Chapter 5 concludes the deliverable.
IST IP IDEALIST (Industry-Driven Elastic and Adaptive Lambda
Infrastructure for Service and Transport Networks)
D2.3 – Final Version
Page 19 of 89
2 Node architectures
2.1 Filtering aspects
This section reports the work done within IDEALIST concerning filtering effects’ issues. First, filter cascade effects are modeled for planning purposes (e.g., identifying the maximum number of filters a lightpath can traverse without experiencing an unacceptable BER). Then, two techniques with the aim of mitigating filtering effects are presented: i) the first one is based on spectral shaping; ii) the second one, called super-filtering, was presented in D2.2 and here is more deeply investigated.
2.1.1 Filter cascade effects modeling
The effect of cumulative filtering on optical signals, carried on an optical switching network, due to the crossing of many WSSs, imposes constraints on the bandwidth that can be allocated for each channel. This may have a significant impact on the expected spectral efficiency of an elastic optical network based on flexgrid. Therefore, such effect must be studied accurately, in order to be able to assign adequate portions of spectrum to each superchannel, taking into account, among other parameters, the number of nodes to be crossed.
For this reason an extensive simulations study has been performed, to address how the transmission performance degrades as a function of the number of crossed filters. First, a single carrier optical channel with a baud rate of 32GBd/s was considered, with two different modulation formats (100Gbit/s PM-QPSK and 200Gbit/s PM-16QAM); moreover two different filter models (defined respectively in [Morea-JOCN] and [Pulikkaseril-OPTICS EXPRESS]) have been implemented, mainly to compare results with what is already known in the literature and to calibrate the simulation environment. Afterwards the analysis focused on 200Gbit/s PM-16QAM modulation format, and adopted the filter model described in [Pulikkaseril-OPTICS EXPRESS]. The aim was to enlighten how the transmission performance varies as a function of the bandwidth of the optical filters in both cases of a single carrier channels, and a superchannels. For the superchannel instance, cumulative filtering affects the two most external subcarriers inducing an addition penalty with respect to the other sub-carriers of the superchannel, thus the penalty is expected to be lower than that experienced by a single carrier channel.
The two filter models adopted in the first part of the activity are respectively a super-Gaussian filter of order 4.2 and B-3dB=35.2GHz (referred to as “SHARP”, following the terminology used in [Morea-JOCN]), and a filter (denoted as “WSS”), whose transfer function is obtained from a simplified physical model of the operation of a WSS device [Pulikkaseril-OPTICS EXPRESS] and is given by:
where B is the -6dB bandwidth in frequency of the optical filter and represents the width in frequency of the aperture formed at the image plane of spatially diffracted light, while σ is related to the steepness of the filter fronts, and represents how the beam has been focused onto the aperture plane. In a WSS device the σ parameter is fixed by geometry and size. A peculiar characteristic, well experimentally verified, of this transfer function is that the

IST IP IDEALIST (Industry-Driven Elastic and Adaptive Lambda
Infrastructure for Service and Transport Networks)
D2.3 – Final Version
Page 20 of 89
steepness of the filter fronts is closely independent of the bandwidth of the synthetized filter. This transfer function is the best known candidate in accurately describing all spectral filters synthesizable within the range of a WSS device.
In the simulations most of the electrical and optical parameters at the transmitter and receiver, were kept ideal, in order to pull out the contribution of cumulative filtering to the degradation of optical transmission only (ideal laser linewidth and extinction ratio in transmission, ideal coherent receiver, etc.). The subcarrier spectral shaping was given by a square root raised cosine electrical filter with roll-off = 0.1 at the transmitter, and a matching filter at the receiver. The demodulation is based on a training sequence algorithm with 25 taps.
The following figures show some of the simulation results, in terms of BER versus OSNR, comparing the theoretical behavior for back to back transmission with simulated back to back and showing the behavior of several cascaded filters of different bandwidth. In particular in Figure 2-1, Figure 2-2 and Figure 2-3 are shown respectively the 100Gbit/s PM-QPSK case using SHARP filter model, the 200Gbit/s PM-16QAM case, again using the SHARP filter model and the 200Gbit/s PM-16QAM case, using the WSS filter model with a -6dB bandwidth of 37.5GHz (corresponding to a -3dB bandwidth that matches that of the SHARP filter, 35.2GHz). As we have used ideal components both at the transmitter and at the receiver, the back to back curve matches very closely the theoretical one, while, as expected, the performance gets worse and worse as the number of filters increases, in all three cases. The case shown in Figure 2-4 is still 200Gbit/s PM-16QAM with the same WSS filter as for Figure 2-3, but an almost ideal electrical compensator of the cumulative filtering distortion has been introduced at the receiver; such compensator could be implemented, at least approximately, in a real receiver by a DSP. In the simulations we adopted an electrical filter with a transfer function equal to the inverse of the transfer function of the WSS filters chain; it is interesting to note that, even in the presence of an “ideal” compensator, penalties are still present with an improvement more significant for higher OSNR values and higher number of crossed filters.
Figure 2-1: BER vs OSNR for the 100Gbit/s PM-QPSK case using SHARP filter model.

IST IP IDEALIST (Industry-Driven Elastic and Adaptive Lambda
Infrastructure for Service and Transport Networks)
D2.3 – Final Version
Page 21 of 89
Figure 2-2: BER vs OSNR for the 200Gbit/s PM-16QAM case using SHARP filter model.
Figure 2-3: BER vs OSNR for the 200Gbit/s PM-16QAM case using WSS filter model.
Figure 2-4: BER vs OSNR for the case 200Gbit/s PM-16QAM using WSS filter model and an electrical ideal compensator at the receiver.

IST IP IDEALIST (Industry-Driven Elastic and Adaptive Lambda
Infrastructure for Service and Transport Networks)
D2.3 – Final Version
Page 22 of 89
Figure 2-5: BER vs OSNR for the 200Gbit/s PM-16QAM case for different bandwidth of the WSS filter.
In Figure 2-5 a number of crossed WSS filters ranging from 6 to 30 have been considered. In the hypothesis of a switch-and-select architecture for a ROADM node the number of crossed WSSs is 3 in the adding/dropping nodes, and 2 in a passthrough node; thus the analysis considers links ranging from 1 hop up to 12 hops, covering almost all the interesting cases in an optical transparent network.
The six graphs reported in the figure show the BER vs OSNR for six different values of the WSS filter bandwidth, ranging from 35GHz to 47.5GHz in 2.5 GHz steps. It appears that for narrow WSS bandwidths the performance strongly degrade immediacy after very few crossing filters (or hops), while this dependence decreases as the WSS bandwidth increases. In particular, considering a maximum acceptable BER=1.10-2 (for Soft Decision-FEC), the case B=35GHz gives unacceptable performance regardless the number of hops, while the case B=37.5GHz allows no more than 2 hops; for bandwidths grater then 42.5GHz the performance does not seem to depend on the number of hops anymore.
Figure 2-6 shows OSNR penalties (with respect to performance in back to back) at
BER=1.10-2 plotted against the WSS filter bandwidth, for different number of crossed filters.
As expected again, in this figure it is manifest that narrower filters show greater penalties

IST IP IDEALIST (Industry-Driven Elastic and Adaptive Lambda
Infrastructure for Service and Transport Networks)
D2.3 – Final Version
Page 23 of 89
and strong dependence on the number of crossed filters, while, increasing the bandwidth of the filters, the penalty asymptotically tends to vanish. The above diagram can be profitably used in designing a network in order to determine the smallest filter bandwidth on the ITU-T grid compatible with the number of hops of each considered link, if a specific acceptable penalty is considered.
Figure 2-6: OSNR penalties vs WSS filter bandwidth at BER=10-2, for the 200Gbit/s PM-16QAM case.
The above analysis has been extended to the case of a superchannel with 3 subcarriers.
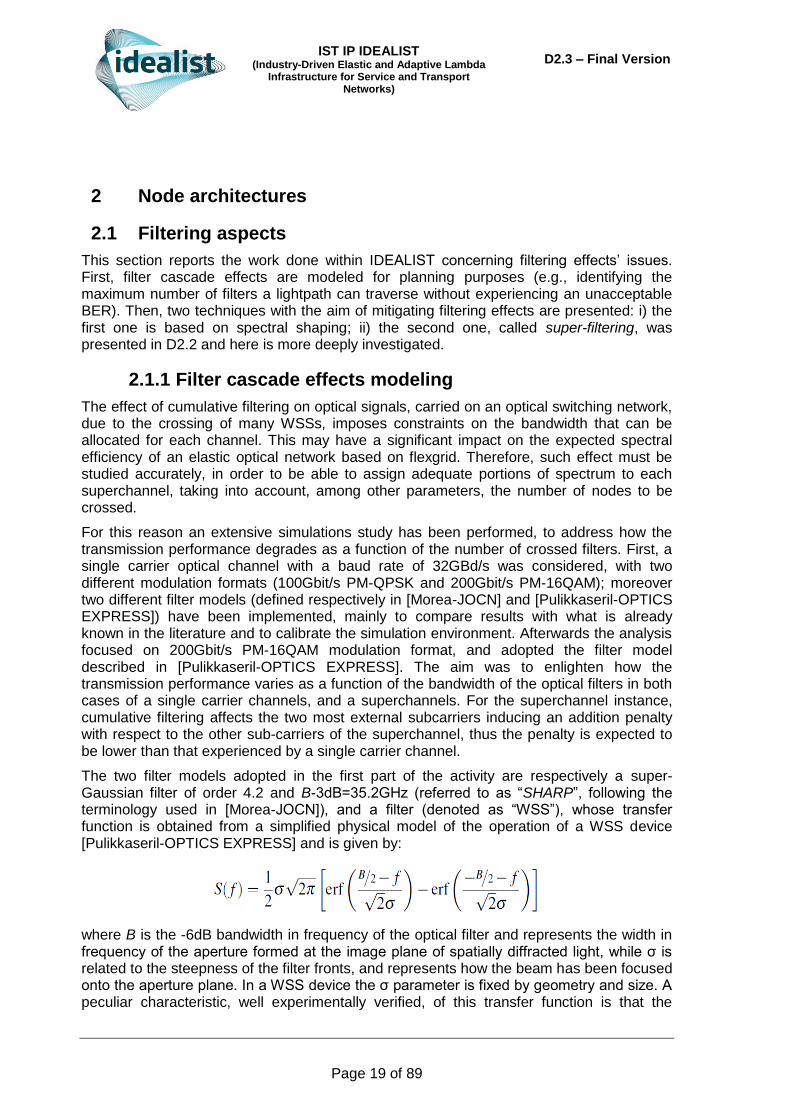
Table 2-I and Figure 2-7 show a preliminary simulation result at OSNR=18dB, with a channel spacing of 37.5GHz and a WSS filter bandwidth of 3x37.5 =112.5GHz. The obtained BER for different number of filters is compared with the one of a single carrier channel and filter bandwidth of 37.5GHz. It can be seen that the BER of the single carrier channel is significantly higher with respect to that experienced by the lateral subcarriers of the superchannel; as expected the central subcarrier is not affected by cumulative filtering, so negligible penalties are shown, while the lateral subcarriers are distorted by the filters only on one side resulting in less penalty if compared to the single carrier channel.
Table 2-I
IST IP IDEALIST (Industry-Driven Elastic and Adaptive Lambda
Infrastructure for Service and Transport Networks)
D2.3 – Final Version
Page 24 of 89
Figure 2-7: BER vs number of filters at OSNR=18dB; comparison between single channel and superchannel subcarriers.
To be more quantitative, Figure 2-8 shows OSNR penalties (with respect to performance in
back to back) at BER=1.10-2 plotted against the subcarrier spacing for different number of
crossed filters, obtained for one of the lateral subcarriers of the 3 subcarriers superchannel. To make a fair comparison with the performance given by a single channel (the one shown in Figure 2-6), the abscissa in Figure 2-8 has been redefined as:
Beq= WSSBW – (n-1) x f
Where: WSSBW is the optical filter bandwidth (referred to 6 dB for the WSS filter considered here), and has been kept fixed to 112.5GHz; n is the number of subcarriers (3 in this case);
f is the spacing between subcarriers, and it has been varied from 37.25GHz to 33.75GHz with step of -1GHz, resulting in a Beq that varies from 38GHz to 45GHz. Beq is called the Equivalent Bandwidth of the filter and is a measure of the relative positioning of the lateral subcarriers respect to the optical filter fronts.
It turns out that, as expected, lateral subcarriers exhibit a significantly lower penalty with respect to the single channel case.
Figure 2-8: OSNR penalties vs WSS filter bandwidth at BER=10-2, for one of the lateral subcarriers of the three subcarrier superchannel case.
Work is ongoing to extend the analysis to superchannels with more subcarriers: preliminary results seem to support the hypothesis that only the more lateral subcarriers are affected

IST IP IDEALIST (Industry-Driven Elastic and Adaptive Lambda
Infrastructure for Service and Transport Networks)
D2.3 – Final Version
Page 25 of 89
by cumulative filtering and that the impact is independent on the number of the subcarriers in the superchannel but only on the Equivalent Bandwidth of the filter, and the subcarrier modulation format, baud-rate and spectral shaping. This result is consistent with the bandwidth-independence steepness of the filter fronts in the WSS transfer function.
2.1.2 Experimental verification of mitigation of filtering cascade penalties employing spectral shaping within optical nodes
Current WDM networks employ fixed 50GHz grid, which leads to a sub-optimal utilization of the spectrum, because, for example, a 28/32GBd/s signal could be allocated within a 37.5GHz grid instead of using a 50GHz grid and leading to the save of ~30% in spectral efficiency (SE).
On the other hand, the allocation of a 32GBd/s signal within 37.5GHz is only theoretically possible, since the filter transfer functions are not ideal. For instance commercial WSSs, with 12.5GHz slice, present a -3dB bandwidth at around 33GHz when set to operate at 37.5GHz. The direct consequence of this is that after a single WSS, the filter bandwidth is already comparable to one of the channel, condition that dramatically increases the inter-symbol interference (ISI). Furthermore, the penalty arising from a long cascade of such filters would result being problematic since the margin w.r.t. the equivalent bandwidth is practically inexistent. In fact, within modern meshed networks, WDM channels cross several multi-degree ROADMs (sometimes based on WSSs) and therefore the amount of introduced ISI can result a blocking penalty for the entire system.
To maximize the spectral efficiency (approaching to one the ratio between signal and grid bandwidth) we reported in [Rahman-PTL-2013] the performance for a set of advanced modulation formats transmitted at 28/32GBd/s when passing a significant amount of WSSs (comparable to what it may happen in national European or pan-European network). Herein we reported a significant improvement in the mitigation of these penalties by employing different optical pulse shaping. Now in [Rahman-ECOC-2014] we experimentally assess the performance. Here we consider a 32GBd/s PM-8QAM and 16QAM signals where their neighboring channels are continuously added or dropped in a 37.5GHz WDM grid.
Based on our previous results in [Rahman-PTL-2013], we consider only the optical spectral shaping provided by a wave-shaper (WS) at each node as mitigating device. The transmission over increased number of optical nodes both for PM-8QAM and PM-16QAM is reported. Moreover, we show that the benefit of the proposed mitigation approach significantly increases for higher number of filter cascades.
Experimental setup Figure 2-9 shows net per channel optical filter after add/drop operation from one to ten optical nodes. After one optical node, the 3-dB bandwidth is 29.4GHz which is reduced to 20.9GHz after ten nodes.
In order to evaluate add/drop penalties from optical nodes, an experiment was set up as shown in Figure 2.11 of [Rahman-ECOC-2014] where we considered 8QAM and 16QAM at 32GBd/s, employing a root raised cosine (RRC) filter with roll-off factor = 0.2. The neighboring channels (x2) and test channel were generated by two separate IQ-modulators and their spacing was adjusted by tunable LASERs fed in to the IQ-modulators. 8QAM or 16QAM modulated signals then went through polarization multiplex emulation stage where single polarization signals were split in two orthogonal polarizations, delayed with respect to each other and then combined again to generate dual polarization signals. Finally both

IST IP IDEALIST (Industry-Driven Elastic and Adaptive Lambda
Infrastructure for Service and Transport Networks)
D2.3 – Final Version
Page 26 of 89
polarization multiplexed test and neighboring channels were combined by a 3-dB coupler which were amplified by an EDFA before transmission through a recirculating optical loop.
Figure 2-9: (left) Evolution of WSS transfer function as a result of add/drop. (right) WS transfer function (HWS(f)) variation in pass-band attenuation by changing the in-band attenuation. Hdesired(f) is 5th order Gaussian filter. Hch(f) is transfer function of
optical node after add/drop.
The optical loop consisted of an emulated node with 2×WSSs, for de-multiplexing and multiplexing functionalities. Both neighboring channels were dropped at the first WSS, and added back again through the second WSS, emulating an add/drop scenario in an optical node. Due to de-multiplex/ multiplex operation in each loop, worst-case filtering penalties were induced on the central (test) channel. To mitigate these filtering degradations, optical spectral shaping of test channel was employed by a WS. In addition, an EDFA amplified 82km transmission link of large area pure silica core fiber (LA-PSCF) was also employed. In order to avoid periodic signal conditioning by loop components, a polarization scrambler (PS) was also present.
After N loops, the optical signal went through a switch, amplified by an EDFA and filtered by a tunable band-pass filter (BPF) before mixing with local oscillator LASER in the optical front end. Finally the electrical outputs of the optical front end were sampled by a 50Gsamples/s oscilloscope triggered with the loop switch. The sampled test signal was saved for offline processing as in [Kuschnerov-JLT-2009].
Spectral shaping of an optical signal can be achieved by employing programmable optical filter also known as wave-shaper, which are commercially available and allow user defined transfer function with a frequency resolution of 1GHz. We employed a wave shaper between the two WSS (see Figure 2 in [Rahman-ECOC-2014]) to compensate for the filtering cascade penalties. The transfer function of WS was calculated as reported in [Rahman-ECOC-2014], where we varied the in-band attenuation of this filter as showed in Figure 2-9(right).
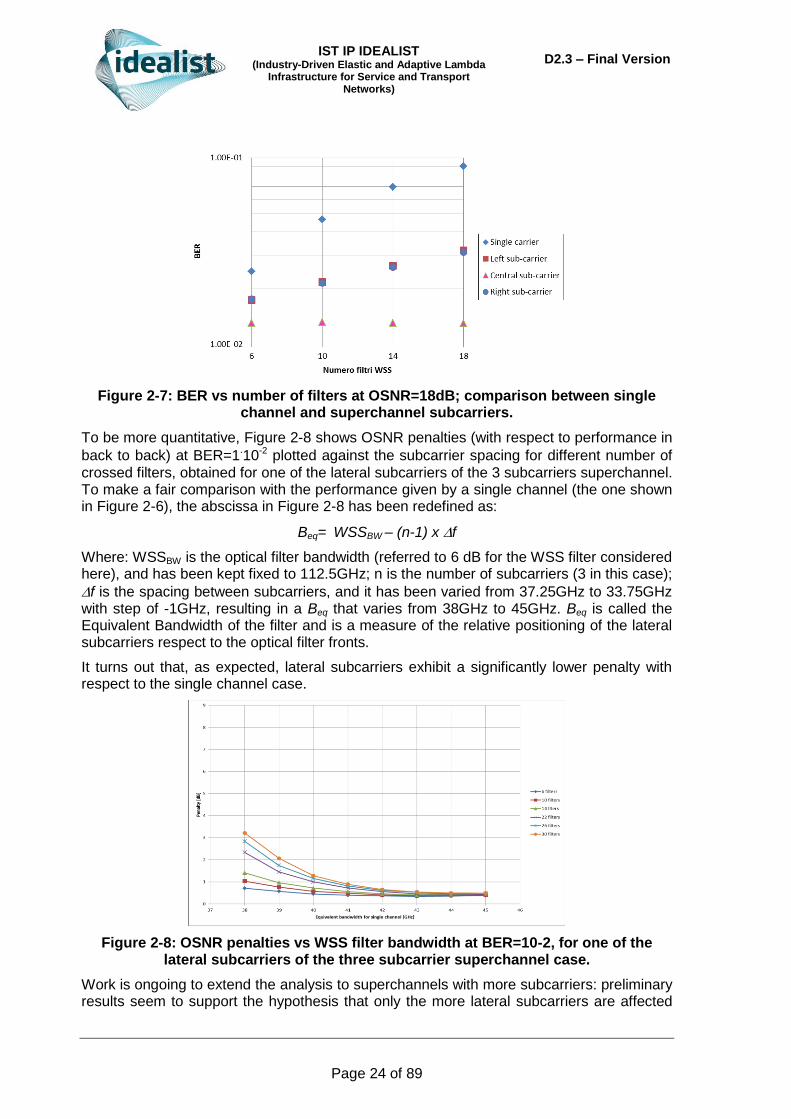
In [Rahman-ECOC-2014] we showed (see Figure 2-10(left)) the improvement in terms of Q² by varying the pass-band attenuation of the WS transfer function for both 32GBd PM-16QAM and PM-8QAM signals, after 4 and 5 filters, respectively. It can be seen that maximum improvement is achieved at a pass-band attenuation of 7dB for both modulation formats. Furthermore, Q² improvement for PM-16QAM is about 1.7dB which is 0.3dB higher than that for PM-8QAM.
IST IP IDEALIST (Industry-Driven Elastic and Adaptive Lambda
Infrastructure for Service and Transport Networks)
D2.3 – Final Version
Page 27 of 89
Figure 2-10: (left) Q² improvement as function of in-band attenuation. (right) Q² as function of the number of crossed WSSs.
Finally, in Figure 2-10(right), we plot the performance of PM-8QAM as a function of increasing number of optical filters, at the optimum passband attenuation of 7dB. A Q² penalty of ~3dB is observed due to channel add/drop signals after five optical filters. In [Rahman-ECOC-2014] we also report that because of the smaller Euclidean distance of 16QAM constellation points, effects of ISI induced by optical filtering are more pronounced on 16QAM than on 8QAM. Last, for both modulation formats considered in [Rahman-ECOC-2014] we observed that improvement in Q² increases with increasing number of cascaded optical filters. Consequently, transmission of 32GBd/s optical signals over a 37.5GHz grid is only feasible by employing optical spectral shaping in every node to mitigate add/drop filtering penalties.
We evaluated worst-case filtering penalties, considering neighboring traffic drop in each node, and showed that, 32GBd/s PM-8QAM/16QAM signals can be transmitted in a 37.5GHz WDM grid, given wave shaper based optical spectral shaping is employed. It is shown that the impact of filtering penalties (and mitigation) is more pronounced for high-order modulation formats. Furthermore, we also demonstrated that the benefit of filter cascade penalty mitigation improves with increasing number of optical filters.
2.1.3 Super-filtering assessment
This section is based on the work published in [paolucci-jocn]. A lightpath with bit-rate br and modulation format mf is considered. The lightpath is routed along path p. Filter bandwidth is configured according to the reserved spectrum resources, with a granularity imposed by the ITU-T flexgrid specifications, i.e., as a number S of slices of width 12.5GHz. Given the non-ideal filter shapes, detrimental filtering cascade effects may be induced on the optical signal. Different values of S can be typically considered for a lightpath according to the number N of traversed filters. In particular, it is typically possible to identify a minimum value Sm when up to Nf filters are safely traversed (i.e., penalty may be introduced but margins are adequate and QoT is guaranteed). On the other hand, when N>Nf, to limit detrimental filtering effects and guarantee adequate QoT, values of S larger than Sm (i.e. SM > Sm) are required.

IST IP IDEALIST (Industry-Driven Elastic and Adaptive Lambda
Infrastructure for Service and Transport Networks)
D2.3 – Final Version
Page 28 of 89
Figure 2-11: Reference network scenario including three lightpaths. (b-d) configuration of all traversed filters. In particular, (b) light path A-W traverses filters
configured with S=Sm (e.g., 25GHz). Lightpath A-W experiences excessive detrimental filtering effects. (c) lightpath A-W traverses filters configured with S=SM
(e.g., 37.5GHz). QoT guaranteed at the expenses of additional reserved spectrum resources. (d) Super-filter technique is applied. A unique filter for all three ligtpaths
is configured on E-P. These nodes do not induce detrimental filtering effects and QoT on lightpath A-W is guaranteed even if it occupies only S=Sm (e.g., 25GHz).
Figure 2-11(a) shows an example of a flexgrid network. Three independent lightpaths, having different source-destination node pairs (i.e., B-V, A-W, C-Z), are considered. The three lightpaths are routed along the path D-Q. In this example, one filter per node is considered, and Nf =4 is assumed to guarantee adequate QoT when Sm=2 slices is considered. Thus, for N larger than Nf=4, SM=3 slices is required.
In the considered example of Figure 2-11(a), signal A-W traverses a number N of filters larger than Nf. Three different scenarios are then evaluated. For each scenario, the filter configuration traversed by each lightpath is shown in Figure 2-11(b-d).
In the first scenario, shown in Figure 2-11(b), lightpaths B-V and C-Z safely traverse filters configured with SM=3 and no detrimental filtering effects are introduced on these two signals. On the other hand, lightpath A-W traverses an excessive number of filters configured with S=Sm (N>Nf). Thus, QoT is not guaranteed for lightpath A-W and the scenario results unfeasible.
In the second scenario, shown in Figure 2-11(c), all lightpaths including A-W traverse filters configured with S=SM. This way, at the expenses of additional allocated spectrum resources, adequate QoT is guaranteed to all lightpaths and the whole scenario results feasible.
In the third scenario, shown in Figure 2-11(d), the proposed super-filter technique is applied. By exploiting the common route of the three lightpaths, the sequence of nodes along E-P is configured with a unique filter bandwidth, which encompasses all three signals (i.e., S=SM + Sm + SM, corresponding in this example to eight slices). With focus on lightpath A-W, end nodes A and W are configured with S=Sm. Also node D (where a common outgoing link is selected among the three lightpaths) and node Q (where the last common link is used), given the considered broadcast and select node architecture, are configured with S=Sm for A-W resources. This way, lightpath A-W traverses four filters configured with S=Sm. However, the other filters along E-P are configured with S=8, a value significantly larger than Sm=2. This way, the constraint of Nf is successfully addressed. Indeed, nodes along E-P do not induce detrimental filtering effects and the scenario exploiting super-filters results feasible without requiring additional spectrum resources for

IST IP IDEALIST (Industry-Driven Elastic and Adaptive Lambda
Infrastructure for Service and Transport Networks)
D2.3 – Final Version
Page 29 of 89
lightpath A-W. Indeed, lightpath A-W occupies only two slices, saving one slice with respect to the previous feasible scenario of Figure 2-11(c).
The proposed super-filter technique consists in a path computation strategy which specifically accounts for the presence of other lightpaths and in particular, for the actual configuration of BV-OXC filters in the network nodes. That is, filter configuration is computed such that different lightpaths (e.g., with different source or destination nodes) can co-exist within the same flat region of a single filter configuration. As a consequence, the technique decouples the filter configurations with respect to head-end lightpath configurations. The technique can be considered an extended application of the filter configuration typically applied to superchannels (i.e, a contiguous set of co-routed optical signals having the same source-destination pair). In this study, common filter configurations are applied also to lightpaths having different source-destination pairs, exploiting their co- routing along links and segments of the flexgrid optical network.
Differently with respect to traditional networking solutions, also in case of tear down, the behavior is modified. If the B-V lightpath is torn-down, the network controller has to account for the presence of the considered A-W connection. Thus, all the B-V spectrum resources will not be completely released. In particular, a slice of 12.5GHz contiguous to A-W resources will be maintained reserved along E-P.
The effectiveness of the proposed super-filter technique in terms of overall network spectrum savings has been assessed through networking simulations in [castro-ecoc], showing promising results particularly when the super-filter technique is combined with an additional technique called differentiated filter configuration [Sambo-JLT].
To further detail the super-filter technique and the aforementioned reference scenarios, a possible transmission system is considered and an analysis of filtering cascade effects is performed through simulations.
The considered optical signal consists of a PM-QPSK signal transmitted at a baud rate of 30GS/s, i.e. corresponding to a gross bit-rate of 120Gb/s. Time-frequency-packing (TFP) transmission technique with low-density parity-check (LDPC) codes and coherent detection are here adopted, as in [Sambo-JLT] and in D2.2.
A code rate of 9/10 is applied, thus obtaining an information rate after decoding of br=108Gb/s. Furthermore, a concatenated outer code with 4% overhead is taken into account, to eliminate the error floor of LDPC codes. The net bit rate is then 103Gb/s. The considered signal is particularly suitable for ITU-T flexgrid optical networks since it can be narrow filtered at the transmitter and propagated occupying only two frequency slices (Sm=2, i.e. 25GHz), achieving error free operations for OSNR as low as 12dB. However, the propagation through a cascade of intermediate nodes including filters with S=2, given their non-ideal filter shape, strongly affects the overall transmission (one filter per BV-OXC is assumed to be traversed).

IST IP IDEALIST (Industry-Driven Elastic and Adaptive Lambda
Infrastructure for Service and Transport Networks)
D2.3 – Final Version
Page 30 of 89
Figure 2-12: OSNR penalty vs. number of traversed nodes for a BER of 10-5.
In the first scenario, described in Figure 2-11(b), a configuration of two spectrum slices of 12.5GHz is applied to the central lightpath A-W, corresponding to a spectrum allocation of 25 GHz, while three slices (S=3, 37.5GHz) are configured for both lightpaths B-V and C-Z (left and right channel). The impact of the cascade of intermediate nodes has been measured in term of OSNR penalty at BER=1x10⁻⁵. For this first scenario, the introduced penalty is shown in Figure 2-12(circles). Results show that around 1.5dB of OSNR penalty per node is experienced for the first three traversed nodes with S=2 (25GHz) while penalty further increases for each subsequent traversed node. A maximum number Nf equal to 6 (with OSNR penalty as high as 12dB) of intermediate filters with S=2 is here admitted. Indeed, larger values of N induce excessive distortions even with acceptable OSNR. To reduce these detrimental penalties and to enable the pass through within a larger number of intermediate nodes, the second scenario described in Figure 2-11(c) is then considered.
In this second scenario, additional spectrum resources are reserved in all traversed nodes, and three spectrum slices of 12.5GHz are reserved also to lightpath A-W. Signal degradation along the filter cascade is reduced with respect to the previous scenario, and simulations show that only 0.5dB penalty is experienced because of the pass through of N=6 BV-OXC with S=3 (37.5GHz) as shown in Figure 2-12(squares). However, this corresponds to a 50% increment of the spectrum reserved to lightpath A-W.
In the third scenario, described in Figure 2-11(d), the proposed super-filter technique is applied. A unique filter configuration of value S=8 (100GHz) among all signals is configured at node E (see Figure 2.12d). Only S=2 is reserved to the central signal. After the detrimental effects introduced by the first two narrow filters, the subsequent cascade of filters is traversed in their flat region, without experiencing significant transmission degradation (Figure 2-12(triangles)). In this case, transmission always remains within the considered Nf threshold.
Finally, work has been done in conjunction with WP3 to identify the proper control plane architecture to control such a node configuration type. In particular, SDN has been identified has the promising control plane architecture, with respect to GMPLS/PCE, for the control of super-filtering. Details can be found in [Sambo-JLT][Paolucci-JOCN].

IST IP IDEALIST (Industry-Driven Elastic and Adaptive Lambda
Infrastructure for Service and Transport Networks)
D2.3 – Final Version
Page 31 of 89
2.2 Architecture on Demand (AoD)
2.2.1 Availability aspects of self-healing optical nodes designed by Architecture on Demand
Hard-wired optical node architectures can be characterized by a low level of architectural flexibility and scalability [Amaya-JOCN13]. These characteristics imply lower availability and survivability due to the fact that all lightpaths (or arbitrary paths) passing the hard-wired nodes traverse the same set of component types, even though they are not needed for a specific function. As a consequence, unnecessary component usage can inherently degrade path availability. In the case of a path breakdown caused by a node component failure, unless the nodes incorporate a high degree of redundancy, the only possible recovery action includes path rerouting at the network level, requiring a number of protocol steps and consuming switchover time in range of seconds.
By introducing the Architecture on Demand (AoD) paradigm in the design, optical node functionalities can be dynamically adapted according to different traffic patterns, switching and processing requirements [Amaya-ICTON11][IDEALIST-D2.2]. AoD can be implemented by using additional switching elements (e.g. mirrors in 3D MEMS or collimator arrays in piezo electric switch) that interconnect optical components necessary for implementation of specific functions or for achieving different switching granularities, from fibre to sub-wavelength switching.
By using internal rerouting in AoD nodes, self-healing can be achieved after node component failures. Self-healing is based on the possibility to switch over the connections, affected by failures, to the node redundancy that can be i) deliberately added for survivability purposes, or ii) created by releasing all unused components. In the second scenario, if no extra components dedicated for survivability are present in the node, there are, at least, two ways of creating node redundancy: 1) By decreasing traffic load in a node, the need for using of deployed components decreases. Surplus components are treated as redundant. 2) By grouping of wavelength or waveband paths into fibre-switched paths, if possible. Unnecessary node components are set free and they are treated as redundant.
All redundant components can be used on-the-fly for self-healing, providing backup resources for the paths on the optical node level and eliminating the necessity of path rerouting on the network level. Note, switchover time at node level can be estimated to 10ms range (when 3D MEMS is applied), yielding faster path recovery compared to switchover time at network level. A lower number of components traversed by a path, as well as the usage of backup connections inside a node, increase the path and overall network availability.
2.2.1.1 Availability of self-healing optical nodes
In order to compare availability performance of optical networks implemented by hard-wired nodes (HWnet) and networks, which consist of AoD self-healing optical nodes (AoDnet), a set of assumptions is defined and described in [Mikac-ICTON14].
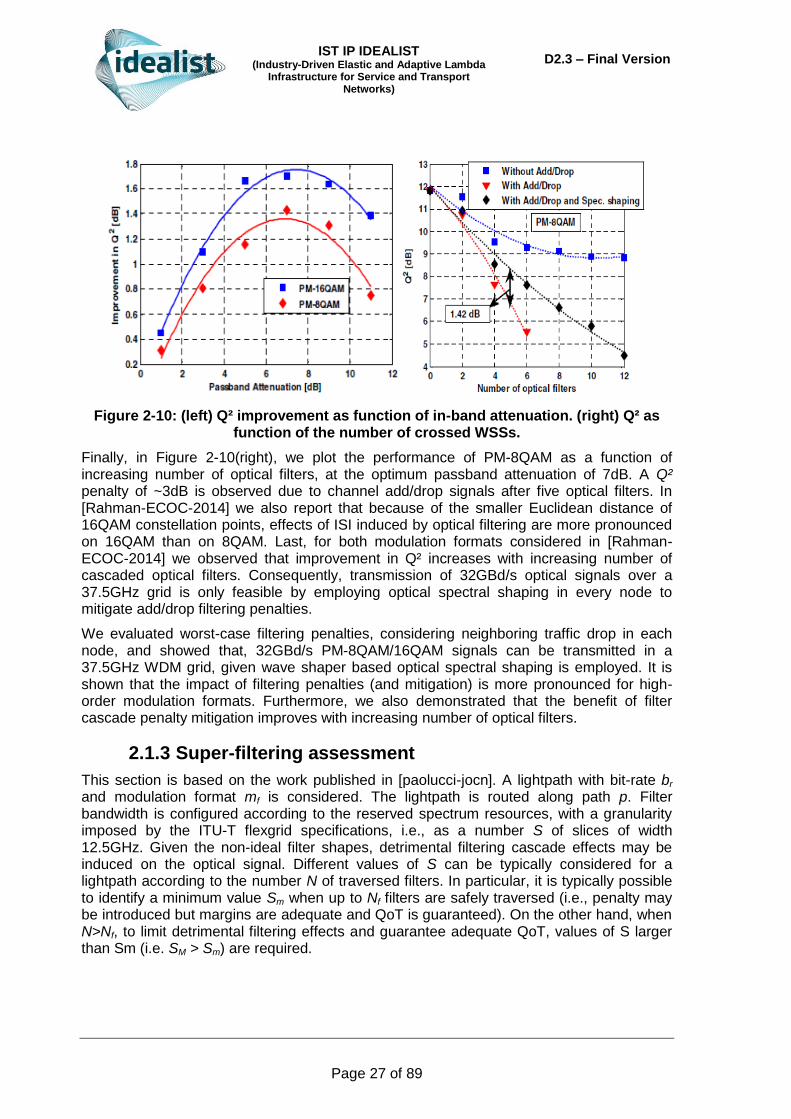
Figure 2-13 shows the AoD nodes deploying additional switching elements in order to interconnect Splitters (SPLs) and WSSs, and to enable self-healing after failures. The additional switching elements are assumed to be mirrors of 3D MEMS.
IST IP IDEALIST (Industry-Driven Elastic and Adaptive Lambda
Infrastructure for Service and Transport Networks)
D2.3 – Final Version
Page 32 of 89
Figure 2-13: Self-healing procedure in an example network with AoD nodes.
Additional mirrors along each path bring higher path failure rate and lower path availability. An assumption is that the total number of SPLs, as well as WSSs, in a node is equal to node degree. All unused node components, treated as idle, are placed in the spare bank of components. The number of idle components is equal to the difference between their total number and the number of used components (SPLs and WSSs). The number of components depends on the traffic load in the node, i.e., increased traffic decreases the number of idle components.
In order to increase the number of idle components in the spare bank, a search is applied over all paths, in order to find if they fulfill the requirement to be fibre-switched, i.e. all paths from a single input fibre have to be cross-connected to the same output fibre, traversing only the switching matrix (e.g. one pair of mirrors in 3D MEMS). Each fibre-switched cross-connection found within an optical node sets a pair of SPL and WSS to idle state. Idle components are placed in the spare bank and they can be used further on as redundant, aiming to replace any future faulty component in the node. The sequence of components along a path which does not undergo Fiber Switching (FS), cross-connecting an input (IN_F) and an output fibre (OUT_F), is as follows: IN_F // SPL // WSS // OUT_F (symbol / replaces a mirror). If FS is applied, the number of components on each path is reduced (IN_F // OUT_F) and a SPL-WSS pair is rendered redundant. The achieved redundancy enhances the availability of all cross-connected paths in the node. On the other hand, any reduction of the number of components along a fibre-switched single path improves related end-to-end availability.
Three availability measures are evaluated in order to compare HWnet and AoDnet:
1) s,t-availability As,t is the minimal value of all i,j-availabilities (Ai,j) among all node pairs, where Ai,j is equal to the probability that at least one path between nodes i and j is in working state. As,t is a non-linear measure reflecting the availability of the worst end-to-end connection in a network. If any requirement related to the minimal end-to-end connection availability denoted as Ai,j(min) exists, then As,t should not be lower than Ai,j(min): As,t ≥ Ai,j(min).
2) av-availability (Aav) is the average value of all end-to-end connection availabilities Ai,j among all node pairs. Aav is a linear measure reflecting the availability level of all end-to-end connections in a network.

IST IP IDEALIST (Industry-Driven Elastic and Adaptive Lambda
Infrastructure for Service and Transport Networks)
D2.3 – Final Version
Page 33 of 89
3) g-availability (Ag) is the probability that all end-to-end connections are in working state. The measure we used instead of Ag is Mean Down Time (MDTg), denoted as the number of minutes per year when at least one end-to-end connection is broken due to concurrent failures of the working and the backup path: MDTg=(1−Ag)×525,600 minutes/year.
2.2.1.2 Availability evaluation
Based on the assumptions from Section 2.2.1.1 the following steps lead to availability figures for HWnet and AoDnet:
1) Using Fixed Shortest Path (FSP) algorithm, two paths are found for each source and destination node pair of connection requests: 1st SP as the working path and independent 2nd SP as the backup path.
2) In AoDnet all paths which fulfill the requirements for fibre switching are found at each node.
3) If FS exists in an AoD node, one SPL and one WSS are released and placed in the node spare bank.
4) Monte Carlo failure simulation is executed, based on component failure rates λ and repair rates μ, assuming that time to failure and time to repair have exponential probability density functions. Each simulation run is accomplished for different total traffic loads. In the simulation, when an AoD node component fails, the node spare bank is checked if there exists any idle component identical to the failed type. If an idle component exists, it is used as a backup for all paths traversing the failed component, and the number of idle components in the spare bank is decreased by one. If there is no idle component in the spare bank, the recovery procedure is switched to the network level, using 1+1 protection. The time period in which an end-to-end connection is up is recorded as Time To Failure (TTF). In opposite, when a repair of a failed node component occurs, the paths are restored back to those which use the previously repaired component, releasing the redundant component at the node level and incrementing the number of idle components in the spare bank by one. If recovery was done on the network level, transmission is switched from the backup path back to the working path. If both the working and the backup paths fail at the same time, the breakdown of end-to-end connection occurs. The time period when the end-to-end connection was down is recorded as time to repair (TTR).
5) i,j-availabilities (Ai,j) are calculated from MTTF/(MTTF+MTTR) where MTTF is the mean of all TTFs and MTTR is the mean of all TTRs. Consequently s,t-availability (As,t) and av-availability (Aav) are calculated from all Ai,j. MDTg is calculated from Ag.
The av-availability, s,t-availability and MDTg are calculated using the procedure (steps 1 to 5) on the German topology, deploying i) HW and ii) AoD nodes as shown in Figure 2-14 a), b), and c). At low traffic loads, logical topologies are not fully connected, i.e. connections are not established between all pairs of nodes. Therefore, AoDnet shows higher values for all availability measures because some components are idle and they can be used as redundant for recovery when active components fail. For higher traffic loads (no. of lightpaths ≥ 144), logical topology becomes fully connected and all deployed components in AoD nodes have to be used. If there is no FS, then there are no idle components and self-healing is not possible. Paths in AoDnet traverse more components compared to the HWnet architecture because of additional mirrors in 3D MEMS switch. As a consequence, availability figures for AoDnet degrade, compared to the HWnet architecture.

IST IP IDEALIST (Industry-Driven Elastic and Adaptive Lambda
Infrastructure for Service and Transport Networks)
D2.3 – Final Version
Page 34 of 89
Figure 2-14: Availability figures and statistics when comparing HWnet and AoDnet with FSP routing Algorithm.
Figure 2-14d) shows the number of idle components in AoDnet under different traffic loads. The results are in line with the availability performance analysed before. Under lower traffic loads, the number of redundant components is high and the self-healing capability of nodes is significant. For higher loads, there are no idle components in the network, causing a drop of the availability performance.
Figure 2-14e) shows the number of node failures, which cannot be restored neither by self-healing in the node nor by 1+1 protection at network level. The benefits of using AoD diminish as the traffic load increases.
2.2.2 Efficient optical amplification in self-healing synthetic ROADMs
In general, approaches for increasing network availability and reducing service disruption, along with the associated data and revenue losses include (i) providing redundancy in the network to be used for failure recovery, and (ii) reducing the number of failure-prone components used by each connection, thus lowering the associated risk of failure. Failure recovery typically takes place at the network level by rerouting connections to disjoint paths

IST IP IDEALIST (Industry-Driven Elastic and Adaptive Lambda
Infrastructure for Service and Transport Networks)
D2.3 – Final Version
Page 35 of 89
when components at links or nodes included in the working paths of connections fail. Redundant path can be precomputed and reserved at connection setup time (protection), or upon a failure (restoration).
Improvement of network availability via node-level recovery, i.e. self-healing inside nodes, as well as through reduction of the number of failure-prone components used by each connection, are novel functionalities enabled by synthetic reconfigurable add-drop multiplexers (ROADMs) implemented by AoD. Interconnections between optical components in AoD nodes, e.g., optical splitters, WSSs, (de)multiplexers or amplifiers, are realized in a highly flexible and reconfigurable manner via an optical backplane (e.g. high-port count 3-dimensional micro-electro-mechanical switch (3D MEMS) or Piezoelectric Optical Switch (POS)), thus providing the network with an unparalleled adaptability to traffic diversity and variations.
In this deliverable D2.3, the aim is to further improve network availability and energy efficiency by minimizing the number of optical amplifiers used in AoD nodes. In particular, we focus on erbium-doped fiber amplifiers (EDFAs), which are the most commonly used amplifiers in optical networks and have been identified as significant contributors to the total network power consumption [Manousakis-JOCN13]. In addition to the reduction of energy consumption, the aim is to improve the connection availability by allowing bypassing unnecessary optical amplifiers inside AoD nodes. At each node, a decision on amplifier usage is made based on the signal power. Unused amplifiers are put into sleep mode, thus reducing power consumption. Bypassing unnecessary amplifiers reduces the related risk of connection failures, while reuse of idle amplifiers for recovery from failures of working amplifiers further increases network availability.
The schematic view of synthetic optical node implemented by AoD is shown in Figure 2-15(a).
Figure 2-15: (a) Synthetic optical node implemented by architecture on demand. (b) Hard-wired WSS-based ROADM.
As a comparison, Figure 2-15(b) shows a hard-wired ROADM based on bandwidth-variable WSSs in broadcast and select configuration. Unlike in hard-wired ROADMs, the architecture of an AoD node can be changed arbitrarily.
As can be seen in Figure 2-15(a), each connection traverses just those components within the AoD node that are required for fulfilling the switching and processing requirements. In addition, different WDM signals from the lower three input ports target different output ports, so they must traverse splitters and WSS to be switched to the desired output. On the other hand, all signals from the uppermost input port are directed to the uppermost output port. The input and the output port can, thus, be directly connected via the optical

IST IP IDEALIST (Industry-Driven Elastic and Adaptive Lambda
Infrastructure for Service and Transport Networks)
D2.3 – Final Version
Page 36 of 89
backplane, bypassing any other components within the node. This type of switching is called fiber switching and has been shown to greatly benefit connection availability and energy efficiency [Džanko-ECOC13], [Garrich-ONDM12].
2.2.3 Synthetic optical nodes implemented by AoD
The performances of two possible implementations of the optical backplane are described in this subsection. One implementation is based on a 3D MEMS optical switch and the other is based on the piezoelectric switch.
Considering these high-port counts, flexible switches, efficient optical amplification in AoD-based nodes is possible. In order to compensate for the attenuation of optical signals on their paths, optical amplifiers have to be placed along links and inside nodes. The most commonly used optical amplifier is erbium doped fiber amplifier (EDFA). Based on their function and placement, the amplifiers can be categorized in three groups, i.e. line amplifiers, pre-amplifiers and boosters, as shown in Figure 2-16.
Figure 2-16: Amplifier functions in networks deploying hard-wired ROADMs.
Line amplifiers are placed along optical fibres, typically 80-100km apart, and primarily compensate for the losses due to fiber attenuation. Pre-amplifiers are located at the ingress of optical nodes to ensure that the power level of the incoming signal is sufficiently high to be detected by the receiver and other optical components within the node. Booster amplifiers are typically placed at the egress side of the node to compensate for the insertion loss of the node components and guarantee sufficient power level of the signals launched into the output fiber.
Due to the cost of optical amplifiers, it is beneficial to place them in strategic locations in the network so as to minimize the total number of necessary amplifiers while ensuring adequate amplification of all signals. This problem is referred to as the optical amplifier placement problem, whose recent studies can be found in [Hamad-JOCN09], [Fortune-JOCN09]. Regardless of the optimality of amplifier locations, in networks with hard-wired optical nodes, all connections unavoidably traverse all of the amplifiers deployed along the path. However, depending on the fiber and node losses, it might not always be necessary for each connection to use each EDFA along its path. In some cases, signal power level might be sufficiently high to allow for bypassing one or more EDFAs along the path, and synthetic optical nodes implemented by AoD support this functionality. It can be particularly beneficial for connections which undergo switching at the fiber level, thus bypassing all components generating losses within the node.

IST IP IDEALIST (Industry-Driven Elastic and Adaptive Lambda
Infrastructure for Service and Transport Networks)
D2.3 – Final Version
Page 37 of 89
In this deliverable D2.3, we aim at improving connection availability by minimizing the number of EDFAs which are traversed by each connection in AoD nodes and whose failures can, consequently, cause the corresponding connections to fail. Unlike in the amplifier placement problem, (suboptimal) locations of all EDFAs are given and we attempt to minimize their usage while satisfying power level requirements of each connection.
The principle of our proposed approach is illustrated in Figure 2-17 using a simple example with five connections. In Figure 2-17(a), the optical backplane is implemented by 3D MEMS, and in Figure 2-17(b) by a piezoelectric optical switch. Connections are denoted as λij, where index i denotes the wavelength of the signal and j is the index of the input port. Line amplifiers are denoted as LA 1 to LA 6, SP 1 and 2 denote splitters, while PA 1 and 2, and BA 1 and 2 denote pre-amplifiers and booster amplifiers within the node, respectively.
To achieve efficient amplification, at every node a decision on signal amplification is made based on the signal power level. In case when the insertion loss of the node is low, the amplification received at the last line amplifier before that node can be sufficient for the signal to reach the first line amplifier after that node without breaching the minimal power level threshold. This is typically the case when the signal undergoes fiber switching, and thus bypasses components responsible for the high insertion loss in the node, i.e. splitters and WSSs. In such scenario, the only loss within the node arises due to the single traversal of the optical switching back-plane. Note that, as optical backplane interconnects any two components or input/output ports of the ROADM, a connection which uses M components in the node traverses the optical backplane M+1 times, adding up to the total loss.
For the sake of simplicity in the example and throughout this work, we assume that all amplifiers have the same characteristics and work in constant power mode, setting output power of all signals to 0dBm. We assume that sensitivity level of all components is -24dBm. The distances between the node and the line amplifiers in the example are D1 = 25km, D2 = 80km, while fiber attenuation equals 0.2dB/km. In the example, we use 1:4 splitters with 6dB attenuation. We assume insertion loss of 3D MEMS (denoted as LMEMS), piezoelectric switch (LPOS) and WSS to be 3dB, 1dB, and 6dB, respectively.
Figure 2-17(a) shows the architecture of an AoD node with 3D MEMS optical backplane. As can be seen in the figure, connection λ1
1 undergoes fiber switching at the node. Its losses within the node comprise only a single traversal of the optical backplane (3dB). Insertion loss of the spans D1 and D2 equal 5dB + 16dB = 21dB. If the output power of LA 1 equals 0dBm, then the total loss of λ1
1 on the fibers and inside the node reduces the power level to -24dBm at the input of LA 4, which is equal to the amplifier sensitivity threshold. Therefore, signal λ1
1 can traverse the span between the two line amplifiers without additional amplification at the node.
The rest of the signals in the example, i.e. λ12, λ2
2, λ23, and λ3
3 have different switching requirements from λ1
1 so they must traverse splitters and WSSs, whose insertion losses sum up to 12dB. These components are interconnected by three MEMS cross-connections, yielding additional 9dB loss.

IST IP IDEALIST (Industry-Driven Elastic and Adaptive Lambda
Infrastructure for Service and Transport Networks)
D2.3 – Final Version
Page 38 of 89
Figure 2-17: Efficient amplification inside an AoD node with (a) 3D MEMS and (b) piezoelectric switch as optical backplane.
Combined with the losses along the two fiber spans of length D2, the total loss renders it necessary for all four connections to use amplification inside the node. Note that, in this case, both pre-amplifiers and boosters must be used in order to keep the signal power above the sensitivity threshold of WSS and EDFA. If, for example, preamplifier PA 1 was not used, the power of signals λ1
2 and λ22 at the input of WSS 1 would fall below the
threshold:
P(WSS1),in = P(LA2),out – D2•-LMEMS-LSP1-LMEMS
=0dBm-16dB-3dB-6dB-3dB=-28dBm
Figure 2-17(b) shows the same example using an AoD node with piezoelectric switch implementation of the optical backplane. For λ1
1, power at the input of LA 4 equals -22dBm. As POS has lower loss than MEMS, pre-amplifiers PA 1 and PA 2 are not needed since the power of the four signals at the inputs of WSS 1 and WSS 2 does not fall below the threshold:
P(WSS1),in = P(LA2),out – D2•-LPOS-LSP1-LPOS
=0dBm-16dB-1dB-6dB-1dB=-24dBm
The second design is, thus, capable of saving two EDFAs. The power consumption of such solution is lower, while idle EDFAs can be used as redundancy to support self-healing capabilities of the node and improve connection availability.
2.2.4 Numerical results
Using the simulation setup and the event-driven simulator described in [Furdek-ONDM14], we simulated the proposed approach in two reference networks deploying (i) AoD ROADMs with MEMS-based optical backplane, (ii) AoD ROADMs with piezoelectric switch as optical backplane and (iii) hard-wired ROADMs. The performance of the networks was evaluated by using EFS routing algorithm at different percentages of fiber switching, ranging from 0 to 30% in 10% increments, and compared to shortest path (SP) routing.

IST IP IDEALIST (Industry-Driven Elastic and Adaptive Lambda
Infrastructure for Service and Transport Networks)
D2.3 – Final Version
Page 39 of 89
Figure 2-18 and Figure 2-19 show the obtained network mean down time, number of used EDFAs and WSSs, and power consumption.
Figure 2-18: Mean down time in the 28-node EON network (a) and 14-node NSF (b) deploying AoD ROADMs with different optical backplane implementations and hard-
wired ROADMs for the two lightpath routing strategies.
Figure 2-19: (a) The number of used WSSs/splitters, (b) the number of used EDFAs and (c) total power consumption in the 28-node EON network deploying hard-wired
and AoD ROADMs with different optical backplane implementations and the two lightpath routing strategies.
Figure 2-18 (a) and (b) show the MDT obtained by all three approaches in the NSF and EON network, respectively. As can be seen in the graphs, networks deploying any of the two implementations of AoD nodes have lower MDT than those deploying conventional hard-wired ROADMs even when shortest path routing is used (denoted as FS 0%) and no attempt is made to increase the percentage of fiber switching. At 0% FS, MDT in the EON and NSF network using AoD nodes with piezoelectric switch as optical backplane is 55.5% and 45.1% lower than for hard-wired ROADMs, respectively. For AoD nodes with MEMS optical backplane this difference equals 16.8% and 5.1%, respectively. The MDT of each AoD implementation further decreases for higher percentages of FS. Results for 10% and
a)
b) c)

IST IP IDEALIST (Industry-Driven Elastic and Adaptive Lambda
Infrastructure for Service and Transport Networks)
D2.3 – Final Version
Page 40 of 89
20% FS are omitted for greater clarity. At 30% FS, MDT of the EON network with AoD based on POS and MEMS switch is 62.1% and 31% lower than with hard-wired ROADMs, respectively. In the NSF network, this difference equals 64.7% and 48.7%, respectively.
The main reason for superior availability performance of AoD nodes lies in the fact that AoD can, combined with careful routing, reduce the number of used components in the nodes. Due to AoD flexibility, such idle components can then be treated as redundancy and used for self-healing of intra-nodal failures. The total number of WSSs and splitters used in the EON network at 30% FS is shown in Figure 2-19(a). Results for the NSF network exhibit similar trend and are omitted for lack of space. Due to the ability to bypass unneeded components via fiber switching, deployment of AoD requires on average 11.6% less WSSs and splitters than when using hard-wired ROADMs. For smaller percentages of FS, networks deploying AoD nodes use equal or lower number of components than hard-wired ROADMs.
The advantages of AoD in reducing the number of used components are even clearer considering the total number of used EDFAs, as shown in Figure 2-19(b) for 30% FS. Due to lower insertion loss of piezoelectric switches compared to MEMS, AoD nodes with POS-based optical backplane bring even greater reduction of EDFA usage. The EON and NSF network deploying POS-based AoD ROADMs use on average 35% and 45.7% less EDFAs than with hard-wired ROADMs, re-spectively. For MEMS-based AoD ROADMs this reduction equals 13.1% in EON and 23.6% in the NSF network.
Figure 2-19(c) shows the total power consumption of the three node deployment scenarios in three representative test cases of the EON network corresponding to low, medium and high traffic load. In each case, we make a distinction between the power consumption contributions of the optical backplane, WSSs and EDFAs. In all test scenarios, AoD nodes with POS-based optical backplane and 30% FS achieve the lowest power consumption due to the greatest reduction in the total component usage. They consume 11.6% less total power than the hard-wired ROADM solution. On average over all test cases of both networks, POS-based AoD ROADMs reduce the MDT and EDFA power consumption by 63% and 38%, respectively, making it a very promising technology.
2.2.5 Experimental demonstration of backplane architectures for AoD-based optical nodes
To support heterogeneous traffic requests that may require different types of optical processing (e.g. space/frequency/time switching) there is a need of an optical backplane with a high port count. However, available commercial optical switches range from 192 to 320 ports, thus limiting the number of available cross-connections for the specific architecture instances and the number of pluggable modules. Therefore, several optical backplane switches must be interconnected together to overcome this limitation. In this deliverable D2.3, our contributions to overcome this limitation are twofold: i) the proposal of two backplane architectures and their scalability analysis in terms of number of available cross-connections to synthesize architectures and ii) a small-scale experimental validation of both proposals.
2.2.6 Backplane architectures
In this deliverable, we present and compare two architectures for the composition of a large optical AoD-based Network Function Programmable (NFP) nodes with enhanced modularity (allow from pay as you grow backplane model) and high availability. Let k be the number of ports for each optical switch (e.g., k = 192 for the Polatis or k = 320 for the

IST IP IDEALIST (Industry-Driven Elastic and Adaptive Lambda
Infrastructure for Service and Transport Networks)
D2.3 – Final Version
Page 41 of 89
Calient optical switches). We denote as inlet and outlet the two fiber terminations of each port of the switch devoted to transmit and receive optical signals.
Figure 2-20: Backplane architectures for AoD-based NFP nodes a) Unidirectional, b) Expandable.
Figure 2-20(a) presents the unidirectional backplane architecture, where U optical switches with k ports are connected in a unidirectional fashion. More precisely, the N input ports of the NFP node are connected to N inlets of the first switch. Then, N outlets of the first switch are connected to N inlets of the second switch. This process is repeated until N outlets of the switch U–1 are connected to N inlets of the switch U. Finally, N outlets of the switch U are associated to the N output ports of the NFP node. By construction, optical signals are constrained to pass through all the optical switches. This backplane architecture offers a number of available cross-connections:
XU=U•k-N•(U-1)
where the second term of the subtraction evaluates the number of ports dedicated to the interconnection between switches. Therefore, the subtracted ports are not available for the modules to be connected neither for the synthesis of architectures.
Figure 2-20(b) shows the expandable backplane architecture, where E optical switches of k ports are bidirectionally connected. More precisely, the N input and output ports are connected to the first optical switch. In addition, N outlets of the first switch are connected to N inlets of the second switch and N outlets of the second switch are connected to N inlets of the first switch. This process is repeated until N outlets of the switch E–1 are connected to N inlets of switch E and N outlets of the switch E are connected to N inlets of the switch E–1. This backplane architecture offers a number of available cross-connections:
XE=E•k-2N•(E-1)
2.2.7 Backplane architectural trade-offs
We consider as a reference a commercially available 320-port 3D-MEMS switch with a power consumption of 50W. Figure 2-21 shows an example of the power consumption of
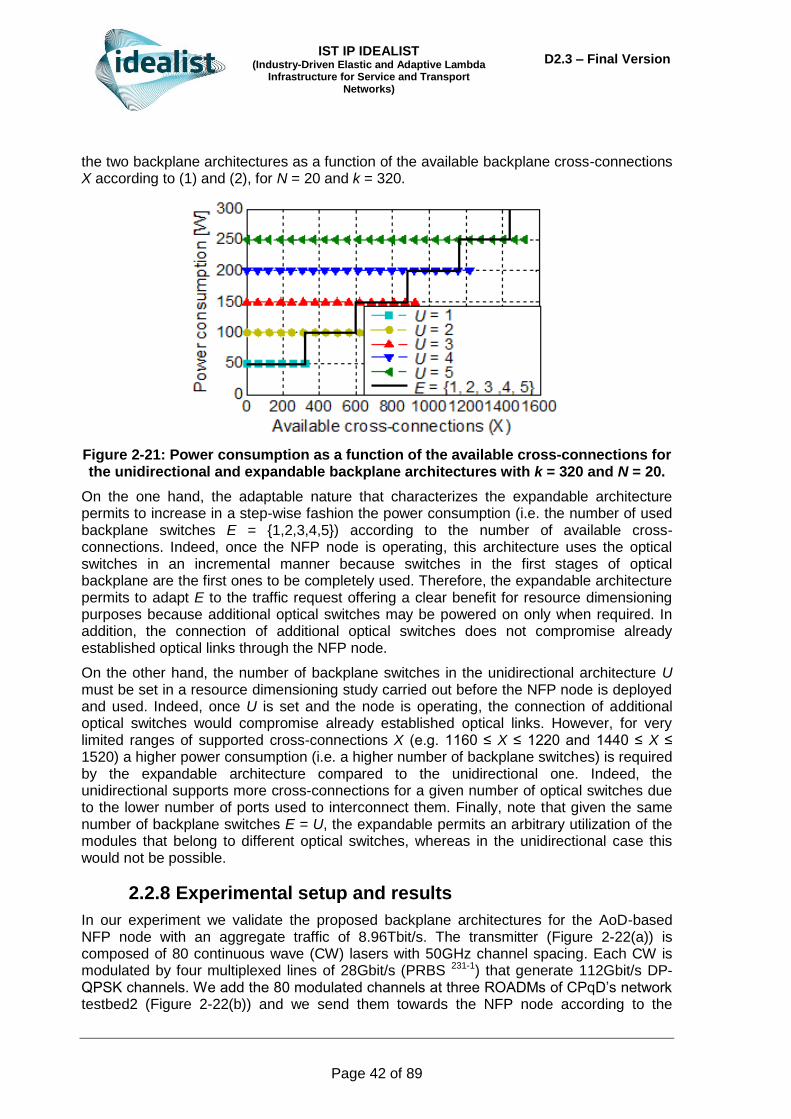
IST IP IDEALIST (Industry-Driven Elastic and Adaptive Lambda
Infrastructure for Service and Transport Networks)
D2.3 – Final Version
Page 42 of 89
the two backplane architectures as a function of the available backplane cross-connections X according to (1) and (2), for N = 20 and k = 320.
Figure 2-21: Power consumption as a function of the available cross-connections for the unidirectional and expandable backplane architectures with k = 320 and N = 20.
On the one hand, the adaptable nature that characterizes the expandable architecture permits to increase in a step-wise fashion the power consumption (i.e. the number of used backplane switches E = {1,2,3,4,5}) according to the number of available cross-connections. Indeed, once the NFP node is operating, this architecture uses the optical switches in an incremental manner because switches in the first stages of optical backplane are the first ones to be completely used. Therefore, the expandable architecture permits to adapt E to the traffic request offering a clear benefit for resource dimensioning purposes because additional optical switches may be powered on only when required. In addition, the connection of additional optical switches does not compromise already established optical links through the NFP node.
On the other hand, the number of backplane switches in the unidirectional architecture U must be set in a resource dimensioning study carried out before the NFP node is deployed and used. Indeed, once U is set and the node is operating, the connection of additional optical switches would compromise already established optical links. However, for very limited ranges of supported cross-connections X (e.g. 1160 ≤ X ≤ 1220 and 1440 ≤ X ≤ 1520) a higher power consumption (i.e. a higher number of backplane switches) is required by the expandable architecture compared to the unidirectional one. Indeed, the unidirectional supports more cross-connections for a given number of optical switches due to the lower number of ports used to interconnect them. Finally, note that given the same number of backplane switches E = U, the expandable permits an arbitrary utilization of the modules that belong to different optical switches, whereas in the unidirectional case this would not be possible.
2.2.8 Experimental setup and results
In our experiment we validate the proposed backplane architectures for the AoD-based NFP node with an aggregate traffic of 8.96Tbit/s. The transmitter (Figure 2-22(a)) is composed of 80 continuous wave (CW) lasers with 50GHz channel spacing. Each CW is modulated by four multiplexed lines of 28Gbit/s (PRBS 231-1) that generate 112Gbit/s DP-QPSK channels. We add the 80 modulated channels at three ROADMs of CPqD’s network testbed2 (Figure 2-22(b)) and we send them towards the NFP node according to the

IST IP IDEALIST (Industry-Driven Elastic and Adaptive Lambda
Infrastructure for Service and Transport Networks)
D2.3 – Final Version
Page 43 of 89
considered scenarios. The SDN controller sets the network parameters via NETCONF. At the receiver (Figure 2-22(c)), the polarizations of each dropped 112Gbit/s channel are fed to 40Gsample/s real time scope and digital signal processing algorithms are used offline. We consider two scenarios shown in Figure 2-22(d) in which the spectra is divided in aggregates of channels Λ1= {1529.62, ..., 1541}, Λ2 = {1541.38, ..., 1548.94} and Λ3 = {1549.38, ..., 1561.04} (central wavelengths in nm). Scenario A presents a single aggregate of channels at each input. Conversely, scenario B considers channel aggregates of A plus loopback traffic so as to synthesize a node with more optical functionalities. The NFP node is implemented with two 8×8 Planar Lightwave Circuits (PLCs with 5dB of loss per cross-connection) that interconnect inputs, outputs and composed modules. The unidirectional and expandable architectures (Figure 2-22(e) and Figure 2-22(f)) show the required cross-connections for scenarios A and B respectively.
Figure 2-22: (a) Transmitter, (b) metro network and (c) receiver setups for the validation of the NFP in (d) two scenarios using (e) the unidirectional and (f) the
expandable backplane architectures. (g) Summary of results and (h) spectra at input 1 and outputs 1 and 3 for the unidirectional and expandable architectures
respectively in scenario B.
Figure 2-22(g) shows our obtained results in terms of optical signal-to-noise ratio (OSNR) and optical loss. The unidirectional architecture presents high OSNR at the output ports and lower loss compared with the expandable architecture in scenario B. Indeed, for switching cases with high number of cross-connections, the unidirectional architecture is convenient due to the reduced connectivity between backplane optical switches. However, a clear benefit is observed for the expandable architecture against the unidirectional one in scenario A. In particular, when all channels of a given input are switched to the same output fewer cross-connections, modules and backplane switches are required. Indeed, only the first optical switch is used in the expandable for scenario A reducing losses and OSNR degradation.

IST IP IDEALIST (Industry-Driven Elastic and Adaptive Lambda
Infrastructure for Service and Transport Networks)
D2.3 – Final Version
Page 44 of 89
2.3 The Switchless Elastic Rate Node (SERANO) architecture
SERANO as described in [IDEALIST-D2.1] efficiently supports Flex-OXC nodes and EON operations exploiting bit rate variable transponders and their sliceable variants (S-BVTs) as a central part of a demux/mux system that allows all superchannels to be fully regenerated and remodulated prior to onward transmission. Optical bypass is still possible, but SERANO allows for full flexibility when needed. Following the multi-granular switching design approach in the context of flexgrid and elastic rate networks it is assumed that a fraction of the traffic passing through the Flex-OXC node is added/dropped by/towards the SERANO block by means of N I/O ports/fibers as illustrated in Figure 2-23.
Figure 2-23: Overview of the SERANO architecture with simplified S-BVT modules
embedded.
Each input fiber is terminated in what we call an “optical blade” which is shown in greater detail in the inset of Figure 2-23. The first stage in each blade is an optical splitter creating multiple copies of the input signal at all coupler’s outputs. Each output is directly interfaced to a WDM card. A WDM card consists of an 1:M optical splitter (possibly in the form of zero-loss couplers), followed by an array of Sliceable BVTs (S-BVTs). Such an S-BVT consists of a multiflow optical module integrating a fixed-receiver tunable-multiflow transmitter pair connected back-to-back whilst a buffer is also provisioned for synchronization purposes. Therefore, the functionality of this block is to terminate the entire group of flows dropped from the Flex-OXC, where the selection of the desired channel is made by properly tuning the local oscillator in xPSK/xQAM schemes. Thus the block is providing for full 3R regeneration, possibly at a different central carrier frequency, only for selected flows (media-channels with specific number of spectral slots and/or modulation format) i.e. only those desired to be directed to the specific output fiber associated to the specific WDM card.
The WDM card also has a coupler, possibly amplified, that operates as a combiner with M input ports, M being the upper number of flows a particular input fiber may forward to a particular output fiber. In the final stage of SERANO, the outputs of each WDM card are passively recombined by means of a second, possibly amplified, optical N:1 combiner.
BVT
SERANO Node
…
N:1 combiner
Optical Blade
Optical Blade…
…
…
I1
IN
O1
ON
Optical Blade
Op
tica
l sp
litte
r 1
:N
…
WDM card
S-BVT
Optical DEMUX
BVTBVT
BVT
…
Optical combiner
WDM card
S-BVT
Optical DEMUX
BVTBVT
BVT
…
Optical combiner
N:1 combiner
N:1 combiner
Control plane i/f
BV RxBV
tuneableTx
Digital memory
Physical control

IST IP IDEALIST (Industry-Driven Elastic and Adaptive Lambda
Infrastructure for Service and Transport Networks)
D2.3 – Final Version
Page 45 of 89
The aforementioned SERANO architecture is flow and link modular, since only the couplers need to be provisioned, and the building blocks (blades and WDM cards) can be added progressively, as traffic increases, following a pay-as-you-grow principle. Thus, all the requirements for flexibility, scalability, resilience and adaptability set forth in the previous section can be met. Conclusively, the SERANO module operates as a flow-forwarding engine in a service transparent/protocol agnostic manner, with 3R regeneration and on-the-fly adaptation functions obviating the use of large electronic switches. The functions provided by a SERANO module are: change of central carrier’s frequency, spectral slot occupancy and modulation format modification, tailoring line-rate to the length of the subsequent transparent optical section. In addition, it can guarantee multivendor interoperability, since the embedded multiflow optical receivers and transmitters can be purchased from different vendors.
As described in [IDEALIST-D1.3] an important optimization parameter for SERANO is the number of BVTs that are required for an efficient operation. Towards this target we need to investigate the operational conditions under which the Flex-OXC operates. Flex-grid networks usually set up paths between two end points to serve specific traffic flow demands e.g. implementing the Path Computation Element (PCE). In practical implementations these connections are pre-provisioned together with their protection paths [Sambo-JLT11]. A key observation in this case is that a given input fiber may forward flows only to a sub-set of output fibers. Therefore, a data plane architecture of the flow-forwarding engine may take advantage of this characteristic to attain savings in the required building blocks. In general, the total required number of BVTs to construct the SERANO block is:
2NN
MaST
(1)
where M is the maximum number of supported flows per input fiber, whilst α is a resource over-provisioning factor with values in the interval [0,N] and it is a design parameter. If a = N then the entire flow group of any input port can be forwarded to any output and the total number of BVTs is equal to M×N2, which represents a full scale SERANO implementation. However, not only this operation is better completed via the WSS/BV-ROADM section but also the majority of BVTs will remain unused or under-utilized wasting considerable amount of deployed resources. While selecting a lower a value for the parameter might increase the chance of blocking, since fewer BVTs will be deployed in each WDM card. Thus, the design parameter α could be used to trade-off the cost of WDM cards (by limiting the size -i.e. number of BVTs) for a limited set of interconnection patterns that could be implemented during each switch reconfiguration.
Therefore a reduction in the number of BVTs can be achieved as a tradeoff between a blocking probability Pb, which can be set to a controllable upper value, and the number of BVTs employed. For a given number of N and M, the value of a can be computed for any acceptable value of Pb based on mathematical analysis. In [IDEALIST-D1.3] a number of practical scenarios are examined assuming blocking probability values below 3×10⁻³ under the simplifying assumption that each flow has equal probabilities of selecting an output fiber. Additionally, observing that the flows entering the SERANO section are most likely directed to only a small number of c (c < N) pre-selected output fibers (working fiber, second alternative e.g. protection, third, etc.) we resulted in the following expression for the blocking probability in a SERANO node:
(2)

IST IP IDEALIST (Industry-Driven Elastic and Adaptive Lambda
Infrastructure for Service and Transport Networks)
D2.3 – Final Version
Page 46 of 89
The aforementioned expression was derived to calculate the lower bound of the blocking probability in a SERANO node with N I/O fibres, and M flows per I/O fibre assuming a uniform output fibre distribution (all flows have the same probability to appear at any output). Therefore for a given number of N and M and for an acceptable value of Pb,tot we can deduce the value of a which retain the blocking probability under the predefined threshold showing in [IDEALIST-D1.3] that values of a ranging between 1,6 and 2,6 achieved the required Pb threshold and drastically reduced the number of BVTs up to 93.5% compared to the full scale implementation of MxN2 BVTs.
An important consideration regarding the integration of SERANO in a Flex-OXC node is the interconnection pattern between the WSS/ROADM based transit path and the add-drop network to integrate SERANO into the multilayer architecture. The results of the analysis presented above were obtained following a straightforward implementation of a transit SERANO variant shown in Figure 2-24.
Figure 2-24: A transit SERANO variant.
However based on the traffic properties (overall load, directionality etc.) the above assumption for 1:1 association between the number of node input/output fibers and SERANO input/output fibers (ADD/DROP) could be reduced if SERANO can be used in a shared node configuration. In such a case the number of SERANO node input fibers can be reduced, exploiting the traffic properties, from N to a smaller number K and the complexity determined by the parameter a as provided by Eq. (1) and (2) above could be reduced. Finally, this means that in case of lightly loaded fibers in a network node the a SERANO node does not need to be assembled with maximum number of WDM cards during the first phase, avoiding hardware over-provisioning of the node with extra and not used components leading to a pay as you grow architecture. This is something we plan to explore by the end of the project.

IST IP IDEALIST (Industry-Driven Elastic and Adaptive Lambda
Infrastructure for Service and Transport Networks)
D2.3 – Final Version
Page 47 of 89
3 Sliceable bandwidth variable transponders
Fundamental limits of the optical channel have evolved throughout the years in order to reach high performances, often in terms of capacity or spectral efficiency. This chapter will briefly provide a review of the main transmission techniques investigated within IDEALIST which are Nyquist WDM, OFDM and Time-Frequency Packing (TFP). Next, the most recent advances of DSP solutions studied in the project aiming at compensating for various kinds of impairments will be described. The last two sections will be dedicated to give example of applications of these solutions to both long haul and metro area networks.
3.1 Brief review of transmission techniques
High spectral efficiencies are commonly achieved by three main transmission techniques, i.e. NWDN, OFDM and TFP [Napoli-ComMag14][Sambo-ComMag15]. The first two techniques are using orthogonal signals that avoid inter-symbol interference (ISI) and inter-carrier interference (ICI) whereas the latter uses non-orthogonal signals to increase the spectral efficiency. This is achievable by reducing the information rate (due to interferences) but at the same time transmitting more symbols per unit of time.
NWDM Nyquist WDM uses a digital spectral pulse in order to minimize the spectral width of signals. NWDM theoretically supports a channel spacing equal to the symbol-rate. Root raised cosine is a popular choice for pulse shaping minimizing the inter-symbol interference (ISI Nyquist criterion) with a roll-off factor indicating the excess occupied bandwidth. A sharp roll-off (generally below 0.2) is required to avoid large guard bands between channels or equivalently inter-symbol interference. A superchannel aggregating several Nyquist WDM channels with no guard band is a widespread technique to reach very high bit rate such as 1Tbps superchannels [Renaudier-ECOC13]. The bit rate of each carrier of a superchannel can be independently programmed and modulated with different formats (e.g. QPSK, 16QAM). NWDM achieves high spectral efficiency (e.g. 5.7 bit/s/Hz with PM-16QAM) and it is suitable for long haul transmission.
OFDM Optical OFDM consists in the transmission of multiple orthogonal subcarriers, each running at low symbol rate. The common approach to implement an optical OFDM system is based on digital signal processing (DSP). In this case, the OFDM subcarriers are generated at the DSP and further converted into the analog electrical domain [Shieh-10]. Afterwards, the resulting electrical signals are optically modulated by an optoelectronic front-end, which can be an external modulator excited by the appropriate lightwave source. At the receiver, either a direct-detection or a coherent receiver front-end can be used for converting the optical OFDM into the electrical domain. Then, these signals are digitized and further demodulated and processed at the DSP of the receiver.
Since the subcarriers are generated in the electrical domain, a fine granularity and narrow subcarrier spacing can be achieved, usually of the order of hundreds or even tens of MHz. Also, a set of transmission system parameters required for channel estimation/equalization are inherently acquired thanks to the insertion of training sequences, cyclic prefix and pilot tones. Thus, a single tap equalization is possible at the receiver side. Additionally, using a

IST IP IDEALIST (Industry-Driven Elastic and Adaptive Lambda
Infrastructure for Service and Transport Networks)
D2.3 – Final Version
Page 48 of 89
number of electrical subcarriers equal or greater than 64, a more flexible OFDM spectrum with squared profile is obtained while achieving the same spectral efficiency as Nyquist WDM [Schmogrow-OPTEXP12]. An alternative implementation called all-optical OFDM is also possible, where the frequency multiplexing/demultiplexing is performed in the optical domain by specialized devices, e.g. as in [Hillerkuss-OPTEXP10]. In these schemes, the number of subcarriers is limited in order to minimize the cost and complexity of the system.
The fine spectrum granularity of an optical OFDM system, in combination with the DSP, allows to suitably/dynamically reconfigure the transceiver at the electrical subcarrier level. Specifically, arbitrary subcarrier suppression and bit/power loading are enabled at the DSP. Bit loading consists in independently loading the subcarriers with different modulation formats, achieving fine bit-rate selection. For example, for optimizing the system performance, the subcarriers with low signal-to-noise ratio can be loaded with data mapped with the most robust (and less spectrally efficient) modulation format. Power loading can also be implemented at the DSP, in which each subcarrier or a set of subcarriers is multiplied by a gain coefficient in order to adaptively set the subcarrier power. The combination of both, bit and power loading, introduces additional flexibility to the system. Particularly, transceivers featuring bit and power loading can be ad hoc configured for achieving a certain reach and/or coping with a targeted data rate, making OFDM suitable for elastic optical networks.
Thanks to the overhead of information needed for equalization, an optical OFDM system intrinsically provides self-performance monitoring after reception, as all the information gathered in view of further equalization can be used for monitoring the status and/or quality of the transmission [Shieh-10]. Furthermore, OFDM enables the allocation of guard-bands, where the noise can be in-band measured by means of a high-resolution optical spectrum analysis. This allows an all-optical non-intrusive OSNR monitoring that can be placed at the network nodes [Fabrega-ICTON13].
TFP It consists of sending pulses that strongly overlap in time or frequency or both to maximize spectral efficiency, while introducing inter-symbol (ISI) and/or inter-carrier interference (ICI) [Barbieri-TransComm09] [Sambo-JLT]. Coding and detection are properly designed to account for this. A Low-Density Parity-Check (LDPC) code can be used to approach the maximum information rate achievable with the given modulation (typically PM-QPSK), accounting for the presence of noise, ISI, ICI, etc. Code rate, thus spectrum efficiency, may vary with the OSNR of the subcarrier (the lower the OSNR, the larger the redundancy). The receiver of each subcarrier exploits coherent detection with DSP. In particular, a two dimensional adaptive feed-forward equalizer recovers the signal, compensating for linear propagation impairments (e.g., dispersion) and implementing electronic filtering. Given the introduced ISI, TFP requires a receiver based on sequence detection, such as the well-known Bahl-Cocke-Jelinek-Raviv (BCJR) detector [Bahl-InfoTheory74], which exchanges information with an LDPC decoder. TFP provides high spectral efficiency (e.g., 5.16bit/s/Hz) and flexibility because the required all-optical reach can be achieved through the selection of proper code rate even without requiring the support of multiple modulation formats [Sambo-JLT].

IST IP IDEALIST (Industry-Driven Elastic and Adaptive Lambda
Infrastructure for Service and Transport Networks)
D2.3 – Final Version
Page 49 of 89
3.2 Advanced DSP solutions
Previous deliverables D2.1 and D2.2 tackled both analytical and experimental works on data plane designs with various modulation formats (from BPSK to 32QAM), transmission techniques (NWDM, OFDM, TFP) for a wide range of data rates up to 1 Tbps.
In this deliverable D2.3, additional DSP solutions have been investigated to enhance the OSNR sensitivity of the BVT. The next sub-sections include both analytical and experimental validation of the novel solutions. The following topics are addressed:
Performance prediction with the Gaussian Noise model for arbitrary spectral shape, see Section 3.2.1.
Data aided equalization with a focus on the most appropriate CAZAC sequence design for the nonlinear regime, see Section 3.2.2.
The tolerance to phase noise and frequency detuning on the 8QAM constellation is addressed in Section 3.2.3.
Nonlinear effect mitigation is a tempting proposal to achieve higher capacity in the next years in order to remove the power limitation of optical systems, see Section 3.2.4.
The distortions due to hardware limitations such as the limited resolution of DAC could be limited with digital pre-emphasis techniques, see Section 3.2.5.
Although the proposed solutions are independent of the transmission techniques, they have been validated in a Nyquist WDM scenario.
3.2.1 System performance prediction using the Gaussian noise model
In the first project phase we started to investigate the performance in terms of transmission reach of systems using various different modulation formats and symbol rates. We identified the most promising combination of the two parameters for various desired transmission reaches and network scenarios. In order to be able to include as many different configurations as possible, we used an analytical approximation of the Gaussian noise model [Poggiolini-PTL11] to predict the performance of all the different systems and verified several selected systems with full numerical simulations. The outcome of this analysis was already reported in Deliverable 2.1. However, the analytical approximation only holds in the case of Nyquist limit, meaning ideal rectangular channel spectra without gaps between them. Since the IDEALIST project focuses on elastic and dynamic optical networks in which the spectral shape of the WDM signal can substantially differ from this idealized spectral shape it is beneficial to be able to also predict the performance for these, more complicated cases. This however requires either time-consuming full numerical simulations of the whole WDM signal or numerical integration of the Gaussian-noise reference formula [Poggiolini-JLT12]. By numerical integration of the Gaussian-noise reference formula not only arbitrary spectral shapes of the WDM signal but even different amplification schemes like an hybrid Raman/EDFA amplification scheme can be considered. In order to extend the analysis presented in Deliverable 2.1 and to be able to include the systems with arbitrary WDM spectrum in our analysis we implemented and tested numerical integration method during this reporting period.

IST IP IDEALIST (Industry-Driven Elastic and Adaptive Lambda
Infrastructure for Service and Transport Networks)
D2.3 – Final Version
Page 50 of 89
Figure 3-1: Spectra of investigated WDM signals and resulting simulation results. (a). (c) and (e) show the WDM spectra for the ideal Nyquist limit, for the Nyquist limit with spectral gaps and for an arbitrarily chosen spectral shape. (b), (d), (f) and (g) show the effective OSNR (including linear ASE noise and nonlinear interference noise) as a function of the fiber input power per channel for the various spectral
shapes. Each graph shows a comparison between the different investigated numerical methods. (b), (d) and (f) show the results for a single span, while (g)
shows the results for a 10 span transmission.
First we verified the numerical integration method in the Nyquist limit case. We therefore compared the predicted effective OSNR (including linear ASE noise and nonlinear interference noise power) using the analytical approximation, the numerical integration and full numerical simulations using the commercial software VPITransmissionMaker. The investigated system emulates 15 WDM channels and the link consists of 80km SSMF and EDFA amplifiers with a noise figure of 5dB. The resulting white WDM signal spectrum and the simulation results for this case are shown in Figure 3-1(a) and (b) respectively. It can be seen that, as expected, all three performance prediction methods show very good agreement and are therefore suited to predict the transmission performance of such systems.
The next row of graphs in Figure 3-1 shows a different investigated system scenario. While the individual channel spectra are still ideally Nyquist shaped, spectral gaps between them are considered. It can be seen, that while the predicted OSNR values for all three methods still match very well in the linear regime, a difference becomes visible in the nonlinear transmission regime. While the numerical integration method and the full numerical simulations still show good agreement, the results from analytical approximation differ. Since the analytical approximation is not fully valid anymore for this system scenario it predicts wrong amount of nonlinear interference noise. However, since the WDM spectrum only slightly deviates from the ideal Nyquist case, the prediction error is only small (at most
(a) (b)
(c) (d)
(e)(f) (g)

IST IP IDEALIST (Industry-Driven Elastic and Adaptive Lambda
Infrastructure for Service and Transport Networks)
D2.3 – Final Version
Page 51 of 89
0.3dB). This situation significantly changes when considering larger deviations from the ideal Nyquist case as can be seen in Figure 3-1(e) and (f). In this case, seven WDM channels with different individual channel powers, symbol rates and channel spacing are considered. In this case the analytical approximation method considerably underestimates the system performance (by more than 1.5dB), while the performance prediction of the numerical integration matches the results of the full numerical simulations very well, meaning showing less than 0.1dB difference. In Figure 3-1(g) the estimated OSNR considering a 10 span transmission is shown. It can be seen, that the OSNR estimation of the numerical integration predicts the obtained results from full simulations with at most 0.2dB discrepancies even in this case.
The goal for further investigations is to also verify this useful tool for performance estimation of optical systems in an experimental environment. Therefore we plan to compare the experimentally obtained maximum transmission reach of different superchannel configurations with the predictions from this numerical integration technique.
3.2.2 Performance issues using CAZAC training sequences for data-aided channel estimation
Data-aided digital signal processing for channel estimation and channel equalization is a key part for realizing future flexible and bandwidth variable transponders [Fischer-JLT14]. As already reported in deliverable 2.2, we started to investigate different types of training sequences for the use in channel estimation of the optical transmission link. This work has been continued within this reporting period. We focused on the behaviour and the performance comparison of different implementations of a very popular type of training sequence, namely Constant Amplitude and Zero Autocorrelation (CAZAC) sequences [Heimiller-IT60], [Frank-IT62]. One advantage of this type of sequences is that they show a white amplitude spectrum and are therefore particularly well suited for data-aided channel estimation. This kind of sequence is widely used for wireless communications and has recently been adopted for optical communications [Pittala-JLT14], [Tran-PTL12].
While these sequences can be used for all discussed multiplexing techniques in the scope of the IDEALIST project, namely Nyquist WDM, time-frequency packing and optical OFDM, we restrict our analysis in this part to Nyquist WDM only. However, the main findings are also valid for the other two multiplexing techniques.
CAZAC sequences are similar to linearly chirped signals, i.e. they are composed of an oscillation with constant amplitude and an instantaneous frequency, which is changing almost linearly in time. While experimental investigations of CAZAC sequences in optical systems so far only considered sequences with linearly increasing frequency (up-chirp) [Kuschnerov-PJ10], [Pittalà-ICTON11], [Elschner-OE12] it is also possible to generate CAZAC sequences with decreasing frequency (down-chirp), similar to the definition of chirped Gaussian pulses in [Agrawal06]. The here investigated CAZAC sequences are composed out of temporally subsequent oscillations each having a constant frequency. The individual frequencies of the oscillations are increasing with time. Meaning these CAZAC sequences show a piecewise linear approximation of the phase of continuous chirped signals. Such sequences can efficiently be generated digitally, similar to [Röhrs-COMSIG92] using the equation
𝑐± 𝑘 = exp ±𝑗
2𝜋
𝑁 mod 𝑘, 𝑁 1
𝑘
𝑁 + 1 , with 𝑘 = 0,1, . . . 𝑁 1.
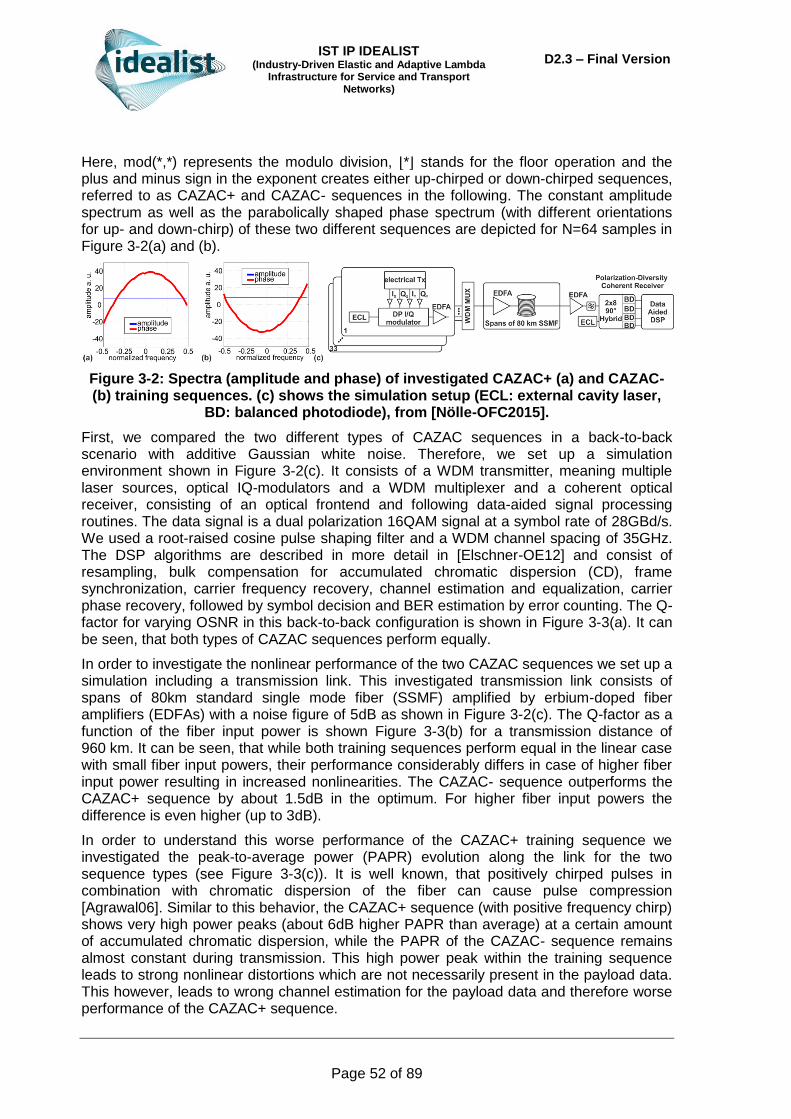
IST IP IDEALIST (Industry-Driven Elastic and Adaptive Lambda
Infrastructure for Service and Transport Networks)
D2.3 – Final Version
Page 52 of 89
Here, mod(*,*) represents the modulo division, ⌊*⌋ stands for the floor operation and the plus and minus sign in the exponent creates either up-chirped or down-chirped sequences, referred to as CAZAC+ and CAZAC- sequences in the following. The constant amplitude spectrum as well as the parabolically shaped phase spectrum (with different orientations for up- and down-chirp) of these two different sequences are depicted for N=64 samples in Figure 3-2(a) and (b).
Figure 3-2: Spectra (amplitude and phase) of investigated CAZAC+ (a) and CAZAC- (b) training sequences. (c) shows the simulation setup (ECL: external cavity laser,
BD: balanced photodiode), from [Nölle-OFC2015].
First, we compared the two different types of CAZAC sequences in a back-to-back scenario with additive Gaussian white noise. Therefore, we set up a simulation environment shown in Figure 3-2(c). It consists of a WDM transmitter, meaning multiple laser sources, optical IQ-modulators and a WDM multiplexer and a coherent optical receiver, consisting of an optical frontend and following data-aided signal processing routines. The data signal is a dual polarization 16QAM signal at a symbol rate of 28GBd/s. We used a root-raised cosine pulse shaping filter and a WDM channel spacing of 35GHz. The DSP algorithms are described in more detail in [Elschner-OE12] and consist of resampling, bulk compensation for accumulated chromatic dispersion (CD), frame synchronization, carrier frequency recovery, channel estimation and equalization, carrier phase recovery, followed by symbol decision and BER estimation by error counting. The Q-factor for varying OSNR in this back-to-back configuration is shown in Figure 3-3(a). It can be seen, that both types of CAZAC sequences perform equally.
In order to investigate the nonlinear performance of the two CAZAC sequences we set up a simulation including a transmission link. This investigated transmission link consists of spans of 80km standard single mode fiber (SSMF) amplified by erbium-doped fiber amplifiers (EDFAs) with a noise figure of 5dB as shown in Figure 3-2(c). The Q-factor as a function of the fiber input power is shown Figure 3-3(b) for a transmission distance of 960 km. It can be seen, that while both training sequences perform equal in the linear case with small fiber input powers, their performance considerably differs in case of higher fiber input power resulting in increased nonlinearities. The CAZAC- sequence outperforms the CAZAC+ sequence by about 1.5dB in the optimum. For higher fiber input powers the difference is even higher (up to 3dB).
In order to understand this worse performance of the CAZAC+ training sequence we investigated the peak-to-average power (PAPR) evolution along the link for the two sequence types (see Figure 3-3(c)). It is well known, that positively chirped pulses in combination with chromatic dispersion of the fiber can cause pulse compression [Agrawal06]. Similar to this behavior, the CAZAC+ sequence (with positive frequency chirp) shows very high power peaks (about 6dB higher PAPR than average) at a certain amount of accumulated chromatic dispersion, while the PAPR of the CAZAC- sequence remains almost constant during transmission. This high power peak within the training sequence leads to strong nonlinear distortions which are not necessarily present in the payload data. This however, leads to wrong channel estimation for the payload data and therefore worse performance of the CAZAC+ sequence.
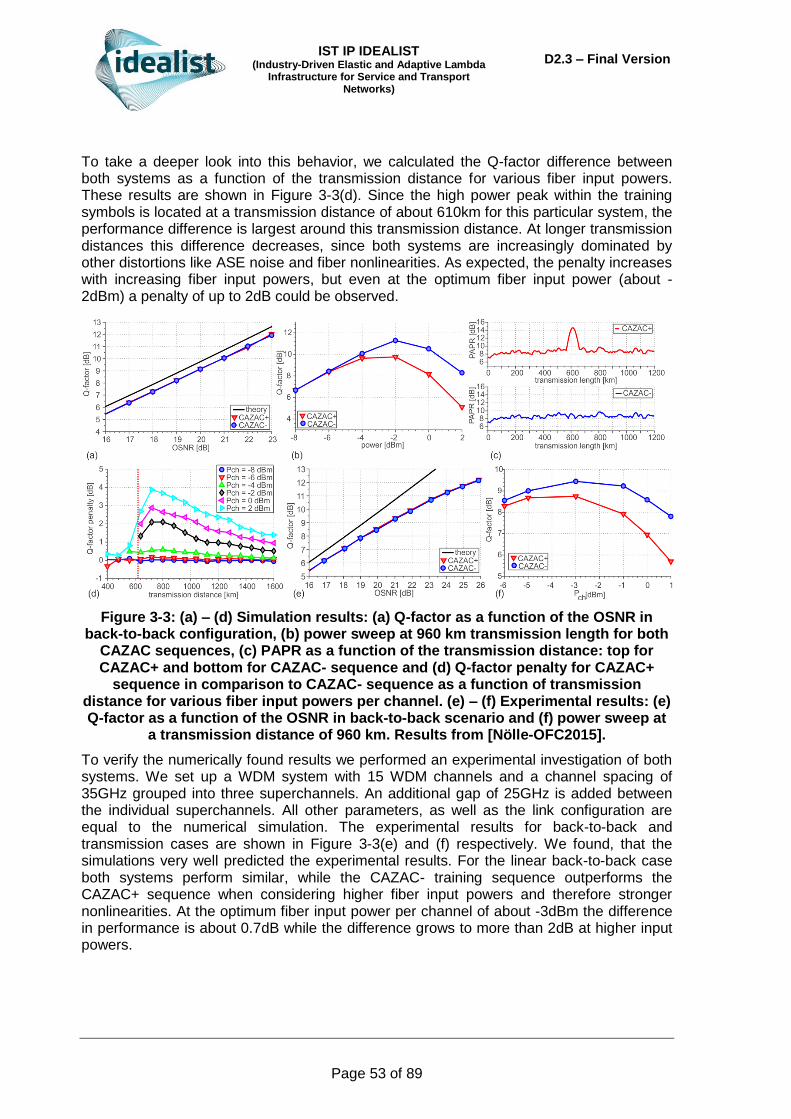
IST IP IDEALIST (Industry-Driven Elastic and Adaptive Lambda
Infrastructure for Service and Transport Networks)
D2.3 – Final Version
Page 53 of 89
To take a deeper look into this behavior, we calculated the Q-factor difference between both systems as a function of the transmission distance for various fiber input powers. These results are shown in Figure 3-3(d). Since the high power peak within the training symbols is located at a transmission distance of about 610km for this particular system, the performance difference is largest around this transmission distance. At longer transmission distances this difference decreases, since both systems are increasingly dominated by other distortions like ASE noise and fiber nonlinearities. As expected, the penalty increases with increasing fiber input powers, but even at the optimum fiber input power (about -2dBm) a penalty of up to 2dB could be observed.
Figure 3-3: (a) – (d) Simulation results: (a) Q-factor as a function of the OSNR in back-to-back configuration, (b) power sweep at 960 km transmission length for both
CAZAC sequences, (c) PAPR as a function of the transmission distance: top for CAZAC+ and bottom for CAZAC- sequence and (d) Q-factor penalty for CAZAC+
sequence in comparison to CAZAC- sequence as a function of transmission distance for various fiber input powers per channel. (e) – (f) Experimental results: (e) Q-factor as a function of the OSNR in back-to-back scenario and (f) power sweep at
a transmission distance of 960 km. Results from [Nölle-OFC2015].
To verify the numerically found results we performed an experimental investigation of both systems. We set up a WDM system with 15 WDM channels and a channel spacing of 35GHz grouped into three superchannels. An additional gap of 25GHz is added between the individual superchannels. All other parameters, as well as the link configuration are equal to the numerical simulation. The experimental results for back-to-back and transmission cases are shown in Figure 3-3(e) and (f) respectively. We found, that the simulations very well predicted the experimental results. For the linear back-to-back case both systems perform similar, while the CAZAC- training sequence outperforms the CAZAC+ sequence when considering higher fiber input powers and therefore stronger nonlinearities. At the optimum fiber input power per channel of about -3dBm the difference in performance is about 0.7dB while the difference grows to more than 2dB at higher input powers.

IST IP IDEALIST (Industry-Driven Elastic and Adaptive Lambda
Infrastructure for Service and Transport Networks)
D2.3 – Final Version
Page 54 of 89
3.2.3 Tolerance of phase noise with 8QAM
The 8QAM modulation format is a potential alternative to QPSK for long-haul transmissions since it is a good compromise between spectral efficiency and achievable distance. Therefore, in previous deliverable D2.2, performance of 8QAM was investigated with respect to DAC quantization and pulse shapes [Noelle-OFC14]. In contrast to QPSK or 16QAM which are square constellations, 8QAM is not compliant with Gray Mapping and 3 different bit mapping are considered. It was shown that the circular 8QAM outperforms the commonly used star-8QAM constellation by 0.7dB [Noelle-OFC14].
In this novel study, we extend the comparison by investigating the tolerance of the circular-8QAM and star-8QAM constellations against phase noise and frequency detuning. We use the same bit mapping as defined in D2.2 (Fig. 44). Moreover, using a standard single mode fiber (SSMF-) based transmission link combined with hybrid EDFA/Raman amplification, we compare the nonlinear performance of both constellations [Rios-Muller-ECOC14]. All constellations operate at 41.6Gbaud over a 50GHz-grid and assuming 20% of error correction code, i.e. at 200Gb/s, or alternatively at 4 b/s/Hz.
Our test-bed depicted in Figure 3-4(a) consists of one narrow linewidth laser under test at 1545.72nm, plus 63 loading channels spaced by 50GHz. To generate the driving signals, we combined multiple delayed-decorrelated sequences of 215 bits, and obtained a multi-level sequence of symbols. Then we insert pilot symbols according to a structure made of frames and sub-frames as depicted in Figure 3-4(b). For each frame we first insert a sequence that will be used for frame synchronization, then for each 400 symbol subframe we insert pilot symbols that will be used for absolute phase estimation in the receiver. The number of pilots per sub-frame is flexible. As shown in the table in Figure 3-4(c), pilots and synchronizing symbols have amplitudes equal to the outer-ring of each constellation to increase the pilot-to-signal power ratio, while inducing less than 0.02 dB power penalty owing to the small considered overheads of pilot symbols and synchronization sequence. The resulting symbols sequences are oversampled by a factor of ~1.56 and pulse shaped using a root-raised cosine function with roll-off of 0.1.
Figure 3-4: WDM experimental setup (a). Frame structure used for pilot insertion (b). Constellations used for pilots and data symbols (c).
The WDM comb is sent into the recirculating loop with hybrid Raman-EDFA optical repeaters compensates fiber loss. The Raman pre-amplifier is designed to provide ~10dB on/off gain. Loop synchronous polarization scrambling (LSPS) is used and power equalization is performed thanks to a 50GHz grid WSS inserted at the end of the loop. All transmission details can be found in [Rios-Muller-ECOC14].
The DSP at the receiver includes first chromatic dispersion compensation, then polarization demultiplexing is realized using a 25-tap T/2 spaced butterfly equalizer with blind adaptation based on a multi-modulus algorithm. Frequency recovery is done using 4th and

IST IP IDEALIST (Industry-Driven Elastic and Adaptive Lambda
Infrastructure for Service and Transport Networks)
D2.3 – Final Version
Page 55 of 89
7th power periodogram for the Star-8QAM and Circular-8QAM respectively. Phase recovery is done using blind phase search algorithm for both constellations [Pfau-JLT09]. For the Star-8QAM, it can be directly used by testing equally-spaced phases between [–π/4, π/4]. Since Circular-8QAM has a different constellation rotational symmetry (7), the test phases are in the range [-π/7, π/7]. The phase unwrapper is modified to take the different constellation symmetries into account. After phase recovery, we synchronize the received sequence by doing a complex correlation with the frame synchronization sequence, followed by absolute phase estimation of each sub-frame by comparing the phase of the emitted and received pilot symbols. Each sub-frame is then multiplied by the estimated phase to enable the use of direct decoding. Considering symmetry equals 4 and 7 for the
star and the circular 8QAM constellations respectively, the complex phase θ that multiplies the sub-frame is:
,
where is the normalized estimated pilot phase, si is the ith pilot symbol for each
subframe, yi the received symbol corrupted by noise and a phase ambiguity, N is the number of pilot symbols per sub-frame and (.)* denotes the complex conjugate. Decision is then done using the minimum distance and BER is counted and then converted to Q²-factor.
Figure 3-5: a) Fitted distribution of normalized phases over 2600 subframes for different number of pilots per sub-frame, b) frequency detuning tolerance.
We first investigated the impact of the different symmetry of these constellations onto the performance of pilot phase estimation. Figure 3-5(a) compares the distribution of normalized estimated pilot phase of the two modulation formats as a function of the number of pilots at 14dB of OSNR. Triangles are showing the phase distribution obtained for the Star-8QAM with 0.5% pilots (2 pilots per subframe). Diamonds and squares depict the distribution of phase for the Circular 8QAM with 0.5% and 1.5% pilots respectively. Note that phase estimation error occurs when the modulus of normalized phase is bigger than 0.5 (shaded region in this figure). This figure shows that with the same amount of pilots (0.5%), the Star-8QAM exhibits a narrower normalized phase distribution than the Circular-8QAM, leading to less phase estimation errors. This figure also shows that the Circular-8QAM requires three times more pilots than the Star- 8QAM in order to achieve similar phase estimation performance. Thus, we consider for all the following results 6 pilots (1.5%) for the Circular-8QAM and 2 pilots (0.5%) for the Star-8QAM. Note that such an increase on pilot overhead corresponds to a symbol rate increase of 0.4GBd/s, having

IST IP IDEALIST (Industry-Driven Elastic and Adaptive Lambda
Infrastructure for Service and Transport Networks)
D2.3 – Final Version
Page 56 of 89
negligible impact on OSNR sensitivity (0.04dB). Furthermore, in Figure 3-5(b), we investigated the impact of the frequency detuning in the performance of both formats at the same OSNR of 14dB. We can see in this figure that the Star-8QAM is much more tolerant to the frequency detuning than the circular 8QAM, with a tolerance of ±5.2GHz compared to ±3GHz. This is attributed to the fact that the maximum tolerable frequency detuning is equivalent to half-baud rate divided by the symmetry of the considered constellation when using the commonly used periodogram technique.
Figure 3-6: Performance of the two solutions versus (a) the launched power after 3200 km and (b) distance.
Next, we launched the 200Gbit/s channels into the loop. Figure 3-6(a) presents the performance measured by the Q²-factor as a function of the fiber input power after 3200km. This figure indicates the optimum launching power, which is approximately the same for the two examined formats, demonstrating similar non-linear tolerance for both of them. Then, we set the launch power to the optimum value of 17dBm and we measured the Q²-factor as a function of distance. Figure 3-6(b) shows the measured performance of each modulation format versus the number of loop round trips. This figure confirms that the performance advantage of the circular format observed in back-to-back holds even after long distance transmission, making it a promising constellation for increasing the distance of long-haul systems, although less tolerant to phase noise and frequency detuning.
3.2.4 Nonlinear inter-channel XPolM mitigation
High spectral efficiencies for future 1Tbit/s optical transmission systems are likely to require the usage of high order modulations such as 8QAM and 16QAM as well as a large symbol rate. With such an evolution, the system becomes more sensitive to noise, which suggests increasing the optical power level at each fiber input. Optical nonlinearities arise then, producing distortions which, in return, limit this optical power level below a certain threshold. The optical reach is therefore significantly reduced with high order modulations, for instance moving from QPSK to 16QAM doubles the data rate but at the same time reduces the optical reach by a factor of five [Layec-BLTJ13]. To gain in performance, the compensation of nonlinear effects becomes of key interest.
In previous deliverables D2.1 and D2.2, the nonlinear mitigation techniques were focused on the cancellation of intra-superchannel nonlinearities, such as Self-Phase Modulation (SPM) and Cross-Phase Modulation (XPM) coming from the superchannel subcarriers, with digital back propagation.
We considered in this work other nonlinear Kerr effects arising from adjacent channels known as Cross-Polarization Modulation (XPolM). Systems using polarization multiplexing are indeed suffering from XPolM which ultimately limits the OSNR sensitivity. Digital back propagation can also theoretically mitigate XPolM but this would require the knowledge of

IST IP IDEALIST (Industry-Driven Elastic and Adaptive Lambda
Infrastructure for Service and Transport Networks)
D2.3 – Final Version
Page 57 of 89
all fiber links parameters (including from the other channels) as well as excessive processing for realistic chips [Sperti-PTL11]. Decision-aided Nonlinear Polarization Crosstalk Canceller (NPCC) have also been proposed [Li-OFC10][Stojanovic-OFC12] but offers moderate benefits.
We propose to use a new joint maximum likelihood (ML) performing both blind channel estimation and symbol detection in the same stage. A joint ML approach has renewed a significant interest recently in wireless communications [Xu-ISIT08] to mitigate channel uncertainties and boost spectral efficiency. We elaborate a novel method involving relaxations to derive a joint ML called Generalized ML (GML). We then adapt the numerical algorithm [Xu-ISIT08] to resolve the GML. We present simulation results highlighting the improvement compared to the previously reported NPCC. Finally, we assess the efficiency of our proposed method with experimental data over a WDM dispersion-managed system based on 32GBd/s PM-QPSK channels [Layec-ECOC14].
The novel formulation of XPolM mitigation is based on an analytical modelling of XPolM nonlinear effects developed in [Li-OFC10][Ghazisaeidi-ECOC12] where all linear effects are assumed to be perfectly compensated and all other inter- and intra-channel nonlinear impairments are neglected. All the multichannel components are well captured in the
following XPolM channel model.
where the coefficients , are complex Gaussian processes, independent of symbols
and ASE, with the auto-correlation function 𝑘
where stands
for the ensemble average and * stands for the complex conjugation. The XPolM strength is denoted by Rmax, but is simply equal to R[0]. The coherence time is given by the full-width at
half-maximum (FWHM) of R[k], and we refer to it with NFWHM. However, Rmax is a small
value, i.e. Rmax ≪ 1, hence for simplicity in the remainder
.
Our approach is to consider a relaxation of the XPolM channel modeling. Let us
approximate that the channel realization is quasi-static over P symbols. This relaxation is valid as long as P remains smaller than the coherence time. The experiments confirm the validity of this approximation. In addition, we propose to take advantage of an estimate of Rmax and use the Gaussian distribution assumption of to make a regularization of the GML formulation, which makes it more accurate. The GML formulation, derivations and closed-form solution of the problem is developed in detail in [Layec-JLT15]. Note that GML can be very easily adapted to any modulation format. A fast algorithm based on branch-estimate-bound [Xu-ISIT08] and proved to achieve optimal performances with a substantial reduction of complexity is then proposed for the proposed GML algorithm. Using Monte
Carlo simulations we simulate the XPolM channel model and AWGN noise to evaluate the performance of GML [Layec-ECOC14] and previously reported NPCC [Li-OFC10]. We also plot the so-called genie-aided limit which is obtained under perfect knowledge of the XPolM channel realization and ML detection.
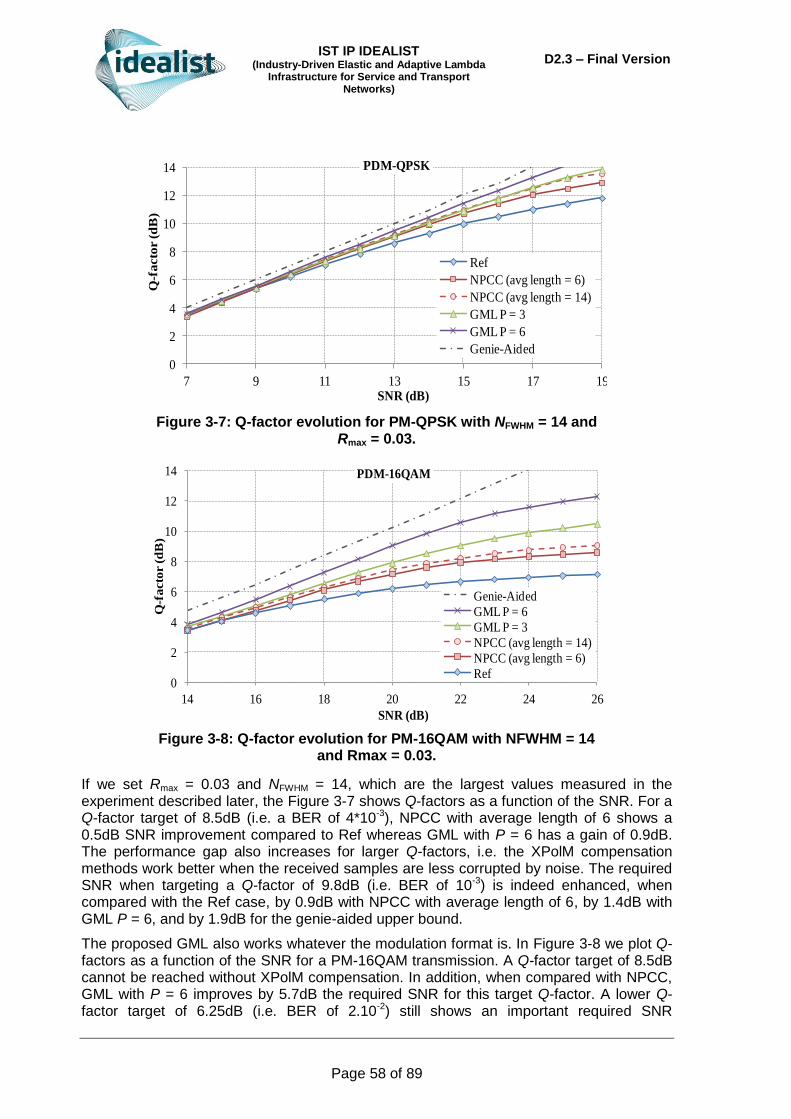
IST IP IDEALIST (Industry-Driven Elastic and Adaptive Lambda
Infrastructure for Service and Transport Networks)
D2.3 – Final Version
Page 58 of 89
If we set Rmax = 0.03 and NFWHM = 14, which are the largest values measured in the experiment described later, the Figure 3-7 shows Q-factors as a function of the SNR. For a Q-factor target of 8.5dB (i.e. a BER of 4*10-3), NPCC with average length of 6 shows a 0.5dB SNR improvement compared to Ref whereas GML with P = 6 has a gain of 0.9dB. The performance gap also increases for larger Q-factors, i.e. the XPolM compensation methods work better when the received samples are less corrupted by noise. The required SNR when targeting a Q-factor of 9.8dB (i.e. BER of 10-3) is indeed enhanced, when compared with the Ref case, by 0.9dB with NPCC with average length of 6, by 1.4dB with GML P = 6, and by 1.9dB for the genie-aided upper bound.
The proposed GML also works whatever the modulation format is. In Figure 3-8 we plot Q-factors as a function of the SNR for a PM-16QAM transmission. A Q-factor target of 8.5dB cannot be reached without XPolM compensation. In addition, when compared with NPCC, GML with P = 6 improves by 5.7dB the required SNR for this target Q-factor. A lower Q-factor target of 6.25dB (i.e. BER of 2.10-2) still shows an important required SNR
Figure 3-7: Q-factor evolution for PM-QPSK with NFWHM = 14 and Rmax = 0.03.
Figure 3-8: Q-factor evolution for PM-16QAM with NFWHM = 14 and Rmax = 0.03.
0
2
4
6
8
10
12
14
7 9 11 13 15 17 19
Q-f
acto
r (
dB
)
SNR (dB)
PDM-QPSK
Ref
NPCC (avg length = 6)
NPCC (avg length = 14)
GML P = 3
GML P = 6
Genie-Aided
0
2
4
6
8
10
12
14
14 16 18 20 22 24 26
Q-f
acto
r (d
B)
SNR (dB)
PDM-16QAM
Genie-Aided
GML P = 6
GML P = 3
NPCC (avg length = 14)
NPCC (avg length = 6)
Ref

IST IP IDEALIST (Industry-Driven Elastic and Adaptive Lambda
Infrastructure for Service and Transport Networks)
D2.3 – Final Version
Page 59 of 89
improvement of 1.4dB between NPCC with average length of 6 and GML with P = 6. NPCC suffers more in high order modulation due to the hard decision gate of the algorithm.
We conducted an experiment with 84 channels of 32GBd/s PM-QPSK with 50GHz channel spacing in a submarine configuration. The 8 central channels are Nyquist pulse shaped as a root raised cosine with roll-off factor of 0.1. Surrounding channels are independently modulated with PM-QPSK and no pulse shaping. The resulting WDM comb is transmitted over eighty-five 60km-long span of Non-Zero dispersion-shifted fiber with PMD coefficient lower than 0.08ps/√km using a typical dispersion map. The channel under test at 1550.12nm is sent in each span with a launch power of -2.5dBm corresponding to the nonlinear threshold which maximizes the Q-factor. We recorded 1000 measurements. The received signals are processed offline. The signal is received on both polarizations. After compensating for chromatic dispersion we perform polarization demultiplexing with constant-modulus algorithm, then frequency and carrier phase estimation. We then insert the XPolM compensation stage (either with NPCC or with the proposed GML). Finally, we discriminate the symbols and count errors.
(a)
(b)
Figure 3-9: Experimental auto-correlation: (a) XPolM strength; (b) Coherence time, both with a trendline showing XpolM characteristics and experimental Q-factors.
Without XPolM compensation, the measured Q-factors vary in a range of [6.35dB; 7.80dB]. We attribute these fluctuations to the nonlinear XPolM impairments during transmission. As evidence, we plot the auto-correlation of the crosstalk coefficient α (note that is would be similar for β), calculated from the 1000 sets of data, at the corresponding Q-factor. Figure 3-9(a) shows a quasi-linear trend between Q-factors and Rmax. Similarly the relationship between NFWHM and Q-factors is quasi-linear; NFWHM is found to range between 6 and 14 symbols, see Figure 3-9(b). As explained above, the value of NFWHM sets the limit of P, beyond which our GML relaxation is not valid anymore.
0.000
0.005
0.010
0.015
0.020
0.025
0.030
6.0 6.5 7.0 7.5 8.0
Rm
ax
Q-factor (dB)
Trendline0
2
4
6
8
10
12
14
16
6.0 6.5 7.0 7.5 8.0
NF
HW
M
Q-factor (dB)
Trendline
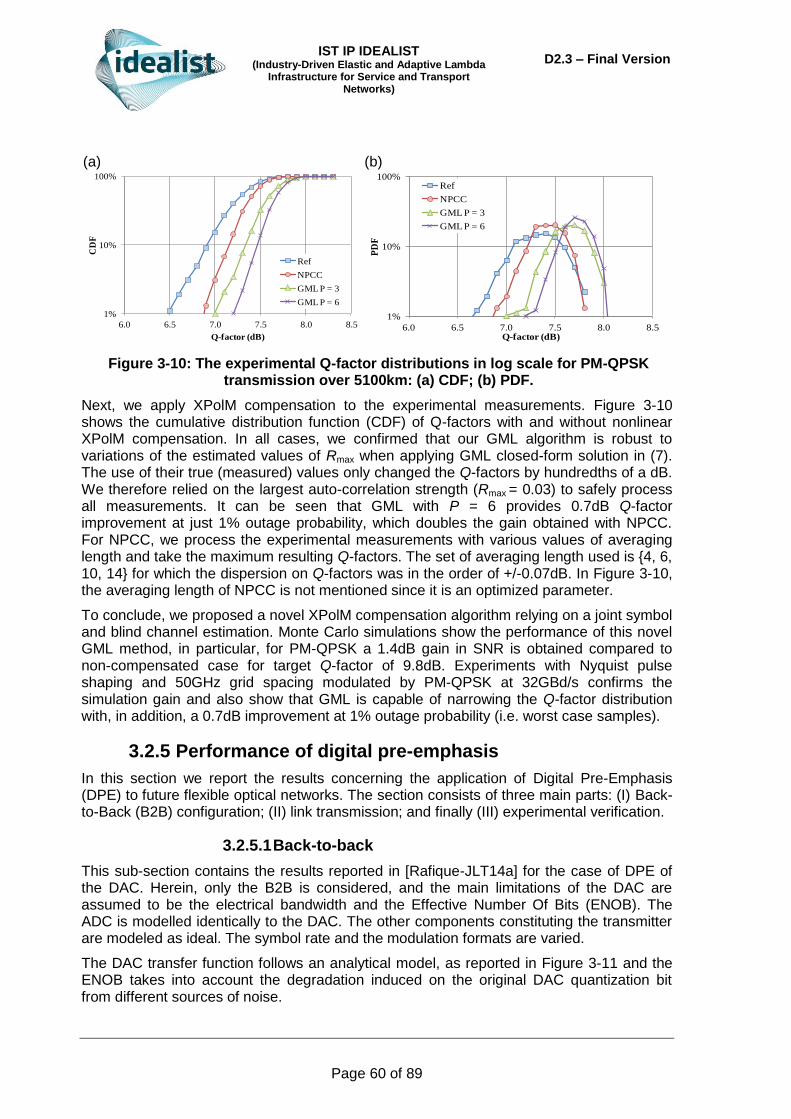
IST IP IDEALIST (Industry-Driven Elastic and Adaptive Lambda
Infrastructure for Service and Transport Networks)
D2.3 – Final Version
Page 60 of 89
(a)
(b)
Figure 3-10: The experimental Q-factor distributions in log scale for PM-QPSK transmission over 5100km: (a) CDF; (b) PDF.
Next, we apply XPolM compensation to the experimental measurements. Figure 3-10 shows the cumulative distribution function (CDF) of Q-factors with and without nonlinear XPolM compensation. In all cases, we confirmed that our GML algorithm is robust to variations of the estimated values of Rmax when applying GML closed-form solution in (7). The use of their true (measured) values only changed the Q-factors by hundredths of a dB. We therefore relied on the largest auto-correlation strength (Rmax = 0.03) to safely process all measurements. It can be seen that GML with P = 6 provides 0.7dB Q-factor improvement at just 1% outage probability, which doubles the gain obtained with NPCC. For NPCC, we process the experimental measurements with various values of averaging length and take the maximum resulting Q-factors. The set of averaging length used is {4, 6, 10, 14} for which the dispersion on Q-factors was in the order of +/-0.07dB. In Figure 3-10, the averaging length of NPCC is not mentioned since it is an optimized parameter.
To conclude, we proposed a novel XPolM compensation algorithm relying on a joint symbol and blind channel estimation. Monte Carlo simulations show the performance of this novel GML method, in particular, for PM-QPSK a 1.4dB gain in SNR is obtained compared to non-compensated case for target Q-factor of 9.8dB. Experiments with Nyquist pulse shaping and 50GHz grid spacing modulated by PM-QPSK at 32GBd/s confirms the simulation gain and also show that GML is capable of narrowing the Q-factor distribution with, in addition, a 0.7dB improvement at 1% outage probability (i.e. worst case samples).
3.2.5 Performance of digital pre-emphasis
In this section we report the results concerning the application of Digital Pre-Emphasis (DPE) to future flexible optical networks. The section consists of three main parts: (I) Back-to-Back (B2B) configuration; (II) link transmission; and finally (III) experimental verification.
3.2.5.1 Back-to-back
This sub-section contains the results reported in [Rafique-JLT14a] for the case of DPE of the DAC. Herein, only the B2B is considered, and the main limitations of the DAC are assumed to be the electrical bandwidth and the Effective Number Of Bits (ENOB). The ADC is modelled identically to the DAC. The other components constituting the transmitter are modeled as ideal. The symbol rate and the modulation formats are varied.
The DAC transfer function follows an analytical model, as reported in Figure 3-11 and the ENOB takes into account the degradation induced on the original DAC quantization bit from different sources of noise.
1%
10%
100%
6.0 6.5 7.0 7.5 8.0 8.5
CD
F
Q-factor (dB)
Ref
NPCC
GML P = 3
GML P = 6
1%
10%
100%
6.0 6.5 7.0 7.5 8.0 8.5
PD
F
Q-factor (dB)
Ref
NPCC
GML P = 3
GML P = 6

IST IP IDEALIST (Industry-Driven Elastic and Adaptive Lambda
Infrastructure for Service and Transport Networks)
D2.3 – Final Version
Page 61 of 89
Figure 3-11: Transfer function for the real DAC (16GHz): solid line, pre-emphasis response (varying bandwidth and 5.5 ENOB): dashed lines, and desired DAC (only shown for 16GHz and 32GHz desired bandwidth): dashed lines – see the figure to
identify which dashed lines correspond to which DAC specification.
With the aim of employing these results within future optical flexible networks, we considered a wide range of symbol rates (to enable for example higher FEC overhead) and m-QAM modulation formats.
Figure 3-12: Q-factor as a function of baud rate for PM-16QAM signals, both without (a) and with DPE (b).
A first set of results is reported in Figure 3-12, where the Q factor in dB is shown as
function of the DAC bandwidth vs. the symbol rate. The theoretical value is also reported
(black solid line). Figure 3-12(a) shows the case without DPE, while Figure 3-12(b) shows
the case with. All curves in Figure 3-12 are with ENOB = 5.5. It can be seen that increasing
the symbol rate, even with ideal DACs (theoretical curve), degrades the performance by
~3dB for doubling of the baud rate (30GBd/s to 62GBd/s), due to higher OSNR
requirements with increasing baud rates. As expected, for both Fig. 5a and Fig. 5b, in case
of large enough DAC bandwidths the Q degradation across baud rates is similar to that of

IST IP IDEALIST (Industry-Driven Elastic and Adaptive Lambda
Infrastructure for Service and Transport Networks)
D2.3 – Final Version
Page 62 of 89
theoretical curve (~3dB), even for the highest considered baud rate of 62GBd/s. However,
even the best-case DAC specification is ~1.4dB worse, compared to theory at any given
baud rate, due to limitations of components used to generate and detect PM-16QAM.
Nonetheless, the general trend is that as the baud rate increases, for any given bandwidth,
the performance deteriorates, with worst-case degradation for lower bandwidths, owing to
extreme filtering of signals. As shown in Fig. 5b, DPE partially addresses this issue, and
enables superior tolerance towards DAC limitations, where near theoretical performance
(same slope) can be achieved with bandwidth greater than 22GHz, compared to 28GHz
without DPE (Fig. 5a). As an example, considering typical commercial DAC bandwidth of
16GHz, the maximum baud rates at 1dB penalty, without and with DPE are ~34GBd/s and
~38GBd/s, respectively. It is also worth mentioning that for the smallest bandwidth
considered, 10GHz, system performance degrades, even for the lowest baud rate of
30GBd/s, by ~2dB without DPE and ~1dB with DPE.
Extending this analysis, to investigate the influence of ENOB, we obtained the results of
Figure 3-13, where Q factor is displayed as a function of increasing ENOB for the particular
case of PM-16QAM. It can be seen that at a fixed ENOB, the Q-improvement – here
defined as the gain in Q-factor when DPE is activated, is ~1.2dB for high baud rate system,
and ~0.4dB for low baud rate system. The performance improvement trend is uniform for
any given ENOB. The presented results can be viewed in two dimensions:
1) Reduction in ENOB requirements at a fixed performance penalty, with respect to maximum saturated performance, for individual scenarios with and without DPE: The required ENOB, at 1dB penalty, for low and high baud rates are found to be 4.5bits (4.8bits) and 4.7 (5bits), respectively – numbers outside/inside bracket represent scenarios with/without DPE.
2) Reduction in ENOB requirements at a fixed penalty, with respect to maximum performance enabled by DPE: The required ENOB at 1dB penalty, for low and high baud rates is found to be 4.5 (5.1bits) and 4.75 (7bits), respectively – numbers outside/inside bracket.
Figure 3-13: Q-factor vs. ENOB for PM-16QAM.
Finally, we studied the maximum transmittable symbol rate for a given bandwidth, when we fix the Q threshold of our FEC at 7.33dB. This provides the results showed in Figure 3-14.

IST IP IDEALIST (Industry-Driven Elastic and Adaptive Lambda
Infrastructure for Service and Transport Networks)
D2.3 – Final Version
Page 63 of 89
Figure 3-14: Maximum potential baud rates, as a function of various modulation formats, both without and with DPE.
To conclude, we investigated the performance and benefit of a DPE algorithm that selectively enhances higher signal frequencies. Numerous DAC specifications have been considered and performance improvements have been established for polarization multiplexed m-state QAM formats (PM-BPSK, PM-16QAM). As an outcome, DAC bandwidth and ENOB requirements have been provided, and maximum baud rates have been derived for different transponder configurations (modulation and DAC specification).
The presented results suggest that increasing the DAC -3dB bandwidth beyond conventional 16GHz is substantially beneficial. Moreover, if effective DAC resolution of 5.5bits is available at the specified bandwidth, it is typically enough to enable performance comparable to higher DAC resolutions.
3.2.5.2 Link
In this second sub-section we present the second part of the work carried out in [Rafique-JLT14a] and detailed in [Rafique-JLT14b]. The impact of DPE on nonlinear channel performance, both numerically and experimentally is investigated. In particular, we establish the performance of a transmitter without and with DPE when transmitting in nonlinear regime through a power sweep, and we assess the benefit provided by DPE when transmitting over long distances. A last study on the performance in case of closely space channels is reported.
In Figure 3-15 we show the performance (Q factor vs. launch power) for a PM-16QAM transmitted over 400km of SSFM at 44GBd/s. In blue are reported the line with DPE ON, while in red DPE is OFF. The general trend is consistent with well-known bell-curve behavior, where the performance is initially limited by OSNR, up to the Nonlinear Threshold (NLT) – at optimum launch power, beyond which channel nonlinearities limit the transmission performance. As expected, performance without DPE is worse, compared to the case with DPE. However, quite interestingly, it can also be observed that, compared to the linear transmission (or back-to-back configuration), DPE enabled performance improvements are greater in nonlinear transmission regime. In particular, one may observe ~2dB improvements after nonlinear transmission, compared to ~0.9dB improvement in linear transmission region, respectively. This trend may be attributed to channel

IST IP IDEALIST (Industry-Driven Elastic and Adaptive Lambda
Infrastructure for Service and Transport Networks)
D2.3 – Final Version
Page 64 of 89
nonlinearity mitigation by the DPE filter, owing to enhanced higher frequency components by the DPE filter.
Figure 3-15: Q-factor as a function of launch power per channel for 44GB/s PM-16QAM WDM transmission after 400km. a) 44GBd/s. Circles: DPE OFF, Squares: DPE
ON.
In order to understand and confirm the linear and nonlinear performance improvements available from DPE across transmission reach, we establish the maximum attainable distance by different modulation formats at the investigated baud rates in [Rafique-JLT14b]. Note that for various transmittable baud rates, we assumed 28GBd/s of data and framer overhead, and allocated the additional baud rate to increase the forward error correction overhead (FEC-OH). FEC-OH was calculated assuming soft-decision codes, allowing for net coding gain equivalent to hard-decision Shannon limit [Schmalen-BLTJ13]. In particular, the FEC-OH corresponding to the used baud rates are 50Gbaud (88%), 46Gbaud (72%), and 44Gbaud (64%) for PM-4QAM, PM-4QAM, PM-16QAM, respectively. The pre-FEC Q-thresholds are highlighted in the figure with solid horizontal lines. It is worth mentioning that FEC-OH beyond 50 - 60% may not be practical today due to hardware limitations, however we present up to 88% of OH to show the potential of our algorithm.
Figure 3-16 shows the Q-factor as a function of transmission reach, where each data-point is taken at NLT. It can be seen that the maximum distance, without DPE, that could be traversed by PM-4QAM, PM-8QAM and PM-16QAM channels, at pre-FEC threshold, is ~8000km, ~4700-km and ~2900km, respectively (without DPE), and ~9700km, ~6000km and ~3700km, respectively. These results confirm the twofold advantage of our simple DPE approach
1) The increased baud rate allows for higher FEC-OH, and lower pre-FEC threshold
2) DPE partially mitigates channel nonlinearities across any given distance. The presented results are of utmost importance and confirm that at the cost of up to 1dB penalty, the FEC-OH may be adequately enhanced, allowing to bridge long-haul and ultra-long-haul distances for advanced modulation formats.

IST IP IDEALIST (Industry-Driven Elastic and Adaptive Lambda
Infrastructure for Service and Transport Networks)
D2.3 – Final Version
Page 65 of 89
Figure 3-16: Q-factor as a function of transmission reach. Open: without DPE, Solid: with DPE. Horizontal lines represent pre-FEC Q-threshold (see text). Each data point
at optimum launch power.
Having established maximum transmission reach at pre-FEC threshold for various
configurations, in Figure 3-17 we explore the DPE dependency on distance, and plot the Q-
improvements, enabled by DPE, as a function of transmission reach. It can be clearly seen
that DPE enables greater improvements at shorter reach, and the performance benefits
saturate as longer links are traversed. In particular, in Figure 3-17(a), PM-16QAM enables
maximum improvement of up to ~1.6dB, which saturates to ~0.8dB after ~11 spans. On the
other hand, PM-8QAM and PM-4QAM almost show no dependency on reach due to higher
traversed reach, essentially higher accumulated dispersion, dominating the nonlinearity
averaging effects. However, in Figure 3-17(b), this trend is more pronounced, and a clear
improvement can be seen for transmission below 11 spans, irrespective of the modulation
order. Also note that, similar to Figure 3-15, even after DPE gain saturation, the Q-factor
improvement after nonlinear transmission is greater than back-to-back transmission (see
insets). These results may be attributed to channel nonlinearity compensation by the DPE
filter, where higher frequencies are enhanced to mitigate low-pass DAC impact. In time-
domain this translates to rapidly dispersing pulses, allowing for better averaged intra-
channel nonlinear effects and larger walk off for inter-channel nonlinearities. In case of
dispersion unmanaged long haul transmission, such nonlinear averaging may be
intrinsically achieved, however for shorter distances substantial advantages may be
gained, as observed in Figure 3-17.
These results provide an interesting and practical outcome of DPE, confirming that transmitter based DPE not only mitigates DAC induced signal distortion, but also enables better nonlinear channel performance. Using Figure 3-16 and Figure 3-17, performance regimes for different modulation and baud rates may be established, where gain of DPE in terms of higher FEC-OH and nonlinearity compensation may be recognized.

IST IP IDEALIST (Industry-Driven Elastic and Adaptive Lambda
Infrastructure for Service and Transport Networks)
D2.3 – Final Version
Page 66 of 89
Figure 3-17: Q-improvement as a function of transmission reach. Inset: Back-to-Back performance improvement. Each data point at optimum power.
Finally, we report in Figure 3-18 the Q-factor as a function of channel spacing, targeting reach at BER = 10-3 (Q-factor of ~9.8dB) for PM-16QAM (560km 7 spans). It can be clearly seen that the minimum required channel spacing is ~1.2 x Baud Rate, and that beyond this saturation point, transmission performance, both with and without DPE, is independent of channel spacing. However, when channel spacing is below 1.2xBaud rate, the performance is severely limited by linear and nonlinear channel crosstalk. In this case, the performance improvements from DPE are diminished, confirming that DPE is not importantly effective when compensating for inter-channel nonlinearities, and that our algorithm does not provide significant improvement in case of high linear inter-carrier crosstalk. Furthermore, similar trends are seen for both high and low baud rate transmission regimes.
The above analysis confirms that as far as channel nonlinearity mitigation is concerned, simple DPE filter is unable to mitigate inter-channel fiber nonlinearities, however it works well for intra-channel nonlinear mitigation. This is consistent with our earlier hypothesis that higher frequency enhancement leads to increased pulse spread, allowing for better intra-channel nonlinear averaging. Recently, this phenomenon was also observed in context of special pulse-design, termed as M-shaped pulses [Xu-OFC14], which further verifies our

IST IP IDEALIST (Industry-Driven Elastic and Adaptive Lambda
Infrastructure for Service and Transport Networks)
D2.3 – Final Version
Page 67 of 89
findings. Nonetheless, our approach of DPE enables the nonlinear suppression at no additional hardware cost.
Figure 3-18: Q-factor as a function of channel spacing for a PM-16QAM after 560km. Open: without DPE, Solid: with DPE. Each data point at optimum power.
3.2.5.3 Experimental verification
An experimental verification of the previous techniques has been carried out in [Rahman-ECOC2014a], where a 1.15Tb/s signal formed by quad carriers PM-16QAM (at 36GBd/s) was transmitted over two different optical fibers (SSMF and large-effective area pure core silica fiber). The setup, detailed in [Rahman-ECOC2014a], considers a 92GSamples/s DAC, and it employs a scope with ~20GHz, with transfer function as displayed in Figure 3-19.
Figure 3-19: Transfer function of DAC and driver.
0 4 8 12 16 20 24 28 32
-18
-15
-12
-9
-6
-3
0
Frequency [GHz]
|Y|
[dB
]
HI
HQ
VI
VQ

IST IP IDEALIST (Industry-Driven Elastic and Adaptive Lambda
Infrastructure for Service and Transport Networks)
D2.3 – Final Version
Page 68 of 89
Figure 3-20: Reach analysis.
The performance is reported in Figure 3-20 as BER vs. distance, for the two fibers, with and without DPE.
If we assume a pre-FEC threshold Q² = 5.16dB (blue dashed line) using pre-compensation, the maximum reach improves from 633km to 949km for SSMF. In this case, the maximum reach is limited by larger attenuation and nonlinear coefficient of SSMF. Due to a larger effective area, lower attenuation coefficient and lower nonlinear coefficient, maximum reach with PSCF without pre-compensation is 1459km; which is increased to 2272km with pre-compensation at pre-FEC threshold. The nonlinear effects are also minimized for PSCF as a result of a larger value of dispersion coefficient (21ps/nm/km) as compared to SSMF (16ps/nm/km). In case we assume a higher pre-FEC Q² of 6.43dB (BER of 1.8x10⁻²) a maximum reach of 537km/ 230km with/without pre-compensation for SSMF and 1154km/ 602km with/ without pre-compensation for PSCF is achieved.
To conclude we show that using pre-compensation of commercially available DAC, driver amplifier and IQ-modulator using zero-forcing type equalizer structure, WDM transmission of 36GBd/s four subcarrier PM-16QAM 1Tb/s superchannel with 5bit/s/Hz is feasible.
At a pre-FEC Q² of 5.16dB, an improvement in reach of 316km for SSMF (~50%) and 813km for PSCF (~56%) is demonstrated. The maximum transmission reach of 2272km was achieved for PSCF: sufficient for a long-haul network scenario.
3.3 Long haul applications
3.3.1 Single-carrier NWDM 1Tbit/s experiment
In order to respond to continuous capacity increase, the field of high spectral density and high data-rate systems has been the focus of significant research. In deliverable D2.1, we already achieved a 1Tbit/s experiment in [Renaudier-ECOC13] with a superchannel made up of 4 subcarriers. Going now further, we propose the use of spectral slice synthesis technique to successfully demonstrate the first 1Tbit/s line rate single-carrier transmission [Mardoyan-OFC15]. By doing so, the transmitter generates a record symbol rate of 127.9GBd/s with PM-16QAM signals.
0 500 1000 1500 2000 2500 30004
5
6
7
8
9
Distance [km]
Q2 [
dB
]
SSMF:w/o pre-comp.
SSMF:w/ pre-comp.
PSCF:w/o pre-comp.
PSCF:w/ pre-comp.
3.5x10⁻²
1.8x10⁻²

IST IP IDEALIST (Industry-Driven Elastic and Adaptive Lambda
Infrastructure for Service and Transport Networks)
D2.3 – Final Version
Page 69 of 89
Combining optical and digital signal processing, we realized a transmitter capable of generating 1Tbit/s Nyquist-shaped signal, occupying an optical bandwidth of 128GHz. The 1Tbit/s line rate single-carrier signal has been transmitted over 3,000 km of low loss large effective area fibers with EDFA only using a 65GHz coherent receiver with soft decision forward error correction.
In our approach, we divide digitally (i.e. filter) the spectrum of a PDM-16QAM signal into three slices of equal width. Each of them corresponds to a portion (one third) of the overall single-carrier spectrum and is engineered through a separate set of I/Q modulators driven by digital-to-analog converters.
Figure 3-21: Optical and digital signal processing for transmitter generation based on spectral slices engineering.
Figure 3-21 shows the transmitter configuration. We use an external cavity laser (ECL) with 100kHz linewidth followed by a Mach-Zehnder Modulator fed with a sinus wave at a frequency of 42.63GHz (one third of the symbol rate) from an external clock generator. This scheme produces multiple coherent spectral lines, equally-spaced by 42.63GHz, which are amplified and demultiplexed by an optical flexible filter (Waveshaper®) with 40dB suppression ratio. Only three lines are filtered out, passed into three single-polarization I/Q modulators, fed with electrical waveforms from 8-bit DACs operating at 65 GSample/s and triggered by the same reference clock at 10 MHz as that of external synthesizer.
Figure 3-22: (left) Performance versus OSNR at 127.9 GBd and (right) transmission performance versus distance.
We evaluated the back-to-back performance of the generated 127.9GBd/s PM-16QAM signals and compare it to a 127.9GBd/s PM-QPSK, generated with the same equipment.

IST IP IDEALIST (Industry-Driven Elastic and Adaptive Lambda
Infrastructure for Service and Transport Networks)
D2.3 – Final Version
Page 70 of 89
Figure 3-22(left) shows the Q²-factor versus OSNR measured in 0.1nm. Dashed lines indicate the corresponding theoretical expectations. With PM-QPSK modulation, we observe 0.7dB penalty with respect to theory for a line rate of 511.6Gbit/s and no error floor in the investigated range, thus validating the transmitter performance. With PM-16QAM, we observed an error floor around 6.8dB Q²-factor, owing to the higher sensitivity of 16QAM format to transmitter and receiver imperfections. We also measured 5dB penalty on the required OSNR to meet the 4.85dB FEC-limit, when compared to theory.
To validate the transmitter design, including Tx/Rx signal processing, we demonstrate the transmission of the 1Tbit/s signal over a long-haul distance. The signal from the transmitter is boosted through an EDFA and sent into a recirculating loop together with thirty 50GHz spaced PM-16QAM channels modulated at 48GBd/s used for amplifier loading. The loop is composed of twelve 50km-long spans composed of two different Corning® Vascade® fibers. Fiber losses are compensated by EDFAs. At the receiver end, our 1Tbit/s channel is selected using a wavelength selective switch and sent into our coherent receiver. After coherent demodulation, the signal enters a 27.3% overhead SD-FEC. We show in Figure 3-22(right) the performance results versus transmission distance for the single carrier 1Tbit/s line rate channel. After 3000km, the measured performance is above FEC limit.
In conclusion, we generate and detect of the first 1Tbit/s line rate single-carrier signal with Nyquist pulse shaping and PM-16QAM modulation using a synthesis technique based on spectral slice engineering over 3000km.
3.3.2 Transmission scheme comparison: NWDM vs. TFP
Within IDEALIST we planned to investigate several transmission techniques, namely Nyquist WDM (NWDM), Time-Frequency-Packing (TFP), and optical OFDM. Each technique has its pro and contra and targets specific application scenarios. So far, the first two have been meant mainly for long-haul transmission, while Optical-OFDM has been more investigated (but is not limited to) metro networks.
Consequently we decided to carry out a joint experiment among CNIT, Coriant and TU/e at Coriant Lab in Munich to directly compare NWDM vs. TFP. The experiment assumed that only the DSP was different (for NWDM and TFP), while the hardware (from the DAC to the ADC, including the fiber) was identical.
The experiment was successful and it confirmed our expectations that each transmission technique has his advantages and disadvantages. Three major articles to be submitted to IEEE/OSA are under preparation and this will be detailed in next deliverable D2.4.
3.4 MAN use case
The flexible architecture depicted in the previous deliverable [IDEALIST-D2.2] can be applicable to core, border but also metro node. Indeed, the different functional blocks can be adapted to implement a high degree of elastic transmission data rate. The first subsection presents a sliceable BVT fine tuned for the metro area network with OFDM technique. Next we present an alternative set of modulations for low cost modulator devices. These low cost components and solutions are particularly suitable for metro networks.

IST IP IDEALIST (Industry-Driven Elastic and Adaptive Lambda
Infrastructure for Service and Transport Networks)
D2.3 – Final Version
Page 71 of 89
3.4.1 OFDM-based S-BVT
The advent of elastic optical networks and the advance of transmission techniques in terms of flexibility and capacity has led to undertake new challenges and goals, enabling the introduction of sliceable superchannels as well as the reduction of channel width for low bit rate connections. This granularity is especially useful for an aggregation network. Precisely, the adoption of flexgrid technologies improves spectrum utilization and network efficiency, while reducing CapEx investment. Thus, an evolutionary approach for the metro/regional network segment has been envisioned and novel scenario proposals have been investigated [Svaluto-ONDM14].
Lately, main network operators are expanding their photonic mesh to the regional networks. So, it has been proposed to extend the aggregation network reach, typically confined in a metropolitan area. This implies the creation of a conveniently dimensioned pool of virtual BRASes co-located with IP core transit routers in the same data center in order to further reduce the cost. In this scenario, it is expected to have a vast number of low bit rate connections from Multi-Tenant Units (MTUs) to the virtual BRASes, featuring a highly centric traffic pattern.
For this metro scenario, using technologies for core networks is overkill, since the requirements are substantially different. Precisely, a more cost-effective solution is required. In this sense, flexgrid technologies offer interesting features, such as the ability of concurrently serving multiple destinations by means of the individual control of its carriers, forging the Sliceable Bandwidth Variable Transceiver (S-BVT) concept [Svaluto-ONDM14]. For BRAS centralization in a regional network, the S-BVT must be both cost-effective and robust against transmission impairments, in order to support multiple low bit rate connections over regional optical paths of hundreds of km.
A first study was reported in [IDEALIST-D2.1] and [Svaluto-ONDM14]. There, a cost-effective BVT design was numerically and experimentally assessed. Limiting factors, such as PAPR, available bandwidth, dispersion impairments and linearity of the subsystem components were taken into account in the BVT design guidelines. Also, bit loading schemes and guard band minimizing were proposed for distance adaptive transmission, considering up to 10Gbit/s connections and 12.5GHz channels.
In order to further enhance the cost effectiveness, an asymmetric transmission architecture has been investigated, also coping with the proposed requirements. This is shown in Figure 3-23. The solutions approached are envisioned to give service to several MTUs using cost-effective S-BVT(s) at the BRAS side, able to support multiple low bit rate connections over regional optical paths. Along a different line, simple BVTs transmitting amplitude modulated DMT signals and featuring direct detection are envisioned at the MTU side.
For the BRAS-MTU connection (downstream), a multiband approach in combination with optical Single-SideBand (SSB) is proposed. The cost-effective software-defined S-BVT is based on digitally processed Multiple Band OFDM (MB-OFDM), as described in [Svaluto-ECOC14]. An array of modulators generates N slices that can be directed towards different destinations nodes, as shown in Figure 3-23. Each MB-OFDM BVT (S-BVT building block) serves a number of MTUs (M) with a single optoelectronic front-end. The number of MTUs per MB-OFDM slice is mainly limited by the bandwidth of digital-to-analog converter (DAC) and optoelectronic components. The MB-OFDM digital signal processing (DSP) supports multiple m-QAM formats. By considering narrow sub-bands, the flexibility and spectral efficiency can be enhanced, and the DSP requirements relaxed. Furthermore, the mixing between optical carrier and OFDM signal can also be reduced by properly adjusting the

IST IP IDEALIST (Industry-Driven Elastic and Adaptive Lambda
Infrastructure for Service and Transport Networks)
D2.3 – Final Version
Page 72 of 89
MZM biasing point [Svaluto-ECOC13]. For a software-defined OFDM band tuning over the spectrum, the radio frequency (RF) mixing is performed in the digital domain, resulting in a cost-effective solution (no additional hardware). Each OFDM slice is capable to serve up to
5 or 6 MTUs with a single optoelectronic block (corresponding to a single optical carrier n). Cost effective direct detection (DD) is used at the MTU receiver. Thus, longer elastic optical paths can be supported, with the proposed combination of SSB modulation and DD, thanks to the enhanced robustness to chromatic dispersion (CD), compared to double sideband transmission. As a preliminary assessment of the proposed architecture, extensive simulations have been performed considering TID network. Particularly, SSB transmission of 10Gbit/s connections over the longest worst path (545km and 6 hops, according to WP1 analysis) has been successfully direct detected. More details of this implementation can be found in [Svaluto-ECOC14].
Figure 3-23: Transmission architecture based on OFDM S-BVT for MAN investigated within the IDEALIST project.
Likewise, a simple and cost-effective scheme based on optical Discrete Multitone (DMT) is proposed for the transmitter at each MTU. As chromatic dispersion can severely affect DMT systems, it is proposed to combine DMT transmission with shared coherent reception at the S-BVRx located at the BRAS. The proposed upstream transmission system architecture is also shown in Figure 3-23. At the BRAS S-BVT, a spectrum selective switch (SSS) distributes the slices of the received flow (aggregating the traffic from several MTUs) to a bank of bandwidth variable coherent receivers (BVCo-Rxs), whose number (N) determines the S-BVT total capacity. Similarly to the connections between the BRASes and the MTUs, also different MTUs can be served by a single optoelectronic block at the BRAS S-BVRx. In fact, closely spaced MTU channels can be received by using a single local laser at the BRAS coherent receiver and further digitally processed by the corresponding MB-OFDM signal processing block. There, a preliminary digital radio frequency (RF) down-conversion step per each MTU connection/channel, followed by the proper demodulation DSP is required, enabling a fine tuning over the spectrum. Multiple
S-BVRx
BVT
@ MTU node-N
DAC1
DMT
BVTx1 DSP
k
TLS-k
MZMk
BVTx
BVT @ MTU node-k
+
-
+
-
+
-
+
-
MB-OFDMBVRx1
DSPADC1
TLO-1
.
.
.
+
-
+
-
+
-
+
-
MB-OFDMBVRxN
DSP
TLO-N
Coherent Rx 1
Coherent Rx N
S-BVT @ BRAS node
1
OpticalDistributor
Flexgrid Optical
Regional NetworkBVRx
NADCN
DAC1
MB-OFDM
BVTx1 DSP
1
TLS-1
DACN
MB-OFDM
BVTxN DSP
MZM1
.
.
.
SSB
Filter
N
TLS-N
MZMNSSB
Filter
S-BVTx
OpticalAggregator
MB-OFDM
BVRxk DSPADCk
BVT
@ MTU node-1
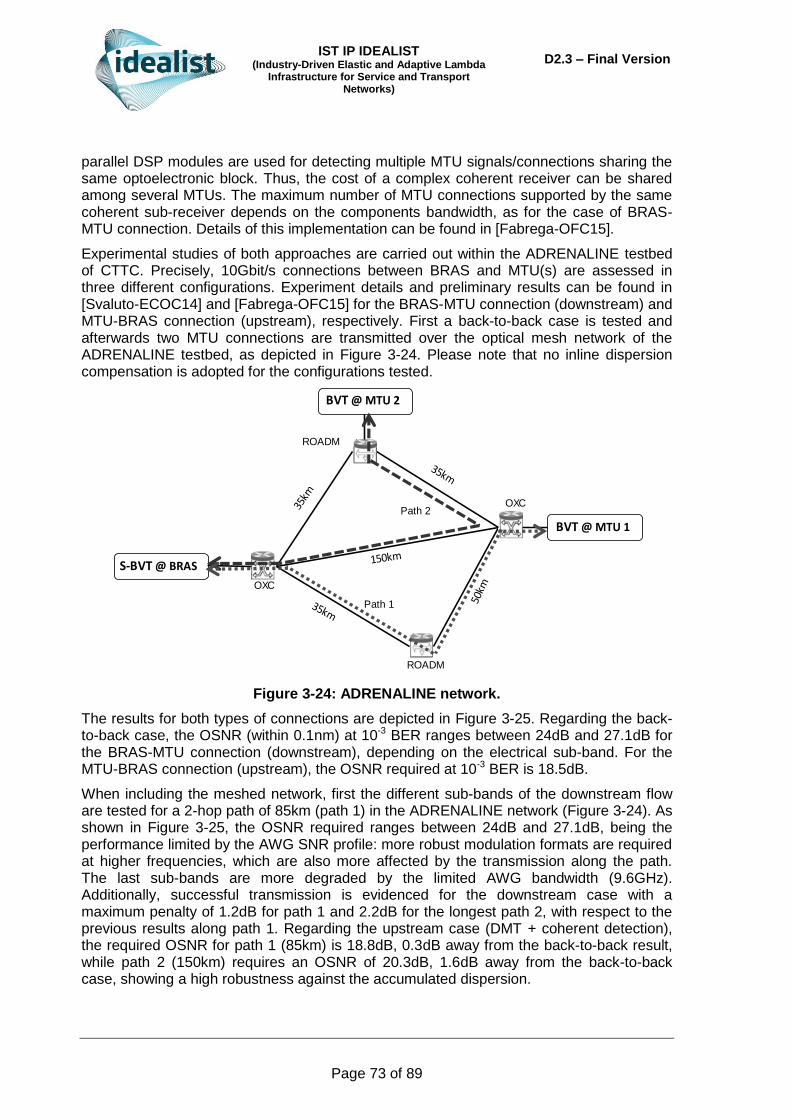
IST IP IDEALIST (Industry-Driven Elastic and Adaptive Lambda
Infrastructure for Service and Transport Networks)
D2.3 – Final Version
Page 73 of 89
parallel DSP modules are used for detecting multiple MTU signals/connections sharing the same optoelectronic block. Thus, the cost of a complex coherent receiver can be shared among several MTUs. The maximum number of MTU connections supported by the same coherent sub-receiver depends on the components bandwidth, as for the case of BRAS-MTU connection. Details of this implementation can be found in [Fabrega-OFC15].
Experimental studies of both approaches are carried out within the ADRENALINE testbed of CTTC. Precisely, 10Gbit/s connections between BRAS and MTU(s) are assessed in three different configurations. Experiment details and preliminary results can be found in [Svaluto-ECOC14] and [Fabrega-OFC15] for the BRAS-MTU connection (downstream) and MTU-BRAS connection (upstream), respectively. First a back-to-back case is tested and afterwards two MTU connections are transmitted over the optical mesh network of the ADRENALINE testbed, as depicted in Figure 3-24. Please note that no inline dispersion compensation is adopted for the configurations tested.
Figure 3-24: ADRENALINE network.
The results for both types of connections are depicted in Figure 3-25. Regarding the back-to-back case, the OSNR (within 0.1nm) at 10-3 BER ranges between 24dB and 27.1dB for the BRAS-MTU connection (downstream), depending on the electrical sub-band. For the MTU-BRAS connection (upstream), the OSNR required at 10-3 BER is 18.5dB.
When including the meshed network, first the different sub-bands of the downstream flow are tested for a 2-hop path of 85km (path 1) in the ADRENALINE network (Figure 3-24). As shown in Figure 3-25, the OSNR required ranges between 24dB and 27.1dB, being the performance limited by the AWG SNR profile: more robust modulation formats are required at higher frequencies, which are also more affected by the transmission along the path. The last sub-bands are more degraded by the limited AWG bandwidth (9.6GHz). Additionally, successful transmission is evidenced for the downstream case with a maximum penalty of 1.2dB for path 1 and 2.2dB for the longest path 2, with respect to the previous results along path 1. Regarding the upstream case (DMT + coherent detection), the required OSNR for path 1 (85km) is 18.8dB, 0.3dB away from the back-to-back result, while path 2 (150km) requires an OSNR of 20.3dB, 1.6dB away from the back-to-back case, showing a high robustness against the accumulated dispersion.
OXC
OXC
ROADM
ROADM
Path 2
Path 1
BVT @ MTU 2
BVT @ MTU 1
S-BVT @ BRAS

IST IP IDEALIST (Industry-Driven Elastic and Adaptive Lambda
Infrastructure for Service and Transport Networks)
D2.3 – Final Version
Page 74 of 89
a)
b)
Figure 3-25: Experimental results for BRAS-MTU connection (a) and MTU-BRAS connection (b).
In summary, cost-effective flexgrid technologies have been assessed for a MAN scenario with centralized BRASes. Experimental results show successful 10Gb/s net connections from BRASes to the MTUs and vice versa, when serving different paths and covering distances up to 185km. Thus, the proposed architectures for up/downstream communication offers a promising solution for serving the multiple endpoints using S-BVT(s) at the BRASes according to the topology requirements.
3.4.2 Alternative modulations for low cost modulators
Intensity modulators are good candidates for integrated high bit-rate interfaces [Kang-Opt.Express07] for low cost metro solutions. In this study, we numerically investigate the best possible modulations we can achieve with two phase-rotated intensity modulators. The output of this study has recently been published in [Antona-ECOC14].
At OFC’14, we demonstrated a record monolithic integrated 1D transmitter capable of generating 56Gbaud modulation formats [De Valicourt-ECOC14] as complex as bipolar 4PAM (Pulse Amplitude Modulation), by combining two intensity (electro-absorption) modulators with a prefixed differential phase rotation [Kang-Opt.Express07] (or mutual
angle) of π. Such modulation format is ~4dB less tolerant to noise than 2D QPSK.
Moving to 2D, we then studied the general case of modulation formats generated by two phase-rotated intensity modulators called NQIM constellations, for Non-Quadrature
Intensity Modulation (or QIM with π/2 angle), as in Figure 3-26, with mutual angle .
Figure 3-26: Left: Transmitter set-up of the -NQIM formats.
Middle: 4--NQIM constellation (ideal modulators). Right: 8-NQIM constellation.
We investigated 4, 8 and 16 symbol constellations and stressed the optimum mutual angle of 2π/3. For the 4-symbol format, the constellation has the shape of a Diamond.
00 01
1110
00 01
1110
First IM
axis
First IM
axis
0
Intensity
modulator 1
Intensity
modulator 2DATA
+
a) -NQIM Modulation scheme b) 4 -NQIM
c) 4 -NQIM w/ finite Extinction Ratio d) 8 -NQIM
First IM
axis
Laser
001 011
111010000
100 110 101
00 01
1110
First IM
axis
00 01
1110
00 01
1110
First IM
axis
First IM
axis
0
Intensity
modulator 1
Intensity
modulator 2DATA
+
a) -NQIM Modulation scheme b) 4 -NQIM
c) 4 -NQIM w/ finite Extinction Ratio d) 8 -NQIM
First IM
axis
Laser
001 011
111010000
100 110 101

IST IP IDEALIST (Industry-Driven Elastic and Adaptive Lambda
Infrastructure for Service and Transport Networks)
D2.3 – Final Version
Page 75 of 89
Figure 3-27: Left: Required electrical SNR to ensure different BERs (2 10-2, 4 10-3, and
10-5) versus angle for 4 -NQIM formats. Plots = Monte-Carlo simulations, straight lines = analytical BER formula. Horizontal lines correspond to 4PAM.
Right: Diamond 4-NQIM constellation.
In theory, with ideal intensity modulators, the “Diamond” 4-NQIM format yields an OSNR sensitivity 2.3dB worse than for QPSK, while 1.7dB better than 4PAM and 0.7dB better
than 4-QIM (mutual angle of π/2), see Figure 3-28(left). In practice, however, this format requires modulation extinction ratios higher than 15dB to really outperform 4PAM.
With higher order modulations, the promising NQIM formats always outperform the PAM whatever the extinction ratio, see Figure 3-28(right). Assuming 12dB extinction ratio, NQIM yields OSNR sensitivity worse than 8QAM (with a constellation like 8-SP-16QAM) by 4.7dB and better than 8PAM by 2.2dB.
Figure 3-28: Required SNR as a function of the extinction ratio for (left) 4-symbol, (right) 8-symbol constellations. Circles / diamonds for PAM / 2π/3-NQIM respectively.
Such types of modulators could thus be a basis for low cost, short reach elastic interfaces.
7 dB
9 dB
11 dB
13 dB
15 dB
17 dB
19 dB
0.00 π 0.33 π 0.67 π 1.00 π
Re
q. S
NR
for
giv
en
BE
R (d
B)
Angle (rad)
BER 10-5
BER 4.10-3
BER 2 10-2
BER 10-5
11
00 01
10
First IM
axis
Second IM axis
Diamond 4-2/3-NQIM
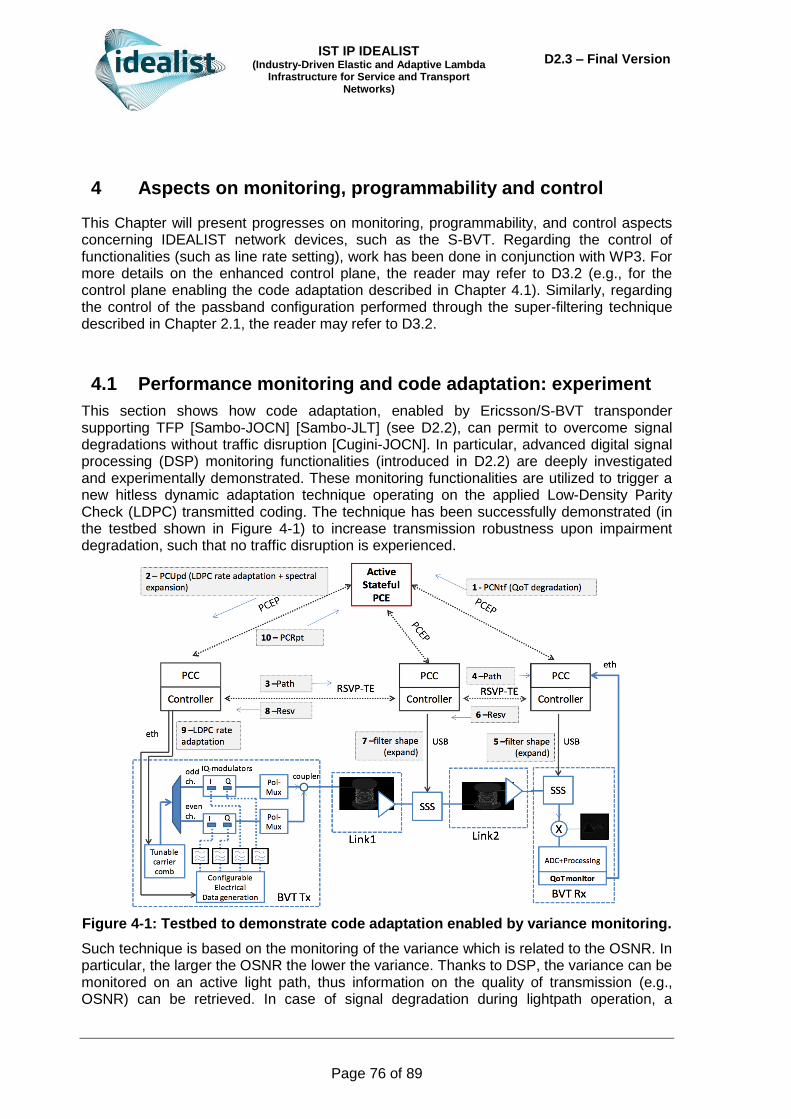
IST IP IDEALIST (Industry-Driven Elastic and Adaptive Lambda
Infrastructure for Service and Transport Networks)
D2.3 – Final Version
Page 76 of 89
4 Aspects on monitoring, programmability and control
This Chapter will present progresses on monitoring, programmability, and control aspects concerning IDEALIST network devices, such as the S-BVT. Regarding the control of functionalities (such as line rate setting), work has been done in conjunction with WP3. For more details on the enhanced control plane, the reader may refer to D3.2 (e.g., for the control plane enabling the code adaptation described in Chapter 4.1). Similarly, regarding the control of the passband configuration performed through the super-filtering technique described in Chapter 2.1, the reader may refer to D3.2.
4.1 Performance monitoring and code adaptation: experiment
This section shows how code adaptation, enabled by Ericsson/S-BVT transponder supporting TFP [Sambo-JOCN] [Sambo-JLT] (see D2.2), can permit to overcome signal degradations without traffic disruption [Cugini-JOCN]. In particular, advanced digital signal processing (DSP) monitoring functionalities (introduced in D2.2) are deeply investigated and experimentally demonstrated. These monitoring functionalities are utilized to trigger a new hitless dynamic adaptation technique operating on the applied Low-Density Parity Check (LDPC) transmitted coding. The technique has been successfully demonstrated (in the testbed shown in Figure 4-1) to increase transmission robustness upon impairment degradation, such that no traffic disruption is experienced.
Figure 4-1: Testbed to demonstrate code adaptation enabled by variance monitoring.
Such technique is based on the monitoring of the variance which is related to the OSNR. In particular, the larger the OSNR the lower the variance. Thanks to DSP, the variance can be monitored on an active light path, thus information on the quality of transmission (e.g., OSNR) can be retrieved. In case of signal degradation during lightpath operation, a

IST IP IDEALIST (Industry-Driven Elastic and Adaptive Lambda
Infrastructure for Service and Transport Networks)
D2.3 – Final Version
Page 77 of 89
possible increase of the variance (e.g., due to amplifier malfunction) can be detected before the level of BER overtakes the threshold of acceptability. Then, the control plane can automatically set a more robust code without incurring in data loss because of signal degradation.
Figure 4-2(a-c) show a relation between the variance of the acquired samples as function of OSNR. Such relation is obtained through measurements on the testbed in Figure 4-1. The figures also show, for different codes, the OSNR range of use where the applied code can successfully operate (solid line), i.e. error free after decoding. Note that the variance does not depend on the applied LDPC code.
Figure 4-2: Variance of the acquired samples as a function of the OSNR for different codes (a:8/9, b:4/5, c:3/4) the OSNR range of use where the applied code can
successfully operate is reported (solid line). The OSNR warning threshold is set opportunely at a certain margin from working limit condition. Then, the
corresponding value of variance is established as threshold for monitoring operation.
For each code, an OSNR threshold is identified at a certain margin (i.e. 1dB) from the minimum OSNR required for error free operations. Monitoring of variances then reveals

IST IP IDEALIST (Industry-Driven Elastic and Adaptive Lambda
Infrastructure for Service and Transport Networks)
D2.3 – Final Version
Page 78 of 89
any OSNR degradation and indicates whether the working-limit condition is approaching for the code in use. Therefore, such monitoring system is able to predict OSNR degradation in advance, before reaching the working limit condition. If the OSNR degradation exceeds the threshold and remains within the margin (e.g., 0.07 for 8/9 coding), no post-FEC bit error rate (BER) degradation is experienced, but a warning alarm is locally triggered to switch to a more robust code before post-FEC errors occur.
The demonstration of code adaptation upon signal degradation is performed. The testbed implements up to 1Tb/s transmission through 7 carriers at up to 160Gbit/s PM-QPSK (40 GBd/s) as in CNIT/Ericsson S-BVT of D2.2 or [Sambo-JLT]. The transmission relies on TFP through configurable LDPC coding with coherent detection. During operation of the Tera connection, OSNR degradation is induced in the path by increasing the attenuation of a variable optical attenuator (VOA) at the input port of the EDFA placed on Link2 of Figure 4-1. A variance increase is detected and an alarm in the control plane is created (by extending the PCEP Ntf message). LDPC coding adaptation from 8/9 to 4/5 is computed to react to the signal degradation.
Work in WP4 will show the integrated data and control planes working in conjunction upon signal degradation and avoiding loss of data.
4.2 Programmable and asymmetric multi-wavelength source
S-BVT programmability was introduced in D2.2, in particular in Chapter 5.6. Programmable functionalities such as code adaptation, line rate settings, number of carriers, equalization, etc. were also demonstrated in Chapter 6.
In this section, we mainly focus on the programmability of the Subcarrier Generation module (where N unmodulated subcarriers are generated) of the general S-BVT architecture (see D2.2) when it is based on a multi-wavelength source. The work on multi-wavelength has been presented in [Sambo-ECOC].
Typically, several laser sources are adopted in the Subcarrier Generation, each one to generate a subcarrier. Alternatively, a Multi-Wavelength source (MW, i.e. a source able to create several subcarriers from a single laser) [Anandarajah-OFC] could be used. MW may reduce the number of adopted lasers, thus costs. Moreover, MW does not suffer from cross-talk among subcarriers due to the drift of the laser, since the spacing among subcarriers is rigid. However, MW may present some limitations. First, MW typically requires filters to extract subcarriers generated by the comb (see Figure 4-3(a)). Moreover, the generated subcarriers may be intrinsically contiguous in the spectrum and also with the same channel spacing (B in Figure 4-3(a)), implying limitations in the Routing and Spectrum Assignment (RSA).
In this section, we present and demonstrate a programmable SBVT based on MW source, generating subcarriers with asymmetric channel spacing (as in Figure 4-3(b)). No filter is required to extract subcarriers for modulation. Moreover, generated subcarriers are not required to be contiguous in the spectrum. Channel spacing is programmed by extended SDN control plane. Experiments are reported for a 480Gbit/s S-BVT controlled by SDN. First slice-ability of three optical flows, each one at 160Gbi/s, with asymmetric channel spacing is demonstrated. Then, a 3-subcarriers-based superchannel at 480Gbit/s is validated. BER of 10−5 is achieved.
For more details related to the control plane and the work done in conjunction with WP3, the reader may refer to [Sambo-ECOC].

IST IP IDEALIST (Industry-Driven Elastic and Adaptive Lambda
Infrastructure for Service and Transport Networks)
D2.3 – Final Version
Page 79 of 89
4.2.1 S-BVT based on programmable and asymmetric multi-wavelength with extended SDN
The architecture is summarized in Figure 4-3(c). Centralized SDN controls the data plane— i.e. the 480Gbit/s S-BVTs, both at the transmitter and receiver side, and node (based on spectrum selective switches —SSSs) configuration. The transponder at the transmitter side is based on a Programmable and Asymmetric Multi-Wavelength (PAMW) source generating three subcarriers. Then, it includes a Low Density Parity Check (LDPC) encoder (used by TFP in the Ericsson/CNIT S-BVT), three PM-QPSK transmitters, each one modulating a subcarrier and achieving 160Gbit/s PM-QPSK, and a coupler to multiplex the modulated subcarriers. As a possible node architecture, in this study we consider the one based on broadcast and select (see ingress node in Figure 4-3(c)). Thus, any signal coming into the node is split, broadcasted to all the ports, and selected by SSSs. Slice-ability is supported thanks to SSSs, i.e. the subcarriers are selected by a specific port through the proper configuration of the SSS passband, while they are blocked by the other SSSs. The figure shows that the optical flows may follow three different paths p1, p2, and p3. At the receiver side, the transponder is composed by three coherent receivers, one for each possible subcarrier. For each coherent receiver, a tunable laser used as Local Oscillator (LO) must be tuned in order to match the proper subcarrier. As a result, two optical signals beat into the opto/electronic conversion module providing four analog electrical signals. Analog-to- Digital (ADC) conversion is performed and digital signal processing (DSP) is used. Each receiver includes an LDPC decoder.
The PAMW architecture generating three subcarriers is shown in Figure 4-3(d). The architecture is based on IQ modulators driven by radio frequency (RF) clocks and configured as Single Side Band suppressed carrier modulation generation (SSB-G). A tunable laser (TL) provides the central sub- carrier at frequency f0. Then, the subcarrier at f0 is split in three branches, thus finally having three subcarrier copies. One is kept at f0, while the other two are shifted in frequency exploiting SSB-G. RF clocks f1 and f2 determine the subcarrier spacing. In particular, SSB is achieved as follows. A relative phase difference of π/2 is introduced to RF while entering into the inputs of the IQ modulator. The shift towards higher or lower frequencies (e.g., ±f1) is achieved with proper configuration of the IQ bias by introducing a phase difference of +π/2 or −π/2. Both symmetric and asymmetric carrier spacing can be achieved by choosing appropriate RF clocks. Finally, three subcarriers are obtained at f0, f0 − f1, and f0 + f2.
Specific control plane extensions have been proposed to control the programmability of such a source, thus work has been done in conjunction with WP3.

IST IP IDEALIST (Industry-Driven Elastic and Adaptive Lambda
Infrastructure for Service and Transport Networks)
D2.3 – Final Version
Page 80 of 89
Figure 4-3: (a) MW with symmetric channel spacing and filtering; (b) PAMW and asymmetric channel spacing; (c) SDN-controlled network (testbed) including PAMW-
based SBVT; (d) Experimented PAMW architecture.
4.2.2 Experimental demonstration
The proposed S-BVT based on PAMW and controlled by extended SDN is demonstrated through two experiments. Related measurements and control plane message capture are reported in Figure 4-4. The network testbed and the PAMW are described in Figure 4-3(c) and (d), respectively. PM-QPSK transmitters and the implemented receiver with LDPC code are described in D2.2 or [Sambo-JLT]. The first experiment demonstrates the slice-ability of the SBVT and the asymmetry of channels generated by PAMW. Three 160Gbit/s PM-QPSK channels are generated. Two channels are spaced by 25GHz, while the third one is spaced out by the central channel of 37.5GHz. Figure 4-4(a) and (b) show the spectrum at the output of the PAMW source, before modulation, for the subcarriers f0−f1 (with f1=37.5GHz),and f0+f2 (with f2= 25GHz), when f0=192.8125THz. In this case, we obtained a side band suppression of about 15 dB for f0+f2 (Figure 4-4(b)) and more than 20dB for f0−f1 (Figure 4-4(a)). In both cases f0 was suppressed by more than 20dB (Figure 4-4(a) and (b)). Figure 4-4(c) shows the spectrum, after the coupler (Figure 4-4(c)), of the modulated subcarriers with asymmetric spacing. Such subcarriers are then filtered and sliced by the SSSs in Figure 4-4(c) with a ITU-T flexgrid bandwidth of 25GHz. Figure 4-4(d) shows BER measurements vs. OSNR for the three subcarriers, named ch1, ch2, and ch3, after transmission along different paths of 80, 70 and 70km. For all the tree connections, a BER lower than 10−5 is achieved for the OSNR of the paths (i.e., the maximum OSNR). In the second experiment, superchannel is demonstrated: S-BVT and MW are programmed to generate a 480Gbit/s superchannel, composed by 3 × 160Gbit/s subcarriers spaced by 20GHz (totally 60GHz), within an ITU-T flex- grid frequency slot of 62.5GHz. Figure 4-4(e) shows the spectrum of the modulated superchannel after the coupler. Figure 4-4(f) shows
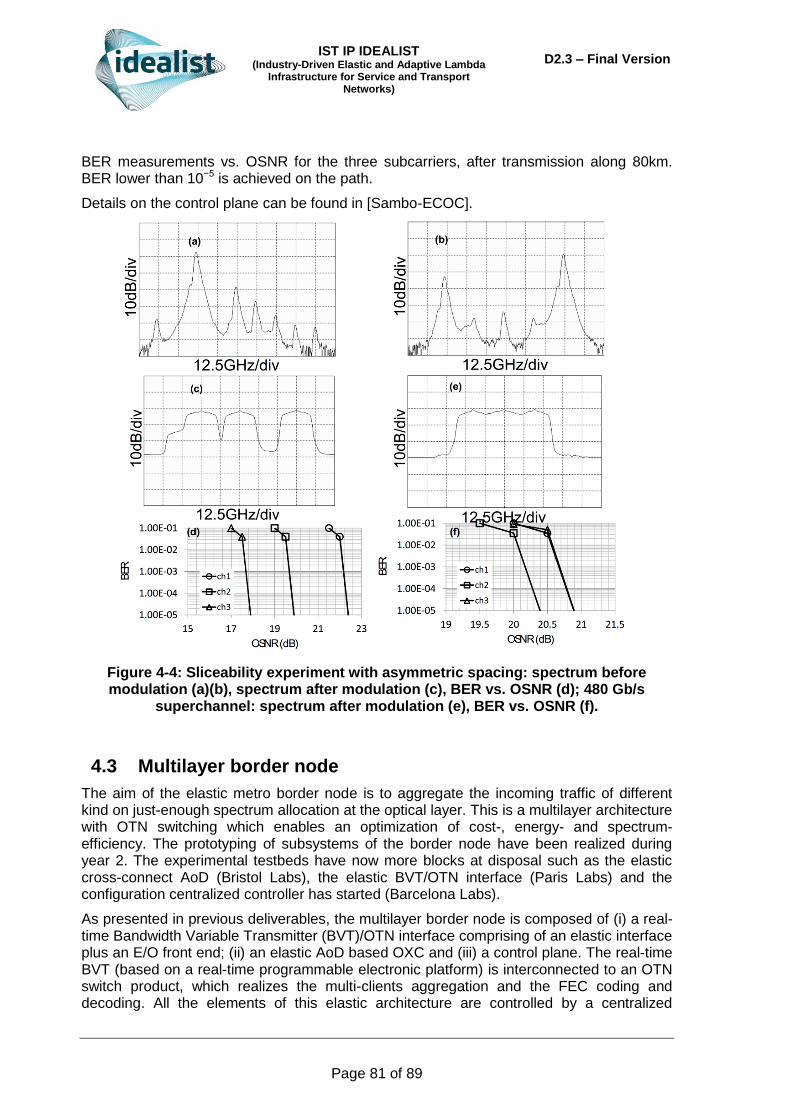
IST IP IDEALIST (Industry-Driven Elastic and Adaptive Lambda
Infrastructure for Service and Transport Networks)
D2.3 – Final Version
Page 81 of 89
BER measurements vs. OSNR for the three subcarriers, after transmission along 80km. BER lower than 10−5 is achieved on the path.
Details on the control plane can be found in [Sambo-ECOC].
Figure 4-4: Sliceability experiment with asymmetric spacing: spectrum before modulation (a)(b), spectrum after modulation (c), BER vs. OSNR (d); 480 Gb/s
superchannel: spectrum after modulation (e), BER vs. OSNR (f).
4.3 Multilayer border node
The aim of the elastic metro border node is to aggregate the incoming traffic of different kind on just-enough spectrum allocation at the optical layer. This is a multilayer architecture with OTN switching which enables an optimization of cost-, energy- and spectrum-efficiency. The prototyping of subsystems of the border node have been realized during year 2. The experimental testbeds have now more blocks at disposal such as the elastic cross-connect AoD (Bristol Labs), the elastic BVT/OTN interface (Paris Labs) and the configuration centralized controller has started (Barcelona Labs).
As presented in previous deliverables, the multilayer border node is composed of (i) a real-time Bandwidth Variable Transmitter (BVT)/OTN interface comprising of an elastic interface plus an E/O front end; (ii) an elastic AoD based OXC and (iii) a control plane. The real-time BVT (based on a real-time programmable electronic platform) is interconnected to an OTN switch product, which realizes the multi-clients aggregation and the FEC coding and decoding. All the elements of this elastic architecture are controlled by a centralized

IST IP IDEALIST (Industry-Driven Elastic and Adaptive Lambda
Infrastructure for Service and Transport Networks)
D2.3 – Final Version
Page 82 of 89
GMPLS controller as described in the testbed description D4.2 and is also reported in Figure 4-5. The global architecture includes a GMPLS controller with an Active State PCE developed by CTTC.
Figure 4-5: Setup of the Metro/Core Border node testbed.
Regarding the elastic BVT/OTN interface, this subsystem is a joint work between ALU-Italy, University of Bristol and Bell Labs France. This interface includes a flexible OTN mapping to the optical line rate in order to deliver just-enough capacity for future flexgrid networks, from 10Gbit/s to 100Gbit/s by steps of 10Gbit/s.The elastic interface is an FPGA-based prototype and is software-defined by a local controller. First experimental results on the software-defined elastic interface are presented in [Dupas-OFC15] after a common work and integration step.
In [Dupas-OFC15], the Elastic Interface includes a local controller that can be managed by a serial link management interface. A GUI is used for a local control of the board and the build prototype including all the elements from the E/O interconnection with 10 OTU2 tributaries to the coherent optical signal transmission (see Figure 4-6). It can also be interconnected with a real-time receiver working at different bit rates and with multiple optical levels, before sending, after decision, the received data to the OTNs Demultiplexer, that will recovers the data per OTU2 lane. All the design is based on one FPGA with a total resource use of 13.5% of LUTs and 6.7% of the total registers.

IST IP IDEALIST (Industry-Driven Elastic and Adaptive Lambda
Infrastructure for Service and Transport Networks)
D2.3 – Final Version
Page 83 of 89
Figure 4-6: Elastic interface prototype (left) with GUI (right).
The optical signal of the BVT with PM-QPSK output format at different bitrates has been observed with an optical spectrum analyzer on Figure 4-7. The recorded curve 2a represents the full optical spectrum of the PM-QPSK signal at 26.7GBd/s on 1 nm full span, corresponding to a total bit rate of 107Gbit/s. The curves 2b, 2c, 2d and 2e show the optical spectrum on the same span at 21.4, 16.1, 10.7 and 5.3GBd/s, respectively corresponding to a total bit rate of 85.7, 64.3, 42.8 and 21.4Gbit/s. With the black reference curve for the maximum bit rate, the reduction of spectrum occupancy is clearly observed.
At the electrical level, the eye diagram at the output of the variable bit rate serialiser has been recorded for the corresponding curves 2a to 2e. The bit rate can be changed from the minimum to the maximum bit rate of 107Gbit/s, only by sending to the FPGA a control sequence. The switching time is mainly due to the time required to stabilize and lock the high speed serializer / deserializer. It is in the range of the microsecond and remains blow 100µs for all switching configuration.
Figure 4-7: Optical spectrum of multi-rate PM-QPSK with electrical eye-diagram (from 5.3GBd/s to 26.7GBd/s).

IST IP IDEALIST (Industry-Driven Elastic and Adaptive Lambda
Infrastructure for Service and Transport Networks)
D2.3 – Final Version
Page 84 of 89
This reconfiguration time demonstrated on commercially available electronic components confirms the compatibility of this elastic solution with the requirements of existing networks. Next step is the integration of the elastic BVT/OTN interface together with the OTN switch matrix.
With regards to the AoD-based OXC, which functionalities and features are explained in section 2.2, several network topologies can be implemented by using the adaptability inherent to the AoD. The elastic interface aforementioned will feed this AoD elastic cross-connect to allow traffic flows to be directed to different nodes on request, based on the reconfigurability and programmability of this type of switch. In addition, components such as demultiplexers, splitters, BV-WSSs, etc. can be also added to the AoD-based OXC structure to provide more flexibility and granularity. It is important to mention that the AoD OXC is SDN-enabled, allowing the control of individual cross-connections.
The AoD OXC is based on high-port count Polatis switches, series 6000, with an all-optical 192x192 matrix switch and 192 by 192 input and output ports. The insertion loss per crossconnection is typically <1dB based on its piezoelectric beam-steering technology. Optical power monitoring as well as automatic protection switching (APS) is also available in the Polatis switches, enabling network monitoring, data mirroring and intrusion detection.
In addition to the switches, programmable and reconfigurable 4x16 optical spectrum-selective switches (SSSs) are going to be included in the AoD OXC node design to provide different functions such as spectrum selectivity. These types of SSSs provide precise control of filter wavelength, bandwidth, shape and phase, with the ability to switch and combine signals in an “Add” or “Drop” configuration.
Further experimental evaluation in year 3 of the project will interconnect these two systems prototypes together with a control plane to conduct more evolved network scenarios.
4.4 DSP technology compatibility
This section reports on the latest experimental achievements on DSP technology compatibility for next generation 1.28Tbit/s PM-16QAM superchannel. The experiment was carried out at Coriant Lab in Munich by CNIT, Coriant, and TU/e.
Figure 4-8 displays the setup considered within the experiment, whose main goal was to investigate the digital signal processing (DSP) technology compatibility between two system vendors, namely Coriant and Ericsson/CNIT.
A 1.28Tbit/s superchannel (consisting of five Nyquist wavelength-division multiplexed subcarriers each with 32GBd/s DP-16-QAM modulation including digital pre-emphasis as in [Rafique-JLT14a]) provided by Coriant was transmitted over a fiber link equipped with Coriant amplification technology. The net rate was 1Tbit/s, while a 28% overhead takes into account for FEC-OH, pilots, etc.
A flexgrid wavelength selective switch (WSS) to emulate ROADM induced filtering penalties was placed after each loop together with a Gain Flattening Filter (GFF). The link consisted of a ring test-bed with 95km spans of standard single mode fiber (SSMF) and a polarization scrambler (PS). After filtering and coherent reception with a Coriant optical frontend and a 50GSamples/s sampling scope with 23GHz optical bandwidth, the complex signal was offline processed by applying proprietary DSP algorithms provided by Coriant [Kuschnerov-JLT09] (single-vendor case) and CNIT/Ericsson (cross-vendor case).

IST IP IDEALIST (Industry-Driven Elastic and Adaptive Lambda
Infrastructure for Service and Transport Networks)
D2.3 – Final Version
Page 85 of 89
Figure 4-8: Experimental test set-up at the Coriant laboratories.
In order to allow compatible processing, we used blind signal estimation instead of applying a vendor-specific training sequence (i.e., no data-aided transmission was used). Only bit mapping and symbol rate were disclosed upon request to facilitate the post-processing. FEC was modeled as a threshold value only. As benchmark, we considered a bit error rate threshold (BERth) of 1×10⁻² and 3.4×10⁻² in case of hard-decision (HD) and soft-decision (SD), respectively, both assuming ~23% OH.
Assuming the adoption of a more powerful vendor-specific SD-FEC for a proprietary solution, a total transmission distance of approximately 1700km was achieved, see Figure 4-9. For a DSP technology compatible or interoperable solution, we assumed instead a standard HD-FEC and blind DSP processing executed by CNIT/Ericsson. In the first practical signal processing attempt, these assumptions limited the transmission reach in the range of ~300km. Although effective SD-FEC solutions could be implemented also for the cross-vendor configuration with blind DSP, this value is already a remarkable cornerstone and close to what most European operators require for a considerable number of lightpaths in their national backbone networks. Further analysis is ongoing to improve the ultimate cross-vendor reach even further.
Figure 4-9: Cross-vendor DSP technology compatibility and achieved transmission reach.
As a first tangible hero experiment, we investigated the cross-vendor DSP processing interoperability between two well-established system vendors. Our measurements in back-to-back configuration as well as over several hundred km of fiber demonstrated the

IST IP IDEALIST (Industry-Driven Elastic and Adaptive Lambda
Infrastructure for Service and Transport Networks)
D2.3 – Final Version
Page 86 of 89
principle feasibility of a cross-vendor coherent signal reception and digital signal processing of next generation 1.28Tbit/s PM-16QAM superchannels as long as a few DSP-related parameters are disclosed between the involved parties. As expected, transmission distance is significantly reduced compared to a single-vendor solution. But it is still within a commercially interesting range for most European network operators.
4.5 Multivendor interoperability
Based on the table “Common reference list of parameters for interoperability” presented in deliverable D2.1, in this deliverable D2.3 the first related values for the different parameters are provided, following the expertise of different IDEALIST partners.
Table 4-I presents the initial provided values for the different parameters for interoperability with an additional column for comments. In some cases more than one range of values is provided. This is because these specific parameters are still under discussion.
Table 4-I: Common reference list of parameters for interoperability
Req
uir
ed
fo
r A
-B
inte
rop
era
bilit
y in
alien
w
avele
ng
th s
olu
tio
n
Parameter Units
Min
imu
m v
alu
e (
if
ap
pli
cab
le)
Ty
pic
al valu
e
Ma
xim
um
valu
e (
if
ap
pli
cab
le)
Co
mm
en
ts
1. Basic BVT parameters 400G -> 1 Terabit
yes Total capacity Gbit/s 400 any 1000
yes Number of subcarriers - 1 2, 5 8
1-4 Subcarriers for 400G, 5
NWDM, 8 TFP.
yes Bit-rate/line coding of optical tributary signals
- 25 + overhead
no Framing (example: OTL4.4) "OTL5.16" (not standardized)
maybe Number of parallel lanes (per subcarrier)
-
8x25Gb/s
40x25Gbit/s OOK, client side
8x100Gb/s QPSK neighbours 4 per side
2. Electrical processing parameters
only NCG FEC type (e.g. RS(255/239) or proprietary)
Cortina/Vitese/no FEC (just pre-
FEC BER)
no/yes FEC decision type (hard or soft) soft-decision (28% total
overhead for FEC, framing, pilots, etc.)
maybe Maximum bit error ratio (post-FEC) - - 10-15
10-12
pre-FEC BER?
no Data encoding (e.g. differential / non differential)
ideally non-differential
/differential
no Acquisition (blind training / training sequence)
blind
no Acquisition time (w/o previous training sequences)
ms 20 40
no Acquisition time (based on training sequences)
ms 10 20
3. Optical line-sided TX parameters

IST IP IDEALIST (Industry-Driven Elastic and Adaptive Lambda
Infrastructure for Service and Transport Networks)
D2.3 – Final Version
Page 87 of 89
3a. Power related parameters
yes Total BVT output power dBm 1 1, 3, 5, 7,
9 9
yes Subcarriers’ output power dBm -2 0 2
yes Power difference between polarizations (per subcarrier)
dB - <1 --
maybe Power jitter (per subcarrier) dB 0.5
3b. Spectrum related parameters
yes superchannel central wavelength nm 1530nm 1550nm 1560n
m
yes
Total BVT central frequency THz
192
yes 187.6
GHz for NWDM
yes 175 for
TFP
no Spectral bandwidth (per subcarrier)
GHz 32 35 Depends on
scheme
no Occupied spectral slices (per superchannel/subcarrier)
in multiples of 12.5GHz
3 16
maybe Subcarriers’ channel spacing GHz
37.5 38.4/No channel spacing
50
36.8 GHz
for NWDM
20GHz for
TFP
no Spectral excursion (per subcarrier) GHz With or w/o
Filter?
no/yes Guard band between subcarriers GHz
6.4 for TPF
1.5/2 GHz for NWDM
3c. Modulation related parameters
yes Modulation type (e.g. QPSK, 16QAM)
- Mix between 32QAM and QPSK [flexMod@OFC]
yes Baud-rate (per subcarrier) GBaud 27.95 27.95, 28,
32 32
no Inphase and quadrature constellation exactness (per subcarrier)
Degree (angle)
<5 5
4. Optical line-sided RX requirements
yes Received power dBm -17 -12 -7
yes OSNR dB (0.1nm) 22 23.5 n.a.
yes Chromatic dispersion tolerance ps/nm 30000 50000
no Rx optical frequency variation tolerance
GHz <+-2
It is important to mention in here that some of these parameters were extracted from the recent interoperability experiment undertaken in Work Package 4. This experiment is described more in detail in the Section 4.4.

IST IP IDEALIST (Industry-Driven Elastic and Adaptive Lambda
Infrastructure for Service and Transport Networks)
D2.3 – Final Version
Page 88 of 89
5 Conclusions
This deliverable summarizes the most recent advances in the design and experimental validation of IDEALIST data plane solutions. Furthermore, subsystems have been prototyped and will be used further in WP4 for next year systems experiments.
Deliverable D2.3 leverages on the common architecture of data plane identified in the previous deliverable D2.2. This common architecture comprises of (i) an optical node that should provide flexibility in terms of optical switching, bandwidth variable WSS, etc; (ii) a S-BVT with its multi-flow optical front end that can adapt its transmission rate (symbol rate, FEC, modulation,etc.) according to the reach or physical impairments; (iii) client mapping and flexible OTN fabric. All of these major functional blocks include a high level of programmability to ensure elastic optical networks a reality, but also more intelligent networks with monitoring and control.
At each optical node, the optical switching relies on WSS. According to the level of flexibility and the architecture of the optical node, many of them can be crossed from the source node to the destination node. This filter cascade imposes some bandwidth restriction on the channel spectrum. In this deliverable, two solutions were presented and evaluated to mitigate this filter cascade penalty. First a spectral shaping based solution has been analyzed, showing that 32GBd/s PM-8QAM/16QAM signals can be transmitted in a 37.5GHz WDM grid, but at the same time experimentally evidencing that high order modulations are more sensitive to the filtering penalty. Second, a super-filter technique is proposed taking into account the other co-propagating superchannels, and that in a way can be seen as a generalization of filtering for channel, where now all the involved channels may not have the same destination.
Architecture on Demand provides a high level of flexibility and scalability, with the particularity to propose a self-healing architecture enabling bypassing faulty components or permitting internal rerouting within the node. Self-healing procedure in AoD nodes is proposed and compared in term of benefits to traditional hard-wired nodes solutions. In terms of availability, AoD is well-suited for a reasonable number of lightpaths. In addition, the reduction of failure-prone component is a key advantage in AoD. Scalability of optical switching is traditionally obtained with a high number of ports but alternatively an innovative optical backplane architecture could be proposed to limit the requirement on optical switch connectivity. A pay-as-you-grow model is proposed with either unidirectional or expandable architecture for which the number of connections as well as the power consumption is studied analytically. An experimental small-size setup validates the proposed pay-as-you-grow optical backplane. For specific scenarios, the expandable architecture is able to reduce losses and SNR degradation since in this case a limited number of switches is needed with respect to the unidirectional architecture.
The SERANO node architecture is also depicted in this deliverable. It is an integral building block of a flexible optical node and its architecture has been thought to reduce as much as possible the switching and cost for sliceable BVTs.
High speed elastic transmission is possible with various wave forms such as Nyquist pulse shaping, Time-Frequency Packing and OFDM but needs more and more versatile and efficient DSP algorithms. Efficiency is often expressed in terms of BER performance or OSNR sensitivity, but ideally energy-efficiency and low-cost implementations are also at stake. Some of the most recent advanced DSP solutions are exposed and shows substantial improvements. For instance, data aided equalization in the nonlinear regime is shown to be up to 2dB better by implementing CAZAC- sequences. Else, a novel XPolM equalizer is
IST IP IDEALIST (Industry-Driven Elastic and Adaptive Lambda
Infrastructure for Service and Transport Networks)
D2.3 – Final Version
Page 89 of 89
proposed showing a gain of several dBs for high Q-factors with no need for the knowledge of link parameters. Other pre-emphasis techniques reduce the effects of DAC limitation, of interest particularly for high baud rate. Indeed, the 1Tbit/s transmission will likely use the highest baud rate possible providing that the hardware limitations of high speed electronics allows a limited penalty to the system transmission. In previous deliverables D2.1 and D2.2, the 1Tbit/s transmission was only investigated in terms of superchannels or OFDM waveforms, but in this deliverable the first single-carrier 1Tbit/s line transmission is shown to be possible. Low cost implementations are well-suited for metro networks such as BRAS centralization with the ability to serve multiple destinations. For such an application a multiband OFDM with single-sideband is proposed. In the other direction (upstream), an optical Discrete Multitone (DMT) is used in combination with shared coherent detection. Experimental back-to-back and transmission over a mesh network show significant results in term of the required OSNR for a 10-3 BER.
The data plane is also designed to be more intelligent and adapt its behavior according to monitoring information and control plane trigger. The latter is realized in conjunction with WP3. Programmability is first applied to code rate adaptation. In this case, the monitoring system is able to predict the OSNR degradation in advance so as to trigger a code rate change; hence to avoid errors before they occur, the data rate is reduced. In addition, the S-BVT can be further improved with a programmable and asymmetric wavelength source. A single source avoids the laser drift between sub-carriers. Experiments with different sub-carrier spacing are obtained in an ITU-T flexgrid. A software-defined real-time elastic OTN/BVT prototype, whose details plans were presented in the previous deliverables, is now running. The flexible OTN mapping delivers just-enough capacity for a flexgrid transmission The BVT then adjusts the baud rate to match the bit rate to the flexible OTN mapping. The real-time OTN/BVT prototype has a sub-millisecond reconfiguration; this is obtained on commercially available FPGA and electronic components.
Finally, works on interoperability of data plane have been further demonstrated. A joint experiment on DSP compatibility with Nyquist WDM ensures that a minimum performance could be guaranteed. Using a PM-16QAM and standard hard decision FEC for interoperability, a 300km reach could be obtained, which demonstrates feasibility with an interesting range. This first interoperable experiment between two system vendors permits to update the common reference list of parameters for interoperability.
Leveraging on these first subsystem demonstrations, further experimental demonstrations will be evaluated in WP4 being the results of a lot of collaborative effort to integrate hardware and software.