Data Mining: Concepts and Techniques - TUTavisa/5306lec5.pdf · Chapter 5: Concept Description:...
63
Data Mining: Concepts and Techniques — Slides for Textbook — — Chapter 5 — Jiawei Han and Micheline Kamber Intelligent Database Systems Research Lab Simon Fraser University, Ari Visa, , Institute of Signal Processing Tampere University of Technology October 3, 2010 Data Mining: Concepts and Techniques 1
Transcript of Data Mining: Concepts and Techniques - TUTavisa/5306lec5.pdf · Chapter 5: Concept Description:...

Data Mining: Concepts and Techniques
— Slides for Textbook —— Chapter 5 —
Jiawei Han and Micheline Kamber
Intelligent Database Systems Research Lab Simon Fraser University,
Ari Visa, , Institute of Signal Processing
Tampere University of TechnologyOctober 3, 2010 Data Mining: Concepts and Techniques 1

Chapter 5: Concept Description: Characterization and Comparison
• What is concept description?
• Data generalization and summarization-based characterization
• Analytical characterization: Analysis of attribute relevance
• Mining class comparisons: Discriminating between different
classes
• Mining descriptive statistical measures in large databases
• Discussion
• Summary
October 3, 2010 Data Mining: Concepts and Techniques 2

What is Concept Description?
• Descriptive vs. predictive data mining– Descriptive mining: describes concepts or task-relevant data
sets in concise, summarily, informative, discriminative forms– Predictive mining: Based on data and analysis, constructs
models for the database, and predicts the trend and properties of unknown data
• Concept description: – Characterization: provides a concise and succinct
summarization of the given collection of data– Comparison: provides descriptions comparing two or more
collections of data
Concept Description vs. OLAP
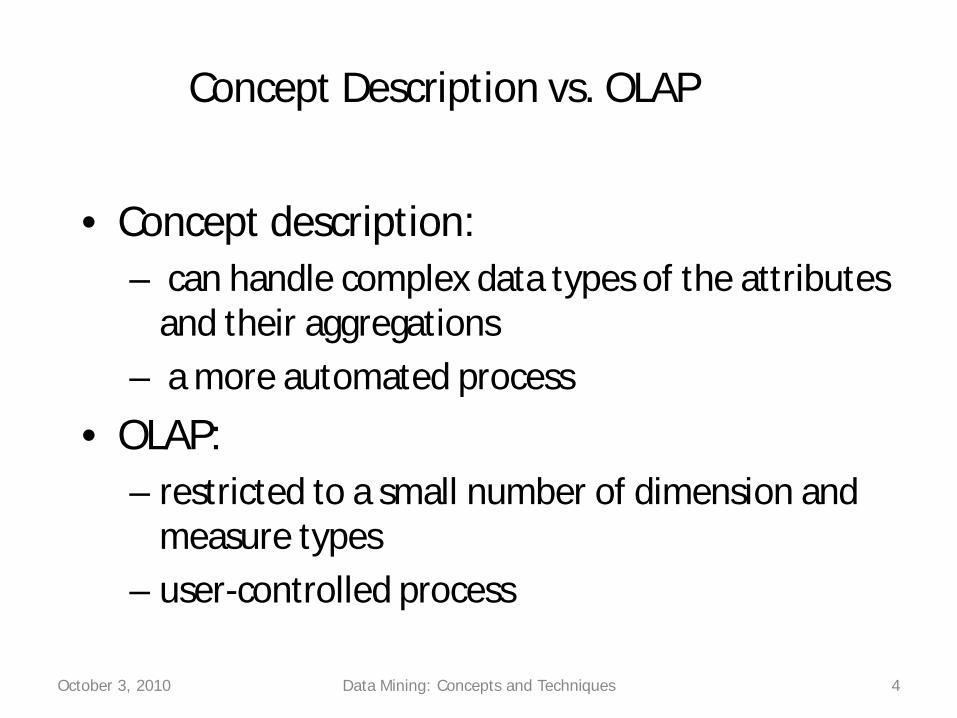
• Concept description: – can handle complex data types of the attributes
and their aggregations
– a more automated process
• OLAP: – restricted to a small number of dimension and
measure types
– user-controlled process
October 3, 2010 Data Mining: Concepts and Techniques 4

Chapter 5: Concept Description: Characterization and Comparison
• What is concept description?
• Data generalization and summarization-based characterization
• Analytical characterization: Analysis of attribute relevance
• Mining class comparisons: Discriminating between different
classes
• Mining descriptive statistical measures in large databases
• Discussion
• Summary
October 3, 2010 Data Mining: Concepts and Techniques 5

Data Generalization and Summarization-based Characterization
• Data generalization
– A process which abstracts a large set of task-relevant data in a database from a low conceptual levels to higher ones.
– Approaches:
• Data cube approach(OLAP approach)
• Attribute-oriented induction approach
October 3, 2010 Data Mining: Concepts and Techniques 6
1
2
3
4
5Conceptual levels

Characterization: Data Cube Approach (without using AO-Induction)
• Perform computations and store results in data cubes
• Strength
– An efficient implementation of data generalization
– Computation of various kinds of measures• e.g., count( ), sum( ), average( ), max( )
– Generalization and specialization can be performed on a data cube by roll-up and drill-down
• Limitations
– handle only dimensions of simple nonnumeric data and measures of simple aggregated numeric values.
– Lack of intelligent analysis, can’t tell which dimensions should be used and what levels should the generalization reach
October 3, 2010 Data Mining: Concepts and Techniques 7

Attribute-Oriented Induction
• Proposed in 1989 (KDD ‘89 workshop)
• Not confined to categorical data nor particular measures.
• How it is done?
– Collect the task-relevant data( initial relation) using a relational database query
– Perform generalization by attribute removal or attribute generalization.
– Apply aggregation by merging identical, generalized tuples and accumulating their respective counts.
– Interactive presentation with users.
October 3, 2010 Data Mining: Concepts and Techniques 8

Basic Principles of Attribute-Oriented Induction
• Data focusing: task-relevant data, including dimensions, and the result is the initial relation.
• Attribute-removal: remove attribute A if there is a large set of distinct values for A but (1) there is no generalization operator on A, or (2) A’s higher level concepts are expressed in terms of other attributes.
• Attribute-generalization: If there is a large set of distinct values for A, and there exists a set of generalization operators on A, then select an operator and generalize A.
• Attribute-threshold control: typical 2-8, specified/default.
• Generalized relation threshold control: control the final relation/rule size. see example
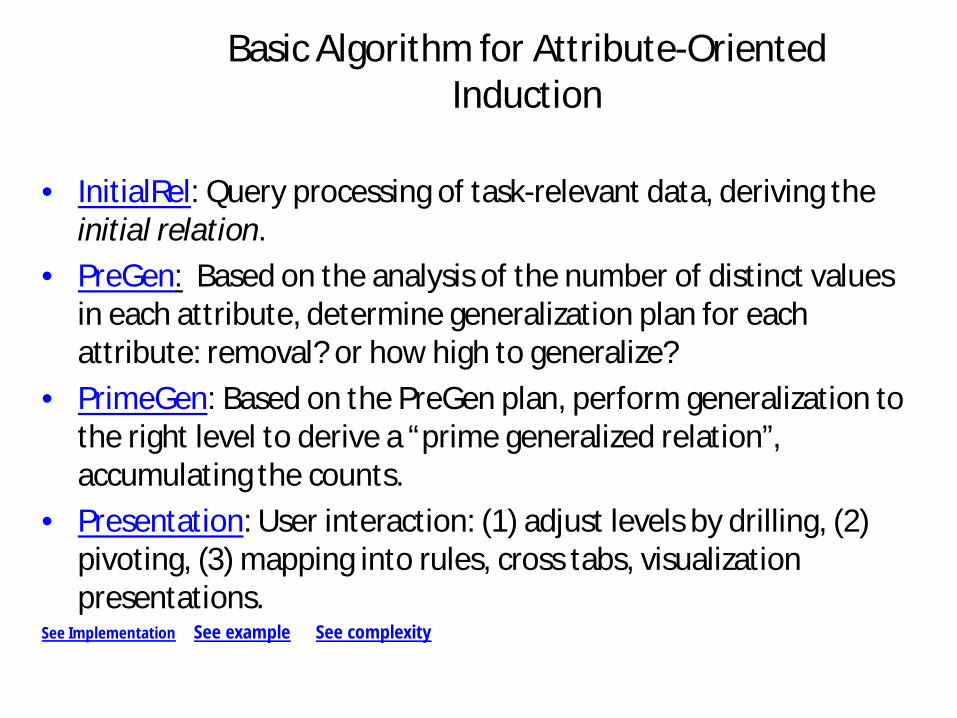
Basic Algorithm for Attribute-Oriented Induction
• InitialRel: Query processing of task-relevant data, deriving the initial relation.
• PreGen: Based on the analysis of the number of distinct values in each attribute, determine generalization plan for each attribute: removal? or how high to generalize?
• PrimeGen: Based on the PreGen plan, perform generalization to the right level to derive a “prime generalized relation”, accumulating the counts.
• Presentation: User interaction: (1) adjust levels by drilling, (2) pivoting, (3) mapping into rules, cross tabs, visualization presentations.
See Implementation See example See complexity

Example
• DMQL: Describe general characteristics of graduate students in the Big-University databaseuse Big_University_DBmine characteristics as “Science_Students”in relevance to name, gender, major, birth_place,
birth_date, residence, phone#, gpafrom studentwhere status in “graduate”
• Corresponding SQL statement:Select name, gender, major, birth_place, birth_date,
residence, phone#, gpafrom studentwhere status in {“Msc”, “MBA”, “PhD” }
October 3, 2010 Data Mining: Concepts and Techniques 11
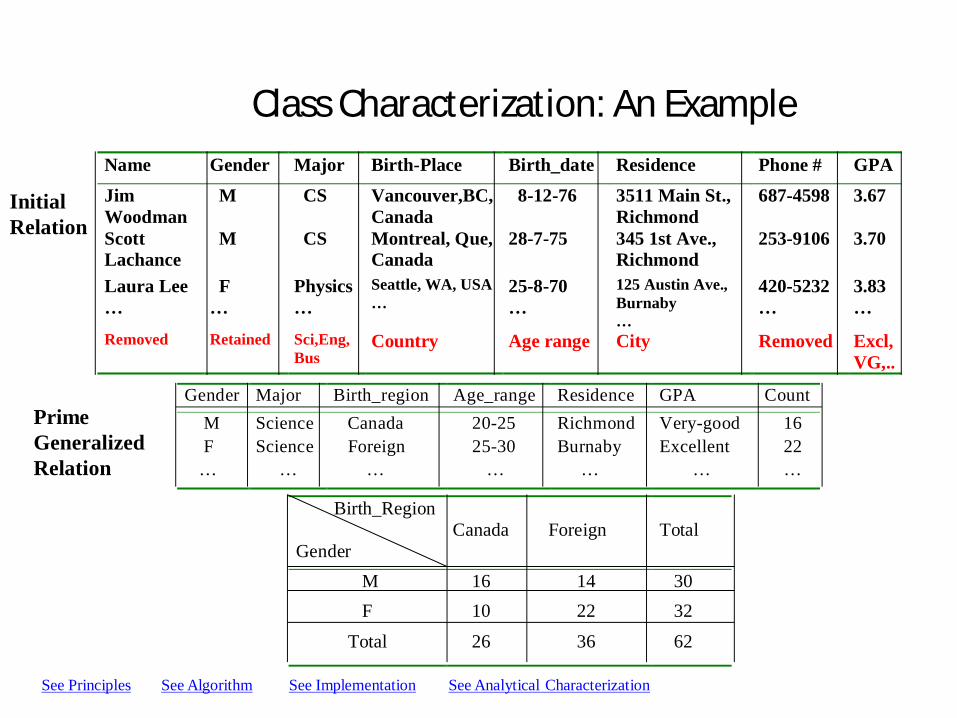
Class Characterization: An ExampleName Gender Major Birth-Place Birth_date Residence Phone # GPAJimWoodman
M CS Vancouver,BC,Canada
8-12-76 3511 Main St.,Richmond
687-4598 3.67
ScottLachance
M CS Montreal, Que,Canada
28-7-75 345 1st Ave.,Richmond
253-9106 3.70
Laura Lee…
F…
Physics…
Seattle, WA, USA…
25-8-70…
125 Austin Ave.,Burnaby…
420-5232…
3.83…
Removed Retained Sci,Eng,Bus
Country Age range City Removed Excl,VG,..
Gender Major Birth_region Age_range Residence GPA Count M Science Canada 20-25 Richmond Very-good 16 F Science Foreign 25-30 Burnaby Excellent 22 … … … … … … …
Birth_Region
GenderCanada Foreign Total
M 16 14 30 F 10 22 32
Total 26 36 62
See Principles See Algorithm
Prime Generalized Relation
Initial Relation
See Implementation See Analytical Characterization

Presentation of Generalized Results
• Generalized relation:
– Relations where some or all attributes are generalized, with counts or other aggregation values accumulated.
• Cross tabulation:
– Mapping results into cross tabulation form (similar to contingency tables).
– Visualization techniques:
– Pie charts, bar charts, curves, cubes, and other visual forms.
• Quantitative characteristic rules:
– Mapping generalized result into characteristic rules with quantitative information associated with it, e.g.,
.%]47:["")(_%]53:["")(_)()(
tforeignxregionbirthtCanadaxregionbirthxmalexgrad
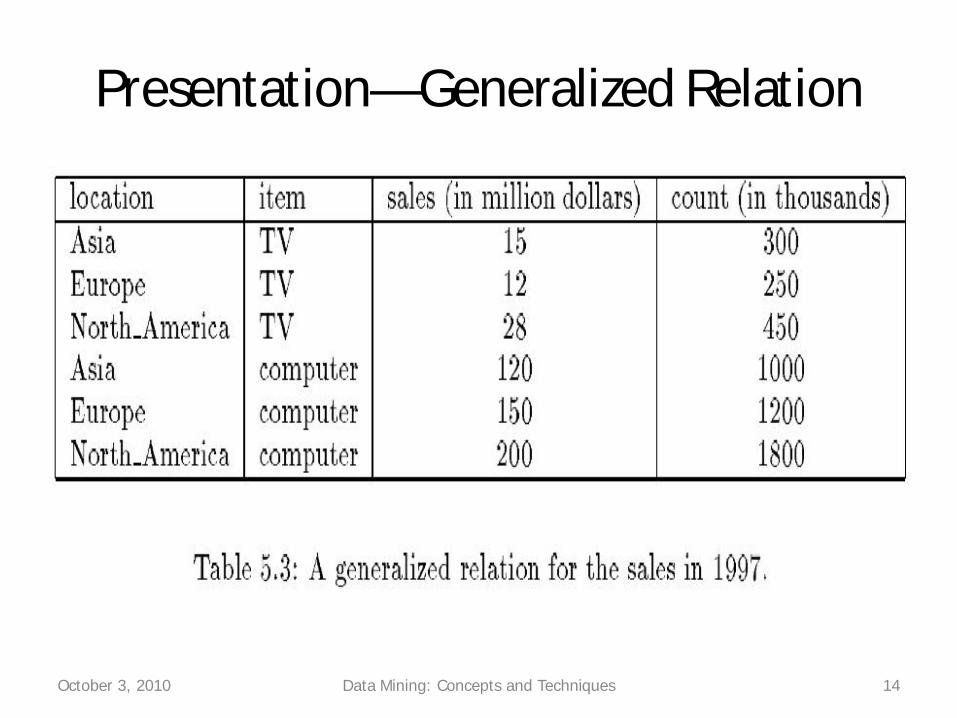
Presentation—Generalized Relation
October 3, 2010 Data Mining: Concepts and Techniques 14

Presentation—Crosstab
October 3, 2010 Data Mining: Concepts and Techniques 15

Implementation by Cube Technology
• Construct a data cube on-the-fly for the given data mining query– Facilitate efficient drill-down analysis– May increase the response time– A balanced solution: precomputation of “subprime”
relation• Use a predefined & precomputed data cube
– Construct a data cube beforehand– Facilitate not only the attribute-oriented induction, but
also attribute relevance analysis, dicing, slicing, roll-up and drill-down
– Cost of cube computation and the nontrivial storage overhead
October 3, 2010 Data Mining: Concepts and Techniques 16

Chapter 5: Concept Description: Characterization and Comparison
• What is concept description?
• Data generalization and summarization-based characterization
• Analytical characterization: Analysis of attribute relevance
• Mining class comparisons: Discriminating between different
classes
• Mining descriptive statistical measures in large databases
• Discussion
• Summary
October 3, 2010 Data Mining: Concepts and Techniques 17

Characterization vs. OLAP
• Similarity:
– Presentation of data summarization at multiple levels of abstraction.
– Interactive drilling, pivoting, slicing and dicing.
• Differences:
– Automated desired level allocation.
– Dimension relevance analysis and ranking when there are many relevant dimensions.
– Sophisticated typing on dimensions and measures.
– Analytical characterization: data dispersion analysis.
October 3, 2010 Data Mining: Concepts and Techniques 18

Attribute Relevance Analysis
• Why?
– Which dimensions should be included?
– How high level of generalization?
– Automatic vs. interactive
– Reduce # attributes; easy to understand patterns
• What?
– statistical method for preprocessing data• filter out irrelevant or weakly relevant attributes
• retain or rank the relevant attributes
– relevance related to dimensions and levels
– analytical characterization, analytical comparison October 3, 2010 Data Mining: Concepts and Techniques 19

Attribute relevance analysis (cont’d)
• How?
– Data Collection
– Analytical Generalization• Use information gain analysis (e.g., entropy or other measures)
to identify highly relevant dimensions and levels.
– Relevance Analysis• Sort and select the most relevant dimensions and levels.
– Attribute-oriented Induction for class description• On selected dimension/level
– OLAP operations (e.g. drilling, slicing) on relevance rules
October 3, 2010 Data Mining: Concepts and Techniques 20
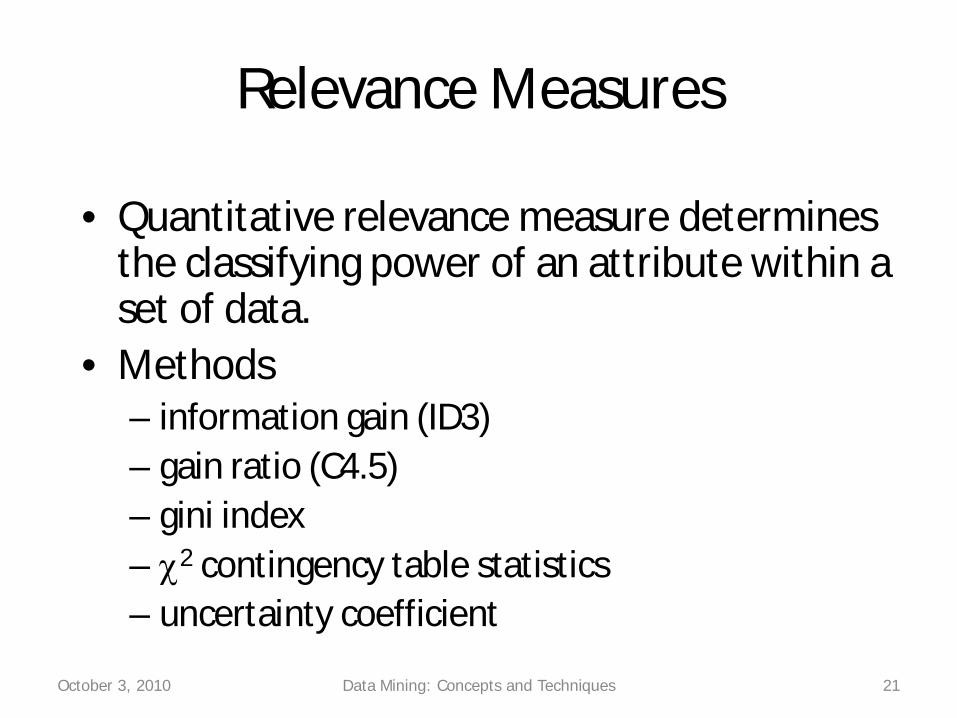
Relevance Measures
• Quantitative relevance measure determines the classifying power of an attribute within a set of data.
• Methods– information gain (ID3)– gain ratio (C4.5)– gini index– 2 contingency table statistics– uncertainty coefficient
October 3, 2010 Data Mining: Concepts and Techniques 21

Information-Theoretic Approach
• Decision tree
– each internal node tests an attribute
– each branch corresponds to attribute value
– each leaf node assigns a classification
• ID3 algorithm
– build decision tree based on training objects with known class labels to classify testing objects
– rank attributes with information gain measure
– minimal height • the least number of tests to classify an object
October 3, 2010 Data Mining: Concepts and Techniques 22See example

Top-Down Induction of Decision Tree
October 3, 2010 Data Mining: Concepts and Techniques 23
Attributes = {Outlook, Temperature, Humidity, Wind}
Outlook
Humidity Wind
sunny rainovercast
yes
no yes
high normal
no
strong weak
yes
PlayTennis = {yes, no}

Entropy and Information Gain
• S contains si tuples of class Ci for i = {1, …, m} • Information measures info required to
classify any arbitrary tuple
• Entropy of attribute A with values {a1,a2,…,av}
• Information gained by branching on attribute A
October 3, 2010 Data Mining: Concepts and Techniques 24
sslog
ss),...,s,ssI( im
i
im21 2
1
)s,...,s(Is
s...sE(A) mjj
v
j
mjj1
1
1
E(A))s,...,s,I(sGain(A) m21

Example: Analytical Characterization
• Task– Mine general characteristics describing graduate students
using analytical characterization
• Given– attributes name, gender, major, birth_place, birth_date,
phone#, and gpa– Gen(ai) = concept hierarchies on ai
– Ui = attribute analytical thresholds for ai
– Ti = attribute generalization thresholds for ai
– R = attribute relevance threshold
October 3, 2010 Data Mining: Concepts and Techniques 25

Example: Analytical Characterization (cont’d)
• 1. Data collection– target class: graduate student– contrasting class: undergraduate student
• 2. Analytical generalization using Ui
– attribute removal• remove name and phone#
– attribute generalization• generalize major, birth_place, birth_date and
grade_point_average• accumulate counts
– candidate relation: gender, major, birth_country, age_range and gpa
October 3, 2010 Data Mining: Concepts and Techniques 26
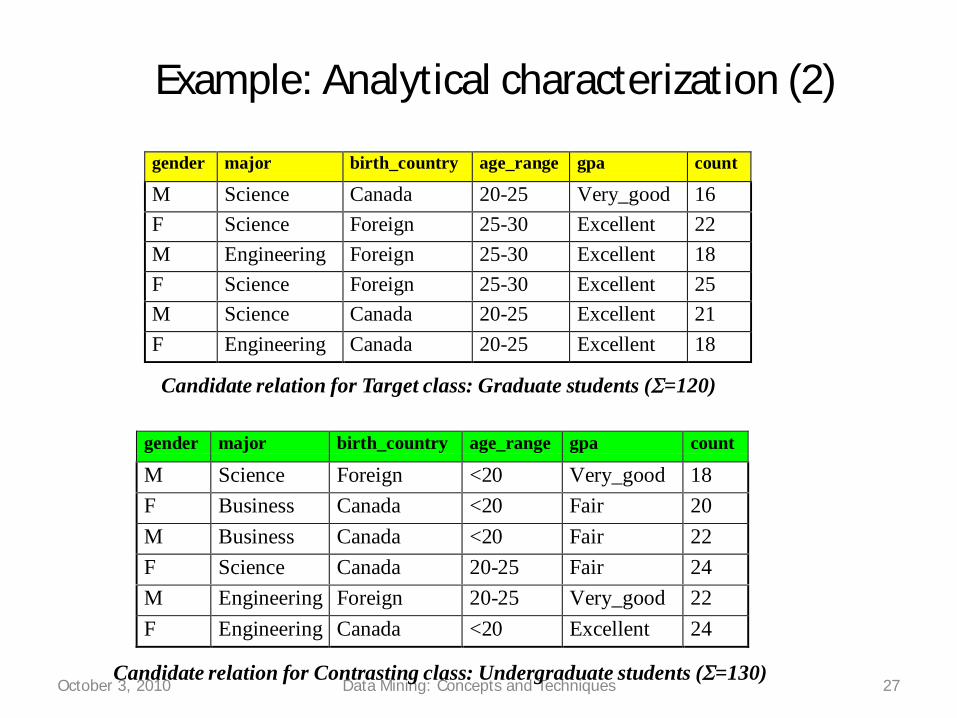
Example: Analytical characterization (2)
October 3, 2010 Data Mining: Concepts and Techniques 27
gender major birth_country age_range gpa count
M Science Canada 20-25 Very_good 16F Science Foreign 25-30 Excellent 22M Engineering Foreign 25-30 Excellent 18F Science Foreign 25-30 Excellent 25M Science Canada 20-25 Excellent 21F Engineering Canada 20-25 Excellent 18
Candidate relation for Target class: Graduate students ( =120)
gender major birth_country age_range gpa count
M Science Foreign <20 Very_good 18F Business Canada <20 Fair 20M Business Canada <20 Fair 22F Science Canada 20-25 Fair 24M Engineering Foreign 20-25 Very_good 22F Engineering Canada <20 Excellent 24
Candidate relation for Contrasting class: Undergraduate students ( =130)

Example: Analytical characterization (3)
• 3. Relevance analysis
– Calculate expected info required to classify an arbitrary tuple
– Calculate entropy of each attribute: e.g. major
October 3, 2010 Data Mining: Concepts and Techniques 28
99880250130
250130
250120
250120130120 2221 .loglog),I()s,I(s
For major=”Science”: S11=84 S21=42 I(s11,s21)=0.9183
For major=”Engineering”: S12=36 S22=46 I(s12,s22)=0.9892
For major=”Business”: S13=0 S23=42 I(s13,s23)=0
Number of grad students in “Science” Number of undergrad
students in “Science”

Example: Analytical Characterization (4)
• Calculate expected info required to classify a given sample if S is partitioned according to the attribute
• Calculate information gain for each attribute
– Information gain for all attributes
October 3, 2010 Data Mining: Concepts and Techniques 29
7873025042
25082
250126
231322122111 .)s,s(I)s,s(I)s,s(IE(major)
2115021 .E(major))s,I(s)Gain(major
Gain(gender) = 0.0003
Gain(birth_country) = 0.0407
Gain(major) = 0.2115Gain(gpa) = 0.4490
Gain(age_range) = 0.5971

Example: Analytical characterization (5)
• 4. Initial working relation (W0) derivation
– R = 0.1
– remove irrelevant/weakly relevant attributes from candidate relation => drop gender, birth_country
– remove contrasting class candidate relation
• 5. Perform attribute-oriented induction on W0 using Ti
October 3, 2010 Data Mining: Concepts and Techniques 30
major age_range gpa countScience 20-25 Very_good 16Science 25-30 Excellent 47Science 20-25 Excellent 21Engineering 20-25 Excellent 18Engineering 25-30 Excellent 18
Initial target class working relation W0: Graduate students

Chapter 5: Concept Description: Characterization and Comparison
• What is concept description?
• Data generalization and summarization-based characterization
• Analytical characterization: Analysis of attribute relevance
• Mining class comparisons: Discriminating between different
classes
• Mining descriptive statistical measures in large databases
• Discussion
• Summary
October 3, 2010 Data Mining: Concepts and Techniques 31

Mining Class Comparisons
• Comparison: Comparing two or more classes.• Method:
– Partition the set of relevant data into the target class and the contrasting class(es)
– Generalize both classes to the same high level concepts– Compare tuples with the same high level descriptions– Present for every tuple its description and two measures:
• support - distribution within single class• comparison - distribution between classes
– Highlight the tuples with strong discriminant features • Relevance Analysis:
– Find attributes (features) which best distinguish different classes.
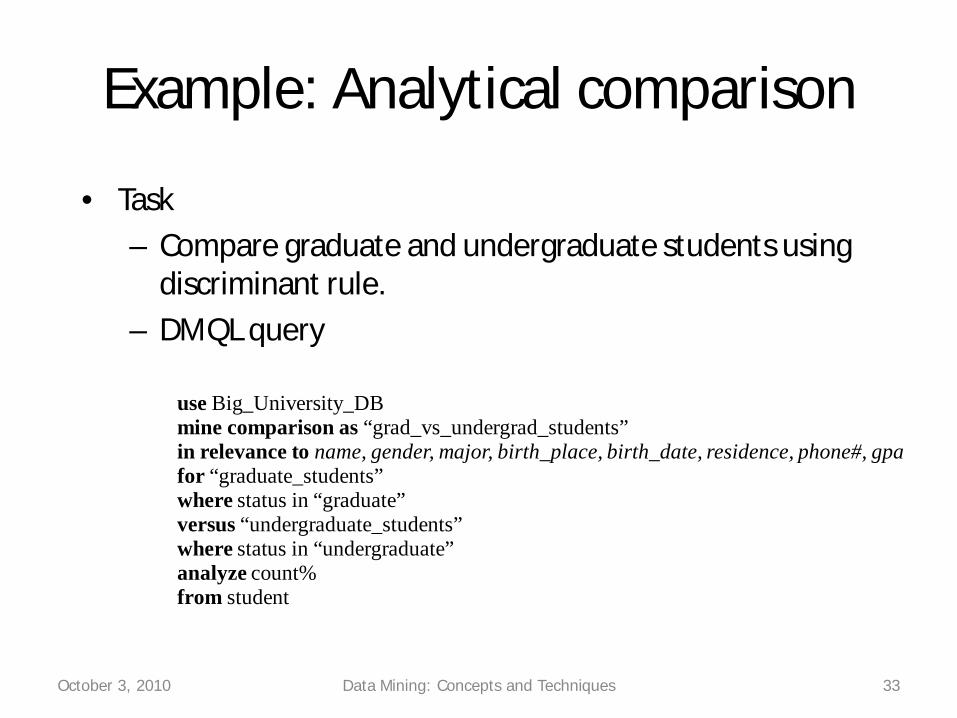
Example: Analytical comparison
• Task
– Compare graduate and undergraduate students using discriminant rule.
– DMQL query
October 3, 2010 Data Mining: Concepts and Techniques 33
use Big_University_DBmine comparison as “grad_vs_undergrad_students”in relevance to name, gender, major, birth_place, birth_date, residence, phone#, gpafor “graduate_students”where status in “graduate”versus “undergraduate_students”where status in “undergraduate”analyze count%from student

Example: Analytical comparison (2)
• Given– attributes name, gender, major, birth_place,
birth_date, residence, phone# and gpa
– Gen(ai) = concept hierarchies on attributes ai
– Ui = attribute analytical thresholds for attributes ai
– Ti = attribute generalization thresholds for attributes ai
– R = attribute relevance threshold
October 3, 2010 Data Mining: Concepts and Techniques 34

Example: Analytical comparison (3)
• 1. Data collection
– target and contrasting classes
• 2. Attribute relevance analysis
– remove attributes name, gender, major, phone#
• 3. Synchronous generalization
– controlled by user-specified dimension thresholds
– prime target and contrasting class(es) relations/cuboids
October 3, 2010 Data Mining: Concepts and Techniques 35

Example: Analytical comparison (4)
October 3, 2010 Data Mining: Concepts and Techniques 36
Birth_country Age_range Gpa Count%Canada 20-25 Good 5.53%Canada 25-30 Good 2.32%Canada Over_30 Very_good 5.86%… … … …Other Over_30 Excellent 4.68%
Prime generalized relation for the target class: Graduate students
Birth_country Age_range Gpa Count%Canada 15-20 Fair 5.53%Canada 15-20 Good 4.53%… … … …Canada 25-30 Good 5.02%… … … …Other Over_30 Excellent 0.68%
Prime generalized relation for the contrasting class: Undergraduate students
Example: Analytical comparison (5)
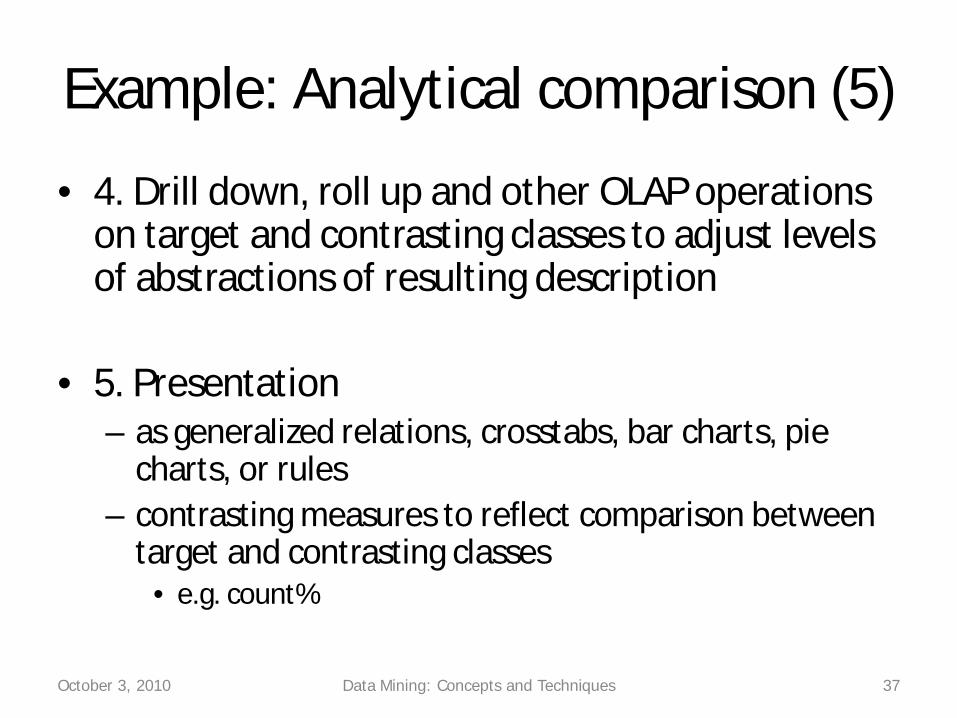
• 4. Drill down, roll up and other OLAP operations on target and contrasting classes to adjust levels of abstractions of resulting description
• 5. Presentation– as generalized relations, crosstabs, bar charts, pie
charts, or rules– contrasting measures to reflect comparison between
target and contrasting classes• e.g. count%
October 3, 2010 Data Mining: Concepts and Techniques 37

Quantitative Discriminant Rules
• Cj = target class
• qa = a generalized tuple covers some tuples of class
– but can also cover some tuples of contrasting class
• d-weight
– range: [0, 1]
• quantitative discriminant rule form
October 3, 2010 Data Mining: Concepts and Techniques 38
m
iia
ja
)Ccount(q
)Ccount(qweightd
1
d_weight]:[dX)condition(ss(X)target_claX,

Example: Quantitative Discriminant Rule
• Quantitative discriminant rule
– where 90/(90+120) = 30%
October 3, 2010 Data Mining: Concepts and Techniques 39
Status Birth_country Age_range Gpa Count
Graduate Canada 25-30 Good 90
Undergraduate Canada 25-30 Good 210
Count distribution between graduate and undergraduate students for a generalized tuple
%]30:["")("3025")(_"")(_)(_,
dgoodXgpaXrangeageCanadaXcountrybirthXstudentgraduateX

Class Description
• Quantitative characteristic rule
– necessary
• Quantitative discriminant rule
– sufficient
• Quantitative description rule
– necessary and sufficient
October 3, 2010 Data Mining: Concepts and Techniques 40
]w:d,w:[t...]w:d,w:[t nn111 (X)condition(X)conditionss(X)target_claX,
n
d_weight]:[dX)condition(ss(X)target_claX,
t_weight]:[tX)condition(ss(X)target_claX,

Example: Quantitative Description Rule
• Quantitative description rule for target class Europe
October 3, 2010 Data Mining: Concepts and Techniques 41
Location/item TV Computer Both_items
Count t-wt d-wt Count t-wt d-wt Count t-wt d-wt
Europe 80 25% 40% 240 75% 30% 320 100% 32%
N_Am 120 17.65% 60% 560 82.35% 70% 680 100% 68%
Both_ regions
200 20% 100% 800 80% 100% 1000 100% 100%
Crosstab showing associated t-weight, d-weight values and total number (in thousands) of TVs and computers sold at AllElectronics in 1998
30%]:d75%,:[t40%]:d25%,:[t )computer""(item(X))TV""(item(X)Europe(X)X,

Chapter 5: Concept Description: Characterization and Comparison
• What is concept description?
• Data generalization and summarization-based characterization
• Analytical characterization: Analysis of attribute relevance
• Mining class comparisons: Discriminating between different
classes
• Mining descriptive statistical measures in large databases
• Discussion
• Summary
October 3, 2010 Data Mining: Concepts and Techniques 42

Mining Data Dispersion Characteristics
• Motivation
– To better understand the data: central tendency, variation and spread
• Data dispersion characteristics
– median, max, min, quantiles, outliers, variance, etc.
• Numerical dimensions correspond to sorted intervals
– Data dispersion: analyzed with multiple granularities of precision
– Boxplot or quantile analysis on sorted intervals
• Dispersion analysis on computed measures
– Folding measures into numerical dimensions
– Boxplot or quantile analysis on the transformed cube
October 3, 2010 Data Mining: Concepts and Techniques 43
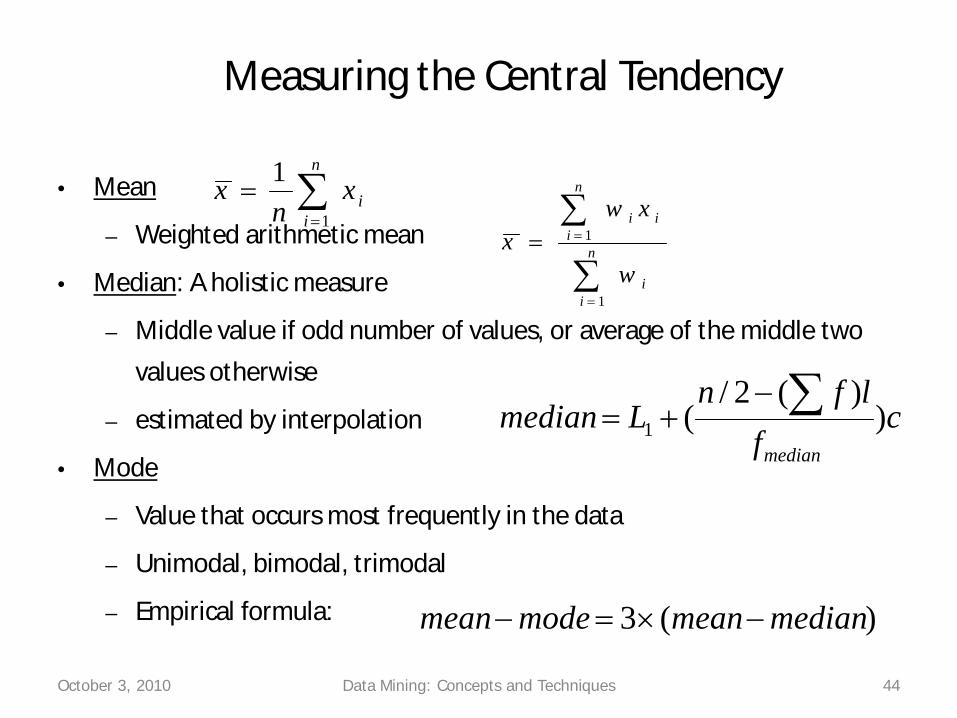
Measuring the Central Tendency
• Mean
– Weighted arithmetic mean
• Median: A holistic measure
– Middle value if odd number of values, or average of the middle two
values otherwise
– estimated by interpolation
• Mode
– Value that occurs most frequently in the data
– Unimodal, bimodal, trimodal
– Empirical formula:
October 3, 2010 Data Mining: Concepts and Techniques 44
n
iix
nx
1
1
n
ii
n
iii
w
xwx
1
1
cf
lfnLmedian
median
))(2/
(1
)(3 medianmeanmodemean

Measuring the Dispersion of Data
• Quartiles, outliers and boxplots
– Quartiles: Q1 (25th percentile), Q3 (75th percentile)
– Inter-quartile range: IQR = Q3 – Q1
– Five number summary: min, Q1, M, Q3, max
– Boxplot: ends of the box are the quartiles, median is marked,
whiskers, and plot outlier individually
– Outlier: usually, a value higher/lower than 1.5 x IQR
• Variance and standard deviation
– Variance s2: (algebraic, scalable computation)
– Standard deviation s is the square root of variance s2
October 3, 2010 Data Mining: Concepts and Techniques 45
n
i
n
iii
n
ii x
nx
nxx
ns
1 1
22
1
22 ])(1[1
1)(1
1

Boxplot Analysis
• Five-number summary of a distribution:Minimum, Q1, M, Q3, Maximum
• Boxplot– Data is represented with a box– The ends of the box are at the first and third
quartiles, i.e., the height of the box is IRQ– The median is marked by a line within the box– Whiskers: two lines outside the box extend to
Minimum and Maximum
October 3, 2010 Data Mining: Concepts and Techniques 46
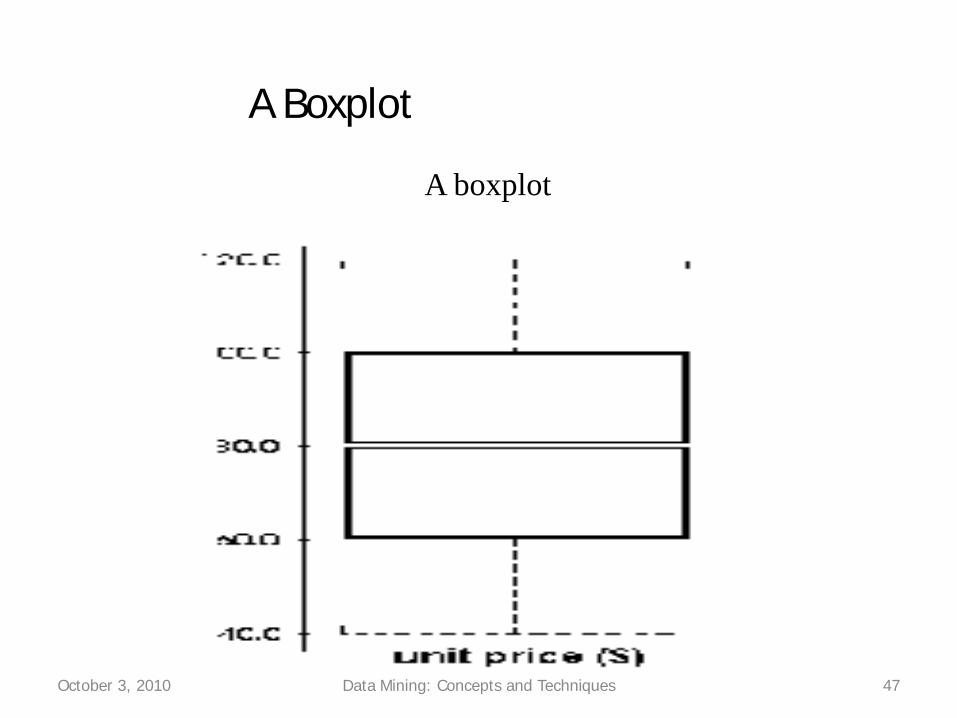
A Boxplot
October 3, 2010 Data Mining: Concepts and Techniques 47
A boxplot

Visualization of Data Dispersion: Boxplot Analysis
October 3, 2010 Data Mining: Concepts and Techniques 48

Mining Descriptive Statistical Measures in Large Databases
• Variance
• Standard deviation: the square root of the variance
– Measures spread about the mean
– It is zero if and only if all the values are equal
– Both the deviation and the variance are algebraic
October 3, 2010 Data Mining: Concepts and Techniques 49
22
1
22 11
1)(1
1ii
n
ii x
nx
nxx
ns

Histogram Analysis
• Graph displays of basic statistical class descriptions
– Frequency histograms • A univariate graphical method
• Consists of a set of rectangles that reflect the counts or frequencies of the classes present in the given data
October 3, 2010 Data Mining: Concepts and Techniques 50

Quantile Plot
• Displays all of the data (allowing the user to assess both the overall behavior and unusual occurrences)
• Plots quantile information– For a data xi data sorted in increasing order, fi indicates
that approximately 100 fi% of the data are below or equal to the value xi
October 3, 2010 Data Mining: Concepts and Techniques 51

Quantile-Quantile (Q-Q) Plot
• Graphs the quantiles of one univariate distribution against the corresponding quantiles of another
• Allows the user to view whether there is a shift in going from one distribution to another
October 3, 2010 Data Mining: Concepts and Techniques 52

Scatter plot
• Provides a first look at bivariate data to see clusters of points, outliers, etc
• Each pair of values is treated as a pair of coordinates and plotted as points in the plane
October 3, 2010 Data Mining: Concepts and Techniques 53

Loess Curve
• Adds a smooth curve to a scatter plot in order to provide better perception of the pattern of dependence
• Loess (local regression) curve is fitted by setting two parameters: a smoothing parameter, and the degree of the polynomials that are fitted by the regression
October 3, 2010 Data Mining: Concepts and Techniques 54
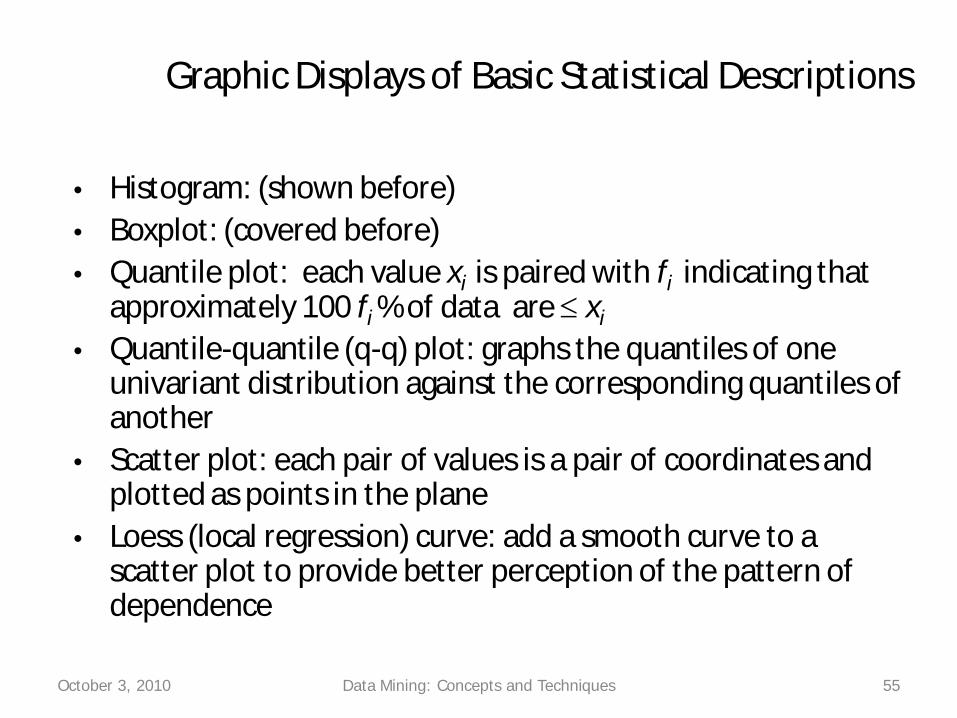
Graphic Displays of Basic Statistical Descriptions
• Histogram: (shown before)• Boxplot: (covered before)• Quantile plot: each value xi is paired with fi indicating that
approximately 100 fi % of data are xi
• Quantile-quantile (q-q) plot: graphs the quantiles of one univariant distribution against the corresponding quantiles of another
• Scatter plot: each pair of values is a pair of coordinates and plotted as points in the plane
• Loess (local regression) curve: add a smooth curve to a scatter plot to provide better perception of the pattern of dependence
October 3, 2010 Data Mining: Concepts and Techniques 55

Chapter 5: Concept Description: Characterization and Comparison
• What is concept description?
• Data generalization and summarization-based characterization
• Analytical characterization: Analysis of attribute relevance
• Mining class comparisons: Discriminating between different
classes
• Mining descriptive statistical measures in large databases
• Discussion
• Summary
October 3, 2010 Data Mining: Concepts and Techniques 56

Attribute Oriented Induction vs. Learning-from-example Paradigm
• Difference in philosophies and basic assumptions
– Positive and negative samples in learning-from-example: positive used for generalization, negative - for specialization (not always)
– Positive samples only in data mining: hence generalization-based, to drill-down backtrack the generalization to a previous state
• Difference in methods of generalizations
– Machine learning generalizes on a tuple by tuple basis
– Data mining generalizes on an attribute by attribute basis
October 3, 2010 Data Mining: Concepts and Techniques 57

Comparison of Entire vs. Factored Version Space
October 3, 2010 Data Mining: Concepts and Techniques 58

Incremental and Parallel Mining of Concept Description
• Incremental mining: revision based on newly added data DB
– Generalize DB to the same level of abstraction in the generalized relation R to derive R
– Union R U R, i.e., merge counts and other statistical information to produce a new relation R’
• Similar philosophy can be applied to data sampling, parallel and/or distributed mining, etc.
October 3, 2010 Data Mining: Concepts and Techniques 59

Chapter 5: Concept Description: Characterization and Comparison
• What is concept description?
• Data generalization and summarization-based characterization
• Analytical characterization: Analysis of attribute relevance
• Mining class comparisons: Discriminating between different
classes
• Mining descriptive statistical measures in large databases
• Discussion
• Summary
October 3, 2010 Data Mining: Concepts and Techniques 60

Summary
• Concept description: characterization and discrimination
• OLAP-based vs. attribute-oriented induction
• Efficient implementation of AOI
• Analytical characterization and comparison
• Mining descriptive statistical measures in large databases
• Discussion
– Incremental and parallel mining of description
– Descriptive mining of complex types of data
October 3, 2010 Data Mining: Concepts and Techniques 61

References
• Y. Cai, N. Cercone, and J. Han. Attribute-oriented induction in relational databases. In G. Piatetsky-Shapiro and W. J. Frawley, editors, Knowledge Discovery in Databases, pages 213-228. AAAI/MIT Press, 1991.
• S. Chaudhuri and U. Dayal. An overview of data warehousing and OLAP technology. ACM SIGMOD Record, 26:65-74, 1997
• C. Carter and H. Hamilton. Efficient attribute-oriented generalization for knowledge discovery from large databases. IEEE Trans. Knowledge and Data Engineering, 10:193-208, 1998.
• W. Cleveland. Visualizing Data. Hobart Press, Summit NJ, 1993.• J. L. Devore. Probability and Statistics for Engineering and the Science, 4th ed. Duxbury Press,
1995.• T. G. Dietterich and R. S. Michalski. A comparative review of selected methods for learning
from examples. In Michalski et al., editor, Machine Learning: An Artificial Intelligence Approach, Vol. 1, pages 41-82. Morgan Kaufmann, 1983.
• J. Gray, S. Chaudhuri, A. Bosworth, A. Layman, D. Reichart, M. Venkatrao, F. Pellow, and H. Pirahesh. Data cube: A relational aggregation operator generalizing group-by, cross-tab and sub-totals. Data Mining and Knowledge Discovery, 1:29-54, 1997.
• J. Han, Y. Cai, and N. Cercone. Data-driven discovery of quantitative rules in relational databases. IEEE Trans. Knowledge and Data Engineering, 5:29-40, 1993.
October 3, 2010 Data Mining: Concepts and Techniques 62

References (cont.)
• J. Han and Y. Fu. Exploration of the power of attribute-oriented induction in data mining. In U.M. Fayyad, G. Piatetsky-Shapiro, P. Smyth, and R. Uthurusamy, editors, Advances in Knowledge Discovery and Data Mining, pages 399-421. AAAI/MIT Press, 1996.
• R. A. Johnson and D. A. Wichern. Applied Multivariate Statistical Analysis, 3rd ed. Prentice Hall, 1992.
• E. Knorr and R. Ng. Algorithms for mining distance-based outliers in large datasets. VLDB'98, New York, NY, Aug. 1998.
• H. Liu and H. Motoda. Feature Selection for Knowledge Discovery and Data Mining. Kluwer Academic Publishers, 1998.
• R. S. Michalski. A theory and methodology of inductive learning. In Michalski et al., editor, Machine Learning: An Artificial Intelligence Approach, Vol. 1, Morgan Kaufmann, 1983.
• T. M. Mitchell. Version spaces: A candidate elimination approach to rule learning. IJCAI'97, Cambridge, MA.
• T. M. Mitchell. Generalization as search. Artificial Intelligence, 18:203-226, 1982.• T. M. Mitchell. Machine Learning. McGraw Hill, 1997.• J. R. Quinlan. Induction of decision trees. Machine Learning, 1:81-106, 1986.• D. Subramanian and J. Feigenbaum. Factorization in experiment generation. AAAI'86,
Philadelphia, PA, Aug. 1986.
October 3, 2010 Data Mining: Concepts and Techniques 63


![Operational Concept Description - University of …sunset.usc.edu/research/MBASE/EPG/templates/OCD.doc · Web viewThe operational concept description of [Project Name] will be introduced.](https://static.fdocuments.in/doc/165x107/5b07e73a7f8b9a520e8bd383/operational-concept-description-university-of-viewthe-operational-concept-description.jpg)