Data management for the Murray-Darling Basin Sustainable ... · It is an output of the...
40
M. Hartcher and D. Lemon November 2008 Data Management for the Murray-Darling Basin Sustainable Yields Project A report to the Australian Government from the CSIRO Murray-Darling Basin Sustainable Yields Project
Transcript of Data management for the Murray-Darling Basin Sustainable ... · It is an output of the...
M. Hartcher and D. Lemon
November 2008
Data Management for the Murray-DarlingBasin Sustainable Yields Project A report to the Australian Government from the CSIRO Murray-Darling Basin Sustainable Yields Project
Murray-Darling Basin Sustainable Yields Project Acknowledgments
Prepared by CSIRO with contributions from: Sinclair Knight Merz, Resource; Environmental Management Pty Ltd; Department of Water
Land and Biodiversity Conservation (South Australia); Department of Sustainability and Environment (Victoria); Department of Water
and Energy (New South Wales); Department of Natural Resources and Water (Queensland); Murray-Darling Basin Commission; Bureau
of Rural Sciences; Geoscience Australia; Salient Solutions Australia Pty Ltd; eWater Cooperative Research Centre; University of
Melbourne; and several individual sub-contractors.
Murray-Darling Basin Sustainable Yields Project Disclaimers
Derived from or contains data and/or software provided by the Organisations. The Organisations give no warranty in relation to the data
and/or software they provided (including accuracy, reliability, completeness, currency or suitability) and accept no liability (including
without limitation, liability in negligence) for any loss, damage or costs (including consequential damage) relating to any use or reliance
on that data or software including any material derived from that data and software. Data must not be used for direct marketing or be
used in breach of the privacy laws. Organisations include: Department of Water, Land and Biodiversity Conservation (South Australia),
Department of Sustainability and Environment (Victoria), Department of Water and Energy (New South Wales), Department of Natural
Resources and Water (Queensland) and the Murray-Darling Basin Commission.
CSIRO advises that the information contained in this publication comprises general statements based on scientific research. The reader
is advised and needs to be aware that such information may be incomplete or unable to be used in any specific situation. No reliance or
actions must therefore be made on that information without seeking prior expert professional, scientific and technical advice. To the
extent permitted by law, CSIRO (including its employees and consultants) excludes all liability to any person for any consequences,
including but not limited to all losses, damages, costs, expenses and any other compensation, arising directly or indirectly from using
this publication (in part or in whole) and any information or material contained in it. Data is assumed to be correct as received from the
Organisations.
Report Acknowledgements
The Data Management component of the MDBSY project could not have been completed without the resourcefulness and commitment
of the Data Management Team and Project Data Coordinators. Key contributions came from; Jenet Austin, Pheobe Carmody, Phil
Davies, Trevor Dowling, Alex Dyce, Peter Dyce, Peter Fitch, Douglas Kerruish, Tegan Liston, Steve Marvanek, Arthur Read, Garry
Swan, Brendan Speet and Jamie Vleeshouwer.
This report was ably reviewed by Susan Cuddy and Yun Chen.
Citation
Hartcher M and Lemon D (2008) Data Management for the Murray-Darling Basin Sustainable Yields Project. A report to the Australian
Government from the CSIRO Murray-Darling Basin Sustainable Yields Project, CSIRO, Australia. 34pp.
Publication Details
Published by CSIRO ©2008 all rights reserved. This work is copyright. Apart from any use as permitted under the Copyright Act 1968,
no part may be reproduced by any process without prior written permission from CSIRO.
ISSN 1895-095X
Preface
This is a report to the Australian Government from CSIRO. It is an output of the Murray-Darling Basin Sustainable Yields
Project which assessed current and potential future water availability in 18 regions across the Murray-Darling Basin
(MDB) considering climate change and other risks to water resources. The project was commissioned following the
Murray-Darling Basin Water Summit convened by the then Prime Minister of Australia in November 2006 to report
progressively during the latter half of 2007. The reports for each of the 18 regions and for the entire MDB are supported
by a series of technical reports detailing the modelling and assessment methods used in the project. This report is one of
the supporting technical reports of the project. Project reports can be accessed at http://www.csiro.au/mdbsy.
Project findings are expected to inform the establishment of a new sustainable diversion limit for surface and
groundwater in the MDB – one of the responsibilities of a new Murray-Darling Basin Authority in formulating a new
Murray-Darling Basin Plan, as required under the Commonwealth Water Act 2007. These reforms are a component of
the Australian Government’s new national water plan ‘Water for our Future’. Amongst other objectives, the national water
plan seeks to (i) address over-allocation in the MDB, helping to put it back on a sustainable track, significantly improving
the health of rivers and wetlands of the MDB and bringing substantial benefits to irrigators and the community; and (ii)
facilitate the modernisation of Australian irrigation, helping to put it on a more sustainable footing against the background
of declining water resources.
Summary
The management of the storage of models, inputs and outputs, maps and plots, and reports required a substantial and
sustained investment in infrastructure and process. This report describes the computing equipment utilised for the project,
and the processes put in place to manage the acquisition, storage, maintenance and audit of the reporting materials.
© CSIRO 2008 Data management for the Murray-Darling Basin Sustainable Yields Project
Table of contents
1 Introduction............................................................................................................................... 1
2 WRON infrastructure ................................................................................................................. 2
3 Data management .................................................................................................................. 4 3.1 Data permissions..........................................................................................................................................................4 3.2 Project data archive and workspaces ...........................................................................................................................4 3.3 Data management within project team..........................................................................................................................6
3.3.1 Catchment yield modelling team.....................................................................................................................6 3.3.2 Groundwater modelling team..........................................................................................................................7 3.3.3 River modelling team......................................................................................................................................9 3.3.4 Water accounting and environmental assessment team...............................................................................10 3.3.5 Reporting team.............................................................................................................................................10
3.4 Data licensing.............................................................................................................................................................12 3.5 Data standards...........................................................................................................................................................12
3.5.1 Data formats ................................................................................................................................................13 3.5.2 Naming conventions.....................................................................................................................................13 3.5.3 Coordinate systems......................................................................................................................................13
4 Data management tools ....................................................................................................... 14 4.1 SharePoint web sites..................................................................................................................................................14
4.1.1 MDB Partner portal.......................................................................................................................................14 4.1.2 Reporting Products portal.............................................................................................................................15 4.1.3 Review Panel portals....................................................................................................................................16
4.2 External data transfer via FTP ....................................................................................................................................18 4.3 Metadata and the metadata entry tool ........................................................................................................................18 4.4 Reporting database ....................................................................................................................................................22 4.5 Document management .............................................................................................................................................23
5 Data auditing .......................................................................................................................... 25 5.1 Audit trail ....................................................................................................................................................................25 5.2 Auditing methods........................................................................................................................................................25
Figures
Figure 2-1. The high-level architecture of the WRON Computing Facility in 2007.............................................................................3 Figure 3-1. Project archive directory structure..................................................................................................................................5 Figure 3-2. Catchment Yield modelling directory for the Murrumbidgee reporting region..................................................................7 Figure 3-3. Groundwater modelling directory structure for Rainfall Reduction Factor modelling .......................................................8 Figure 3-4. Groundwater modelling directory structure for the Namoi reporting region .....................................................................8 Figure 3-5. River Modelling directory structure for the Warrego reporting region..............................................................................9 Figure 3-6. Water accounting and environmental assessment directory structure ..........................................................................10 Figure 3-7. Reporting directory structure stored in project archive..................................................................................................11 Figure 3-8. Reporting directory structure within project teams........................................................................................................12 Figure 4-1. MDBSY Partner Portal SharePoint web page ..............................................................................................................15 Figure 4-2. Reporting portal home page.........................................................................................................................................16 Figure 4-3. Additional SharePoint portals used in the MDBSY project............................................................................................17 Figure 4-4. Technical Reference Panel portal home page..............................................................................................................17 Figure 4-5. SmartFTP client software interface ..............................................................................................................................18 Figure 4-6. Login page of the metadata entry tool..........................................................................................................................19 Figure 4-7. Home page of the metadata catalogue ........................................................................................................................20 Figure 4-8. Example of a metadata page in the metadata entry tool...............................................................................................21 Figure 4-9. Example of the editing interface of the metadata entry tool ..........................................................................................21 Figure 4-10. Lineage data input screen in the metadata entry tool .................................................................................................22 Figure 4-11. User interface of TRIM...............................................................................................................................................24
Data management for the Murray-Darling Basin Sustainable Yields Project © CSIRO 2008
1 Introduction
This report – one in a series of scientific reports from the CSIRO Murray-Darling Basin Sustainable Yields Project
(MDBSY) – describes the data management technical environment and formal protocols developed for handling
documents, modelling software, and data in support of the project. The development of and adherence to a data
management policy, as well as the provision of appropriate data management tools such as a metadata catalogue, were
integral to ensuring the project and team members were able to achieve the required outcomes and meet higher than
normal levels of scrutiny within the tight timeframes of the project.
The MDBSY project was a huge and diverse undertaking requiring input from a large number of people from within
CSIRO and various external sub-contractors. The amount and diversity of data, models and reports used or produced
within the project, along with the tight timeframes for delivery, required a professional approach to data management.
To this end, data management was undertaken as a separate component of the project with close linkages to other
teams. The key goals were to ensure that data used or generated within the project was
• accessible to those who needed it
• safe from being lost or corrupted
• managed according to requirements of data suppliers
• secure from those who did not need it
• had demonstrable integrity (i.e. it could be demonstrated how any individual dataset was produced and where it
came from).
By separating data management as a distinct team focus, it was possible to establish common protocols across the
various project teams, as well as establish a common data repository and a robust set of procedures for managing the
data store.
The MDBSY project generated a large volume of datasets and documents which had to be managed such that they were
secure, accessible, and described with appropriate metadata. The protocols that were established for all project teams
for data storage, access, security, backup, and archiving, ensured that the integrity of both datasets and documents was
and remains demonstrable. Protocols for exchanging data with external agencies and sub-contractors, sharing project
documents with project team members and disseminating information, and issues of confidentiality and restricted access
to some documents and data were also developed and administered.
A critical responsibility for the Data Management team was to ensure a complete audit trail existed for all modelling
results, all original and interim datasets, all software versions, and all reports. These were archived in the project data
repository, with metadata statements completed and stored within a relational database.
The Data Management team took responsibility for
• provision of secure centralised computing facilities (including data storage and processing)
• provision of project collaboration tools (including the Project SharePoint site, Project Data Catalogue, and data
exchange facilities)
• development of a project reporting database
• ensuring all data collected for the project was appropriately described and licensed
• ensuring a full audit trail of all steps of the analysis process was captured
• ensuring commitments made to third parties with respect to data and models were fulfilled.
This report outlines the protocols, the various locations used to store and exchange documents and data, the tools used
for managing data, and the issue of having a robust audit trail.
© CSIRO 2008 Data management for the Murray-Darling Basin Sustainable Yields Project ▪ 1
2 WRON infrastructure
Data storage and processing for the MDBSY project was, where appropriate and possible, performed using the CSIRO
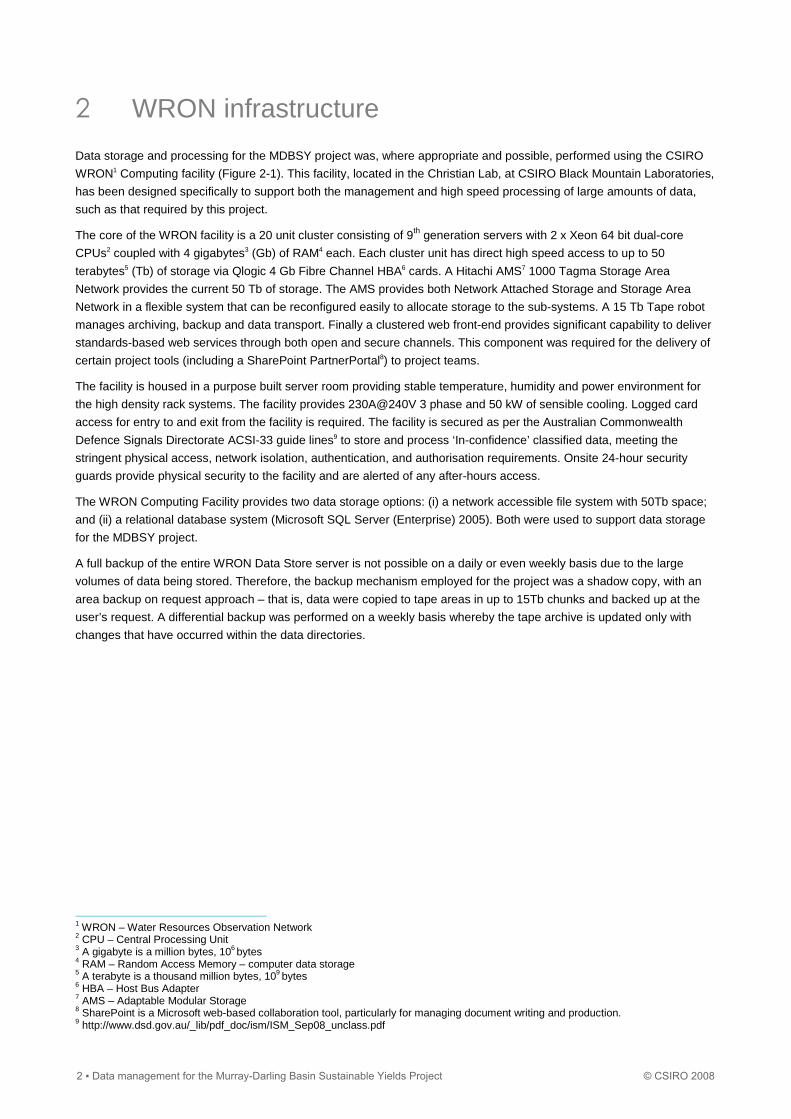
WRON1 Computing facility (Figure 2-1). This facility, located in the Christian Lab, at CSIRO Black Mountain Laboratories,
has been designed specifically to support both the management and high speed processing of large amounts of data,
such as that required by this project.
The core of the WRON facility is a 20 unit cluster consisting of 9th generation servers with 2 x Xeon 64 bit dual-core
CPUs2 coupled with 4 gigabytes3 (Gb) of RAM4 each. Each cluster unit has direct high speed access to up to 50
terabytes5 (Tb) of storage via Qlogic 4 Gb Fibre Channel HBA6 cards. A Hitachi AMS7 1000 Tagma Storage Area
Network provides the current 50 Tb of storage. The AMS provides both Network Attached Storage and Storage Area
Network in a flexible system that can be reconfigured easily to allocate storage to the sub-systems. A 15 Tb Tape robot
manages archiving, backup and data transport. Finally a clustered web front-end provides significant capability to deliver
standards-based web services through both open and secure channels. This component was required for the delivery of
certain project tools (including a SharePoint PartnerPortal8) to project teams.
The facility is housed in a purpose built server room providing stable temperature, humidity and power environment for
the high density rack systems. The facility provides 230A@240V 3 phase and 50 kW of sensible cooling. Logged card
access for entry to and exit from the facility is required. The facility is secured as per the Australian Commonwealth
Defence Signals Directorate ACSI-33 guide lines9 to store and process ‘In-confidence’ classified data, meeting the
stringent physical access, network isolation, authentication, and authorisation requirements. Onsite 24-hour security
guards provide physical security to the facility and are alerted of any after-hours access.
The WRON Computing Facility provides two data storage options: (i) a network accessible file system with 50Tb space;
and (ii) a relational database system (Microsoft SQL Server (Enterprise) 2005). Both were used to support data storage
for the MDBSY project.
A full backup of the entire WRON Data Store server is not possible on a daily or even weekly basis due to the large
volumes of data being stored. Therefore, the backup mechanism employed for the project was a shadow copy, with an
area backup on request approach – that is, data were copied to tape areas in up to 15Tb chunks and backed up at the
user’s request. A differential backup was performed on a weekly basis whereby the tape archive is updated only with
changes that have occurred within the data directories.
1 WRON – Water Resources Observation Network 2 CPU – Central Processing Unit 3 A gigabyte is a million bytes, 106 bytes 4 RAM – Random Access Memory – computer data storage 5 A terabyte is a thousand million bytes, 109 bytes 6 HBA – Host Bus Adapter 7 AMS – Adaptable Modular Storage 8 SharePoint is a Microsoft web-based collaboration tool, particularly for managing document writing and production. 9 http://www.dsd.gov.au/_lib/pdf_doc/ism/ISM_Sep08_unclass.pdf
2 ▪ Data management for the Murray-Darling Basin Sustainable Yields Project © CSIRO 2008
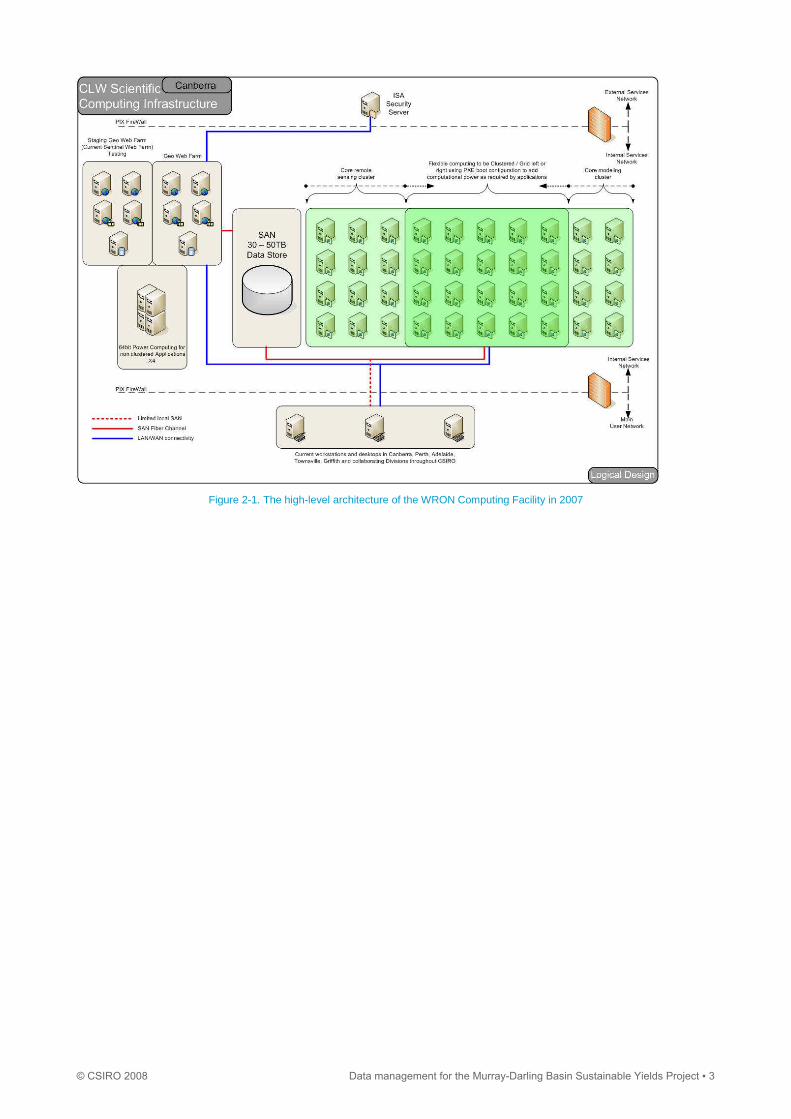
Figure 2-1. The high-level architecture of the WRON Computing Facility in 2007
© CSIRO 2008 Data management for the Murray-Darling Basin Sustainable Yields Project ▪ 3
3 Data management
In order to control and maintain the integrity of the project data a set of data management protocols were implemented.
For each of the four key project teams (Catchment Yield, River Modeling, Groundwater, Water Accounting and
Environmental Assessment) a Data Coordinator was nominated. It was this person’s role to ensure that the data
management protocols were being applied within the team. The data coordinators were data custodians for their
respective teams, and had responsibility for ensuring that all project data, software, code, maps, and report elements,
were archived in an appropriate location within the project archive. The MDBSY Project data management team included
a team leader, a project data manager, the project team data coordinators, and some additional data management
support staff.
The data coordinators were the first point of contact for any data-related problem in their project team. The data
coordinators could then guide teams through the process of solving any data problems. The data archiving process
involved team members saving new data/results in an appropriate staging area within their own working directory and
then notifying their data coordinator that the dataset was ready for upload to the project archive. The data coordinator
would then move the item into the project directory, and populate the record in the metadata catalogue.
3.1 Data permissions
The large storage volumes associated with the project inhibited the use of folder-level permissions for data security. A
set of permission ‘groups’ were therefore created in order to manage access to data on the WRON server, and to enable
specific access to the MDBSY project archive. Access to the WRON server was only available to CSIRO internal team
members. The permission groups were created to control data updates, editing, directory structure, versioning, etc. Read
access to project data was provided to all internal project staff. Higher permission levels required justification before they
were approved and applied. There were four permission group levels as follows:
• MDB_Storage_Administrator (full administrative control)
• MDB_Storage_Editor (can create/delete folders and files but cannot change permissions and ownership)
• MDB_Storage_Contributor (can read/write/create and modify files, but cannot delete or create folders)
• MDB_Storage_Reader (read and execute access to data)
3.2 Project data archive and workspaces
It was identified early in the project that in order to maintain data integrity it was essential that a project data archive
should be kept separate from working areas. The archive provided an organised set of data directories which enabled
the development of a structured audit trail for all project outputs. The project archive was created on the WRON facility
(ref Section 2) and was only accessible by CSIRO internal staff.
The MDBSY Project Archive contained directories for the 18 MDBSY reporting regions, an additional folder for the
Snowy region (99_Snowy), which was included in the Murrumbidgee and Murray reporting, and another directory for
whole-of-MDB data. Within each of the reporting region directories a directory for each project team was created Figure
3-1 illustrates the structure of the project archive directories.
The structure below each project team varied depending on the tasks being performed, and/or the number of models
being applied in the reporting region. The modelling directories for each project are outlined in the sections describing
each team’s structure. The modelling performed for each region is described in the regional reports and a broad outline
of the methods applied can be found in the ‘Overview of Project Methods’ report.
Individual datasets were contained within their own directory. Each dataset directory was designated with an underscore,
(‘_’) as the directory name prefix (eg. ‘_datasetname’). This allowed for identification of datasets by automatic metadata
tools.
4 ▪ Data management for the Murray-Darling Basin Sustainable Yields Project © CSIRO 2008
In some cases an individual dataset contained thousands of files. It was not deemed necessary nor efficient, to describe
(via a metadata statement) each data file stored. Therefore metadata statements described the dataset as a whole,
encompassing all files contributing to that data set.
Figure 3-1. Project archive directory structure
Personal work space was provided for project team staff to develop data, carry out model runs, create maps, develop
report spreadsheets, and to write documents. Data development was carried out on a separate server within the WRON
facility, away from the project archive directory. This was a smaller server with approximately 4 Tb of available storage.
Two directories located on the workspace server related to the MDBSY project. These were named 'Work' and 'dat'.
‘Work’ was used for individual project staff to develop data and to run models, prior to migration across to the Project
Archive. All final datasets, model runs, etc., were required to be moved from here into the project directory onto the data
archive with a metadata record fully populated for each dataset.
The ‘dat’ directory held some key datasets used as a basis for further data development, modelling inputs, and for the
creation of reference maps. This structure was utilised prior to the main Storage Access Network storage coming online
in the WRON server midway through 2007. The core datasets stored in ‘dat’ were later migrated across to the GIS
directory on the data archive for ongoing use as reference datasets.
Some modelling work required very large volumes of storage in order to run multiple scenarios using, and generating,
many thousands of files. To support this, a separate volume was created, which provided a further 9.5 Tb of storage.
Much of the river modelling and catchment yield rainfall runoff modelling work was performed on this server. These
datasets were structured to nest within the project archive structure so that the task of transferring the data into the
archive directory, once the modelling was finished, would be simplified, i.e. only one directory needed to be moved
across.
© CSIRO 2008 Data management for the Murray-Darling Basin Sustainable Yields Project ▪ 5
3.3 Data management within project team
3.3.1 Catchment yield modelling team
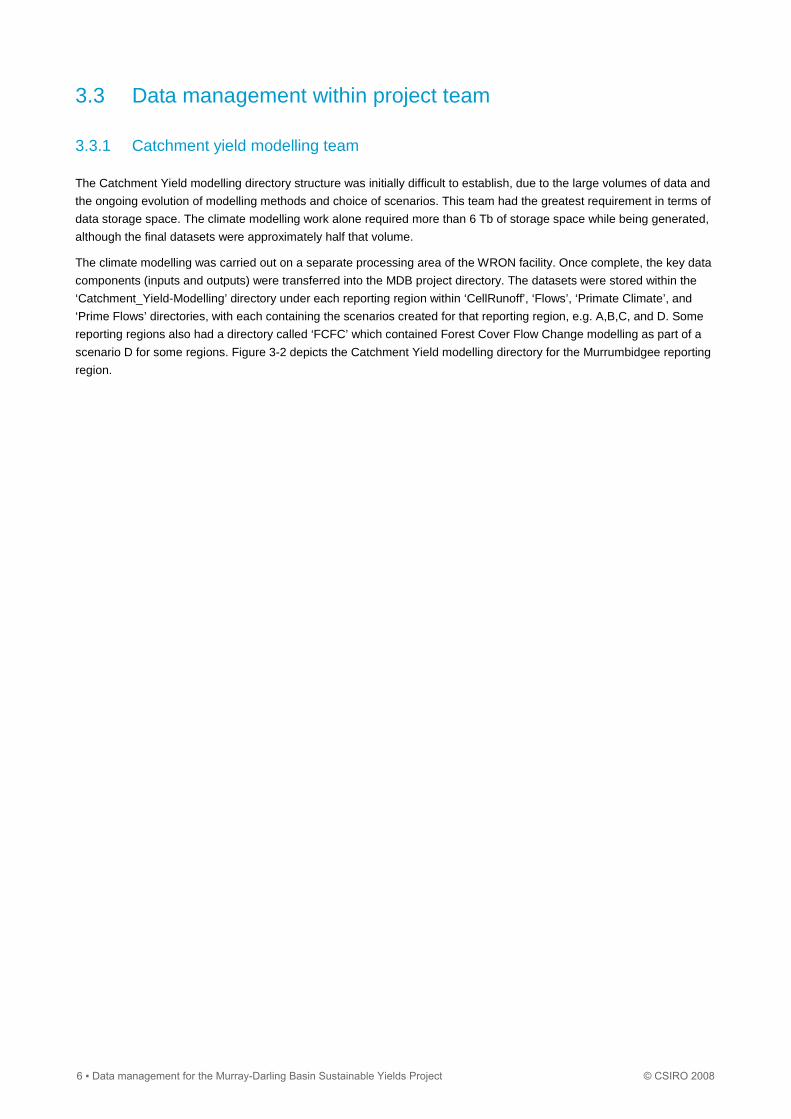
The Catchment Yield modelling directory structure was initially difficult to establish, due to the large volumes of data and
the ongoing evolution of modelling methods and choice of scenarios. This team had the greatest requirement in terms of
data storage space. The climate modelling work alone required more than 6 Tb of storage space while being generated,
although the final datasets were approximately half that volume.
The climate modelling was carried out on a separate processing area of the WRON facility. Once complete, the key data
components (inputs and outputs) were transferred into the MDB project directory. The datasets were stored within the
‘Catchment_Yield-Modelling’ directory under each reporting region within ‘CellRunoff’, ‘Flows’, ‘Primate Climate’, and
‘Prime Flows’ directories, with each containing the scenarios created for that reporting region, e.g. A,B,C, and D. Some
reporting regions also had a directory called ‘FCFC’ which contained Forest Cover Flow Change modelling as part of a
scenario D for some regions. Figure 3-2 depicts the Catchment Yield modelling directory for the Murrumbidgee reporting
region.
6 ▪ Data management for the Murray-Darling Basin Sustainable Yields Project © CSIRO 2008
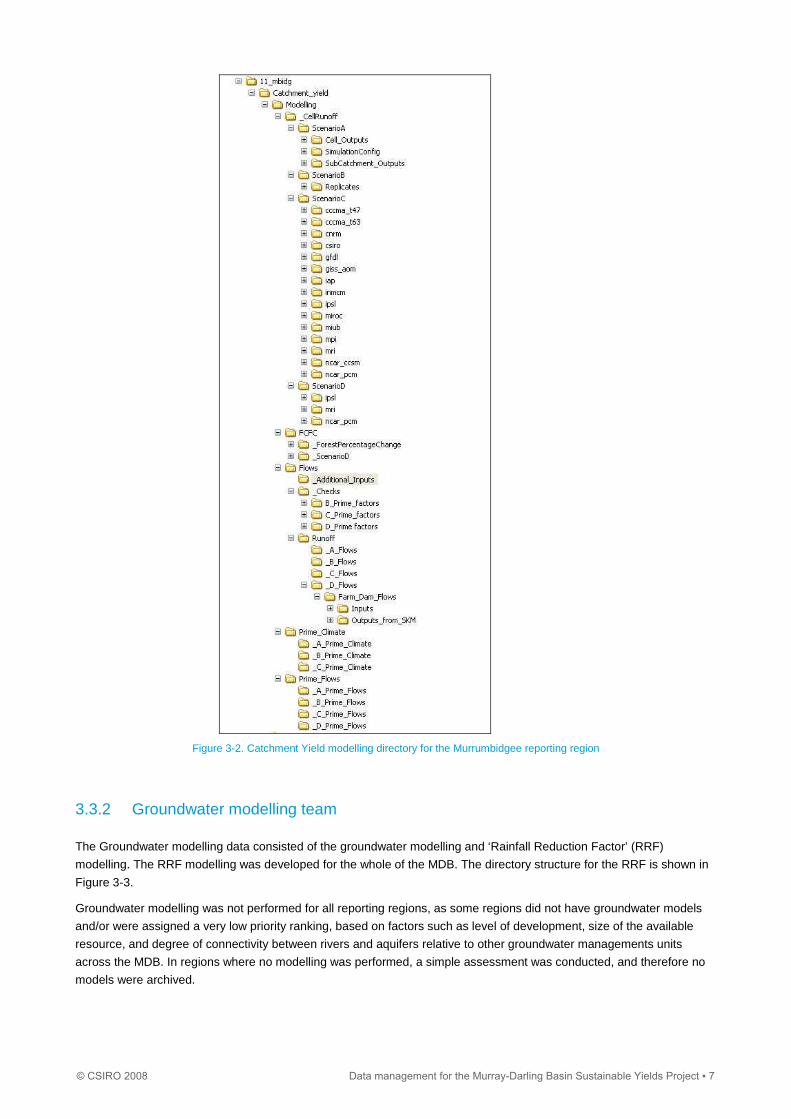
Figure 3-2. Catchment Yield modelling directory for the Murrumbidgee reporting region
3.3.2 Groundwater modelling team
The Groundwater modelling data consisted of the groundwater modelling and ‘Rainfall Reduction Factor’ (RRF)
modelling. The RRF modelling was developed for the whole of the MDB. The directory structure for the RRF is shown in
Figure 3-3.
Groundwater modelling was not performed for all reporting regions, as some regions did not have groundwater models
and/or were assigned a very low priority ranking, based on factors such as level of development, size of the available
resource, and degree of connectivity between rivers and aquifers relative to other groundwater managements units
across the MDB. In regions where no modelling was performed, a simple assessment was conducted, and therefore no
models were archived.
© CSIRO 2008 Data management for the Murray-Darling Basin Sustainable Yields Project ▪ 7
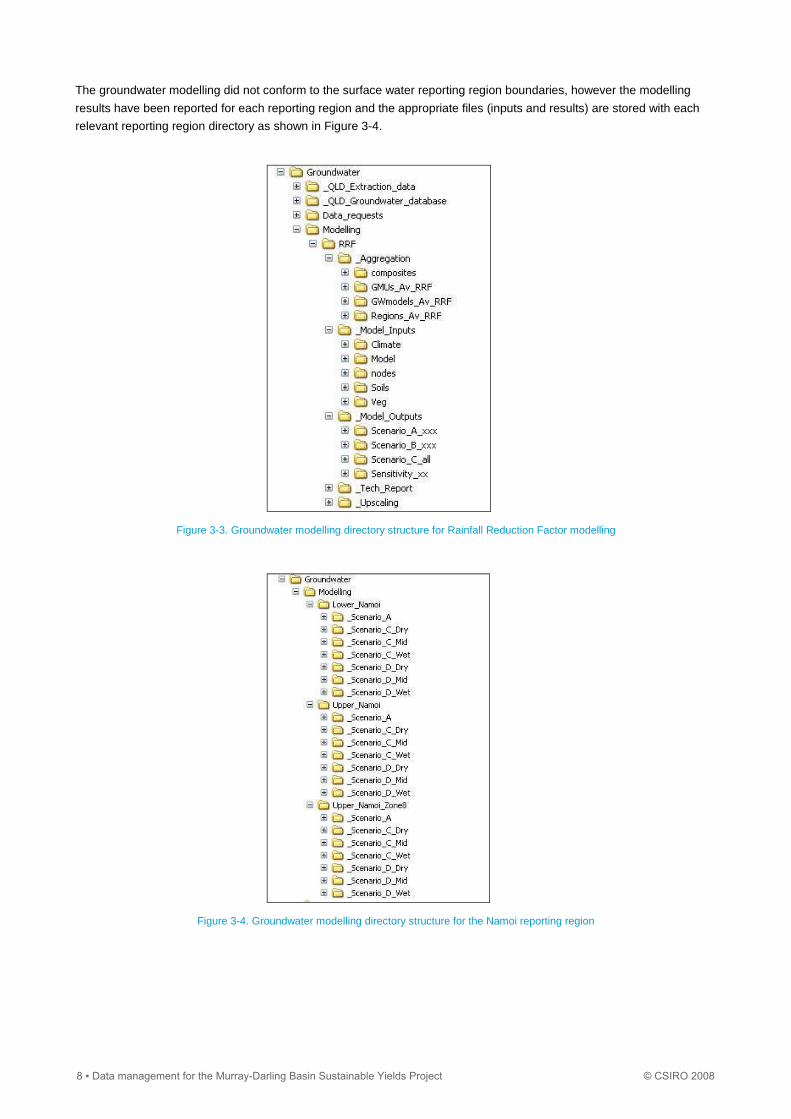
The groundwater modelling did not conform to the surface water reporting region boundaries, however the modelling
results have been reported for each reporting region and the appropriate files (inputs and results) are stored with each
relevant reporting region directory as shown in Figure 3-4.
Figure 3-3. Groundwater modelling directory structure for Rainfall Reduction Factor modelling
Figure 3-4. Groundwater modelling directory structure for the Namoi reporting region
8 ▪ Data management for the Murray-Darling Basin Sustainable Yields Project © CSIRO 2008
3.3.3 River modelling team
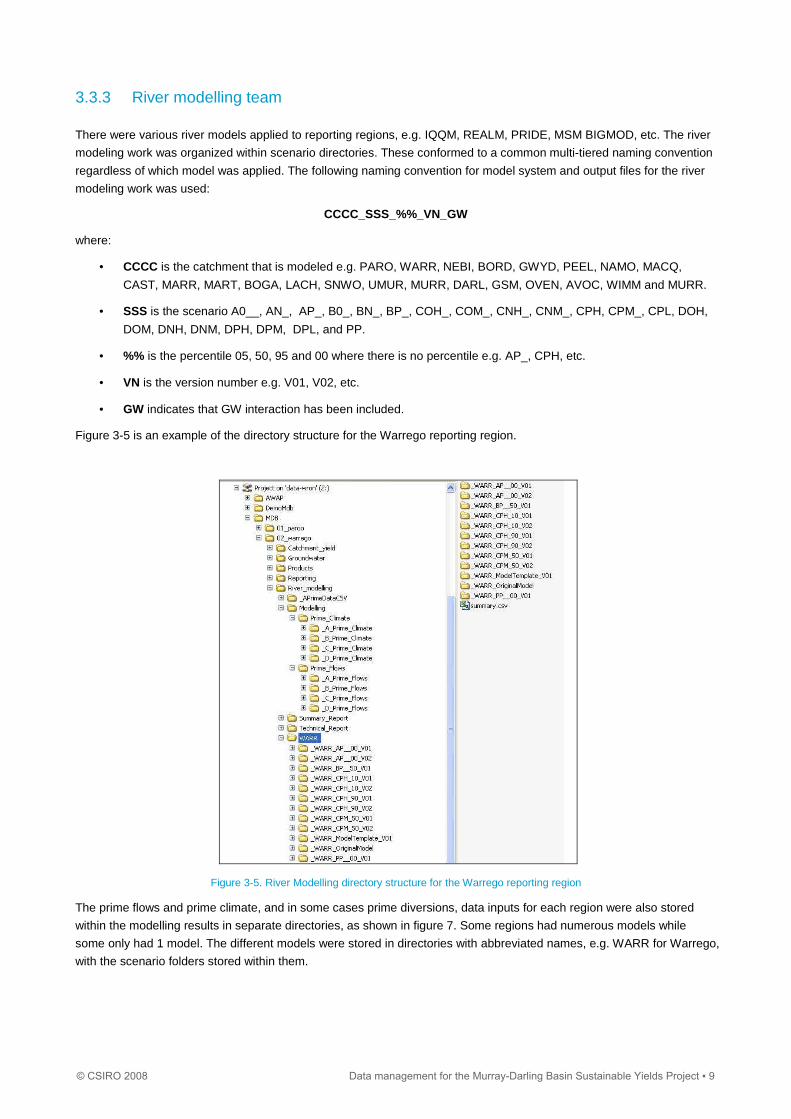
There were various river models applied to reporting regions, e.g. IQQM, REALM, PRIDE, MSM BIGMOD, etc. The river
modeling work was organized within scenario directories. These conformed to a common multi-tiered naming convention
regardless of which model was applied. The following naming convention for model system and output files for the river
modeling work was used:
CCCC_SSS_%%_VN_GW
where:
• CCCC is the catchment that is modeled e.g. PARO, WARR, NEBI, BORD, GWYD, PEEL, NAMO, MACQ,
CAST, MARR, MART, BOGA, LACH, SNWO, UMUR, MURR, DARL, GSM, OVEN, AVOC, WIMM and MURR.
• SSS is the scenario A0__, AN_, AP_, B0_, BN_, BP_, COH_, COM_, CNH_, CNM_, CPH, CPM_, CPL, DOH,
DOM, DNH, DNM, DPH, DPM, DPL, and PP.
• %% is the percentile 05, 50, 95 and 00 where there is no percentile e.g. AP_, CPH, etc.
• VN is the version number e.g. V01, V02, etc.
• GW indicates that GW interaction has been included.
Figure 3-5 is an example of the directory structure for the Warrego reporting region.
Figure 3-5. River Modelling directory structure for the Warrego reporting region
The prime flows and prime climate, and in some cases prime diversions, data inputs for each region were also stored
within the modelling results in separate directories, as shown in figure 7. Some regions had numerous models while
some only had 1 model. The different models were stored in directories with abbreviated names, e.g. WARR for Warrego,
with the scenario folders stored within them.
© CSIRO 2008 Data management for the Murray-Darling Basin Sustainable Yields Project ▪ 9
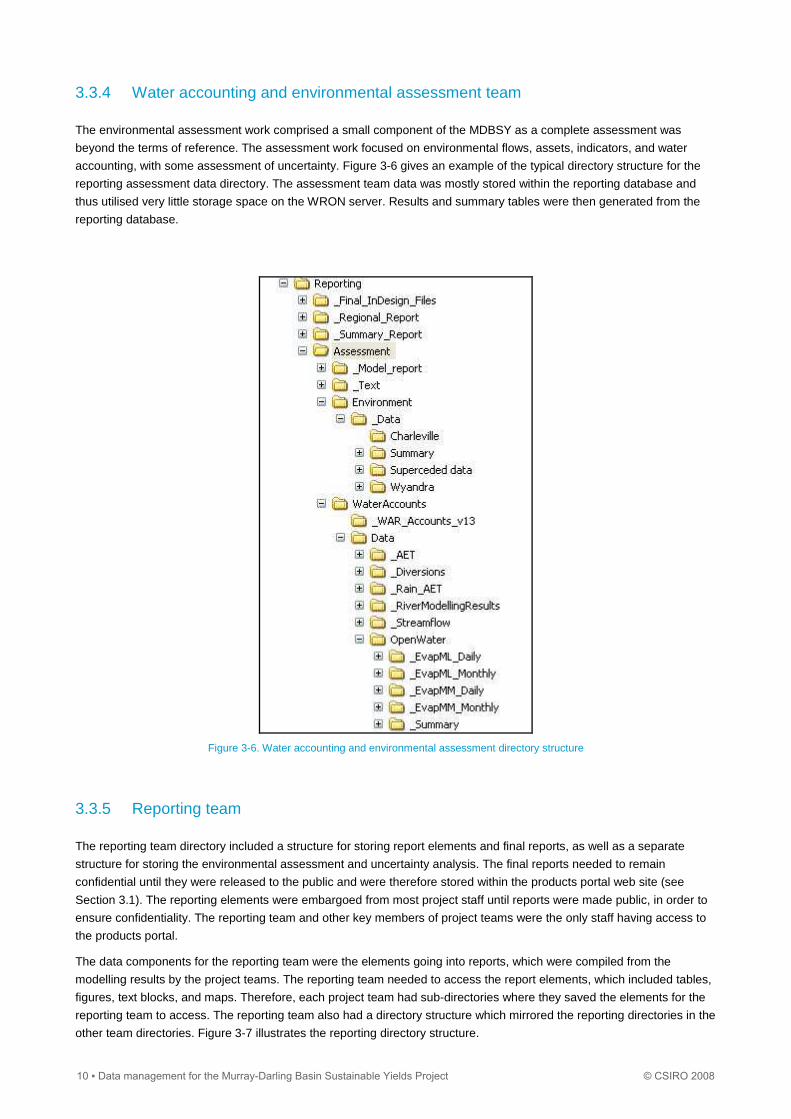
3.3.4 Water accounting and environmental assessment team
The environmental assessment work comprised a small component of the MDBSY as a complete assessment was
beyond the terms of reference. The assessment work focused on environmental flows, assets, indicators, and water
accounting, with some assessment of uncertainty. Figure 3-6 gives an example of the typical directory structure for the
reporting assessment data directory. The assessment team data was mostly stored within the reporting database and
thus utilised very little storage space on the WRON server. Results and summary tables were then generated from the
reporting database.
Figure 3-6. Water accounting and environmental assessment directory structure
3.3.5 Reporting team
The reporting team directory included a structure for storing report elements and final reports, as well as a separate
structure for storing the environmental assessment and uncertainty analysis. The final reports needed to remain
confidential until they were released to the public and were therefore stored within the products portal web site (see
Section 3.1). The reporting elements were embargoed from most project staff until reports were made public, in order to
ensure confidentiality. The reporting team and other key members of project teams were the only staff having access to
the products portal.
The data components for the reporting team were the elements going into reports, which were compiled from the
modelling results by the project teams. The reporting team needed to access the report elements, which included tables,
figures, text blocks, and maps. Therefore, each project team had sub-directories where they saved the elements for the
reporting team to access. The reporting team also had a directory structure which mirrored the reporting directories in the
other team directories. Figure 3-7 illustrates the reporting directory structure.
10 ▪ Data management for the Murray-Darling Basin Sustainable Yields Project © CSIRO 2008
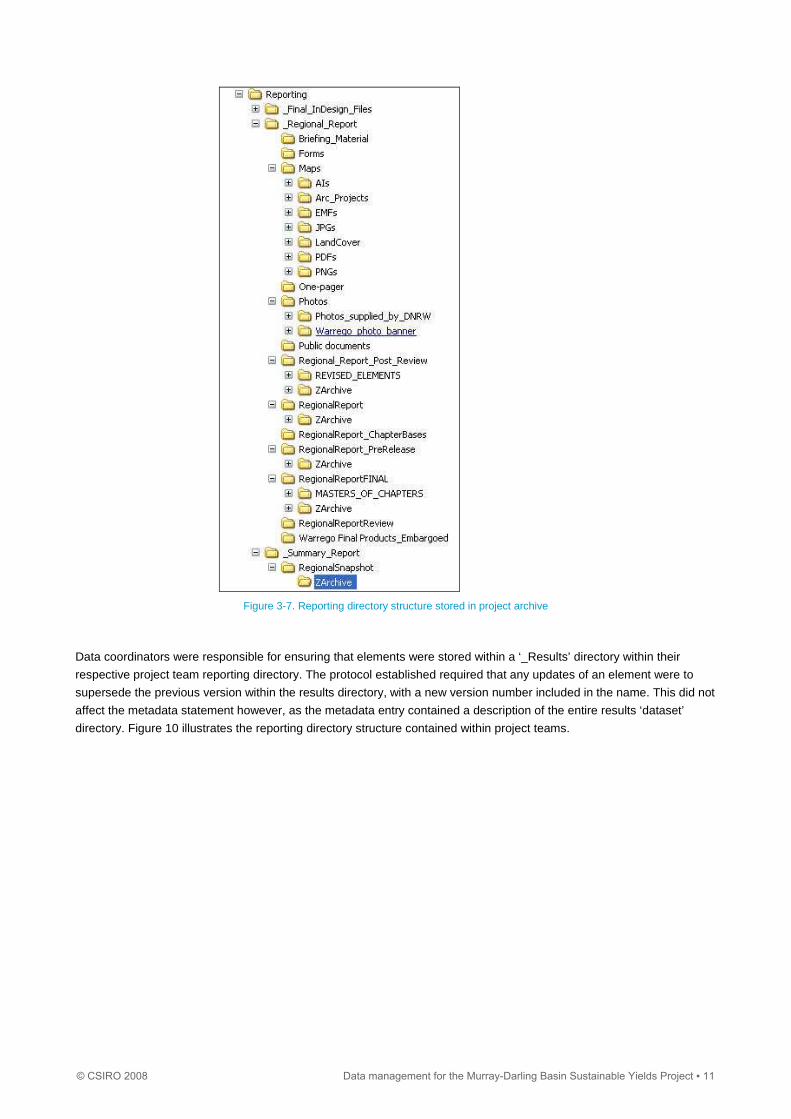
Figure 3-7. Reporting directory structure stored in project archive
Data coordinators were responsible for ensuring that elements were stored within a ‘_Results’ directory within their
respective project team reporting directory. The protocol established required that any updates of an element were to
supersede the previous version within the results directory, with a new version number included in the name. This did not
affect the metadata statement however, as the metadata entry contained a description of the entire results ‘dataset’
directory. Figure 10 illustrates the reporting directory structure contained within project teams.
© CSIRO 2008 Data management for the Murray-Darling Basin Sustainable Yields Project ▪ 11
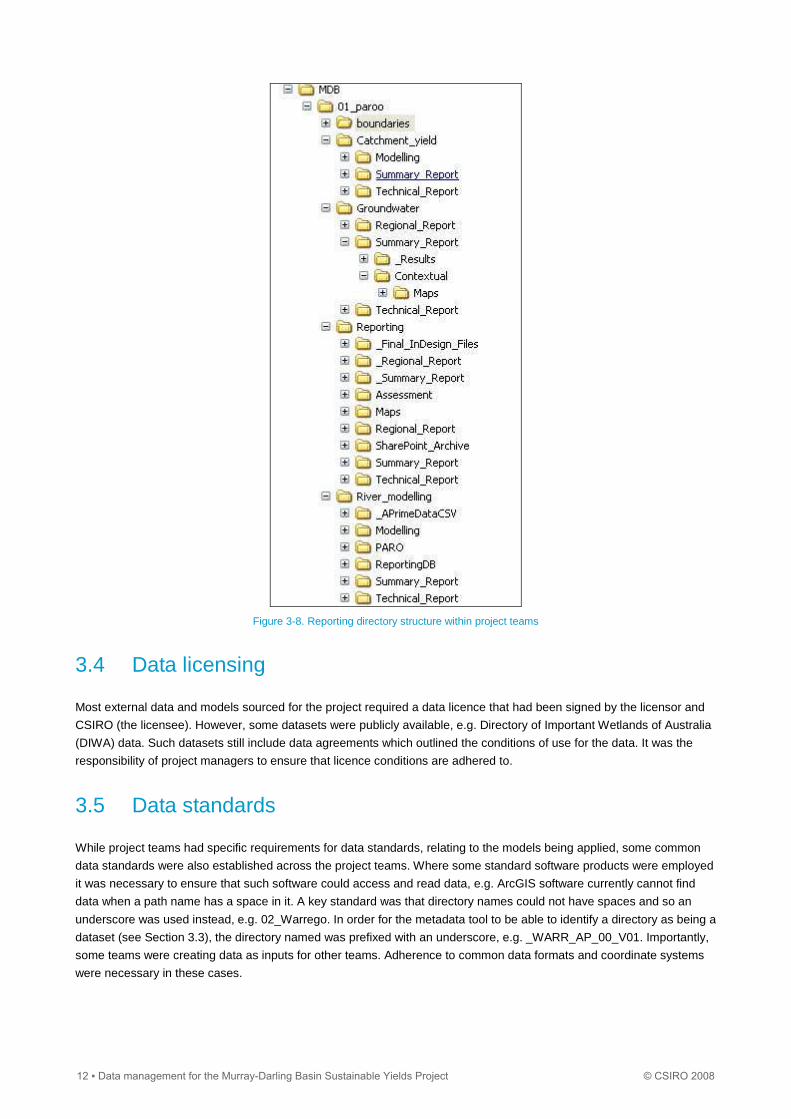
Figure 3-8. Reporting directory structure within project teams
3.4 Data licensing
Most external data and models sourced for the project required a data licence that had been signed by the licensor and
CSIRO (the licensee). However, some datasets were publicly available, e.g. Directory of Important Wetlands of Australia
(DIWA) data. Such datasets still include data agreements which outlined the conditions of use for the data. It was the
responsibility of project managers to ensure that licence conditions are adhered to.
3.5 Data standards
While project teams had specific requirements for data standards, relating to the models being applied, some common
data standards were also established across the project teams. Where some standard software products were employed
it was necessary to ensure that such software could access and read data, e.g. ArcGIS software currently cannot find
data when a path name has a space in it. A key standard was that directory names could not have spaces and so an
underscore was used instead, e.g. 02_Warrego. In order for the metadata tool to be able to identify a directory as being a
dataset (see Section 3.3), the directory named was prefixed with an underscore, e.g. _WARR_AP_00_V01. Importantly,
some teams were creating data as inputs for other teams. Adherence to common data formats and coordinate systems
were necessary in these cases.
12 ▪ Data management for the Murray-Darling Basin Sustainable Yields Project © CSIRO 2008
3.5.1 Data formats
The ArcGIS software suite was used to develop GIS data layers and to create maps throughout the project. The standard
format for GIS data used in the project was the ESRI shapefile format.
Comma delimited files (.csv) were most commonly used for both input and output formats for model runs. Some models
had formats specific to the modelling software and so there was some conversions carried out as post-processing
operations, such as for the IQQM surface water modelling.
It is interesting to note that many of the file formats used in the project (.csv in particular) are relatively inefficient when it
comes to use of storage space. For most projects this is not usually a concern as the number of files is relatively small
and the ease with which they can be manipulated far outweighs any inefficiencies. However, in a project the size of the
MDBSY, inefficient file formats do become an issue. For example, at one point during project it was estimated that the
commas within CSV files were consuming a terabyte of storage alone. At the time, there were considerable constraints
on storage space with an ever increasing demand for space in contrast, it was found that storage of the data within a
relational database, reduce storage space requirement considerably. For this reason, and many other reasons, such
technologies should be seriously concerned for future projects.
3.5.2 Naming conventions
Naming conventions were mostly dependent upon requirements for model inputs within each project team, such for the
river modelling scenario directory names as previously mentioned. There was adherence to a naming convention
required for the reporting elements, so that the reporting team could determine which elements were encompassed by a
particular excel spreadsheet or text document.
The reporting elements had a naming convention which encompassed the reporting region, the report chapter, the
element number for the report, and the version of the element to account for updates if they occur. For example
‘02_SW3_37_v10.xls’ refers to the surface water results for the Warrego region for elements between 3 and 37, with this
being version 10 of the results. The version reference was critical as there were often small changes made to
spreadsheets by reporting team members, as well as version updates being requested from project teams.
3.5.3 Coordinate systems
The standard projections used for the spatial data in the project were:
• Geographic, GDA94, based on the SILO data – used for data processing
• Lambert GDA94 MDBC Standard Projection – used for mapping
The Lamberts projection was the preference for mapping as there was minimal distortion of shape on the regions with projected data compared with geographic coordinate data.
© CSIRO 2008 Data management for the Murray-Darling Basin Sustainable Yields Project ▪ 13
4 Data management tools
4.1 SharePoint web sites
4.1.1 MDB Partner portal
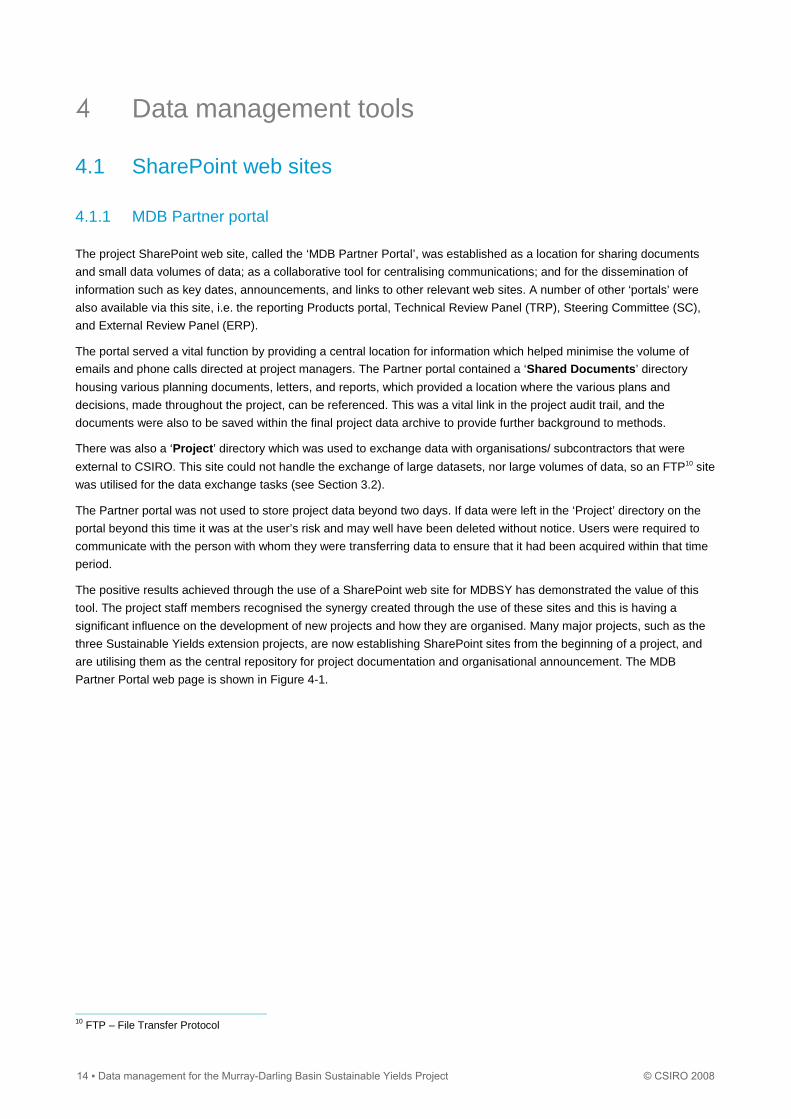
The project SharePoint web site, called the ‘MDB Partner Portal’, was established as a location for sharing documents
and small data volumes of data; as a collaborative tool for centralising communications; and for the dissemination of
information such as key dates, announcements, and links to other relevant web sites. A number of other ‘portals’ were
also available via this site, i.e. the reporting Products portal, Technical Review Panel (TRP), Steering Committee (SC),
and External Review Panel (ERP).
The portal served a vital function by providing a central location for information which helped minimise the volume of
emails and phone calls directed at project managers. The Partner portal contained a ‘Shared Documents ’ directory
housing various planning documents, letters, and reports, which provided a location where the various plans and
decisions, made throughout the project, can be referenced. This was a vital link in the project audit trail, and the
documents were also to be saved within the final project data archive to provide further background to methods.
There was also a ‘Project ’ directory which was used to exchange data with organisations/ subcontractors that were
external to CSIRO. This site could not handle the exchange of large datasets, nor large volumes of data, so an FTP10 site
was utilised for the data exchange tasks (see Section 3.2).
The Partner portal was not used to store project data beyond two days. If data were left in the ‘Project’ directory on the
portal beyond this time it was at the user’s risk and may well have been deleted without notice. Users were required to
communicate with the person with whom they were transferring data to ensure that it had been acquired within that time
period.
The positive results achieved through the use of a SharePoint web site for MDBSY has demonstrated the value of this
tool. The project staff members recognised the synergy created through the use of these sites and this is having a
significant influence on the development of new projects and how they are organised. Many major projects, such as the
three Sustainable Yields extension projects, are now establishing SharePoint sites from the beginning of a project, and
are utilising them as the central repository for project documentation and organisational announcement. The MDB
Partner Portal web page is shown in Figure 4-1.
10 FTP – File Transfer Protocol
14 ▪ Data management for the Murray-Darling Basin Sustainable Yields Project © CSIRO 2008
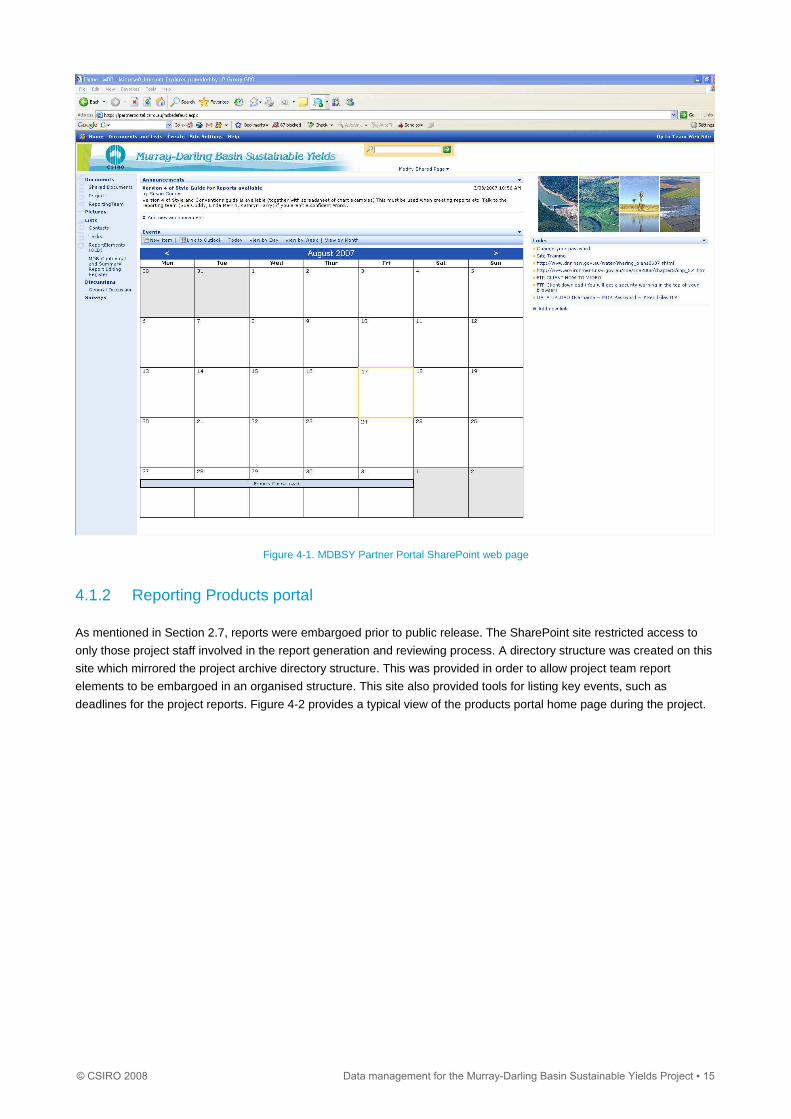
Figure 4-1. MDBSY Partner Portal SharePoint web page
4.1.2 Reporting Products portal
As mentioned in Section 2.7, reports were embargoed prior to public release. The SharePoint site restricted access to
only those project staff involved in the report generation and reviewing process. A directory structure was created on this
site which mirrored the project archive directory structure. This was provided in order to allow project team report
elements to be embargoed in an organised structure. This site also provided tools for listing key events, such as
deadlines for the project reports. Figure 4-2 provides a typical view of the products portal home page during the project.
© CSIRO 2008 Data management for the Murray-Darling Basin Sustainable Yields Project ▪ 15
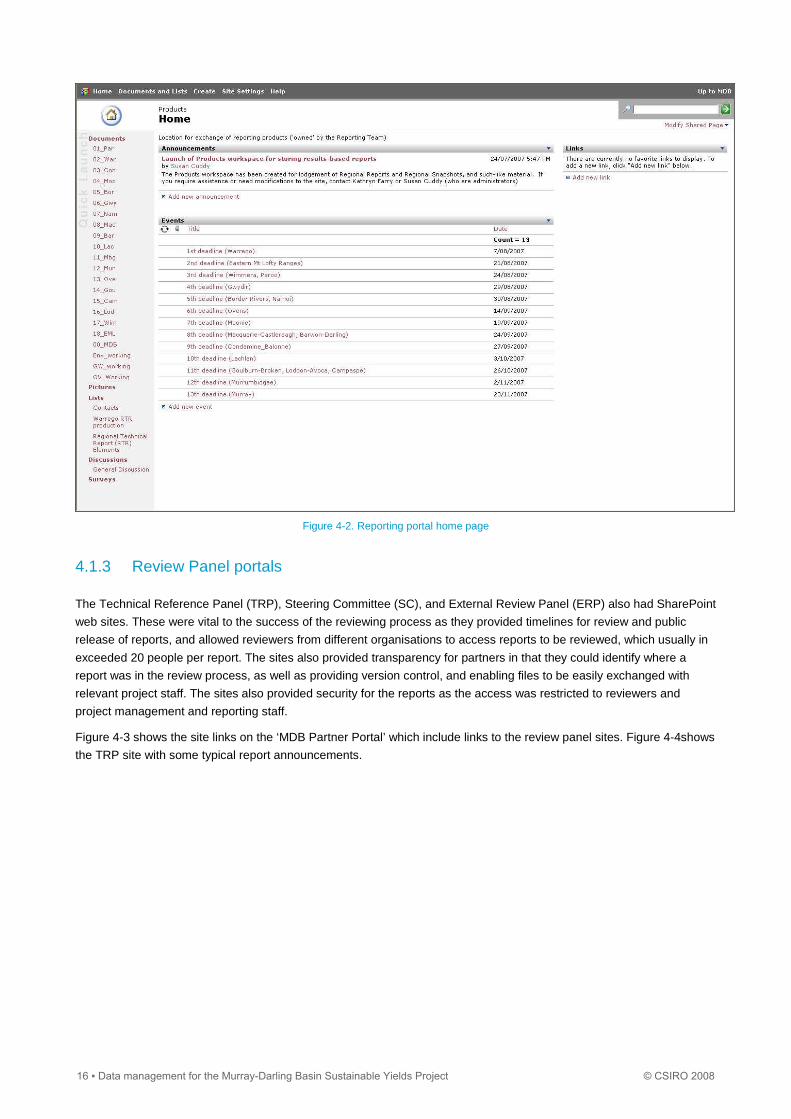
Figure 4-2. Reporting portal home page
4.1.3 Review Panel portals
The Technical Reference Panel (TRP), Steering Committee (SC), and External Review Panel (ERP) also had SharePoint
web sites. These were vital to the success of the reviewing process as they provided timelines for review and public
release of reports, and allowed reviewers from different organisations to access reports to be reviewed, which usually in
exceeded 20 people per report. The sites also provided transparency for partners in that they could identify where a
report was in the review process, as well as providing version control, and enabling files to be easily exchanged with
relevant project staff. The sites also provided security for the reports as the access was restricted to reviewers and
project management and reporting staff.
Figure 4-3 shows the site links on the ‘MDB Partner Portal’ which include links to the review panel sites. Figure 4-4shows
the TRP site with some typical report announcements.
16 ▪ Data management for the Murray-Darling Basin Sustainable Yields Project © CSIRO 2008
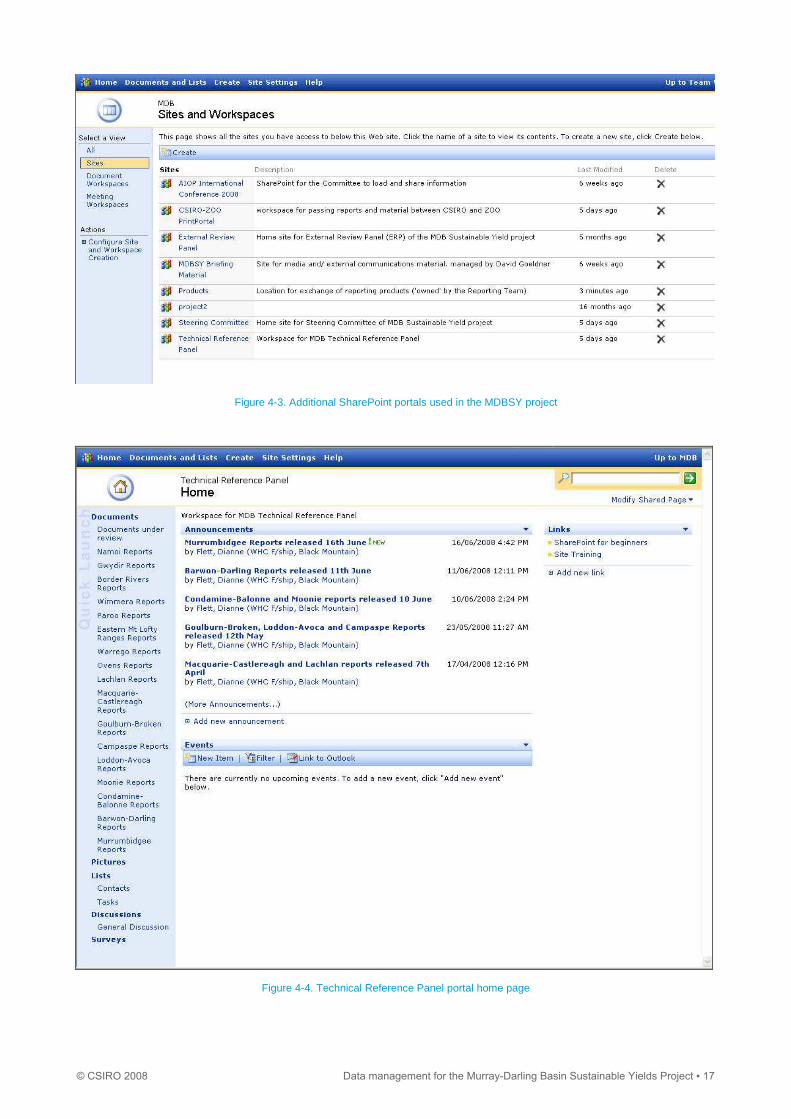
Figure 4-3. Additional SharePoint portals used in the MDBSY project
Figure 4-4. Technical Reference Panel portal home page
© CSIRO 2008 Data management for the Murray-Darling Basin Sustainable Yields Project ▪ 17
4.2 External data transfer via FTP
It was necessary to exchange data with external organisations in order to develop data and models for the project.
External project partners were not able to directly access the WRON facility due to the firewall protection. Originally the
project partner portal was used to fulfil this requirement; however, the portal was not designed to handle the large
volumes of data being transferred. An FTP site was therefore established for the project to provide this functionality.
The FTP site was a mirror of the project data store and was only to be used for transfer of data externally. As for the
team areas on the Partner Portal, it was not used to store data beyond a couple of days. The home page of the ‘MDB
Partner Portal’ provided a link to for access to the FTP software download, as well as a ‘How to…’ video demonstration
for using the software, and login details for users. The FTP directories were not physically located on the WRON server,
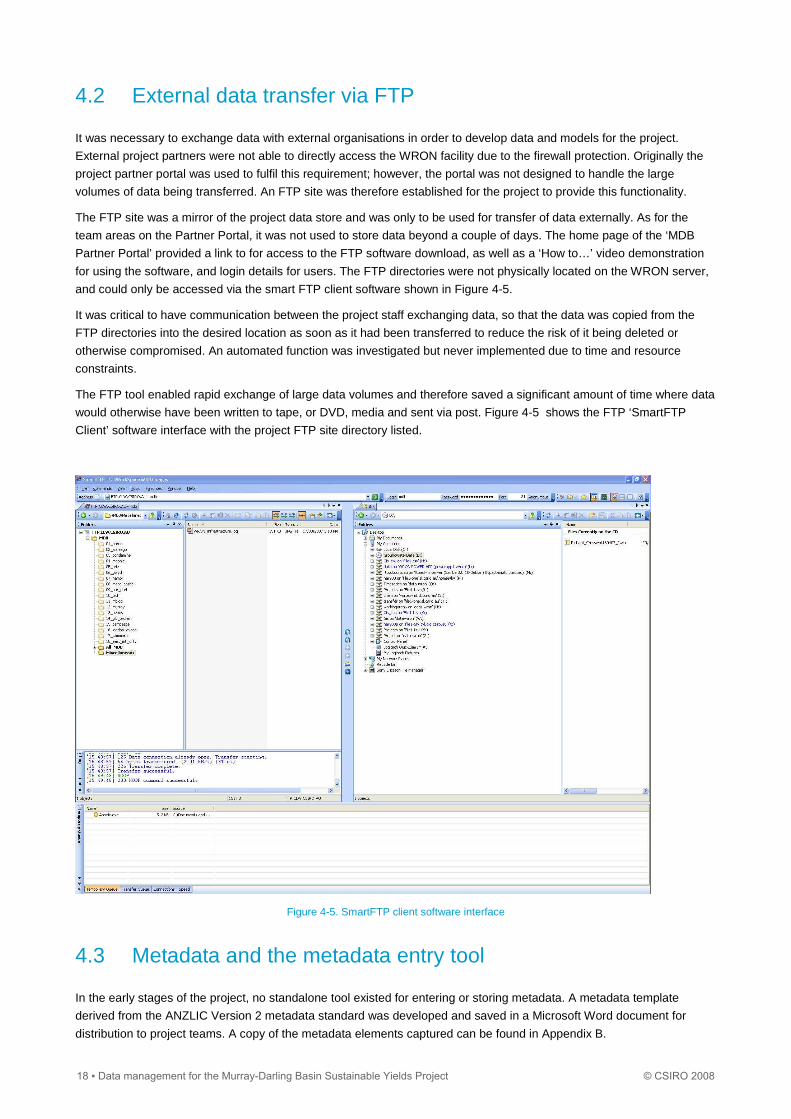
and could only be accessed via the smart FTP client software shown in Figure 4-5.
It was critical to have communication between the project staff exchanging data, so that the data was copied from the
FTP directories into the desired location as soon as it had been transferred to reduce the risk of it being deleted or
otherwise compromised. An automated function was investigated but never implemented due to time and resource
constraints.
The FTP tool enabled rapid exchange of large data volumes and therefore saved a significant amount of time where data
would otherwise have been written to tape, or DVD, media and sent via post. Figure 4-5 shows the FTP ‘SmartFTP
Client’ software interface with the project FTP site directory listed.
Figure 4-5. SmartFTP client software interface
4.3 Metadata and the metadata entry tool
In the early stages of the project, no standalone tool existed for entering or storing metadata. A metadata template
derived from the ANZLIC Version 2 metadata standard was developed and saved in a Microsoft Word document for
distribution to project teams. A copy of the metadata elements captured can be found in Appendix B.
18 ▪ Data management for the Murray-Darling Basin Sustainable Yields Project © CSIRO 2008
Metadata was initially entered within a metadata word document with the document title matching the dataset name for
each dataset, and saved within the data directory. This was a stop-gap approach employed while an online metadata
catalogue tool was developed.
Metadata statements were written to encapsulate all components within the dataset directory. In many cases this
amounted to thousands of files and so the description needed to provide enough detail to describe how the contents of
the dataset directory were utilised.
A web-based metadata catalogue was developed half way through 2007 which utilised an abbreviated form of the
metadata template originally developed. The catalogue employs a web-based GUI11 which interfaces with a relational
database, where the metadata is stored. The tool allows users to describe the dataset once it is stored within the project
directory structure.
As noted previously, datasets were identified by prefacing the dataset directory with an underscore character (ie “_”).
This allowed the metadata tool to ‘recognise’ the directory as a dataset. When a new dataset directory was created on
the project archive, a metadata record for the dataset was automatically created in the metadata database. At this stage
the record contained null fields and required metadata details to be entered via the web-based GUI.
Login
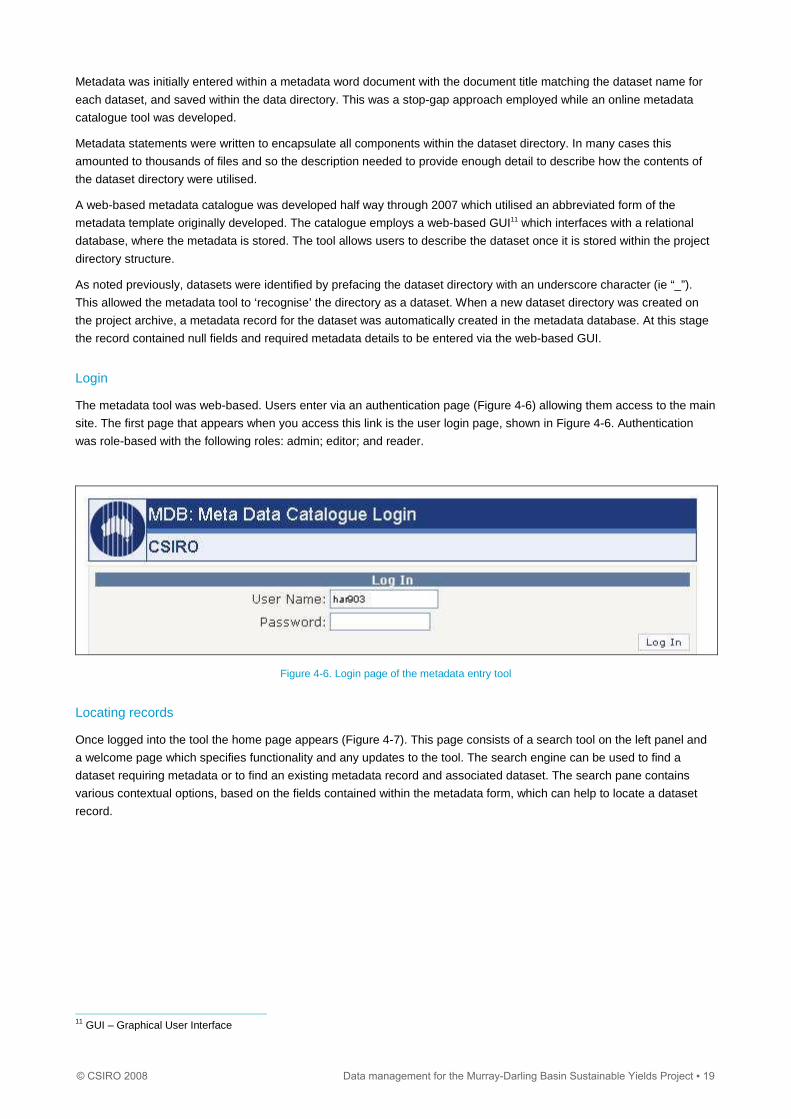
The metadata tool was web-based. Users enter via an authentication page (Figure 4-6) allowing them access to the main
site. The first page that appears when you access this link is the user login page, shown in Figure 4-6. Authentication
was role-based with the following roles: admin; editor; and reader.
Figure 4-6. Login page of the metadata entry tool
Locating records
Once logged into the tool the home page appears (Figure 4-7). This page consists of a search tool on the left panel and
a welcome page which specifies functionality and any updates to the tool. The search engine can be used to find a
dataset requiring metadata or to find an existing metadata record and associated dataset. The search pane contains
various contextual options, based on the fields contained within the metadata form, which can help to locate a dataset
record.
11 GUI – Graphical User Interface
© CSIRO 2008 Data management for the Murray-Darling Basin Sustainable Yields Project ▪ 19
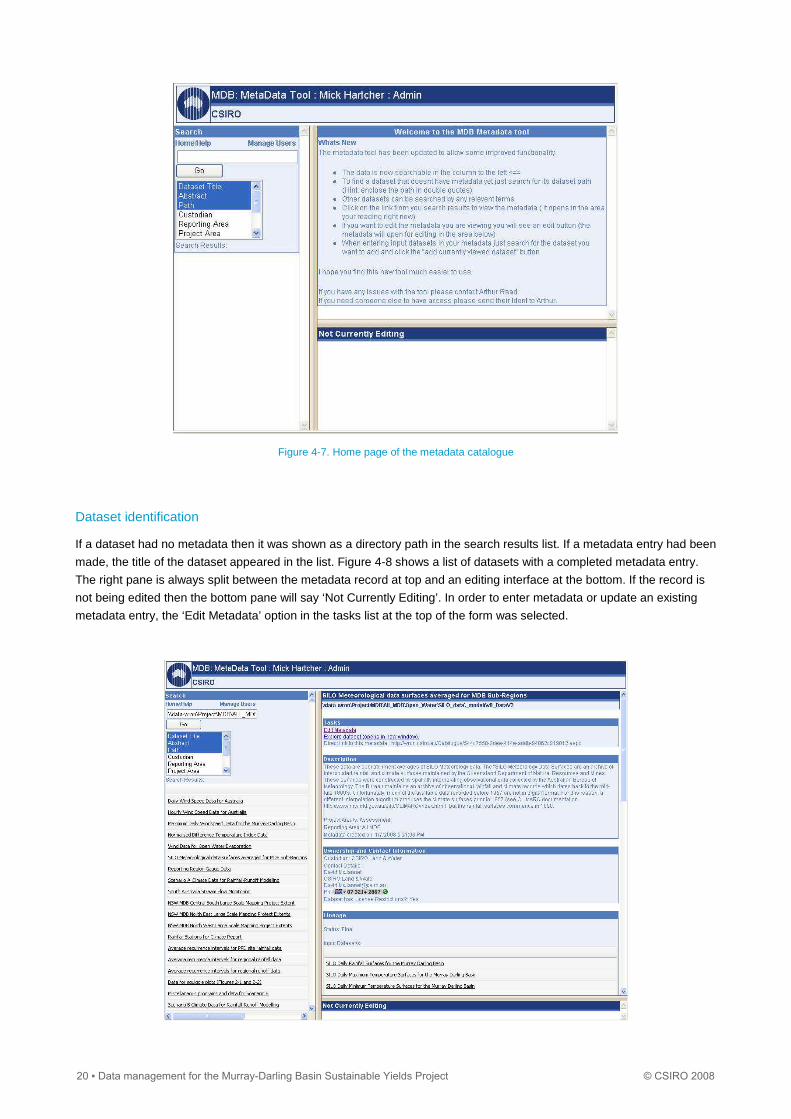
Figure 4-7. Home page of the metadata catalogue
Dataset identification
If a dataset had no metadata then it was shown as a directory path in the search results list. If a metadata entry had been
made, the title of the dataset appeared in the list. Figure 4-8 shows a list of datasets with a completed metadata entry.
The right pane is always split between the metadata record at top and an editing interface at the bottom. If the record is
not being edited then the bottom pane will say ‘Not Currently Editing’. In order to enter metadata or update an existing
metadata entry, the ‘Edit Metadata’ option in the tasks list at the top of the form was selected.
20 ▪ Data management for the Murray-Darling Basin Sustainable Yields Project © CSIRO 2008
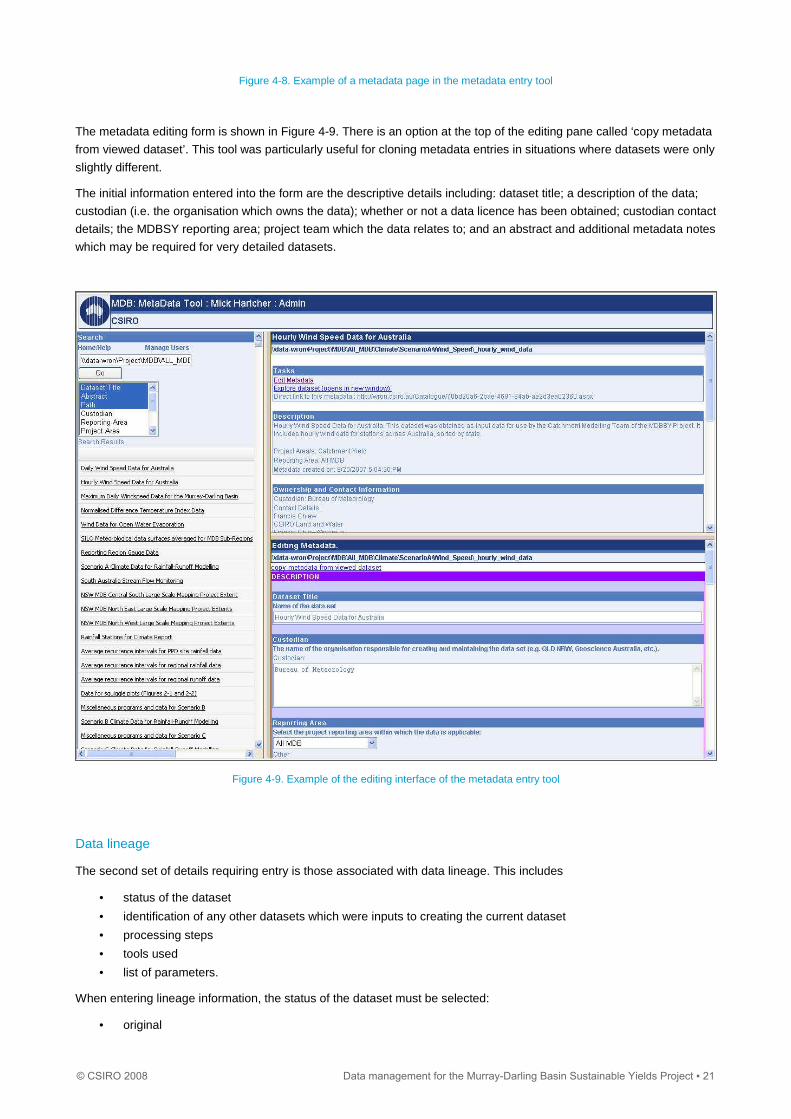
Figure 4-8. Example of a metadata page in the metadata entry tool
The metadata editing form is shown in Figure 4-9. There is an option at the top of the editing pane called ‘copy metadata
from viewed dataset’. This tool was particularly useful for cloning metadata entries in situations where datasets were only
slightly different.
The initial information entered into the form are the descriptive details including: dataset title; a description of the data;
custodian (i.e. the organisation which owns the data); whether or not a data licence has been obtained; custodian contact
details; the MDBSY reporting area; project team which the data relates to; and an abstract and additional metadata notes
which may be required for very detailed datasets.
Figure 4-9. Example of the editing interface of the metadata entry tool
Data lineage
The second set of details requiring entry is those associated with data lineage. This includes
• status of the dataset
• identification of any other datasets which were inputs to creating the current dataset
• processing steps
• tools used
• list of parameters.
When entering lineage information, the status of the dataset must be selected:
• original
© CSIRO 2008 Data management for the Murray-Darling Basin Sustainable Yields Project ▪ 21
• intermediate
• for external review
• final
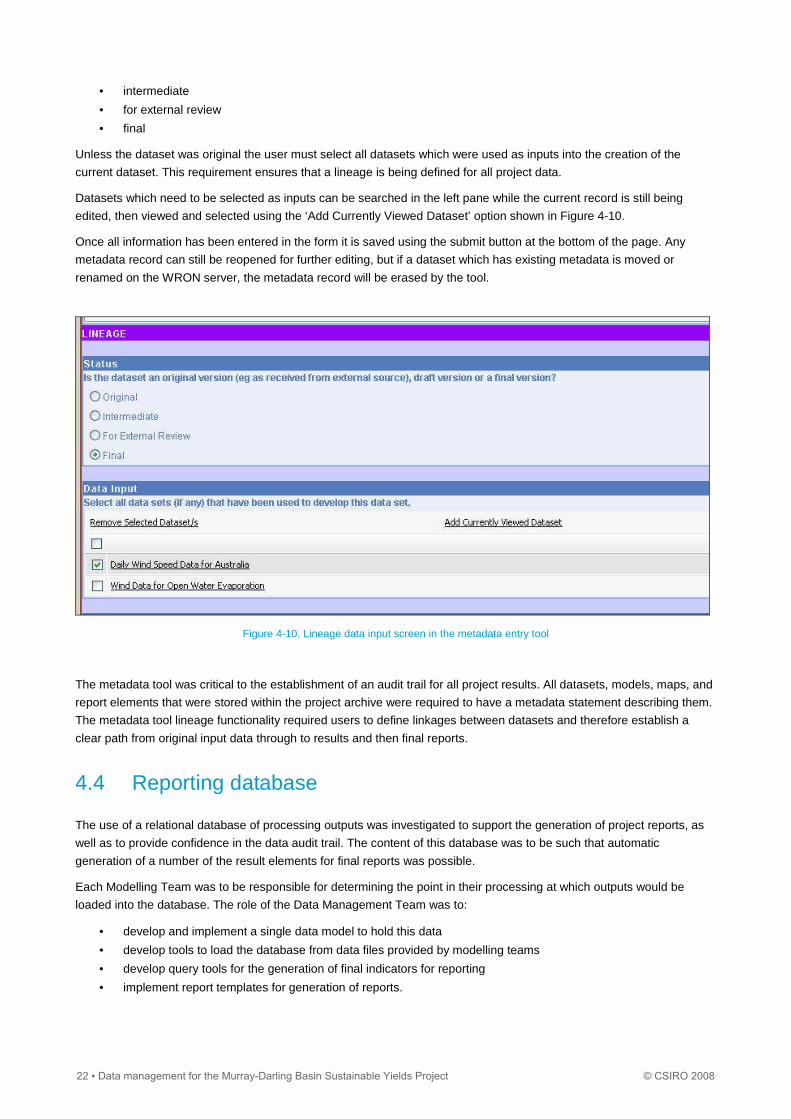
Unless the dataset was original the user must select all datasets which were used as inputs into the creation of the
current dataset. This requirement ensures that a lineage is being defined for all project data.
Datasets which need to be selected as inputs can be searched in the left pane while the current record is still being
edited, then viewed and selected using the ‘Add Currently Viewed Dataset’ option shown in Figure 4-10.
Once all information has been entered in the form it is saved using the submit button at the bottom of the page. Any
metadata record can still be reopened for further editing, but if a dataset which has existing metadata is moved or
renamed on the WRON server, the metadata record will be erased by the tool.
Figure 4-10. Lineage data input screen in the metadata entry tool
The metadata tool was critical to the establishment of an audit trail for all project results. All datasets, models, maps, and
report elements that were stored within the project archive were required to have a metadata statement describing them.
The metadata tool lineage functionality required users to define linkages between datasets and therefore establish a
clear path from original input data through to results and then final reports.
4.4 Reporting database
The use of a relational database of processing outputs was investigated to support the generation of project reports, as
well as to provide confidence in the data audit trail. The content of this database was to be such that automatic
generation of a number of the result elements for final reports was possible.
Each Modelling Team was to be responsible for determining the point in their processing at which outputs would be
loaded into the database. The role of the Data Management Team was to:
• develop and implement a single data model to hold this data
• develop tools to load the database from data files provided by modelling teams
• develop query tools for the generation of final indicators for reporting
• implement report templates for generation of reports.
22 ▪ Data management for the Murray-Darling Basin Sustainable Yields Project © CSIRO 2008
The intention was that as much of the final reports as possible will be directly produced from the database including all
table based information. The hope was to limit the amount of reformatting required to create the final released
documents.
An important aspect of this database was that it would form a vital link in the data audit trail. That is, through this
database, it was to be possible to directly link reported results to original input data. This would be achieved through
capture of some of the final analysis steps in code (queries) as well as storage of links to input data files.
The data audit trail could then be constructed in the following way:
• Reported results come directly from the reporting database and are generated through stored code.
• The database also contains a link to the original data input file for every piece of information stored. These files
must be stored within the project directory structure.
• As these files are stored on the project data directory, they will be required to have an associated metadata
statement.
• Metadata statements include links to datasets used to create the described dataset.
These input datasets will also be stored within the project directory structure and hence must also have metadata
statements.
Development of the Reporting Database proved ambitious given the project timeframes. The River Modelling and Water
Accounting and Assessment Teams were the only teams to participate in the experiment which had some good early
results. A simple data model built around model results was developed, data loaders were built and deployed, data for a
number of reporting regions were loaded and early products were delivered.
4.5 Document management
The ‘TRIM12’ system is used for archiving audit records, i.e. decisions made for processes within project, staffing
documents relating to appointments, expenditure (e.g. purchase of equipment such as desks and stationery), project
events, salaries, and documents relating to data licences and correspondence. A unique number is assigned to each
document and details of the document entered into the TRIM system through a GUI form shown in Figure 4-11. This
system enabled project leaders to keep track of key documents relating to data agreements and decisions related to
data/document workflow within the project.
12 TRIM is a commercial document management tool used within CSIRO.
© CSIRO 2008 Data management for the Murray-Darling Basin Sustainable Yields Project ▪ 23
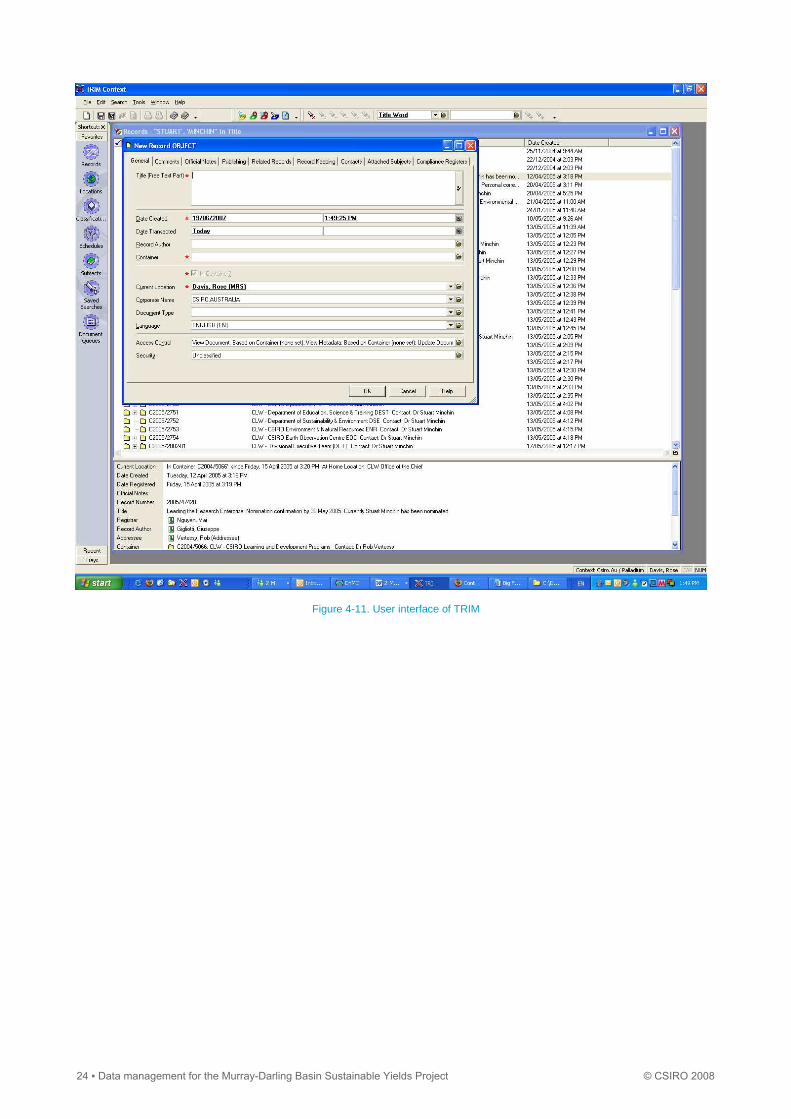
Figure 4-11. User interface of TRIM
24 ▪ Data management for the Murray-Darling Basin Sustainable Yields Project © CSIRO 2008
5 Data auditing
For the MDBSY project, all data components, ranging from original inputs through to final products, were fully
documented with metadata and legally covered by data licence agreements where appropriate. It is possible that
elements of the project may need to be regenerated to reproduce results – for example, regeneration of modelling results,
maps, and even reports, as well as possibly sharing out of data to other agencies. It is therefore necessary that any
result can be regenerated exactly as it was originally produced with no variation in modelling outputs, and that it is
possible to verify the inputs to models. To meet this requirement it was necessary to ensure that all project data,
modelling software, model parameters, results, and reports were archived within the project archive directory and/or
metadata catalogue.
5.1 Audit trail
In order to meet the requirements outlined above, it was necessary to ensure that there was a complete audit trail for all
project data, software, model parameters, results, and reports. The audit trail relies on the metadata catalogue
(described in Section 3.3), which was developed within CSIRO specifically for the MDBSY project. Data coordinators
within each project team were responsible for ensuring that all datasets were archived in the project directory and that
they all had metadata entered describing their origin, and indicating what other datasets, if any, were used to create them.
The data management protocols and archiving processes were created such that the audit trail could be fully established.
Every effort was made by the data management team, to ensure that all required components were archived. However, it
is possible that some components of the trail have not been accounted for, e.g. where post-processing has occurred with
corrections applied to modelling outputs in spreadsheets based on known errors in modelling parameters.
A complicating factor was the need to source vital details on datasets from numerous project staff in different teams,
some of whom worked for organisations outside of CSIRO. Often several staff were involved in the creation of a single
metadata statement due to the division of work components and/or expertise within teams.
Archiving the large volumes, and wide variety, of datasets, used in and generated by the project, created a number of
challenges. Demarcating the working space and the project archive directories was necessary for maintaining data
integrity – however this posed problems as the data components developed within working directories needed to be
moved into the project archive prior to metadata creation. As discussed in Section 2.2, this was relatively straightforward
for model runs with well defined directory structures. However, where datasets included, for example ArcMap documents
and various assorted GIS layers and/or images, it was difficult to identify files nested away in individual work directories.
In addition, once all of these data components were moved, the pathways within ArcMap documents and model code
were redundant and needed to be updated. It is therefore possible that some small data components have been
overlooked and not archived by project teams.
5.2 Auditing methods
The Metadata Cataloguing Tool developed for the project required that the lineage of all datasets be described, and that
any datasets used as inputs for the development of another dataset be listed within the metadata statement. As
metadata was created for all reports and reporting elements, it should be possible to identify the path by which individual
results were generated data.
The approach taken was to firstly establish that the key modelling datasets for each reporting region were archived. In
many cases these were obvious, although project team members responsible for running the models had to be consulted
to ensure that all relevant files were included. This process was carried out by using the metadata tool to search the
project archive for those models known to have been run in each region. In many cases this highlighted gaps in the
archive which required further data files to be transferred from work space locations. In addition, some post-processing
datasets were uncovered which also were subsequently archived, e.g. IQQM post-processing data.
© CSIRO 2008 Data management for the Murray-Darling Basin Sustainable Yields Project ▪ 25
The quality of metadata records was also checked to ensure adequate detail had been supplied. Quality control of
metadata was difficult to enforce as it was often unclear if the detail on a specific dataset was enough to describe all files
associated with that dataset. Data lineage quality was less difficult to measure as it was in most cases obvious which
datasets were inputs to or derived from another dataset.
Given the large volume (over a thousand) of datasets involved in the project, a process of randomly selecting metadata
records from key datasets for each region provided an efficient basis for checking the quality of metadata entries.
Feedback to metadata custodians also allowed them to make updates to a range of records which further improved the
quality.
26 ▪ Data management for the Murray-Darling Basin Sustainable Yields Project © CSIRO 2008
Appendix A MDBSY Datasets
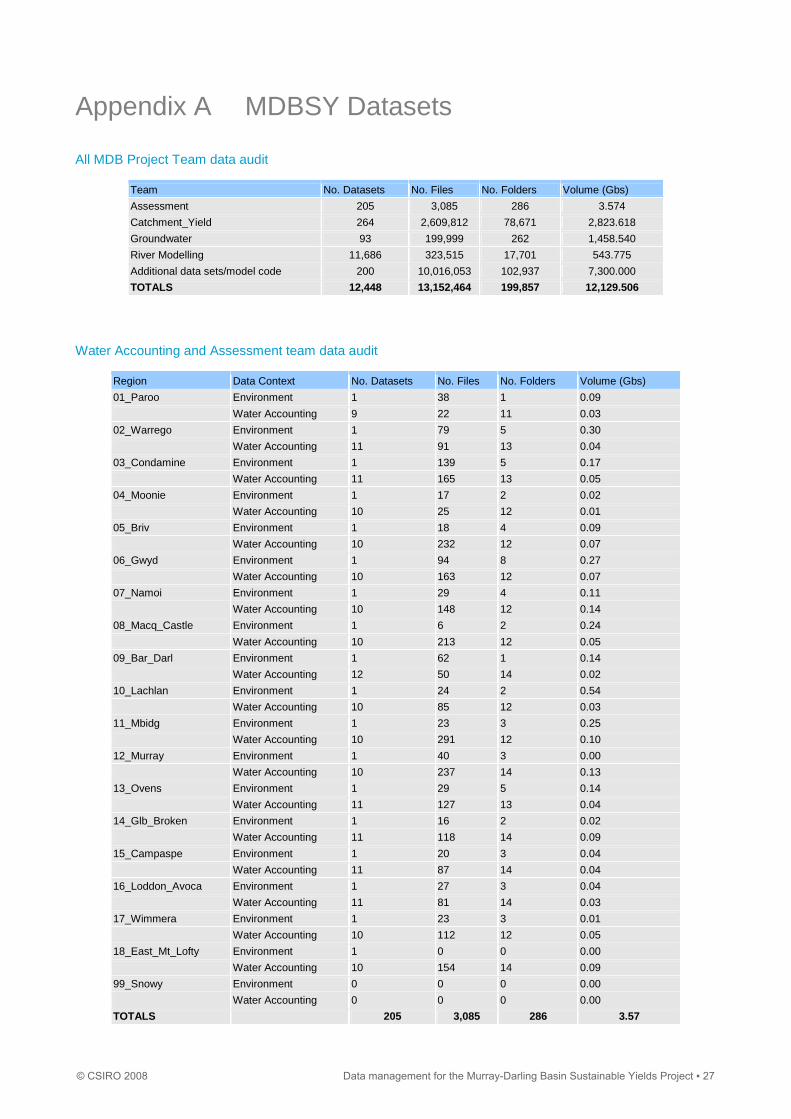
All MDB Project Team data audit
Team No. Datasets No. Files No. Folders Volume (Gbs)
Assessment 205 3,085 286 3.574
Catchment_Yield 264 2,609,812 78,671 2,823.618
Groundwater 93 199,999 262 1,458.540
River Modelling 11,686 323,515 17,701 543.775
Additional data sets/model code 200 10,016,053 102,937 7,300.000
TOTALS 12,448 13,152,464 199,857 12,129.506
Water Accounting and Assessment team data audit
Region Data Context No. Datasets No. Files No. Folders Volume (Gbs)
01_Paroo Environment 1 38 1 0.09
Water Accounting 9 22 11 0.03
02_Warrego Environment 1 79 5 0.30
Water Accounting 11 91 13 0.04
03_Condamine Environment 1 139 5 0.17
Water Accounting 11 165 13 0.05
04_Moonie Environment 1 17 2 0.02
Water Accounting 10 25 12 0.01
05_Briv Environment 1 18 4 0.09
Water Accounting 10 232 12 0.07
06_Gwyd Environment 1 94 8 0.27
Water Accounting 10 163 12 0.07
07_Namoi Environment 1 29 4 0.11
Water Accounting 10 148 12 0.14
08_Macq_Castle Environment 1 6 2 0.24
Water Accounting 10 213 12 0.05
09_Bar_Darl Environment 1 62 1 0.14
Water Accounting 12 50 14 0.02
10_Lachlan Environment 1 24 2 0.54
Water Accounting 10 85 12 0.03
11_Mbidg Environment 1 23 3 0.25
Water Accounting 10 291 12 0.10
12_Murray Environment 1 40 3 0.00
Water Accounting 10 237 14 0.13
13_Ovens Environment 1 29 5 0.14
Water Accounting 11 127 13 0.04
14_Glb_Broken Environment 1 16 2 0.02
Water Accounting 11 118 14 0.09
15_Campaspe Environment 1 20 3 0.04
Water Accounting 11 87 14 0.04
16_Loddon_Avoca Environment 1 27 3 0.04
Water Accounting 11 81 14 0.03
17_Wimmera Environment 1 23 3 0.01
Water Accounting 10 112 12 0.05
18_East_Mt_Lofty Environment 1 0 0 0.00
Water Accounting 10 154 14 0.09
99_Snowy Environment 0 0 0 0.00
Water Accounting 0 0 0 0.00
TOTALS 205 3,085 286 3.57
© CSIRO 2008 Data management for the Murray-Darling Basin Sustainable Yields Project ▪ 27
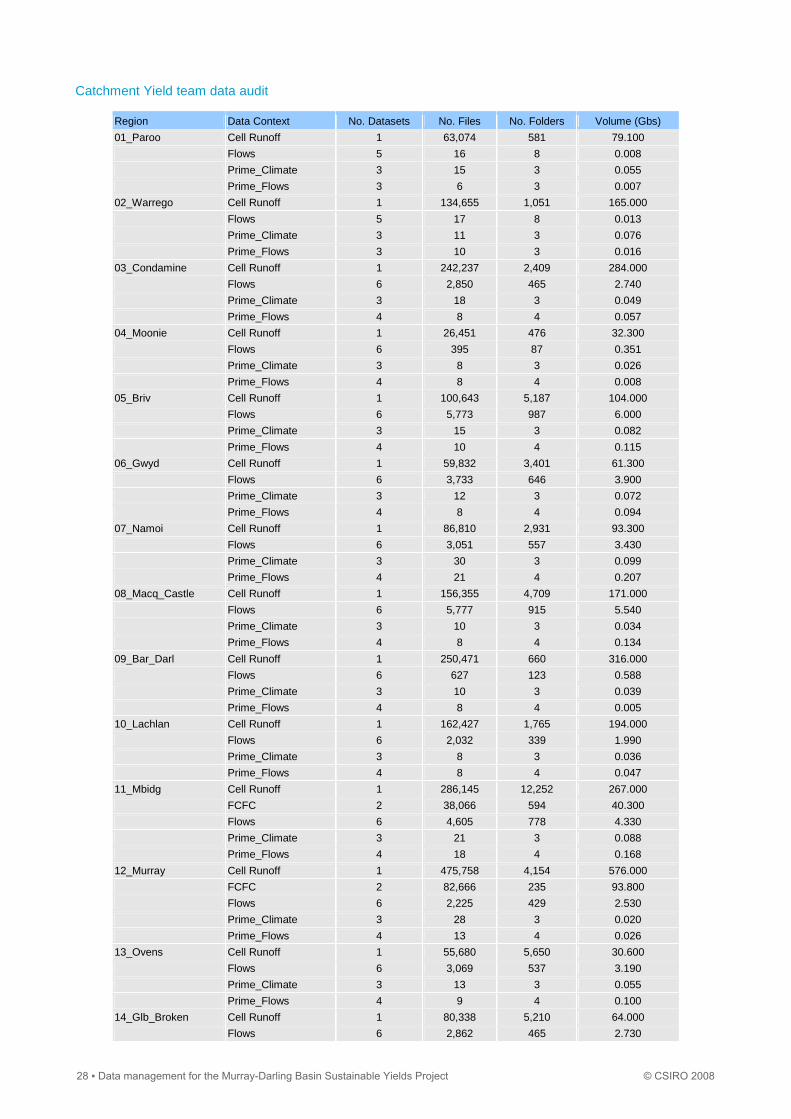
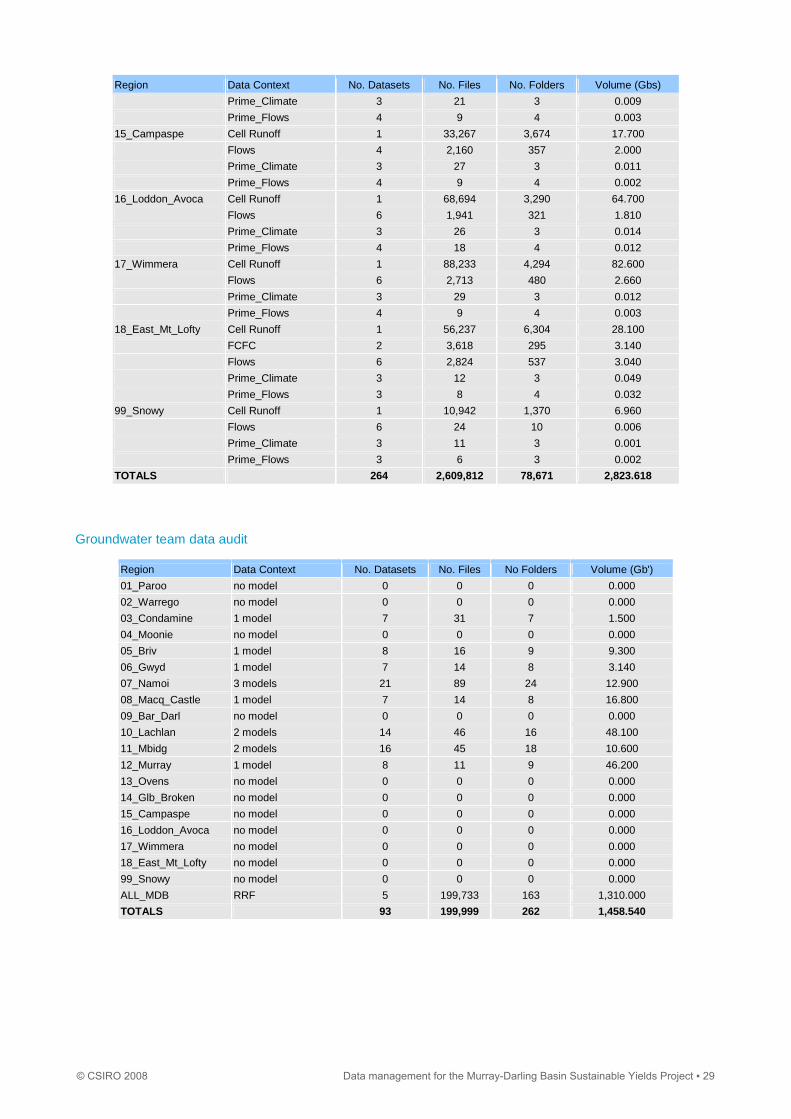
Catchment Yield team data audit
Region Data Context No. Datasets No. Files No. Folders Volume (Gbs)
01_Paroo Cell Runoff 1 63,074 581 79.100
Flows 5 16 8 0.008
Prime_Climate 3 15 3 0.055
Prime_Flows 3 6 3 0.007
02_Warrego Cell Runoff 1 134,655 1,051 165.000
Flows 5 17 8 0.013
Prime_Climate 3 11 3 0.076
Prime_Flows 3 10 3 0.016
03_Condamine Cell Runoff 1 242,237 2,409 284.000
Flows 6 2,850 465 2.740
Prime_Climate 3 18 3 0.049
Prime_Flows 4 8 4 0.057
04_Moonie Cell Runoff 1 26,451 476 32.300
Flows 6 395 87 0.351
Prime_Climate 3 8 3 0.026
Prime_Flows 4 8 4 0.008
05_Briv Cell Runoff 1 100,643 5,187 104.000
Flows 6 5,773 987 6.000
Prime_Climate 3 15 3 0.082
Prime_Flows 4 10 4 0.115
06_Gwyd Cell Runoff 1 59,832 3,401 61.300
Flows 6 3,733 646 3.900
Prime_Climate 3 12 3 0.072
Prime_Flows 4 8 4 0.094
07_Namoi Cell Runoff 1 86,810 2,931 93.300
Flows 6 3,051 557 3.430
Prime_Climate 3 30 3 0.099
Prime_Flows 4 21 4 0.207
08_Macq_Castle Cell Runoff 1 156,355 4,709 171.000
Flows 6 5,777 915 5.540
Prime_Climate 3 10 3 0.034
Prime_Flows 4 8 4 0.134
09_Bar_Darl Cell Runoff 1 250,471 660 316.000
Flows 6 627 123 0.588
Prime_Climate 3 10 3 0.039
Prime_Flows 4 8 4 0.005
10_Lachlan Cell Runoff 1 162,427 1,765 194.000
Flows 6 2,032 339 1.990
Prime_Climate 3 8 3 0.036
Prime_Flows 4 8 4 0.047
11_Mbidg Cell Runoff 1 286,145 12,252 267.000
FCFC 2 38,066 594 40.300
Flows 6 4,605 778 4.330
Prime_Climate 3 21 3 0.088
Prime_Flows 4 18 4 0.168
12_Murray Cell Runoff 1 475,758 4,154 576.000
FCFC 2 82,666 235 93.800
Flows 6 2,225 429 2.530
Prime_Climate 3 28 3 0.020
Prime_Flows 4 13 4 0.026
13_Ovens Cell Runoff 1 55,680 5,650 30.600
Flows 6 3,069 537 3.190
Prime_Climate 3 13 3 0.055
Prime_Flows 4 9 4 0.100
14_Glb_Broken Cell Runoff 1 80,338 5,210 64.000
Flows 6 2,862 465 2.730
28 ▪ Data management for the Murray-Darling Basin Sustainable Yields Project © CSIRO 2008
Region Data Context No. Datasets No. Files No. Folders Volume (Gbs)
Prime_Climate 3 21 3 0.009
Prime_Flows 4 9 4 0.003
15_Campaspe Cell Runoff 1 33,267 3,674 17.700
Flows 4 2,160 357 2.000
Prime_Climate 3 27 3 0.011
Prime_Flows 4 9 4 0.002
16_Loddon_Avoca Cell Runoff 1 68,694 3,290 64.700
Flows 6 1,941 321 1.810
Prime_Climate 3 26 3 0.014
Prime_Flows 4 18 4 0.012
17_Wimmera Cell Runoff 1 88,233 4,294 82.600
Flows 6 2,713 480 2.660
Prime_Climate 3 29 3 0.012
Prime_Flows 4 9 4 0.003
18_East_Mt_Lofty Cell Runoff 1 56,237 6,304 28.100
FCFC 2 3,618 295 3.140
Flows 6 2,824 537 3.040
Prime_Climate 3 12 3 0.049
Prime_Flows 3 8 4 0.032
99_Snowy Cell Runoff 1 10,942 1,370 6.960
Flows 6 24 10 0.006
Prime_Climate 3 11 3 0.001
Prime_Flows 3 6 3 0.002
TOTALS 264 2,609,812 78,671 2,823.618
Groundwater team data audit
Region Data Context No. Datasets No. Files No Folders Volume (Gb')
01_Paroo no model 0 0 0 0.000
02_Warrego no model 0 0 0 0.000
03_Condamine 1 model 7 31 7 1.500
04_Moonie no model 0 0 0 0.000
05_Briv 1 model 8 16 9 9.300
06_Gwyd 1 model 7 14 8 3.140
07_Namoi 3 models 21 89 24 12.900
08_Macq_Castle 1 model 7 14 8 16.800
09_Bar_Darl no model 0 0 0 0.000
10_Lachlan 2 models 14 46 16 48.100
11_Mbidg 2 models 16 45 18 10.600
12_Murray 1 model 8 11 9 46.200
13_Ovens no model 0 0 0 0.000
14_Glb_Broken no model 0 0 0 0.000
15_Campaspe no model 0 0 0 0.000
16_Loddon_Avoca no model 0 0 0 0.000
17_Wimmera no model 0 0 0 0.000
18_East_Mt_Lofty no model 0 0 0 0.000
99_Snowy no model 0 0 0 0.000
ALL_MDB RRF 5 199,733 163 1,310.000
TOTALS 93 199,999 262 1,458.540
© CSIRO 2008 Data management for the Murray-Darling Basin Sustainable Yields Project ▪ 29
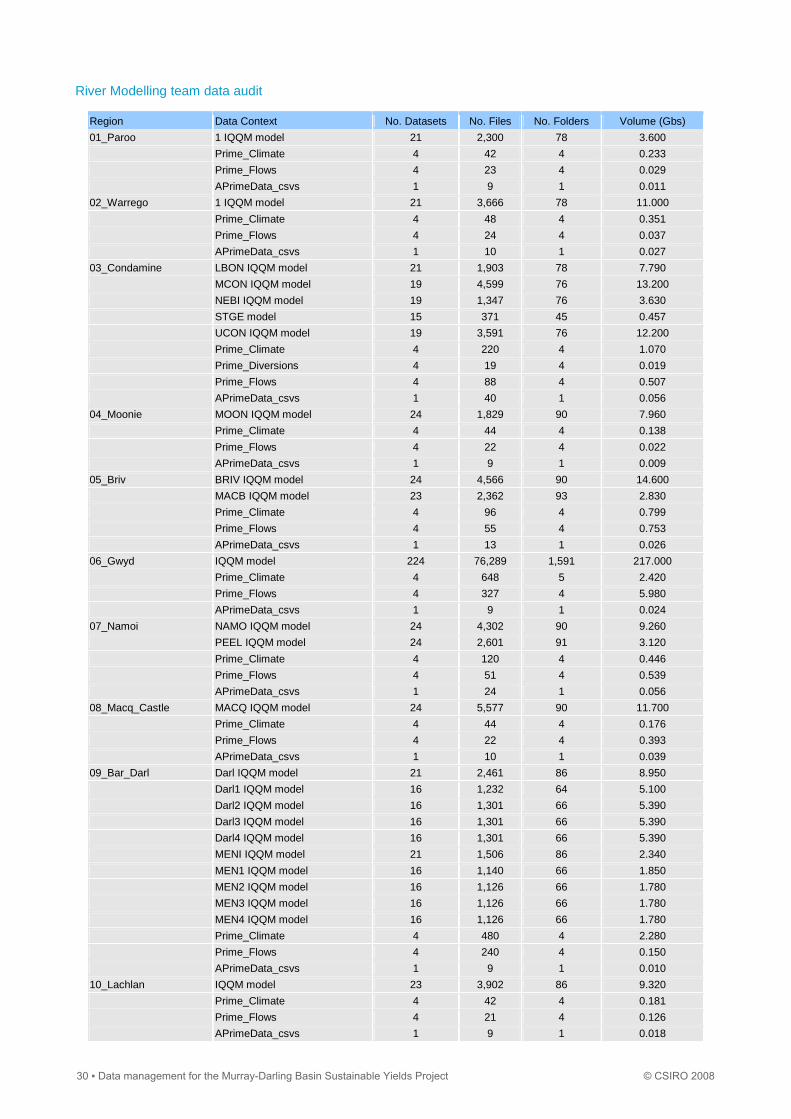
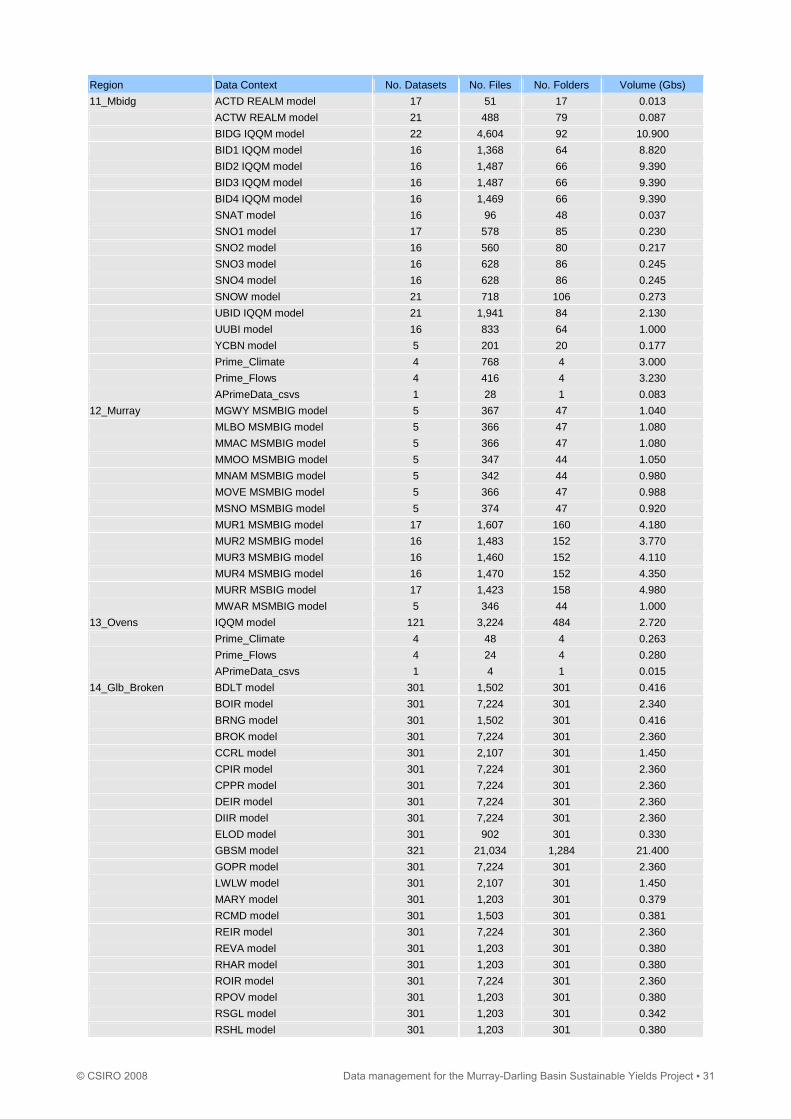
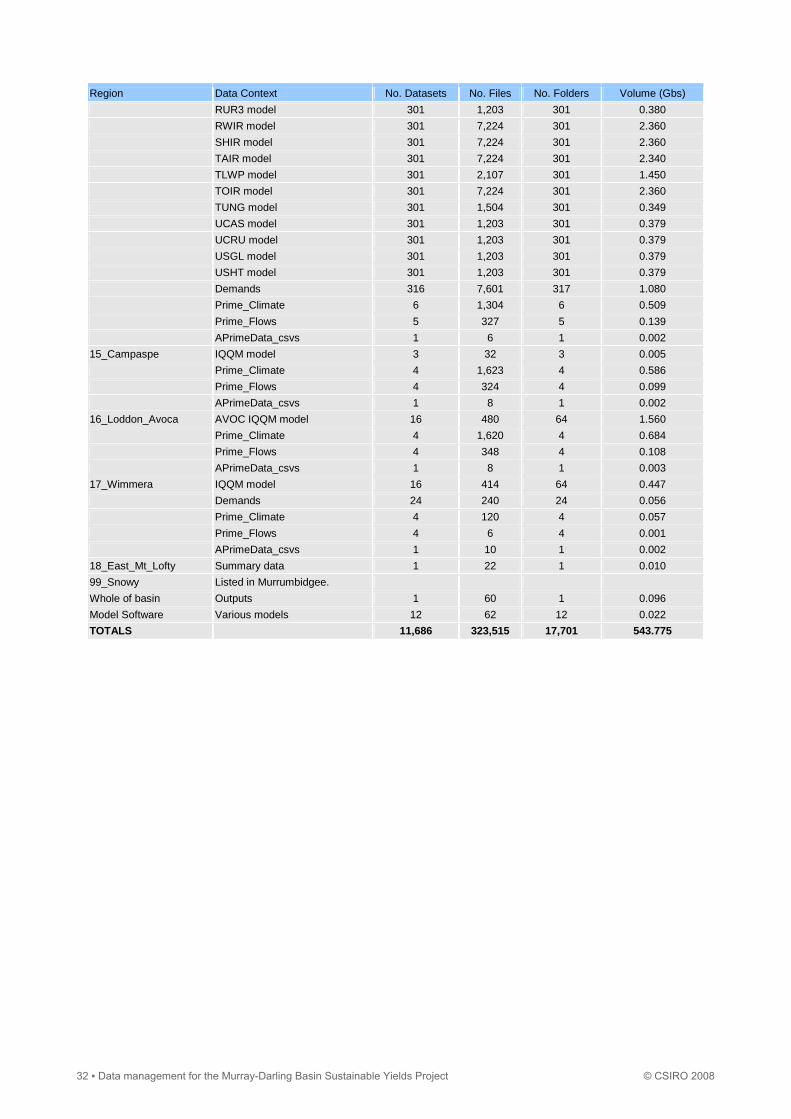
River Modelling team data audit
Region Data Context No. Datasets No. Files No. Folders Volume (Gbs)
01_Paroo 1 IQQM model 21 2,300 78 3.600
Prime_Climate 4 42 4 0.233
Prime_Flows 4 23 4 0.029
APrimeData_csvs 1 9 1 0.011
02_Warrego 1 IQQM model 21 3,666 78 11.000
Prime_Climate 4 48 4 0.351
Prime_Flows 4 24 4 0.037
APrimeData_csvs 1 10 1 0.027
03_Condamine LBON IQQM model 21 1,903 78 7.790
MCON IQQM model 19 4,599 76 13.200
NEBI IQQM model 19 1,347 76 3.630
STGE model 15 371 45 0.457
UCON IQQM model 19 3,591 76 12.200
Prime_Climate 4 220 4 1.070
Prime_Diversions 4 19 4 0.019
Prime_Flows 4 88 4 0.507
APrimeData_csvs 1 40 1 0.056
04_Moonie MOON IQQM model 24 1,829 90 7.960
Prime_Climate 4 44 4 0.138
Prime_Flows 4 22 4 0.022
APrimeData_csvs 1 9 1 0.009
05_Briv BRIV IQQM model 24 4,566 90 14.600
MACB IQQM model 23 2,362 93 2.830
Prime_Climate 4 96 4 0.799
Prime_Flows 4 55 4 0.753
APrimeData_csvs 1 13 1 0.026
06_Gwyd IQQM model 224 76,289 1,591 217.000
Prime_Climate 4 648 5 2.420
Prime_Flows 4 327 4 5.980
APrimeData_csvs 1 9 1 0.024
07_Namoi NAMO IQQM model 24 4,302 90 9.260
PEEL IQQM model 24 2,601 91 3.120
Prime_Climate 4 120 4 0.446
Prime_Flows 4 51 4 0.539
APrimeData_csvs 1 24 1 0.056
08_Macq_Castle MACQ IQQM model 24 5,577 90 11.700
Prime_Climate 4 44 4 0.176
Prime_Flows 4 22 4 0.393
APrimeData_csvs 1 10 1 0.039
09_Bar_Darl Darl IQQM model 21 2,461 86 8.950
Darl1 IQQM model 16 1,232 64 5.100
Darl2 IQQM model 16 1,301 66 5.390
Darl3 IQQM model 16 1,301 66 5.390
Darl4 IQQM model 16 1,301 66 5.390
MENI IQQM model 21 1,506 86 2.340
MEN1 IQQM model 16 1,140 66 1.850
MEN2 IQQM model 16 1,126 66 1.780
MEN3 IQQM model 16 1,126 66 1.780
MEN4 IQQM model 16 1,126 66 1.780
Prime_Climate 4 480 4 2.280
Prime_Flows 4 240 4 0.150
APrimeData_csvs 1 9 1 0.010
10_Lachlan IQQM model 23 3,902 86 9.320
Prime_Climate 4 42 4 0.181
Prime_Flows 4 21 4 0.126
APrimeData_csvs 1 9 1 0.018
30 ▪ Data management for the Murray-Darling Basin Sustainable Yields Project © CSIRO 2008
Region Data Context No. Datasets No. Files No. Folders Volume (Gbs)
11_Mbidg ACTD REALM model 17 51 17 0.013
ACTW REALM model 21 488 79 0.087
BIDG IQQM model 22 4,604 92 10.900
BID1 IQQM model 16 1,368 64 8.820
BID2 IQQM model 16 1,487 66 9.390
BID3 IQQM model 16 1,487 66 9.390
BID4 IQQM model 16 1,469 66 9.390
SNAT model 16 96 48 0.037
SNO1 model 17 578 85 0.230
SNO2 model 16 560 80 0.217
SNO3 model 16 628 86 0.245
SNO4 model 16 628 86 0.245
SNOW model 21 718 106 0.273
UBID IQQM model 21 1,941 84 2.130
UUBI model 16 833 64 1.000
YCBN model 5 201 20 0.177
Prime_Climate 4 768 4 3.000
Prime_Flows 4 416 4 3.230
APrimeData_csvs 1 28 1 0.083
12_Murray MGWY MSMBIG model 5 367 47 1.040
MLBO MSMBIG model 5 366 47 1.080
MMAC MSMBIG model 5 366 47 1.080
MMOO MSMBIG model 5 347 44 1.050
MNAM MSMBIG model 5 342 44 0.980
MOVE MSMBIG model 5 366 47 0.988
MSNO MSMBIG model 5 374 47 0.920
MUR1 MSMBIG model 17 1,607 160 4.180
MUR2 MSMBIG model 16 1,483 152 3.770
MUR3 MSMBIG model 16 1,460 152 4.110
MUR4 MSMBIG model 16 1,470 152 4.350
MURR MSBIG model 17 1,423 158 4.980
MWAR MSMBIG model 5 346 44 1.000
13_Ovens IQQM model 121 3,224 484 2.720
Prime_Climate 4 48 4 0.263
Prime_Flows 4 24 4 0.280
APrimeData_csvs 1 4 1 0.015
14_Glb_Broken BDLT model 301 1,502 301 0.416
BOIR model 301 7,224 301 2.340
BRNG model 301 1,502 301 0.416
BROK model 301 7,224 301 2.360
CCRL model 301 2,107 301 1.450
CPIR model 301 7,224 301 2.360
CPPR model 301 7,224 301 2.360
DEIR model 301 7,224 301 2.360
DIIR model 301 7,224 301 2.360
ELOD model 301 902 301 0.330
GBSM model 321 21,034 1,284 21.400
GOPR model 301 7,224 301 2.360
LWLW model 301 2,107 301 1.450
MARY model 301 1,203 301 0.379
RCMD model 301 1,503 301 0.381
REIR model 301 7,224 301 2.360
REVA model 301 1,203 301 0.380
RHAR model 301 1,203 301 0.380
ROIR model 301 7,224 301 2.360
RPOV model 301 1,203 301 0.380
RSGL model 301 1,203 301 0.342
RSHL model 301 1,203 301 0.380
© CSIRO 2008 Data management for the Murray-Darling Basin Sustainable Yields Project ▪ 31
Region Data Context No. Datasets No. Files No. Folders Volume (Gbs)
RUR3 model 301 1,203 301 0.380
RWIR model 301 7,224 301 2.360
SHIR model 301 7,224 301 2.360
TAIR model 301 7,224 301 2.340
TLWP model 301 2,107 301 1.450
TOIR model 301 7,224 301 2.360
TUNG model 301 1,504 301 0.349
UCAS model 301 1,203 301 0.379
UCRU model 301 1,203 301 0.379
USGL model 301 1,203 301 0.379
USHT model 301 1,203 301 0.379
Demands 316 7,601 317 1.080
Prime_Climate 6 1,304 6 0.509
Prime_Flows 5 327 5 0.139
APrimeData_csvs 1 6 1 0.002
15_Campaspe IQQM model 3 32 3 0.005
Prime_Climate 4 1,623 4 0.586
Prime_Flows 4 324 4 0.099
APrimeData_csvs 1 8 1 0.002
16_Loddon_Avoca AVOC IQQM model 16 480 64 1.560
Prime_Climate 4 1,620 4 0.684
Prime_Flows 4 348 4 0.108
APrimeData_csvs 1 8 1 0.003
17_Wimmera IQQM model 16 414 64 0.447
Demands 24 240 24 0.056
Prime_Climate 4 120 4 0.057
Prime_Flows 4 6 4 0.001
APrimeData_csvs 1 10 1 0.002
18_East_Mt_Lofty Summary data 1 22 1 0.010
99_Snowy Listed in Murrumbidgee.
Whole of basin Outputs 1 60 1 0.096
Model Software Various models 12 62 12 0.022
TOTALS 11,686 323,515 17,701 543.775
32 ▪ Data management for the Murray-Darling Basin Sustainable Yields Project © CSIRO 2008
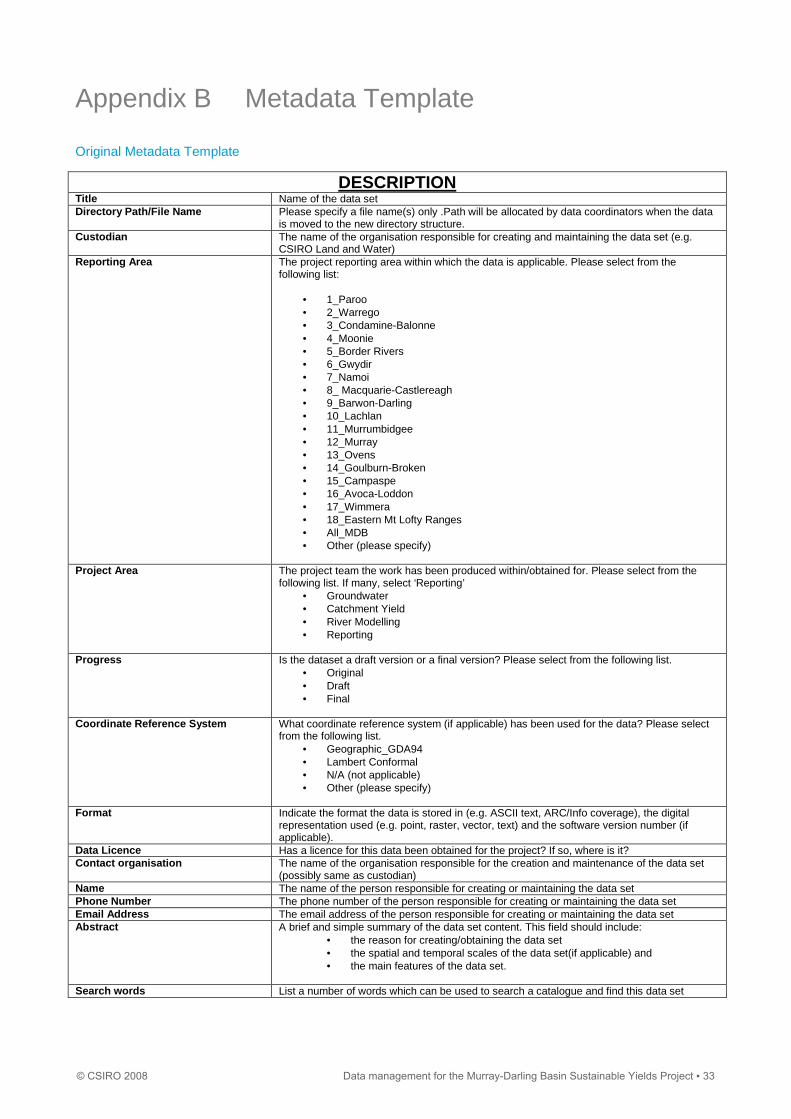
Appendix B Metadata Template
Original Metadata Template
DESCRIPTION Title Name of the data set Directory Path/File Name Please specify a file name(s) only .Path will be allocated by data coordinators when the data
is moved to the new directory structure. Custodian The name of the organisation responsible for creating and maintaining the data set (e.g.
CSIRO Land and Water) Reporting Area The project reporting area within which the data is applicable. Please select from the
following list:
• 1_Paroo • 2_Warrego • 3_Condamine-Balonne • 4_Moonie • 5_Border Rivers • 6_Gwydir • 7_Namoi • 8_ Macquarie-Castlereagh • 9_Barwon-Darling • 10_Lachlan • 11_Murrumbidgee • 12_Murray • 13_Ovens • 14_Goulburn-Broken • 15_Campaspe • 16_Avoca-Loddon • 17_Wimmera • 18_Eastern Mt Lofty Ranges • All_MDB • Other (please specify)
Project Area The project team the work has been produced within/obtained for. Please select from the
following list. If many, select ‘Reporting’ • Groundwater • Catchment Yield • River Modelling • Reporting
Progress Is the dataset a draft version or a final version? Please select from the following list.
• Original • Draft • Final
Coordinate Reference System What coordinate reference system (if applicable) has been used for the data? Please select
from the following list. • Geographic_GDA94 • Lambert Conformal • N/A (not applicable) • Other (please specify)
Format Indicate the format the data is stored in (e.g. ASCII text, ARC/Info coverage), the digital representation used (e.g. point, raster, vector, text) and the software version number (if applicable).
Data Licence Has a licence for this data been obtained for the project? If so, where is it? Contact organisation The name of the organisation responsible for the creation and maintenance of the data set
(possibly same as custodian) Name The name of the person responsible for creating or maintaining the data set Phone Number The phone number of the person responsible for creating or maintaining the data set Email Address The email address of the person responsible for creating or maintaining the data set Abstract A brief and simple summary of the data set content. This field should include:
• the reason for creating/obtaining the data set • the spatial and temporal scales of the data set(if applicable) and • the main features of the data set.
Search words List a number of words which can be used to search a catalogue and find this data set
© CSIRO 2008 Data management for the Murray-Darling Basin Sustainable Yields Project ▪ 33
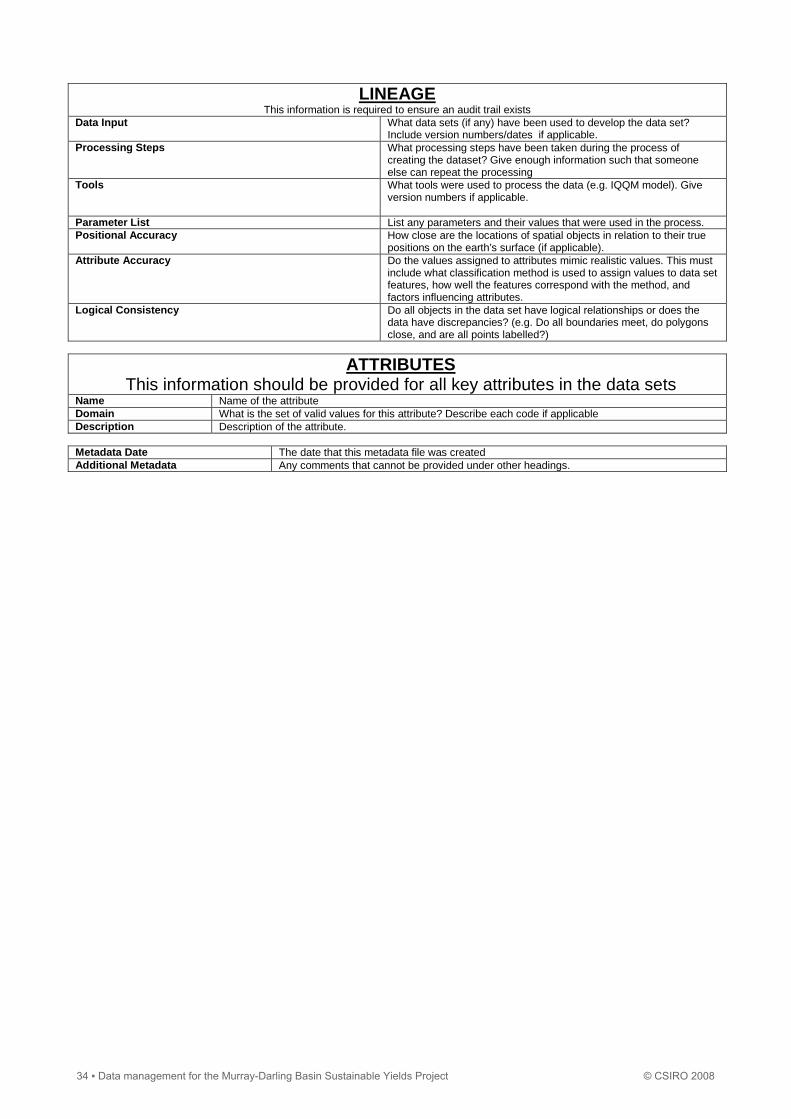
LINEAGE This information is required to ensure an audit trail exists
Data Input What data sets (if any) have been used to develop the data set? Include version numbers/dates if applicable.
Processing Steps What processing steps have been taken during the process of creating the dataset? Give enough information such that someone else can repeat the processing
Tools What tools were used to process the data (e.g. IQQM model). Give version numbers if applicable.
Parameter List List any parameters and their values that were used in the process. Positional Accuracy How close are the locations of spatial objects in relation to their true
positions on the earth’s surface (if applicable). Attribute Accuracy Do the values assigned to attributes mimic realistic values. This must
include what classification method is used to assign values to data set features, how well the features correspond with the method, and factors influencing attributes.
Logical Consistency Do all objects in the data set have logical relationships or does the data have discrepancies? (e.g. Do all boundaries meet, do polygons close, and are all points labelled?)
ATTRIBUTES This information should be provided for all key attributes in the data sets
Name Name of the attribute Domain What is the set of valid values for this attribute? Describe each code if applicable Description Description of the attribute. Metadata Date The date that this metadata file was created Additional Metadata Any comments that cannot be provided under other headings.
34 ▪ Data management for the Murray-Darling Basin Sustainable Yields Project © CSIRO 2008